diversity and soil-tissue elemental · pdf file2/9/2014 · key words: edaphic...
TRANSCRIPT
DIVERSITY AND SOIL-TISSUE ELEMENTAL RELATIONS
OF VASCULAR PLANTS OF CALLAHAN MINE,
BROOKSVILLE, MAINE, U.S.A.
MARGARET R. MANSFIELD
College of the Atlantic, 105 Eden Street, Bar Harbor, ME 04609
NATHANIEL S. POPE
Section of Integrative Biology, University of Texas at Austin, Austin, TX 78712
GLEN H. MITTELHAUSER
Maine Natural History Observatory, 317 Guzzle Road, Gouldsboro, ME 04607
NISHANTA RAJAKARUNA1
College of the Atlantic, 105 Eden Street, Bar Harbor, ME 04609, USA;Unit for Environmental Sciences and Management, North-West University,
Private Bag X6001, Potchefstroom, 2520, South Africa1Author for correspondence: e-mail: [email protected]
ABSTRACT. Metal-contaminated soils provide numerous stressors to plant life,resulting in unique plant communities worldwide. The current study focuses onthe vascular plants of Callahan Mine in Brooksville, ME, USA, a Superfund sitecontaminated with Cu, Zn, Pb, and other pollutants. One hundred and fifty-fivetaxa belonging to 50 families were identified, with the Asteraceae (21%), Poaceae(11%), and Rosaceae (9%) as the most species-rich families. Ninety-six speciesencountered at the Mine were native to North America (62%), including 11 taxa(7%) with rarity status in at least one New England state. Fifty-one species werenon-native (33%), including nine taxa (6%) considered invasive in at least oneNew England state. We characterized how the plant community changed acrossdifferent habitats at the Mine, from disturbed and exposed (waste rock piles,tailings pond) to inundated and relatively undisturbed (wetland, shore), anddocumented concurrent shifts in the ionic content of the soils across the habitats.We found substantial differences in both the plant community and soil chemicalfeatures among habitats. Habitats separated out along a single axis of anordination of the plant community, with wetland and shore habitats at oneextreme and tailings pond and waste rock-pile habitats at the other. The firstprincipal component axis of the 21 soil variables was significantly predicted bythe ordination of the plant community, indicating a gradient of increasing organicmatter, Fe, Mg, Mn, total N, Na, and K roughly parallel to the gradient ofincreasing wetland vegetation. None of the plant species tested accumulatedsubstantial concentrations of metals in their leaf tissue except Salix bebbiana andPopulus balsamifera, which accumulated 1070 ppm and 969 ppm Zn in dry leaftissue, respectively—approximately one-third of the concentration considered ashyperaccumulation for Zn.
RHODORA, Vol. 116, No. 967, pp. 283–322, 2014
E Copyright 2014 by the New England Botanical ClubDOI: 10.3119/13-23; first published on-line September 2, 2014.
283
Key Words: edaphic ecology, geobotany, habitat restoration, metal pollution,
phytoremediation, plant-soil relations, Superfund sites
Edaphically extreme habitats, such as serpentine outcrops, guano
deposits, alkaline flats, and metal-enriched mining sites pose unique
challenges to plant life (Rajakaruna and Boyd 2008). The stressors
faced by plants of such habitats can include: water stress due to the
rocky and often shallow nature of the substrate, generally low levels
of essential nutrients, extremes of pH, and elevated concentrations
of ions, including heavy metals. Although trace levels of some
heavy metals are required by plants as micronutrients (Ahmad
and Ashraf 2011; Marschner 1995), high levels can interfere with
essential physiological processes and cause toxicities (Hansch and
Mendel 2009; Peralta-Videa et al. 2009). Some heavy metals, such
as copper (Cu), iron (Fe), manganese (Mn), nickel (Ni), and zinc
(Zn), regulate various biological processes in plants (Epstein and
Bloom 2004), but when they occur in excess they can disrupt critical
biological processes (Chaffai and Koyama 2011; Kabata-Pendias
2001). Thus, most plants exclude metals at the root level by binding
them to organic acids or ligands or storing them within vacuoles in
the roots, where they cannot interfere with important physiological
processes (Gall and Rajakaruna 2013; Hossain et al. 2012). However,
metal-hyperaccumulating plants are able to take up high concentra-
tions of heavy metals from the soil and translocate them into above-
ground tissue at concentrations exceeding, in most cases, 0.1% of
total dry leaf tissue mass (Rascio and Navari-Izzo 2011; van der Ent
et al. 2012). The Brassicaceae (Gall and Rajakaruna 2013),
Caryophyllaceae (Verkleij and Prast 1988), Asteraceae (O’Dell and
Rajakaruna 2011), Rubiaceae (Reeves 2003), and Fabaceae (Page et
al. 2006) are families known to consist of species able to tolerate
metals either through exclusion or accumulation.
Understanding the ecology of metal-contaminated sites is
becoming critical as increasing pollution exposes more land to
heavy metals and other contaminants (Boyd 2004; Ensley 2000;
McGee et al. 2007; Wuana and Okieimen 2011). Metal-enriched
habitats and their locally adapted biota are also undergoing drastic
changes due to natural and human-induced stressors (Williamson
and Balkwill 2006), even those resulting from recent efforts to
remediate metal mines abandoned for long periods of time (Jacobi
et al. 2011; Palmer et al. 2010). Thus, floristic surveys in support of
284 Rhodora [Vol. 116
conservation efforts should be encouraged. These should document
the wealth of biological diversity continually being lost from suchsites worldwide, particularly those metal-tolerant plants that could
be used for phytoremediation (Baker et al. 2010; Whiting et al.
2004). Although there are many metal-enriched sites in northeast-
ern North America (Rajakaruna, Harris, and Alexander 2009),
including 118 EPA-designated Superfund sites in New England
(Environmental Protection Agency 2013), the sites are under-
explored for both their botanical diversity and the occurrence of
species with unusual metal-accumulating physiologies (Rajakaruna,Harris, and Alexander 2009). Studies conducted at Pine Hill, an Ni-
enriched serpentine quarry on Little Deer Isle, ME, suggest both a
unique bryophyte (Briscoe et al. 2009) and vascular flora (Pope
et al. 2010) compared to Settlement Quarry, an adjacent granite
outcrop. Harris et al. (2007) also found a unique lichen flora at Pine
Hill, including two species new to New England and an additional
three new to Maine. Rajakaruna et al. (2011) recently showed a
unique composition of lichens at the Cu-, Zn-, and Pb-enrichedCallahan Mine in Brooksville, ME, consisting of taxa that are often
found in metal-enriched sites worldwide.
In this study, we compiled a list of vascular plants growing at
Callahan Mine (hereafter also, the Mine) and examined how the
plant community and soil ionic content varied across five distinct
habitats at the Mine (tailings pond, waste rock piles, shore,
wetland, and ‘in between;’ see Figure 1 and Materials and Methods
for habitat descriptions). We hypothesized that: (a) diversity wouldbe lowest in the disturbed and exposed habitats (waste rock piles
and tailings pond) and the often inundated wetland habitat,
compared to less disturbed and less exposed habitats (shore, ‘in
between’); (b) species composition and life forms would be distinct
among the different habitats with herbaceous, annual, and non-
native species dominating the more disturbed and highly exposed
habitats, compared to native and perennial herb, shrub, and tree
species in the less disturbed and less exposed habitats and thewetland habitat; and (c) substantial differences in soil variables
would be present across habitat types, and would correlate with
variation in the plant communities (although not necessarily
causing, or caused by, variation in the plant community).
We collected descriptive data on the ionic content of leaf tissue
from select plant taxa growing at Callahan Mine to assess if there
are species that show unusual physiologies with respect to metal
2014] Mansfield et al.—Vascular Plants at Callahan Mine 285

accumulation and that could be utilized in the restoration of metal-
contaminated sites in New England. To informally place the flora
of the Mine within a regional context, we calculated the proportion
of species that were native to North America and to New England.
Figure 1. Map of Callahan Mine featuring the sampling plots placed withinthe five habitats chosen for the vegetation survey.
286 Rhodora [Vol. 116
Finally, we compared the species list from the Mine to those
previously reported from two adjacent rock outcrops (Pope et al.
2010) to see if the metal-tolerant plants at the Mine were more
abundant at nearby Pine Hill (serpentine outcrop), relative to
Settlement Quarry (granitic outcrop). We expected the flora at the
Mine to be more similar (in terms of species composition, measured
by Bray-Curtis dissimilarity) to the flora of Pine Hill than to the
flora of Settlement Quarry.
MATERIALS AND METHODS
Site description. Callahan Mine is a former intertidal open-pit
mine in Brooksville, Hancock County, ME (44u209 N, 68u489W;
WGS 84; Figure 1). It has been mined intermittently since 1880,
with the most intensive mining taking place from 1968–1972
(Environmental Protection Agency 2009; Rajakaruna et al. 2011).
Today, the 150-acre site is composed of the ore pad where rocks
from the Mine were crushed to a fine sand, three waste rock piles
where non-ore-bearing rocks were piled, and a tailings pond made up
of refuse (fine-textured soil particles) from the chemical separation of
mineral and non-mineral particles. Callahan Mine was listed as a
Superfund site in 2002 by the Environmental Protection Agency
(2002) due to elevated levels of organic contaminants and heavy
metals, including Cu, Zn, Pb, and Cd. Remediation efforts that
began in 2010 at the Mine have restricted access to the northern part
of the site. Therefore, this study focused on the southern portion of
the Mine, including waste rock piles 1 and 3, the tailings pond, and
the wetland, areas that were also surveyed during the recent lichen
study (Rajakaruna et al. 2011; Figure 1).
Floristic survey. We stratified Callahan Mine into five separate
habitats: tailings pond, waste rock piles 1 and 3, wetland, shore, and
a section without distinct geographical features referred to as ‘in
between’ (Figure 1). Within each habitat, five 10 3 10 m plots were
placed (six within the waste rock piles) using the Geographic
Information System (GIS) random point generator (ArcGIS 10.1
Spatial Analyst, ‘Create Random Points’ tool). Two of the random
plots on the tailings pond were not included in any analyses, as
remediation efforts had recently removed vegetation. We avoided
selecting plots from any areas within the Mine that were currently
undergoing remediation or were planned for such activities in the
2014] Mansfield et al.—Vascular Plants at Callahan Mine 287
future. Randomly generated plots devoid of any vegetation were
also not selected for the survey. Within each plot, vascular specieswere recorded, and the percent cover of each species was calculated
within a grid of twenty-five 2 3 2 m subplots to obtain a percent
cover measure per 10 3 10 m plot. Percent cover data were used to
calculate species diversity indices and other species-habitat associ-
ations. A few species not encountered within the plots were
identified from throughout the study area and included in the
species list for Callahan Mine. They were not included in the
diversity indices we calculated for individual plots. Plants wereidentified using Haines (2011). Voucher specimens were deposited
at the herbarium of College of the Atlantic, Bar Harbor, ME
(HCOA).
Soil analysis. Soil samples were collected in August 2011 fromthe four corners and center of each 10 3 10 meter plot from up to
10 cm below the surface using a stainless steel trowel. Samples were
air-dried for 2 weeks and stored in plastic bags. Soil pH was
measured with the 1:2 soil-to-solution method, with distilled water
and 0.01 M CaCl2 (Kalra and Maynard 1991). Organic matter was
measured by loss on ignition at 375uC. Using a 1 M potassium
chloride solution, nitrate and ammonium nitrogen were extracted
and analyzed colorometrically by a Dual-Channel Automated IonAnalyzer (OI Corporation, TX). Calcium, K, Mg, Na, P, and S
were extracted with 1 M neutral ammonium acetate (Kalra and
Maynard 1991) and determined by Inductively Coupled Plasma
Optical Emission Spectrometry (ICP-OES). Phosphorus was
determined colorometrically by the Ion Analyzer. Electrical
conductivity (EC) was measured by a saturated media water
extraction (Gavlak et al. 2003). Aluminum, Cd, Cr, Cu, Fe, Mn,
Mo, Ni, Pb, and Zn were extracted in 0.005 M DPTA to a pH of 7.3for 2 h and determined by ICP-OES. Analyses were conducted by
the Analytical Laboratory at the University of Maine in Orono
(UMO).
Tissue analysis. Ten to fifteen fully expanded and mature leaves
were collected from throughout the Mine from five to ten widely
spaced individuals of Achillea millefolium subsp. lanulosa, Betula
papyrifera, Festuca rubra subsp. rubra, Galium mollugo, Hypericum
perforatum subsp. perforatum, Juncus gerardii, Lotus corniculatus,
Lupinus polyphyllus var. polyphyllus, Morella caroliniensis, Onoclea
sensibilis, Phragmites australis, Populus balsamifera, Salix bebbiana,
288 Rhodora [Vol. 116
Silene vulgaris subsp. vulgaris, Spiraea alba var. latifolia, Stellaria
graminea, Thlaspi arvense, Typha latifolia, Vaccinium angustifolium,
and Vicia villosa subsp. villosa. The unequal sample size was due to
the leaf size differences among the target species (more leaves were
collected from species with smaller leaves in order to have adequate
mass for tissue analyses) or due to their relative abundance at
the Mine (common species were collected more often). The
species selected were from plant families known to contain metal
accumulating taxa (e.g., Asteraceae, Brassicaceae, and Caryophyl-
laceae) or from those found in high abundance at the Mine (e.g.,
Betulaceae, Fabaceae, Poaceae, and Salicaceae). Leaves were rinsed
with distilled water, washed in 0.1 M HCl solution, and rinsed again
twice in distilled water. Samples were dried in a forced-draft oven
for 48 h at 80uC. One composite tissue sample from each species,
consisting of tissue from five to ten individuals, was sent to the
Analytical Laboratory at UMO. To determine tissue concentra-
tions (ppm) of Ca, K, Mg, P, Al, B, Cu, Fe, Mn, Zn, Ni, Cr, Cu,
Cd, Pb, and Mo, samples were dry-ashed at 450uC for 5 h and
dissolved in 50% HCl; concentrations were determined using ICP-
OES. Direct combustion analysis at 1150uC in pure oxygen with
detection by thermal conductivity in the combustion gases was used
to estimate total N (TN %) content of tissue.
Statistical analyses. All statistical analyses were conducted
using R (R Core Team 2013). To compare the complete flora of
Callahan Mine with those of nearby Pine Hill and Settlement
Quarry, we calculated the proportion of shared species relative to
the total number of species in a given site pair (also known as
Jaccard’s similarity index). To compare the higher taxonomy
between these sites, we used a taxonomic variant of Jaccard’s
index (DT; Bacaro et al. 2007) which is a measure of the similarity of
a pair of taxonomic trees. To estimate diversity of the plant
community across habitats at the Mine, we calculated species
richness and the Shannon diversity index (2Si (pi ? ln pi), where pi is
the proportional abundance of the ith species) for each plot. To test
for differences in diversity among habitats, we used a GLM
(generalized linear model) with a quasi-Poisson distribution (for
species richness) and a normal linear model (for Shannon diversity).
To examine species composition across habitats, we used non-
metric multidimensional scaling (hereafter, nMDS) with Bray-
Curtis distance for an unconstrained ordination of the plant
2014] Mansfield et al.—Vascular Plants at Callahan Mine 289

community (ter Braak 1995). Two sites of the ‘waste rock pile’
habitat were removed prior to the ordination as they were devoid ofvegetation. Habitat membership was regressed against site scores
from the ordination, and the coefficient of determination (R2) was
calculated. A permutation test was then used to assess the
probability that site scores and habitats were non-randomly
associated: the vector of habitat membership was permuted and
R2 calculated with each permutation. A p-value was calculated by
asking what proportion of the permuted R2 was greater than the
observed R2. This procedure follows ter Braak (1995) and isimplemented in the vegan package (Oksanen et al. 2013). To
facilitate visualization of plant community structure (i.e., plant life
form and family membership across habitats), we partitioned
species scores from the ordination into separate subsets based upon
life form and family membership. For each subset, we calculated the
centroid and a 95% confidence ellipse. Species scores in an nMDS
ordination are essentially weighted means of site scores (e.g., a mean
of site scores weighted by the number of times the taxon appears inthe sites). Each species score can be viewed as an optimum—the point
in ordination space where the abundance of that taxon is maximal. In
nMDS, the rate of decline in abundance from the optimum is not
uniform in every direction (the taxon may decline in abundance more
quickly in one direction than another). Therefore, the centroid of
species scores for a subset of taxa (e.g., a clade) should not be
interpreted as the point where the abundance of this clade is
maximal, but instead as the central tendency of the optima of thetaxa in that clade. To examine soil ionic content across habitats, we
used principal components analysis (PCA) to reduce log-transformed
soil variables (pH was not log-transformed) into orthogonal
eigenvectors. Variables were scaled and centered prior to PCA. The
first six principal components explained ,92% of the variance in the
soil data; subsequent axes were not considered further. We used a
one-way MANOVA with an approximate F-test to determine
whether habitats explained a substantial amount of variation in thePCA axes. To assess soil ionic content across variation in the plant
community, we fit PCA axes to the nMDS ordination using an
analogous procedure to that described above for habitats. Essential-
ly, each PCA axis was regressed against the corresponding site scores
of the nMDS axes. It is important to note that the PCA axes were
analyzed individually; we assessed the degree to which each PCA axis
could be predicted, given the ordination.
290 Rhodora [Vol. 116

RESULTS
We collected 155 taxa and identified 148 to full species (Appendix).
Seven taxa were only identified to genus as our collections were made
before or after peak flowering and the vegetative samples were not
sufficient for identification to species. A total of 50 families were
encountered at Callahan Mine. Ninety-six species encountered at the
Mine were native to North America (62%) whereas fifty-one species
were non-native (33%), including nine taxa (6%) considered invasive
in at least one New England state (New England Wild Flower Society
2012). Within the Mine, the shore and ‘in between’ habitats were the
most species rich, with 66 and 53 taxa, respectively; the tailings pond
and the waste rock piles were the least species rich, with 20 and 21
taxa, respectively (Appendix). Eleven species (7%) were listed as rare,
threatened, endangered, or special concern in at least one state in
New England (New England Wild Flower Society 2012).
Woody vegetation was abundant across the Mine but was
predominantly associated with the shore and ‘in between’ habi-
tats—although several tree species were common across habitats
(such as Betula papyrifera and Picea spp.). The wetland community
consisted of typical wetland species such as Glyceria striata,
Torreyochloa pallida, and Typha latifolia; annual and perennial
forbs (predominately of the Asteraceae, such as the goldenrods
Euthamia graminifolia and Solidago rugosa); and a few woody
species of the Rosaceae (Prunus virginiana, Rosa palustris, and
Rubus idaeus). The shoreline was dominated by a mix of
hydrophyllous and maritime species such as Juncus gerardii,
Phragmites australis, and Typha latifolia; woody species, most
abundantly Betula papyrifera and Picea rubens; and perennial forbs
(Plantago maritima, Solidago rugosa, and the maritime species S.
sempervirens). The ‘in between’ habitat was a patchy matrix of
woody vegetation dominated by deciduous trees (Betula papyrifera,
Populus tremuloides); but also supported conifers (Picea glauca,
Pinus resinosa, Thuja occidentalis), understory shrubs (Diervilla
lonicera, Morella caroliniensis, Salix sp., Sambucus racemosa,
Spiraea alba var. latifolia), forbs (the most abundant were Galium
mollugo and the introduced Hieracium spp. and Vicia cracca subsp.
cracca), and several grasses (e.g., Festuca rubra subsp. rubra, Poa
nemoralis). The waste rock piles shared some species with the ‘in
between’ and shore habitats, specifically trees (Betula papyrifera,
Picea glauca, P. rubens, and Populus tremuloides). The waste rock
2014] Mansfield et al.—Vascular Plants at Callahan Mine 291

piles were also characterized by Vaccinium angustifolium, as well as
small numbers of other shrubs and woodland herbs. The tailings
pond was the most marginally vegetated of the habitats and, in
contrast to the waste rock piles, lacked diversity in woody
vegetation. Only two tree species were found on the tailings pond
(Betula papyrifera and Picea glauca). Although Picea rubens was
common on the waste rock piles, it was absent from the tailings
pond; likewise, P. glauca was abundant on the waste rock piles but
sparse on the tailings pond. Aside from the woody vegetation, the
tailings pond was dominated by Festuca rubra, as well as a few
perennial forbs: the introduced legumes Lotus corniculatus and
Trifolium repens, the introduced Cerastium fontanum, and the
ubiquitous Asteraceae genera Hieracium and Solidago.
At the species level, the Callahan Mine flora was as similar to the
flora of Pine Hill (Jaccard similarity 5 0.23) as it was to Settlement
Quarry (Jaccard similarity 5 0.24), whereas the floras of Pine Hill
and Settlement Quarry were relatively more similar to each other
(Jaccard similarity 5 0.35). When a taxonomic variant of the
Jaccard index (Bacaro et al. 2007) was used, the outcome was
similar: the higher taxonomy of the flora at Callahan Mine was as
similar to Pine Hill (DT 5 0.37) as to Settlement Quarry (DT 5
0.37), but the higher taxonomies of Pine Hill and Settlement Quarry
were relatively more similar (DT 5 0.44) to each other. The
proportion of species in the Callahan Mine flora shared with Pine
Hill (0.27) was marginally larger than the proportion of species in
Callahan Mine flora shared with Settlement Quarry (0.21).
Within Callahan Mine, Shannon diversity and species richness
were generally correlated across plots (Pearson’s r 5 0.83; Table 1).
Table 1. Mean values 6 standard errors for two metrics of diversity: speciesrichness and the Shannon diversity index (SDI). Total Richness 5 the totalnumber of species found in a habitat. Area 5 the area of the habitat in acres.Habitat codes: TP 5 tailings pond, WR 5 waste rock piles, WE 5 wetland, SH5 shore, and IB 5 in between.
HabitatMean Richness
(per plot)Mean SDI(per plot)
TotalRichness
Area(acres)
TP 3.7 6 2.2 0.2 6 0.2 21 7WR 2.3 6 1.1 0.5 6 0.3 21 2.5WE 10.6 6 2.0 1.4 6 0.3 39 2SH 16 6 3.6 1.6 6 0.2 66 7IB 15 6 3.3 1.1 6 0.3 53 8
292 Rhodora [Vol. 116

Shore, wetland, and ‘in between’ habitats had greater species
richness and Shannon diversity than tailings pond and waste rock
piles (species richness, quasi-Poisson GLM: p , 0.001, F4,19 5 7.40;
Shannon diversity, normal GLM: p 5 0.012, F4,19 5 4.25;
Figure 2). The habitats were of varying size: the tailings pond,
shore, and ‘in between’ were the largest, the wetland was the
smallest, and the waste rock was intermediate (Table 1). There was
no evidence of a correlation between the size of a habitat type and
the total species richness in that habitat (Kendall’s t 5 0.22, p 5
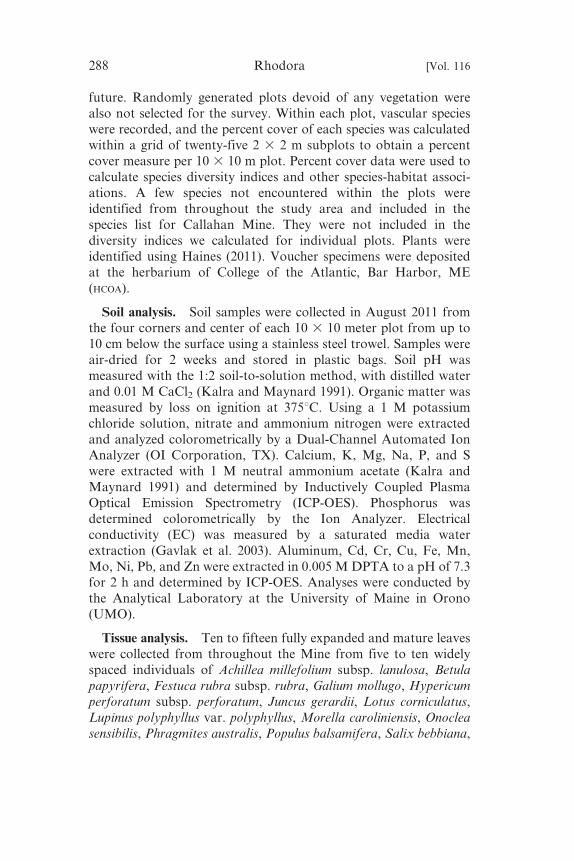
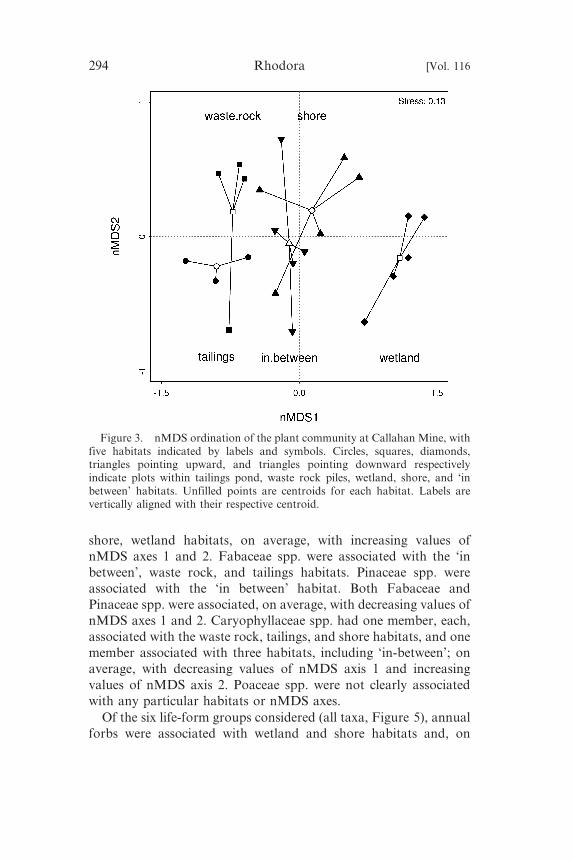
0.6). Three groups of habitats separated out clearly along the first
nMDS axis (Figure 3): tailings pond and waste rock piles, ‘in
between’ and shore, and wetland. The second nMDS axis described
the variation within habitats, and roughly separated tailings from
waste rock and shore from ‘in between.’ Habitat membership
(species occupancy) was significantly correlated with nMDS axes
(R2 5 0.70, permutation p , 0.001), and thus reflected differences
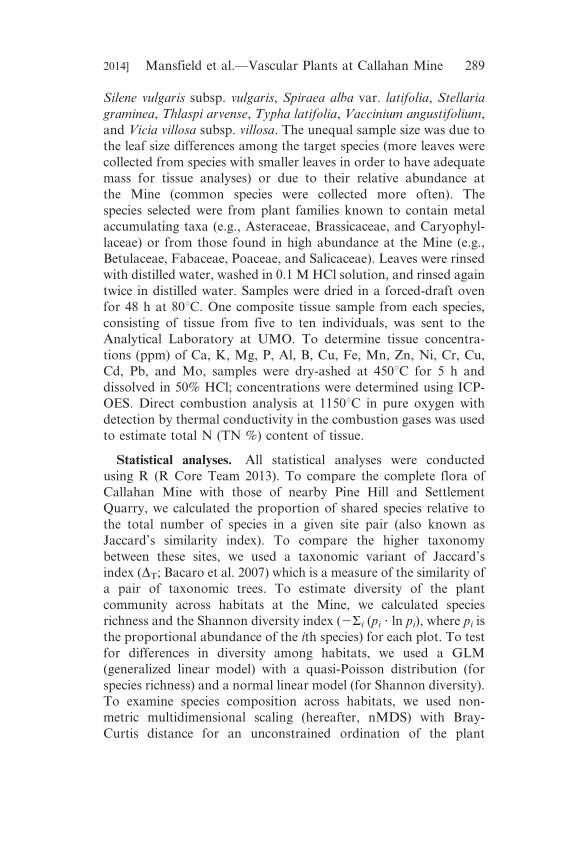
in plant community composition. Six plant families had more than
three species in the sampled sites at Callahan Mine (in total 48 taxa,
Figure 4). Rosaceae spp. were associated with the wetland, shore,
and ‘in between’ habitats, on average, with increasing values of
nMDS axis 1. Asteraceae spp. were associated with the waste rock,
Figure 2. Species richness and Shannon diversity for plots sampled in fivedifferent habitats at Callahan Mine. Gray symbols and bracketing lines aremeans and 95% confidence intervals, respectively. Habitat codes and symbols:TP 5 tailings pond (circles), WR 5 waste rock piles (squares), WE 5 wetland(diamonds), SH 5 shore (upward triangles), and IB 5 in between(downward triangles).
2014] Mansfield et al.—Vascular Plants at Callahan Mine 293
shore, wetland habitats, on average, with increasing values of
nMDS axes 1 and 2. Fabaceae spp. were associated with the ‘in
between’, waste rock, and tailings habitats. Pinaceae spp. were
associated with the ‘in between’ habitat. Both Fabaceae and
Pinaceae spp. were associated, on average, with decreasing values of
nMDS axes 1 and 2. Caryophyllaceae spp. had one member, each,
associated with the waste rock, tailings, and shore habitats, and one
member associated with three habitats, including ‘in-between’; on
average, with decreasing values of nMDS axis 1 and increasing
values of nMDS axis 2. Poaceae spp. were not clearly associated
with any particular habitats or nMDS axes.
Of the six life-form groups considered (all taxa, Figure 5), annual
forbs were associated with wetland and shore habitats and, on
Figure 3. nMDS ordination of the plant community at Callahan Mine, withfive habitats indicated by labels and symbols. Circles, squares, diamonds,triangles pointing upward, and triangles pointing downward respectivelyindicate plots within tailings pond, waste rock piles, wetland, shore, and ‘inbetween’ habitats. Unfilled points are centroids for each habitat. Labels arevertically aligned with their respective centroid.
294 Rhodora [Vol. 116
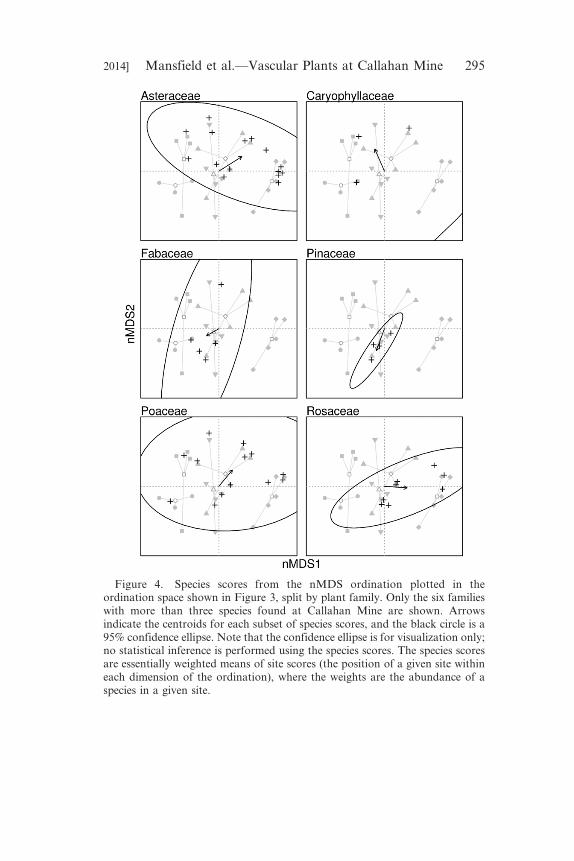
Figure 4. Species scores from the nMDS ordination plotted in theordination space shown in Figure 3, split by plant family. Only the six familieswith more than three species found at Callahan Mine are shown. Arrowsindicate the centroids for each subset of species scores, and the black circle is a95% confidence ellipse. Note that the confidence ellipse is for visualization only;no statistical inference is performed using the species scores. The species scoresare essentially weighted means of site scores (the position of a given site withineach dimension of the ordination), where the weights are the abundance of aspecies in a given site.
2014] Mansfield et al.—Vascular Plants at Callahan Mine 295
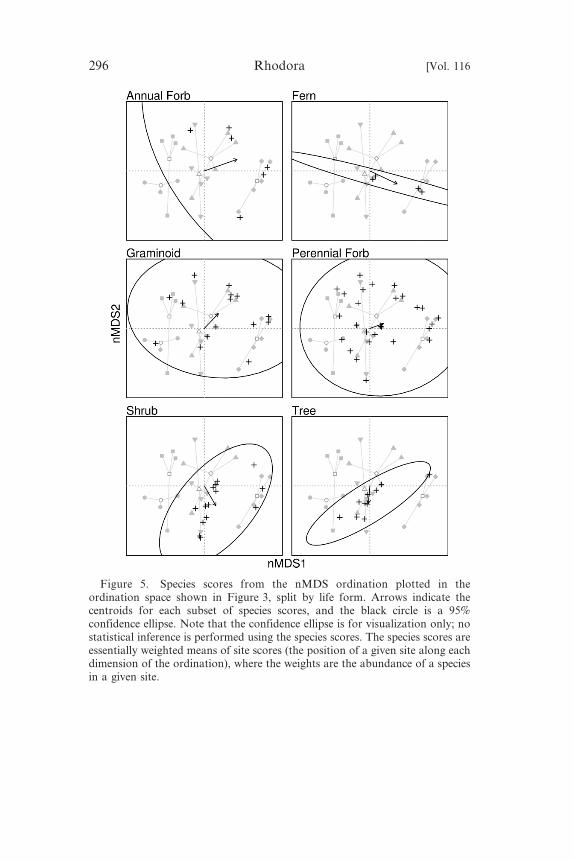
Figure 5. Species scores from the nMDS ordination plotted in theordination space shown in Figure 3, split by life form. Arrows indicate thecentroids for each subset of species scores, and the black circle is a 95%
confidence ellipse. Note that the confidence ellipse is for visualization only; nostatistical inference is performed using the species scores. The species scores areessentially weighted means of site scores (the position of a given site along eachdimension of the ordination), where the weights are the abundance of a speciesin a given site.
296 Rhodora [Vol. 116
average, with increasing values of nMDS axes 1 and 2. Ferns were
associated with the wetland and ‘in between’ habitats and, onaverage, with increasing values of nMDS axis 1 and decreasing
values of nMDS axis 2. Graminoids and perennial forbs were not
clearly associated with any particular habitats or nMDS axes.
Shrubs were associated primarily with shore and ‘in between’
habitats but also with the wetland habitats and, on average, with
increasing values of nMDS axis 1 and decreasing values of nMDS
axis 2. Trees were also primarily associated with the shore and ‘in
between’ habitats, with one species, each, in wetland and waste rockhabitats and, on average, with decreasing values of nMDS axis 2.
The first axis of the soil PCA was positively associated with soils
that had high levels of organic matter, Fe, Mg, Mn, N, Na, and K.
The second axis of the soil PCA was positively associated with pH,
Ca, Cu, P, Mo, and Zn, and negatively associated with Al and Fe. The
remaining axes were difficult to interpret, as they explained a
relatively small amount of variation in the soil data (Table 2). The
PCA axes varied significantly among habitats (MANOVA, approx.F6,15 5 7.96, p , 0.001), indicating that soils of the habitats differed
substantially in ionic composition (Table 3). Values of the first PCA
axis were significantly predicted by site scores from the nMDS,
indicating that plant community type and soil ionic content were
associated (R2 5 0.65, permutation p , 0.001). PCA axis 1 was
associated with increasing values of nMDS axis 1 and thus reflected a
soil gradient from waste rock and tailings to wetland soil types
(Figure 6). The remaining PCA axes were not significantly predictedby the ordination (Table 4). Table 5 lists the leaf tissue concentrations
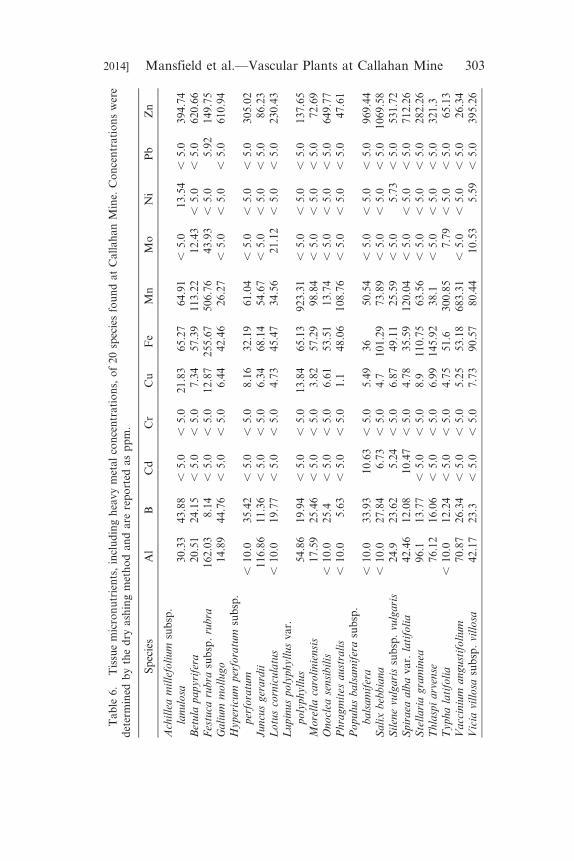
of macronutrients (Ca, K, Mg, P, N) and Table 6 lists the tissue
concentrations of micronutrients, including heavy metals (Al, B, Cu,
Fe, Mn, Zn, Ni, Cr, Cu, Cd, Pb, and Mo), for the 20 species collected
from Callahan Mine. None of the collected plant species accumulated
substantial concentrations of metals in their leaf tissue, except Salix
bebbiana and Populus balsamifera, which accumulated 1070 ppm and
969 ppm Zn in dry leaf tissue, respectively. Populus balsamifera,Spiraea alba var. latifolia, and S. bebbiana also accumulated 10.63,
10.47, and 6.73 ppm Cd in dry leaf tissue, respectively.
DISCUSSION
Ours is the first survey of the diversity and tissue metal content of
vascular plants of a metal-enriched Superfund site in New England.
2014] Mansfield et al.—Vascular Plants at Callahan Mine 297

Our results indicate that the various habitats found within Callahan
Mine were not equally diverse and harbored distinct plant
communities consisting of different plant families and plant habits
(life forms). With regard to hypothesis (a): in general, the waste rock
piles and the tailings pond were the least species rich, whereas the
shore, ‘in between,’ and wetland habitats were the most species rich
(Table 1). This result is not surprising, given that the waste-rock piles
and tailings pond had the lowest total N (NO32 and NH4
+) and
organic matter content among the five habitats within the Mine
(Table 3). The waste-rock piles also had shallow, coarse-textured
soils (mostly gravel and rocks) and little water-holding capacity,
whereas the tailings pond was made of fine-textured soil particles
(mostly silt, clay, and fine sediment) and could be water-logged,
Table 2. Principal components loadings for 21 soil variables (log-transformed and centered/scaled prior to PCA). Cum. Var. 5 the cumulativeamount of variance explained by the nth axis, %Var. Expl. 5 the amount ofvariance explained by the nth axis.
Variable PC1 PC2 PC3 PC4 PC5 PC6
pH 21.39 3.01 23.36 1.05 21.21 1.87LOI 3.2 20.15 20.04 21.14 20.01 24.08EC 1.87 1.77 0.02 5.14 1.74 1.69NO3
2 1.95 20.07 24.46 1.24 2 24.08NH4
+ 2.98 20.15 0.52 22.16 20.19 3.75Ca 0.25 3.62 21.88 21.67 20.27 3.62K 3.09 0.38 22.45 0.52 20.9 22.32Mg 3.12 0.82 0.29 1.3 20.21 2.92Na 2.88 1.16 20.78 3.25 0.38 20.61P 0.59 2.87 23.57 21.56 1.46 1.05S 1.08 0.51 4.56 3.22 3.97 0.17Al 1.58 23.35 0.93 21.05 21.34 1.86Cd 0.88 3.66 1.69 22.39 20.49 21.98Cr 3.27 20.73 0.18 0.87 0.45 1.87Cu 21.34 2.66 2.94 1.5 21.34 21.86Fe 2.63 22.28 20.31 21.3 22.16 0.35Mn 2.85 0.01 1.04 0.88 23.69 0.32Mo 1.57 3.16 1.33 22.69 1.13 20.27Ni 2.92 0.6 1.81 22.37 20.97 21.48Pb 20.79 0.96 20.29 3.33 26.83 20.55Zn 20.05 3.91 2.47 20.8 21.17 20.79
Variance
Cum. Var. 0.39 0.64 0.75 0.83 0.89 0.92%Var. Expl. 0.39 0.25 0.11 0.08 0.06 0.03
298 Rhodora [Vol. 116
Ta
ble
3.
Mea
nv
alu
es6
sta
nd
ard
erro
rsfo
rso
ilv
ari
ab
les;
incl
ud
ing
17
soil
elem
ents
(tw
ofo
rms
of
nit
rog
en),
pH
,o
rga
nic
ma
tter
con
ten
ta
slo
sso
nig
nit
ion
(LO
I),
an
del
ectr
ica
lco
nd
uct
ivit
y(E
C).
All
elem
ents
are
rep
ort
eda
sp
pm
,L
OI
as
per
cen
t(%
),a
nd
elec
tric
al
con
du
ctiv
ity
as
mm
ho
s/cm
.C
od
esfo
rin
div
idu
al
ha
bit
ats
:T
P5
tail
ing
sp
on
d,
WR
5w
ast
ero
ckp
iles
,W
E5
wet
lan
d,
SH
5sh
ore
,a
nd
IB5
inb
etw
een
.
Ha
bit
at
pH
LO
IE
CN
O32
NH
4+
Ca
K
IB5
.87
60
.15
5.2
61
.80
.66
60
.17
6.2
63
.18
.26
5.9
25
69
61
42
91
05
.76
41
.7S
H6
.73
60
.38
8.4
63
.81
1.8
46
6.5
64
9.7
63
3.2
19
.36
16
.63
66
06
10
08
43
9.4
62
27
.2T
P7
.54
60
.07
0.6
60
.20
.79
60
.26
1.8
60
.43
.76
0.6
16
28
56
15
15
11
.76
0.7
WR
5.1
46
0.6
11
.16
0.1
0.7
56
0.1
21
.46
0.3
26
0.1
24
11
61
29
21
0.5
61
.4W
E4
.39
60
.44
25
68
1.8
26
0.9
54
8.6
61
23
7.5
62
4.5
32
64
61
51
22
55
.16
14
.8
Mg
Na
PS
Al
Cd
Cr
IB1
02
.46
32
.31
8.4
66
.37
.36
1.2
16
4.1
67
3.2
12
.46
11
.72
.76
0.7
0.0
46
60
.01
9S
H3
80
.56
14
6.4
30
22
.26
16
89
.91
2.9
64
.93
20
.56
14
1.7
1.8
61
.23
.46
1.5
0.1
42
60
.07
TP
10
0.6
61
0.7
5.6
61
.52
0.1
61
.88
9.8
62
9.2
0.4
60
36
0.9
0.0
23
60
.00
3W
R6
6.7
69
.45
.86
0.7
4.1
61
.73
76
.76
10
9.8
9.6
65
.81
.36
0.5
0.0
32
60
.00
5W
E3
78
.96
15
82
85
.96
16
4.4
8.7
61
.43
45
2.7
63
19
2.7
7.4
63
25
.26
22
0.1
56
60
.04
3
Cu
Fe
Mn
Mo
Ni
Pb
Zn
IB1
31
.86
26
.31
17
.36
62
.94
.26
20
.38
60
.06
1.5
26
0.5
81
29
.26
78
55
86
11
0S
H5
66
15
.11
39
.56
91
.81
4.2
64
.60
.39
60
.08
1.3
96
0.5
22
9.2
65
.84
30
61
46
TP
10
2.7
67
.22
.56
0.9
0.8
60
.20
.56
0.0
40
.49
60
.21
9.1
62
.77
50
65
2W
R1
07
.56
25
.73
66
15
.61
.86
0.7
0.2
76
0.0
80
.49
60
.06
13
.36
5.6
36
86
11
9W
E1
70
.36
14
6.2
65
6.9
61
92
.51
3.8
61
0.8
1.8
16
1.3
68
.68
65
.66
1.4
60
.42
93
46
26
32
2014] Mansfield et al.—Vascular Plants at Callahan Mine 299
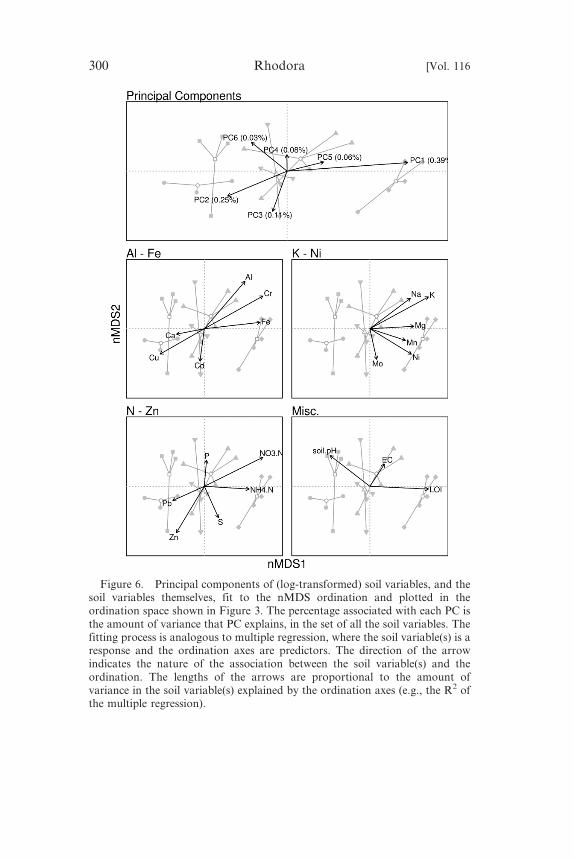
Figure 6. Principal components of (log-transformed) soil variables, and thesoil variables themselves, fit to the nMDS ordination and plotted in theordination space shown in Figure 3. The percentage associated with each PC isthe amount of variance that PC explains, in the set of all the soil variables. Thefitting process is analogous to multiple regression, where the soil variable(s) is aresponse and the ordination axes are predictors. The direction of the arrowindicates the nature of the association between the soil variable(s) and theordination. The lengths of the arrows are proportional to the amount ofvariance in the soil variable(s) explained by the ordination axes (e.g., the R2 ofthe multiple regression).
300 Rhodora [Vol. 116

making both these habitats physically challenging for plant growth.
Wetland and shore habitats were fairly nutrient rich, especially in
total N, and had the highest organic matter content among the five
habitats examined. There was also ample soil development on both
these habitats, providing a suitable growth medium for roots.With regard to hypothesis (b): the ordination of the plant
community indicates two distinct floras with little overlap (see
Supplementary Table with mean abundances across habitats and
NMDS loadings for all plants at http://nrajakaruna.files.wordpress.
com/2014/03/supplementary-table.pdf): 1) a wetland flora and 2) a
small subset of plants found in the disturbed habitats (waste rock
piles and tailings pond). The shore and ‘in between’ habitats—
which fall between the disturbed habitats and the wetland habitatin ordination space—share plant taxa with both the wetland and
the disturbed habitats. Woody vegetation was abundant across
Callahan Mine but was predominately associated with the shore
and ‘in between’ habitats. The few species of ferns present at the
Mine were found in the wetland and in the wooded buffer, and were
likely restricted in location by the requirement for a moist rooting
zone. Annual forbs were infrequent at the Mine (six species in
total), and were associated only with the shore and wetlandhabitats. The absence of annual forbs from the disturbed habitats—
the tailings pond and waste rock piles—is curious. It is unsurprising
that Asteraceae (33 taxa; 21%), Poaceae (17 taxa; 11%), and
Rosaceae (12 taxa; 8%) were the most species-rich families, as they
are also some of the most speciose families in the region.
Of the six families speciose enough to be considered individually,
the Rosaceae were associated with the less disturbed habitats
Table 4. Fit of the variables to the nMDS ordination of the plantcommunity. Note that each variable was fit separately. The p-value wasderived from 999 permutations of each variable vector with regard to the site-species matrix; the vector was permuted and R2 calculated for eachpermutation. The p-value, therefore, is the fraction of permutations with anR2 greater than that observed with the original data.
Variable R2 p (permutation) .R2
PC1 0.6496 0.001PC2 0.2218 0.095PC3 0.1792 0.157PC4 0.0284 0.785PC5 0.0676 0.495Habitats 0.7073 0.001
2014] Mansfield et al.—Vascular Plants at Callahan Mine 301

Ta
ble
5.
Tis
sue
ma
cro
nu
trie
nt
con
cen
tra
tio
ns
of
20
spec
ies
fou
nd
at
Ca
lla
ha
nM
ine.
Co
nce
ntr
ati
on
sw
ere
det
erm
ined
by
the
dry
ash
ing
met
ho
dfo
ra
llex
cep
tN
,w
hic
hw
as
esti
ma
ted
by
dir
ect
com
bu
stio
na
na
lysi
s.T
ota
ln
itro
gen
(TN
)is
rep
ort
eda
sp
erce
nta
ge
an
da
llo
ther
elem
ents
are
rep
ort
eda
sp
pm
.
Sp
ecie
s
Ele
men
tal
Co
nce
ntr
ati
on
s(%
or
pp
m)
TN
(%)
Ca
KM
gP
Ach
ille
am
ille
foli
um
sub
sp.
lan
ulo
sa1
.46
14
24
0.2
26
37
6.9
52
26
6.4
32
90
4.3
2B
etu
lap
ap
yri
fera
1.9
99
14
4.5
11
10
50
.31
24
5.9
11
67
5.7
Fes
tuca
rub
rasu
bsp
.ru
bra
1.2
65
05
3.6
51
02
81
.41
98
0.9
76
09
.42
Ga
liu
mm
oll
ug
o1
.54
18
42
7.3
71
61
91
.06
23
76
.77
24
56
.64
Hy
per
icu
mp
erfo
ratu
msu
bsp
.p
erfo
ratu
m1
.74
78
90
.31
04
17
.86
13
06
.47
21
26
.67
Ju
ncu
sg
era
rdii
1.1
51
42
4.9
82
05
39
.13
13
34
.07
11
74
.63
Lo
tus
corn
icu
latu
s2
.55
14
23
1.2
71
57
18
.77
13
64
.79
81
3.7
9L
up
inu
sp
oly
ph
yll
us
va
r.p
oly
ph
yll
us
3.7
21
62
60
.96
19
00
1.1
44
49
9.1
11
76
5.8
7M
ore
lla
caro
lin
ien
sis
1.8
85
65
4.1
76
62
9.2
81
72
4.7
75
54
.05
On
ocl
ease
nsi
bil
is1
.82
13
50
6.0
91
77
06
.61
23
40
.29
24
56
.78
Ph
rag
mit
esa
ust
rali
s2
.36
31
84
.76
17
37
7.7
98
85
.96
13
09
.96
Po
pu
lus
ba
lsa
mif
era
sub
sp.
ba
lsa
mif
era
1.7
71
89
56
.08
16
68
7.9
31
87
1.7
11
45
9.0
5S
ali
xb
ebb
ian
a1
.55
14
51
5.7
89
17
8.2
91
27
6.7
11
62
1.3
2S
ilen
evu
lga
ris
sub
sp.
vulg
ari
s1
.17
19
53
4.5
44
03
27
.08
22
24
.72
43
3.5
Sp
ira
eaa
lba
va
r.la
tifo
lia
1.5
66
75
4.2
58
75
6.1
61
32
7.1
51
38
7.0
2S
tell
ari
ag
ram
inea
1.0
99
27
2.1
21
00
73
.56
17
49
.45
51
6.0
3T
hla
spi
arv
ense
4.8
22
61
32
.53
39
06
0.0
72
40
6.1
65
11
8.3
9T
yp
ha
lati
foli
a2
.13
66
90
.21
21
76
7.2
81
03
8.2
61
86
8.3
3V
acc
iniu
ma
ng
ust
ifo
liu
m1
.69
67
51
.56
35
86
.61
16
81
.53
94
4.7
Vic
iavi
llo
sasu
bsp
.vi
llo
sa3
.07
21
47
6.7
51
19
65
.07
14
17
.51
15
23
.15
302 Rhodora [Vol. 116
Ta
ble
6.
Tis
sue
mic
ron
utr
ien
ts,
incl
ud
ing
hea
vy
met
al
con
cen
tra
tio
ns,
of
20
spec
ies
fou
nd
at
Ca
lla
ha
nM
ine.
Co
nce
ntr
ati
on
sw
ere
det
erm
ined
by
the
dry
ash
ing
met
ho
da
nd
are
rep
ort
eda
sp
pm
.
Sp
ecie
sA
lB
Cd
Cr
Cu
Fe
Mn
Mo
Ni
Pb
Zn
Ach
ille
am
ille
foli
um
sub
sp.
lan
ulo
sa3
0.3
34
3.8
8,
5.0
,5
.02
1.8
36
5.2
76
4.9
1,
5.0
13
.54
,5
.03
94
.74
Bet
ula
pa
py
rife
ra2
0.5
12
4.1
5,
5.0
,5
.07
.34
57
.39
11
3.2
21
2.4
3,
5.0
,5
.06
20
.66
Fes
tuca
rub
rasu
bsp
.ru
bra
16
2.0
38
.14
,5
.0,
5.0
12
.87
25
5.6
75
06
.76
43
.93
,5
.05
.92
14
9.7
5G
ali
um
mo
llu
go
14
.89
44
.76
,5
.0,
5.0
6.4
44
2.4
62
6.2
7,
5.0
,5
.0,
5.0
61
0.9
4H
yp
eric
um
per
fora
tum
sub
sp.
per
fora
tum
,1
0.0
35
.42
,5
.0,
5.0
8.1
63
2.1
96
1.0
4,
5.0
,5
.0,
5.0
30
5.0
2J
un
cus
ger
ard
ii1
16
.86
11
.36
,5
.0,
5.0
6.3
46
8.1
45
4.6
7,
5.0
,5
.0,
5.0
86
.23
Lo
tus
corn
icu
latu
s,
10
.01
9.7
7,
5.0
,5
.04
.73
45
.47
34
.56
21
.12
,5
.0,
5.0
23
0.4
3L
up
inu
sp
oly
ph
yll
us
va
r.p
oly
ph
yll
us
54
.86
19
.94
,5
.0,
5.0
13
.84
65
.13
92
3.3
1,
5.0
,5
.0,
5.0
13
7.6
5M
ore
lla
caro
lin
ien
sis
17
.59
25
.46
,5
.0,
5.0
3.8
25
7.2
99
8.8
4,
5.0
,5
.0,
5.0
72
.69
On
ocl
ease
nsi
bil
is,
10
.02
5.4
,5
.0,
5.0
6.6
15
3.5
11
3.7
4,
5.0
,5
.0,
5.0
64
9.7
7P
hra
gm
ites
au
stra
lis
,1
0.0
5.6
3,
5.0
,5
.01
.14
8.0
61
08
.76
,5
.0,
5.0
,5
.04
7.6
1P
op
ulu
sb
als
am
ifer
asu
bsp
.b
als
am
ifer
a,
10
.03
3.9
31
0.6
3,
5.0
5.4
93
65
0.5
4,
5.0
,5
.0,
5.0
96
9.4
4S
ali
xb
ebb
ian
a,
10
.02
7.8
46
.73
,5
.04
.71
01
.29
73
.89
,5
.0,
5.0
,5
.01
06
9.5
8S
ilen
evu
lga
ris
sub
sp.
vulg
ari
s2
4.9
23
.62
5.2
4,
5.0
6.8
74
9.1
12
5.5
9,
5.0
5.7
3,
5.0
53
1.7
2S
pir
aea
alb
av
ar.
lati
foli
a4
2.4
61
2.0
81
0.4
7,
5.0
4.7
83
5.5
91
20
.04
,5
.0,
5.0
,5
.07
12
.26
Ste
lla
ria
gra
min
ea9
6.1
13
.77
,5
.0,
5.0
8.9
11
0.7
56
3.5
6,
5.0
,5
.0,
5.0
28
2.2
6T
hla
spi
arv
ense
76
.12
16
.06
,5
.0,
5.0
6.9
91
45
.92
38
.1,
5.0
,5
.0,
5.0
32
1.3
Ty
ph
ala
tifo
lia
,1
0.0
12
.24
,5
.0,
5.0
4.7
55
1.6
30
0.8
57
.79
,5
.0,
5.0
65
.13
Va
ccin
ium
an
gu
stif
oli
um
70
.87
26
.34
,5
.0,
5.0
5.2
55
3.1
86
83
.31
,5
.0,
5.0
,5
.02
6.3
4V
icia
vill
osa
sub
sp.
vill
osa
42
.17
23
.3,
5.0
,5
.07
.73
90
.57
80
.44
10
.53
5.5
9,
5.0
39
5.2
6
2014] Mansfield et al.—Vascular Plants at Callahan Mine 303

(wetland, shore, and ‘in between’), whereas the Pinaceae were
absent from the wetland habitats. The Asteraceae were associatedwith all habitats but were a more dominant component of the
community in the shore and wetland habitats. The Caryophyllaceae
consisted of three introduced species characteristic of disturbed
environments (Cerastium fontanum, Silene vulgaris subsp. vulgaris,
and Stellaria graminea) and a native maritime species (Spergularia
marina). Collectively, these were found in all habitats except the
wetland. Both Cerastium and Silene consist of metal-tolerant
species worldwide and are often dominant perennial forbs on Cuand Zn mine tailings (O’Dell and Rajakaruna 2011). The Poaceae
were associated with all habitats, confirming why genera such as
Festuca and Agrostis are often used in the restoration of mine
tailings worldwide (O’Dell and Rajakaruna 2011). The Fabaceae
were absent from the wetland habitats (unsurprising, as this family is
nitrogen fixing and characteristic of marginal soils), and were all
introduced perennials characteristic of pastures. The association of
various plant families and life forms within different habitatssuggests differential tolerance to physical and chemical factors
associated with distinct habitats found within Callahan Mine. This is
an important result that provides land managers with better guidance
to select species of plants that are best suited for the restoration, per
Environmental Protection Agency (1996), of the various habitats
(tailings pond, waste rock piles, wetland, etc.) found within the Mine.
With regard to hypothesis (c): soil ionic content differed
substantially across habitats, and the gradient in the plantcommunity paralleled the primary differences in soils among
habitats. Wetland soils contained high levels of organic matter,
N, Fe, and the plant nutrients Mn, Mg, Na, and K, whereas the
soils of the tailings pond and waste rock piles were marginal in
terms of organic matter and N. All habitats were found to have
equivalent amounts of Cu (means ranging from 103 to 170 ppm),
except the shore (mean 56 ppm). Although it is impossible to infer a
causal influence of soil ionic content on the plant community (asopposed to soil physical factors such as depth, texture, and water
inundation), our findings are important for management and
restoration decisions, especially when suitable species are sought to
restore distinct habitats (i.e., tailings pond, waste rock pile, etc.)
within Callahan Mine.
Our exploratory tissue analyses also indicate the extent to which
metals were accumulated by the plants found at Callahan Mine.
304 Rhodora [Vol. 116
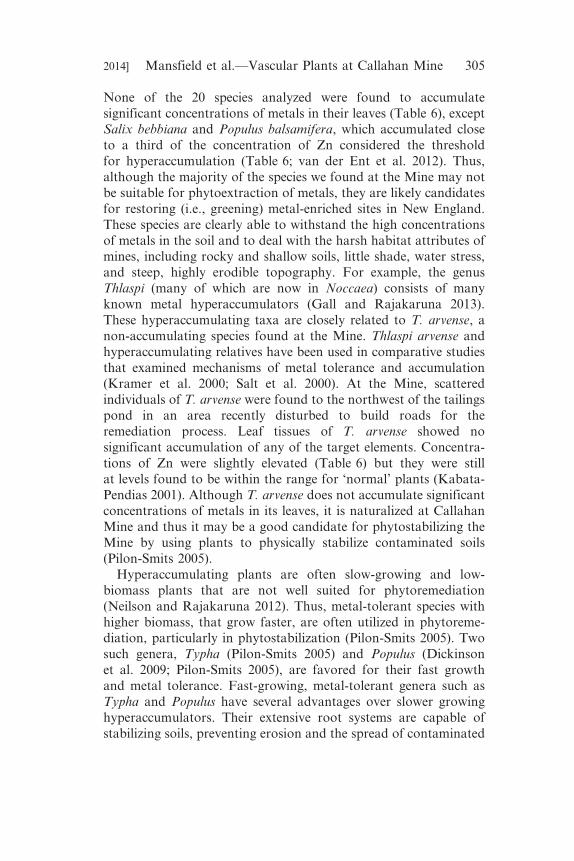
None of the 20 species analyzed were found to accumulate
significant concentrations of metals in their leaves (Table 6), exceptSalix bebbiana and Populus balsamifera, which accumulated close
to a third of the concentration of Zn considered the threshold
for hyperaccumulation (Table 6; van der Ent et al. 2012). Thus,
although the majority of the species we found at the Mine may not
be suitable for phytoextraction of metals, they are likely candidates
for restoring (i.e., greening) metal-enriched sites in New England.
These species are clearly able to withstand the high concentrations
of metals in the soil and to deal with the harsh habitat attributes ofmines, including rocky and shallow soils, little shade, water stress,
and steep, highly erodible topography. For example, the genus
Thlaspi (many of which are now in Noccaea) consists of many
known metal hyperaccumulators (Gall and Rajakaruna 2013).
These hyperaccumulating taxa are closely related to T. arvense, a
non-accumulating species found at the Mine. Thlaspi arvense and
hyperaccumulating relatives have been used in comparative studies
that examined mechanisms of metal tolerance and accumulation(Kramer et al. 2000; Salt et al. 2000). At the Mine, scattered
individuals of T. arvense were found to the northwest of the tailings
pond in an area recently disturbed to build roads for the
remediation process. Leaf tissues of T. arvense showed no
significant accumulation of any of the target elements. Concentra-
tions of Zn were slightly elevated (Table 6) but they were still
at levels found to be within the range for ‘normal’ plants (Kabata-
Pendias 2001). Although T. arvense does not accumulate significantconcentrations of metals in its leaves, it is naturalized at Callahan
Mine and thus it may be a good candidate for phytostabilizing the
Mine by using plants to physically stabilize contaminated soils
(Pilon-Smits 2005).
Hyperaccumulating plants are often slow-growing and low-
biomass plants that are not well suited for phytoremediation
(Neilson and Rajakaruna 2012). Thus, metal-tolerant species with
higher biomass, that grow faster, are often utilized in phytoreme-diation, particularly in phytostabilization (Pilon-Smits 2005). Two
such genera, Typha (Pilon-Smits 2005) and Populus (Dickinson
et al. 2009; Pilon-Smits 2005), are favored for their fast growth
and metal tolerance. Fast-growing, metal-tolerant genera such as
Typha and Populus have several advantages over slower growing
hyperaccumulators. Their extensive root systems are capable of
stabilizing soils, preventing erosion and the spread of contaminated
2014] Mansfield et al.—Vascular Plants at Callahan Mine 305
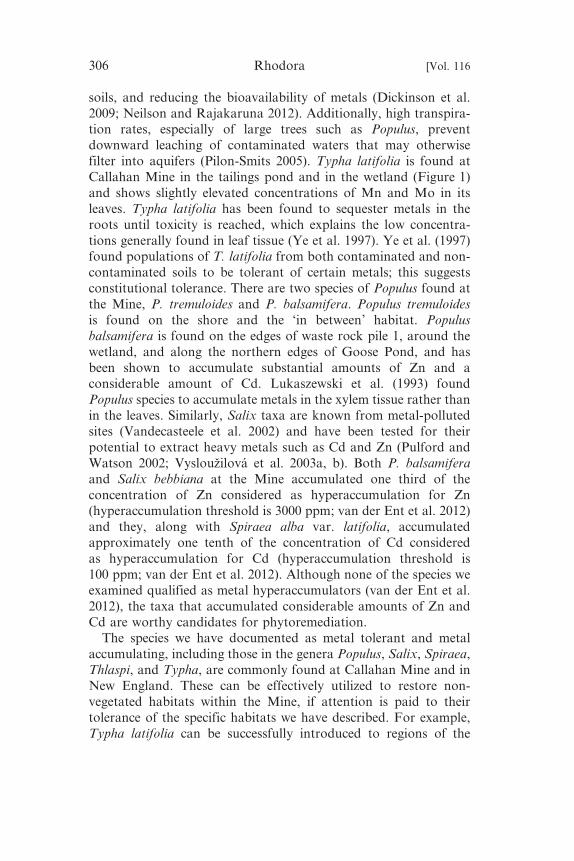
soils, and reducing the bioavailability of metals (Dickinson et al.
2009; Neilson and Rajakaruna 2012). Additionally, high transpira-tion rates, especially of large trees such as Populus, prevent
downward leaching of contaminated waters that may otherwise
filter into aquifers (Pilon-Smits 2005). Typha latifolia is found at
Callahan Mine in the tailings pond and in the wetland (Figure 1)
and shows slightly elevated concentrations of Mn and Mo in its
leaves. Typha latifolia has been found to sequester metals in the
roots until toxicity is reached, which explains the low concentra-
tions generally found in leaf tissue (Ye et al. 1997). Ye et al. (1997)found populations of T. latifolia from both contaminated and non-
contaminated soils to be tolerant of certain metals; this suggests
constitutional tolerance. There are two species of Populus found at
the Mine, P. tremuloides and P. balsamifera. Populus tremuloides
is found on the shore and the ‘in between’ habitat. Populus
balsamifera is found on the edges of waste rock pile 1, around the
wetland, and along the northern edges of Goose Pond, and has
been shown to accumulate substantial amounts of Zn and aconsiderable amount of Cd. Lukaszewski et al. (1993) found
Populus species to accumulate metals in the xylem tissue rather than
in the leaves. Similarly, Salix taxa are known from metal-polluted
sites (Vandecasteele et al. 2002) and have been tested for their
potential to extract heavy metals such as Cd and Zn (Pulford and
Watson 2002; Vyslouzilova et al. 2003a, b). Both P. balsamifera
and Salix bebbiana at the Mine accumulated one third of the
concentration of Zn considered as hyperaccumulation for Zn(hyperaccumulation threshold is 3000 ppm; van der Ent et al. 2012)
and they, along with Spiraea alba var. latifolia, accumulated
approximately one tenth of the concentration of Cd considered
as hyperaccumulation for Cd (hyperaccumulation threshold is
100 ppm; van der Ent et al. 2012). Although none of the species we
examined qualified as metal hyperaccumulators (van der Ent et al.
2012), the taxa that accumulated considerable amounts of Zn and
Cd are worthy candidates for phytoremediation.The species we have documented as metal tolerant and metal
accumulating, including those in the genera Populus, Salix, Spiraea,
Thlaspi, and Typha, are commonly found at Callahan Mine and in
New England. These can be effectively utilized to restore non-
vegetated habitats within the Mine, if attention is paid to their
tolerance of the specific habitats we have described. For example,
Typha latifolia can be successfully introduced to regions of the
306 Rhodora [Vol. 116

tailings pond and wetland that are currently unvegetated, whereas
the two Populus taxa and Salix bebbiana are ideal for unvegetatedsettings along the shore and ‘in-between’ habitats. Thlaspi arvense,
Silene vulgaris subsp. vulgaris, and Achillea millefolium subsp.
lanulosa are ideally suited for seeding many of the disturbed settings
at the Mine, including regions of the waste-rock piles, shore, and ‘in
between’ habitats. Similarly, the metal-tolerant grass and legume
species we have documented (Appendix) are good candidates for
phytoremediation practices, as they can stabilize the soil and, in the
case of the legumes, also introduce much-needed nitrogen to the soils.Thus, the suite of species we have documented for the Mine can
provide a species list from which land managers can choose species
that are able to remediate the distinct habitats within the Mine, as
well as in other similar disturbed and metal-enriched settings in the
region. It is important, however, to 1) pay attention to seed source, as
not all populations may be as tolerant of heavy metals due to
intraspecific variation for metal tolerance commonly found within a
species (O’Dell and Rajakaruna 2011) and 2) select those species thatare native or naturalized and are less likely to become invasive.
Degraded, disturbed, and polluted landscapes are often consid-
ered as habitats that non-native species readily colonize (Alpert et
al. 2000; Decker et al. 2012; Lemke et al. 2013). However, our study
confirms that 62% of the taxa we encountered at Callahan Mine are
native to North America, including 11 taxa (7%) listed as rare in at
least one New England state (Appendix). Only eight taxa (5%) are
considered invasive in at least one New England state (NewEngland Wild Flower Society 2012). A similar trend was observed
for bryophytes (Briscoe et al. 2009), lichens (Harris et al. 2007), and
vascular plants (Pope et al. 2010) at the metal-enriched serpentine
quarry at Pine Hill and for vascular plants of a nutrient-enriched
guano deposit on an offshore island in the region (Rajakaruna,
Pope, and Perez-Orozco 2009). These results suggest that chemi-
cally and physically harsh edaphic settings, including those that are
disturbed, may contribute to species-rich native plant communities(Hobbs and Humphries 1995). Contrary to our expectation, the
vegetation at Callahan Mine was as similar to that of the metal-
enriched serpentine quarry at Pine Hill, as it was to that of the
granitic outcrop at Settlement Quarry (Pope et al. 2010), both in
terms of families and species shared. The proportion of species in
the Callahan Mine flora shared with Pine Hill was marginally larger
than the proportion of species in Callahan Mine flora shared with
2014] Mansfield et al.—Vascular Plants at Callahan Mine 307

Settlement Quarry. However, this outcome is probably a direct
result of the greater diversity in the Pine Hill flora (132 species,relative to 94 at Settlement Quarry), and hence of the greater
chance that any given site in the region would share a larger
proportion of species with Pine Hill than Settlement Quarry.
Edaphically extreme sites, such as Callahan Mine, hold many
potential discoveries in the fields of ecology and evolution (Harrison
and Rajakaruna 2011) and green technologies such as phytoreme-
diation and phytostabilization (Pilon-Smits 2005; Whiting et al.
2004). The potential for new discoveries is exciting; however, withoutprior knowledge of what is growing at sites such as Callahan Mine,
these discoveries could not take place. Remediation of the Mine
began in 2010 (Environmental Protection Agency 2013) and without
this study, there would have been little information on the flora of
this unique habitat prior to remediation. The current study of the
vascular plants at the Mine provides a baseline to compare
vegetation before and after remediation efforts, making more in-
depth studies possible in the future. Our study also points to distinctplant-habitat associations within the Mine, and indicates that
different plant families and plant forms may be better suited to the
restoration of each of the edaphically distinct habitats found within
the Mine. Studies such as these, conducted across New England’s
many contaminated sites, can better inform land managers and
conservation authorities on how best to remediate the landscapes
degraded by human activities of the past.
ACKNOWLEDGMENTS. We thank Naji Akladiss and Ed Hathaway
(US Environmental Protection Agency), Paul Scally (Charter
Environmental), and Sally N. Mills (Hale & Hamlin, LLC) for
providing access to Callahan Mine; Robin van Dyke, Hale Morrell,
and Ilse Purrenhage for assistance in the field; Luka Negoita for
advice on field sampling methods; Matt Dickinson for assistance in
plant identification; Ian D. Medeiros for taxonomic and editorial
assistance; Gordon Longsworth for assistance with GIS; and ananonymous reviewer for useful comments and guidance during the
revision of the manuscript. This study was supported with funds
from the Maine Space Grant Consortium to N.R., Garden Club of
America Summer Scholarship in Field Botany to M.R.M., College
of the Atlantic’s Rothschild Research Grant for Faculty-Student
Collaboration to N.R. and M.R.M. and Presidential Scholarship
to M.R.M, and a National Science Foundation Predoctoral
308 Rhodora [Vol. 116

Fellowship to N.S.P. The paper is based on the undergraduate
thesis of M.R.M.
LITERATURE CITED
AHMAD, M. S. AND M. ASHRAF. 2011. Essential roles and hazardous effects ofnickel in plants. Rev. Environm. Contam. Toxicol. 214: 125–167.
ALPERT, P., E. BONE, AND C. HOLZAPFEL. 2000. Invasiveness, invasibility and therole of environmental stress in the spread of non-native plants. Perspect.Pl. Ecol. 3: 52–66.
BACARO, G., C. RICOTTA, AND S. MAZZOLENI. 2007. Measuring beta-diversityfrom taxonomic similarity. J. Veg. Sci. 18: 793–798.
BAKER, A. J. M., W. H. O. ERNST, A. VAN DER ENT, F. MALAISSE, AND R.GINOCCHIO. 2010. Metallophytes: The unique biological resource, itsecology and conservation status in Europe, Central Africa, and LatinAmerica, pp. 7–40. In: L. C. Batty and K. B. Hallberg, eds., Ecology ofIndustrial Pollution. Cambridge University Press, New York, NY.
BOYD, R. S. 2004. Ecology of metal hyperaccumulation. New Phytol. 162:563–567.
BRISCOE, L. R. E., T. B. HARRIS, E. DANNENBERG, W. BROUSSARD, F. C. OLDAY,AND N. RAJAKARUNA. 2009. Bryophytes of adjacent serpentine and graniteoutcrops on the Deer Isles, Maine, USA. Rhodora 111: 1–20.
CHAFFAI, R. AND H. KOYAMA. 2011. Heavy metal tolerance in Arabidopsisthaliana. Advances Bot. Res. 60: 1–49.
DECKER, K. L., C. R. ALLEN, L. ACOSTA, M. L. HELLMAN, C. F. JORGENSEN, R.J. STUTZMAN, K. M. UNSTAD, A. WILLIAMS, AND M. YANS. 2012. Land use,landscapes, and biological invasions. Invasive Pl. Sci. Managem. 5:108–116.
DICKINSON, N. M., A. J. M. BAKER, A. DORONILA, S. LAIDLAW, AND R. D.REEVES. 2009. Phytoremediation of inorganics: Realism and synergies. Int.J. Phytoremed. 11: 97–114.
ENSLEY, B. D. 2000. Phytoremediation for toxic metals—using plants to clean upthe environment, pp. 3–13. In: I. Raskin and B. D. Ensley, eds., Rationalefor Use of Phytoremediation. John Wiley & Sons, Inc., New York, NY.
ENVIRONMENTAL PROTECTION AGENCY. 1996. Revegetation of Superfund siteswith native plants: A primer for Superfund personnel. U.S. EPA, Region 5Superfund. National Service Center for Environmental Publications,Washington, DC. Website (http://nepis.epa.gov). Accessed Oct 2013.
———. 2002. National priorities list site narrative for Callahan Mine. U.S.EPA, OSRTI, Washington, DC. Website (http://www.epa.gov/superfund/sites/npl/nar1646.htm). Accessed Oct 2013.
———. 2009. Callahan Mine Superfund Site – OU1 Feasibility Study Report.MACTEC Engineering and Consulting, Inc., Portland, ME. Website(http://www.epa.gov/region1/superfund/sites/callahan/452698.pdf). Ac-cessed Oct 2013.
———. 2013. Waste site cleanup and reuse in New England. EPA New England,Boston, MA. Website (http://www.epa.gov/region1/superfund/). AccessedOct 2013.
2014] Mansfield et al.—Vascular Plants at Callahan Mine 309

EPSTEIN, E. AND A. J. BLOOM. 2004. Mineral Nutrition of Plants: Principles and
Perspectives. 2nd ed. Sinauer Associates, Inc., Sunderland, MA.
GALL, J. E. AND N. RAJAKARUNA. 2013. The physiology, functional genomics,and applied ecology of heavy metal-tolerant Brassicaceae, pp. 121–148. In:
M. Lang, ed., Brassicaceae: Characterization, Functional Genomics, and
Health Benefits. Nova Science Publishers, Inc., New York, NY.
GAVLAK, R., D. HORNECK, R. O. MILLER, AND J. KOTUBY-AMACHER. 2003. Soil,
Plant, and Water: Reference Methods for the Western Region. 2nd ed.WCC-103 publication, WREP-125, Corvallis, OR.
HAINES, A. 2011. Flora Novae Angliae: A Manual for the Identification of
Native and Naturalized Higher Vascular Plants of New England. Yale
University Press, New Haven, CT.
HANSCH, R. AND R. R. MENDEL. 2009. Physiological functions of mineral
micronutrients (Cu, Zn, Mn, Fe, Ni, Mo, B, Cl). Curr. Opin. Pl. Biol. 12:
259–266.
HARRIS, T. B., F. C. OLDAY, AND N. RAJAKARUNA. 2007. Lichens of Pine Hill, a
peridotite outcrop in eastern North America. Rhodora 109: 430–447.
HARRISON , S. P. AND N. RAJAKARUNA, eds. 2011. Serpentine: Evolution and
Ecology in a Model System. University of California Press, Berkeley, CA.
HOBBS, R. J. AND S. E. HUMPHRIES. 1995. An integrated approach to the ecology
and management of plant invasions. Conserv. Biol. 9: 761–770.
HOSSAIN, M. A., P. PIYATIDA, J. A. TEIXERIA DA SILVA, AND M. FUJITA. 2012.
Molecular mechanism of heavy metal toxicity and tolerance in plants:
Central role of glutathione in detoxification of reactive oxygen species and
methylglyoxal and in heavy metal chelation. J. Bot., Vol. 2012, Article ID
872875, 37 pp., 2012. doi:10.1155/2012/872875.
JACOBI, C. M., F. F. DO CARMO, AND I. C. DE CAMPOS. 2011. Soaring extinction
threats to endemic plants in Brazilian metal-rich regions. Ambio 40: 540–543.
KABATA-PENDIAS, A. 2001. Trace Elements in Soils and Plants. 3rd ed. CRC
Press, Boca Raton, FL.
KALRA, Y. P. AND D. G. MAYNARD. 1991. Methods manual for forest soil and
plant analysis. Information Report NOR-X-319, Forestry Canada,
Northwest Region, Northern Forestry Centre, Edmonton, AB, Canada.
KRAMER, U., I. J. PICKERING, R. C. PRINCE, I. RASKIN, AND D. E. SALT. 2000.
Subcellular localization and speciation of nickel in hyperaccumulator andnon-accumulator Thlaspi species. Pl. Physiol. 122: 1343–1353.
LEMKE, D., C. J. SCHWEITZER, W. TADESSE, Y. WANG, AND J. A. BROWN. 2013.
Geospatial assessment of invasive plants on reclaimed mines in Alabama.
Invasive Pl. Sci. Managem. 6: 401–410.
LUKASZEWSKI, Z., R. SIWECKI, J. OPYDO, AND W. ZEMBRZUSKI. 1993. The effect of
industrial pollution on copper, lead, zinc, and cadmium concentration in
xylem rings of resistant (Populus marilandica) and sensitive (P. balsamifera)
species of poplar. Trees 7: 169–174.
MARSCHNER, H. 1995. Mineral Nutrition of Higher Plants. 2nd ed. AcademicPress, New York, NY.
MCGEE, C. J., I. J. FERNANDEZ, S. A. NORTON, AND C. S. STUBBS. 2007. Cd, Ni,
Pb, and Zn concentrations in forest vegetation and soils in Maine. Water
Air Soil Pollut. 180: 141–153.
310 Rhodora [Vol. 116

NEILSON, S. AND N. RAJAKARUNA. 2012. Roles of rhizospheric processes andplant physiology in phytoremediation of contaminated sites using oilseedBrassicas, pp. 313–330. In: N. A. Anjum, I. Ahmad, M. E. Pereira, A. C.Duarte, S. Umar, and N. A. Khan, eds., The Plant Family Brassicaceae:Contribution Towards Phytoremediation. Environmental Pollution BookSeries, Vol. 21. Springer, Dordrecht, The Netherlands.
NEW ENGLAND WILD FLOWER SOCIETY. 2012. Go Botany. Discover thousandsof New England plants. Framingham, MA. Website (http://gobotany.newenglandwild.org). Accessed Jan 2013.
O’DELL, R. E. AND N. RAJAKARUNA. 2011. Intraspecific variation, adaptation,and evolution, pp. 97–137. In: S. P. Harrison and N. Rajakaruna, eds.,Serpentine: Evolution and Ecology in a Model System. University ofCalifornia Press, Berkeley, CA.
OKSANEN, J., F. G. BLANCHET, R. KINDT, ET AL. 2013. vegan: Community EcologyPackage. R package version 2.0-8. J. Oksanen, maintainer, University of Oulu,Finland. Website (http://CRAN.R-project.org/package5vegan). Accessed Oct2013.
PAGE, V., L. WEISSKOPF, AND U. FELLER. 2006. Heavy metals in white lupine:Uptake, root-to-shoot transfer, and redistribution within the plant. NewPhytol. 171: 329–341.
PALMER, M. A., E. S. BERNHARDT, W. H. SCHLESINGER, ET AL. 2010. Mountaintopmining consequences. Science 327: 148–149.
PERALTA-VIDEA, J. R., M. L. LOPEZ, M. NARAYAN, G. SAUPE, AND J. GARDEA-TORRESDEY. 2009. The biochemistry of environmental heavy metal uptakeby plants: Implications for the food chain. Int. J. Biochem. Cell. B. 41:1665–1677.
PILON-SMITS, E. 2005. Phytoremediation. Annual Rev. Pl. Biol. 56: 15–39.POPE, N., T. B. HARRIS, AND N. RAJAKARUNA. 2010. Vascular plants of adjacent
serpentine and granite outcrops on the Deer Isles, Maine, U.S.A. Rhodora112: 105–141.
PULFORD, I. D. AND C. WATSON. 2002. Phytoremediation of heavy metal-contaminated land by trees – A review. Environm. Int. 1032: 1–12.
R CORE TEAM. 2013. R: A language and environment for statistical computing.R Foundation for Statistical Computing, Vienna, Austria. Website (http://www.R-project.org/). Accessed Oct 2013.
RAJAKARUNA, N. AND R. S. BOYD. 2008. The edaphic factor, pp. 1201–1207. In:S. E. Jorgensen and B. Fath, eds., The Encyclopedia of Ecology, Vol. 2.Elsevier, Oxford, UK.
———, T. B. HARRIS, AND E. B. ALEXANDER. 2009. Serpentine geoecology ofeastern North America: A review. Rhodora 111: 21–108.
———, ———, S. R. CLAYDEN, A. C. DIBBLE, AND F. C. OLDAY. 2011. Lichensof Callahan Mine, a copper- and zinc-enriched superfund site inBrooksville, Maine, U.S.A. Rhodora 113: 1–31.
———, N. POPE, AND J. PEREZ-OROZCO. 2009. Ornithocoprophilous plants ofMount Desert Rock, a remote bird-nesting island in the Gulf of Maine,U.S.A. Rhodora 111: 417–447.
RASCIO, N. AND F. NAVARI-IZZO. 2011. Heavy metal accumulating plants: Howand why do they do it? And what makes them so interesting? Pl. Sci. 180:169–181.
2014] Mansfield et al.—Vascular Plants at Callahan Mine 311

REEVES, R. D. 2003. Tropical hyperaccumulators of metals and their potentialfor phytoextraction. Pl. & Soil 249: 57–65.
SALT, D. E., N. KATO, U. KRAMER, R. D. SMITH, AND I. RASKIN. 2000. The roleof root exudates in nickel hyperaccumulation and tolerance in accumulatorand non-accumulator species of Thlaspi, pp. 196–207. In: N. Terry and G.Banuelos, eds., Phytoremediation of Contaminated Soil and Water. CRCPress, Boca Raton, FL.
TER BRAAK, C. J. F. 1995. Ordination, pp. 91–173. In: R. H. G. Jongman,C. J. F. ter Braak, and O. F. R. van Tongeren, eds., Data Analysis inCommunity and Landscape Ecology. Cambridge University Press, NewYork, NY.
VAN DER ENT, A., A. J. M. BAKER, R. D. REEVES, A. J. POLLARD, AND H. SCHAT.2012. Hyperaccumulators of metal and metalloid trace elements: Facts andfiction. Pl. & Soil 362: 319–334.
VANDECASTEELE, B., B. DE VOS, AND F. M. G. TACK. 2002. Cadmium and zincuptake by volunteer willow species and elder rooting in polluted dredgedsediment disposal sites. Sci. Total Environm. 299: 191–205.
VERKLEIJ, J. A. C. AND J. E. PRAST. 1988. Cadmium tolerance and co-tolerancein Silene vulgaris (5 S. cucubalus). New Phytol. 111: 637–645.
VYSLOUZILOVA, M., P. TLUSTOS, J. SZAKOVA, AND D. PAVLIKOVA. 2003a. As, Cd,Pb, and Zn uptake by Salix spp. clones grown at soils enriched by highloads of these elements. Pl. Soil Environm. 49: 191–196.
———, ———, AND ———. 2003b. Cadmium and zinc phytoextractionpotential of seven clones of Salix spp. planted on heavy metalcontaminated soils. Pl. Soil Environm. 49: 542–547.
WHITING, S. N., R. D. REEVES, D. RICHARDS, ET AL. 2004. Research priorities forconservation of metallophyte biodiversity and their potential for restora-tion and site remediation. Restorat. Ecol. 12: 106–116.
WILLIAMSON, S. D. AND K. BALKWILL. 2006. Factors determining levels of threatto serpentine endemics. S. African J. Bot. 72: 619–626.
WUANA, R. A. AND F. E. OKIEIMEN. 2011. Heavy metals in contaminated soils:A review of sources, chemistry, risks and best available strategies forremediation. ISRN Ecology, Vol. 2011, Article ID 402647, 20 pp., 2011.doi:10.5402/2011/402647. ISRN Ecology 10/2011.
YE, Z. H., A. J. M. BAKER, M. H. WONG, AND A. J. WILLIS. 1997. Zinc, lead, andcadmium tolerance, uptake, and accumulation by Typha latifolia. NewPhytol. 136: 469–480.
312 Rhodora [Vol. 116

AP
PE
ND
IX
VA
SC
UL
AR
PL
AN
TS
FO
UN
DA
TC
AL
LA
HA
NM
INE
Ta
ble
sho
ws
pre
sen
ce/a
bse
nce
wit
hin
each
of
the
fiv
eh
ab
ita
tso
fC
all
ah
an
Min
e,a
sw
ell
as
on
the
serp
enti
ne
ou
tcro
p,
Pin
eH
ill
(PH
),a
nd
the
gra
nit
eo
utc
rop
,S
ettl
emen
tQ
ua
rry
(SQ
).C
all
ah
an
Min
eh
ab
ita
ts:
TP
5ta
ilin
gs
po
nd
,W
R5
wa
ste
rock
pil
es,
WE
5w
etla
nd
,S
H5
sho
re,
IB5
‘in
bet
wee
n’.
X5
spec
ies
pre
sen
t,–
5sp
ecie
sa
bse
nt.
Ta
xa
list
ed,
bu
tn
ot
fou
nd
ina
ny
of
the
des
ign
ate
dh
ab
ita
ts,
wer
eco
llec
ted
bet
wee
np
lots
.S
pec
ies
no
tn
ati
ve
toN
ort
hA
mer
ica
are
den
ote
db
ya
n*
.N
om
encl
atu
rea
nd
au
tho
riti
esfo
llo
wH
ain
es(2
01
1).
Co
nse
rva
tio
nst
atu
sin
New
En
gla
nd
(E5
end
an
ger
ed;
I5
inv
asi
ve;
P5
pro
hib
ited
;S
C5
spec
ial
con
cern
;T
5th
rea
ten
ed)
isfr
om
New
En
gla
nd
Wil
dF
low
erS
oci
ety
(htt
p:/
/go
bo
tan
y.n
ewen
gla
nd
wil
d.o
rg/;
mo
stre
cen
tly
acc
esse
dJa
n2
01
3).
Fa
mil
yS
pec
ies
Ca
lla
ha
nM
ine
Ha
bit
ats
PH
SQ
Co
nse
rva
tio
nS
tatu
s(S
tate
)T
PW
RW
ES
HIB
AD
OX
AC
EA
ES
am
bu
cus
race
mo
saL
.–
–X
XX
XX
Vib
urn
um
nu
du
mv
ar.
cass
ino
ides
(L.)
To
rr.
&A
.G
ray
––
––
X–
XS
C(C
T)
AM
AR
AN
TH
AC
EA
E*
Ch
eno
po
diu
ma
lbu
mL
.–
––
X–
––
Sa
lico
rnia
dep
ress
aS
tan
dl.
––
–X
––
–T
(NH
)*
Su
aed
am
ari
tim
asu
bsp
.m
ari
tim
a(L
.)D
um
ort
.–
––
––
––
AP
IAC
EA
E*
Da
ucu
sca
rota
L.
––
–X
––
–A
PO
CY
NA
CE
AE
Ap
ocy
nu
ma
nd
rosa
emif
oli
um
L.
––
–X
––
–A
scle
pia
ssy
ria
caL
.–
––
X–
––
AQ
UIF
OL
IAC
EA
EIl
exm
ucr
on
ata
To
rr.
&G
ray
exG
ray
––
––
––
XIl
exve
rtic
illa
ta(L
.)G
ray
––
––
––
–A
RA
LIA
CE
AE
Ara
lia
nu
dic
au
lis
L.
––
––
XX
–A
ST
ER
AC
EA
EA
chil
lea
mil
lefo
liu
msu
bsp
.la
nu
losa
(Nu
tt.)
Pip
er–
––
XX
XX
An
ten
na
ria
ho
wel
lii
sub
sp.
pet
alo
idea
(Fer
na
ld)
Ba
yer
––
––
––
–S
C(C
T)
2014] Mansfield et al.—Vascular Plants at Callahan Mine 313

Fa
mil
yS
pec
ies
Ca
lla
ha
nM
ine
Ha
bit
ats
PH
SQ
Co
nse
rva
tio
nS
tatu
s(S
tate
)T
PW
RW
ES
HIB
Cir
siu
mm
uti
cum
Mic
hx
.–
–X
X–
––
*C
irsi
um
vulg
are
(Sa
vi)
Ten
.–
–X
––
–X
Cir
siu
msp
.M
ill.
––
X–
––
–D
oel
lin
ger
iau
mb
ella
tav
ar.
um
bel
lata
(Mil
l.)
Nee
s–
–X
––
–X
Ere
chti
tes
hie
raci
ifo
liu
sv
ar.
hie
raci
ifo
liu
s(L
.)R
af.
exD
C.
––
X–
––
–
Eri
ger
on
stri
go
sus
Mu
hl.
exW
illd
.–
––
––
X–
Eu
ryb
iam
acr
op
hy
lla
(L.)
Ca
ss.
––
–X
––
–E
uth
am
iag
ram
inif
oli
a(L
.)N
utt
.X
–X
––
XX
*H
iera
ciu
mca
esp
ito
sum
Du
mo
rt.
–X
––
–X
XH
iera
ciu
mk
alm
iiL
.–
––
–X
––
*H
iera
ciu
mp
ilo
sell
aL
.X
X–
––
XX
Hie
raci
um
sp.
––
–X
X–
–L
act
uca
bie
nn
is(M
oen
ch)
Fer
na
ld–
–X
––
––
La
ctu
caca
na
den
sis
L.
––
X–
––
–L
act
uca
sp.
––
X–
––
–*
Leu
can
them
um
vulg
are
La
m.
–X
––
XX
–R
ud
bec
kia
hir
taL
.v
ar.
pu
lch
erri
ma
Fa
rw.
–X
––
––
–
*S
corz
on
ero
ides
au
tum
na
lis
sub
sp.
au
tum
na
lis
(L.)
Mo
ench
––
––
X–
–
So
lid
ag
ob
ico
lor
L.
X–
X–
–X
–S
oli
da
go
can
ad
ensi
sL
.v
ar.
can
ad
ensi
s–
–X
––
X–
AP
PE
ND
IX.
Co
nti
nu
ed.
314 Rhodora [Vol. 116

Fa
mil
yS
pec
ies
Ca
lla
ha
nM
ine
Ha
bit
ats
PH
SQ
Co
nse
rva
tio
nS
tatu
s(S
tate
)T
PW
RW
ES
HIB
So
lid
ag
oju
nce
aA
ito
nX
––
––
XX
So
lid
ag
on
emo
rali
sA
ito
nsu
bsp
.n
emo
rali
s–
––
–X
X–
So
lid
ag
op
ub
eru
laN
utt
.v
ar.
pu
ber
ula
X–
––
––
XS
oli
da
go
rug
osa
Mil
l.su
bsp
.ru
go
saX
–X
X–
XX
So
lid
ag
ose
mp
ervi
ren
sL
.v
ar.
sem
per
vire
ns
––
–X
––
–
So
lid
ag
ou
lig
ino
saN
utt
.–
––
––
––
So
lid
ag
osp
.X
–X
–X
––
*S
on
chu
sa
rven
sis
L.
va
r.a
rven
sis
––
––
––
–S
ym
ph
yo
tric
hu
mn
ovi
-bel
gii
(L.)
G.L
.N
eso
mv
ar.
no
vi-b
elg
ii–
–X
X–
XX
Sy
mp
hy
otr
ich
um
no
vi-b
elg
ii(L
.)G
.L.
Nes
om
va
r.el
od
es(T
orr
.&
Gra
y)
Nes
om
X–
X–
––
–
*T
ara
xa
cum
off
icin
ale
Web
erex
F.H
.W
igg
.–
––
XX
X–
BA
LS
AM
INA
CE
AE
Imp
ati
ens
cap
ensi
sM
eerb
.–
–X
––
X–
BE
TU
LA
CE
AE
Aln
us
viri
dis
(Vil
l.)
La
m.
&D
C.
sub
sp.
cris
pa
(Ait
on
)T
urr
ill
––
––
XX
–T
(MA
)
Bet
ula
pa
py
rife
raM
ars
ha
llX
X–
XX
XX
BR
AS
SIC
AC
EA
E*
Bra
ssic
an
igra
(L.)
W.D
.J.
Ko
ch–
––
X–
––
*T
hla
spi
arv
ense
L.
––
––
––
–C
AP
RIF
OL
IAC
EA
ED
ierv
illa
lon
icer
aM
ill.
––
––
XX
X
AP
PE
ND
IX.
Co
nti
nu
ed.
2014] Mansfield et al.—Vascular Plants at Callahan Mine 315

Fa
mil
yS
pec
ies
Ca
lla
ha
nM
ine
Ha
bit
ats
PH
SQ
Co
nse
rva
tio
nS
tatu
s(S
tate
)T
PW
RW
ES
HIB
*L
on
icer
am
orr
ow
iiG
ray
––
––
––
XI
(CT
,M
A,
NH
,R
I,V
T);
P(C
T,
MA
,N
H,
VT
)C
AR
YO
PH
YL
LA
CE
AE
*C
era
stiu
mfo
nta
nu
mB
au
mg
.su
bsp
.vu
lga
re(H
art
m.)
Gre
ute
r&
Bu
rdet
X–
––
–X
–
*S
ilen
evu
lga
ris
(Mo
ench
)G
arc
ke
sub
sp.
vulg
ari
s–
X–
XX
––
Sp
erg
ula
ria
ma
rin
a(L
.)G
rise
b.
––
–X
––
–*
Ste
lla
ria
gra
min
eaL
.–
X–
––
X–
CE
LA
ST
RA
CE
AE
*C
ela
stru
so
rbic
ula
tus
Th
un
b.
––
––
–X
–I
(CT
,M
A,
RI,
VT
);P
(CT
,M
A,
NH
,V
T)
CO
NV
OL
VU
LA
CE
AE
*C
usc
uta
gro
no
vii
Wil
ld.
exJ.
A.
Sch
ult
.v
ar.
gro
no
vii
––
X–
––
–P
(MA
,V
T)
CU
PR
ES
SA
CE
AE
Ju
nip
eru
sco
mm
un
isL
.v
ar.
dep
ress
aP
urs
h–
––
XX
XX
Th
uja
occ
iden
tali
sL
.–
––
XX
X–
E(M
A);
T(C
T)
CY
PE
RA
CE
AE
Ca
rex
beb
bii
Oln
eyex
Fer
na
ld–
––
X–
––
Ca
rex
sco
pa
ria
Sch
ku
hr
exW
illd
.X
––
X–
XX
AP
PE
ND
IX.
Co
nti
nu
ed.
316 Rhodora [Vol. 116
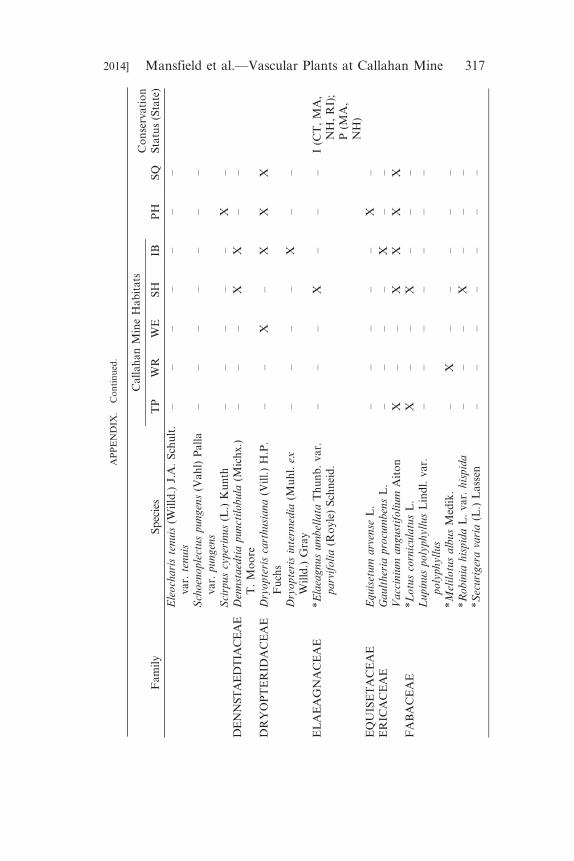
Fa
mil
yS
pec
ies
Ca
lla
ha
nM
ine
Ha
bit
ats
PH
SQ
Co
nse
rva
tio
nS
tatu
s(S
tate
)T
PW
RW
ES
HIB
Ele
och
ari
ste
nu
is(W
illd
.)J.
A.
Sch
ult
.v
ar.
ten
uis
––
––
––
–
Sch
oen
op
lect
us
pu
ng
ens
(Va
hl)
Pa
lla
va
r.p
un
gen
s–
––
––
––
Sci
rpu
scy
per
inu
s(L
.)K
un
th–
––
––
X–
DE
NN
ST
AE
DT
IAC
EA
ED
enn
sta
edti
ap
un
ctil
ob
ula
(Mic
hx
.)T
.M
oo
re–
––
XX
––
DR
YO
PT
ER
IDA
CE
AE
Dry
op
teri
sca
rth
usi
an
a(V
ill.
)H
.P.
Fu
chs
––
X–
XX
X
Dry
op
teri
sin
term
edia
(Mu
hl.
exW
illd
.)G
ray
––
––
X–
–
EL
AE
AG
NA
CE
AE
*E
laea
gn
us
um
bel
lata
Th
un
b.
va
r.p
arv
ifo
lia
(Ro
yle
)S
chn
eid
.–
––
X–
––
I(C
T,
MA
,N
H,
RI)
;P
(MA
,N
H)
EQ
UIS
ET
AC
EA
EE
qu
iset
um
arv
ense
L.
––
––
–X
–E
RIC
AC
EA
EG
au
lth
eria
pro
cum
ben
sL
.–
––
–X
––
Va
ccin
ium
an
gu
stif
oli
um
Ait
on
X–
–X
XX
XF
AB
AC
EA
E*
Lo
tus
corn
icu
latu
sL
.X
––
X–
––
Lu
pin
us
po
lyp
hy
llu
sL
ind
l.v
ar.
po
lyp
hy
llu
s–
––
––
––
*M
elil
otu
sa
lbu
sM
edik
.–
X–
––
––
*R
ob
inia
his
pid
aL
.v
ar.
his
pid
a–
––
X–
––
*S
ecu
rig
era
vari
a(L
.)L
ass
en–
––
––
––
AP
PE
ND
IX.
Co
nti
nu
ed.
2014] Mansfield et al.—Vascular Plants at Callahan Mine 317

Fa
mil
yS
pec
ies
Ca
lla
ha
nM
ine
Ha
bit
ats
PH
SQ
Co
nse
rva
tio
nS
tatu
s(S
tate
)T
PW
RW
ES
HIB
*T
rifo
liu
ma
rven
seL
.–
––
––
X–
*T
rifo
liu
mca
mp
estr
eS
chre
b.
––
––
–X
–*
Tri
foli
um
pra
ten
seL
.–
––
X–
XX
*T
rifo
liu
mre
pen
sL
.X
––
–X
X–
*V
icia
cra
cca
L.
sub
sp.
cra
cca
––
X–
XX
–*
Vic
iavi
llo
saR
oth
sub
sp.
vill
osa
–X
X–
X–
–G
RO
SS
UL
AR
IAC
EA
ER
ibes
gla
nd
ulo
sum
Gra
uer
––
X–
––
XS
C(C
T)
HY
PE
RIC
AC
EA
E*
Hy
per
icu
mp
erfo
ratu
mL
.su
bsp
.p
erfo
ratu
m–
––
––
XX
IRID
AC
EA
ES
isy
rin
chiu
mm
on
tan
um
Gre
ene
va
r.m
on
tan
um
–X
––
X–
–
JUN
CA
CE
AE
Ju
ncu
sb
alt
icu
sW
illd
.su
bsp
.li
tto
rali
s(E
ng
elm
.)S
no
ger
up
–X
––
––
–
Ju
ncu
sg
era
rdii
Lo
isel
.–
––
X–
––
JUN
CA
GIN
AC
EA
ET
rig
loch
inm
ari
tim
aL
.–
––
X–
––
E(V
T)
LA
MIA
CE
AE
*G
ale
op
sis
bif
ida
Bo
enn
.–
–X
X–
X–
LY
CO
PO
DIA
CE
AE
Dip
ha
sia
stru
md
igit
atu
m(D
ill.
exA
.B
rau
n)
Ho
lub
––
––
––
–
LY
TH
RA
CE
AE
*L
yth
rum
sali
cari
aL
.–
–X
––
––
I(C
T,,
ME
MA
,N
H,
RI,
VT
);P
(CT
,M
E,
MA
,N
HV
T)
AP
PE
ND
IX.
Co
nti
nu
ed.
318 Rhodora [Vol. 116

Fa
mil
yS
pec
ies
Ca
lla
ha
nM
ine
Ha
bit
ats
PH
SQ
Co
nse
rva
tio
nS
tatu
s(S
tate
)T
PW
RW
ES
HIB
MY
RIC
AC
EA
EM
ore
lla
caro
lin
ien
sis
(Mil
l.)
Sm
all
––
–X
––
–M
YR
SIN
AC
EA
E*
Ly
sim
ach
iab
ore
ali
s(R
af.
)U
.M
an
ns
&A
.A
nd
erb
.–
––
–X
XX
ON
AG
RA
CE
AE
Ch
am
aen
erio
na
ng
ust
ifo
liu
m(L
.)S
cop
.su
bsp
.ci
rcu
mva
gu
m(M
osq
uin
)M
old
enk
e
––
X–
––
–
Ep
ilo
biu
mci
lia
tum
va
r.ci
lia
tum
Ra
f.–
––
–X
––
Oen
oth
era
pa
rvif
lora
L.
XX
––
––
–O
NO
CL
EA
CE
AE
On
ocl
ease
nsi
bil
isL
.–
–X
XX
––
OR
CH
IDA
CE
AE
*E
pip
act
ish
elle
bo
rin
e(L
.)C
ran
tz–
––
XX
––
OR
OB
AN
CH
AC
EA
EE
up
hra
sia
nem
oro
sa(P
ers.
)W
all
r.–
––
–X
––
OX
AL
IDA
CE
AE
Ox
ali
sst
rict
aL
.–
––
––
X–
PIN
AC
EA
EA
bie
sb
als
am
ea(L
.)M
ill.
––
–X
–X
XE
(CT
)L
ari
xla
rici
na
(Du
Ro
i)K
.K
och
––
–X
––
–T
(RI)
Pic
eag
lau
ca(M
oen
ch)
Vo
ssX
––
XX
XX
Pic
earu
ben
sS
arg
.–
X–
XX
XX
Pin
us
resi
no
saA
ito
n–
––
XX
––
E(C
T)
Pin
us
stro
bu
sL
.–
––
X–
X–
*P
inu
ssy
lves
tris
L.
–X
––
––
–P
LA
NT
AG
INA
CE
AE
*P
lan
tag
om
ajo
rL
.–
––
––
––
Pla
nta
go
ma
riti
ma
L.
sub
sp.
jun
coid
es(L
am
.)H
ult
en–
––
X–
––
*V
ero
nic
ao
ffic
ina
lis
L.
––
X–
–X
X
AP
PE
ND
IX.
Co
nti
nu
ed.
2014] Mansfield et al.—Vascular Plants at Callahan Mine 319

Fa
mil
yS
pec
ies
Ca
lla
ha
nM
ine
Ha
bit
ats
PH
SQ
Co
nse
rva
tio
nS
tatu
s(S
tate
)T
PW
RW
ES
HIB
PO
AC
EA
EA
gro
stis
sca
bra
Wil
ld.
––
–X
––
X*
Ag
rost
isst
olo
nif
era
L.
X–
–X
X–
–*
Ely
mu
sre
pen
s(L
.)G
ou
ld–
–X
X–
XX
Fes
tuca
rub
raL
.su
bsp
.ru
bra
XX
––
XX
X*
Fes
tuca
tra
chy
ph
yll
a(H
ack
.)K
raji
na
––
–X
––
–
Gly
ceri
ast
ria
ta(L
am
.)A
.S.
Hit
chc.
––
X–
–X
–H
ord
eum
jub
atu
mL
.su
bsp
.ju
ba
tum
––
–X
––
–*
Ph
leu
mp
rate
nse
L.
––
––
X–
–P
hra
gm
ites
au
stra
lis
(Ca
v.)
Tri
n.
exS
teu
d.
––
–X
––
–I
(CT
,M
A,
NH
,V
T);
P(C
T,
MA
,N
H,
VT
)*
Po
aco
mp
ress
aL
.–
X–
XX
XX
I(C
T);
P(C
T)
*P
oa
nem
ora
lis
L.
––
––
X–
–P
oa
pa
lust
ris
L.
––
–X
–X
X*
Pu
ccin
elli
am
ari
tim
a(H
ud
s.)
Pa
rl.
––
–X
––
–P
ucc
inel
lia
nu
tta
llia
na
(J.A
.S
chu
lt.)
A.S
.H
itch
c.–
––
X–
––
Sp
art
ina
alt
ern
iflo
raL
ois
el.
––
–X
––
–S
pa
rtin
ap
ate
ns
(Ait
on
)M
uh
l.–
––
X–
––
AP
PE
ND
IX.
Co
nti
nu
ed.
320 Rhodora [Vol. 116

Fa
mil
yS
pec
ies
Ca
lla
ha
nM
ine
Ha
bit
ats
PH
SQ
Co
nse
rva
tio
nS
tatu
s(S
tate
)T
PW
RW
ES
HIB
To
rrey
och
loa
pa
llid
a(T
orr
.)C
hu
rch
va
r.fe
rna
ldii
(A.S
.H
itch
c.)
Do
reex
Ko
ya
ma
&K
aw
an
o
––
XX
––
–
PO
LY
GO
NA
CE
AE
Fa
llo
pia
cili
no
dis
(Mic
hx
.)H
olu
b–
–X
––
––
*F
all
op
iaco
nvo
lvu
lus
(L.)
A.
Lo
ve
––
––
––
–*
Per
sica
ria
ma
culo
saS
.F.
Gra
y–
––
––
––
SC
(MA
)*
Ru
mex
ace
tose
lla
L.
sub
sp.
py
ren
aic
us
(Po
urr
.ex
La
pey
r.)
Ak
ero
yd
–X
––
–X
XI
(CT
);P
(CT
)
*R
um
excr
isp
us
L.
sub
sp.
cris
pu
s–
–X
X–
X–
RA
NU
NC
UL
AC
EA
ER
an
un
culu
sa
bo
rtiv
us
L.
––
X–
––
–*
Ra
nu
ncu
lus
acr
isL
.–
––
–X
X–
RO
SA
CE
AE
Am
ela
nch
ier
spic
ata
(La
m.)
K.
Ko
ch–
––
XX
––
Fra
ga
ria
virg
inia
na
Du
ches
ne
sub
sp.
virg
inia
na
–X
–X
XX
X
Ma
lus
sp.
––
–X
––
–P
ote
nti
lla
no
rveg
ica
L.
––
––
–X
XP
ote
nti
lla
sim
ple
xM
ich
x.
–X
––
–X
XP
run
us
pen
sylv
an
ica
L.
f.v
ar.
pen
sylv
an
ica
X–
––
–X
X
Pru
nu
svi
rgin
ian
aL
.v
ar.
virg
inia
na
––
X–
XX
XP
run
us
sp.
––
–X
X–
–R
osa
pa
lust
ris
Ma
rsh
all
––
XX
––
–R
ub
us
ida
eus
L.
sub
sp.
ida
eus
––
XX
X–
–
AP
PE
ND
IX.
Co
nti
nu
ed.
2014] Mansfield et al.—Vascular Plants at Callahan Mine 321

Fa
mil
yS
pec
ies
Ca
lla
ha
nM
ine
Ha
bit
ats
PH
SQ
Co
nse
rva
tio
nS
tatu
s(S
tate
)T
PW
RW
ES
HIB
Ru
bu
sid
aeu
sL
.su
bsp
.st
rig
osu
s(M
ich
x.)
Fo
cke
––
X–
XX
X
Sp
ira
eaa
lba
Du
Ro
iv
ar.
lati
foli
a(A
ito
n)
Dip
pel
––
–X
XX
X
RU
BIA
CE
AE
*G
ali
um
mo
llu
go
L.
–X
–X
X–
–R
US
CA
CE
AE
Ma
ian
them
um
can
ad
ense
Des
f.–
––
–X
––
SA
LIC
AC
EA
EP
op
ulu
sb
als
am
ifer
aL
.su
bsp
.b
als
am
ifer
a–
X–
––
––
Po
pu
lus
trem
ulo
ides
Mic
hx
.–
––
XX
XX
Sa
lix
beb
bia
na
Sa
rg.
X–
––
X–
–S
ali
xsp
.–
––
XX
––
SA
PIN
DA
CE
AE
Ace
rru
bru
mL
.–
––
––
XX
SO
LA
NA
CE
AE
*S
ola
nu
md
ulc
am
ara
L.
va
r.vi
llo
siss
imu
mD
esv
.–
–X
XX
X–
I(C
T);
P(C
T)
TY
PH
AC
EA
ET
yp
ha
lati
foli
aL
.–
–X
––
––
AP
PE
ND
IX.
Co
nti
nu
ed.
322 Rhodora [Vol. 116