diversity and habitat selection of papilionidae in a protected
TRANSCRIPT

Diversity and Habitat Selection of Papilionidae in a
Protected Forest Reserve in Assam, Northeast India
Dissertation
zur Erlangung des Doktorgrades
der Mathematisch-Naturwissenschaftlichen Fakultäten
der Georg-August-Universität zu Göttingen
vorgelegt von
Kamini Kusum Barua
aus Assam, Nord-Ost Indien
Göttingen 2007

D7
Referent: Prof. Dr. Michael Mühlenberg
Korreferent: Prof. Dr. Rainer Willmann
Tag der mündlichen Prüfung: 23.01.2008

SUMMARY ZUSAMMENFASSUNG

i
EXTENDED SUMMARY
The Eastern Himalayas covering entire Northeast India is located at the confluence
of the Oriental and Palaearctic realms and exhibits a high level of endemism in the flora and
fauna. The region has a high diversity of butterflies as reported from the first documentation
on the butterfly fauna of this region. However there has hardly been any focus on research
studies for butterflies in this biodiversity rich zone. The butterfly family Papilionidae is
associated with pristine forests and their abundance is directly associated with loss of forest
cover due to logging and human disturbance. A review of the past records of Papilionidae
from this region and comparison with recent checklists have brought into the limelight,
some important questions pertaining to the probable extinction of many species and the need
for further monitoring of some of the still existing species. There are also several Eastern
Himalaya endemic Papilionidae at sub-species level and we need to investigate their status
and distribution at both regional and local levels.
The habitat association by forest type and distribution pattern, seasonal abundance,
correlation between mean abundance and geographic range and the feeding guild and
indicator properties of swallowtail butterflies (Lepidoptera: Papilionidae) were studied in a
disturbed secondary protected forest reserve in Assam, Northeast India. The method of
multivariate analysis by constrained canonical correspondence ordination (Ter Braak, 1986)
was used for examining the effects of some independent, continuous environmental
variables like altitude, rainfall, year, geographical position (latitude and longitude) on the
swallowtail butterfly group and species assemblages during the two-year study period. The
separating effects of season and forest type as categorical variables were examined for
observing their effects on the abundance and distribution of the Papilionidae within the
study area. We used the indicator (IndVal) method of Dufrene & Legendre (1997) to detect
some characteristic indicator taxa within the study area by defining the indicator values of
the group and species assemblages for the transects by forest types and mean seasonal
abundances. The analyses were done separately for the three study sites of Garbhanga range
and two study sites of Rani range based on the pooled abundance data. All the five study
sites were moderately to heavily disturbed as observed from the land-use satellite imageries
and actual field observations. Line transect method (Pollard, 1977, 1984; Thomas, 1983;

ii
Pollard & Yates, 1993) was followed for sampling the butterflies within a 50 ha study area.
Permanent line transects were laid within the study sites on the basis of habitat type -
scattered forest and closed forest, which were selected on the basis of canopy openness and
observed levels of disturbance. A total sample effort of 131 days across the five study sites
during dry and wet seasons of the two-year study period resulted in 18,371 individuals
identified from 28 species of Papilionidae. Our sampling effort was not equal across the
study sites of both the ranges within the Reserve. For the three study sites in Garbhanga
range, we walked 24 kms amounting to two transect counts in nine hours of sampling per
day in the 12 transects. For the two study sites of Rani range we walked 16 kms amounting
to two transect counts in six hours of sampling per day in the eight transects.
As the study area experiences a tropical monsoon type of climate, therefore the
different diversity parameters including species richness, evenness and rarefaction estimates
were examined by forest type and season. As the host-plant specificity of the swallowtail
butterflies is confined to a few tropical plant families, we therefore tried to document the
availability of some of the important larval food-plants of the swallowtail butterflies within
the study area.
We identified 28 species of Papilionidae within the protected reserve during the 2-
year study period. In the study sites of Garbhanga and Rani ranges, 28 and 26 species were
recorded respectively. Vegetation study relating to estimation of the species diversity and
richness conducted in each of the two study sites of Garbhanga and Rani ranges showed a
near similarity in the floral composition and could be considered to represent the overall
vegetation profile of the study area. The total plant family representation in the study area
was 65 which included a total of 197 species out of which 99 species were represented by
trees, 63 species were herbs/shrubs and 35 species were represented by climbers. Seven
plant families represented the larval host-plant resources and 29 plant families represented
the potential adult nectar sources of the swallowtail butterflies. The monophagous feeding
guild recorded the highest number of species (12) and the correlation between the mean
abundance and feeding guild of the Papilionidae was significant, showing a marked increase
in the mean abundance of the Papilionidae from ‘specialist’ to generalist’ feeders and
monophagy to polyphagy.
The correlation between the mean abundance and the pre-defined geographic range
of the species assemblages in the three study sites of Garbhanga range was weak but
significant and positive indicating a marked increase in the mean abundance of the

iii
Papilionidae with the widest geographic range. For the two study sites of Rani range, the
correlation was not significant but still positive. Species with the widest range did not show
a large variation in their mean abundance as observed in the correlation results for the study
sites of Garbhanga range.
Canonical Correspondence Analysis (CCA) showed that the swallowtail butterfly
species assemblage could be divided into two groups with respect to habitat association and
abundance by forest types was highly significant for all the five study sites. In Garbhanga
range, 16 species were closed forest restricted and nine species were open/scattered forest
dependent while another three species could be classified as intermediate as they were
encountered in both gaps and closed forests. In Rani range, only 14 species were found to be
confined to the closed forest while the number of species associated with gaps and the
intermediate species was the same as in Garbhanga range. In Garbhanga range, higher
abundances of butterflies from the genera Graphium (Jays and Bluebottles), Papilio
(Common Mormon and Great Mormon) and Pathysa (Swordtails and Zebras) were
encountered in the open forest transects while the abundances of the butterflies from the
closed forests and particularly from the genera Atrophaneura (Windmills and Batwings),
Troides (Birdwings) and Papilio castor (Common Raven) were lower. Peacocks and Helens
(Papilio sp.) from the closed forests and the gap species like Pachliopta aristolochiae
(Common Rose) and Lamproptera sp. (Dragontails) recorded moderate abundances.
However in Rani range, the abundance trend for the group (genus-wise) assemblages were
found to be different – closed forest confined groups like the Birdwings (Troides sp.),
Peacocks and Helens (Papilio sp.) and open forest dependant groups like the Jays and
Bluebottles (Graphium sp.), Swordtails (Pathysa sp.) as well as the Dragontails
(Lamproptera sp.) were recorded in higher abundances.
The site scores in the ordination plots for both Garbhanga and Rani ranges simply
showed the changing abundances of swallowtail butterflies across the open and closed forest
transects throughout the study period. However they could not be considered as strong
predictors of butterfly seasonality. Therefore in our study we only tried to observe the
changing patterns of species abundances through dry and wet seasons of the study period
between the two forest types.
The effects of independent variables were studied separately for Garbhanga and Rani
ranges and the results of the CCA ordination showed the significant effects of some of these
variables on the species assemblages. The significant effect of the amount of rainfall as an

iv
independent variable on the abundances of different species assemblages within Garbhanga
and Rani ranges clearly indicated the influence of the monsoon climate on plant phenology
and the resultant high wet season abundances. However the effect of rain on butterfly
abundances indicated a larger variation between the dry and wet season abundances in Rani
range and this could be attributed to favourable microclimatic conditions within this range.
In the constrained ordinations for both Rani and Garbhanga ranges, the influence of the
monsoon rain on the seasonality of some species like particularly the Limes (Papilio
demoleus), Jays (Graphium sp.) and Common Rose (Pachliopta aristolochiae) was strongly
predicted. Again some of the closed forest restricted species like the Crimson Rose
(Pachliopta hector) and Common Raven (Papilio castor) were found to be highly seasonal
in their association with the monsoon period.
To examine the continuum of seasonal abundance of the swallowtail butterflies, the
effect of year as an independent variable on the butterfly abundances was tested separately
for Garbhanga and Rani ranges. In Garbhanga range, year as a variable did not show a
significant effect on the butterfly abundances whereas in Rani range, the effect of year was
significant and higher abundances of some of the species assemblages were recorded during
the wet season of the second year of study.
Altitude as an independent variable showed a significant effect on the total variance
of the species assemblages within the study area and species characteristic of closed forest
were recorded in greater abundances at higher elevations and open forest species were
recorded in higher abundances at lower elevations. The effect of altitude on species
abundance and distribution was observed to be more pronounced in Garbhanga than Rani
range. On an overall such findings could be correlated to the sampling design where the
locations of the open forest transects at lower elevations and closed forest transects at higher
elevations were influencing the ordination results.
The ordination results did not show a significant correlation between the
geographical position and species abundances although at least statistically a significant
correlation was seen in the genus (group-wise) and species ordination for Garbhanga range.
One of the limitation being the small size of the sampling area and the close location of the
transects, the results could not be meaningfully interpreted.
The homogenous species assemblage within the protected reserve showed varying
diversity patterns by forest type and season. The diversity parameters were analysed
separately for Garbhanga and Rani ranges. In the study sites of Garbhanga range, there were

v
no differences in species diversity, evenness and rarefaction estimates between dry and wet
seasons throughout the study period but by forest type, the closed forests were more diverse
than the open/scattered forests. A similar trend was also detected for the evenness and
rarefaction estimates of the species assemblages. There were no significant differences in
species richness between forest types and season as probably all the species were
encountered in almost all the transects in varying levels of abundance and secondly could
also be related to the pooled data. In Rani range, the conditions were different where only
Shannon’s diversity (H’) was higher during the wet season of both years but there were no
significant differences by forest type. The scattered/open forests were more diverse than the
closed forests as shown by Simpson’s and Inverse Simpson’s indices but α-diversity was
again higher in the closed forests The evenness and rarefaction estimates were also higher in
the open forest habitats although there were no significant differences between seasons.
Observed differences in the landscape features with higher levels of disturbance in the study
sites of Rani range and probable microclimatic conditions could have influenced the results.
Characteristic indicator taxa defined by their Indicator Values (% IndVal) were
determined separately for the study sites of Garbhanga and Rani ranges by their transect and
seasonal abundances. In the scattered/open forest transects of Garbhanga range
identification of the group assemblages (genus-wise) showed that the Graphium species
(Jays and Bluebottles) scored IndVals >60% (p<0.05) while in the closed forest transects,
none of the group assemblages were statistically significant except Papilio castor castor
(Common Raven) which did not score a high IndVal but was statistically significant at p≤
0.05. Amongst the species assemblages, only two species from the open forests or gaps
scored significantly high IndVals > 60% (p<0.05) and therefore could be selected as
indicators for open or scattered forests within Garbhanga range. In Rani range, when the
group assemblages for the indicator taxa were defined by values of the pooled transects
from the 2 study sites, Pathysa sp. (Zebras), Graphium sarpedon sarpedon (Bluebottles) and
Papilio demoleus (Limes) were identified as the indicator groups for the open/scattered
forests although they did not score high IndVals (p<0.05). When species assemblages were
defined by values of the pooled transects, two gap species were statitistically significant
(p<0.05) although they did not score high IndVals (>45%) in the open forest transects.
However no indicator species could be detected statistically for the closed forest habitats.
When the indicator values of the species assemblages were defined by values of
seasonal abundances within Garbhanga and Rani ranges separately, a total of seven closed

vi
forest-restricted species and one gap species scored statistically significant IndVals (> 70%,
p<0.05) for all the five study sites. In Garbhanga range, four closed forest restricted species
from the red-bodied group- Windmills (Atrophaneura sp., 3) and Birdwings (Troides sp., 1)
scored significantly high IndVals (> 80%, p<0.05) while one black-bodied species (Papilio
helenus (Red Helen) scored an IndVal < 65% but was significant at p<0.05. In Rani range,
four species from the closed forest and one gap species scored high IndVals (>65%,
p<0.05). The result of the identification of indicator species by both transect and seasonal
abundances was that seven species were finally selected as indicators for the two forest
types and the findings would be helpful for the proposed butterfly monitoring program in
this protected forest reserve. The five indicator species for the open forests were mostly
opportunistic species with wide geographic distribution and also known to be good colonists
of extreme early succesional habitats (Leps & Spitzer, 1990) while the two indicator species
for the closed forests had restricted distribution and such endemics with high conservation
priority can play a crucial role in determining the habitat quality and control of disturbances.
This present study has reflected the changing patterns of Papilionidae diversity,
abundance and distribution in a protected tropical landscape which is disturbed but effective
forest management practices are being taken up to protect the remaining fragmented habitat
of the elephants and the Hoolock gibbons. The identification of the swallowtail butterflies
along with some of their important larval food-plants and potential nectar resources has
been an important part of the study. Further research into their ecology by examining the
effects of some independent environmental variables on their abundances and habitat
association with respect to preference of forest types thereby determining their distribution
pattern within the forest reserve has helped in the identification of some of the threats facing
their survival. An analysis of the diversity and species richness patterns of the species
assemblages by season and forest type has helped in evaluating their status within the
landscape and determining the indicator values of both group and species assemblages by
their transect and seasonal abundances will be a useful tool for monitoring or evaluating
their role in forest management.

vii
Ausführliche Zusammenfassung Im östlichen Himalaya, der sich über das gesamte Gebiet Nordost-Indiens erstreckt, treffen
die biogeographischen Regionen der Paläarktik und des Orients zusammen und zeigen dabei
eine beträchtliche Flora und Fauna Biodiversität mit einem außergewöhnlich hohen Anteil
an Endemiten. Die Region verfügt auch über eine hohe Diversität an Schmetterlingsarten,
die bereits in dem ersten Bericht über die Schmetterlingsfauna dieses Gebietes dokumentiert
wurde. Dennoch gibt es für diese biodiversitätsreiche Zone praktisch keine weiteren
Untersuchungen, die sich mit Schmetterlingen befassen. Die Familie der Papilionidae wird
assoziiert mit dem Waldökosystem und ihre Abundanz steht in direktem Zusammenhang
mit dem Verlust an Waldfläche durch Abholzung und anthropogene Störungen. Ein
Vergleich von Bestandsaufnahmen der Papilionidae der Vergangenheit mit aktuellen
Artenlisten der Region, verdeutlichen die Problematik des lokalen Aussterbens vieler Arten
und die Notwendigkeit für ein Monitoring der noch verbliebenen Arten. Weiterhin gibt es
mehrere im Ost-Himalaya endemische Papilionidae-Unterarten, die, sowohl auf regionaler
wie auf lokaler Ebene, weiterer Untersuchungen zu aktuellem Bestand und Verbreitung
bedürfen. Die Schwalbenschwanzgesellschaften (Lepidoptera:Papilionidae)
wurden nach Waldtyp, Verteilungsmuster, saisonaler Abundanz, Indikatoreigenschaften,
Korrelation zwischen der geographischen Verbreitung und der mittleren Abundanz und der
Nahrungsgilde in einem gestörtem Sekundärwaldreservat in Assam (Nordost-Indien)
untersucht. Die Methode der multivariaten Analyse mit kanonischer
Korrespondenzordination (Ter Braak, 1986) wurde benutzt um die Einflüsse einiger
unabhängiger, kontinuierlicher Umweltvariablen wie Höhe üNN, Niederschlag, Jahr,
geographische Lage (geografische Breite und Höhe) auf die
Schwalbenschwanzgesellschaften während eines zweijährigen Zeitraums zu untersuchen.
Die trennenden Effekte von Jahreszeit und Waldtyp als kategorischen Variablen wurden
hinsichtlich eines Einflusses auf Abundanz und Verbreitung der Papilionidae des
Untersuchungsgebiets analysiert. Wir benutzten die Indikatiormethode (IndVal) von
Dufrene & Legendre (1997) um charakteristische Indikatortaxa im Untersuchungsgebiet zu
ermitteln, indem die Indikatorwerte für Gruppen und Gesellschaften in den Transekten nach
Waldtyp und mittlerer saisonaler Abundanz definiert wurden. Die Untersuchungen wurden,
basierend auf gepoolte Abundanzdaten, getrennt für die drei Gebiete des Garbhanga-
Gebirges und die zwei Gebiete des Rani-Gebirges durchgeführt. Alle fünf

viii
Untersuchungsgebiete waren gemäß Landnutzungs-Satellitenbildern und eigenen
Feldbeobachtungen, mäßig bis stark gestört. Die Linentransektmethode (Pollard, 1977,
1984; Thomas, 1983; Pollard & Yates, 1993) wurde angewandt, um Stichproben in einem
50 ha Gebiet zu sammeln. Permanente Linientransekte wurden innerhalb der
Untersuchungsflächen gemäß den Waldtypen (offener bis geschlossener Wald) eingerichtet.
Die Waldtypen wurden nach Lichtdurchlässigkeit der Baumkrone und Störungsgrad
eingeteilt. Der gesamte Untersuchungsaufwand von 131 Tagen für alle fünf
Untersuchungsgebiete in Trocken- wie in Regenzeiten, ergab über den
Untersuchungszeitraum von zwei Jahren, eine Anzahl von 18.371 Individuen von 28 Arten.
Der Untersuchungsaufwand war unterschiedlich in den Untersuchungsflächen der beiden
Gebirgszüge des Reservats: In den drei Flächen des Garbhanga-Gebirges wurden insgesamt
24 km begangen, zusammengesetzt aus 12 Transekten von je 1 km Länge, die je zwei Mal
in ca. Neun Stunden untersucht wurden. In den zwei Untersuchungsgebieten des Rani-
Gebirges wurden 16 km begangen, resultierend aus acht Transekten mit je zwei mal sechs
Stunden Untersuchungsaufwand.
Da die Untersuchungsgebiete einem tropischen Monsunklima ausgesetzt sind, wurden die
Diversitätsparameter einschließlich Artenreichtum, Äquitabilität und rarefaction, nach
Waldtyp und Saison analysiert. Da die Wirtspflanzenspezifität von Schwalbenschwanz-
Schmetterlingen auf einige wenige tropische Pflanzenfamilien beschränkt ist, haben wir
versucht die Verfügbarkeit einiger wichtiger Larven-Futterpflanzen im Untersuchungsgebiet
zu dokumentieren.
Während der zwei-jähringen Untersuchungszeit fanden wir 28 Papilionidae-Arten.
Im Garbhanga- und im Rani-Gebirge wurden 28 beziehungsweise 26 Arten gefunden.
Vegetationskundliche Untersuchungen zur Abschätzung der Artenvielfalt, die in beiden
Gebirgen durchgeführt wurden, ergaben eine große Ähnlichkeit in der floristischen
Zusammensetzung und können als repräsentativ für die Vegetation der gesamten
Untersuchungsfläche angesehen werden. Insgesamt 65 Pflanzenfamilien waren repräsentiert
durch 197 Arten, von denen 99 Bäume, 63 Krautpflanzen und Sträucher und 35 Arten
Kletterpflanzen waren. Sieben Pflanzenfamilien stellten Larven-Wirtspflanzen dar, und 29
Familien sind potentielle Nektarressourcen für adulte Schwalbenschwanz-Schmetterlinge.
Für die Nahrungsgilde der Monophagen wurden die meisten Arten (12) beobachtet und es
konnte eine Korrelation zwischen der mittleren Abundanz und der Nahrungsgilde der
Papilionindae aufgezeigt werden, die sich in einem deutlichen Anstieg der mittleren

ix
Abundanz von den Spezialisten zu den Generallisten und von monophagem zu polyphagem
Nahrungsverhalten ausdrückt.
Die Korrelation zwischen der mittleren Abundanz und der vordefinierten geographischen
Ausbreitung von Artengemeinschaften in den drei Untersuchungsgebieten des Garbhanga-
Gebirges war schwach, aber signifikant und positiv, und zeigte sich in einem Anstieg in der
mittleren Abundanz der Papilionidae mit der größten geographischen Ausbreitung. Für die
zwei Untersuchungsgebiete im Rani-Gebirge gab es keine signifikante Korrelation.
Diejenigen Arten mit den größten Ausbreitungen zeigten keine großen Veränderungen in
ihrer mittleren Abundanz, wie sie im Garbhanga-Gebirge beobachtet wurde.
Eine kanonische Korrespondenzanalyse zeigte, dass sich die Zusammensetzung von
Schwalbenschwanz-Schmetterlingsarten in zwei Gruppen einteilen lässt: in der einen
korrelierte die Habitatvergesellschaftung und in der anderen die Abundanz mit dem
Waldtyp in allen fünf Versuchsflächen in signifikanter Weise. Im Garbhanga-Gebirge waren
16 Arten an geschlossenen Wald und 9 Arten an offenen/lichten Wald gebunden, während
drei Arten als intermediär klassifiziert wurden, da sie sowohl im geschlossenen Wald, als
auch in Waldlücken angetroffen wurden. Im Rani-Gebirge wurden nur 14 Arten gefunden,
die mit geschlossenem Wald assoziiert sind, während die Zahl der Schmetterlingsarten, die
auf Waldlücken beschränkt sind und die Zahle der intermediären Arten genauso hoch wie
im Garbhanga-Gebirge war. Im geschlossenen Wald des Garbhanga-Gebirges gab es hohe
Abundanzen der Gattungen Graphium, Papilio und Pathysa, während die Individuenzahlen
im geschlossenen Waldtyp vor allem für Atrophaneura, Troides und Papilio castor geringer
waren. Andere Papilio-Arten („Peacocks” und „Helens”) im geschlossenen Wald und Arten
der Waldlücken, wie Pachliopta aristolochiae und Lamproptera sp. kamen in mittleren
Abundanzen vor. Im Rani-Gebirge dagegen verhielten sich die Abundanz-Trends der
verschiedenen Gattungen anders: an geschlossenen Wald gebunden Arten wie „Birdwings”
(Troides sp.), „Peacocks” und „Helens” (Papilio sp.) und Arten der offenen Waldtypen wie
„Jays” und „Bluebottles” (Graphium sp.), „Swordtails” (Pathysa sp.) und „Dragontails”
(Lamproptera sp.), kamen in höheren Abundanzen vor.
Die Ordinationswerte für die einzelnen Transekte zeigten für den gesamten
Versuchszeitraum sich mit dem Waldtyp verändernden Abundanzen der Schmetterlinge.
Dennoch können sie nicht als Beleg für starke jahreszeitenbedingte Schwankungen
herangezogen werden. In dieser Studie werden daher nur die sich mit Trocken- und
Regenzeit verändernden Abundanzmuster für die zwei Waldtypen beschrieben.

x
Die Effekte der unabhängigen Variablen wurden separate für die beiden Gebirge untersucht.
Die Ergebnisse der Ordination zeigen signifikante Effekte einiger dieser Variablen zur
Artenzusammensetzung. Der signifikante Einfluss der Niederschlagsmenge als unabhängige
Variable auf die Abundanz verschiedener Artzusammensetzungen innerhalb des Garbhanga-
bzw. des Rani-Gebirges, zeigte deutlich die Wirkung des Monsunklimas auf die Phänologie
der Flora und die daraus resultierende hohe Abundanz während der Hoch-Regenzeit. Dieser
Effekt des Niederschlags auf die Schmetterlingsabundanz, weist auf einen deutlichen
Abundanzunterschied zwischen der Regen- und der Trockenzeit im Rani-Gebirge hin, der
wiederum mit den mikroklimatisch günstigeren Bedingungen in diesem Gebirge
zusammenhängen könnte. In der Ordination wurde für beide Gebirge ein Einfluss des
Monsun-Regens auf die Saisonalität einiger Arten, insbesondere für Papilio demoleus,
“Jays” (Graphium sp.) und Pachliopta aristolochiae festgestellt. Weiterhin zeigten sich
einige Arten des geschlossenen Waldtyps, wie Pachliopta hector und Papilio castor durch
die Monsunzeit bedingt, als stark saisonal.
Um die Kontinuität der jahreszeitlichen Abundanz der Schwalbenschwanz-Schmetterlinge
zu untersuchen, wurde der Effekt des Jahres als unabhängige Variable auf die
Individuenzahl für das Garbhanga- und das Rani-Gebirge einzeln analysiert. Im Garbhanga-
Gebirge zeigt das Jahr als Variable keinen Einfluss auf die Schmetterlingsabundanz,
während im Rani-Gebirge der Effekt des Jahres signifikant war und dort deutlich höhere
Abundanzen einiger Artengemeinschaften in den Regenzeiten des zweijährigen
Untersuchungszeitraums beobachtet wurden.
Die Höhe als unabhängige Variable, zeigte einen signifikanten Einfluss auf die totale
Varianz der Artengemeinschaften des Untersuchungsgebietes: Charakteristische Arten des
geschlossenen Waldtyps wurden in größeren Höhen deutlich häufiger beobachtet, während
Arten der offenen Waldtypen in geringeren Höhen häufiger waren. Der Effekt der Höhe auf
Abundanz und Verbreitung der Arten war im Rani-Gebirge stärker ausgeprägt. Theoretisch
könnten diese Ergebnisse auf den Versuchsaufbau zurückzuführen sein, indem die Lage der
Offenwald-Transekte in geringeren Höhen und der Transekte im geschlossenen Wald in
größeren Höhen die Ergebnisse der Ordination beeinflussten.
Die Ergebnisse der Ordination zeigten keine signifikante Korrelation zwischen der
geographischen Lage und der Artzahl, obwohl, zumindest statistisch, für das Garbhanga-
Gebirge eine signifikante Korrelation für Gattungen (gruppenweise) und Arten beobachtet
wurde. Eine der Beschränkungen, die die relativ kleine Untersuchungsfläche und die Nähe

xi
der Transekte zueinander mit sich bringt, ist, dass dieser Teil der Ergebnisse nicht
ökologisch sinnvoll interpretiert werden kann.
Die homogene Artzusammensetzung innerhalb des geschützten Gebietes, zeigte eine mit
dem Waldtyp und der Jahreszeit variierende Diversität. Die Diversitätsparameter wurden für
das Garbhanga- und das Rani-Gebirge einzeln analysiert. In den Untersuchungsgebieten des
Garbhanga-Gebirges gab es keine Unterschiede hinsichtlich der Artenvielfalt, Äquitabilität
und der rarefaction Schätzungen zwischen der Regen- und der Trockenzeit, aber der
geschlossene Waldtyp zeigte eine höhere Diversität als der offene. Eine vergleichbare
Tendenz wurde auch für die Äquitabilität und die rarefaction Schätzungen der
Artengemeinschaften beobachtet. Es gab keinen signifikanten Unterschied der Artenvielfalt
zwischen den Waldtypen und den Jahreszeiten, da wahrscheinlich alle Arten in verschieden
hohen Abundanzen in fast allen Transekten angetroffen wurden. Andererseits könnte auch
das Poolen der Daten einen Einfluss gehabt haben. Im Rani-Gebirge waren die Verhältnisse
anders: Dort war der Shannon-Diversitätsindex (H’) in den Regenzeiten beider Jahre höher,
aber es gab keinen signifikanten Unterschied zwischen den Waldtypen. Die lichten/offenen
Waldtypen waren diverser, wie am Simpson- und Inversen Simpson-Index abzulesen ist,
aber die α-Diversität war wiederum höher im geschlossenen Wald. Die Äquitabilität und die
rarefaction Schätzungen waren wiederum höher in den offenen Waldhabitaten, aber es gab
keinen signifikanten Unterschied zwischen den Jahreszeiten. Die beobachteten Unterschiede
in den Merkmalen der Landschaft, wie der höhere Grad der Störung im Rani-Gebirge, sowie
die wahrscheinlichen mikroklimatischen Bedingungen könnten die Ergebnisse ebenfalls
beeinflusst haben.
Charakteristische Indikatorarten, definiert durch ihren Indikatorwert (% IndVal) wurden
einzeln für die Untersuchungsgebiete in den beiden Gebirgen anhand ihres Vorkommens
pro Transekt und pro Jahreszeit ausgewählt. In den Transekten des offenen/lichten
Waldtypes im Garbhanga-Gebirge zeigte eine Untersuchung der gattungsmäßigen
Zusammensetzung, dass Graphium-Arten einen Indikatorwert von mehr als 60 % (p<0,05)
erreichten, während im geschlossenen Wald keiner der Taxa statistisch relevant war, außer
der Unterart Papilio castor, welche zwar keinen hohen Indikatorwert erzielte, aber dennoch
signifikant war (p≤ 0,05). Von den Artgemeinschaften erreichten nur zwei Arten der
Waldlücken einen signifikant hohen Indikatorwert von über 60 % (p≤ 0,05) und konnten
daher als Indikator für offenen/lichten Wald innerhalb des Garbhanga-Gebirges ausgewählt
werden. Im Rani-Gebirge wurden die Indikatortaxa der Artengemeinschaften definiert durch
Werte von gepoolten Transekten der zwei Untersuchungsgebiete. Pathysa sp. (Zebras),

xii
Graphium sarpedon und Papilio demoleus wurden als Indikatorgruppen für offene
Waldhabitate ausgewählt, obwohl sie keinen hohen Indikatorwert erzielten (p≤ 0,05). Als
Artenzusammensetzungen durch Werte aus gepoolten Transekten definiert wurden, gab es
zwei statistisch signifikante (p≤ 0,05) Arten der Waldlücken, obwohl sie keinen hohen
Indikatorwert in den Transekten des offenen Waldtypes erreichten. Außerdem konnte keine
statistisch signifikante Indikatorart für die geschlossenen Waldtypen gefunden werden.
Als die Indikatorwerte durch Werte der jahreszeitlichen Abundanz für das Garbhanga- und
das Rani-Gebirge einzeln definiert wurden, erreichten sieben Arten des geschlossenen
Waldtypes und eine Waldlücken-Art statistisch signifikante Indikatorwerte (>70 %; p≤
0,05) in allen fünf Untersuchungsgebieten. Im Garbhanga-Gebirge erzielten drei rotleibige
„Windmill”-Arten (Atrophaneura sp.) eine „Birdwing”-Art (Troides sp.) des geschlossenen
Waldtypes, signifikante Indikatorwerte (>80 %; p≤ 0,05), während die Unterart Papilio
helenus einen Wert von IndVal <65% erreichte, aber signifikant war (p≤ 0,05). Im Rani-
Gebirge erreichten vier Arten des geschlossenen Waldtypes und eine Waldlücken-Art hohe
Indikatorwerte (>65 %; p≤ 0,05). Als Ergebnis der Identifikation von Indikatorarten durch
Transekt- und jahreszeitliche Abundanz, wurden sieben Arten als Indikatorarten für die
beiden Waldtypen ausgewählt, welche ebenfalls als hilfreich für das geplante Monitoring
des Schutzgebietes angesehen werden. Die fünf Indikatorarten des offenen Waldtypes waren
hauptsächlich opportunistische Arten mit großer geographischer Verbreitung und sind
ebenfalls bekannt als gute Erstbesiedler von sehr frühen Sukzessionsstadien (Leps &
Spitzer, 1990), während die beiden Indikatorarten des geschlossenen Waldtypes eine nur
geringe Verbreitung aufwiesen und daher als Endemiten mit hoher Schutzpriorität eine
entscheidende Rolle bei der Beurteilung der Habitatqualität und der Kontrolle von
Störungen spielen können.
Die vorliegende Studie gibt die Veränderungsmuster der Diversität, Abundanz und
Verbreitung von Papilioniden in einem geschützten tropischen Lebensraum wieder, der
Störungen aufweist, indem man aber beispielsweise auch bemüht ist, die verbliebenen
Habitatfragmente des asiatischen Elefanten und einer einheimischen Gibbon-Art durch
geeignete Schutz- und Entwicklungsmaßnahmen zu erhalten. Die Aufnahme der
Schwalbenschwanz-Schmetterlingsarten einschließlich ihrer Larven-Futterpflanzen und
potentieller Nektarpflanzen, kann als wichtiger Erkenntnissprung angesehen werden. Die
Untersuchung der Effekte einiger unabhängiger Umweltfaktoren auf ihre Abundanz und
Habitatvergesellschaftung unter Berücksichtigung der bevorzugten Habitattypen, und die
Bestimmung der Verbreitungsmuster innerhalb des Waldschutzgebietes, hat dazu

xiii
beigetragen einige wichtige Bedrohungsursachen zu identifizieren. Eine Analyse der
Diversitätsmuster der Artengemeinschaften nach Jahreszeit und Waldtyp, trug dazu bei
ihren Zustand innerhalb der Landschaft zu evaluieren und die Bestimmung von
Indikatorwerten für Gruppen und Artgemeinschaften durch ihre Abundanz pro Jahreszeit
und Transekt kann ein gebräuchliches Werkzeug für Monitoring oder Evaluierung im
Forstmanagement darstellen.

xiv
ACKNOWLEDGEMENTS I owe my vision and accomplishment of my research studies in Germany to my
‘Doktorvater’ Prof. Dr. Michael Mühlenberg, whose supervision, encouragement and
support throughout my study period and stay in Germany has made this thesis become a
fruitful reality. His excellent academic guidance and helpful advice at every stage of my
research work has helped me to develop my performance skills in the field of Conservation
Biology and this will go a long way in my professional life. My exposure to an international
environment and excellent infrastructure has been possible due to Prof. Mühlenberg’s
continued support.
I would like to express my words of gratitude to my Co-Referrent Prof. Dr Rainer
Willman and Dr. Michael Kessler for kindly consenting to examine my thesis and contribute
their valuable advice and inputs for my research work.
I would have the pleasure to express my heartfelt gratitude to my guide and
mentor, Dr. Jolanta Slowik, who discovered me in the remote corner of India. It was her
continued invaluable support and advice which has given a new dynamic frame to my
professional career.
I would like to express my sincere words of appreciation for Dr Matthias Waltert,
who during the final phase of my thesis writing gave valuable inputs and advice which has
helped me in giving the final frame to my thesis.
I would also like to thank Dr. Eckhard Gottschalk and Dr. Hermann Hondong,
scientific staff at the Centre for Nature Conservation for their helpful support during my
stay here at the Centre.
I have the pleasure to express my sincere words of thanks to my colleagues Dr.
Bobo Kadiri Serge who took up the painstaking task of meticulously reading and editing my
thesis and Mark Hallfeldt who did a fantastic job with the translation of the summary of my
thesis into the ‘Deutsche’ version.
My sincere words of thanks are expressed for Elisabeth Opielka who handled the
informatics section and kept me updated on the computer applications and programs.
I would also like to express my words of gratitude to Monika Deseniß and
Andrea Lambertz who have been so helpful in assisting me with all the official and
administration related works and giving me good guidance.
I express my sincere thanks to Dr. Carsten Schröder, who gave me the opportunity
to participate in the ‘Summer School’ program on ‘Close to Nature Forestry’ in 2007 which

xv
gave me an enlightening insight into the long and impressive history of forest development
in Germany.
My words of appreciation for my colleagues Dr. Margaretha Pangau, R.
Sunjidmaa, Dr. Martina Meeske, Dr. Innocent Tschigio, Lien, Christos Astaras, Anna
Kemmling, Dr. Mei Ling Bai and Oyunsanaa who have cooperated with me and helped me
during my tenure here at the Centre for Nature Conservation.
I would also like to express my words of appreciation for Dr. C. Dulamsuren and
Dr. Markus Hauck whose invaluable advice and guidance has made my stay in Göttingen
wonderful.
I would like to thank my team in Assam, India- Prof. Dr. J. Kalita from the
Department of Entomology and Environmental Biology, Gauhati University and the
Principal Investigator of the Ministry of Environment and Forests funded Research Projects
in Dibru-Saikhowa Biosphere Reserve and Manas Biosphere Reserve and the University
Grants Commission funded Research Project on assessing the Swallowtail butterfly
(Papilionidae) diversity in the protected areas of the Assam Himalayas. It was under these
projects that as a Junior Research Fellow, I had the opportunity to conduct my field-based
research work in some of the protected areas of Assam, including my present research study
area.
My sincere gratitude goes to N. K. Bhagobaty, Senior Instructor, Institute of
Advanced Study in Science & Technology, Guwahati, who has contributed to the new ideas
on the statistical framework of my research work.
My words of thanks are also expressed for S.Hazarika, Director of Forest
Communication, State Forest Department, Government of Assam who provided the
sceitnific information on the study area, and the scientific team from ‘Assam Remote
Sensing Application Centre’ Guwahati, and the ‘Regional Meteorological Research Station’
Guwahati for assisting me in the preparation of the GIS images of the study area with
analysis of the land-use patterns and the meteorological data for my research work.
I finally dedicate this work to my parents who always guided me and showed
me the way towards academic excellence and the good wishes of all my near and dear ones
in India and Hongkong who have given me the mental strength to achieve my dream.
I finally end my words of gratitude for all with the renowned phrase from Robert Frost :
‘ When the woods are lovely, dark and deep,
I have promises to keep and miles to go before I sleep ‘.

ACKNOWLEDGEMENTS

xvi
TABLE OF CONTENTS
SUMMARY………………………………………………………………………………….i
ZUSAMMENFASSUNG………………………………………………………………….vii
ACKNOWLEDGEMENTS……………………………………………………………...xiv
TABLE OF CONTENTS………………………………………………………………...xvi
LIST OF TABLES………………………………………………………………………xxiii LIST OF FIGURES……………………………………………………………………...xxv LISTOF PHOTO PLATES …………………………………………………………..…………..xxix LISTOF ABBREVIATIONS……………………………………………………………………...xxx LIST OF CITATIONS ON REPORTS AND POLICIES……………………………xxxi PART I : GENERAL INTRODUCTION CHAPTER 1 :INTRODUCTION………………………………………………………1
1.1. An Overview of the Tropical forests…………………………………...1
1.2. The Eastern Himalayas…………………………………………………2
1.3. Study on tropical butterfly communities……………………………….4
1.4. The Protected Forest Management Scenario in Assam………………...7
CHAPTER 2: BACKGROUND, OBJECTIVES AND HYPOTHESES……………..9
2.1. Background……………………………………………………………..9
2.2.Objectives……………………………………………………………...13
2.3. Research questions……………………………………………………14
2.4 Hypotheses…………………………………………………………….17

xvii
CHAPTER 3 : STUDY AREA……………………………………………………………….20
3.1. Review of Rani-Garbhanga Reserve Forest…………………………………20
3.2. Butterfly-Plant interaction…………………………………………………...30
3.3. Climate, Vegetation and Soil………………………………………………...31
3.3:1. Climate conditions in the study area………………………………….31
3.3.2. Vegetation and Soil…………………………………………………...33
3.4. Forest Management and Biomonitoring……………………………………...37
3.4.1. Sal Regeneration………………………………………………………37
3.4.2. Miscellaneous Plantation……………………………………………...38
3.4.3. Bamboo Overlapping………………………………………………….38
3.4.4. Biodiversity Conservation…………………………………………….39
3.4.5. Watershed management and Soil Conservation………………………39
3.4.6. Joint Forest Management (JFM)/ Peoples’ Participatory Plantation
program ……………………………………………………………….40
PART II : METHODS AND RESULTS
CHAPTER 4 : METHODS…………………………………………………………………..43
4.1. Study Sites…………………………………………………………………..43
4.2. Satellite Image Preparation, Interpretation and Area Estimation…………...44
4.3. Sampling…………………………………………………………………….49
4.3.1. Sampling period………………………………………………………49
4.3.2. Sampling design………………………………………………………49
4.3.2.1. Permanent Line Transects………………………………………...51
4.4. Butterfly collection, identification and geographic range classification…….55
4.5. Diet breadth classification…………………………………………………...56
4.6. Vegetation survey……………………………………………………………57

xviii
4.7. Food-plants……………………………………………………………….....57
4.8. Investigations on the climate conditions during the study period…………..59
4.9. Data analysis………………………………………………………………..60
4.9.1. Swallowtail butterflies- habitat relationships…………………….....62
4.9.2. Measures of Diversity Index………………………………………..63
4.9.3. Indicator Taxa………………………………………………………66
4.9.4. Vegetation analysis…………………………………………………67
4.9.5. Basic statistical tests………………………………………………...67
CHAPTER 5 : RESULTS………………………………………………………………......68
5.1. Plant Community (Trees, Herbs, Shrubs and Climbers)……………......68
5.1.1. Flora Overview………………………………………………......69
5.1.1.1. Study site S1 (Garbhanga range)…………………………...69
5.1.1.2. Study site S4 (Rani range)………………………………….70
5.1.1.3. Comparison of plant diversity parameters between S1
and S4…………………………………………………......71
5.2. Plant community representation in the study area…………………......73
5.2.1 Plant families, genera and species…………………………......73
5.2.2. Larval host-plants and adult nectaring plant families and
species…………………………………………………………74
5.3. Papilionidae diversity in Rani-Garbhanga Reserve Forest…………......77
5.3.1. Genera, Species and Abundance………………………………….77
5.3.2. Differences in total and mean abundances between seasons
and years……………………………………………………........79
5.3.2.1. Differences in total abundance between seasons and
years…………………………………………………….........79
5.3.2.2. Differences in mean abundance between seasons and

xix
years………………………………………………………….80
5.3.3. Differences in abundance between genera…………………........83
5.3.4. Abundance and Geographic range…………………………........85
5.3.4.1. Correlation between the mean abundance and
geographic range of the swallowtail butterfly
species assemblages in Garbhanga range………………85
5.3.4.2. Correlation between the mean abundance and
geographic range of the swallowtail butterfly
species assemblages in Rani range…………………….87
5.3.5. Abundance and Feeding guild………………………………......88
5.3.5.1. Papilionidae species and their feeding guild…………...88
5.3.5.2. Correlation between mean abundance of Papilionidae
and their feeding guild………………………………….89
5.4. Ordination of the swallowtail butterfly assemblages in relation to their
abundance and distribution or habitat specificity……………………………91
5.4.1. Ordination of the swallowtail butterfly assemblages in relation to
their abundance and distribution in Garbhanga range…………........91
5.4.1.1. Ordination of the group assemblages (Genus-wise)………..91
5.4.1.2. Ordination of the species assemblages……………………..94
5.4.1.3. Effect of independent variables on species assemblages
within Garbhanga range…………………………………....96
5.4.2. Ordination of the swallowtail butterfly assemblages in relation
to their abundance and distribution in Rani range………………......99
5.4.2.1. Ordination of the group assemblages (Genus-wise)….........99
5.4.2.2. Ordination of the species assemblages…………………...100
5.4.2.3. Effect of independent variables on species
assemblages within Rani range…………………….........103

xx
5.4.3. Partial conclusion of CCA on swallowtail butterfly
assemblages within the study area……………………………………106
5.5. Impact of season and forest type on species diversity…………………......108
5.5.1. Study sites of Garbhanga range ……………………………………108
5.5.2. Study sites of Rani range…………………………………………...109
5.6. Indicator values and characteristic species………………………….............111
5.6.1. Indicator values and characteristic species in the study sites
of Garbhanga range…………………………………………………111
5.6.2. Indicator values and characteristic species in the study sites
of Rani range………………………………………………..............115
PART III : DISCUSSION AND RECOMMENDATIONS FOR
CONSERVATION………………………………………………………......119
CHAPTER 6 : DISCUSSION
6.1. Climate, Vegetation and butterfly abundance………………..............119
6.1.1. Climate and butterfly abundance……………………..............119
6.1.2. Vegetation and butterfly abundance…………………………..120
6.2. Geographic Range and butterfly abundance…………………………123
6.3. Feeding guild and abundance………………………………...............124
6.4. Effects of environmental variables on swallowtail butterfly
abundance and distribution pattern by using the method
of multivariate analysis……………………………………................127
6.4.1. Swallowtail butterfly species composition and habitat
association by forest type……………………………………..127
6.4.2. Seasonality of the Papilionidae………………………….........131

xxi
6.4.3. Effect of rainfall as an independent variable on the
swallowtail butterfly species assemblages…………………..133
6.4.4. Effect of altitude as an independent variable on the
abundance and distribution pattern of the swallowtail
butterfly species assemblage…………………….................134
6.4.5. Effect of geographical position (latitude and longitude)
on the abundance and distribution pattern of the
swallowtail butterfly species assemblage………………….135
6.5. Effect of season and forest/habitat type on species diversity,
richness, evenness and rarefaction estimates…………………............136
6.5.1. Species diversity in the study sites by forest type and
season………............................................................................136
6.5.2. Species richness, evenness and rarefaction in the study
sites by forest type and season………………………………...140
6.6. Butterfly assemblages and indicator taxa……………………..............142
6.6.1. Indicator species defined by transect abundance of
butterflies in open and closed forest…………………...............142
6.6.2. Indicator species defined by values of mean seasonal
abundance of butterflies………………………………………...145
CHAPTER 7 : RECOMMENDATIONS FOR CONSERVATION………………….148
7.1. Study overview………………………………………………………148
7.2. Implications for Conservation of Butterflies………………………...153
7.2.1. Threats to butterfly habitats……………………………….......154
7.2.1.1. Habitat exploitation and fragmentation………………154
7.2.1.2. Illegal trade in butterflies…………………..................155
7.2.2. The role of butterflies in conservation………………………….155
7.2.3. Recommendations for conservation of butterflies in

xxii
Rani-Garbhanga Landscape……………………….................157
7.2.3.1. In-situ conservation………………………………..157
7.2.3.2. Ex-situ conservation…………………….................157
PART IV : REFERENCES, APPENDICES, PHOTO SECTION
REFERENCES………………………………………………………………………..160
APPENDICES………………………………………………………………………...179
PHOTO SECTION……………………………………………………….…………..216
CURRICULUM VITAE……………………………………………………………...227

xxiii
LIST OF TABLES Table 4.1: Study sites in Rani-Garbhanga Reserve forest…………………………………43
Table 4.2: Land-use analysis of the study area in hectares (1998 and 2002)………...........46
Table 4.3: Sampling activities in the 50 ha study site of Rani-Garbhanga
Reserve forest…………………………………………………………………..51
Table 5.1: Diversity parameters for tree species sampled as number of individuals
in the study sites S1 (Partially disturbed) and S4 (Heavily disturbed) within
the forest reserve using PC-ORD, 4.01………………………………………...72
Table 5.2: Diversity parameters for herbs/shrubs sampled as number of individuals
in the study sites S1 (Partially disturbed) and S4 (Heavily disturbed) within
the forest reserve using PC-ORD, 4.01………………………………………...72
Table 5.3: Diversity parameters for climbers sampled as number of individuals in the
study sites S1 (Partially disturbed) and S4 (Disturbed) within the forest
reserve using PC-ORD 4.01……………………………………………………72
Table 5.4: Total and Mean abundances of Papilionidae genera sampled during dry and
wet seasons of 2003-2004 in the 20 fixed transects of the study area………..84
Table 5.5: Diversity indices of swallowtail butterfly species assemblages in the open
and closed forest habitats of Garbhanga range during dry and wet seasons
of 2003-2004………………………………………………………………...108
Table 5.6: Species-wise diversity indices of swallowtail butterflies in the open and
closed forest habitats of Rani range during dry and wet seasons
of 2003-2004………………………………………………………………..109

xxiv
Table 5.7: Indicator values (%IndVals) of swallowtail butterflies (Genus-wise) in
the 12 sampling transects of the three study sites (S1, S2 and S3) in
Garbhanga range……………………………………………………………111
Table 5.8: Indicator values (%IndVals) of swallowtail butterflies (Species-wise) in
the 12 sampling transects of the 3 study sites (S1, S2, S3) under
Garbhanga range…………………………………………………………….112
Table 5.9: Indicator values for 28 species of swallowtail butterflies sampled season
-wise in the study sites of Garbhanga range during 2003-2004…………....114
Table 5.10: Indicator values (%IndVals) of swallowtail butterfly group assemblages
(Genus-wise) in the 8 fixed transects of the two study sites (S4 & S5)
in Rani range ……………………………………………………………....115
Table 5.11: Indicator values (%IndVals) of swallowtail butterflies (Species-wise) in
the fixed transects of the two study sites (S4 & S5) in Rani range………..116
Table 5.12: Indicator values for 26 species of swallowtail butterflies sampled
season-wise in the 8 transects of study sites S4 and S5 within Rani
range during 2003 -2004…………………………………………………..117

xxv
LIST OF FIGURES Figure 3.1: Map showing the Eastern Himalayas Region comprising Northeast India,
Bhutan and Southern, eastern and central Nepal…………………………………23
Figure 3.2:Location of Rani-Garbhanga Reserve Forest/ Landscape in Assam,
Northeast India…………………………………………………………………...24
Figure 3.3: Map of the proposed ‘Deepor Beel Wildlife Sanctuary’………………………..25
Figure 3.4: GIS image of Rani-Garbhanga Landscape showing the different
types of forest mosaic…………………………………………………………….26
Figure 3.5: Map of Rani-Garbhanga Landscape showing the drainage pattern
and butterfly collection points within the study area…………………………….29
Figure 3.6: Ombrothermic diagram (P=2T) for the study area during January
to December (mean of years 1996-2000) ……………………………………….32
Figure 3.7 : Ombrothermic diagram (P=2T) for the study area during January
to December (mean of years 2001-2005) ………………………………………32
Figure 4.1: GIS image showing the land-use pattern in Rani-Garbhanga Reserve
forest in 1998……………………………………………………………………47
Figure 4.2: GIS image showing the change in the land-use pattern associated
with human disturbances within the forest reserve over a period
of four years (1998-2002)…………………………………………………….....48
Figure 4.3: Schematic plan of the sampling design for conducting butterfly sampling
within the study area of the protected forest reserve during the
two-year study period……………………………………………………………..50
Figure 4.4: Monthly total rainfall data for the study area during January to December
for the period of 5 years (2001-2005)………………………………………........59
xxvi
Figure 4.5: Monthly Mean Maximum temperature (°C) of the study area over the
period of 5 years (2001-2005) that includes the study period (2003-2004)……..60
Figure 5.1: Rarefaction curve for the plant community of the two study sites (S1 & S4)…...68
Figure 5.2: Percentage representation of trees, herbs/shrubs and climbers in the
Forest Reserve (n = number of species). …………………………………….73
Figure 5.3: Number of species of trees, herb/shrubs and climbers per family
represented in the floral composition of study sites S1 and S4………………….74
Figure 5.4: Number of species per family representing the larval and adult
food-plant resources of the swallowtail butterflies in Rani-Garbhanga
Reserve Forest…………………………………………………………………...75
Figure 5.5: Number of plant families and species represented in the total floral
diversity, larval and adult food-plant resources of the swallowtail
butterflies in the study area…………………………………….. ………………76
Figure 5.6: Percentage representation of the total, larval and adult food-plant
resources of the swallowtail butterflies in the study area……………………….76
Figure 5.7: Genus representation of the swallowtail butterflies sampled during
the dry and wet seasons of 2003-2004 in the 50 ha study site of
Rani-Garbhanga Reserve forest…………………………………………………77
Figure 5.8: Papilionidae representation in the forest reserve from the present
study (2003-2004) as compared to the first documentation on the
Papilionidae of the Indian Himalayan Region by Evans (1932)
and Talbot (1939)………………………………………………………………78
Figure 5.9: Total abundance of swallowtail butterflies sampled in the 20 fixed
transects of the study area during the wet and dry seasons of 2003-2004...........79
xxvii
Figure 5.10: Differences in mean annual transect abundance of butterfly
individuals between dry and wet seasons of the study period
(2003-2004) in Garbhanga range…………………………………………….80
Figure 5.11: Differences in mean annual transect abundance of butterfly
individuals between dry and wet seasons of study period
(2003-2004) in Rani range. ……………………………………………...........81
Figure 5.12: Mean abundances (mean number of butterfly individuals per
season/year ± standard error) of swallowtail butterflies sampled
as individuals during dry and wet seasons of 2003-2004 in the
fixed transects (1-8 for dry and wet season of 2003 again
resampled as 9-16 for dry and wet season of 2004) in study
sites S1, S2 and S3 of Garbhanga Range……………………………………..82
Figure 5.13: Mean abundances (mean number of butterfly individuals per
season/year ± standard error) of swallowtail butterflies sampled
as individuals during dry and wet seasons of 2003-2004 in the
fixed transects (1-8 for dry and wet season of 2003 again
resampled as 9-16 for dry and wet season of 2004) in study
sites S4 and S5 of Rani Range…………………………………………………82
Figure 5.14: Total abundance of swallowtail butterfly individuals per genera
recorded during dry and wet seasons of 2003-2004 in study sites
(S1-S5) of Rani-Garbhanga Reserve Forest…………………………............83
Figure 5.15: Mean abundances of Papilionidae genera sampled as individuals in
the 20 fixed transects of the study area during dry and wet seasons
of 2003-2004………………………………………………………………….85
Figure 5.16: The relationship between the geographic range and mean abundance
of species assemblages in the study sites (S1, S2 & S3) of Garbhanga
range………………………………………………………………………….86

xxviii
Figure 5.17: The relationship between the geographic range and mean abundance
of species assemblages in the study sites (S4 & S5) of Rani range…………87
Figure 5.18: Larval diet breadth of the swallowtail butterflies of Rani-Garbhanga
Landscape…………………………………………………………………….89
Figure 5.19: Relationship between mean abundance and feeding guild of the
species assemblages in the study area……………………………………......90
Figure 5.20: CCA ordination of swallowtail butterfly abundance in Garbhanga
range (S1, S2 & S3)…………………………………………………............92
Figure 5.21: CCA ordination of locations and distribution of swallowtail
butterflies of Garbhanga range (pooled data of 12 fixed transects of
study sites S1, S2 & S3 in species space (Common names)…………...........94
Figure 5.22: CCA ordination of locations and distribution of swallowtail
butterflies of Garbhanga range (pooled data of 12 fixed transects of
study sites S1, S2 & S3 in species space (Scientific names)………………...98
Figure 5.23: CCA ordination of swallowtail butterfly abundance (Group
assemblages, genus-wise) of Rani range (S4 & S5)………………………..100
Figure 5.24: Ordination plot of CCA of swallowtail butterfly species matrix
on sampling locations (pooled data of 8 fixed transects) of Rani
range (S4 & S5) by common names during the wet and dry
seasons of 2003-2004…….............................................................................102
Figure 5.25: Ordination plot of CCA of swallowtail butterfly species matrix
on sampling locations (pooled data of 8 fixed transects) of Rani
range (S4 & S5) by scientific names during the wet and dry seasons
of 2003-2004…………………………………………………………………105

xxix
LIST OF PHOTO PLATES IN CHAPTERS 3 AND 4 :
CHAPTER 3 : STUDY AREA
Photo 1 : ‘ Deepor Beel’ – the 4.14 sq. Km (core area) wetland is the only
Ramsar site in Assam and is under proposal for being declared
as a ‘Wildlife Sanctuary’…………………………………………………24
Photo 2 : Small-wood collection by the local villagers from the fringe areas
is a common problem within the forest reserve…………………………...27
Photo 3 : A typical ‘bamboo forest’ habitat type within the forest reserve
Bamboo (Dendrocalamus hamiltonii) …………………………………….28
CHAPTER 4 : METHODS Photo 4 : Study site S1 – Partially disturbed (Garbhanga ) – transect T1
in open/scattered forest (SCF)……………………………………………..53
Photo 5 : Study site S1 – Partially disturbed (Garbhanga) – transect T3 in closed forest (CF)……………………………………………………….53 Photo 6 : Study site S4 – Heavily disturbed (Rani) – transect T1 in open/
scattered forest……………………………………………………………54
Photo 7 : Study site S4 – (Rani) – transect T4 in closed forest (CF)………………..54

xxx
LIST OF ABBREVIATIONS :
ASTER : Advanced Space borne Thermal Emission and Reflection Radiometer CITES : Convention on International Trade in Endangered Species of Wild Fauna FAO : Food and Agriculture Organisation FSI : Forest Survey of India GPS : Global Positioning System GIS : Geographic Information System IHR : Indian Himalayan Region IUCN : International Union for Conservation of Nature and Natural Resources ICIMOD : International Centre for Integrated Mountain Development ICBP : International Council for Bird Preservation IBA : Important Bird Area IRS LISS : Indian Remote Sensing –Linear Imaging Self-Scanning System JFM : Joint Forest Management TEK : Traditional Ecological Knowledge UNEP : United Nations Environment Programme USF : Unclassed State Forest WWF : Worldwide Fund for Nature

xxxi
LIST OF CITATIONS ON REPORTS AND POLICIES : CHAPTER 2 : Media Report, 2002 (The Assam Tribune, 8th November, 2002) Media Report, 2006 (The Hindu, 11th April, 2006). Journal of Himalayan Biosphere Reserves CHAPTER 3 : State Forest Department Communication, 2005. Director, Forest Communication, Forest Department, Assam . www.assamforest.co.in Assam Forest Policy, 2002. Department of Environment and Forests, Government of Assam, India Assam Forest Policy, 2004. Department of Environment and Forests, Government of Assam, India National Afforestation Programme, 1990 WWF India (2002) National Forest Policy, 1988. Department of Environment, Forests and Wildlife, Ministry of Environment and Forests, Government of India Indian Wildlife Protection Act (1972) Ministry of Environment and Forests, Government of India. CITES Appendix I : CITES Appendix I includes those species which are threatened with extinction and are, or may be, affected by international commercial trade. These species may not be traded internationally (including import from the high seas) for primarily commercial purposes.

PART I GENERAL INTRODUCTION
CHAPTER 1 : INTRODUCTION
CHAPTER 2 : BACKGROUND, OBJECTIVES AND HYPOTHESES
CHAPTER 3 : STUDY AREA

1
CHAPTER 1 : INTRODUCTION 1.1 An Overview of the Tropical forests Tropical forest ecosystems are dynamic systems occupying ca. 7% of the earth’s
area (Myers, 1984). These ecosystems are under threat across the world and tropical forest
deforestation as well as the impact of this disturbance on the global biodiversity has become
a global concern in recent years (Fimbel et al., 2001; Groombridge & Jenkins, 2000;
Lawton et al., 1998). Although the tropical forests are known to contribute significantly to
the global diversity (Sutton & Collins, 1991; World Conservation Monitoring Centre, 1992),
not more than 4% of the total tropical forest cover is within the boundaries of reserves or
national parks (Whitmore & Sayer, 1992). Sometimes even the best-protected areas might
not be adequate to maintain the original ecosystem either due to their small size or difficult
political and social conditions (Terborgh, 1999). Ecological disturbance is a continuously
operating process in tropical environments (Blau 1980). Most estimates of species loss have
focused on tropical forests, as they are known to harbour the majority of species. However
with increasing anthropogenic pressures, tropical forests are undergoing fragmentation,
leading to a loss of habitat and subsequently erosion of biodiversity (Pimm 1998; Laurance
1999). In developing countries, degradation of tropical forests through selective logging,
hunting, change in land-use practices, shifting agriculture and urbanization is both
widespread and continuing yet, despite several decades of research into this problem, the
impacts of such disturbance on the diversity of fauna within tropical forests are poorly
understood (Hill & Hamer, 2004). Severe disturbances like clear felling and conversion of
forest into grassland usually reduce diversity (Holloway, Kirk-Spriggs & Chey, 1992) but
impacts of moderate habitat disturbance such as commercial selective logging still remains
unclear. Given the rapid loss of tropical forest habitats ecologists and conservationists
urgently need to understand the factors contributing to this lack of consensus. In densely
populated countries like India forest degradation is a serious problem. The country has
about 6% of the total human population and about 15% of the world’s cattle population.
Indiscriminate utilisation of both forest and non-forest resources is leading to a change in
the quality of the forests/habitat. Shifting cultivation, which was once said to be a

2
sustainable practice, is causing a serious threat to the endemic flora and fauna
(Ramakrishnan, 1993). Shifting cultivation is widely prevalent in Northeast India. It is the
major land-use in this region and extends over 1.73 million ha (FSI, 1999). A meaningful
solution to this problem has become critical not only from the point of biodiversity
conservation, but also for the productive agriculture in the region.
The tropical moist deciduous forests occur under varied climatic
conditions, but essentially with alternate wet and dry periods. The structure and composition
of deciduous forests change with the length of the wet period, amount of rainfall, latitude,
longitude and altitude (Shankar, 2001). Phytosociological patterns in Indian deciduous
forests are not well known. In Northeast India, the moist mixed deciduous forests are
classified as ‘East Himalayan moist deciduous forest’ (Champion & Seth, 1968) and in
Assam, the tropical deciduous forests cover is 11,358 sq. Kms, which is 14.5% of the total
forest cover (FSI, 2003). Deciduous forests are not considered species rich (Gentry, 1995)
but have a diversity of life forms (Medina, 1995). These forests still assume unusual
significance for conservation as they are the most used and threatened ecosystems (Janzen,
1986), especially in India.
1.2 The Eastern Himalayas
The Indian Himalayan Region (IHR) covering about 16.2% of the country’s
total geographical area occupies the entire northern boundary of the Indian sub-continent
extending from the Northwest (Kashmir-Kumaon) to the Northeast (Eastern Himalayas).
This region portrays India’s ecological and social identity by virtue of being the center of
biological and cultural diversity with the ethnic hill tribes primarily depending on the
natural forest resources for their daily sustenance. The cultural and ethnic diversity in the
region is remarkable, with each group of people adapting to the demands of the region in
their own unique way. Great differences in altitude, latitude and longitude create vast
variation in microhabitats throughout this range. The Western Himalaya is relatively dry and
cold, while the Eastern Himalayan region is extremely wet. However the exceptionally rich
and higher biological diversity in the Eastern Himalaya is attributed to its multiple
biogeographic origins. Its location at the junction of two continental plates places it in an
ecotone that is represented by flora and fauna from both. The Indo-Malayan realm of
Southeast Asia has contributed to many tropical taxa and particularly represented by such
primitive plants like Michelia, Magnolia, Camellia, Dipterocarpus, Shorea, Terminalia and
Rhododendrons and epiphytic orchids. The monsoon forests below 1000 metres have a close

3
affinity with the monsoon forests of Indo-China where Dipterocarpaceae is the dominant
family while the faunal elements are mainly the representatives of the Indo-Malayan realm.
The Palaearctic realm to the north contributes to the Sub-tropical Broadleaved Hill type of
forests including the conifers while the temperate and sub-tropical East Asian or Sino-
Japanese region contributes to a primitive biota with a high level of endemism. There is also
a good representation of the Palaearctic mammals like the Snow leopard (Uncia uncia),
Brown Bear (Ursus arctos) and a diverse assemblage of ungulates. The high degree of
climatic variability associated with the steep and complex topography has enhanced the
biodiversity across the north-south axis (WWF and ICIMOD, 2001).
Conservation International has upscaled the Eastern Himalaya Hotspot to the
Indo-Burma Hotspot (Myers et al., 2000) and as one of the earth’s biodiversity hotspots
includes several Global 200 Ecoregions (Olson & Dinerstein, 1998), two Endemic Bird
Areas (Stattersfield et al., 1998) and several centres for plant diversity (WWF/IUCN, 1995).
The region’s lowland and montane moist to wet tropical evergreen forests are considered to
be the northernmost limit of true tropical rainforests in the world (Proctor et al., 1998). The
region harbours India’s largest elephant (Elephas maximus) population and the world’s
largest population of the one-horned rhino (Rhinoceros unicornis). This region also
harbours the highest avian diversity in the Orient with about 836 of the 1200 species of
birds known from the Indian subcontinent (ICBP, 1992). The political boundaries of this
region now include entire Northeast India, Bhutan, Nepal, Myanmar and Southern China.
Northeast India, which covers the entire Indian extent of the Eastern Himalayas, and
representing this transition zone between the Indo-Malayan, Indo-Chinese and Indian
biogeographical realms, is unique in providing a profusion of habitats with diverse biota and
a high level of endemism. Physiogeographically the region can be categorised into the
Eastern Himalayas, Northeast hills (Patkai-Naga Hills and Lushai Hills) and the
Brahmaputra and Barak valley plains. Northeast India forms the main region of tropical
forests in India with a rich diversity of medicinal plants and many other rare and endangered
taxa. Although 64% of the total geographical area is under forest cover, there has been a
decrease of about 1800 sq.kms. in the forest cover between 1991 –1999 (FSI, 2000). The
region is also the abode of approximately 225 ethnic tribes out of a total of 450 in India, the
culture and customs of which have an important role in understanding biodiversity
conservation and management issues. This region provides a good example of the linkages
that exists between cultural diversity and biological diversity (Ramakrishnan 1999). The
Biodiversity Strategy and Action Plan for Northeastern Ecoregion suggests that 3,624

4
species of insects are recorded from the region. Butterflies and moths are by far the best-
studied invertebrate organisms in this region. Assam is a part of this mega diversity zone by
virtue of its rich tropical evergreen rain forests and moist deciduous forests (Champion &
Seth, 1968).
1.3 Study on tropical butterfly communities
Relatively few studies have focussed on invertebrates, despite their
dominance of the animal community in species richness, abundance and biomass (Wilson
1987; Stork 1988). Insects have been shown to be sensitive to changes in vegetation
composition and the physical attributes of the environment (Erhardt 1985; Gardner et al.,
1995; Wood & Gillman, 1998) resulting in a decrease in insect diversity (Holloway 1987;
Holloway et al., 1992). Tropical insects are highly diverse (Hamer et al., 2003). Tropical
butterfly communities are highly diverse with many endemic species, most of which are to
some extent dependant on closed-canopy forest (Collins & Morris, 1985; Sutton & Collins,
1991). Compared with other invertebrate groups, the high visibility of butterflies together
with their relatively well studied taxonomy and rapid abundance changes in response to
environmental variations and local weather have resulted in them being used regularly as
biological indicators of ecosystem health (New 1992; Spitzer et al., 1997; Lawton et al.,
1998; Scoble 1992). They have been widely used to assess patterns of tropical insect
diversity in forest conservation studies (Brown 1991; De Vries et al., 1997). Inventory and
monitoring of butterflies has proven useful in the evaluation of terrestrial landscapes for
biological conservation (Samways, 1994). Examples include habitat assessment and
classification (New, 1991; Pollard & Yates, 1993; New et al., 1995) as well as evaluation of
the effects of land use (Erhardt, 1985; Swengel 1996) and urbanization (Kremen, 1992;
Blair & Launer, 1997). As butterflies are extremely sensitive to changes in vegetation
composition and structure, butterfly assemblages may be used to characterize different
habitats (Erhardt, 1985). Butterflies in general and swallowtail butterflies (Family
Papilionidae) in particular also represent the ‘flagship’ and/or ‘umbrella’ taxa for
invertebrate conservation (Collins & Morris, 1985; New et al., 1995). The swallowtail
butterflies have become one of the model taxa for understanding the processes involved in
evolutionary divergence of host preference, host-specialization and diversification in insects
(Wiklund, 1975, 1981; Rausher et al., 1983; Scriber et al., 1991; Tyler et al., 1994;
Thompson, 1994). They have diversified worldwide into more than 475 species and species
complexes that differ in the range of plant taxa they attack (Scriber et al., 1995; Tyler et al.,

5
1995). Most species of the swallowtails are predominantly tropical but a few species are
also found in the temperate zones (Slansky, 1972). They are most diverse in the equatorial
rainforest zones and Southeast Asia has the highest number of species, while species
richness in the eastern Asian region between 20ο and 40o N is also high as reflected in the
analysis on critical swallowtail fauna where Indonesia, Philippines, China, Brazil and
Madagascar are reported to include well over a half of the world’s swallowtails (309 species
and 54% of the world total) with highest swallowtail species endemism. Another five
countries, India, Mexico, Taiwan, Malaysia and Papua New Guinea bring the total to 68%,
which is more than two-thirds (Collins & Morris, 1985). Globally 573 species have been
listed out of which nearly 78 species have been listed in the threatened categories. Amongst
these, 14 species have been listed as ‘Insufficiently known’ (Scriber, 1973; Collins &
Morris, 1985). In the Indian sub-continent, the family Papilionidae is represented by two
sub-families- Parnassiinae (Apollos), which includes 14 species, and Papilioninae
(Swallowtails), which include 83 species and sub-species (Evans, 1932; Talbot, 1939).
Swallowtail butterflies are the most spectacular and magnificent of all insects with brilliant
colouration and large variations in size ranging from the minute 50 mm wingspan of the
Dragontails of India and Malaysia (Lamproptera species) to the giant Birdwings (Troides,
Trogonoptera and Ornithoptera species) of India, Indonesia and New Guinea. The female
Queen Alexandra’s Birdwing (Ornithoptera alexandrae) is the largest butterfly in the world,
attaining a wingspan of over 250 mm. Due to their fabulous colours and aesthetic value, the
swallowtails are vulnerable to commercial collection and trading and are the sole insects
included in Appendices to CITES. The Birdwings (Troides, Trogonoptera and
Ornithoptera species) have been listed by CITES on Appendix II. Butterfly trading based in
India and Indo-China is quite extensive and occurs at all levels from personal collectors to
substantial business (Collins & Morris, 1985). In the Eastern Himalayas, the trade in the
swallowtail butterflies has been most intensive since the early part of the 19th century and
over collection of Teinopalpus imperialis (Kaiser-I-Hind) and Bhutanitis lidderdalii (Bhutan
Glory) by private collectors for the international market has been a major threat to not only
these specie but the illegal commercial trade in the oriental region has been the primary
cause of concern for the continued survival of a number of important localised species. India
occupies the 6th rank in the list of priority countries or ‘critical faunas’ for swallowtail
conservation (Collins & Morris, 1985). A total of 77 species have been recorded in the
Indian subcontinent out of which 6 species are known to be endemic and only 1 species is
threatened (Collins & Morris, 1985). The IUCN has identified the entire Indo-Burma hot

6
spot that includes the Eastern Himalayas and other Global 200 ecoregions from this hotspot
as ‘Swallowtail butterfly-rich zone’ and has also drawn up an action plan for their
conservation (‘Swallowtail Conservation Action Plan’, New & Collins, 1991). Many
swallowtail butterflies are very restricted in their habitat and geographical range. Some taxa
are found only in the montane regions or ‘ecological islands’; others on small geographical
islands while many are endemic to microhabitats in tropical forests. As the Papilionids are
dependant on forest vegetation, habitat alteration associated with deforestation, agricultural
conversion and intensification, alteration of pastures, urbanisation and industrialisation are
posing a serious threat to their survival. (Collins & Morris, 1985). Habitat change in
densely populated and economically poor tropical regions is of increasing concern
(FAO/UNEP, 1981). In tropical South-east Asia in particular, habitat alteration by way of
deforestation has posed a serious threat to the survival of the Papilionidae. In the Eastern
Himalayas deforestation is occurring throughout the range of an endemic species, Kaiser-I-
Hind (Teinopalpus imperialis imperialis Hope, 1843) described as rare by Talbot (1939) and
protected by law in India (Wildlife Protection Act, 1972). This species is listed by the IUCN
(1996). The present IUCN status of this species is rare and much of its forest habitat is being
degraded through shifting cultivation. There has also been commercial overexploitation of
this species in the past and the protective legislation enacted in India and Nepal appears not
to be very effective. The primary vegetation in extensive areas of Northeast India including
Assam has been disturbed by human activities. The quality of the forests is also
deteriorating with the dense forests (canopy closure >60%) becoming degraded into open
forest or scrub. In Assam the percentage of ‘Very Dense’ forest cover is only 2.1% (1,684
sq.kms), ‘Moderately Dense’ forest cover is 14.5% (11, 358 sq.kms.), ‘Degraded/Open
forests’ is 18.9% (14, 784 sq.kms.) and ‘Non-forest’ area is 64.5% of the total area of forest
and tree cover (FSI, 2003). This indicates a disturbing trend in the declining primary forest
cover. The total estimated area under encroachment is 3,555 sq.kms. and total area under
forest fringe villages is approximately 538.35 sq.kms. (0.69% of the Reserved forest area).
A majority of the indigenous inhabitants of Assam are meat eating and almost all
communities have expert hunters, trappers and fishermen. Although the traditional practices
of trapping and snaring of animals are carried out in very remote areas, shooting wild
animals with guns is prevalent. Moreover certain meat is valued as medicinal and such
animals are hunted. It has been recommended under the National Forest Policy, 1988 that
every state in India shall have atleast 5% of the geographical area under National Parks and

7
Wildlife sanctuaries, which cover natural ecosystems and greater emphasis needs to be
given towards anti-poaching measures in such protected areas.
1.4 The Protected Forest Management Scenario in Assam
Sustainable forest management is a key issue not only for biodiversity
conservation but is also equally significant for the local economy (Ramakrishnan, 1999). In
Assam where culturally distinct ethnic societies living close to nature and natural resources
have sculptured a cultural landscape around them, this concept of cultural landscape can be
seen as an effective tool for linking conservation with sustainable development of this
marginalized society. With a rapid decline in the forest cover of Assam, forest rehabilitation
initiatives in which local communities get involved are already being introduced. Under the
National Afforestation Programme in Assam, Joint Forest Management (JFM) has been
implemented which has been working on the local peoples’ participation for the regeneration
and protection of the forests. Rani-Garbhanga Reserve forest in Assam, Northeast India
which was selected for our research study on the Papilionidae (Swallowtail butterflies), has
five Joint Forest Management committees under Forest Development Agency, where the
local forest village community who are the actual traditional owners of the forest are an equal
stake holder, and in collaboration with the forest department have been actively involved in
various community development programs like constructing village roads, school buildings,
providing safe drinking water and primary health facilities, incorporation of smaller income
generation schemes and growing cash crops along with the main crops. Bamboo
(Dendrocalamus hamiltonii) is a very important bio-resource of Rani-Garbhanga Reserve that
provides subsistence and livelihood security to the local village community and is a part of
the cultural, social and economic tradition of the region in general. In the rural scene bamboo
is particularly useful at the household level and the local people possess traditional skill of
working with the material and knowledge of cultivation and management of bamboo. A
community based development approach through active participation and involvement of
communities under the JFM has been adopted for protecting the bamboo forests within the
reserve. Agro-forestry and village-level social forestry initiatives have also been
implemented, as unless the local people are not involved they will jeopardise the forest
management. It is also critical that special emphasis should be placed on socially/culturally
valued species within the forest ecosystem because such species are invariably also the
keystone species and it is through this medium that the forest management authorities and
other local non-governmental organisations can relate with the local communities and make

8
such an interdisciplinary approach the basis for making management decisions. Formal
knowledge based forestry management practices can then provide added value to and help in
arriving at appropriate management decisions.
Management of ‘shifting cultivation’ (locally called Jhum) has been the next big
problem in particularly the southern range of the reserve. The shortening fallow cycle has
been managed through using appropriate tree species rather than introducing an alien
technology. Scientifically analysed ‘Traditional Ecological Knowledge’ (TEK) available with
the local communities is a powerful tool to redevelop ‘Jhum’ as part of a short-term strategy,
and as a component of a larger and more comprehensive landscape management plan
(Ramakrishnan, 1999).
In tropical regions where the management authorities are having to deal more
and more with secondary forest systems rather than with primary forests, more emphasis
needs to be given on the value of secondary forests in our research and management plans so
that these forests are effectively able to meet the multi-purpose needs of communities
(Ramakrishnan, 1999). Rani-Garbhanga Reserve Forest in Assam is also a disturbed
secondary forest where such a management approach that will sustain community
participatory rehabilitation or management plans can alone be sustainable in the long run as
the ultimate objective is towards restoring the integrity of the cultural landscape with which
the local ethnic community is closely linked.

9
CHAPTER 2 : BACKGROUND, OBJECTIVES AND HYPOTHESES
2.1. Background
Amongst the invertebrates, butterflies are becoming sufficiently well studied for
them to be used for general conservation planning in some parts of the tropics as a
representative insect group (Thomas, 1991). While butterflies are considered as useful
indicators of diversity, much of the extensive quantitative fieldwork on tropical lepidopteron
diversity has been confined to moths (Walpole & Sheldon, 1999). Yet the ease of sampling
butterflies has made them a focal group for characterizing tropical insect diversity,
community structure and disturbance effects and as tools in conservation biology (Derives
& Walla, 2001).
The state of Assam in Northeast India is home to a rich butterfly fauna and between
680-700 species and sub-species has alone been recorded while the total species count for
North-east India is 962 (Evans, 1932; Talbot, 1939; Wynter-Blyth, 1957). Large-scale
deforestation and habitat fragmentation have led to the decline of several butterfly
populations in the region and many species, which were listed as common during the early
part of the 20th century, have now declined rapidly throughout much of their range. Another
serious issue has been the illegal trade in butterflies where the strong nexus between the
private collectors and butterfly smugglers has been posing a serious threat to the survival of
these winged creatures. The Bhutan glory (Bhutanitis lidderdalii lidderdalii Atkinson 1873)
and Kaiser-I-Hind (Teinopalpus imperialis imperialis Hope 1843) are two species of
swallowtails endemic to the eastern Himalayas and which were described as rare (Evans,
1932; Talbot, 1939) but the present status is not known. Both species have been listed by
IUCN as ‘rare’ and ‘not so restricted’ respectively and require monitoring to ascertain their
actual status (Collins & Morris, 1985). While deforestation in India and Nepal that has been
occurring throughout the range of these two species has been one of the major threats to
their survival in the wild, illegal trade is the second most serious threat to these species.
Hundreds of individuals are exported annually from Thailand to collectors worldwide.
Trade in these two species flourished in the British Northeast India in the early part of 19th
century and now the present status of these species is unknown. It is reported that 100

10
million US dollars worth butterflies are being smuggled out of the country from Assam and
the Himalayan region and the target species are the Papilionids and Nymphalids. They have
high market value as both dead and livestock and are mostly used for ornamental purposes.
Many rare species of swallowtail butterflies fall into the ‘low volume/high value’ category
of butterfly trade and it is extremely difficult to monitor this trade as most often the
collectors pose as botanists.
The first major account on the butterflies of Assam was compiled in a series of
papers by Butler (1879), Doherty (1889), Elwes (1891) and Swinhoe (1893). The
biogeography of the Assam butterflies was discussed by several authors, including Bingham
(1907), Evans (1932), Talbot (1939), Parsons & Cantlie (1947), Wynter-Blyth (1957),
Varshney & Chanda (1971), Arora & Mondal (1981), Gupta & Shukla (1988). A historical
review on the swallowtail butterfly diversity of the Indian Himalayan region (IHR)
extending from Kashmir-Garhwal-Kumaon to Burma gives the earlier records of 83 species
and subspecies (excluding the Parnassius sp., commonly called the Apollos) and out of
these, 69 species were described from the present Eastern Himalayas covering entire
Northeast India and the erstwhile political regions of Sikkim, Bhutan, Assam, Meghalaya,
Manipur including Naga and Chin hills, Arunachal Pradesh, Mizoram and Tripura and 50
species were described from Southern Burma, Tavoy and Shan states (Evans, 1932; Talbot,
1939). The records of Evans (1932) described five species to be endemic to Assam while
another six species were endemic to the Sikkim-Assam region, 11 species were described
from Chitral and 31 species from the Western Himalayas. Another 19 species (including
sub-species) of swallowtails belonged to the ‘Non-Himalayan’ category and were described
from South or Peninsular India (Evans, 1932) and 13 species from the Andaman and
Nicobar islands (see Appendix 4: 4.3). All the above species and sub-species counts did not
include the Apollos (Parnassius sp.) whose range or distribution in the Indian sub-continent
is again only restricted to the Himalayan region and are confined to above 2700 m elevation
up to the maximum altitudinal level of 5500 m stretching from the Northeast to the
Northwest Himalayas. In the Northeast Himalayas (Eastern Himalayas), the Apollos are
found only in the states of Arunachal Pradesh and Sikkim. As the political divisions
mentioned in the records of Evans, 1932 belonged to the period of British rule in India and
Burma, therefore the biogeographical units have to be considered for the review on the
documentation. Therefore it would be worth considering the species records from the Shan
states also as they may be eventually found in the adjacent parts of Nagaland and Manipur
in present Northeast India. Moreover the political division during British regime in

11
Northeast India comprised of only one province- Assam, which is now divided into seven
provinces. The records of Wynter-Blyth (1957) gave a modified version of Evans (1932)
records, where he reported the total Papilionidae count for the Indian subcontinent as 94,
with 62 species described from Northeast India and 66 species described from Burma
(present Myanmar). The first comprehensive monograph on the swallowtail butterflies of
the Sikkim region in modern literature were compiled in a series of notes by Hooker (1855),
Elwes (1880), Elwes & Moller (1888), De Niceville (1881, 1882, 1883 & 1885), Tytler
(1915) and Bailey (1911). All these publications were later incorporated into the works of
Evans (1932), Talbot (1939) and Wynter-Blyth (1957). In recent literature, records on the
swallowtail butterflies from the Himalayan region were compiled by Mani (1986) while
Haribal (1992) reported on the diversity, status and habitat preferences of butterflies from
the Sikkim Himalayas. In the Himalayan region, 80% of the butterflies have been recorded
as forest species of which almost 60% of the butterflies occur in forests below the elevation
of 3000m. The remaining species occur above the elevation of about 4000 m (Mani, 1986).
Again in the records of Evans (1932), more than 15 species and sub-species of Papilionidae
have been recorded as endemic to India (excluding the Andamans and Nicobar Islands),
while the IUCN records reported only six species as endemic to India with a total species
count of 77 (Collins & Morris, 1985). There are startling lacunae in the evaluation process
as for example out of 26 threatened species of butterflies listed for India by the IUCN, the
threat categories of only six species (Teinopalpus imperialis, Graphium epaminondas,
Euploea andamanensis, E. scherzeri, Idea malabarica, Parantica nilgiriensis) have been
evaluated so far while another three species (Elymnias pealii, Charana cepheis and
Mycalesis malsarida) of endemics from the family Nymphalidae do not even feature on the
IUCN list. Moreover all the species listed as threatened on the IUCN list are not included
under Schedule I of the Indian Wildlife Protection Act, 1972 (as amended upto1993). This
clearly suggests the need for a re-evaluation of the status and a new documentation on the
butterflies of particularly North-East India. In Assam, there has been less scientific focus on
any kind of major butterfly fauna survey until recently and no scientific documentation of
the local butterfly fauna has been done in the recent past except for a few protected areas.
Academic research on butterflies is also lacking and there is no readily available recent
baseline data on the butterflies of this region. Most of the wildlife parks and sanctuaries in
Assam do not have butterfly lists and on an overall there is very little conservation activity
directed towards butterflies because they are not considered to be flagship/umbrella species.
As there are no names for butterflies in regional languages and no access to any kind of

12
detailed technical information, peoples’ awareness regarding butterflies and their
conservation is lacking and it is also difficult for wildlife managers and policy makers to
take steps for effective butterfly conservation. This is due to the fact that in India butterflies
are treated as non-target species in the conservation and management of wildlife as the
prime focus has always been on the vertebrate taxa. Apart from the occasional checklists,
which have been more of an authoritative work, scientific work pertaining to the biological
and ecological aspects of butterflies from this region is completely lacking. As large-scale
deforestation and habitat fragmentation are continuing at a rapid rate, most of the butterfly
species, which were described as common in the early literature, are now declining
throughout much of their range. Therefore research and documentation on the butterflies
with emphasis on their taxonomy needs to be undertaken as an initial step towards the
conservation of this taxon. ‘Horizon International and Butterfly Conservation’ is one such
project currently involved in the comprehensive survey and monitoring of the butterflies in
the protected areas of Assam and this project is aimed towards the development of a
baseline data for the butterflies of protected areas.
In the present study, Rani-Garbhanga Reserve Forest was selected as the study area
with the prime objective of focussing on ecological studies as well as long-term butterfly
monitoring. This protected reserve was found to harbour a good butterfly diversity based on
earlier studies (Barua et al., 2004a; 2004b) and there has also been a proposal for declaring
this protected reserve as a “Butterfly Sanctuary” (Media report, 2006. The Papilionidae
family was however selected as the focal group for the research studies on butterflies as this
group is primarily composed of forest-dwelling species and a study on the food plant data
base for the swallowtail butterflies along with the impacts of some selected environmental
variables on their abundances and distribution can be used as an effective research tool for
conservation. As for the selection of the study area, the strategic location of this protected
reserve adjacent to a wetland ecosystem, which is the only Ramsar site in Assam and
sharing of common boundary with protected forest reserves from the state of Meghalaya can
be, used an important tool for ‘bio-monitoring studies’ in the future. The first research
project funded by the Ministry of Environment and Forests, Government of India started
work in Rani-Garbhanga Reserve forest in 2001 to identify the butterfly community within
the protected area. A total of 193 species belonging to the families Papilionidae,
Nymphalidae, Pieridae, Lycaenidae and Hesperidae were documented in this study (Barua
et al., 2004a). The initial stage of the research work was directed more towards taxonomic
studies relating to the identification of the butterflies and particularly the Papilionidae group
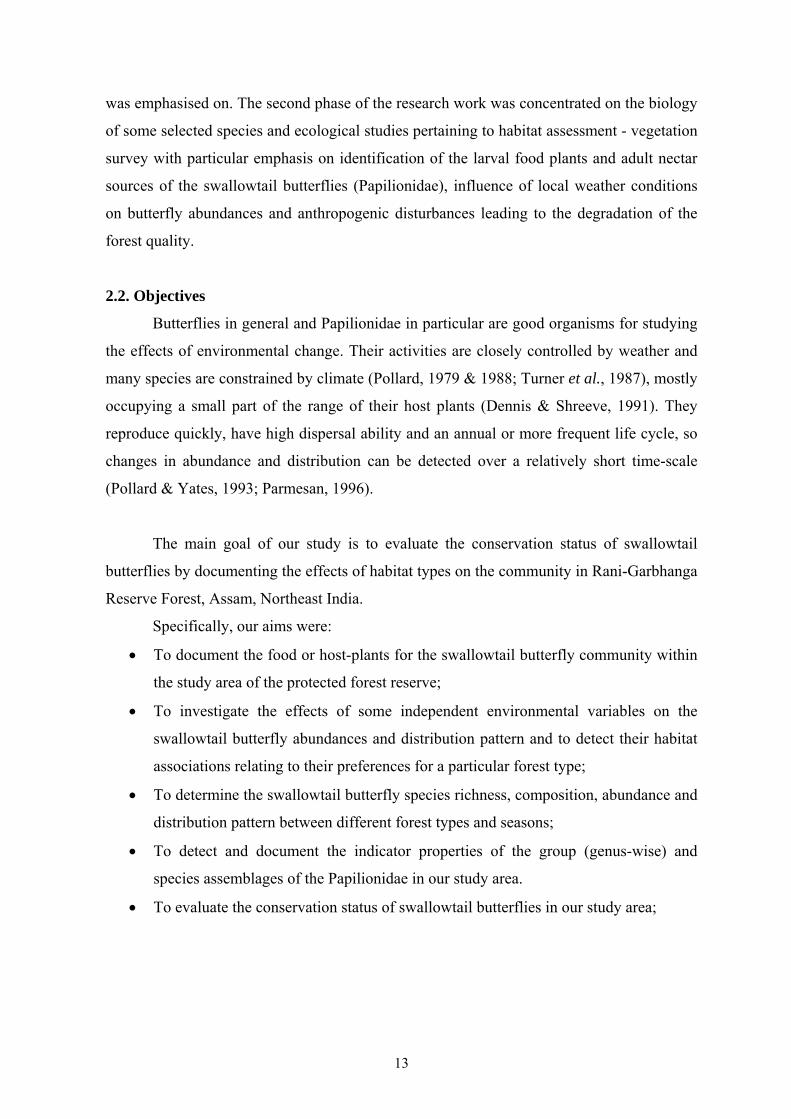
13
was emphasised on. The second phase of the research work was concentrated on the biology
of some selected species and ecological studies pertaining to habitat assessment - vegetation
survey with particular emphasis on identification of the larval food plants and adult nectar
sources of the swallowtail butterflies (Papilionidae), influence of local weather conditions
on butterfly abundances and anthropogenic disturbances leading to the degradation of the
forest quality.
2.2. Objectives
Butterflies in general and Papilionidae in particular are good organisms for studying
the effects of environmental change. Their activities are closely controlled by weather and
many species are constrained by climate (Pollard, 1979 & 1988; Turner et al., 1987), mostly
occupying a small part of the range of their host plants (Dennis & Shreeve, 1991). They
reproduce quickly, have high dispersal ability and an annual or more frequent life cycle, so
changes in abundance and distribution can be detected over a relatively short time-scale
(Pollard & Yates, 1993; Parmesan, 1996).
The main goal of our study is to evaluate the conservation status of swallowtail
butterflies by documenting the effects of habitat types on the community in Rani-Garbhanga
Reserve Forest, Assam, Northeast India.
Specifically, our aims were:
• To document the food or host-plants for the swallowtail butterfly community within
the study area of the protected forest reserve;
• To investigate the effects of some independent environmental variables on the
swallowtail butterfly abundances and distribution pattern and to detect their habitat
associations relating to their preferences for a particular forest type;
• To determine the swallowtail butterfly species richness, composition, abundance and
distribution pattern between different forest types and seasons;
• To detect and document the indicator properties of the group (genus-wise) and
species assemblages of the Papilionidae in our study area.
• To evaluate the conservation status of swallowtail butterflies in our study area;

14
2.3. Research questions
Keeping the above objectives in view, we therefore aimed to answer the following
questions:
1) Is there any difference in the swallowtail butterfly species composition and
distribution between open forest or gaps and closed forest? Which species are
associated with each habitat or forest type?
Previous studies have shown that butterflies are in general very habitat
specific and this habitat association could be influenced by many physical and
biological factors (Ramos, 2000; Spitzer et al., 1993 & 1997; Leps & Spitzer, 1990;
Spitzer, 1983). The swallowtail butterflies belonging to the family Papilionidae are
primarily a forest dwelling species but some species are also known to be associated
with open habitats (Collin & Morris, 1985). A high proportion of swallowtails are
dependant on the forest vegetation and, deforestation has been the major cause of
concern for the continued survival of a number of localised species. Our first
objective was therefore aimed at not only identifying all the available species within
the forest reserve but to also identify the characteristic species for each forest type.
Therefore by segregating the study area into two distinct forest types (gaps or open
and closed forest types) and following the standard transact walk method of Pollard
(1977), we investigated the distribution pattern and abundance levels of the species
assemblages within the forest reserve.
Butterflies interact with plants both as larval herbivores and adult pollinators,
potentially influencing plant population dynamics in both interactions (Gilbert,
1980). Although in our study we did not investigate the correlation between butterfly
and plant diversity, however as part of a general vegetation survey, we tried to
identify the floral resources within the forest reserve especially at the level of larval
food-plants and some of the common adult nectar sources. Swallowtail butterflies
are known to be strongly associated with some tropical and sub-tropical plant
families (Fiedler, 1998); therefore the identification of the host-plants up to species
was important as recent studies have found larval host-plant specificity and adult
habitat specialization to be important determinants of extinctions across all families
of butterflies in south-east Asia (Koh et al., 2004). Interactions with host plants
appear to be an important means of biological diversification and these interactions
are governed by nutrient content, plant phenology and geographical distribution
(Slansky, 1993; Basset, 1991a & b; Leather, 1990). The abundance and distribution

15
of butterflies within a particular habitat therefore signifies the floral diversity and
habitat quality, which can be used as important tools for their conservation as well as
for general bio- monitoring. However high floral diversity does not always coincide
with significant butterfly species diversity (Vane-Wright, 1978). Therefore our
studies on vegetation were only aimed at identifying plants as trees, herbs/shrubs and
climbers and then segregating the adult and larval resources with reliable references
from literature and actual field observations.
2) Is there any relationship between the species abundance and their geographical
range and larval diet breadth?
We tried to investigate the correlation between species geographical range
and abundances as geographical range can be used as a tool for assessing
conservation value. The larval diet breadth is considered to be one of the most
important life-history traits of butterflies that is strongly associated with their
adaptive and survival strategies and efficient uses of resources (Shapiro, 1975). The
correlation between the species abundances and their feeding guild could also be
considered to be an important part of the study on the biogeographical affinities of
butterflies and the differences in the abundance and distribution patterns of the
generalist and, specialist species can be considered to be important ecological
determinants of butterflies (Kitahara & Fujii, 1994).
3) Is the species abundance and distribution within the forest reserve influenced
by such independent environmental variables like season (dry and wet seasons),
forest type, year, rainfall, altitude and geographical position?
In the seasonal ‘East Himalayan region’, responses to the seasonal changes in
local environmental factors are important (Spitzer et al., 1993). Northeast India has
the tropical monsoon type of climate where the amount of rainfall, temperature and
humidity are known to influence the biology and ecology of flora and fauna
(Ramakrishnan et.al., 1993). Specifically in case of the butterflies, rainfall is an
important factor which not only directly influences the plant phenology and
especially the host-plant dynamics, but the combined effects of temperature and
moisture gradients are also known to influence the biology and ecology of the
butterflies, particularly the variation in adult abundance and activity (Wolda, 1989;
Hill et al., 2003). Tropical butterflies have been known to be sensitive to seasonal
16
changes in rainfall (Hill et al., 2003). Again in the tropical regions, there is little
variation in either temperature or photoperiod and changes in rainfall are the most
important factors affecting seasonality of butterflies (Hill et al., 2003). We therefore
tested the effects of both season segregated as ‘Dry’ and ‘Wet’ seasons and the
amount of rainfall to explain the changes in abundance of the Papilionids. Butterfly-
environment relations were inferred using Canonical Correspondence Analysis to
study the effects of rainfall as an independent variable and season (combined effects
of rainfall, maximum temperature and humidity to segregate into dry and wet
seasons) as a categorical variable to examine the variations in abundances,
distribution pattern and diversity of the assemblages of species across the two forest
types.
Differences among species in the pattern of seasonal variation in abundance
could have important implications for comparison of the diversity and faunal
composition of species assemblages between natural and disturbed habitats in
different seasons (Hamer et al., 2005). In our study we separately tested the effects
of season and rainfall to examine the abundances of species across two different
years. Therefore year taken as an independent variable basically defined the two
distinctly separate seasons- the dry and wet seasons over a time period of two years
(2003-2004) to examine the environmental effects. For butterfly sampling, the
months for the dry and wet seasons were chosen on the basis of mean rainfall, mean
maximum temperature and mean humidity data for the study period with information
on the climate data acquired from the meteorological station in Guwahati, Assam.
Therefore the differences in the sampling period in terms of the number of days
between the dry and wet seasons for the study sites and pooling of the transect data
did not qualitatively affect the results.
We also tried to examine the effects of altitude and geographical position
(latitude and longitude) on the abundance and distribution of the Papilionidae within
the protected reserve. This part of our study was an attempt on the line of a similar
kind of study on the distribution patterns in butterflies and birds of the Czech
Republic (Storch et al., 2003). Understanding distribution patterns must include not
only an understanding of species ecological requirements, but also an understanding
of geographical context, which affects structure and dynamics of species’
geographical ranges (Storch et al., 2003). Although such kind of a study requires a
large geographical area and wide physiogeographical and topographical gradients,

17
our attempt to examine the separating effects of these variables on the butterfly
assemblages is the first of its kind in this region. Therefore our future aim is to select
larger gradients in the protected areas of Assam for examining the effects of
geographical variables on butterfly species composition and distribution.
4) Are there any indicator group or species assemblages within the forest reserve,
which can be identified or defined by values of habitat/forest type and season?
The criterion of representative diversity, which is based on the recognition of
assemblages of species that are typical for specific habitats, is an interesting
phenomenon (Dufrene & Legendre, 1997). Indicator species can indicate ecological
change, patterns of richness or habitat type (Fleishmann et al., 2000). Some of these
species can be used as targets for conservation efforts, assuming that their protection
or preservation may help to protect other species sharing the same habitat. Moreover
the use of assemblages of species instead of a single species as indicators enables the
enlargement of the focus of the single-species approach to wider ecological
situations (Kremen, 1992). Such species assemblages with their determined species
richness and taxonomic composition can characterise different habitats which can be
used as an efficient conservation tool. In our study we tried to focus our efforts on
the identification of indicator butterfly taxa by habitat type and season as in the “East
Himalayan” region, seasonality associated with the distinctly separate dry and wet
seasons has a strong influence on the butterfly abundance fluctuations.
2. 4. Hypotheses
• Spitzer et al. (1987, 1990, 1993) and Ramos (2000) had used the method of
multivariate analysis for assessing the composition, abundance and diversity of
butterfly communities in southern Vietnam and Amazonian rain forest fragment.
Their results on the CCA ordination showed great variations in species composition
and abundance particularly with respect to levels of disturbance and vegetation
gradients. In our present study we also expect to find a heterogenous species
assemblage of the Papilionidae with respect to forest type based on the canopy
cover and disturbance gradient although we have not measured the disturbance
levels;

18
• Spitzer et al. (1993) found in their studies on the seasonality of the butterflies in a
montane tropical rain forest in Vietnam that the most characteristic seasonal
patterns in abundance fluctuations are closely associated with the monsoon climate.
Our research study predicts a similar seasonal trend with higher swallowtail
butterfly abundances, richness and diversity during the wet seasons, thereby clearly
indicating the influence of monsoon rain on Papilionidae populations and ecology;
• Corresponding to the findings of Spitzer et al. (1993) and Leps & Spitzer (1990),
where the observed seasonality of the forest butterflies seems to be determined not
only by plant phenology and climate but butterfly biogeography and fauna history
evolution also play an important role, we can expect a similar result in our study
where the swallowtail butterfly geographic range and feeding guild could be
correlated with their abundances to investigate their habitat associations. We could
thus expect swallowtail butterflies with wider ranges to be more closely associated
with gaps and disturbance while forest restricted species exhibit endemicity. This
trend is typically normal for taxa with endemic distribution in Northern Indo-China
(East Himalaya);
• According to Spitzer et al. (1997), endemic specialized stenotopic closed canopy
forest taxa are the most endangered groups and have higher conservation value. We
expect to record a high proportion of closed forest-restricted species within the
protected reserve and particularly in reference to the red-bodied Aristolochia
feeding guild, a good diversity is expected. This guild which normally has restricted
range and preference for closed forests can also be expected to have good
conservation value;
• Environmental factors and geographical position represented the main determinants
of species distribution and composition of local assemblages of birds and butterflies
of the Czech Republic as found by Storch et al. (2003). We also propose to examine
the separating effects of season and forest type and the effects of altitude, latitude-
longitude, year and amount of rainfall as independent variables and thereby predict
a significant influence of all these factors on the Papilionidae abundances,
distribution patterns, species diversity, richness, evenness and rarefaction estimates;
• Forest edges and areas of intermediate to high disturbances presented higher species
richness and diversity of Nymphalid butterfly communities in an Amazonian forest

19
fragment (Ramos, 2000). We however expect to detect higher species diversity and
richness in the closed forest fragments within our study area;
• Although rare or less common species with restricted range have higher
conservation value, common species should be selected to be used as indicators
(Ramos, 2000). We also expect to detect more common species with wider ranges
and ability to utilise a wide range of resources for selection as indicators of habitat
quality for future management plan in this protected reserve.

20
CHAPTER 3 : STUDY AREA
3.1 Review of Rani-Garbhanga Reserve Forest
Rani-Garbhanga Reserve forest located between 26°55’ to 26°0.5’ N latitude and
91°35’E to 91°49’E longitude is situated on the south bank of the river Brahmaputra and is
adjacent to Guwahati, the capital city of Assam in Northeast India (see Fig. 3.1 & 3.2). In
Assam, which is a part of the Eastern Himalayas (see Fig. 3.1), one of the global
biodiversity hotspots in the Indian subcontinent (IUCN, 1991) and now the recently
upscaled Indo-Burma biodiversity hotspot (Myers et al., 2000), there are a total of 312
Reserved forests covering an area of 13,870 sq. Kms (17.68% of the state’s geographical
area). The total recorded forest area in Assam is 26,748 sq.kms out of which the Protected
Area Network (25 in number) covers 3925 sq.kms. (5% of the state’s total geographical
area). The Unclassed State Forests (USF) cover an area of 5865 sq.kms. The number of
proposed Reserve forests in Assam is 145 covering an area of 3103 sq.kms (State Forest
Department Records, 2005). The total area of Rani-Garbhanga Reserve forest is 232 sq.kms
(23,230.58 hectares) and is divided into two ranges- The Garbhanga range having 188.86 sq.
kms area (18,860.58 hectares) and the Rani Range with 45 sq.kms (4370 hectares). The
Reserve is located at an altitude of 170-200 metres above the mean sea level. The forest type
in Rani-Garbhanga reserve corresponds to Champion and Seth’s (1968) ‘Assam valley
Tropical mixed moist deciduous’ forest with bamboos and are classified as ‘Khasi Hill Sal’
[3C/C1 a(ii)] and ‘Kamrup Sal’ [3C/C2 d(ii)] (Champion & Seth, 1968).
This protected forest is primarily a high-density elephant habitat (Asiatic elephant,
Elephus maximus) and home to an endemic primate species, Hylobates hoolock Harlan 1834
(Hoolock or White browed Gibbon), the only species of ape to be found in the natural
habitats of Northeast India. It is protected under Schedule I (1) of the Indian Wildlife
(Protection) Act, 1972, Appendix I of the CITES and ‘Endangered’ category of the IUCN
Red Data Book. The other common species amongst the larger animals are Tiger (Panthera
tigris), leopard (Panthera pardus), Barking deer (Muntiacus muntiak), Indian wild Boar
(Sus cirstatus), Assamese macaque (Macca inulata), Pangolin (Manis crassicaudata). The

21
Reserve has a good diversity of birds (170 species), reptiles (60 species) and a large
diversity of insects including butterflies (State Forest Department Records, 2005). Although
there has been no proper documentation of the butterfly fauna within this reserve recent
studies have recorded 193 species from the study area (Barua et al. 2002). This Reserve is
the original habitat of the Sal, Shorea robusta (IUCN, 1991). The Sal forests, which are
typically categorised as ‘Tropical Moist Deciduous Forest’ are mainly, distributed in South
and South-east Asia and in India alone the Sal forests extend over an estimated area of 13
million hectares (Champion & Seth, 1968). Sal is one of the most important timber yielding
plants while the stems of Sal trees are a good source of ‘aromatic gum’ and is also known to
have medicinal properties. The tribal people use the leaves for preparing rice cake, small
baskets and disposable plates. A special type of microclimate prevailing in the Sal forest
ecosystem facilitates the huge association of undergrowth diversity. However like all other
Sal forests in India that are rich in phytodiversity and have been facing a great threat, in
Rani-Garbhanga as well due to over-exploitation, deforestation and encroachment, the
indigenous Sal vegetation was slowly replaced by moist deciduous secondary bamboo
brakes. Some little amount of Sal trees are still present in the higher elevations of the forest.
However the possible decline in the wealth of medicinal plants as undergrowth as well as
the fragmentation of the natural habitat for threatened animals like the Hoolock gibbon are
of environmental concern. There is a very good diversity of medicinal plants in this Reserve
(Kanjilal et al., 1934-40). The topography of the reserve is primarily hilly although some
portion also comprises of plain-forested areas in the lower elevations. What is more
significant about this protected area is on one hand its close proximity to an urban human
habitation (Guwahati city) on the northern side of Garbhanga Range and on the other side
(touching the northern boundary of Rani range) the protected reserve lies adjacent to an
important wetland, the Deepor Beel (Beel = Lake) which is a freshwater lake and the only
Ramsar site in Assam (designated November, 2002). This wetland with a core area of 4.14
sq.kms. is a representative wetland type found within the bio geographic province ‘Burma
Monsoon Forest’ and is known for its exceptional avifaunal diversity (see Fig. 3.3 & Photo
1). It is a favourable staging ground on the migratory flyways for several species like the
Siberian crane including many endemic species. Amongst the 219 species of birds
(terrestrial and aquatic) recorded in the wetland some of the threatened species are the
Greater Adjugant stork (Leptoptilus dubius), Whistling teal (Dendrocygna javanica), Open-
billed stork (Anastomus oscitans), Little Cormorant (Phalacrocorax carbo), Shoveler (Anas
clypeata), Pintail duck (Amauvor sp.), Garganey (Anas querquedula), Pond Heron (Ardeola

22
grayii), CattleEgret (Bubulcus ibis), Brahminy duck (Casarca farruginea), River Tern
(Sterna aurantia), Pheasant tail jacana (Hydrophasianus chirurgus). There are 70 species of
endemic waterfowls. The other indigenous species recorded include 30 species of reptiles, 6
species of turtles and tortoises, 50 species of fishes, 20 species of amphibians (State Forest
Department Records, 2005). This bird paradise has earned the status of an Important Bird
Area (IBA) accredited by the Birdlife International, India in 1992 (Islam & Rahmani, 2004)
and being fringed by the mixed moist deciduous to semi evergreen forests of Rani-
Garbhanga on its southern edge exhibits a fascinating convergence of both wetland and
forest ecosystem. Fishing is carried out to unsustainable proportions and the area of the
wetland is slowly shrinking due to steady encroachment on its northern part. Massive
siltation that is a direct consequence of deforestation and quarrying activities in the adjacent
forests has emerged as a potential threat to the ‘beel’. It is an important storm-water
drainage system for Guwahati city and acts as a natural reservoir by absorbing the gush of
water during the rainy season from the hills of the Rani range which otherwise would have
created devastation in the adjacent plains by way of flash floods. The total area of the
wetland as recorded in 1996 was 41 sq.kms. So a ‘shrinking Deepor beel’ only means a
‘worsening flood situation’ in Guwahati in the future. The state Forest Department has
proposed 414 ha of the wetland for protection as a wildlife (Bird) sanctuary (Assam Forest
Policy, 2002).
There are mainly four small rivers, which touch some parts of the boundaries of
the Reserve forest, and innumerable perennial and seasonal streams, which finally drain into
the mighty river Brahmaputra (see Fig. 3.5). The direction of all the rivers and most of the
streams is from south to north. Along the streams there is a high density of canebrakes. The
perenniality of some of the rivulets have been lost where there are large-scale teak
plantation, illegal felling of trees and encroachments. This protected forest is considered to
be an ecotone – transition zone between the montane sub-tropical moist broadleaf forest of
Meghalaya Plateau and the Sub-Himalayan moist mixed deciduous forest of the Assam
valley (Champion & Seth, 1968). This could be the reason attributed to a good floral and
faunal diversity in the area. This Reserve having the status of a good elephant habitat
(Williams & Johnsingh, 1996) is proposed to be upgraded into an ‘Elephant Reserve’ (State
Forest Department Communication, 2005). Although the geographical area of the Reserve is
small for such kind of Reserve, what is significant is the physical location of this Reserve
which is adjacent to the hills of Meghalaya on southern side and the Deepor Beel on the
northern side thus serving as a natural ‘Elephant corridor’ by linking about 70 kms of the

23
Reserve from the hills of the Meghalaya plateau into the plains of the Brahmaputra valley
(see Fig.3.4). The Reserve is adjacent to Nakhalliyang Wildlife Sanctuary and Jirang
Unclassed State Forest (U.S.F) of Meghalaya and also the Jarasal Reserve Forest in Assam.
The second important feature is the contiguity of this Reserve with a wetland habitat
(Deepor Beel) that also forms a part of the elephant movement trail and convergence of two
different ecosystems.
Figure 3.1: Map showing the Eastern Himalayas Region comprising Northeast India, Bhutan
and Southern, eastern and central Nepal. It is a part of the Indo-Burma Hotspot as it was
originally described prior to the hotspots reappraisal (2005). Rani-Garbhanga Reserve forest
in Assam is indicated in the map.
Source: Ecosystem Profile, Eastern Himalayas region, WWF-US, Asia Program (2005)
RANI-GARBHANGA RESERVE FOREST; ASSAM, N.E. INDIA

24
Figure 3.2: Location of Rani-Garbhanga Reserve Forest/ Landscape in Assam, Northeast
India
Photo 1 : ‘ Deepor Beel’ – the 4.14 sq. Km (core area) wetland is the only Ramsar site
in Assam and is under proposal for being declared as a ‘Wildlife Sanctuary’
LOCATION OF RANI-GARBHANGA RESERVE FOREST IN ASSAM, NORTH-EAST INDIA
ASSAM
INDIA
GARBHANGA RANGE RANI RANGE

25
Figure 3.3: Map of the proposed ‘Deepor Beel Wildlife Sanctuary’. It has been designated
a Ramsar site and is located between the river Brahmaputra to its northern boundary and
Rani-Garbhanga Reserve forest to its southern boundary. The wetland is about 18 kms. from
Guwahati, the capital city of Assam (Map source: Director of Forest Communication,
Department of Forests, Assam, India).
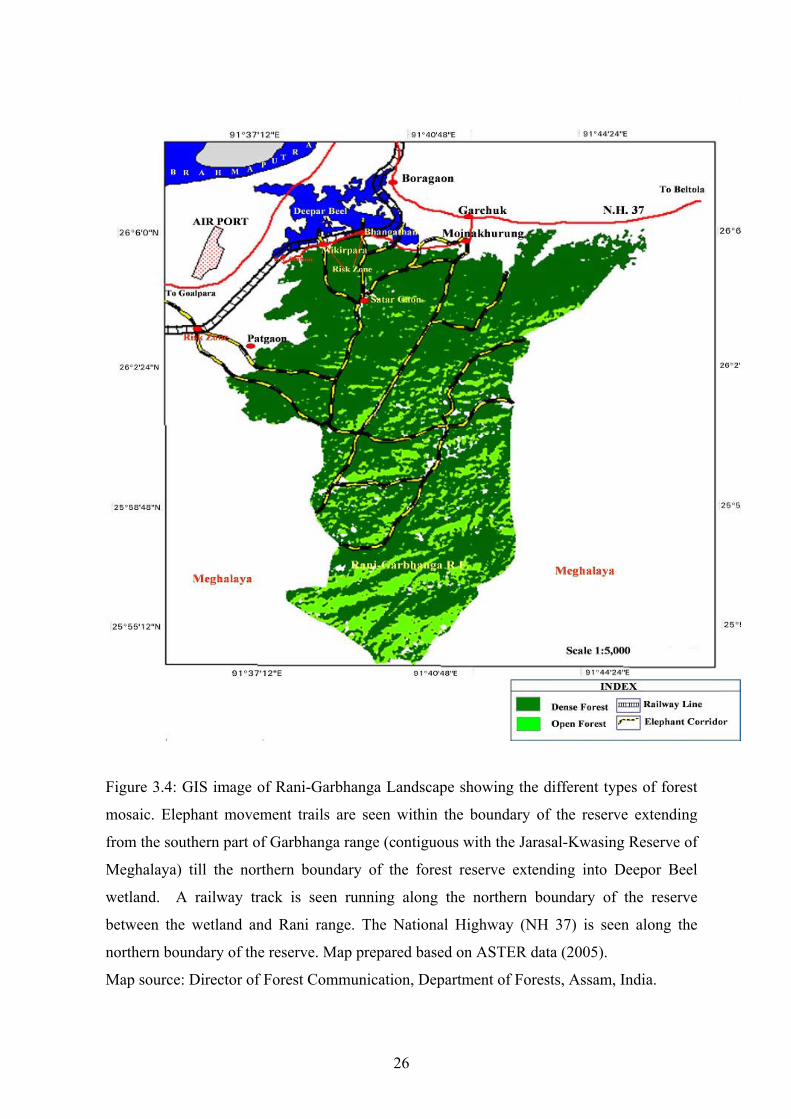
26
Figure 3.4: GIS image of Rani-Garbhanga Landscape showing the different types of forest
mosaic. Elephant movement trails are seen within the boundary of the reserve extending
from the southern part of Garbhanga range (contiguous with the Jarasal-Kwasing Reserve of
Meghalaya) till the northern boundary of the forest reserve extending into Deepor Beel
wetland. A railway track is seen running along the northern boundary of the reserve
between the wetland and Rani range. The National Highway (NH 37) is seen along the
northern boundary of the reserve. Map prepared based on ASTER data (2005).
Map source: Director of Forest Communication, Department of Forests, Assam, India.

27
Rani-Garbhanga Reserve or Landscape as it is commonly known is a disturbed
forest because of anthropogenic interferences like over-exploitation of the forest like illegal
logging practices to cater to the rising industrial demand, encroachment, deforestation,
increasing human settlements, over-grazing, forest fires, interference along the border with
Meghalaya - all these factors are leading to the fragmentation of the habitat of wildlife and
of particularly the larger mammals like elephants, gibbons and tigers and decline in the
natural vegetation cover which is also primarily affecting the butterfly community within
the reserve. Habitat shrinkage is also one of the major causes for regular elephant
depredation in the adjoining fringe villages.
Photo 2 : Small-wood collection by the local villagers from the fringe areas is
a common problem within the forest reserve
The Forest Department of Assam has recently introduced the Joint Forest
Management plan (Assam Forest Policy,2004;WWF India, 2002) and Rani-Garbhanga
Reserve forest also comes under this plan. The plan mainly aims at supporting the
livelihoods of the forest fringe communities through improved natural resource management
with community participation and simultaneuosly protecting the forests from degradation.
The prime targets of this plan are Sal regeneration, raising plantations of more valuable

28
indigenous species, soil and water conservation, improvement of habitat for the Asiatic
elephants, leopards, barking deers and preserve the gene pool by adopting a system causing
least disturbance to these forests. The other management strategies include bringing
degraded areas close to habitation or encroachment under forest cover and raising
plantations with people’s participation, meet the household requirements of the participants
and economic upliftment of the participants by way of sharing the yield with the
Government. The bamboo areas of the Reserve forest have also been brought under the plan
to meet the requirements of some of the nearby Paper mills of the state of Assam.
Photo 3 : A typical ‘bamboo forest’ habitat type within the forest reserve Bamboo (Dendrocalamus hamiltonii)

29
Figure 3.5: Map of Rani-Garbhanga Landscape showing the drainage pattern and butterfly
collection points within the study area with superimposed GPS points indicating the
geographical position of the sampling locations during the two-year study period from
2003-2004.

30
3.2 Butterfly-Plant interaction:
There is a direct ecological relationship between butterflies and plants and this
phenetic relationship may make floral diversity an important precondition for butterfly
diversity (Ehrlich, 1958). Butterflies and plants are predicted to show congruent patterns in
species diversity due to interactions involving herbivory and pollination (Opler & Krizek,
1984; Scoble, 1992) and their history of close evolutionary relationships (Ehrlich & Raven,
1964). Plants are essential resource for butterfly survival, providing nutrients for larvae and
adults. Larvae are intimately associated with their host-plants (Gilbert & Singer, 1975;
Chew, 1980; Porter, 1992; Ravenscroft, 1994). Most butterflies have strong larval food
preferences. Some species feed on only one plant species while others feed on a few closely
related plant species and in some cases large taxonomic groups of butterflies feed almost
exclusively on a single plant family. The larvae of some butterfly species feed on a broad
range of plants from unrelated families. Again the populations of the same butterfly species
in different locations may use different larval food-plants (Dethier & Fuller, 1961; Singer et
al., 1971; Breedlove & Ehrlich, 1968). As the larvae remain upon the host plant throughout
most of their existence, the food-plant is likely to be the key factor in the niche of most
butterfly species since to a large extent it is also the shelter, substrate, or habitat upon which
allelo-chemical co-evolution (Ehrlich & Raven, 1965; Whittaker & Feeny, 1971) of the
entire ‘component community’ takes place (Root, 1973). Likewise, adults require some
plant species as nectar sources (Murphy, 1983; Shreeve, 1992; Holl, 1995; Loertscher et al.,
1995). This dependence on plants makes butterflies highly habitat specific. The vegetation
can also play an important role for butterfly survival, offering particular structural elements
for sun basking or mating and determining certain suitable microclimates (Dover et al.,
1997). Furthermore, the vegetation responds to a large range of environmental and historical
factors like altitude, temperature, precipitation, topography, land use, soil type,
microclimates (Ellenberg et al., 1992). Therefore vegetation is the main physical interface
between butterflies and their environment and a strong relationship between butterfly
species and plant communities can be expected (Dufrene et al., 2003). Studies conducted on
both wide-ranging and sedentary butterflies have shown strong associations between the
distribution of butterflies and of oviposition plants and nectar sources (Gilbert, 1971;
Ehrlich & Gilbert, 1973).
Butterflies are important pollinators that help in plant propagation and
therefore a positive correlation between butterfly and plant diversity can be expected (Sharp

31
et al., 1974). Many species of butterflies are restricted to unique ecological conditions, very
often being sensitive to thermal conditions and are known to show fast responses to climate
fluctuations. This makes them valuable indicators of ecosystem quality and change.
Therefore butterflies can be used as suitable ‘Bioindicators’ in environment monitoring.
Some recent studies have shown the changes in Lepidoptera communities caused by various
types of disturbance in tropical rainforests (Bowman et al., 1990; Leps & Spitzer, 1990;
Thomas, 1991; Holloway et al., 1992; Spitzer et al., 1993; Kremen, 1994; Kremen et al.,
1994). Plant diversity is known to contribute to habitat complexity for butterflies and other
insects by providing microclimate variation (Strong et al., 1984). The knowledge of
butterfly-plant interaction is also an important tool for their conservation and management.
Therefore a study on the climate, vegetation and soil profile of the study area is important in
determining the suitability of the habitat for the butterflies.
3.3 Climate, Vegetation and Soil:
3.3.1. Climate conditions in the study area :
Rani-Garbhanga Reserve forest experiences a tropical monsoon type of
climate. There are three seasons- the Pre-Monsoon period from February to April, Monsoon
(Rainy) period from May to October and the Post-Monsoon period from November to
January. The Post-Monsoon and the Pre-Monsoon periods are described as the Dry Season
while the Monsoon period is described as the Wet Season. The monthly mean maximum
temperature, rainfall and humidity data for the years 1996-2000 indicates the typical tropical
monsoon type of climate in the study area characterised by ≥ 250 mm rainfall during the
peak monsoon period (Wet season) from May to August with no significant variations in the
mean maximum temperatures during the wet and dry periods (See Fig. 3.6 : Appendix 3:
3.1).

32
0
50
100
150
200
250
300
350
Janu
ary
Febr
uary
Mac
hA
pril
May
June
July
Aug
ust
Sep
tem
ber
Oct
ober
Nov
embe
rD
ecem
ber
Months
Mea
n ra
infa
ll (m
m)
0
25
50
75
100
125
150
175
Mea
n m
axim
um te
mpe
ratu
re
(0 C) a
nd re
lativ
e hu
mid
ity (%
)
Rainfall (mm) Temperature(0C) Humidity (%)
Figure 3.6: Ombrothermic diagram (P=2T) for the study area during January to December
(mean of years 1996-2000)
The monsoon period is the longest and is characterised by frequent
thunderstorms and approximately 90% of the annual precipitation occurs during this wet
season. Rains are received by the Southwest as well as the Northeast monsoons, but
maximum rainfall is received from the Southwest monsoon (May-October). During the
Post-monsoon period (Dry season) which normally covers two ecologically dry periods in a
year, rainfall is received from the Northeast monsoon and this is about 7% distributed over
an average of 16 days.
050
100150200250300350400450
Janu
ary
Febr
uary
Mar
ch
Apr
il
May
June
July
Aug
ust
Sep
tem
ber
Oct
ober
Nov
embe
r
Dec
embe
r
Months
Mea
n ra
infa
ll (m
m)
0
25
50
75
100
125
150
175
Mea
n m
axim
um te
mpe
ratu
re
(o C) a
nd r
elat
ive
hum
idity
(%)
Rainfall (mm) Temperature (°C) Humidity (%)
Figure 3.7 : Ombrothermic diagram (P=2T) for the study area during January to December
(mean of years 2001-2005)

33
A comparison of the monthly mean rainfall, temperature and humidity data
for the period of 1996-2000 (Fig. 3.6) with that of the period 2001-2005 (Fig. 3.7) shows
that the recorded mean monthly rainfall for 2001-2005 during the peak monsoon period
(May to August) was ≥ 300 mm and this did not vary greatly from that of 1996-2000 during
the same peak monsoon period . However there were no significant variations in the mean
maximum temperature and humidity between the two periods (Appendix 3: 3.1 & 3.2). All
data pertaining to the climate conditions in the study area were obtained from the Regional
Meteorological Research Station, Guwahati, Assam, India.
3.3.2. Vegetation and Soil
The general vegetation of the study area is described as ‘Mixed Moist Deciduous’
type and there are five forest types primarily classified within the Reserve according to the
‘Revised Forest Type’ classification of Champion & Seth (1968) and the description of the
forest types within the Reserve are as per the records of the Department of Forests of
Assam, 1990.
a) The Eastern Hill Sal forests: These forests mainly occur in the hilly areas of the
Reserve. Pure patches and groups of Sal (Shorea robusta) occur in ridges and spurs but
these pure patches are intersperesed by mixed deciduous forests in the middle slopes and
valleys and in damp patches like the banks of the perennial streams by evergreen forets.
Scima wallichii is the common associate of Sal (Shorea robusta) and the other dominant
associates in the top canopy are Shorea assamica (endemic species), Lagerstoemia
parviflora, Lannea corromandelica, Vitex pedicularis, Castanopsis indica, and
Dipterocarpus macrocarpus.
Middle storey is composed of Holarrhena antidysenterica, Tricalysia singularis,
Oroxylum indicum, Salix tertrasperma, Malletus albus, Gmelina arborea, Careya arborea,
Semicarpius anacardium. Clumps of stunted bamboo (Dendrocalamus hamiltonii) occur on
the ridges and slopes.
The ground cover varies considerably according to the canopy opening. In fairly
open canopy and near the habitations, Imperata cylindrica is the common species. The most
common shade tolerant species in locations having closed canopy is Sau grass
(Microstegium ciliatum). Other species include Eupatorium odoratum, Carex stroementitia,
Thysanllaena maxima.

34
Some of the common climbers found in this protected reserve are Dalbergia
tamarindifolia, Dalbergia remosa, Ficus scandens, Caesalpinia crista, Bauhinia anguinea,
Jasminum coaractatum, Mucuna prurita, Clematis cadmia, Paederia scandens, and
Stenochleana palustris.
This forest type covers an area of 3187 hectares in Garbhanga range and 1769 hectares in
Rani range.
b) Moist Mixed Deciduous forests: In this forest type the principal species forming the
top canopy are Scima wallichii, Vitex peduncularis, Tetrameles nudiflora, Sterospermum
personatum, Lagerstoemia parviflora, Sterculia vilosa, Syzygium cumini, Gmelina arborea,
Spondias mangifera, Diospyros variegata, Bridelia retusa, Machilus bombycina, Albizzia
lebbeck, A.chinensis, Ficus hispida, Sapium baccatum.
In areas, which were subjected to heavy burning in the past, the middle storey is
not well defined. However at lower elevations in the valleys, the middle storey is
predominanatly occupied by the bamboos (Dendrocalamus hamiltonii). In the hill slopes
under close canopy, Sau grass (Microstegium ciliatum) occurs as ground cover. In the lower
slopes Coffea bengalensis occurs under close canopy.
Along the lower slopes of the foothills, thatch grass (Imperata cylindrica)
predominates as ground cover in the open patches. Other common species forming the
ground cover are Eupatorium odoratum, Holmskioldia sanguinea, Phyllanthus simplex and
Lagerstoemia parviflora. Under bamboos there is practically no ground cover.
Occurrence of climbers is higher in this forest type and some of the dominant
species are Butea parviflora, Millettia auriculata, Smylex macrophylla, Acacia pinnata,
Dalbergia remosa, and Aristolochia indica, A.tagala.
These forests cover an area of 10,664 hectares in Garbhanga range and 1396 hectares in
Rani range.
c) Evergreen patches: This type of vegetation is not very common and occurs only in
patches, mainly in the hill slopes and shady moist pockets along the banks of perennial
streams. Such patches are mostly situated in locations far away from habitations and not
subjected to any kind of human interference like shifting cultivation, grazing, forest fire and
stone quarrying activities. According to Champion & Seth (1968) such type of vegetation is
classified under Assam valley Tropical Semi-evergreen forest, 2B/C1. Only small patches of
such forests now remain in Assam and are found along the Indo-Bhutan border and along

35
the border of Assam and Meghalaya. They are mostly confined to protected areas as like
here in Rani-Garbhanga. The typical evergreen tree species are Syzygium, Cinnamomum,
Artocarpus and Magnolia sp. while the deciduous species include Terminalia myriocarpa,
T.citrina, T.tomentosa, Tetrameles sp. and Stereospermum sp. These canopy trees are 20-
30m high. However in the study area the climax formation in such patches was mostly
represented by Garcinia species, Dysoxylum sp., Castanopsis sp., Artocarpus chaplasa,
Echinocarpus sp., and Ficus species. The middle storey is occupied by the bamboos
(Dendrocalamus hamiltonii). The common species forming the ground cover are Alpinia
speciosa, Phalogacanthus sp., Sau grass (Microstergium ciliatum), Pollinia ciliata,
occasional canes and ferns. Climbers are not very abundant in this type of patches.
It has an area of only 13 hectares in Rani range.
d) Secondary Moist Bamboo Brakes: Large tracts of bamboo brakes occur along with the
Moist Mixed Decidous type in the higher elevations. They occur in great profusion in damp
locations especially along the perennial and seasonal streams. These brakes have been found
to extend into the evergreen patches in the hill slopes. The principal species of bamboo in
these brakes is Dendrocalamus hamiltonii. The growth along the hilly streams is so
gregarious that it almost forms a continuous belt of bamboo and it is difficult to distinguish
one clump from the other. It is seen lately that the bamboos also occur in the higher
elevations subjected to intensive ‘jhum’ (Shifting cultivation).
e) Secondary Euphorbiaceous Scrub: The extent of area under this type is very limited and
occurs in the abandoned areas of ‘Jhum’ (Shifting cultivation) which have been left to the
mercy of nature by the farmers after raising 2-3 crops continuously. This type is more
common in the Garbhanga range and particularly in the southern part of the range. The
pioneer species is Macaranga denticulata to be succeeded by Trema orientalis, Albizzia
chinensis, and Callicarpa arborea. The undergrowth is composed of some dominant species
like Solanum khasiana, Mimosa himalayana, Abroma augusta.
It covers an area of 1354 hectares in Garbhanga range while that in Rani range is 312.48
hectares.
Forest fires occur almost every year in all the accessible compartments of the
Reserve. Söme of these are natural fires associated with the activities of the ‘shifting
cultivators’ and others are associated with the dry climatic conditions particularly during the
months of March and April. However the technique of ‘Controlled burning’ where
followed meticulously by the forest authorities has been found to have a positive effect on

36
propagation and advanced growth. It is also advantageous for controlling the understorey
overgrowth, which could otherwise lead to disastrous wildfires (Roy, 2003).
Another remarkable feature is the climber infestation, which is heavy in the
Moist Mixed Deciduous forests and moderate in the Sal areas of the Reserve. Climbers
cause considerable damage in the form of producing weak and forked trees by strangling the
crowns and reducing their usefulness as mother trees as also reducing the amount of foliage.
During Pre-monsoon and Monsoon periods, damage in the form of high winds bringing
down trees heavily infested by inter-twining climbers is very common. Sporadic instances
of Ficus scandens (woody climber) strangling and killing trees are found. There are
incidents of Sal trees being infested by the fungus Polyporus shorea resulting occasionally
in the death of the trees. Incidences of defoliator damage are also to be found but mainly in
the dry season. Grazing by domestic animals from the forest villages is very common within
the plain areas of the reserve, as all other grazing fields around the Reserve have been
opened up for cultivation. The heavily grazed locations have been found to be devoid of
regeneration and undergrowth. Legally limited grazing is permitted in the buffer zone.
There are few records of wild and domestic elephants damaging standing trees both in the
forest and in settlements. Monkeys are also known to cause a certain amount of damage by
breaking the inflorescences of Sal trees and pulling up young seedlings. Illegal felling of
trees for meeting the domestic needs of the forest villagers is however negligible compared
to the illegal logging practices by the timber traders which is posing a more serious threat to
the declining forest cover. Practically there is no proper demarcation of the reserve forest
boundary and as the reserve has an inter-state boundary coupled with a very hilly terrain
from the Assam side, it becomes even more difficult for the forest guards to tackle
unscrupulous logging activites. Due to the advantageous location of this reserve to
Guwahati city there is a continuous widened demand–supply gap of timber. The 36 kms
motorable ‘Fair-weather’ road maintained by the Forest department is working more to the
advantage of these timber traders. Moreover there is also a 45 km walking forest path
running parallel to the perennial stream in Garbhanga range, which is extensively used by
the local tribals from both Assam and Meghalaya.
The GIS data on the land-cover classes of 1998 with that of 2002 has indicated a
marked increase in the area of forest villages and mixed built-up land engaged in
commercial cultivation as well as the cropland inside the forest. The area under Kharif
(Summer) cultivation has declined. The total area under encroachment in Garbhanga range
is 410 hectares while in Rani range it is 245 hectares. However the most disturbing trend is

37
the increase in the areas of shifting cultivation in particularly the southern part of the
Reserve adjoining Meghalaya over a period of 5 years.
The geological formation of Rani-Garbhanga Landscape excepting the recent soil
and alluvium belong to the Archean gneisses complex. The oldest formation is composed of
gneissic and schist which are extensively intruded by granites. Beds of conglomerates are
frequently found at the foot of the hills. The study area is geologically situated on an
outlying area of the Shillong plateau. The principal rocks of this outlying portion are acid
and basic gneisses which have been metamorphosed by intruded igneous rocks. The soil
type is mainly alluvial although in the higher elevations it is red laterite type.
3.4. Forest Management and Biomonitoring:
The Government of India issued guidelines in June 1990 and adopted the ‘Joint
Forest Management’ (JFM) under the ‘National Afforestation Programme’ for
conservation of forests with clearly identified duties and functions for ensuring protection of
forests. The Government of Assam adopted the ‘Assam Forest Policy’, 2004 which
emphasizes the JFMs to graduate to ‘Community Forest Management’ aiming at
sustainable forest management. The main objective is to ‘support the livelihoods of the
forest fringe communities through improved natural resource management with community
participation’.
Under the guidelines of the National Afforestation Policy (1990), Rani and
Garbhanga Reserved Forests (R.F) are managed separately under the current Working Plan
(2002-2003 to 2011-2012) prescriptions for different Working Circles (W.C) instituted such
as - Sal Regeneration Working Circle, Miscellaneous Plantation Working Circle, Bamboo
Overlapping Working Circle, Biodiversity Working Circle, Watershed management and
Soil Conservation Working Circle and JFM (Joint Forest Management) Working Circle.
3.4.1. Sal Regeneration: Sal is one of the few naturally durable timbers in India and is the
principal marketable product of this Reserve forest. As this Reserve is adjacent to Guwahati
city, there is a continuous widened demand supply of timber and the adverse effect is felt
upon this reserve. The main objective of this management is to:
• Arrest depletion in growing stock of Sal by regulating the yield and boost natural
regeneration of Sal.
• Improve the depleted growing stock of Sal under intensive system of management
with the aim of attaining a normal forest in the future.

38
• Conserve and improve the existing growing stock of Sal in areas other than those
marked for regeneration operation.
• Reclaim all Sal areas, which had been lost to invading bamboos and other
miscellaneous species due to human activities.
3.4.2. Miscellaneous Plantation: Human interferences in the form of illegal felling of trees
by the adjacent forest villagers, encroachment by migrant population from the adjoining
hilly regions of Meghalaya leading to springing up of pockets of habitations inside the
reserve forest, ‘jhum’ or shifting cultivation, large scale deforestation in the neighbouring
forests of Meghalaya and the raising of pure teak plantations in the past have disturbed the
ecosystem and caused shrinkage in the habitats of large animals. The main management
objectives under this circle are:
• Conservation and protection of existing forest cover
• Rehabilitate the depleted forest cover by raising plantations of valuable indigenous
species without disturbing the forest ecosystem.
• Replacement of existing teak plantations by indigenous species in a phased manner
and thus remove all the demerits of monoculture.
3.4.3. Bamboo Overlapping: This working circle comprises of the bamboo bearing areas
under the other circles. There is wanton destruction of the bamboo cover by the forest
villagers and encroachers to meet their basic needs like building material for their houses
and fodder for cattle. A substantial supply also goes to some of the local paper-mills.
However bamboos are essential to the forest ecosystem especially in hilly forests as like in
the study area where they not only protect the hilly slopes from soil erosion but are the ideal
habitats for many endangered species including birds and also food for elephants and
Hoolock gibbons. Bamboo is an integral part of the cultural, social and economic traditions
of both urban and rural Assam and particularly the poverty-stricken ethnic tribals in the
forest villages who are dependant upon many forest resources for their livelihood including
bamboos. The major objects of management in this circle include:
• Maintain a sustained yield and regular supply of bamboo to the paper mills of the
state. Only areas where there are continuos stretches of bamboo have been
considered for commercial exploitation.

39
• Maintain ecological balance by prevention of unlimited cutting and removal of
bamboos.
• Prevent erosion and stabilise watershed areas of the reserve covered by bamboo
forests.
• Meet the demands of the local people for construction of their dwellings, agricultural
implements, fencing, cottage industries etc. A sustainable use will be maintained
through encouragement of ‘cultivation and extraction of bamboo’ by scientific
management of forest based bamboo resources, systematic and block plantation of
commercially significant species and improved harvesting and post harvest
practices.
• Enhance employment and income generating opportunities using bamboo and cane
as the prime resource
3.4.4. Biodiversity Conservation: The closed canopy as well as the open forests of this
reserve is included in this plan and the main objectives are:
• Protect the forests and allow nature to take its own course in rehabilitating the
forests by the re-introduction of some indigenous plant species.
• Preserve and improve the habitat of the Asiatic elephant, leopards, barking deers and
Hoolock gibbon.
• Study and record the degree of success achieved in regeneration and succession of
various species.
Census of animals – Census of elephants and tigers were carried out in 1993 and 1997 and
the records showed the elephant figures at 403 and 116 and tigers at 5 and 3 respectively.
Census of leopards in 2000 showed presence of 10 males, 11 females and 4 cubs inside the
reserve forest and 1 male, 1 female and 1 cub outside the reserve forest..
3.4.5. Watershed management and Soil Conservation: This Reserve forest forms only a
small part of the catchment area of the rivers and streams flowing through and around this
region. The sources of most of these rivers and streams are in Meghalaya. Shifting
cultivation (Jhum) which is seen to be more widely prevalent in the southern part of
Garbhanga range bordering the hills of Meghalaya has its own damaging effects pertaining
to soil erosion in the hilly areas of the reserve . However a positive effect is that due to
favourable climatic conditions the abandoned ‘Jhum’ areas quickly regenerate resulting in

40
less quantity of soil run-offs. A more serious threat is posed by some of the teak plantations
in the hilly areas of the reserve, which have very thin undergrowth, and this has resulted in
much heavier erosion as compared to the ‘Jhum’ areas. Following heavy rainfall during the
monsoon period, high degree of siltation has occurred in the adjoining low-lying swamps
and depressions as well as in the ‘Deepor Beel’, and the elevation of the riverbeds. This has
increased the impact of flash floods in urban settlements as like in Guwahati city. Therefore
the major objective of this plan is to reduce disturbance by way of restricting felling and
secondly is the thinning of the congested teak plantations in order to encourage good
undergrowth.
3.4.6. Joint Forest Management (JFM) / Peoples’ Participatory Plantation Program:
This plan has been constituted under the National Afforestation Program, 1990
(Conservation with communities in the biodiversity hotspots of India, WWF India, 2002)
with a view to execute and materialise the policy of the government by way of active
participation and involvement of local people for regeneration, maintenance and protection
of forests owned by the state but appropriated by the local communities. The working area
covers both peripheral degraded as well as some of the encroached areas of the Reserve.
The economic prosperity of the surrounding population is intimately associated with the
proper management of this Reserve. There are almost 8 different ethnic tribes living in the
fringe villages and although their agricultural customs vary to a certain extent, all of them
cultivate paddy in the low-lying land adjoining the reserve. They raise only one crop in a
year from June-July to December. The cattle maintained by these villagers are entirely
dependant on the reserve for their grazing till paddy is harvested. The basic needs of the
villagers like firewood, thatch, bamboo, and cane are met from this reserve. So to stop
destruction of the forests and decrease encroachment, this plan intends to create a buffer
with peoples’ participation. The local people are therefore involved in converting the
encroached and degraded areas into productive land so as to meet their basic needs on
sustained basis. Their involvement in regeneration and other silvicultural operations is being
implemented and the government in return provides a subsidiary income to the local
villagers in the form of wages. However most of these locals are poverty stricken and do not
have the patience to wait for a long time to get their due share of earnings from raising and
protecting the plantations for which they had worked hard. Therefore such species have
been chosen so that the villagers minimum rights can be met right from the 5th year of
plantation in a sustained manner. So by generating a sustainable interface between the

41
Forest department and the local community it can be a possible way through which the
interests of the people and long-term sustainability are harmonised in a mutually supporting
manner.
As a part of the biomonitoring program to study the effects of forest
management, population survey of larger herbivores like elephants and gibbons have been
carried out on permanent line transects to study different habitat utilization patterns and the
current elephant population is 502 (Forest records, 2005). Although the reserve has been
listed as a disturbed area, it has still good conservation potential especially with respect to a
good plant diversity including medicinal plants, mammals and birds. There is no previous
documentation on the butterfly fauna in this area, but a comprehensive inventory showing a
checklist of the available species of butterflies in the reserve also highlights the potential of
this protected area as a good “butterfly reserve”. However the most significant feature about
the management strategy for this reserve is its potential for being managed as a good natural
“elephant corridor”. The Deepor beel on the northern side of the reserve is the perennial
water source for the elephants. Large herds also come down from the adjoining hills of the
Meghalaya forests for drinking, bathing and eating the aquatic plants in the lake. Protection
of the habitat will help to reduce the man- elephant conflict and at the same time envisage
elephant conservation through local community involvement (Daniel et al., 1995).
Elephants influence forests at two main levels – as opportunistic frugivores, by directly
effecting the dispersal and regeneration of certain plant species; and by trampling, debarking
and disturbing the forest (Hoft & Hoft, 1995; Johnstone, 1967; Laws et al., 1970, 1975;
Sheil 1996; Struhsaker et al., 1996; Wing & Buss 1970). In light to moderately logged
forests, the elephants were found to use the forest gaps more than the closed canopy areas
for foraging and the selective browsing of young trees by elephants affected the rates of
forest regeneration, growth form and species composition (Struhsaker et al., 1996).
Therefore the elephants can be taken as a keystone species for the effective conservation
and management of this reserve. The WWF-India under its current elephant conservation
project in Assam has also targeted Rani-Garbhanga Reserve for protection as an ‘elephant
reserve’. Several environmental organisations have also sent proposals to the state
government for upgrading Rani-Garbhanga Landscape into an “urban wildlife sanctuary” as
the proximity of this protected area to the capital city can also contribute towards the
development of ecotourism. The division of International Conservation (US Fish and
Wildlife Service, 2006) has also proposed for the strengthening of the conservation of
Hoolock gibbon in Rani-Garbhanga Landscape, gather baseline information on the

42
biodiversity of this sanctuary along with constructing one anti-poaching camp and designing
a strategic conservation and management plan for the landscape.

PART II METHODS AND RESULTS CHAPTER 4 : METHODS
CHAPTER 5 : RESULTS

43
CHAPTER 4 : METHODS
4.1 Study Sites
A 50 ha study area covering five different sites or locations were selected for
butterfly sampling and conducting field observations. All the five study sites were selected
using satellite imagery. Sites S1, S2 and S3 were located in Garbhanga range, sites S4 and
site S5 were within Rani range. The levels of disturbance in the five study sites were not
quantified but were evaluated on a visual scale. The sites were partially to heavily disturbed
areas with respect to human settlements, grazing, shifting cultivation, teak monoculture,
earth-cutting, small wood collection by local villagers, illegal selective logging by timber
smugglers and presence of stone-quarry as described in Table 4.1. However movement of
people and small logging were observed to be the main disturbance parameters.
Table 4.1: Study sites in Rani-Garbhanga Reserve forest
Study site
in map
Geographical
position
Area in
hectares
Habitat type and
landscape element
Altitude
(metres)
above MSL
Level and
type of
human
disturbance
S1(Garbhanga) 26°05’26.71”–
91°46’39.01”
15 Mixed-moist deciduous
Secondary Sal
forest with good cover of
grasses
102 Partially disturbed
Human settlement,
earth-cutting, small
wood collection
S2 Garbhanga) 26°03’46.49’-
91°43’41.56”
5 Mixed-moist deciduous
secondary forest with
intermittent tracts of
Bamboo brakes. Closed
canopy with trees > 20 m in
height. Abundance of
climbers
130 Partially disturbed
Stone-quarrying,
earth-cutting,
selective logging

44
S3 (Garbhanga) 26°01’39.18”-
91°39’03.91”
5 Secondary euphorbiaceous
scrub with grasses growing
upto 10-15 cm on the rocky
slopes and hills in the areas
near to the abandoned
patches of shifting
cultivation.
170 Heavily disturbed
(Shifting
cultivation, illegal
logging
S4 (Rani) 26°01’52.20”-
91°35’51.32”
10 Degraded secondary
deciduous forest edge with
teak plantation, Sal
regeneration, cropland,
household plantation, with
shrubs and grasses,
scrubland.
100 Heavily disturbed
(Teak plantation,
selective logging,
grazing, road
construction,
human settlements
S5 (Rani) 26°04’49.77”-
91°40’03.07”
15 Secondary mixed
deciduous forest near
human settlement
60 Heavily disturbed
(Forest village,
selective logging,
intensive grazing)
Notes: The area measurement for each study site was calculated using the GPS data. The changing
patterns of land-use and forest cover associated with disturbances can be observed in the GIS maps
on Rani-Garbhanga Reserve Forest (see Figs. 4.1 & 4.2, and Table 4.2).
4.2 Satellite Image Preparation, Interpretation and Area Estimation
Satellite remote sensing has played a key role in generating information about forest
cover, vegetation type and land use changes (Houghton & Woodwell, 1981; Botkin et al.,
1984). Satellite data have also been used to quantify tropical deforestation and habitat
fragmentation in the spatial context (Skole & Tucker, 1993). Changes in shape and size of
forest fragments can be assessed using satellite data and in a GIS environment. Remote
sensing has also been applied in the present study. Survey of India topomaps on 1:50,000
scale was first used for preparation of the base maps.
Satellite images from IRS – 1C and 1D Linear Imaging Self-Scanner System (LISS –
II and III) sensor with ground resolution of 36.25m x 36.25m were used for classification of

45
vegetation cover. The image scale for the satellite images was 1:30,000 and geo-referencing
of the master scene has been carried out on this scale using ancillary data and GPS
locations.
Landcover classification was done within the study area using remotely sensed
satellite imagery (IRS IC LISS III).
Visual interpretation technique was employed to deliniate different land-cover
classes from the digital satellite data (False Colour Composite) under GIS environment
(ARC GIS 9.1).
The land-cover classes were identified as per a standard classification system
generated by the Department of Space, Government of India. The areas under different land-
cover classes were calculated from the map by the facilities with the GIS (which are
presented in the Table 4.1).
Satellite images were also visually interpreted to show the details of the drainage
pattern in the study area and two separate images have been prepared with one image having
the GPS locations superimposed on the actual image (see Fig. 4.2).
The GPS data collected from the field in March 2003 were incorporated as “Point
Information” (latitude and longitude) in a separate layer, which were superimposed onto the
satellite imageries as well as land-cover maps. Based on actual field data collection on the
swallowtail butterflies and vegetation, 24 points covering the 5 study sites within the study
area are shown in the imagery maps. Comparative GPS data from 2 years – 1998 and 2002
was acquired to assess the change in forest cover and land-use patterns in line with the
changing trends of disturbance (see Table 4.2).
Altogether three types of input maps – topomap showing the protected forest
boundary and geographic location of the study area, drainage pattern map and
vegetation/land-use cover map were prepared for further studies. The analysed version of
the vegetation and land-use pattern of the protected reserve is presented in Table 4.2.

46
Table 4.2: Land-use analysis of the study area in hectares (1998 and 2002)
Area in hectares Landscape type
1998 2002 Moist Deciduous forest 21561.39 21230.4 (includes the river area
of 189.88) Agriculture (Kharif/Summer crops) 210.14 12.3 Cropland (inside forest) 30.00 39.12 Marsh/Swampy area 3.6 9.21 Mixed built-up land (Residential, Planted vegetation and commercial area)
54.5 72.5
Household plantation 26.56 202.3 Open forest 1.36 33.46 Scrub forest 53.23 18.35 Forest plantation 13.04 *Land with scrub 41.82 Shifting cultivation 480.5 796.27 (Current) Shifting (Abandoned) 691.71 River 189.88 Total 22611.16 23160.48
Notes: * Land outside the notified area as per the land–use classification norms. The
interpretation for 1998 has been carried out visually from IRS LISS II data of 1998.
Data source for 2002 are from IRS 1D LISS III FEBRUARY (2002). The above
interpretation and preparation of the GIS images were done in the “Assam Remote
Sensing Application Centre, Guwahati, Assam, India.

47
Figure 4.1: GIS image showing the land-use pattern in Rani-Garbhanga Reserve forest in
1998.. GPS points superimposed on the image show the data collection locations pertaining
to butterfly identification, vegetation survey and general field observations during initial
phase of research work in 2001-2002.

48
Figure 4.2: GIS image showing the change in the land-use pattern associated with human
disturbances within the forest reserve over a period of four years (1998-2002). Study sites
S1, S2, S3, S4 and S5 selected for initial phase of research study associated with vegetation
and swallowtail butterfly (Papilionidae) identification and final phase of study for
vegetation and butterfly sampling are shown in the map. GPS points superimposed on the
S1
S2
S3
S4
S5

49
image indicate the sampling points pertaining to the geographical position (latitude and
longitude), altitude and general field observations.
The GIS images of the study area over a period of five years from 1998 to 2002
shows a good forest cover along with the different land-use patterns and also the changing
trends of disturbance in the protected area primarily associated with deforestation due to
human activities. The satellite data on 1:50,000 scale are found to some extent adequate for
classification (with bare eyes) of degraded/scrub (<10% crown), open (10-40% crown) and
dense/closed (>40% crown). The satellite images indicated an increasing trend of
disturbance and deforestation within the boundaries of the reserve primarily caused by
illegal encroachment, shifting cultivation and other anthropogenic interferences in the form
of the fringe forest villages and disturbances caused by one pocket of habitation (Garo tribal
village) inside the reserve (see Figs. 4.1 & 4.2))
4.3 Sampling
4.3.1 Sampling period
The study was conducted for a period of two years from 2003 to 2004 covering 2
different seasons – Dry season (Post monsoon) from January to March and Wet season
(Monsoon) from August to October. All surveys and samplings were limited to sunny days,
under calm to light wind conditions when mean atmospheric temperature was about 32°C,
average humidity was about 80%. The following hours of the day were selected for field
survey and collection of butterflies: Early morning hours – 7.00 h to 13.00 h and late
afternoon hours – 14.00 h to 17.00 h.
4.3.2 Sampling design
In the study area, based on the observed levels of disturbance and the satellite
images, we considered such factors like the degree of canopy closure, availability of
sunlight on the forest floor and presence of both natural and man-made gaps, and
accordingly each of the five study sites were demarcated into two zones for the sampling of
butterflies - a) Scattered forest (SCF) and b) Closed forest (CF)
Line transect sampling method (Pollard 1977, 1984; Thomas 1983; Pollard & Yates
1993) was followed in the five study sites for monitoring the swallowtail butterfly
community and predicting the species diversity and distribution pattern of the Papilionids
within the forest reserve. This method is now extensively used to survey and monitor
butterfly populations and communities (Shreeve & Mason, 1980; Erhardt, 1985; Warren et

50
al., 1986; Yamamoto, 1988; Ishii, 1993; Pollard & Yates, 1993) and has been applied in
Vietnam in previous work (Spitzer et al., 1987; 1993; Vu & Dang, 2002). As the protected
reserve is divided into two ranges for management purposes, therefore butterfly sampling
was done separately for the study sites of Rani and Garbhanga ranges (see Fig. 4.3). The
records were based on visual sightings during the transect walk, active captures using nets,
counts from ‘mud-puddling’ sites along the stream and areas of human habitation located
along the transects. The sampling period covered the flying periods of most species. Some
short visits were also made in other parts of the years for deriving complementary
information.
Figure 4.3: Schematic plan of the sampling design for conducting butterfly sampling within
the study area of the protected forest reserve during the two-year study period.
Rani-Garbhanga Reserve Forest Landscape
Total area = 23,230.58 ha
Garbhanga range Area =18,860.58 ha Number of sampling days = 77
Rani range Area = 4370 ha
Number of sampling days = 54
Number of study sites = 5
Transects = 20
S1 Area = 15 ha
Partially disturbed
S2 Area = 5 ha
Partially disturbed
S3 Area = 5 ha
Heavily disturbed
S4 Area = 10 ha
Heavily disturbed
S5
Area = 15 ha
Heavily disturbed
Transects = 12 SCF = 6 CF = 6
T1 SCF
T2 SCF
T3 CF
T4 CF
Transects = 8 SCF = 4 CF =4
T1 SCF
T2 SCF
T3 CF
T4 CF
1 km long 5 m wide 30 mins.
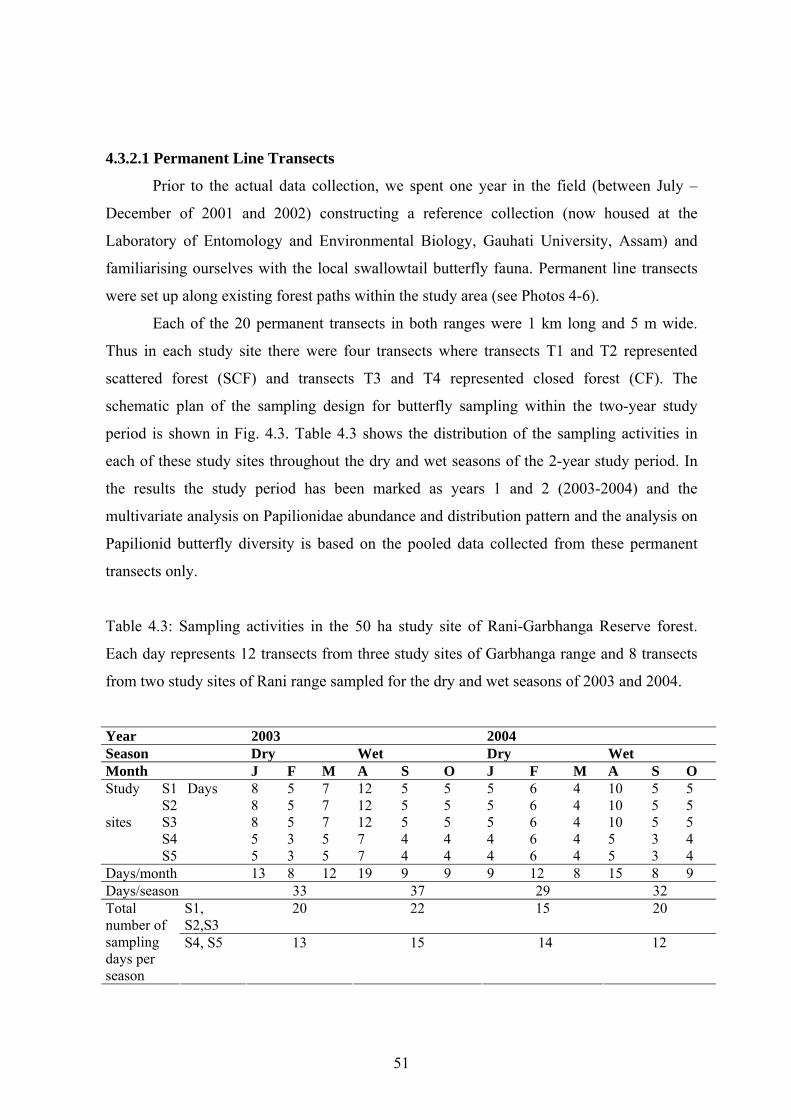
51
4.3.2.1 Permanent Line Transects
Prior to the actual data collection, we spent one year in the field (between July –
December of 2001 and 2002) constructing a reference collection (now housed at the
Laboratory of Entomology and Environmental Biology, Gauhati University, Assam) and
familiarising ourselves with the local swallowtail butterfly fauna. Permanent line transects
were set up along existing forest paths within the study area (see Photos 4-6).
Each of the 20 permanent transects in both ranges were 1 km long and 5 m wide.
Thus in each study site there were four transects where transects T1 and T2 represented
scattered forest (SCF) and transects T3 and T4 represented closed forest (CF). The
schematic plan of the sampling design for butterfly sampling within the two-year study
period is shown in Fig. 4.3. Table 4.3 shows the distribution of the sampling activities in
each of these study sites throughout the dry and wet seasons of the 2-year study period. In
the results the study period has been marked as years 1 and 2 (2003-2004) and the
multivariate analysis on Papilionidae abundance and distribution pattern and the analysis on
Papilionid butterfly diversity is based on the pooled data collected from these permanent
transects only.
Table 4.3: Sampling activities in the 50 ha study site of Rani-Garbhanga Reserve forest.
Each day represents 12 transects from three study sites of Garbhanga range and 8 transects
from two study sites of Rani range sampled for the dry and wet seasons of 2003 and 2004.
Year 2003 2004 Season Dry Wet Dry Wet Month J F M A S O J F M A S O
S1 Days 8 5 7 12 5 5 5 6 4 10 5 5 S2 8 5 7 12 5 5 5 6 4 10 5 5 S3 8 5 7 12 5 5 5 6 4 10 5 5 S4
5 3 5 7 4 4 4 6 4 5 3 4
Study sites
S5 5 3 5 7 4 4 4 6 4 5 3 4 Days/month 13 8 12 19 9 9 9 12 8 15 8 9 Days/season 33 37 29 32
S1, S2,S3
20 22 15 20 Total number of sampling days per season
S4, S5 13 15 14 12

52
During every transect walk of one km in 30 minutes, butterflies on both sides of the
transect within a distance of five metres and up to two metres in front of the observer were
recorded. The walking pace was slow but constant and two observers walking together
along each transect identified and recorded all butterflies seen. The distance was determined
to be the farthest that butterflies could be identified with certainty (using binoculars
whenever necessary) at all transects. The distance is greater than most other studies on
forest butterflies due to the relatively open forest structure typical of tropical deciduous
forests particularly during the dry season (Ghazoul, 2002). Each transect was used twice –
forenoon count between 7.00 to 13.00 h and an afternoon count between 14.00 to 17.00 h.
Each of the forenoon transect walks were of 30 minutes duration, while each of the
afternoon transect walks were of 15 minutes duration. Although sampling was done on
separate days for the study sites of Garbhanga and Rani ranges, the sampling duration for
each of the 8 transects from the two study sites in Rani range with respect to forenoon and
afternoon counts were the same as that for the transects from the study sites of Garbhanga
range. The total sampling hours for the three study sites of Garbhanga range was nine hours
and for the two study sites of Rani range was 6 hours. General field observations relating to
mud-puddling, foraging, egg-laying were also recorded during the morning hours when the
butterflies were most active and in the afternoon for 2 hours (14.00-16.00 hours). The
counts from such observations including the amount of time used for handling individuals or
recording field notes were not counted towards the sampling effort. Wherever visual
identification on the wing was not possible, specimens were netted. Collecting efforts were
more concentrated at mud-puddling spots along the stream, sunspots, fallen fruits and in
areas near to human habitation where the Papilionids along with the Pierids were found to
be attracted to cow-dung and the common nectaring flowers. However it was always
ensured that the counts from such spots were located within the transects. Fast-flying
canopy species were underestimated as individual counts whenever identification or netting
was not possible as the efficiency of the transect method is low for canopy fliers (Spitzer et
al., 1993). As a measure of relative abundance of the butterfly species, we used the
maximum number of observed individuals in each site. This measure allows controlling
sampling intensity and weather differences (Smallidge et al., 1996). All the transect walks
were taken on days with favourable weather conditions.

53
Photo 4 : Study site S1 – Partially disturbed (Garbhanga ) – transect T1 in
open/scattered forest (SCF).
Photo 5 : Study site S1 – Partially disturbed (Garbhanga) – transect T3 in closed forest (CF).
T1
T3

54
Photo 6 : Study site S4 – Heavily disturbed (Rani) – transect T1 in open/scattered
forest
Photo 7 : Study site S4 – (Rani) – transect T4 in closed forest (CF).
T1
T4
55
4.4 Butterfly collection, identification and geographic range classification
The taxonomic characteristics of the swallowtail butterflies were derived using
standard keys from literature (Evans, 1932; Talbot, 1939; Parsons & Cantlie, 1947; Wynter-
Blyth, 1957; Mani, 1986; Haribal, 1992). The butterflies were collected using nets during
the transect walks. Butterflies that could be immediately identified in the field after capture
with netting were released while the unidentified specimens were collected in paper packets
and taken to the laboratory for stretching and preservation. These were identified with the
help of reference material at the Zoological Survey of India, Shillong, India. Type
specimens of the collected butterflies were preserved in the laboratory for future reference.
The collected and identified species have also been preserved for photographic references.
However as part of the Conservation policy (National Forest Policy, 1988) over- collection
was avoided and some rare specimens were collected only if doubts existed with respect to
their specific identity. In the field wherever it was not possible to distinguish between
closely related species during flight, such counts were excluded from the samples and
analyses. Within the East Himalayan Papilionidae fauna, there are species with two or more
different genetic forms such as in case of Common Mormon (Papilio polytes form romulus
and Papilio polytes form stichius) and Common Mime (Chilasa clytia clytia and Chilasa
clytia dissimilis). During sampling, the individual counts for such species were restricted to
the species only without considering the respective forms. As there are several endemic sub-
species in the Eastern Himalayas, therefore in case of the nominate sub-species found in
Assam and adjoining regions, our sample size was restricted only to individual counts at
species level. Similarly for those species, which exhibited polymorphic forms, the counts
were taken wherever identification during flight or after netting was confirmed. Again for
those species exhibiting mimicry, we did not include the sample counts whenever the
identification was not confirmed during flight. In order to avoid sampling bias, another
important factor considered was the sex of the different species. Amongst the Papilionidae,
the males and females of some species are strikingly dissimilar and can be often mistaken as
individuals from different species. Although we collected male and female individuals as
samples for the reference collection, our sampling effort did not include individuals where
identification on the wing or during flight was not confirmed. The seasonality of the tropical
South-east Asian butterflies is also well marked by the distinctly different dry and wet
season broods or forms (Spitzer et al., 1993) and such kind of seasonal polyphenism was
also present amongst the Papilionidae in our study area. They are normally termed as DSF

56
(Dry Season Form) and WSF (Wet Season Form). Therefore care was also taken during dry
and wet season samplings to avoid any kind of observer bias.
Therefore to finally remove as much observer bias as possible during our sampling,
approximations were averaged using values from the two transect walkers after a relevé of
the four transects from each study site.
The nomenclature of the swallowtail butterflies follows Evans (1932) and
D’Abrera (1986) and habitat associations were adopted from Haribal (1992). The
geographic distribution ranges have been categorized on a scale of 1-6 (smallest to largest)
as used by Spitzer et al. (1993):
1 – Eastern Himalayas), Yunnan and Northern Indo-China
2 – North India and all Indo-China
3 – Oriental (Indo-Malayan) region
4 – Indo-Australian region (Australasian) tropics
5 – Paleotropics
6 – Larger than Paleaoetropics - Cosmopolitan
Within the Indian Himalayan region, the Indian extent of the Eastern Himalayas is
from Sikkim to the seven states of Northeast India that includes Assam. Therefore in our
study, the lowest ranked species with score 1 was endemic to the Eastern Himalayas,
excluding Yunnan and Northern Indo-China and the highest ranked species with a score 4
was the most widely distributed species amongst all the preceeding ranks listed above. No
species with geographic range scores 5 and 6 were recorded in our study.
4.5 Diet breadth classification
Many species of Papilionidae are relatively specialized on certain tropical and sub-
tropical plant families (Slansky, 1972). Feeding patterns of the Papilionidae range from
strict monophagy, in which a single species of food plant is utilised to wide polyphagy in
which many species, genera or families may be utilised (Brues, 1920; Dethier, 1954). The
diet-breadth of swallowtail butterflies of Rani-Garbhanga forest reserve based on a measure
of the number of reliably recorded host-plant families was classified as: monophagous
(feeding on plant species that belong to one plant genus and family), oligophagous (feeding
on several plant species within the same family) and polyphagous (feeding on a number of
plant species from different families). Therefore the guild of Papilionidae with respect to the

57
range of larval resource breadth was classified as monophagous specialist, monophagous
generalist, oligophagous generalist and polyphagous generalist (Endo & Nihira, 1990). The
generalist and specialist species were classified on the basis of their range of host-plant
species used by the larvae - Specialist feeders were confined to only one plant species
within the same genus and family while the generalist feeders were classified on the basis of
their range of utilisation of several species of food-plants from within the same or different
families (Kitahara & Fuji, 1994).
4.6 Vegetation survey
To determine the floristic diversity of the study area, we selected two study sites for
sampling (Sites S1 and S4 in Garbhanga and Rani range). The selected sites could represent
all habitat types within the study area. Vegetation sampling was carried out during 2003-
2004 using the quadrate method (Kent & Coker, 1992). The purpose of using a quadrate is
to enable comparable samples to be obtained from areas of consistent size and shape. The
quadrate method usually attempts to define plant community characteristics for an area
much larger than the actual area sampled. Measuring tapes were used for randomly laying
quadrates (50x50 m2 for trees, 20x20 m2 for herbs and shrubs and 10x10 m2 for climbers
within the same 50 x 50 m2 quadrate). Eight quadrates were laid randomly in each of the
two study sites near to the existing butterfly transects. All plants were counted and listed as
individuals belonging to different species within the quadrates. Most of the species were
identified in the field with the help of accompanying botanist and according to the keys and
literature records of Kanjilal et al. (1934 - 1940), Hooker (1872-1897) and Dutta (1988). For
species, which could not be identified, leaves and flowers if available were collected and
prepared into herbaria and these were identified with the help of reference material in the
Eastern Regional Station of the Botanical Survey of India, Shillong, Meghalaya. The
sampling period covered both the dry and wet seasons of 2003-2004 although the sampling
days were separate from the days of butterfly sampling. Our total sampling effort amounted
to 15 days during the study period.
4.7 Food-plants
Butterfly larvae show strong associations with host-plants (Janz & Nylin, 1998). The
distributions and abundance of these host plants are likely to contribute to the abundance
and distributions of adult butterflies in the immediate landscape as well as may influence
their dispersal (Cleary & Genner, 2004). The major objective of vegetation study was to
58
examine the availability of adult nectar and larval food plant resources of the swallowtail
butterflies within the study area. As the larvae feed on the leaves of angiosperms and most
adults feed on nectar, there is a positive correlation between larval and nectar sources and
butterfly distribution (Sharp et al., 1974). Butterflies interact with plants both as larval
herbivores and as adult pollinators, potentially influencing plant population dynamics in
both interactions (Rauscher et al., 1980). Moreover the host-plant specificity in butterflies
plays an important role in determining the geographical range of a species (Vane Wright,
1972), noting that the host-plant use may vary over the geographical range of a species
(Ehrlich et al., 1998). The Papilionid butterflies are strongly associated with a small set of
secondary plant classes and compounds that might restrain their ability to use a greater
taxonomic range of plants (Fiedler, 1998). Seven plant families generally dominate the host
records: Aristolochiaceae, Rutaceae, Lauraceae, Annonaceae, Magnoliaceae, Piperaceae and
Apiaceae (Scriber et al., 1995). Notably, the swallowtail tribes Zerynthiini (Parnassiinae),
Luehdorfiini (Parnassiinae) and Troidini (Papilioninae) are limited almost exclusively to
feeding on Aristolochiaceae (von Euw et al., 1968). The larval host-plants were identified
in the field based on earlier studies and direct observations pertaining to the presence of
larvae during field survey and interpreting recorded host plants from literature (Igarashi &
Fukuda, 1997; Ehrlich & Ehrlich, 1961; Haribal, 1992). Field observations further supported
by earlier studies showed that the adult swallowtails preferred flowers of trees, shrubs and
herbaceous species for nectaring and the adults were observed through two flight seasons to
identify the plants important as nectar sources. Care was used in interpreting recorded adult
food plant sources (Haribal, 1994). During survey, the abundances of larval and adult food
resources of the swallowtails were recorded in the study area as appropriate plant resource.
Distribution may be of critical importance in determining the suitability of a habitat for
butterflies (Ehrlich & Gilbert, 1973) and for the survival of the larvae (Dethier, 1959;
Singer, 1973).
To avoid perpetuating unreliable host plant records, well-researched synoptic
accounts of South-East Asian faunas (Eliot, 1992; Igarashi & Fukuda, 1997) and critical
reviews of the family Papilionidae (Scriber et al., 1995) allowed collation of host plant lists
for Oriental species.

59
4.8 Investigations on the climate conditions during the study period
To investigate the seasonal abundances of tropical butterflies it is also important to
examine the climate data specifically pertaining to rainfall and humidity over a long period
of time prior to the actual study period. This also helps in long-term monitoring of the
butterflies if climate is to be considered as an environmental variable because environmental
factors, especially those related to altitude and climate (temperature, humidity and
precipitation) represents the main determinants of species distribution and composition of
local assemblages of butterflies (Storch et al., 2003). Moreover butterflies are particularly
sensitive to thermal conditions and often show immediate dramatic responses to both
macroclimatic and microclimatic fluctuations (Ehrlich et al., 1975). We have also
investigated the rainfall and humidity trends in our study area over a period of 10 years (see
Chapter 3: 3.3.1).
The total annual rainfall and mean monthly maximum temperature trends in the
study area across a period of five years from 2001 to 2005 (see Figs. 4.4 & 4.5) shows that
during the wet season, maximum precipitation occurs over a period of approximately 250
days from May to September, whereas the variations in the temperature fluctuations
between the dry and wet seasons is very little.
Monthly Total Rainfall (mm)
0
100
200
300
400
500
600
700
Janu
ary
Febr
uary
Mar
ch
Apr
il
May
June
July
Aug
ust
Sep
tem
ber
Oct
ober
Nov
embe
r
Dec
embe
r
Months
Rai
nfal
l (m
m)
20012002200320042005
Figure 4.4: Monthly total rainfall data for the study area during January to December for the
period of 5 years (2001-2005).

60
Monthly Mean Maximum Temperature (0C)
05
10152025303540
Janu
ary
Febr
uary
Mar
ch
Apr
il
May
June
July
Aug
ust
Sep
tem
ber
Oct
ober
Nov
embe
r
Dec
embe
r
Months
Mea
n te
mpe
raut
re (0
C)
20012002200320042005
Figure 4.5: Monthly Mean Maximum temperature (°C) of the study area over the period of 5
years (2001-2005) that includes the study period (2003-2004).
The total annual rainfall in 2004 was lower than the previous years (see
Fig. 4.4). When comparing the two study years, the annual rainfall of 2004 was 1547 mm,
which was lower than the recorded annual rainfall of 2003, which was 2061 mm (see
Appendix 4: 4.1). During the study period, maximum rainfall was recorded during June to
August (see Fig. 4.4). In 2003 during the wet season, highest precipitation was recorded in
June (487.60 mm) and the lowest in October (24.80 mm). In 2004 highest precipitation was
recorded in June (349.80 mm) and the lowest in September (28.20 mm) during the wet
season (see Appendix 4: 4.1).
4.9 Data analysis
Canonical Correspondence Analysis (CCA) was used for ordination of the locations,
species composition and distribution on the butterfly abundance data. CCA is a ‘direct’
gradient analysis (ordination) method that places plots in species space relative to a matrix
of habitat variables (Ter Braak, 1986). It is one of the most important eigenvector methods
in community ordination and is based on Chi-square distances. In this method a set of
species can be directly related to a set of environmental variables. The ordination axes are
chosen in the light of known environmental variables. In this way community or species
variation can be directly related to environmental variation. These variables may be
quantitative or nominal. As many axes can be extracted as there are variables. Constrained

61
axes are constructed to maximize the fit with linear combinations of environmental
variables, and remaining (unconstrained) axes represent a residual variation in the species
data after extracting the constrained axes. In the resulting ordination diagram, points
represent species and sites, and arrows represent environmental variables. Such a diagram
shows the main pattern of variation in species as accounted for by the environmental
variables and also shows in an approximate way, the distributions of species along each
environmental variable (Ter Braak, 1986). The significance of the relationships between
selected external variables and data structure was assessed using permutation tests: the
contrasts were permuted randomly and the model was refitted. Values of external variables
were randomly assigned to the samples and eigenvalues of the CCA analysis for both
constrained and unconstrained axes could be performed.
Multivariate ordination was done separately for the study sites of Garbhanga and
Rani ranges. The butterfly abundance data from the 12 fixed transects of the three study
sites in Garbhanga range and similarly the abundance data from the 8 fixed transects of the
two study sites in Rani range were pooled by season, year and forest type for analysis. Thus
transect T1 representing the pooled abundance data from the open/scattered forest transects
of all the three study sites of Garbhanga or the two study sites of Rani range during dry
season of year 1 (2003) is again resampled as transect T5 representing pooled abundance
data from all the open forest transects of the study sites during wet season of same year.
Again transect T3 representing the pooled abundance data from the closed forest transects of
all the study sites of either Garbhanga or Rani range during dry season of year 1 is
resampled in a similar way during wet season of same year (see Appendix 4: 4.2).
Three sets of ordination were done for the study sites of each of the two ranges – the
first ordination matrix defined the influence of categorical and independent variables on the
changing abundance and distribution patterns of the group assemblages, the second
ordination matrix defined the same for the species assemblages by common English names
and the third ordination matrix defined the same for the species assemblages by the
scientific names. So we had in total six ordination matrices- three each for the study sites of
Garbhanga and Rani ranges.
The classification of the Papilionidae fauna into such group assemblages with
common names like Mormons, Helens, Peacocks, Limes and Ravens which are all included
under one genus Papilio or Windmills and Batwings which are clustered under one genus
Atrophaneura is mainly based on their phylogenetic history and host-plant co-evolution
with sharing of a sub-set of these host plants. Such kind of grouping is also based on some

62
behavioural similarities like mud-pudlling which therefore makes their identification by
common group characteristics easier in the field. In the four ordination plots where we have
used the common English names for both the group and species assemblages, follow Evans
(1932). In the two ordination matrices for the species assemblages where we have used the
scientific names also follow Evans (1932).
4.9.1 Swallowtail butterflies – habitat relationships
In order to explore the relationships between the butterfly fauna and the environment
defined by forest type, season, rainfall, year, altitude, latitude and longitude, CCA was run
on all data sets (Garbhanga and Rani) with data generated from the Line transect sampling
method.
The habitat/environment matrix initially consisted of 11 habitat variables
(temperature, rainfall, humidity, wind speed, altitude, soil type, vegetation, latitude and
longitude, disturbance, light), but was reduced to only the six most important variables -
season that subsumes temperature, humidity and rainfall, forest type, altitude, latitude and
longitude because there was very high correlation between these and other measured
variables (See Appendix 4 : 4.3 & 4.4). The CCA ordination was run using the axis scores
centred and standardized to compartment variance and compartments were plotted on
diagrams using linear combination scores in the statistical program ‘R 2.3.1.’ (R: A
programming Environment for Data Analysis and Graphics. http://cran.r-project.org/ 2006-
06-01). The first two axes of CCA ordination were plotted as standard plots to compare
changes as a result of the environmental variables. Season and forest type were used as
major external variables to explain the community structure of the swallowtail butterflies,
while altitude, geographical position (latitude and longitude), year and rainfall were taken as
independent environmental variables to study their effects on the species assemblages
within the study area. Separate ordination plots were constructed for the swallowtail
butterfly community sampled in Garbhanga and Rani ranges within the forest reserve and
these plots indicated the different taxa in genus (group assemblages) and species space. The
butterfly abundance data from the 20 fixed transects in the 5 study sites were pooled by
forest-type and season-wise to investigate the changing abundance and distribution pattern
of the species assemblages of swallowtail butterflies within Garbhanga and Rani ranges.
The significance of species-environment relationships were tested by running the
permutation tests using the anova function in the vegan package of the program ‘R’.

63
4.9.2 Measures of Diversity index
Using the pooled abundance data on butterfly sampling by season and forest type for
2 years (2003-2004) the following estimators were computed as measures of butterfly
diversity: Shannon-Weiner Index (H’), Simpson’s Diversity (D), Simpson’s Inverse (1/D),
Fischer’s alpha diversity (α), Rarefaction (R2), Species richness (S) and Pielou’s evenness
(J). All of these measures are widely used in ecology literature (Krebs, 1989; Magurran,
1988). The selected diversity indices are relatively easy to interpret ecologically and less
sensitive to rare species and sample size (Magurran, 1988). Diversity measures vary in the
relative emphasis placed on the number of species (richness) and their relative abundances
(Evenness), and each has its limitations. Some information on the applied diversity indices
is given below:
A frequently used diversity measure is the Shannon-Weaner Index and it is
calculated as
and pi = ni/N
Where p (i) is the proportion of the sample represented by species i, and ln is the natural
logarithm and considers the proportion of individuals found in the ith species, pi. This value
is estimated as ni/N (number of individuals in the ith species divided by the total number of
individuals). Compared to other indices, the Shannon index is sensitive to changes in
abundance of rare or intermediate abundant species. It appeared to have only moderate
discriminate ability and since it is strongly influenced by changes in rare species, is sensitive
to sample size. The index assumes that sampling is random and allows including all species
present in the community.
A second group of diversity measures are referred to as dominance measures since
they particularly consider the abundance of the most common species rather than providing
a measure of species richness. One of the most used dominance measures is the Simpson’s
index, which calculates the probability that any two individuals drawn at random from
infinitely large community belong to different species. It is calculated as:
D = ∑pi (reciprocal)
1/D = 1/ ∑pi
and pi = ni (ni –1)/N(N-1)

64
In the formula, pi is the proportion of individuals in the ith species and is estimated from the
relation of the number of individuals in the ith species to the total number of individuals.
Simpson’s index especially takes into account the abundance of the most common species,
and is less sensitive to species richness. It has a moderate discriminate ability and low
sensitivity to sample size, since it does not stress on changes in abundance of rare species,
but of the most common species. Since diversity decreases when D increases, mostly the
reciprocal form of the index is used (1/D).
Diversity depends on the number of species (i.e. S), but also on the evenness (E); if
all species are equally abundant (E max) then diversity is high, but if one species is
especially abundant and the rest are rare (E min) then diversity is low. Simpson's Inverse
Index of Diversity is calculated as:
D = 1/Σpi2
where pi is the proportional abundance of species i, i.e. ni/Σni .
So, to calculate D, we have the following parameters:
• add up the species' abundances (ni) to give the total (N = Σni );
• divide each ni by N to give pi ;
• square each pi , before we
• add them up to give a value for Dominance (= Σpi2 ),
• the reciprocal of which is Simpson's Inverse Index of Diversity.
Another frequently used index is the Fisher’s alpha diversity. It is calculated as:
A = N (1-x)/x
S/N = (1-x)/x-1n(1/x)
and principally considers the total number of individuals N and x which is estimated from
the iterative solution of S/N = (1-x)/x-1n(1/x). It does not take into account the relative
abundance of the species. This means, in situations where the total number of species and
individuals remain constant but the evenness of the community changes, alpha will not
indicate a difference. However, the index appeared to have a very good discriminate ability
between different samples and is not so sensitive to sample size. This attribute of alpha is a
result of its dependence on the numbers of species of intermediate abundance, it is relatively
unaffected by either rare or common species abundance changes. The index is based on the
log-series species abundance model developed by Fisher and is strictly speaking only
appropriate when the community shows a log-series distribution. However, in practice it
appeared to be a good diversity measure independent of the underlying abundance pattern.

65
Pielou's evenness index, j (Pielou, 1966) is calculated as:
H(s)
j = ----------
H (max)
where H(s) = the Shannon-Wiener information function
H(max.) = the theoretical maximum value for H(s) if all species in the sample were equally
abundant.
Rarefaction diversity is a measurement for analyzing the number of species
(species richness) among collections, when all collections are scaled down to the same
sample size (Hulbert, 1971; Heck et al., 1975). The number of species Sn, which can be
expected from a random sample of n individuals, drawn without replacement from N
individuals distributed among S species, is calculated as:
Where S is the total number of species found in the collection, and Ni is the number of
individuals of the i th species (Hulbert, 1971).
The technique of rarefaction can be used to calculate species richness for sub
samples consisting of fewer individuals. The following formula predicts the average species
richness that would be obtained if N individuals were randomly sampled instead of the total
Ntot individuals of the survey, when each species contains Ni individuals in the entire survey:
The species diversity, richness, evenness and rarefaction estimates were analysed
separately for the study sites of Garbhanga and Rani ranges by season and forest type. The
pooled butterfly abundance data from the 12 fixed transects of Garbhanga range and 8 fixed
transects of Rani range were used in the analysis. The software program used for the
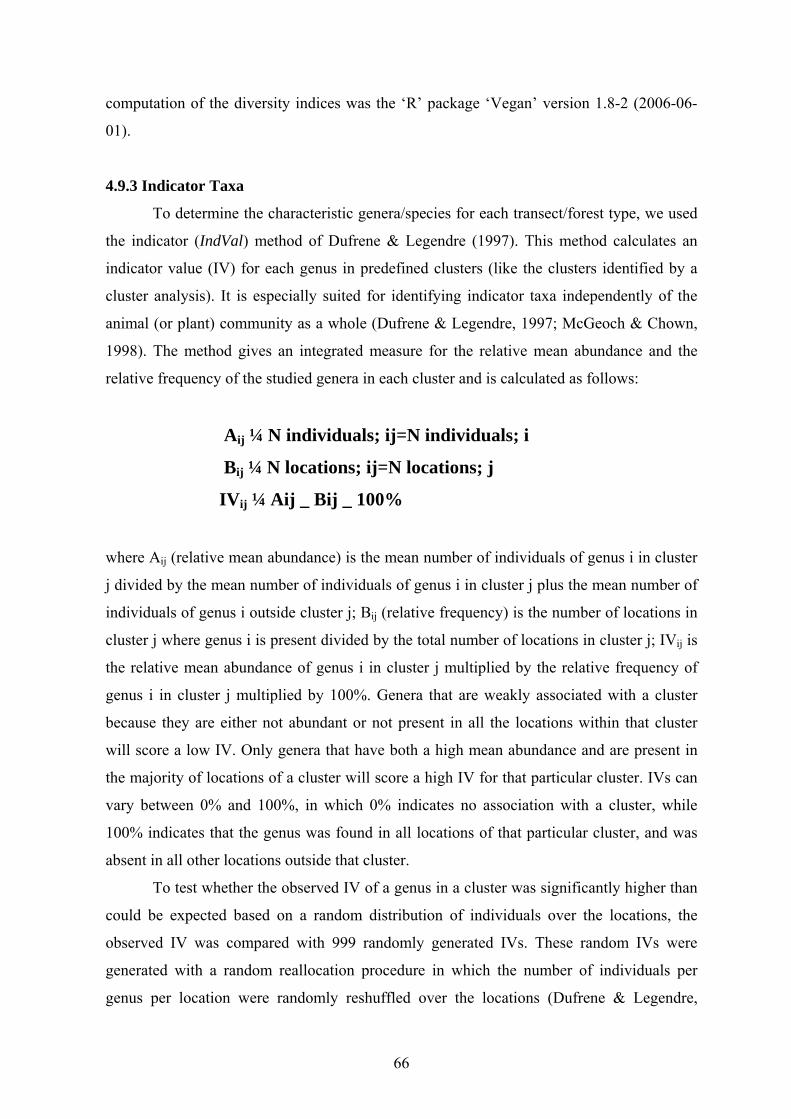
66
computation of the diversity indices was the ‘R’ package ‘Vegan’ version 1.8-2 (2006-06-
01).
4.9.3 Indicator Taxa
To determine the characteristic genera/species for each transect/forest type, we used
the indicator (IndVal) method of Dufrene & Legendre (1997). This method calculates an
indicator value (IV) for each genus in predefined clusters (like the clusters identified by a
cluster analysis). It is especially suited for identifying indicator taxa independently of the
animal (or plant) community as a whole (Dufrene & Legendre, 1997; McGeoch & Chown,
1998). The method gives an integrated measure for the relative mean abundance and the
relative frequency of the studied genera in each cluster and is calculated as follows:
Aij ¼ N individuals; ij=N individuals; i
Bij ¼ N locations; ij=N locations; j
IVij ¼ Aij _ Bij _ 100%
where Aij (relative mean abundance) is the mean number of individuals of genus i in cluster
j divided by the mean number of individuals of genus i in cluster j plus the mean number of
individuals of genus i outside cluster j; Bij (relative frequency) is the number of locations in
cluster j where genus i is present divided by the total number of locations in cluster j; IVij is
the relative mean abundance of genus i in cluster j multiplied by the relative frequency of
genus i in cluster j multiplied by 100%. Genera that are weakly associated with a cluster
because they are either not abundant or not present in all the locations within that cluster
will score a low IV. Only genera that have both a high mean abundance and are present in
the majority of locations of a cluster will score a high IV for that particular cluster. IVs can
vary between 0% and 100%, in which 0% indicates no association with a cluster, while
100% indicates that the genus was found in all locations of that particular cluster, and was
absent in all other locations outside that cluster.
To test whether the observed IV of a genus in a cluster was significantly higher than
could be expected based on a random distribution of individuals over the locations, the
observed IV was compared with 999 randomly generated IVs. These random IVs were
generated with a random reallocation procedure in which the number of individuals per
genus per location were randomly reshuffled over the locations (Dufrene & Legendre,

67
1997). If the observed IV of a genus in a cluster fell within the top 5% of the random IVs
(sorted in decreasing order) it was considered to deviate significantly from the expected
random mean, i.e. the genus had a significantly higher IV than expected. Species with
significant high IndVal values (>70%) show strong habitat specificity, so they may be
considered as characteristic species of the assemblages (McGeoch et al., 2002). This
analysis was performed in the ‘vegan’ subroutine of the program ‘R’.
In order to identify the characteristic indicator species within the forest reserve
season-wise, we performed the analysis on the same data set using the program PC-ORD
4.01 (McCune & Mefford, 1999).
The butterfly abundance data from the 12 fixed transects of the three study sites in
Garbhanga range and 8 fixed transects of the two study sites in Rani range were pooled by
forest type, season and year in a similar method as followed for multivariate ordination for
analysing the Indicator values of the group (genus-wise) and species assemblages.
4.9.4 Vegetation analysis
The vegetation profile within the protected reserve was sampled only within two
study sites (S1 and S4) and plant diversity estimates of these sites with respect to the total
abundance of trees, herb/shrub and climbers sampled as individuals were analyzed using the
program PC-ORD 4.01 (McCune & Mefford, 1999). The rarefaction estimates of species
richness for the sampled vegetation in the study sites S1 and S4 were analysed in the
program ‘RAREFACT’ 3.00 (Hulbert, 1971).
4.9.5 Basic statistical tests
Some of the basic statistical tests like One-way ANOVA for comparing the
differences in the mean abundances of the sampled butterflies between the seasons and
years, and Spearman’s rank correlation tests for analysing the correlation between the mean
species abundances and their pre-defined geographical range and diet breadth based on host-
plant identification were analysed in the program STATISTICA 7.1 (Statsoft, 1995).

68
CHAPTER 5 : RESULTS
5.1 Plant Community (Trees, Herbs, Shrubs and climbers)
The pooled data for study site S1 (Partially disturbed) in Garbhanga range included
1079 individuals of 74 species of trees, 1137 individuals of 63 species of herbs and shrubs
and, 481 individuals of 32 species of climbers. In study site S4 (Heavily disturbed) in Rani
range the pooled data included 1009 individuals of 72 species of trees, 1155 individuals of
62 species of herbs and shrubs and, 475 individuals of 33 species of climbers. (Appendix 5:
5.1).
0
20
40
60
80
100
120
140
160
180
200
0 100 400 700 1000 1300 1600 1900 2200 2500 2800
Number of individuals
Exp
ecte
d nu
mbe
r of
spe
cies
S1S4
Figure 5.1: Rarefaction curve for the plant community of the two study sites (S1 & S4).
Total number of species (trees, herb/shrub, climbers) in the samples of each study site
were169 and 167 respectively.
The rarefaction curves for the plant community showed a nearly close similarity in
the abundance patterns of the sampled plants or the species richness between the two study

69
sites (see Fig. 5.1) and the overall vegetation structure in these two sites could be considered
to represent the complete floral profile of the study area (see Appendix 5: 5.2, 5.3, 5.4, 5.5
& 5.6). The forest reserve is a predominantly mixed deciduous Sal forest with teak
plantation in the fringe areas of the western part of the reserve (study site S4 in Rani range
as seen in GIS map) near to human settlements. Large tracts of bamboo (Dendrocalamus
hamiltonii) were mostly found in the hilly slopes of the reserve at elevations ranging from
100-120 m above MSL. The specific feature of this bamboo species was that it was
observed to grow gregariously in clumps forming ‘pure stands’ and could therefore be
described as separate ‘bamboo forests’ under general edaphic and seral types of tropical
moist deciduous forests (Champion & Seth, 1968). Such bamboo habitats were observed to
have poor undergrowth vegetation with only such species like Gardenia campanulata and
Mussaenda roxburghii.
5.1.1 Flora Overview
5.1.1.1 Study site S1 (Garbhanga range)
We sampled 2697 individuals, belonging to 62 families, 131 genera and 169 species.
The species with highest abundance was Dendrocalamus hamiltonii (86 individuals),
followed by Aristolochia tagala (50 individuals), Hibiscus rosa sinensis and Lantana
camara (each with 47 individuals), Glycosmis pentaphylla (44 individuals), Aristolochia
indica and Homonia riparia (each with 41 individuals). Of the 169 sampled species,
Diospyros variegata was represented by only one individual (see Appendix 5: 5.4. 5.5, 5.6).
Scattered patches of ‘moist bamboo brakes’ corresponding to Champion & Seth’s
type 2/E3 (1968) were found to occur along the stream and clumps of Dendrocalamus
hamiltonii was the dominant species. The ground flora in the moist habitats along the stream
was composed of dominant herb species like Homonia riparia, Solanum indicum, Punica
granatum, Clerodendron infortunatum, Ficus heterophylla, Bauhinia acuminata and
Abutilon indicum. In areas with large gaps (scattered forest habitats) along the stream
created by logging or major tree falls the herbaceous ground vegetation was dominated by
species like Costus speciosus and Hemidesmus indicus. Within the closed canopy forest the
dominant tree species were Ficus religiosa, Gmelina arborea, , Shorea assamica , Salix
tetrasperma, Schima wallichi, Dipterocarpus macrocarpus, Aesculus assamica, Castanopsis
indica, Zanthoxyllum budrunga, Semicarpius anacardium, Moringa oleifera and
Tetrameles nudiflora. The height of the lower canopy was approximately 15.5 m while the

70
upper canopy was about 35-40 m in height. Some of the dominant climbers observed in the
closed forest were Aristolochia tagala, A indica, Mucuna prurita, Butea parviflora, Ficus
scandens (woody climber), Millettia auriculata (woody climber), Smylex macrophylla. The
undergrowth vegetation in these habitats was characterised by such species like Solanum
nigrum, Nerium indicum, Stephania hernandifolia, Sida cordifolia, Desmodium caudatum,
Litsaea salicifolia and Plumbago zeylanica.
In the scattered forests with large gaps close to human settlements some of the
dominant tree species observed were Shorea robusta, Bauhinia variegata, Sharaka indica,
Zanthoxylum hamiltonianum, Emblica officinalis, Annona squamosa , Mangifera indica,
Citus grandis, C aurantifolia and Murrya koeningii. The ground vegetation comprised of
Murrya paniculata, Glycosmis pentaphylla, Cassia sophera, Canna orientalis, Lantana
camara and Eupatorium odoratum while Imperata cylindrica was the common grass species
in such open habitats. Grazing and logging were absent but the forest road running along the
transects was the only walking link for the villagers between the northern and southeastern
part of the reserve. Mild form of disturbance by way of cutting of bamboos and collection of
fodder for the cattle was observed. A comparative study on the GIS land cover images for a
period of 4 years (1998-2002) showed a decrease in the cover of domestic and commercial
plantation in the north-eastern part of the study site but increasing encroachment on the
northern part (see Chapter 4: Figs. 4.1 & 4.2).
5.1.1.2 Study site S4 (Rani range)
We sampled 2576 individuals belonging to 62 families, 130 genera and 167 species.
The species with highest abundance was Lantana camara (62 individuals) followed by
Dendrocalamus hamiltonii (61 individuals), Eupatorium odoratum (50 individuals), Ixora
coccinea (49 individuals), Adhatoda vasica (48 individuals), Polyalthia longifolia (46
individuals) and Mangifera indica (45 individuals).
It is a disturbed habitat characterised by the presence of shrubs, grasses, planted trees
and crop plants. There is a 3 ha teak plantation and there was virtually no ground cover in
this plantation site. The dominant herb and shrub species observed as household plantations
in the areas of the forest settlement were Ixora coccinea, Datura stramonium, Cassia
occidentalis ,Cassia tora, Aeschynomene indica, Hibiscus rosa sinensis, Vitex negundo (tree
shrub) and Holmskioldia sanguinea. Cultivated plants included species like Citrus grandis,
Citrus aurantifolia, Mangifera indica, Emblica officinalis, Carica papaya, Polyalthia
longifolia, Litchi chinensis and Musa sanguinea. The dominant climbers in such habitat

71
were species like Caesalpinia crista, Thunbergia grandiflora, Jasminum scandens, J
coaractatum and Hibiscus fragrans.
The scattered forest consisted of some large natural gaps characterised by the
presence of Imperata cylindrical (Cogon grass), Eupatorium odoratum, Lantana camara,
Glycosmis pentaphylla, Canna orientalis and Cannabis sativa as dominant undergrowth
vegetation.
In the closed forest at elevations of 120--150 m the dominant tree species of
Rutaceae, Moraceae, Dipterocarpaceae, Lauraceae, Annonaceae, Verbenaceae,
Euphorbiaceae and Caesalpiniaceae were found. The ground cover consisted of dominant
species like Solanum indicum, Solanum nigrum, Punica granatum, Murrya paniculata,
Cassia sophera, Clerodendrum indicum, Ficus heterophylla, Mimosa himalayana, Abroma
augusta Desmodium latifolium, Litsaea salicifolia, Duranta repens, Plumbago zeylanica
and Mussaenda roxburghii. Sau grass (Microstegium ciliatum) was also observed to be
dominant under close canopy. At lower elevations of 60-70m bamboo was dominant on the
hilly slopes and ridges. Close associates of bamboo were smaller trees like Zanthoxyllum
budrunga, Z hamiltonianum, Salix tetrasperma, Gmelina arborea and Holarrhena
antidysentrica. The dominant climbers in the closed forest were Aristolochia indica, A
tagala, Delima sarmentosa, Clematis cadmia, Butea parvifloram, Millettia auriculata, Ficus
scandens, Combretum decandrum, Mussaenda glabra, Entada scandens and Naravelia
zeylanica. Bamboo (Dendrocalamus hamiltonii) was found to be more abundant in site S1.
The vegetation in the scrubland was dominated by grasses like Microstegium ciliatum and
other species included Eupatorium odoratum and Lantana camara.
A comparison of the GIS land cover class for four years (1998-2002) showed a
decrease in the agricultural activities but increasing encroachment associated with domestic
plantation and grazing (see Chapter 4: Figs. 4.1 & 4.2). The closed forest was disturbed by
only illegal selective logging while high levels of human disturbance were visually observed
in the open/ scattered forests or gaps in the form of stone quarrying activities, earth cutting
from the hilly slopes, small-wood collection and grazing.
5.1.1.3 Comparison of plant diversity parameters between S1 and S4
An estimation of the diversity parameters of the floral composition within the study
sites with respect to the trees, herbs/shrubs and climbers showed the following results (see
Tables 5.1, 5.2 and 5.3):
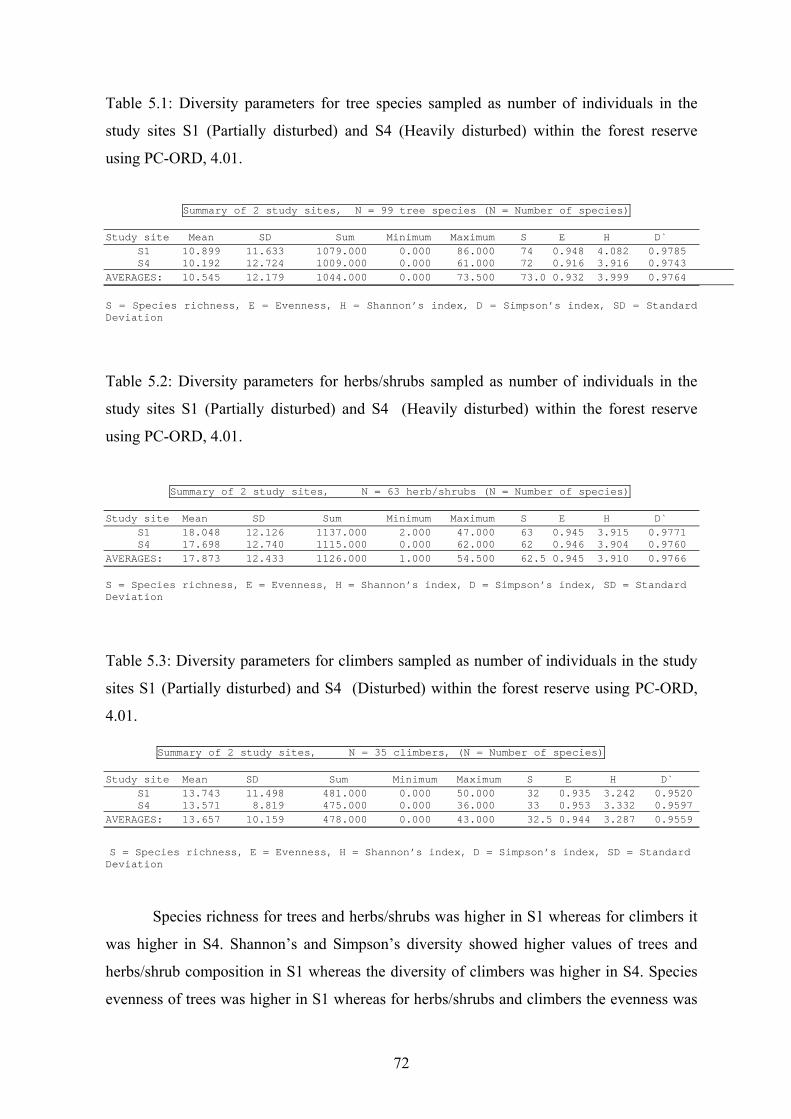
72
Table 5.1: Diversity parameters for tree species sampled as number of individuals in the
study sites S1 (Partially disturbed) and S4 (Heavily disturbed) within the forest reserve
using PC-ORD, 4.01.
Summary of 2 study sites, N = 99 tree species (N = Number of species) Study site Mean SD Sum Minimum Maximum S E H D` S1 10.899 11.633 1079.000 0.000 86.000 74 0.948 4.082 0.9785 S4 10.192 12.724 1009.000 0.000 61.000 72 0.916 3.916 0.9743 AVERAGES: 10.545 12.179 1044.000 0.000 73.500 73.0 0.932 3.999 0.9764
S = Species richness, E = Evenness, H = Shannon’s index, D = Simpson’s index, SD = Standard Deviation
Table 5.2: Diversity parameters for herbs/shrubs sampled as number of individuals in the
study sites S1 (Partially disturbed) and S4 (Heavily disturbed) within the forest reserve
using PC-ORD, 4.01.
Summary of 2 study sites, N = 63 herb/shrubs (N = Number of species) Study site Mean SD Sum Minimum Maximum S E H D` S1 18.048 12.126 1137.000 2.000 47.000 63 0.945 3.915 0.9771 S4 17.698 12.740 1115.000 0.000 62.000 62 0.946 3.904 0.9760 AVERAGES: 17.873 12.433 1126.000 1.000 54.500 62.5 0.945 3.910 0.9766 S = Species richness, E = Evenness, H = Shannon’s index, D = Simpson’s index, SD = Standard Deviation
Table 5.3: Diversity parameters for climbers sampled as number of individuals in the study
sites S1 (Partially disturbed) and S4 (Disturbed) within the forest reserve using PC-ORD,
4.01. Summary of 2 study sites, N = 35 climbers, (N = Number of species) Study site Mean SD Sum Minimum Maximum S E H D` S1 13.743 11.498 481.000 0.000 50.000 32 0.935 3.242 0.9520 S4 13.571 8.819 475.000 0.000 36.000 33 0.953 3.332 0.9597 AVERAGES: 13.657 10.159 478.000 0.000 43.000 32.5 0.944 3.287 0.9559
S = Species richness, E = Evenness, H = Shannon’s index, D = Simpson’s index, SD = Standard Deviation Species richness for trees and herbs/shrubs was higher in S1 whereas for climbers it
was higher in S4. Shannon’s and Simpson’s diversity showed higher values of trees and
herbs/shrub composition in S1 whereas the diversity of climbers was higher in S4. Species
evenness of trees was higher in S1 whereas for herbs/shrubs and climbers the evenness was

73
higher in S4 (see Tables 5.1, 5.2 & 5.3). However the rarefaction estimate for expected
species richness showed near similarity between the two study sites S1 and S4 (see Fig. 5.1)
and this could be considered to represent the overall vegetation profile of the protected
reserve.
5.2 Plant community representation in the study area
5.2.1 Plant families, genera and species
The total plant family representation in the study area was 65. A total of 197 plant
species were recorded, out of which 99 species represented trees, 63 species were
herbs/shrubs and 35 species were represented by climbers (see Fig. 5.2; Appendix 5: 5.7).
Floral species sampled and identified in the Forest Reserve
50%32%
18%
Trees, n = 99
Herb/Shrubs, n = 63
Climbers, n = 35
Figure 5.2: Percentage representation of trees, herbs/shrubs and climbers in the Forest
Reserve (n = number of species).
The most species-rich family in the reserve was Fabaceae with 14 species,
Rutaceae, Verbenaceae and Euphorbiaceae coming in close second each with 12 species.
Moraceae (10) and Caesalpiniaceae (10) were also species rich. Fifty-nine families were
found with less than 10 species and out of these 25 families were found to represent only 1
species (see Fig. 5.3; Appendix 5: 5.7).
Dipterocarpaceae was mainly represented by Shorea robusta (Sal) and S. assamica,
which is a principal associate of Sal in entire North-east India (Singh & Singh, 1987). A
characteristic feature of the Sal forests is that the leafless period of Sal is only about 1-2

74
weeks and this helps to keep the forest floor reasonably moist and cool even during the dry
season. The percentage of canopy cover in an undisturbed Sal forest is about 60-80% but in
the study area which is a disturbed forest, the canopy cover was about 50-60% only and the
understorey in the Sal dominated patches was characterized by the presence of
Microstegium ciliatum and Eupatorium odoratum.
The genera most rich in species was Ficus (Moraceae) with 7 species, followed by
Bauhinia (5, Fabaceae), Zanthoxyllum ( 4, Rutaceae), Solanum ( 4, Solanaceae), Cassia ( 4,
Caesalpiniacea), Cinnamomum (3, Lauraceae), Citrus (3, Rutaceae), Vitex (3, Verbenaceae)
and Garcinia (3, Clusiaceae). One-hundred and twelve genera were represented by only one
species.
0123456789
101112131415
Faba
ceae
Rut
acea
eVe
rben
acea
eEu
phor
biac
eae
Cae
salp
inia
ceae
Mor
acea
eR
ubia
ceae
Mal
vace
aeLa
urac
eae
Sola
nace
aeM
agno
liace
aeA
pocy
nace
aeC
lusi
acea
eA
naca
rdia
ceae
Legu
min
ocea
eM
yrsi
nace
aeC
ombr
etac
eae
Myr
tace
aeD
ipte
roca
rpac
eae
Poac
eae
Ann
onac
eae
Aris
tolo
chia
ceae
Papi
liona
ceae
Zing
iber
acea
eFl
acou
rtia
ceae
Rha
mna
ceae
Asc
elep
iada
ceae
Thea
ceae
Sapi
ndac
eae
Cor
diac
eae
Elae
ocar
pace
aeFa
gace
aeD
illen
iace
aeSt
ercu
liace
aeTi
llace
aeR
anun
cula
ceae
Ole
acea
eLi
liace
aeB
igno
niac
eae
Com
posi
tae
Plant families
Num
ber o
f tre
es, h
erb/
shru
b an
d cl
imbe
r sp
ecie
s pe
r fam
ily
trees herb/shrubs climbers
Figure 5.3: Number of species of trees, herb/shrubs and climbers per family represented in
the floral composition of study sites S1 and S4. The dominant plant families with more than
one species are only shown in the above figure.
5.2.2 Larval host-plants and adult nectaring plant families and species
Seven families in the study area represented the larval host-plants. Rutaceae
represented the highest number of larval host-plants with 11 species to be followed by
Lauraceae (5 species), Magnoliaceae (3 species), Annonaceae and Aristolochiaceae each
with 2 species, Caesalpiniaceae and Solanaceae each with 1 species (see Figs. 5.4 & 5.5:
Appendix 5: 5.8 & 5.9). The larval host-plant diversity represented only 7% of the total
plant diversity in the reserve (see Fig. 5.6).
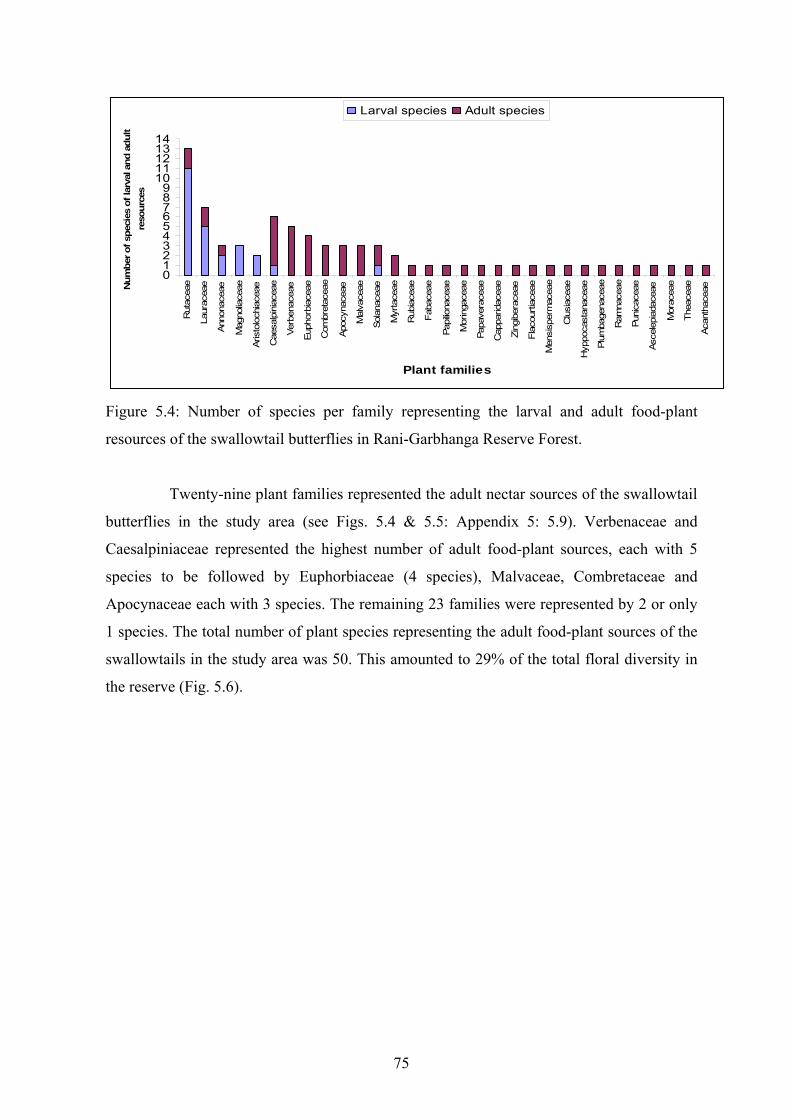
75
0123456789
1011121314
Rut
acea
e
Laur
acea
e
Anno
nace
ae
Mag
nolia
ceae
Aris
tolo
chia
ceae
Cae
salp
inia
ceae
Verb
enac
eae
Euph
orbi
acea
e
Com
bret
acea
e
Apoc
ynac
eae
Mal
vace
ae
Sola
nace
ae
Myr
tace
ae
Rub
iace
ae
Faba
ceae
Papi
liona
ceae
Mor
inga
ceae
Papa
vera
ceae
Cap
parid
acea
e
Zing
iber
acea
e
Flac
ourti
acea
e
Men
sisp
erm
acea
e
Clu
siac
eae
Hyp
poca
stan
acea
e
Plum
bage
nace
ae
Ram
nace
ae
Puni
cace
ae
Asce
lepi
adac
eae
Mor
acea
e
Thea
ceae
Acan
thac
eae
Plant families
Num
ber o
f spe
cies
of l
arva
l and
adu
lt re
sour
ces
Larval species Adult species
Figure 5.4: Number of species per family representing the larval and adult food-plant
resources of the swallowtail butterflies in Rani-Garbhanga Reserve Forest.
Twenty-nine plant families represented the adult nectar sources of the swallowtail
butterflies in the study area (see Figs. 5.4 & 5.5: Appendix 5: 5.9). Verbenaceae and
Caesalpiniaceae represented the highest number of adult food-plant sources, each with 5
species to be followed by Euphorbiaceae (4 species), Malvaceae, Combretaceae and
Apocynaceae each with 3 species. The remaining 23 families were represented by 2 or only
1 species. The total number of plant species representing the adult food-plant sources of the
swallowtails in the study area was 50. This amounted to 29% of the total floral diversity in
the reserve (Fig. 5.6).

76
65
7
29
197
25
50
0 100 200 300
Total
Larval
Adult
Plan
t cat
egor
y re
pres
enta
tion
in th
e st
udy
area
Number of plant families and species represented in the study area
Species
Family
Figure 5.5: Number of plant families and species represented in the total floral diversity,
larval and adult food-plant resources of the swallowtail butterflies in the study area.
Percentage representation of larval and adult foodplant families in the
study area
Total64%
Larval7%
Adult29%
Total
Larval
Adult
Figure 5.6: Percentage representation of the total, larval and adult food-plant resources of
the swallowtail butterflies in the study area.

77
5.3 Papilionidae diversity in Rani-Garbhanga Reserve forest
5.3.1 Genera, Species and Abundance
The abundance of 18,371 individuals of 28 species of swallowtail butterflies
belonging to eight genera were recorded during the wet and dry seasons at the reserve by the
end of 2004. A list of the recorded Papilionidae with their larval food resources and diet
breadth/feeding guild, conservation status and geographic range are given in Appendix 5:
5.10. Nine of these species belonged to the ‘Red-bodied’ group and were included under 3
genera – Atrophaneura (5 species), Pachliopta (2 species) and Troides (2 species). The
‘black-bodied’ group represented by the single genus Papilio had the highest number of
species (9). The genera Pathysa and Graphium were represented by 4 and 3 species
respectively while the genera Lamproptera (2 species) and Chilasa (1 species) were
represented by the lowest number of species (see Figure 5.7).
Genera representation in the forest reserve
9
54
3
2
2
2 1
Papilio
Atrophaneura
Pathysa
Graphium
Troides
Pachliopta
Lamproptera
Chilasa
Figure 5.7: Genus representation of the swallowtail butterflies sampled during the dry and
wet seasons of 2003-2004 in the 50 ha study site of Rani-Garbhanga Reserve forest. The
total number of species for each genus is shown as different numbers around the pie-chart.
The total number of species recorded from our present study represented 45.9% of
the total species documented from Assam by Evans (1932) and Talbot (1939). The number
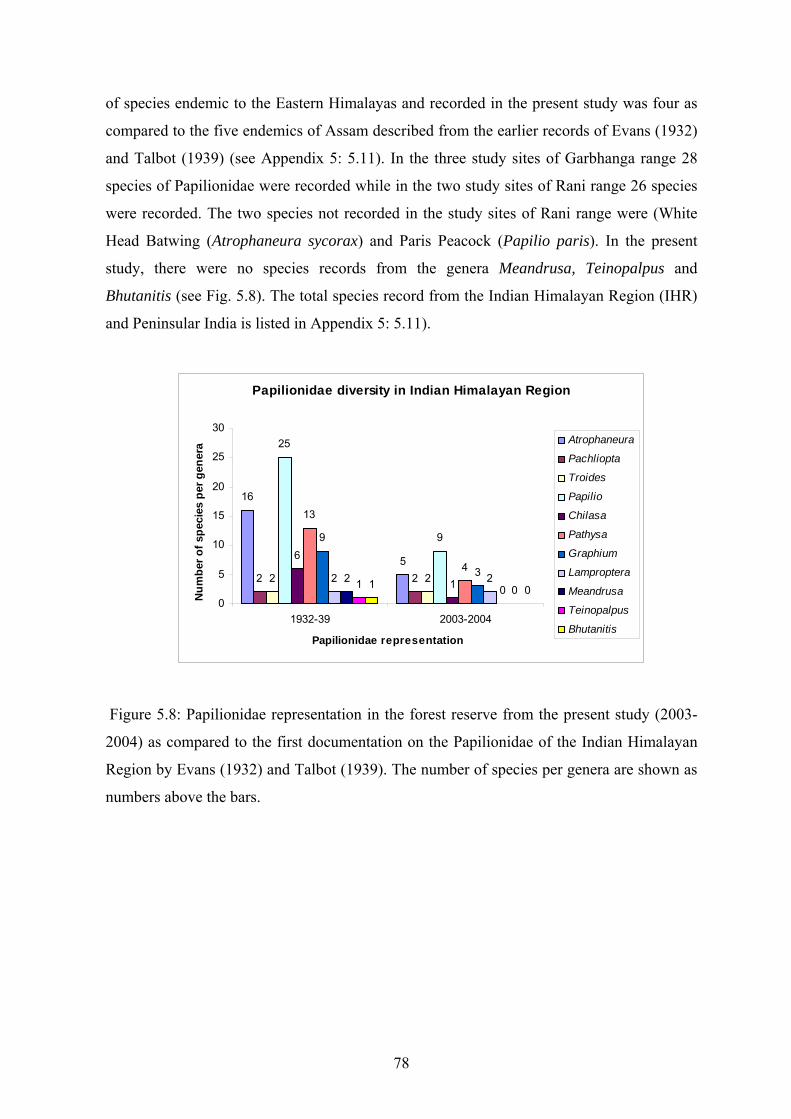
78
of species endemic to the Eastern Himalayas and recorded in the present study was four as
compared to the five endemics of Assam described from the earlier records of Evans (1932)
and Talbot (1939) (see Appendix 5: 5.11). In the three study sites of Garbhanga range 28
species of Papilionidae were recorded while in the two study sites of Rani range 26 species
were recorded. The two species not recorded in the study sites of Rani range were (White
Head Batwing (Atrophaneura sycorax) and Paris Peacock (Papilio paris). In the present
study, there were no species records from the genera Meandrusa, Teinopalpus and
Bhutanitis (see Fig. 5.8). The total species record from the Indian Himalayan Region (IHR)
and Peninsular India is listed in Appendix 5: 5.11).
Papilionidae diversity in Indian Himalayan Region
16
52 22 2
25
96
1
13
4
9
32 2201 01 0
0
5
10
15
20
25
30
1932-39 2003-2004
Papilionidae representation
Num
ber o
f spe
cies
per
gen
era Atrophaneura
Pachliopta
Troides
Papilio
Chilasa
Pathysa
Graphium
Lamproptera
Meandrusa
Teinopalpus
Bhutanitis
Figure 5.8: Papilionidae representation in the forest reserve from the present study (2003-
2004) as compared to the first documentation on the Papilionidae of the Indian Himalayan
Region by Evans (1932) and Talbot (1939). The number of species per genera are shown as
numbers above the bars.

79
5.3.2 Differences in total and mean abundances between seasons and years
5.3.2.1 Differences in total abundance between seasons and years
The total abundance of swallowtail butterfly individuals sampled in the five study
sites of the forest reserve amounted to 2921 in the dry and 6469 in the wet season of year 1
(2003). In year 2 (2004), 3025 individuals were recorded during the dry and 6004
individuals during the wet seasons (see Fig. 5.9, Appendix 5: 5.12 & 5.13).
2339
5173
2589
4852
582
1296
436
1152
0
1000
2000
3000
4000
5000
6000
Dry Year 1 Wet Year 1 Dry Year 2 Wet Year 2
Season and year
Tota
l sea
sona
l abu
ndan
ce
GarbhangaRani
Figure 5.9: Total abundance of swallowtail butterflies sampled in the 20 fixed transects of
the study area during the wet and dry seasons of 2003-2004.
In Garbhanga range the abundance of butterflies was higher during dry season of
year 2 (2589 vs. 2339). The wet season of year 1 recorded higher abundances than year 2
(5173 vs. 4852) as seen in Fig. 5.9.
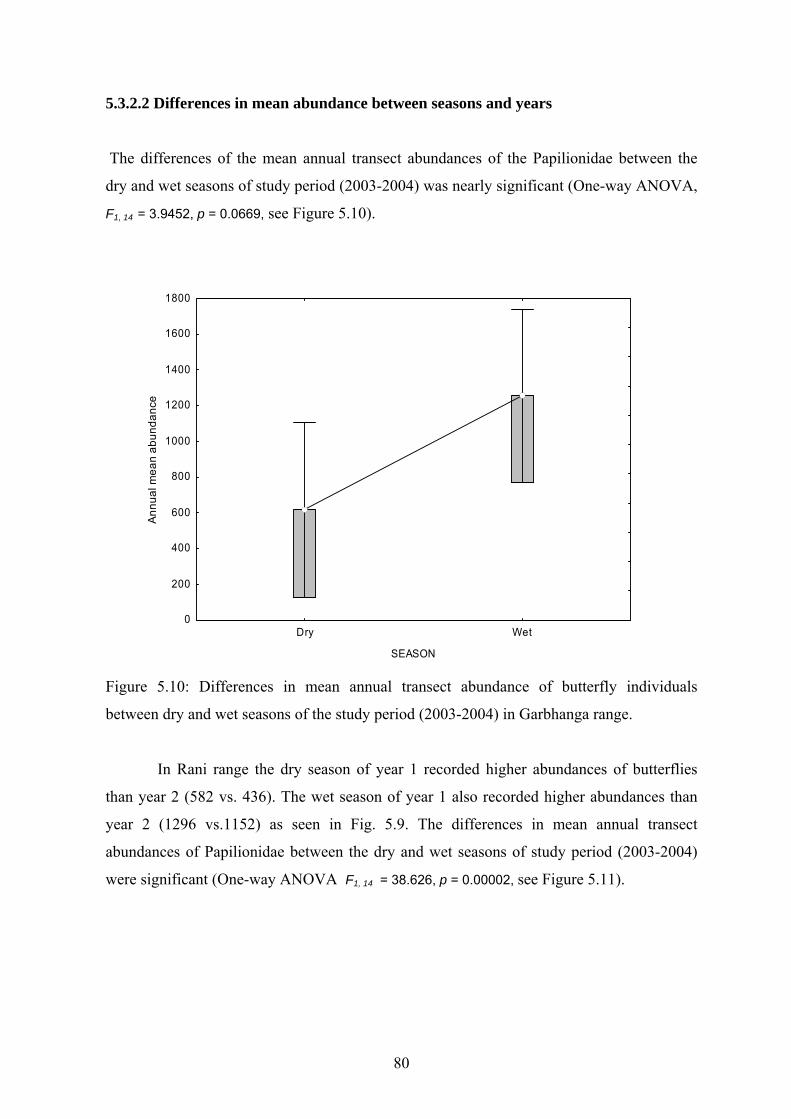
80
5.3.2.2 Differences in mean abundance between seasons and years
The differences of the mean annual transect abundances of the Papilionidae between the
dry and wet seasons of study period (2003-2004) was nearly significant (One-way ANOVA,
F1, 14 = 3.9452, p = 0.0669, see Figure 5.10).
Dry Wet
SEASON
0
200
400
600
800
1000
1200
1400
1600
1800
Ann
ual m
ean
abun
danc
e
Figure 5.10: Differences in mean annual transect abundance of butterfly individuals
between dry and wet seasons of the study period (2003-2004) in Garbhanga range.
In Rani range the dry season of year 1 recorded higher abundances of butterflies
than year 2 (582 vs. 436). The wet season of year 1 also recorded higher abundances than
year 2 (1296 vs.1152) as seen in Fig. 5.9. The differences in mean annual transect
abundances of Papilionidae between the dry and wet seasons of study period (2003-2004)
were significant (One-way ANOVA F1, 14 = 38.626, p = 0.00002, see Figure 5.11).

81
Dry Wet
SEASON
0
50
100
150
200
250
300
350
400
Ann
ual m
ean
abun
danc
e
Figure 5.11: Differences in mean annual transect abundance of butterfly individuals
between dry and wet seasons of study period (2003-2004) in Rani range.
The mean abundances of Papilionidae were higher during the wet season as
compared to the dry season of both the years for the study sites of Garbhanga range (see
Fig. 5.12). In the study sites of Rani range, the mean abundances were also higher in the wet
as compared to the dry season in both years (see Fig. 5.13).

82
0
500
1000
1500
2000
2500
3000
3500
DS1 WS1 DS2 WS2
Season and year
Mea
n ab
unda
nce
Figure 5.12: Mean abundances (mean number of butterfly individuals per season/year ±
standard error) of swallowtail butterflies sampled as individuals during dry and wet seasons
of 2003-2004 in the fixed transects (1-8 for dry and wet season of 2003 again resampled as
9-16 for dry and wet season of 2004) in study sites S1, S2 and S3 of Garbhanga Range (DS1
= Dry season year1, WS1 = Wet season year 1, DS2 = Dry season year 2, WS2 = Wet
season year 2).
0
100
200
300
400
500
600
700
800
DS1 WS1 DS2 WS2Season and year
Mea
n ab
unda
nce
Figure 5.13: Mean abundances (mean number of butterfly individuals per season/year ±
standard error) of swallowtail butterflies sampled as individuals during dry and wet seasons
of 2003-2004 in the fixed transects (1-8 for dry and wet season of 2003 again resampled as
9-16 for dry and wet season of 2004) in study sites S4 and S5 of Rani Range. (DS1 = Dry
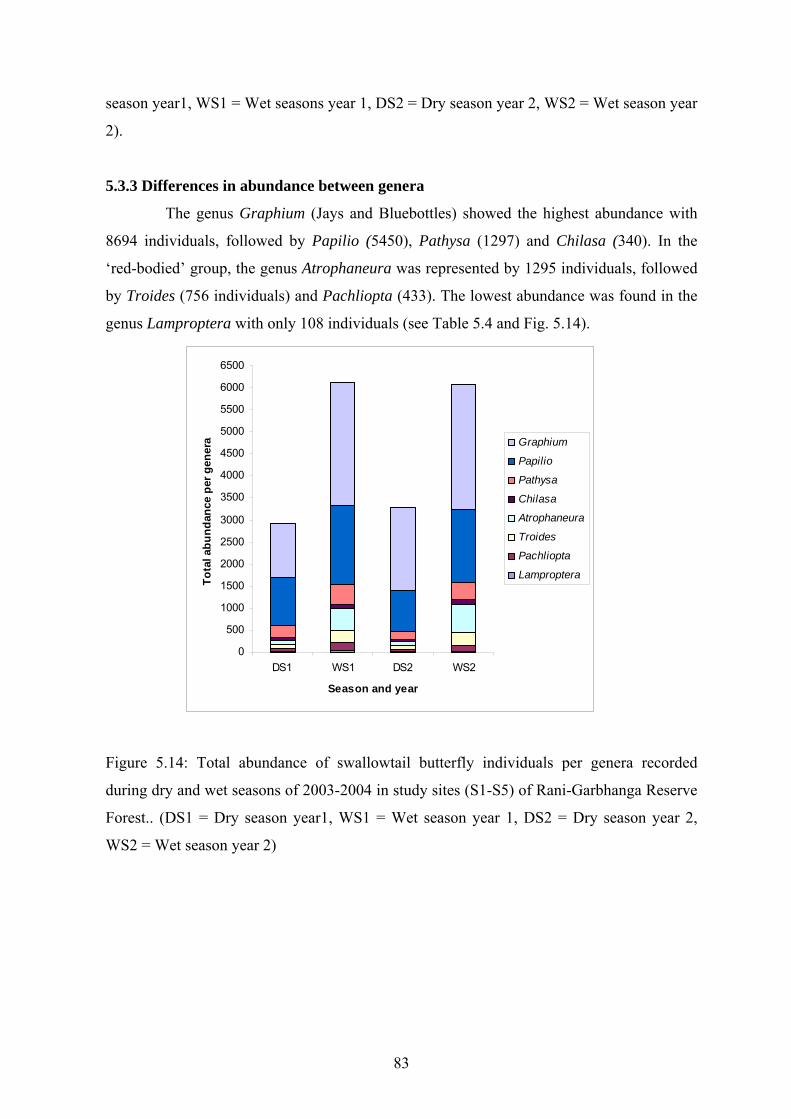
83
season year1, WS1 = Wet seasons year 1, DS2 = Dry season year 2, WS2 = Wet season year
2).
5.3.3 Differences in abundance between genera
The genus Graphium (Jays and Bluebottles) showed the highest abundance with
8694 individuals, followed by Papilio (5450), Pathysa (1297) and Chilasa (340). In the
‘red-bodied’ group, the genus Atrophaneura was represented by 1295 individuals, followed
by Troides (756 individuals) and Pachliopta (433). The lowest abundance was found in the
genus Lamproptera with only 108 individuals (see Table 5.4 and Fig. 5.14).
0
500
1000
1500
2000
2500
3000
3500
4000
4500
5000
5500
6000
6500
DS1 WS1 DS2 WS2
Season and year
Tota
l abu
ndan
ce p
er g
ener
a Graphium
Papilio
Pathysa
Chilasa
Atrophaneura
Troides
Pachliopta
Lamproptera
Figure 5.14: Total abundance of swallowtail butterfly individuals per genera recorded
during dry and wet seasons of 2003-2004 in study sites (S1-S5) of Rani-Garbhanga Reserve
Forest.. (DS1 = Dry season year1, WS1 = Wet season year 1, DS2 = Dry season year 2,
WS2 = Wet season year 2)

84
Table 5.4: Total and Mean abundances of Papilionidae genera sampled during dry and wet
seasons of 2003-2004 in the 20 fixed transects of the study area
Genera
DS 1
WS 1
DS 2
WS 2
Total abundance
Mean abundance
Graphium 1212 2771 1886 2825 8694 2173.5 Papilio 1092 1784 921 1653 5450 1362.5 Pathysa 271 456 194 376 1297 324.25 Chilasa 59 106 46 129 340 85 Atrophaneura 90 491 87 627 1295 323.75 Troides 96 273 100 287 756 189 Pachliopta 65 186 39 143 433 108.25 Lamproptera 26 39 19 24 108 27
Notes: DS 1 = Dry season year1, WS1 = Wet season year 1, DS 2 = Dry season year 2, WS
2 = Wet season year 2
The dominance in the total seasonal abundance of all the genera was pronounced
during the wet season of both the years (see Fig. 5.14, Table 5.4). Graphium and Papilio
species recorded the highest number of individuals during the wet seasons of both years and
the dominance amongst these genera were caused by Graphium sarpedon, Graphium doson,
Graphium agamemmnon, Papilio demoleus, Papilio memnon, Papilio polytes and Papilio
castor. Both genera also showed relatively small differences in abundances during the dry
and wet periods of both years (see Table 5.4). The abundances for the genera Pathysa,
Atrophaneura and Troides were also pronounced during the wet seasons of both years. The
dominance amongst these genera was caused by Pathysa aristeus, Pathysa antipathies,
Pathysa xenocles, Pathysa macareus, Atrophaneura dasarada and Troides aeacus. The
genus Pachliopta also recorded high abundances during the wet season of both years but
this was mainly caused by Pachliopta aristolochiae. The genus Lamproptera recorded the
lowest abundances during dry and wet seasons of both years. Graphium and Papilio were
the only genera, which recorded high abundances during dry and wet seasons of both years
and this amounted to these two genera having the highest total and mean abundances
throughout the study period (see Figs. 5.14 and 5.15).

85
0
500
1000
1500
2000
2500
3000
Gra
phiu
m
Papi
lio
Path
ysa
Chi
lasa
Atr
opha
neur
a
Troi
des
Pach
liopt
a
Lam
prop
tera
Genera
Mea
n ab
unda
nce
Figure 5.15: Mean abundances of Papilionidae genera sampled as individuals in the 20 fixed
transects of the study area during dry and wet seasons of 2003-2004.
5.3.4 Abundance and Geographic range
We tried to test the correlation between the mean abundance and geographic range
of the identified species within the study area. The correlation tests were done separately for
the study sites of Garbhanga and Rani ranges.
5.3.4.1 Correlation between the mean abundance and geographic range of the
swallowtail butterfly species assemblages in Garbhanga range
The relationship between the size of geographic range and mean abundance of
Papilionidae in the three study sites (pooled data of 12 fixed transects) showed a weak,
significant positive correlation (see Fig. 5.16). The Spearman rank correlation was 0.22.
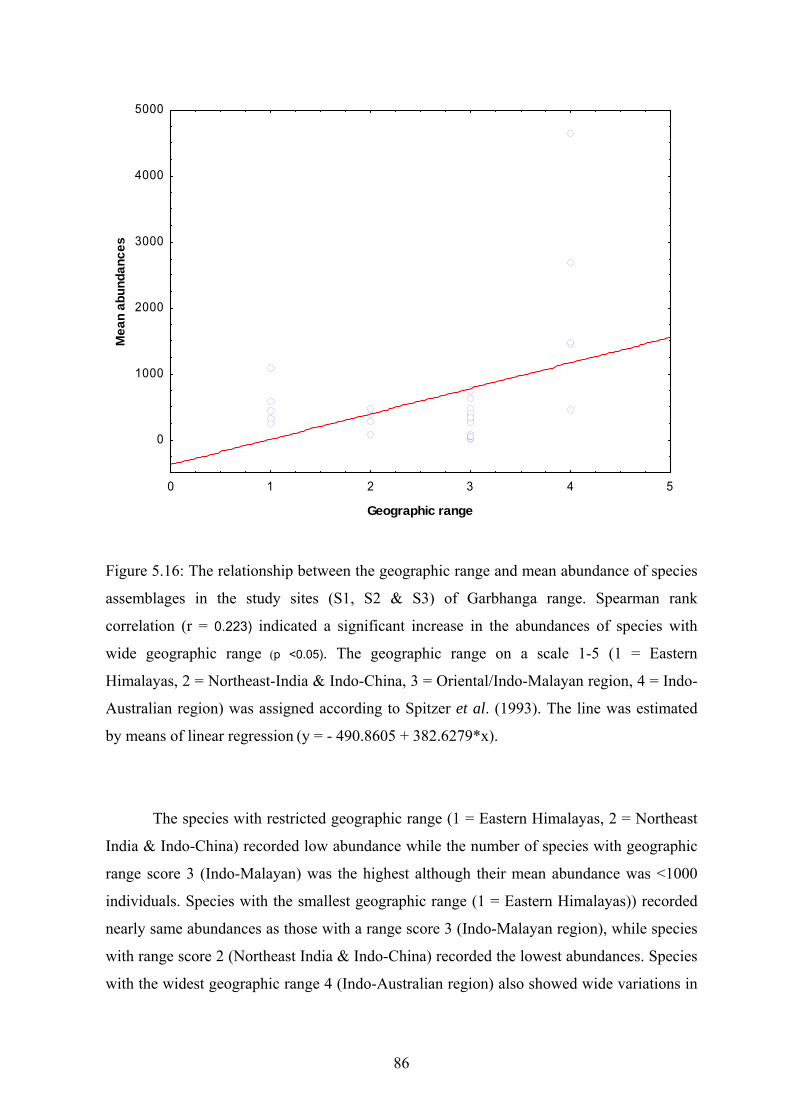
86
0 1 2 3 4 5
Geographic range
0
1000
2000
3000
4000
5000M
ean
abun
danc
es
Figure 5.16: The relationship between the geographic range and mean abundance of species
assemblages in the study sites (S1, S2 & S3) of Garbhanga range. Spearman rank
correlation (r = 0.223) indicated a significant increase in the abundances of species with
wide geographic range (p <0.05). The geographic range on a scale 1-5 (1 = Eastern
Himalayas, 2 = Northeast-India & Indo-China, 3 = Oriental/Indo-Malayan region, 4 = Indo-
Australian region) was assigned according to Spitzer et al. (1993). The line was estimated
by means of linear regression (y = - 490.8605 + 382.6279*x).
The species with restricted geographic range (1 = Eastern Himalayas, 2 = Northeast
India & Indo-China) recorded low abundance while the number of species with geographic
range score 3 (Indo-Malayan) was the highest although their mean abundance was <1000
individuals. Species with the smallest geographic range (1 = Eastern Himalayas)) recorded
nearly same abundances as those with a range score 3 (Indo-Malayan region), while species
with range score 2 (Northeast India & Indo-China) recorded the lowest abundances. Species
with the widest geographic range 4 (Indo-Australian region) also showed wide variations in

87
the total abundance (<1000 - >4500). An isolated case of one restricted range species with
geographic range score 1 recording a mean abundance of ≥ 1000 individuals was also found.
5.3.4.2 Correlation between the mean abundance and geographic range of the
swallowtail butterfly species assemblages in Rani range
The relationship between the size of the geographic range and mean abundance of
the Papilionidae species assemblages in the two study sites (pooled data of eight fixed
transects) of Rani range showed an insignificant but still positive correlation (see Fig. 5.17).
0 1 2 3 4 5
Geographic range
0
200
400
600
800
1000
Mea
n ab
unda
nce
Figure 5.17: The relationship between the geographic range and mean abundance of species
assemblages in the study sites (S4 & S5) of Rani range. Spearman rank correlation (r =
0.173) did not indicate a significant increase in the abundances of species with wide
geographic range (p >0.05). The geographic range on a scale 1-5 (1 = Eastern Himalayas, 2 =
Northeast-India & Indo-China, 3 = Oriental/Indo-Malayan region, 4 = Indo-Australian
region) was assigned according to Spitzer et al. (1993). The line was estimated by means of
linear regression (y = 117.1322+6.0951*x).

88
There was a significant increase in the mean abundance of species with an
increasing geographic range score from 1 (1 = Eastern Himalayas) to 3 (3 = Indo-Malayan
region) as seen in Fig. 5.17. However the mean abundance of species with the widest
geographic range 4 (Indo-Australian) was lower than that of species with range score 3.
Moreover an isolated case of one species from the narrowest range 1 (Eastern Himalayas),
which recorded higher abundance than species from all other ranges was also observed (see
Fig. 5.17).
5.3.5 Abundance and Feeding guild
5.3.5.1 Papilionidae species and their feeding guild
The red-bodied group comprising of the genera Atrophaneura (5 species),
Pachliopta (2 species) and Troides (2 species) and Chilasa clytia were ‘monophagous
generalist’ as their range of larval diet were limited to the plant families Aristolochiaceae (2
species) and Lauraceae (2 species). The black-bodied group comprising of the genus Papilio
(8 species) were classified as ‘oligophagous generalist’ as their larval resources were
confined to 10 plant species from the family Rutaceae and only one ‘black bodied’ species
(Papilio demoleus) was ‘polyphagous generalist’ with larval diet distributed among six
plant species from the families Rutaceae and Solanaceae. Three species from the genus
Graphium were classified as ‘polyphagous generalist’ with their larval diet breadth
distributed among 10 plant species from the families Lauraceae, Magnoliaceae, Annonaceae
and Fabaceae. The host-plants of the genus Pathysa (4 species) could not be identified in the
study area although the host association of this genus is known with Annonaceae and
Magnoliaceae (Haribal, 1992) and they could be classified as ‘polyphagous generalist’.
Only two species belonging to the genus Lamproptera were ‘monophagous specialist’ with
their larval resource known to be restricted to one plant species from the family
Hernandiaceae. The food-plant of the genus Lamproptera (Dragontails), Illigera cordata
(Haribal, 1992) could not be located or identified in the study area (see Appendix 5 : 5.10 &
5.14).

89
Larval feeding guild of the Papilionidae
10, 35%
8, 29%
8, 29%
2, 7%
Monophagous generalist
Oligophagous generalistPolyphagous generalist
Monophagous specialist
Figure 5.18: Larval diet breadth of the swallowtail butterflies of Rani-Garbhanga
Landscape. The number and percentage representation of species per feeding guild are
shown as numbers around the pie –diagram.
The overall percentage representation of the generalist feeders was higher than the
specialist feeders (see Figure 5.18). The ‘monophagous generalist’ feeding guild was
represented by the highest number of species and amongst these 10 species, nine species
belonged to the red-bodied ‘Aristolochiae’ feeding group.
5.3.5.2 Correlation between mean abundance of Papilionidae and their feeling guild The relationship between the mean abundance and the feeding guild of the
Papilionidae within the study area showed a significant and positive correlation (see Fig.
5.19). The Spearman rank correlation was 0.49.

90
Feeding guild
0
1000
2000
3000
4000
5000M
ean
abun
danc
e
MS MG OG PG
Figure 5.19: Relationship between mean abundance and feeding guild of the species
assemblages in the study area. Spearman rank correlation (r = 0.49) indicated a marked
increase in the mean abundance of generalist feeders from monophagy to polyphagy. The
line was estimated by means of linear regression (y = -762.2618+ 500.3036*x). The feeding
guild of the swallowtail butterflies was assigned as MS = Monophagous Specialist, MG =
Monophagous Generalist, OG = Oligophagous Generalist, PG = Polyphagous Generalist)
Although the number of monophagous species recorded in the study area was
the highest (12 species), this feeding guild recorded the lowest mean abundance (<1000)
while the polyphagous feeders (8 species) were the most abundant in the study area (≥
3000). The oligophagous feeding guild (8 species) also recorded lower abundances than the
polyphagous guild (≤ 1000). The Spearman rank correlation coefficient was weak but
positive (r = 0.49) and significant (p = 0.0068) (see Fig. 5.19). There was a marked increase
in the generalist feeders from monophagy to polyphagy as seen in Fig. 5.19. The list of the
swallowtail butterfly species recorded in the study area along with their respective feeding
guilds are given in Appendix 5: 5.10).

91
5.4 Ordination of the swallowtail butterfly assemblages in relation to their abundance and distribution or habitat specificity
The matrix of butterfly abundance used in analyses is presented in Appendix 5: 5.15
- 5.22. Constrained Correspondence Analysis (CCA) is a method of constrained ordination
and it aims to relate the species composition of a community to external (environmental)
variables. To investigate the effects of environmental variables on the species space as well
as season and the continuum, data were collected from the four fixed transects in each study
site twice in a year for 2 successive years, e.g., transect 1 sampled in dry season of 2003 is
again sampled as transects 5, 9 and 13 in wet season of 2003, dry season of 2004 and wet
season of 2004 respectively. The sets of environmental variables used for the multivariate
ordination are presented in Appendix 4: 4.2 – 4.4) and the summary of the analyses are
presented in Appendix 5: 5.23 & 5.24. The analyses were performed in ‘R’ using the
‘Vegan’ subroutine.
5.4.1 Ordination of the swallowtail butterfly assemblages in relation to their
abundance and distribution in Garbhanga range
5.4.1.1 Ordination of the group assemblages (Genus-wise)
The ordination plot shows the effect of rainfall, year, altitude, latitude and longitude
(shown as vectors or arrows), and season and forest type (shown as categorical variables
separated by 1st and 2nd axes) on the Papilionid group assemblages (genus-wise) within the
study sites (see Fig. 5.20). Species and group assemblages increasing in abundance during
the study period are found towards the centre of origin and those decreasing are deviated
from the centre of the ordination diagram. Mormons (Papilio sp.), Limes (Papilio
demoleus), Zebras (Pathysa sp.), Swordtails (Pathysa sp.), Jays and Bluebottles (Graphium
sp.) were recorded in high abundances and could be classified as fairly common, while
Windmills and Batwings (Atrophaneura sp.), Birdwings (Troides sp.) and Ravens (Papilio
castor castor) were rare. Peacocks and Helens (Papilio sp.), Roses (Pachliopta sp.) and
Dragontails (Lamproptera sp.) were intermediate. The axes clearly differentiate the seasons
(horizontal) and forest types (vertical) thus showing the effect of season and habitat (forest
type) on the group assemblages of swallowtail butterflies within the study sites. The
succession of butterfly abundance (season to season and year to year) can be seen from the
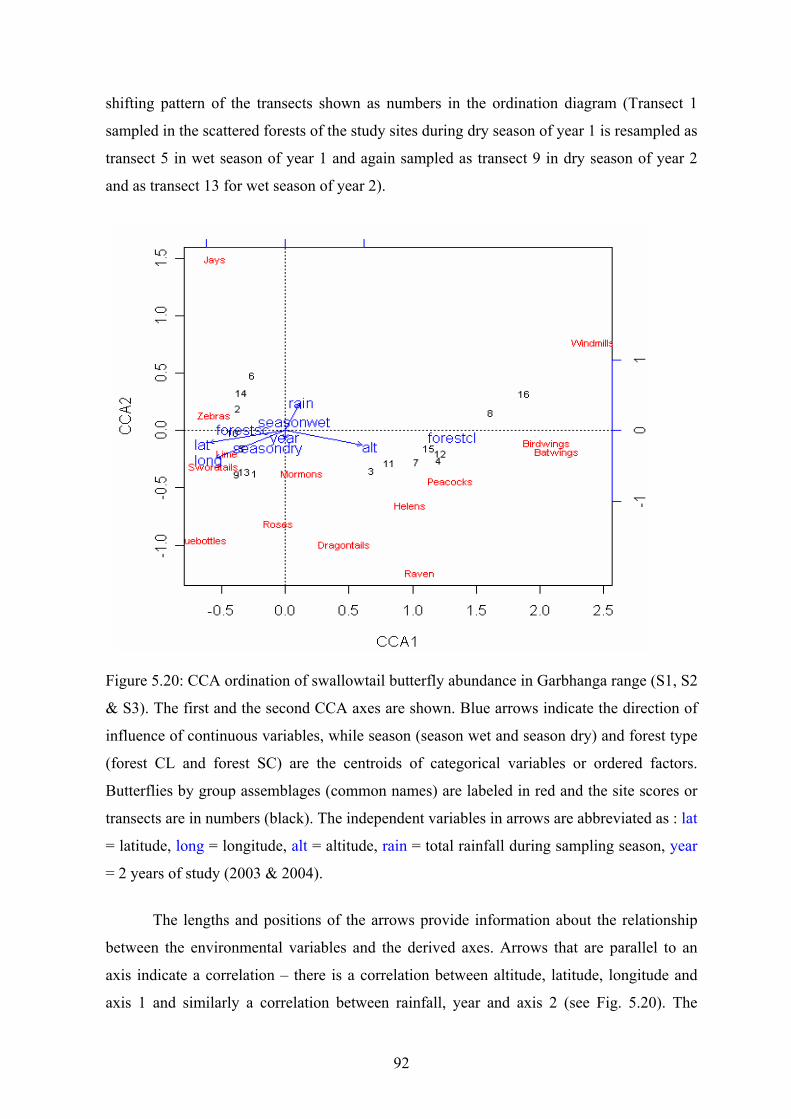
92
shifting pattern of the transects shown as numbers in the ordination diagram (Transect 1
sampled in the scattered forests of the study sites during dry season of year 1 is resampled as
transect 5 in wet season of year 1 and again sampled as transect 9 in dry season of year 2
and as transect 13 for wet season of year 2).
Figure 5.20: CCA ordination of swallowtail butterfly abundance in Garbhanga range (S1, S2
& S3). The first and the second CCA axes are shown. Blue arrows indicate the direction of
influence of continuous variables, while season (season wet and season dry) and forest type
(forest CL and forest SC) are the centroids of categorical variables or ordered factors.
Butterflies by group assemblages (common names) are labeled in red and the site scores or
transects are in numbers (black). The independent variables in arrows are abbreviated as : lat
= latitude, long = longitude, alt = altitude, rain = total rainfall during sampling season, year
= 2 years of study (2003 & 2004).
The lengths and positions of the arrows provide information about the relationship
between the environmental variables and the derived axes. Arrows that are parallel to an
axis indicate a correlation – there is a correlation between altitude, latitude, longitude and
axis 1 and similarly a correlation between rainfall, year and axis 2 (see Fig. 5.20). The

93
directions of the arrows indicate the direction of maximum change of that variable across
the ordination plot. In the ordination plot (see Fig. 5.20), altitude affects the abundances of
Peacocks and Helens (Papilio sp.), Birdwings (Troides sp.), Batwings (Atrophaneura sp.) –
increasing altitude is correlated with increasing abundances of these genera or group
assemblages. Similarly lower altitude implies more abundance of Zebras and Swordtails
(Pathysa sp.) and Limes (Papilio sp.). The length of the arrow indicates the strength of that
correlation. Thus a long arrow for altitude indicates a large change and implies that change
in altitude is strongly correlated with the butterfly community variation as shown by the
ordination diagram (see Fig. 5.20).
Sampling sites that are located close to each other in the ordination are assumed to
have similar species composition and environmental conditions (Storch et al., 2003).
However in our ordinations, as the pooled transects are already partitioned by season and
forest types, we have tried to show the effects of year and season on the butterfly abundance
by each transect. Considering the 1st transect, (points or sites 1, 5, 9 and 13 as seen in Fig.
5.20), there was an increase in the butterfly abundance during the wet season of the first
year, but the dry season in year 1 and both dry and wet seasons in year 2 were more or less
same in terms of butterfly abundance. Again transect 4 in the closed forest is resampled as
transects 8, 12 and 16 and in the ordination plot it is seen that transects 8 and 16 are
deviated from the centre indicating low abundances of butterflies during wet season of both
years 1 and 2 while transects 4 and 12 are nearer to the origin indicating comparatively
higher abundances of butterflies during the dry season of years 1 and 2. Thus transects
located closer to the origin indicated higher abundances of species during the sampling
period and those located far from origin indicated decreasing abundances with respect to
year, season and forest type. Therefore the sites scores in the ordination plot showed the
changing abundances of butterfly communities throughout the study period while the group
scores showed the overall distribution pattern of the Papilionidae group assemblages within
the study area.
Although Graphium species recorded the highest proportional abundances in the
study area, in the ordination on the group and species assemblages (see Figs. 5.20, 5.21&
5.22) Jays and Bluebottles (Graphium sp.) are deviated from the centre indicating lower
abundance throughout the study period; This can be explained by their high abundances in
scattered forests and low abundances in closed forest in both years and in wet and dry

94
seasons resulting in a shift from center in the constrained ordination map. Again if we
examine the relative position of the Limes (Papilio demoleus) and Zebras and Swordtails
(Pathysa sp.) in the ordination plots we can see that these group or species assemblages are
more concentrated towards the centre (Figs. 5.20, 5.21 & 5.22). The abundances of the
Limes (Papilio demoleus) were directly related to the amount of rainfall – lower rainfall
implied higher abundances of Papilio demoleus and secondly more number of individuals
was encountered in transect 1. Higher abundances of Zebras and Swordtails (Pathysa sp.)
recorded in transect 1 compared to the other transects could have been attributed to the
abundant mud-puddling sites in transect 1.
5.4.1.2 Ordination of the species assemblages
Figure 5.21: CCA ordination of locations and distribution of swallowtail butterflies of
Garbhanga range (pooled data of 12 fixed transects of study sites S1, S2 & S3) in species
space. Site scores or transects are in numbers (black). Transects 1-4 (Dry season) are
repeated for the wet season (5-8) for year 1 and again for year 2 (9-12 for dry season and

95
13-16 for wet season). The ordination plot shows the species assemblages (Common names)
in red. The independent variables in arrows are abbreviated as : lat = latitude, long =
longitude, alt = altitude, rain = total rainfall during sampling season, year = 2 years of study
(2003 & 2004).
The gradual change in the species abundance from wet to dry season and from 1st to
the 2nd year can be visualised. Transect 3 in the closed forest sampled during dry season of
year 1 is deviated from the centre indicating lower abundances of butterflies. The same
transect when resampled in the same forest type showed decreasing abundances of species
assemblages during the sampling period with respect to season and year – transect 3
resampled as transects 7, 11 and 15 are deviated from the centre indicating lower
abundances of butterflies during the wet season of year 1 and dry and wet seasons of year 2.
The overall site scores in the ordination plot indicated higher abundances of butterflies
encountered in the open forest transects (see Figs. 5.21 & 5.22).
Jays and Bluebottles (Graphium sp.), Zebras and Swordtails (Pathysa sp.), Limes
(Papilio demoleus), were characteristic of scattered or open forests, while Birdwings
(Troides sp.), Batwings and Windmills (Atrophaneura sp.) occupied the closed forest.
Ravens, Mormons and Peacocks (Papilio sp.), Roses (Pachliopta sp.), Mimes (Chilasa
clytia) and Dragontails (Lamproptera sp.) were intermediate (see Fig.5.20). In the
ordination map on species assemblages (see Fig. 5.21) a similar pattern on the habitat
specificity of the swallowtail butterflies as in the group assemblages (see Fig. 5.20) is
observed. The scattered/open forest type had a significantly higher abundance as compared
to the closed forest type (p<0.001)although the number of closed forest species was higher
than the open forest species (Fig.5.21). Endemic species from the closed forest like Great
Windmill (Atrophaneura dasarada), Common Batwing (Atrophaneura varuna), Golden
Birdwing (Troides aeacus), Common Raven (Papilio castor), Krishna Peacock (Papilio
krishna) with restricted geographic ranges were deviated from the centre while open forest
species with wider geographic ranges like the Limes (Papilio demoleus), Five-Bar Swordtail
(Pathysa antipathies), Lesser Zebra (Pathysa macareus), Great Mormon (Papilio memnon)
were relatively close to the origin (see Fig. 5.21). Again endemic species from the open
forest like Chain Swordtail (Pathysa aristeus) and Great Zebra (Pathysa xenocles) were
closer to the origin while wide-ranging species like Common Jay (Graphium doson), Tailed
Jay (Graphium agammemnon), Bluebottle (Graphium sarpedon) and Green Dragontail

96
(Lamproptera meges) were deviated from the origin because both endemics and wide-
ranging species were not represented in all the transects.
5.4.1.3 Effect of independent variables on species assemblages within Garbhanga range
Continuum of seasonal abundance of swallowtail butterflies in the study sites is
significant as the direction of the arrow showing year as a variable is highly correlated with
axis 2 (see Figs. 5.20, 5.21& 5.22). The abundances of species typical of closed forests such
as Common Windmill (Atrophaneura polyeuctes), Great windmill (Atrophaneura
dasarada), Lesser Batwing (Atrophaneura aidoneus), Golden Birdwing (Troides aeacus),
Paris Peacock (Papilio paris) and species from the scattered/open forests like Common Jay
(Graphium doson), Tailed Jay (G. agammemnon) and Great Zebra (Pathysa xenocles) were
higher during the wet seasons of both years. The abundances of closed forest species such as
Common Batwing (Atrophaneura varuna), White-headed Batwing (Atrophaneura sycorax),
Common Birdwing (Troides helena), Common Peacock (Papilio polyctor), Krishna
Peacock (Papilio krishna), Yellow Helen (Papilio nephelus), Red Helen (Papilio helenus)
and Common Raven (Papilio castor) and of species typical of open forests such as
Swordtails and Zebras (Pathysa sp.) decreased as year progressed – abundances were higher
during year 1 (see Figs. 5.21& 5.22). However the length of the arrow showing the effect of
year indicated that year as an independent variable did not have a significant effect on the
changing abundances of the butterfly species assemblages or that there were not significant
differences in the abundances of butterflies between the two years (see Figs. 5.20, 5.21 &
5.22).
The direction of the arrow showing the effect of the amount of rainfall on the
swallowtail butterfly assemblages within the sampling period indicated that rainfall was
highly correlated with axis 2 (see Figs. 5.20, 5.21& 5.22). The abundances of Graphium
doson (Common Jay) and Graphium agammemnon (Tailed Jay) from the open forests and
Atrophaneura dasarada (Great Windmill), A polyeuctes (Common Windmill) and Papilio
paris (Paris Peacock) from the closed forests were affected by rainfall and showed higher
abundances with higher amount of rainfall during the wet season as year progressed.
Species like the Golden Birdwing (Troides aeacus), Common Birdwing (Troides helena),
and Red Helen (Papilio helenus) from the closed forests and Great Mormon (Papilio
memnon), Common Mormon (Papilio polytes) and Common Rose (Pachliopta
aristolochiae) from the intermediate areas and Papilio demoleus (Limes), Swordtails

97
(Pathysa sp.) and Bluebottles (Graphium sarpedon) from the open forests showed declining
abundances with decreasing rainfall (see Figs. 5.21 & 5.22). However the length of the
arrow showing rainfall as an independent variable did not indicate an overall large or
significant change on the butterfly abundances.
The direction of the arrow showing the effect of altitude on the abundances of
butterflies indicated that species characteristic of closed forest were found to have higher
abundances at higher elevations and species typical of open forests were found to have
higher abundances at lower elevations (see Figs 5.20, 5.21& 5.22). Altitude as an
independent variable was found to be correlated with axis 1 and the length of the arrow for
altitude also showed a strong correlation implying a large variation in the abundances of the
closed forest species with increasing elevation (see Figs. 5.20, 5.21 & 5.22).
The direction of the arrows showing latitude and longitude as variables indicated that
there was a significant correlation between the geographical position of the study sites
(habitats or forest types) and abundances of the butterfly assemblages within the forest
reserve (see Figs. 5.20, 5.21 & 5.22). The arrows for latitude and longitude are correlated
with axis 1 and the lengths of the arrows also indicate a large variation in the abundance of
the species assemblage. However this correlation between geographical position and species
abundance and distribution could not be meaningfully explained probably due to the small
geographical area of the study sites and the proximity between the sampling transects.
The ordination of the species assemblages by their scientific names are presented in
Fig. 5.22 and shows the same results as described above for the effects of the independent
and categorical variables on the habitat association and changing abundance patterns of the
swallowtail butterfly community in the three study sites of Garbhanga range across the
study period.

98
Figure 5.22 : CCA ordination of locations and distribution of swallowtail butterflies of
Garbhanga range (pooled data of 12 fixed transects of study sites S1, S2 & S3) in species
space. Site scores or transects are in numbers (black). Transects 1-4 (Dry season) are
repeated for the wet season (5-8) for year 1 and again for year 2 (9-12 for dry season and
13-16 for wet season). The ordination plot shows the species assemblages (Scientific names)
in red. The independent variables in arrows are abbreviated as : lat = latitude, long =
longitude, alt = altitude, rain = total rainfall during sampling season, year = 2 years of study
(2003 & 2004).
In Garbhanga range (3 study sites and pooled data from 12 transects) it was seen that
the CCA axes 1 and 2 explained around 62% variation by all the constraints in the
abundance (genus wise), while a total of 69% variation in the data were explained by both
axes. The permutation test for CCA under direct model (all constraints together) were

99
significant (p<0.001). In species abundance, the CCA axes 1 and 2 explained 61% variation
out of the total 71% and the full model was significant (p<0.001) (see Permutation test in
Appendix 5: 5.23.4).
5.4.2 Ordination of the swallowtail butterfly assemblages in relation to their
abundance and distribution in Rani range
5.4.2.1 Ordination of the group assemblages (Genus-wise)
The ordination plot for Rani range (see Fig. 5.23) shows Birdwings (Troides sp.),
Peacocks and Helens (Papilio sp.), Dragontails (Lamproptera sp.), Swordtails (Pathysa sp.),
Jays and Bluebottles (Graphium sp.) were having high abundances and could be classified
as common while Limes and Mormons (Papilio sp.), Zebras (Pathysa sp.), Mimes (Chilasa
clytia) and Windmills (Atrophaneura sp.) recorded low abundances and could be classified
as rare. Ravens (Papilio sp.), Batwings (Atrophaneura sp.) and Roses (Pachliopta sp.)
recorded moderate abundances. The separating effects of habitat on the group assemblages
were clearly indicated in the ordination plot as the Jays and Bluebottles (Graphium sp.),
Zebras and Swordtails (Pathysa sp.) and Roses (Pachliopta sp.) were characteristic of
scattered forests while others occupied the closed forests. Transects overlaid on the
ordination matrix showed the effect of season and year on the abundances of butterflies.
Transect 1 is deviated from the centre indicating lower abundances of butterflies in the
scattered or open forest during the dry season of year 1. The same transect is resampled as 5,
9 and 13 during the wet season of year 1 and dry and wet seasons of year 2. The relative
positions of 5, 9 and 13 on the ordination matrix indicated that these sites recorded an
overall higher abundance of butterflies during the latter part of the sampling period and the
wet season of year 2 (site 13 in the ordination) recorded the highest abundance. Thus the
gradual change in the butterfly abundance with respect to season and year is clearly
indicated by the position of the sites scores in the ordination diagram (see Fig. 5.23).
Altitude is being represented by axis 1 and amount of rainfall as well as year are represented
by axis 2. However latitude and longitude was not correlated to any axis (see Fig. 5.23).
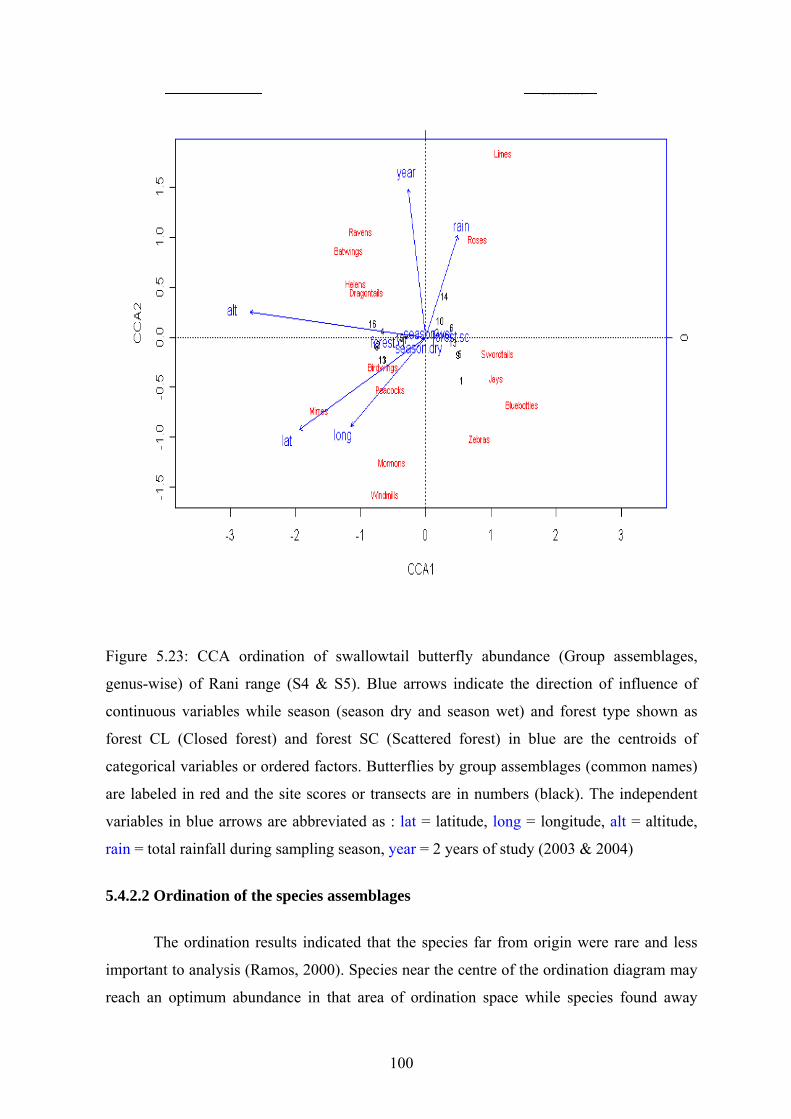
100
Figure 5.23: CCA ordination of swallowtail butterfly abundance (Group assemblages,
genus-wise) of Rani range (S4 & S5). Blue arrows indicate the direction of influence of
continuous variables while season (season dry and season wet) and forest type shown as
forest CL (Closed forest) and forest SC (Scattered forest) in blue are the centroids of
categorical variables or ordered factors. Butterflies by group assemblages (common names)
are labeled in red and the site scores or transects are in numbers (black). The independent
variables in blue arrows are abbreviated as : lat = latitude, long = longitude, alt = altitude,
rain = total rainfall during sampling season, year = 2 years of study (2003 & 2004)
5.4.2.2 Ordination of the species assemblages
The ordination results indicated that the species far from origin were rare and less
important to analysis (Ramos, 2000). Species near the centre of the ordination diagram may
reach an optimum abundance in that area of ordination space while species found away

101
from the centre of the diagram but not near the edges are most likely to display clear
relationships with the ordination axes (McCune & Grace, 2002). Forest –dependant species
like Golden Birdwing (Troides aeacus), Common Birdwing (Troides helena), Common
Peacock (Papilio polycter), Krishna Peacock (Papilio krishna), Yellow Helen (Papilio
nephelus), Lesser Batwing (Atrophaneura aidoneus), Crimson rose (Pachliopta hector),
Green Dragontail (Lamproptera meges), Common Windmill (Atrophaneura polyeuctes),
Great Mormon (Papilio memnon), and scattered or open forest dependant species like the
Bluebottles (Graphium sarpedon), Common Jay (Graphium doson), Five-Bar Swordtail
(Pathysa antipathes), Chain Swordtail (Pathysa aristeus), Lesser Zebra (Pathysa macareus)
were found to be more abundant species and therefore could be classified as common
species. Red Helen (Papilio helenus), Common Raven (Papilio castor), Common Batwing
(Atrophaneura varuna) characteristic of the closed forests and Tailed Jay (Graphium
agammemnon), Common Rose (Pachliopta aristolochiae), Great Zebra (Pathysa xenocles)
and Common Mormon (Papilio polytes) from the open forests were fairly abundant. Closed
forest species like Great Windmill (Atrophaneura dasarada) and Limes (Papilio demoleus)
from the open forests could be classified as rare based on their locations in the ordination
diagram (see Fig. 5.24).

102
Figure 5.24: Ordination plot of CCA of swallowtail butterfly species matrix on sampling
locations (pooled data of 8 fixed transects) of Rani range (S4 & S5) during the wet and dry
seasons of 2003-2004. The common names of the sampled butterfly species assemblage are
in red and the site scores are in black numbers. Transects 1-4 (Dry season) are repeated for
the wet season (5-8) for year 1 and again for year 2 (9-12 for dry season and 13-16 for wet
season). The independent variables in blue arrows are abbreviated as : lat = latitude, long =
longitude, alt = altitude, rain = total rainfall during sampling season, year = 2 years of study
(2003 & 2004)
However taking into account the effect of rainfall as a variable on the species
abundances it could be inferred that the abundance of Limes (Papilio demoleus) was
significantly affected by rainfall and therefore higher the amount of rain higher the

103
abundances of Limes (Papilio demoleus) and vice versa. Secondly this species was mostly
encountered only in the open/scattered forest transects while the counts from the closed
forest transects were almost negligible. This explains the deviation of the Limes from the
centre of the ordination plot. The separating effects of habitat or forest types on the species
assemblages were clearly indicated in the ordination map (see Fig. 5.23). Species like the
White Dragontail (Lamproptera curius) and Common Mormon (Papilio polytes) which
were encountered in moderate abundances in both open and closed forest transects could be
classified as ‘intermediate species’ while axis 2 clearly demarcated the habitat specificity of
the species assemblages within the study sites. Forest –dependant species were located on
the right side and open forest species on the left side of the ordination diagram (see Figs.
5.23, 5.24 & 5.25).
5.4.2.3 Effect of Independent variables on species assemblages within Rani range
The continuum of seasonal abundance of swallowtail butterflies in the study sites is
significant as the direction of the arrow showing year as a variable is highly correlated with
axis 2 (see Figs. 5.24 & 5.25). The abundances of species typical of closed forest such as
Red Helen (Papilio helenus), Common Batwing (Atrophaneura varuna) and Common
Raven (Papilio castor) and species typical of open forests such as Tailed Jay (Graphium
agammemnon), Common Rose (Pachliopta aristolochiae) and Limes (Papilio demoleus), as
well as of species like White Dragontail (Lamproptera curius) from the intermediate zones
were higher during the wet season of year 2 (see Fig. 5.23). The length of the arrow
showing year as a variable indicated a strong correlation between the sampling period and
total abundances of the species assemblages- there was a large variation in the abundances
of the butterfly species between the years of study.
The direction of the arrow showing rainfall as an independent variable was
correlated with axis 2 and showed that the abundances of Limes (Papilio demoleus),
Common Rose (Pachliopta aristolochiae), Tailed Jay (Graphium agammemnon), Common
Raven (Papilio castor), Common Batwing (Atrophaneura varuna), Red Helen (Papilio
helenus) and White Dragontail (Lamproptera curius) were strongly influenced by rainfall
and variations in the total abundance of these species was correlated with the amount of
rainfall. Therefore it could be stated that the wet season abundances of these species were
significantly higher than the dry season abundance. However the length of the arrow
104
showing rainfall as an independent variable did not indicate significantly large variations in
the abundance levels of the species assemblages.
The direction of the arrow showing altitude as an independent variable was highly
correlated with axis 1 and indicated that a change in altitudinal gradient had a significant
effect on the distribution of the species assemblages within the study sites. The species
typical of the open forest transects were found at lower elevations while forest-dependant
species were found at higher elevations. Altitude showed a strong correlation with the
butterfly distribution and variation in abundance as indicated by the length of the arrow
although the elevational gradient within the study sites was not very large. This could be
attributable to the resampling of the same fixed transects.
The direction of the arrows showing latitude and longitude as variables indicated that
the geographical position of the transects or the study sites were not significantly correlated
with either axis 1 or axis 2 as seen in the ordination plots (see Figs. 5.23, 5.24 & 5.25). The
length of the vectors however indicated a large variation in the abundances of the species
assemblages. However again such a weak or insignificant correlation could be attributed to
the small size of the sampling area and the close location of the sampled transects as also
observed in the ordination on the swallowtail butterfly assemblages in Garbhanga range (see
Figs. 5.20, 5.21 & 5.22).
The ordination of the species assemblages by their scientific names are presented in
Fig. 5.25 and shows the same results as described above for the effects of the independent
and categorical variables on the habitat association and changing abundance patterns of the
swallowtail butterfly community in the two study sites of Rani range across the study
period.

105
Figure 5.25 : Ordination plot of CCA of swallowtail butterfly species matrix on sampling
locations (pooled data of 8 fixed transects) of Rani range (S4 & S5) during the wet and dry
seasons of 2003-2004. The scientific names of the sampled butterfly species assemblage are
in red and the site scores are in black numbers. Transects 1-4 (Dry season) are repeated for
the wet season (5-8) for year 1 and again for year 2 (9-12 for dry season and 13-16 for wet
season). The independent variables in blue arrows are abbreviated as : lat = latitude, long =
longitude, alt = altitude, rain = total rainfall during sampling season, year = 2 years of study
(2003 & 2004)
In Rani range (2 study sites and pooled data from 8 transects) it was seen that the
CCA axes explained around 30% variation by all the constraints in the abundance (genus
wise), while 37% variation in the data were explained in total. The permutation tests for
CCA under direct model (all constraints together) were significant (p<0.001). In species

106
abundance, the CCA axes explained around 32% variation out of the total 42 % and the full
model was significant (p<0.001) (see Permutation test in Appendix 5: 5.24.4).
5.4.3 Partial conclusion on CCA on swallowtail butterfly assemblages within the study
area
The ordinations showed how the forest swallowtail butterfly community could be
divided into two clear-cut strata (see Figs 5.20-5.25). There is a group of sun-loving open
forest species, and a group of shade preferring closed forest species. The ordination results
indicated that forest type, season, year and rainfall accounted for most variance in the
distribution and abundance of the swallowtail butterflies within the forest reserve and their
effect was highly significant. Altitude was found to have a significant effect on the
distribution and abundance of the species assemblages within all the five study sites of
Garbhanga and Rani ranges thereby indicating that some of the closed forest species were
found to occur in higher abundances at higher elevations while some of the open forest
dependant species were found to occur at higher abundances at lower elevations (see Figs.
5.20-5.25). The effect of altitude on species abundance and distribution was observed to be
more pronounced in the study sites of Garbhanga than Rani range. However such a kind of
significant correlation could have been related more to the sampling design where the closed
forest transects were located at higher elevations while the open forest transects were
located at lower elevations. Geographical position (latitude and longitude) did not account
for an overall strong significant effect on the total variance of the swallowtail butterfly
species abundance and distribution pattern in the study area although statistically a
significant correlation could atleast be seen in the group-wise (Genus) and species
ordination for the study sites of Garbhanga range (see Figs. 5.20, 5.21 & 5.22).
Based on our results from the CCA ordination on the seasonal abundance and habitat
association pattern of the swallowtail butterfly species assemblages and the pre-defined
geographic ranges of the Papilionidae (Spitzer et.al., 1993) the following tentative
conclusions could be made:
• Species with narrow geographic ranges (1 = Eastern Himalayas & 2 = Indo-China)
were found to be confined to the closed forest (Atrophaneura dasarada,
Atrophaneura varuna, Troides aeacus, Papilio castor, Papilio nephelus, Papilio
krishna) whereas species with wider ranges were characteristic of the open forests

107
(Graphium sp., Papilio demoleus, Pachliopta aristolochiae, Papilio polytes).The
geographic ranges of the species assemblages are defined according to Spitzer et al.
(1993) in Appendix 5: 5.10. Our findings have conformity with the records of
Spitzer et al. (1997).
• Amongst the 16 characteristic climax forest species, six species had restricted
distribution (geographic range 1 & 2) while another nine species had range 3 (Indo-
Malayan) and only one species (Papilio helenus) had the widest geographic range
score 4 (See Appendix 5: 5.10). A total of nine species were found to be associated
with scattered or open forest out of which only two species had restricted range
score 1 (Pathysa aristeus and Pathysa xenocles) and another two species had range
score 3 (Pathysa antiphates and Pachliopta aristolochiae) while five species
(Graphium sp., Papilio demoleus and Pathysa macareus) had the widest range score
4 (See Appendix 5: 5.10). The species distribution trend with respect to association
by forest type (closed and open /scattered forest) was similar for the study sites of
both Garbhanga and Rani ranges (see Figs. 5.20-5.25).
There is a difficulty in interpreting the data on species seasonality as they come from
relatively short periods of different years and the dynamics on species seasonality are
dependant on variations in patterns of rainfall (Owen, 1971; Wolda, 1978). With respect to
the effect of climate or season on the butterfly abundance and distribution, we considered all
the climatic parameters relating to mean maximum temperature, mean humidity and total
rainfall during the sampling seasons. However as is typical of tropical monsoon climate
where there is very little variation in the annual mean maximum and minimum temperature
and humidity, only the effect of rainfall was significant and was displayed in the ordinations
for examining the effect of season on butterfly abundance and distribution pattern.

108
5.5 Impact of season and forest type on species diversity
5.5.1 Study sites of Garbhanga range
There was no overall difference in diversity between dry and wet seasons of both
years (One-way ANOVA by season; p> 0.2 for H’, D, 1/D and alpha diversity). However all
the indices were significantly higher in the closed forest transects for both years as
compared to open forest transects (One-way ANOVA by habitat type; H’, F1, 10 =17.1,
P<0.05; D, F1, 10 = 15.5, P<0.05; 1/D, F1, 10 = 9.9, P<0.05; α diversity, F1, 10 = 7.1, P<0.05,
see Table 5.5).
Table 5.5: Diversity indices of swallowtail butterfly species assemblages in the open and
closed forest habitats of Garbhanga range (pooled data of 12 fixed transects) during dry and
wet seasons of 2003-2004. The butterfly species diversity, richness, evenness and
rarefaction estimates were defined by forest type and season.
Species wise diversity indices in Garbhanga range by forest type & season Forest Season
Year 1 Year 2 Year 1 Year 2 Diversity indices
Closed Scattered Closed Scattered Dry Wet Dry Wet H’ (Shannon’s index) 2.8933 2.2641 2.7715 2.0913 2.5768 2.5453 2.2659 2.4898D (Simpson’s index) 0.9304 0.8308 0.9160 0.7826 0.8797 0.8728 0.8032 0.86061/D (Inverse Simpson) 14.3702 5.9095 11.9054 4.5989 8.3091 7.8636 5.0826 7.1754R2 (Rarefaction) 1.9310 1.8309 1.9166 1.7827 1.8800 1.8730 1.8036 1.8608(α) Alpha diversity 4.8743 3.6459 4.9246 3.8025 4.4717 3.8928 4.3873 3.9334S (Species richness) 28 27 28 28 28 28 28 28J (Pielou's evenness) 0.8683 0.6869 0.8317 0.6276 0.7733 0.7638 0.6800 0.7472
There was no significant difference in species richness between habitats or forest
types and season (One-way ANOVA, by forest type: F1, 10 =2.3, p> 0.2; by season: F1, 10
=3.6, p> 0.2, see Table 5.5). The Evenness and rarefaction of species were significantly
higher in the closed forests during both years as compared to open forest (One-way
ANOVA, by forest type: Evenness: F1, 10 = 13.5, P<0.05; Rarefaction:, F1, 10 = 15.2, P<0.05,
see Table 5.5). However there were no significant differences in the evenness and
rarefaction of species between seasons (One-way ANOVA, by season: p> 0.2 for Evenness
and Rarefaction ).

109
5.5.2 Study sites of Rani range
Shannon’s diversity (H’) showed a significant difference between seasons of both
years (One-way ANOVA, by season: F1, 6= 6.0840, P<0.05, see Table 5.6), but there was no
significant difference in diversity (H’) between habitats or forest types (One-way ANOVA
by forest type; F1, 6 =.82842, p> 0.2). There was no overall difference in Simpson’s, Inverse
Simpson’s and alpha diversity indices between seasons (p>0.3, for D,1/D & α diversity) but
the indices showed significant differences between habitats (One-way ANOVA, by forest
type: D, F1, 6 =14.826, P<0.05; 1/D, F1, 6=17.874, P<0.05; α –D, F1, 6 =7.3362, P<0.05).
Scattered/open forests were more diverse than the closed forest habitats as indicated by
Simpson’s and Inverse Simpson’s indices but α – diversity was again found to be higher in
the closed forests (see Table 5.6).
Table 5.6: Species-wise diversity indices of swallowtail butterflies in the open and closed
forest habitats of Rani range (pooled data of 8 fixed transects) during dry and wet seasons of
2003-2004. The butterfly species diversity, richness, evenness and rarefaction estimates
were defined by forest type and season.
Species wise diversity indices in Rani range by forest type & season Forest type Season
Year 1 Year 2 Year 1 Year 2 Diversity indices
Closed Scattered Closed Scattered Dry Wet Dry Wet H’ (Shannon’s index) 2.7961 2.8529 2.6562 2.7850 2.9361 2.9550 2.8766 2.8967D (Simpson’s index) 0.9140 0.9284 0.8922 0.9228 0.9350 0.9374 0.9282 0.92571/D (Inverse Simpson) 11.6244 13.9687 9.2754 12.9557 15.3882 15.9778 13.9305 13.4518R2 (Rarefaction) 1.9152 1.9293 1.8936 1.9238 1.9366 1.9381 1.9303 1.9265(α) Alpha diversity 5.1909 4.7703 5.1593 4.9546 5.5841 4.6076 5.7608 4.7273S (Species richness) 26 26 25 26 26 26 25 26J (Pielou's evenness) 0.8582 0.8756 0.8252 0.8548 0.9012 0.9070 0.8937 0.8768
There were no significant differences in species richness between habitats or forest
types and seasons (p>0.05). The Evenness and Rarefaction of species assemblages were
significantly higher in the scattered/open forest habitats (One-way ANOVA, by habitat: J,
F1,6 =17.198, p<0.05; Rarefaction, F1,6 =31.078, p<0.05). However there was no overall
difference in evenness and rarefaction estimates between seasons (p>0.05).
An overall opposite trend in the diversity parameters of the swallowtail butterfly
species assemblages between the study sites of Garbhanga and Rani ranges were observed

110
with respect to forest type- in the study sites of Garbhanga range the closed forests were
more diverse than the open/scattered forests while in the study sites of Rani range the open
forests were more diverse. A similar trend was also observed with the evenness and
rarefaction estimates for the study sites of both the ranges With respect to season, there were
no significant differences in the diversity parameters between the dry and wet seasons of the
study period in the study sites of Garbhanga range while for the study sites of Rani range
only Shannon diversity (H’) was found to be higher during the wet seasons of the study
period.

111
5.6 Indicator values and characteristic species
5.6.1 Indicator values and characteristic species in the study sites of Garbhanga range
The swallowtail butterfly assemblages were analysed for detection of characteristic
genera/species for the fixed transects within the two forest types (scattered and closed) of
study sites S1, S2 and S3 in Garbhanga range during the sampling period (wet and dry
seasons of 2003-2004) and, the observed Indicator values (IV %) for the sampled species
are presented in Tables 5.7 and 5.8 below.
Table 5.7: Indicator values (%IndVals) of swallowtail butterflies (Genus-wise) in the 12
sampling transects of the three study sites (S1, S2 and S3) in Garbhanga range. Sampling
data from the 12 transects during the study period (2003-2004) were pooled together to
analyse and identify the characteristic genera for each forest type (transects 1 & 2 for
scattered forest and transects 3 & 4 for closed forest). The species which scored significant
IndVals are indicated in bold and red font pattern. The analysis was done by using the
vegan subroutine in the program ‘R’.
Garbhanga Line Transect
Genus Transect Indval % p* *
1 Bluebottles (Graphium sp.) 1 61.22 0.01 ** 2 Roses (Pachliopta sp.) 1 52.17 0.03 * 3 Swordtails (Pathysa sp.) 1 50.66 0.05 * 4. Mimes (Chilasa clytia) 1 39.68 0.16 -- 5 Dragontails (Lamproptera sp.) 1 38.24 0.31 -- 6 Helens (Papilio sp.) 1 27.97 0.84 -- 7 Jays (Graphium sp.) 2 67.50 0.01 ** 8 Zebras (Pathysa sp.) 2 52.63 0.02 * 9 Lime (Papilio demoleus) 2 49.02 0.04 * 10 Mormons (Papilio sp.) 2 37.36 0.16 -- 11 Common Raven (Papilio castor ) 3 41.16 0.05 * 12 Peacocks (Papilio sp.) 4 32.08 0.08 -- 13 Windmills (Atrophaneura sp.) 4 59.54 0.12 -- 14 Batwings (Atrophaneura sp.) 4 45.79 0.17 -- 15 Birdwings (Troides sp.) 4 41.65 0.18 -- "**" – Statistically significant (p<0.01) ; "*" - p<0.05

112
In the transects of the scattered/open forests, Graphium sp. (Jays and
Bluebottles) scored IndVals >60% (p<0.05) while Pathysa sp. (Swordtails and Zebras),
Pachliopta sp. (Roses), Papilio demoleus (Limes) scored IndVals > 45% (p≤0.05). In the
transects of the closed forest Papilio castor (Common Raven) scored an IndVal <45% but
was significant at p≤0.05 while Atrophaneura sp. (Windmills) scored an IndVal >55% but
were not statistically significant at p>0.05. The groups or butterfly assemblages (genus-
wise) were defined by values of transects in an attempt to detect any characteristic genera or
groups for the fixed transects in the two forest-types (see Table 5.7).
Table 5.8: Indicator values (%IndVals) of swallowtail butterflies (Species-wise) in the 12
sampling transects of the 3 study sites (S1, S2, S3) under Garbhanga range. Sampling data
from the 12 transects were pooled together to analyse the characteristic species for each
forest type (transects 1 & 2 for scattered forest and transects 3 & 4 for closed forest). Species
Transect
IndVal (%)
p*
*
1 Bluebottles (Graphium sarpedon) 1 61.22 0.01 ** 2 Common Rose (Pachliopta aristolochiae) 1 55.07 0.03 * 3 Chain Swordtail (Pathysa aristeus) 1 52.38 0.06 -- 4 Five Bar Swordtail (Pathysa antipathies) 1 48.95 0.07 -- 5 Common Mormon (Papilio polytes) 1 41.29 0.09 -- 6 Green Dragontail (Lamproptera meges) 1 45.45 0.10 -- 7 Common Mime (Chilasa clytia ) 1 39.68 0.16 -- 8 Tailed Jay (Graphium agammemnon) 2 63.74 0.00 ** 9 Great Zebra (Pathysa xenocles) 2 54.11 0.01 * 10 Common Jay (Graphium doson) 2 66.88 0.02 * 11 Lime (Papilio demoleus) 12 Lesser Zebra (Pathysa macareus)
2 2
49.02 49.69
0.04 0.07
* --
13 Great Mormon (Papilio memnon ) 2 38.01 0.07 -- 14 Paris Peacock (Papilio paris) 2 31.48 0.70 -- 15 Crimson Rose (Pachliopta hector) 2 25.00 0.93 -- 16 White Dragontail (Lamproptera ) 2 16.67 0.97 -- 17 Yellow Helen (Papilio nephelus) 2 26.21 0.97 -- 18 Common Raven (Papilio castor) 3 41.16 0.04 * 19 Krishna Peacock (Papilio krishna) 3 36.36 0.38 -- 20 Common Batwing (Atrophaneura varuna) 3 34.29 0.48 -- 21 Red Helen (Papilio helenus helenus) 3 30.10 0.71 -- 22 Common Peacock (Papilio polycter ) 4 39.62 0.00 ** 23 White Headed Batwing (Atrophaneura sycorax) 4 46.67 0.07 -- 24 Common Windmill (Atrophaneura polyeuctes ) 4 63.10 0.09 -- 25 Common Birdwing (Troides helena ) 4 41.76 0.14 -- 26 Great Windmill (Atrophaneura dasarada ) 4 52.68 0.14 -- 27 Lesser Batwing (Atrophaneura aidoneus) 4 49.15 0.15 -- 28 Golden Birdwing (Troides aeacus) 4 41.56 0.42 --
"**" – Statistically significant p<0.01; "*" - P<0.05

113
In the scattered/open-forest transects, Graphium sarpedon (Bluebottles), G.
agamemmnon (Tailed Jay), G. doson (Common Jay), Pathysa xenocles (Great Zebra),
and Pachliopta aristolochiae (Common Rose) scored IndVals >50% (p<0.05) and could be
detected as indicator species for this forest type. Although the Limes (Papilio demoleus)
scored an IndVal < 50% still they were statistically significant (p<0.05) and could be
considered as an indicator species. In the transects of the closed forests, Papilo castor
(Common Raven) and Papilio polyctor (Common Peacock) scored low IndVals (<45%)
but were statistically significant at p<0.05 (see Table 5.8). Amongst the red-bodied
Papilionidae, Atrophaneura polyeuctes (Common Windmill) scored an IndVal > 60% but
was not statistically significant (p>0.05). Such species could be considered as accidental or
anecdotal as they have their maximum indicator value for the given cluster level group
(Dufrene & Legendre, 1997).
However a re-analysis of the same data set where the taxonomic groups or species
assemblages were defined by values of season and statistically tested for observed
maximum indicator values for each species, showed that the forest dependant red-bodied
assemblage – Atrophaneura polyeuctes (Common Windmill), Atrophaneura dasarada
(Great Windmill), Atrophaneura varuna (Common Batwing) and Troides aeacus
(Golden Birdwing) scored IndVals > 80% (p<0.005). The black-bodied Papilio helenus
(Red Helen) scored an IndVal <70% but was significant at p<0.005 (see Table 5.9).

114
Table 5.9: Indicator values for 28 species of swallowtail butterflies sampled season-wise in
the study sites of Garbhanga range during 2003-2004. The indicator values for the species
assemblages were defined by values of mean seasonal abundances. Pooled data from 12
transects in three study sites (S1, S2, S3) were analysed using the program PC-ORD, 4.01.
Species Indicator
al (IV %) Mean Standard
Deviation p*
1 Common Windmill (Atrophaneura dasarada) 88.8 61.6 11.62 0.0010* 2Great Windmill (Atrophaneura polyeuctes) 87.0 63.0 8.48 0.0010* 3White-Headed Batwing (Atrophaneura sycorax) 54.2 34.5 10.48 0.0500 4Lesser.Batwing (Atrophaneura aidoneus) 83.1 62.6 8.72 0.0160 5Common Batwing (Atrophaneura varuna) 88.6 47.1 10.53 0.0040* 6 Golden Birdwing (Troides aeacus) 83.8 61.4 8.35 0.0030* 7 Common Birdwing (Troides helena) 67.4 57.6 5.89 0.0770 8 Common Rose (Pachliopta aristolochiae) 68.1 61.0 7.92 0.2010 9 Crimson Rose (Pachliopta hector) 58.3 48.4 8.76 0.1600 10 Green Dragontail (Lamproptera meges) 47.7 47.9 8.60 0.4650 11 White Dragontail (Lamproptera curius) 41.7 36.8 10.67 0.3590 12 Chain Swordtail (Pathysa aristeus) 49.6 46.8 10.30 0.3440 13 Five-Bar Swordtail (Pathysa antipathies 48.6 46.8 10.22 0.3660 14 Great Zebra (Pathysa xenocles) 45.1 49.7 9.64 0.6150 15 Lesser Zebra (Pathysa macareus) 45.3 46.6 10.04 0.4700 16 Common Mime (Chilasa clytia) 70.9 57.6 5.84 0.0260 17 Common Jay (Graphium doson) 76.4 64.0 10.02 0.1530 18 Tailed Jay (Graphium agammemnon) 66.4 62.2 9.06 0.2880 19 Common Peacock (Papilio polyctor) 57.1 52.8 2.66 0.0480 20 Paris Peacock (Papilio paris) 72.2 54.4 8.31 0.0440 21 Krishna Peacock (Papilio krishna) 40.9 47.9 8.23 0.8230 22 Common Mormon (Papilio polytes) 61.6 57.2 5.63 0.2100 23 Great Mormon (Papilio memnon) 66.1 55.9 4.62 0.0240 24 Red Helen (Papilio helenus) 69.2 55.0 4.19 0.0010* 25 Yellow Helen (Papilio nephelus) 56.5 53.8 3.24 0.1880 26 Common Raven (Papilio castor) 61.6 56.1 4.62 0.1450 27 Bluebottle (Graphium sarpedon) 62.0 61.6 8.78 0.4030 28 Lime Butterfly (Papilio demoleus) 57.1 56.6 7.79 0.3960
‘* ‘ – Statistically significant p<0.005
The detection of indicator taxa by ‘forest type’ and ‘season’ gave different results
as observed from the Indicator values (%IndVals) of the group and species assemblages
(see Tables 5.7, 5.8 & 5.9). When the indicator values were defined by values of the mean
transect abundance in the two forest types, statistically the results were more significant for
some of the open/scattered forest species, particularly from the Graphium group comprising
of the Jays and Bluebottles (see Table 5.7 & 5.8). However, when the same data set was
defined by values of mean seasonal abundance, some of the closed forest restricted species
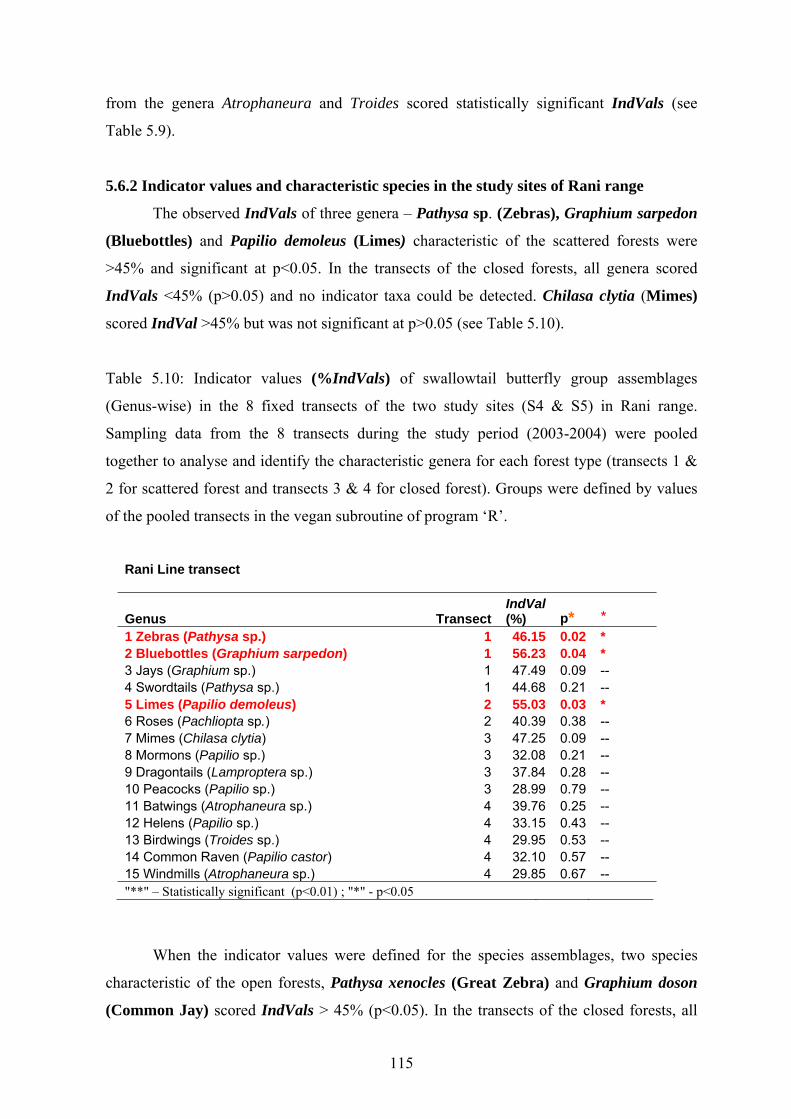
115
from the genera Atrophaneura and Troides scored statistically significant IndVals (see
Table 5.9).
5.6.2 Indicator values and characteristic species in the study sites of Rani range
The observed IndVals of three genera – Pathysa sp. (Zebras), Graphium sarpedon
(Bluebottles) and Papilio demoleus (Limes) characteristic of the scattered forests were
>45% and significant at p<0.05. In the transects of the closed forests, all genera scored
IndVals <45% (p>0.05) and no indicator taxa could be detected. Chilasa clytia (Mimes)
scored IndVal >45% but was not significant at p>0.05 (see Table 5.10).
Table 5.10: Indicator values (%IndVals) of swallowtail butterfly group assemblages
(Genus-wise) in the 8 fixed transects of the two study sites (S4 & S5) in Rani range.
Sampling data from the 8 transects during the study period (2003-2004) were pooled
together to analyse and identify the characteristic genera for each forest type (transects 1 &
2 for scattered forest and transects 3 & 4 for closed forest). Groups were defined by values
of the pooled transects in the vegan subroutine of program ‘R’.
Rani Line transect
Genus TransectIndVal (%)
p* *
1 Zebras (Pathysa sp.) 1 46.15 0.02 * 2 Bluebottles (Graphium sarpedon) 1 56.23 0.04 * 3 Jays (Graphium sp.) 1 47.49 0.09 -- 4 Swordtails (Pathysa sp.) 1 44.68 0.21 -- 5 Limes (Papilio demoleus) 2 55.03 0.03 * 6 Roses (Pachliopta sp.) 2 40.39 0.38 -- 7 Mimes (Chilasa clytia) 3 47.25 0.09 -- 8 Mormons (Papilio sp.) 3 32.08 0.21 -- 9 Dragontails (Lamproptera sp.) 3 37.84 0.28 -- 10 Peacocks (Papilio sp.) 3 28.99 0.79 -- 11 Batwings (Atrophaneura sp.) 4 39.76 0.25 -- 12 Helens (Papilio sp.) 4 33.15 0.43 -- 13 Birdwings (Troides sp.) 4 29.95 0.53 -- 14 Common Raven (Papilio castor) 4 32.10 0.57 -- 15 Windmills (Atrophaneura sp.) 4 29.85 0.67 -- "**" – Statistically significant (p<0.01) ; "*" - p<0.05
When the indicator values were defined for the species assemblages, two species
characteristic of the open forests, Pathysa xenocles (Great Zebra) and Graphium doson
(Common Jay) scored IndVals > 45% (p<0.05). In the transects of the closed forests, all

116
species scored low IndVals (<40%, p>0.05) and therefore no indicator species could be
detected (see Fig. 5.11).
Table 5.11: Indicator values (%IndVals) of swallowtail butterflies (Species-wise) in the
fixed transects of the two study sites (S4 & S5) in Rani range. Sampling data from the 8
transects during the study period (2003-2004) were pooled together to analyse the
characteristic species for each forest type (transects 1 & 2 for scattered forest and transects 3
& 4 for closed forest) and the species assemblages were defined by values of mean
abundance in transects.
Species Transect IndVal (%) p* * 1 Bluebottles (Graphium sarpedon) 1 56.23 0.04 * 2 Great Zebra (Pathysa xenocles) 1 47.86 0.01 * 3 Common Jay (Graphium doson) 1 51.67 0.03 * 4 Lesser Zebra (Pathysa macareus) 1 43.96 0.07 -- 5 Five Bar Swordtail (Pathysa antipathies) 1 44.90 0.17 -- 6 Common Mormon (Papilio polytes) 1 35.46 0.17 -- 7 Chain Swordtail (Pathysa aristeus) 1 44.53 0.27 -- 8 Common Windmill (Atrophaneura polyeuctes) 9 Limes (Papilio demoleus)
1 2
27.27 55.03
0.98 0.03
-- *
10 Tailed Jay (Graphium agammemnon) 2 44.30 0.14 -- 11 White Dragontail (Lamproptera curius) 2 41.03 0.21 -- 12 Common Rose (Pachliopta aristolochiae) 2 40.82 0.42 -- 13 Crimson Rose (Pachliopta hector) 2 14.29 1.00 -- 14 Great Mormon (Papilio memnon) 15 Common Mime (Chilasa clytia)
3 3
37.95 47.25
0.06 0.09
-- --
16 Green Dragontail (Lamproptera meges) 3 40.00 0.29 -- 17 Yellow Helen (Papilio nephelus) 3 34.11 0.36 -- 18 Common Peacock Papilio polyctor) 3 26.19 0.98 19 Lesser Batwing (Atrophaneura aidoneus) 4 37.50 0.28 -- 20 Common Batwing (Atrophaneura varuna) 4 36.21 0.31 -- 21 Red Helen (Papilio helenus) 4 34.42 0.37 -- 22 Golden Birdwing (Troides aeacus) 4 33.77 0.38 -- 23 Krishna Peacock (Papilio krishna) 24 Common Raven (Papilio castor)
4 4
33.33 32.10
0.56 0.57
-- --
25 Great Windmill (Atrophaneura dasarada) 4 26.09 0.65 -- 26 Common Birdwing (Troides helena) 4 27.27 0.99 -- "**" – Statistically significant (p<0.01) ; "*" - p<0.05
A re-analysis of the same data set for statistically testing the significance of
observed maximum values for the taxonomic groups defined by values of season showed
IndVals > 65% (p≤0.005) for the red-bodied species Atrophaneura varuna (Common
Batwing), Troides aeacus (Golden Birdwing), Troides helena (Common Birdwing),

117
Pachliopta aristolochiae (Common Rose) and the black-bodied species Papilio castor
(Common Raven). Papilio nephelus (Yellow Helen) scored an IndVal > 65% but was not
statistically significant at p>0.005. With the exception of Pachliopta aristolochiae
(Common Rose) which was the only gap species, all the other indicator species that were
detected as characteristic indicator taxa were forest restricted (see Table 5.12).
Table 5.12: Indicator values for 26 species of swallowtail butterflies sampled season-wise in
the 8 transects of study sites S4 and S5 within Rani range during 2003-2004. Pooled data
from the fixed transects in the two study sites were analysed using the program PC-ORD,
4.01.
Species
IndVal (IV%)
p*
1 Common Windmill (Atrophaneura dasarada) 63.6 0.0400 2 Great Windmill (Atrophaneura polyeuctes) 48.9 0.2850 3 Lesser.Batwing (Atrophaneura aidoneus) 56.2 0.1210 4 Common Batwing (Atrophaneura varuna) 79.3 0.0050* 5 Golden Birdwing (Troides aeacus) 67.5 0.0050* 6 Common Birdwing (Troides helena) 67.3 0.0040* 7 Common Rose (Pachliopta aristolochiae) 85.7 0.0030* 8 Crimson Rose (Pachliopta hector) 26.8 0.5070 9 Green Dragontail (Lamproptera meges) 47.1 0.4400 10 White Dragontail (Lamproptera curius) 51.6 0.4500 11 Chain Swordtail (Pathysa aristeus) 55.8 0.4370 12 Five-Bar Swordtail (Pathysa antipathies) 52.8 0.4060 13 Great Zebra (Pathysa xenocles) 61.5 0.2570 14 Lesser Zebra (Pathysa macareus) 60.4 0.2690 15 Common Jay (Graphium doson) 67.6 0.0700 16 Tailed Jay (Graphium agammemnon) 57.9 0.1520 17 Common Peacock (Papilio polycter) 66.7 0.0780 18 Krishna Peacock (Papilio krishna) 66.7 0.0300 19 Common Mormon (Papilio polytes) 62.5 0.0580 20 Great Mormon (Papilio memnon) 63.6 0.0300 21 Red Helen (Papilio helenus) 67.5 0.0280 22 Yellow Helen (Papilio nephelus) 70.6 0.0080 23Bluebottle (Graphium sarpedon) 58.5 0.1280 24 Lime Butterfly (Papilio demoleus) 54.6 0.1550 25 Common Mime (Chilasa clytia) 57.7 0.2550 26 Common Raven (Papilio castor) 71.6 0.0040* ‘* ‘ – Statistically significant p<0.005

118
The analysed results showed that when groups (genus-wise) and species
assemblages were defined by values of mean transect abundances; some of the characteristic
gap species particularly from the genera Graphium and Pathysa scored significant IndVals
(>50%) while none of the forest-restricted species could be detected as indicator species
(see Tables 5.7, 5.8, 5.10 & 5.11). However when the same groups and species assemblages
were defined by values of mean seasonal abundances, with the exception of one gap species
(Pachliopta aristolochiae), all the other selected indicator species with significant high
IndVals (>70%) were forest-restricted (see Tables 5.9 & 5.12). When comparing between
the results of the characteristic indicator taxa of the study sites of Garbhanga and Rani
ranges, a similar trend with respect to the selection of more gap species as indicator taxa
when defined by values of only transect abundances and detection of more forest-restricted
species as indicator taxa when defined by values of seasonal abundances were observed for
both the two ranges (see Tables 5.7 – 5.12). Statistically the results were more significant
when the species assemblages were tested season-wise although the analytical results on the
characteristic species of the assemblages detected transect-wise were also meaningful.

PART III DISCUSSION AND RECOMMENDATIONS FOR CONSERVATION CHAPTER 6 : DISCUSSION
CHAPTER 7 : RECOMMENDATIONS FOR CONSERVATION
119
CHAPTER 6 : DISCUSSION
6.1: Climate, Vegetation and butterfly abundance
6.1.1 Climate and butterfly abundance
Butterflies are sensitive to environmental variation (Scoble, 1992). Positive
relations have been found between butterfly diversity and environmental variables such as
climate (Pollard & Yates, 1993; Parmesan, 1996), topographic and moisture gradients
(Kremen, 1992), landscape structure (Wood & Samways, 1992), habitat complexity (Molina
& Palma, 1996), and plant diversity (Erhardt, 1985; Thomas & Malorie, 1985; Leps &
Spitzer, 1990; Spitzer et al., 1997). Our investigations on the climate conditions during the
study period and the butterfly sampling data showed that when comparing between the total
annual rainfall and the annual abundance of butterflies, butterfly abundances were higher in
the first year of study (2003) and the total annual rainfall of 2003 was also higher than that
recorded in 2004. Differences in the seasonal abundances of swallowtail butterflies during
the study period showed higher butterfly abundance during dry season of 2004 and wet
season of 2003. Higher butterfly abundance in the first year (2003) was probably due to
higher rainfall, which could have promoted the vegetation growth that is again known to
directly influence both the larval and adult stages of the butterflies as food resources (Dover
et al., 2000). This however contradicts the recent hypothesis of Hill et al. (2003) where
higher rainfall was actually known to cause a decline in the butterfly abundance by
adversely affecting larval and pupal survival. However when only comparing between the
dry and wet seasons of both years it was seen that butterfly abundances were higher during
the wet seasons of both years. Several studies have provided evidence that tropical insects
undergo seasonal changes in abundance, atleast for those parts of the tropics where wet and
dry seasons alternate (Davis, 1945; Dobzhansky & Pavan, 1950; Owen, 1969; Emmel &
Leck, 1970; Gibbs & Leston, 1970; Robinson & Robinson, 1970; Fogden, 1972; Owen &
Changer, 1972; Wolda, 1977a; 1978). In areas with pronounced dry season the abundance
of most insects in the dry season is relatively low. In areas with a very mild dry season,

120
insects decrease in abundance during the drier season and increase during the wetter season
(Fogden, 1972). Lepidopteron species with biogeographical affinities to the seasonal ‘East
Himalayan’ region have been known to show relatively higher seasonality in the montane
tropical rainforests of Vietnam where the most characteristic seasonal patterns in abundance
fluctuations were closely related with the monsoon climate (Spitzer et al., 1993). Butterflies
have been shown to be sensitive to environmental gradients in tropical regions (Kremen,
1992) particularly in those parts of the tropics with well-defined wet and dry seasons
(Braby, 1995; Owen, 1971; Spitzer et al., 1993). Our results showed a similar trend with
the findings of Spitzer et al. (1993) where the seasonal abundances of the swallowtail
species were found to be positively correlated with higher ‘monsoon precipitation’ during
the wet season for both years.
6.1.2 Vegetation and butterfly abundance
In tropical regions with distinct wet and dry seasons, many insect species attain
maximum adult abundance during the wet season, probably in response to changes in plant
physiology and growth (Didham & Springate, 2003; Wolda, 1989), in particular the
abundance of new foliage (Fensham, 1994; Novotny & Basset, 1998; Shapiro, 1975). In
tropical deciduous forests, the abundance of plants is positively correlated with the patterns
of monsoon rainfall (Wolda, 1978). The onset of monsoon rain triggers the sprouting of
tender young leaves which the larvae prefer to feed on. The availability of adequate larval
and adult nectar sources influences the abundances of the adult population. Although our
data on vegetation does not take into account the seasonal abundances of vegetation in the
sampled sites, however the sampling information on the availability of adult and larval host
plants within the sampled area determines the suitability of the habitat in supporting
butterfly populations in general and the Papilionids in particular.
Although vegetation sampling was not done in all the five study sites, a comparison
of the floral profile with respect to trees, herb/shrubs and climber species diversity, richness
and evenness estimates between the two sampled sites (partially disturbed site S1 and
disturbed site S4) showed an almost near similarity in the vegetation structure. The overall
high diversity of trees and shrubs in study site S1 and comparatively higher climber
diversity in study site S4 as indicated by the Shannon’s and Simpson’s diversity values
suggests the presence of a relatively constant environment, particularly in case of trees and
herb/shrubs (Spitzer et al., 1987). Moreover the presence of climbers particularly on tall

121
trees as also observed in our study sites is an important structural component of the
ecosystem and the presence of Aristolochiae vines is crucial for some of the swallowtail
butterflies like the Troides sp. (Birdwings), Atrophaneura sp.(Windmills and Batwings) and
the Roses or the Pachliopta sp. (Spitzer et al., 1987). The dominant tree species were
represented by the families Rutaceae, Moraceae, Euphorbiaceae, Lauraceae, Magnoliaceae
and Verbenaceae. There was a good diversity of undergrowth vegetation as indicated by the
presence of 63 species of herbs and shrubs represented by some of the dominant families
Verbenaceae, Solanaceae, Malvaceae, Euphorbiaceae and Caesalpiniaceae. The 34 species
of climbers were dominantly represented by the family Fabaceae (9 species). The floristic
composition showed the presence of some evergreen species like Lauraceae, Magnoliaceae
and Rutaceae, which mostly represented the larval food plants. The family Rutaceae was
dominated by such tree species belonging to the genera Citrus and Zanthoxylum and
understorey species like Murrya paniculata and Glycosmis pentaphylla which are some of
the primary larval food plants of the black-bodied swallowtails belonging to the genus
Papilio). The high abundances of the Papilionid genus Papilio could be positively correlated
with the dominant presence of Rutaceae in the study area. Similarly the high abundances of
the genus Graphium (Jays and Bluebottles) with relatively small differences between the
dry and wet seasons in both years could be attributed to the availability of the evergreen
host-plant families Lauraceae and Magnoliaceae in the forest reserve. Therefore the most
frequently observed species with relatively small differences in abundance during the dry
and wet periods like Common Mormon (Papilio polytes ), Limes (P. demoleus), Bluebottles
(Graphium sarpedon) were associated with evergreen food plants such as Rutaceae,
Lauraceae and Magnoliaceae. Our observations are in conformity with the findings of
Spitzer (1983). Most of the citrus-feeders have expanded their seasonal abundances by
switching from their wild Rutaceous food plants onto cultivated varieties of Citrus which
unlike the wild plants maintain their leaves throughout the dry season and this is in
conformity with the observations of Owen (1971). A similar condition was also observed
for the cultivated Citrus sp., Aegel marmelos, Polyalthia longifolia (Annonaceae) and
Cinnamomum tamala (Lauraceae), which are the primary larval resources of Graphium and
Papilio species.
The abundances of the red-bodied Papilionidae genera Atrophaneura (Windmills and
Batwings), Pachliopta (Roses) and Troides (Birdwings) decreased during the dry season but
they could safely survive the dry season in relatively humid patches of trees with

122
Aristolochiaceae near the streams and our observations are in conformity with the findings
of Spitzer (1983).
Although the larval stages were observed to be host-specific, as adults the
papilionids were found to utilise a wide variety of nectar plants. The sun-loving species
belonging to the genera Graphium (Jays and Bluebottles), Papilio (Mormons and Peacocks),
Pathysa (Zebras and Swordtails) and Pachliopta (Roses) were frequently found nectaring at
the flowers of an exotic species Lantana camara in the study area. Such exotic nectar plant
species could have simply provided additional resources for the adult butterflies as
otherwise if the gravid females did not find suitable larval host plants and critical habitats in
the vicinity then it could affect the abundances of adult papilionids (Simonson et al., 2001).
Exotic nectar plants could represent a threat to the native plant and butterfly diversity
although in our study area such a trend was not observed as an immediate threat. Lantana
camara is listed among the world’s worst invasive alien species as recognised by the
Invasive Species Specialist Group (IUCN, 2001) and is known to grow under a wide range
of climatic conditions particularly in disturbed areas and is mostly found in the edges of
tropical and sub-tropical forests (Thakur et al., 1992; Day et al., 2003). In secondary forests
where gaps have been created by logging, such disturbance normally allows Lantana to
encroach upon the forests as this species cannot survive under dense and intact canopies
(Day et al., 2003). Therefore as the density of Lantana in the forests increases, species
richness decreases (Fensham et al., 1994). In the study site S4 of Rani range where levels of
disturbance although not measured was observed to be comparatively higher than in S1
(Garbhanga range) abundances of Lantana camara were found to be higher. In disturbed
areas with high cattle grazing, Lantana is known to benefit from such destructive foraging
activities. Other kinds of human disturbances in the form of cultivation, road construction
and changes in fire regimes are also known to enhance Lantana propagation (Fensham et
al., 1994). Therefore the potential role of Lantana as one of the preferred adult nectar
sources of butterflies as well as its invasive threat upon natural ecosystems has to be further
investigated upon. One of the best management options suggested against spread of Lantana
invasion has been the strategy of shading by intact canopies (Duggin & Gentle, 1998),
commercial exploitation of its wide-spectrum biocidal potential and biogas production
(Sharma et al., 2003).
Patterns in the study area support the conclusions of researchers who have identified
Aristolochiaceae as the most important host plant family in South-East Asia, followed by
Rutaceae and Lauraceae (Fiedler, 1998). However the species richness of the Papilionids

123
(28 species) when compared with the total plant species richness in the forest reserve (197
species) clearly indicates that regions with a rich flora need not be rich in terms of butterfly
species as already pointed out by Vane-Wright (1978) and Cottrell (1985). Moreover within
the Papilionidae higher species diversity in tropical regions is not correlated with higher
host plant diversity. Therefore local abundance and phenology of nectar and host-plant
resources may be more important in determining the abundances and species diversity of the
papilionid butterflies.
6.2 Geographic Range and butterfly abundance : There has been much speculation over the relationship between species’ abundance
in communities and the species geographical range size (Spitzer et al., 1993). The generalist
species should be simultaneously locally abundant and widely distributed as a consequence
of their ability to exploit a wide range of resources on both local and regional scales
(Brown, 1984). In our study we had observed the differences in the correlation between
mean abundances and geographic range size of the Papilionidae between the study sites of
Garbhanga and Rani ranges. Our correlation results for the study sites in Garbhanga range
were corresponding with these findings where it was seen that the size of the geographic
range correlated positively with the mean abundances of the species assemblages although
the correlation was not strong but still significant. The most opportunistic species with wide
geographic ranges recorded the highest abundances and this could be associated with the
correlation between their characteristic seasonal patterns in abundance fluctuations, habitat
preferences and capability to utilise a wide range of resources. However butterfly
biogeography and fauna history evolution are known to be the most important under-lying
factors determining the seasonality phenomena (Spitzer et al., 1993). The wide-ranging
species especially the Graphium sp. were also observed to record low differences between
the dry and wet season abundances and this could be primarily associated with the plant
phenology, wide ranging resources and movements (Ehrlich, 1986). The species with the
most restricted range 1 (1 = Eastern Himalayas) recorded almost equal abundances as those
with range 3 (3 = Indo-Malayan) and this could be considered as a significant result as
conservation priorities are represented first of all by species with small geographic range
(Spitzer et al., 1997). Moreover our results on the higher abundances of the most range
restricted species within the study sites of Garbhanga range were supported by the
hypothesis of Gaston and Lawton (1990) who suggested that in rare and distinct habitats
124
largely different from ‘average’ environmental conditions prevailing in the area, specialists
with small geographic range are more efficient, which permits them to attain higher
population sizes than generalists. Although none of these restricted range species were
specialists, still such results could be treated as important issues concerning the conservation
implications of butterflies.
However the outcome of the correlation between mean abundance and geographic
range size of the Papilionidae in the study sites of Rani range was observed to be weak and
not significant, although the correlation was positive. The mean abundances of the species
with the widest geographic range 4 (4 = Indo-Australian) did not show significantly high
and wide variations in abundance levels as in case of the study sites of Garbhanga range.
They also recorded lower abundance than species with range 3. This could have been
attributed to the differences in the landscape structure between Garbhanga and Rani ranges.
Both the study sites S4 and S5 in Rani range had higher levels of disturbance with teak
plantation, household plantation, village settlements and cropland as observed both visually
and from the satellite imageries on the land-use patterns in the study area. Moreover the
distinction between the open and closed forest habitats in these two study sites of Rani range
were not so widely different as compared to the study sites of Garbhanga range based on our
visual observation. Another factor was the sampling intensity, where the number of
sampling days was not equal for both the ranges and this could have also resulted in the
differences in the mean abundances of the different genera for both the ranges, thereby also
affecting the correlation results.
6.3 Feeding guild and abundance: Although the host-plant databases for the tropical Southeast Asian realm is much
less documented and are based on a single rearing or collection in the wild, substantial
progress has been made in recent years on the database for the oriental Papilionidae
(Igarashi & Fukuda, 1997). Life-history information on the Southeast Asian Papilionidae
has also improved significantly. In South-East Asia, the Papilionids were known to utilise
eight plant families and Aristolochiaceae was the most important host plant family, followed
by Rutaceae and Lauraceae (Scriber et al., 1995; Fiedler, 1998). Our results were
corresponding with these findings as our investigations on the larval host-plant database for
the Papilionidae within the study area showed a good representation. It was seen that seven
species from the red-bodied genera Atrophaneura (Windmills and Batwings) and

125
Pachliopta (Roses) and two species from Troides (Birdwings) fed exclusively on
Aristolochiaceae (2 sp.) where chemicals such as aristolochic acids have been identified as
key mediators in regulating oviposition and feeding behaviour of the Papilionids and their
larvae (Rosenthal & Berenbaum, 1992) as well as assisting in the avoidance of predators
(Dyer, 1995) and parasitoids (Gauld & Gaston, 1992). Another black-bodied species
Common Mime (Chilasa clytia) was monophagous on Lauraceae (2 sp.). The black-bodied
Papilio (Mormons, Peacocks and Helens) and Graphium species (Jays and Bluebottles)
were found to utilise six plant families out of which Rutaceae, Lauraceae and Magnoliaceae
were the dominant ones. The Papilio sp. (8) were oligophagous on the family Rutaceae that
was represented by both wild and cultivated varieties of Citrus in the study area while the
polyphagous Graphium sp. (3) were found to feed on the families Lauraceae and
Magnoliaceae. The year- long occurrence of Graphium and Papilio species with small
differences in the dry and wet season abundances could be attributable to their polyphagous
and oligophagous nature and their association with some of the evergreen food-plant
families like Magnoliaceae and Lauraceae (Spitzer, 1983). Moreover the most abundant
species collected during the study period (Graphium and Papilio sp.) were characterised by
a wide host range that included some common plant species (Citrus sp., Cinnamomum sp.)
which are normally abundant in rural landscapes (Boriani et al., 2005). The Dragontails or
Lamproptera sp. (2) were the only monophagous specialists recorded in our study. As
highly host-specific butterflies are more dependant on the survival of any one of their host-
plants, they are more likely to be vulnerable to localized fragmentation of resources (Koh
et.al., 2004) and similar conditions in the study area could have also contributed to the
decreasing or low abundances of the Lamproptera sp. within the forest reserve. Therefore
our findings showed the dominance of generalist feeders although with respect to the
latitudinal gradient in food plant specialisation, the feeding habits of Papilionidae are known
to be more specialized in the tropical regions (Scriber, 1973). The weak but significant and
positive correlation between the mean abundances and diet breadth of the different species
assemblages also showed the dominance of generalist species and polyphagy over specialist
species and monophagy in our study area. This could be again correlated with seasonality of
the species and plant phenology (Spitzer et al., 1993; Fiedler, 1998). Although in our study
we did not quantitatively analyse the correlation between the host-plant diversity and
butterfly diversity, however it is known from previous studies that within the Papilionidae,
higher species diversity in tropical regions is not correlated with higher host-plant diversity
(Fiedler, 1998). Therefore our investigation and findings on the host-plant database for the

126
swallowtail butterflies within the study area could be considered to be the preliminary stage
for more detailed analytical studies in the future.
We could consider our results on the feeding guild of the Papilionidae to be
interpreted in context with their geographic range distribution where it was seen that
amongst the 10 monophagous generalist species, nine species belonged to the red-bodied
‘Aristolochiae’ feeding category and amongst them three species were having restricted
geographic range (1 and 2) and one of them, Great Windmill (Atrophaneura dasarada) was
an endemic species with range 1. Again amongst the eight species belonging to the
polyphagous feeding guild, six species from the genera Papilio, Pathysa and Graphium
(Limes, Swordtails, Jays and Bluebottles) were having a wide distribution range (3 = Indo-
Malayan and 4 = Indo-Australian), while two species, Chain Swordtail (Pathysa aristeus)
and Great Zebra (Pathysa xenocles) were endemics with a restricted range 1. Amongst the
eight species belonging to the oligophagous feeding guild, only three species had narrow
geographic range (1 and 2), and one of them, Common Raven (Papilio castor) was an
Eastern Himalaya endemic with range 1. The only two monophagous specialist feeders
recorded in the study area had a wide range 3 (Indo-Malayan). Therefore it was seen that
amongst all the feeding guilds, the number of species with a wider geographic range was
higher and a significant correlation between the species mean abundance and their feeding
guilds with increasing abundance from ‘Specialist’ to ‘Generalist’ and ‘Monophagy’ to
‘Polyphagy’ could hold meaningful implications for future conservation purpose. Our
results on the dominance of generalists with wide distribution was important with respect to
their typical characteristics like broad tolerance limits, exploitation of more food types,
flexible habitat requirements and strong dispersal and colonizing abilities (Kitahara & Fujii,
1994).
Although the adult resources of the swallowtail butterflies were examined only with
respect to the identification of some of the important plant families, the study area was
found to have a good representation of plant species as good nectar sources for the
butterflies. However the adults are as species less specific and more opportunistic in feeding
than their larval stages (Gilbert & Singer, 1975). As supported by previous studies,
availability of both floral and larval resources and the effect of climate on plant phenology
could be effective in determining butterfly diversity and abundance. Moreover the local
abundance and phenology of nectar and host-plant resources may be more important than
their presence (Erhardt, 1985; Simonson et al., 2001). In our study area, the phenology of

127
the typical moist deciduous vegetation which is influenced by the seasonal monsoon climate
could have had an influence on butterfly abundance and diversity as food availability being
one of the primary biological factors within a local habitat structure determines the local
butterfly assemblage (Ramos, 2000).
6.4 Effects of environmental variables on swallowtail butterfly abundance
and distribution pattern by using the method of multivariate analysis
6.4.1 Swallowtail butterfly species composition and habitat association by forest type
Multivariate analysis has proven to be an important tool when investigating the
relationships between species assemblages and environmental variables (Leps & Spitzer,
1990; Kremen, 1992; Ramos, 1992; Spitzer et al., 1987; Spitzer et al., 1993; Spitzer et al.,
1997). Corresponding to the findings of Spitzer et al., 1987, 1990 & 1993 on the
multivariate analysis of the differences among species composition of butterfly communities
in particular habitat or forest types, the results of the CCA ordination in our present study
showed that the swallowtail butterfly assemblages were homogenous with respect to species
composition but heterogenous with respect to abundances and distribution in different forest
types within the study area. In all the five study sites within the forest reserve, the species
assemblages could be divided into two groups – open forest and closed forest preferring
species. The red-bodied swallowtail group comprising of the genera Atrophaneura (5 sp.)
commonly called the Windmills and Batwings, Troides (2 sp.) commonly called the
Birdwings and Pachliopta hector (Crimson Rose) and the black-bodied genera Papilio (7
sp.) given by common names as Great Mormon, Common Raven, Red Helen, Yellow
Helen, Common Peacock, Paris Peacock, Krishna Peacock and Chilasa (1 sp.) commonly
called the Mimes were found to prefer the closed forests. The open forests preferring species
were specifically confined to the genera Pathysa (4 sp.) commonly called the Swordtails
and Zebras, Graphium (3 sp.) commonly called the Jays and Bluebottles, red-bodied
Pachliopta aristolochiae (Common Rose) and the black-bodied Papilio demoleus (Limes).
There was also a third group of species assemblage comprising of the genera Lamproptera
(2 sp.) commonly called the Dragontails and Papilio (1 sp.) commonly Common Mormon
which could be termed as intermediate species as they were not specifically confined to the
open or closed forests but were encountered in the intermediate zones. The choice of forest

128
type might be influenced by several biological factors for the adults – availability of suitable
oviposition sites by the gravid females depending on greater abundance of host-plant
availability, floral phenology, predators and mimics (Ramos, 2000). Ecological factors like
suitable mud-puddling sites and more sheltered conditions as well as structural variables
like size of the area, topography, temperature, humidity, light, gaps and ground pattern
could account for the preference shown by the butterflies for different habitats or forest
types (Ramos, 2000; Boriani et al, 2005). Our field observations are supported by the
findings of the researchers. Although butterfly-host plant relationships are not always
meaningful predictors of abundances of butterfly species (Sharp et al, 1974; Courtney &
Chew, 1987; Singer & Ehrlich, 1991), for the monophagous red-bodied Atrophaneura and
Troides sp., preferences or higher abundances in the closed forests could be attributed to the
availability of Aristolochiaceae in association with tall trees in damp, shady habitats
alongside forest streams and preferences for mud-puddling on wet soil along the stream
banks. Troides aeacus (Golden Birdwing) and some of the Atrophaneura sp. (Windmills)
are known to occur in forest gaps and along riparian corridors in tropical forests where there
is an abundance of Aristolochia vines (Pinratana, 1992). In our study T. aeacus (Golden
Birdwing) and A. dasarada (Great Windmill) recorded higher abundances in the closed
forest transects but sightings were also made in the open forest gaps. This could be
attributed to the fact that the increased canopy openness and light penetration caused by
disturbance increases the abundance of herbaceous growth and vines and favours species
frequenting tree fall gaps and streams for mud-puddling and sun basking (Ghazoul, 2002).
The nine oligophagous black-bodied species that were associated with the host family
Rutaceae might have preferred the closed forests due to the influence of structural variables
like temperature, light, humidity although the correlation between these factors and butterfly
abundances were not analysed individually but rather the overall effect of rainfall as an
independent variable which included the combined effects of rainfall, maximum
temperature and humidity and season as a categorical variable on the seasonal abundances
of the Papilionidae were estimated. The family Rutaceae was represented by both wild and
cultivated varieties of Citrus sp. and the host plant preferences of these Papilio sp. for the
wild varieties could have accounted for their preferences for the closed forests. The
geographically wide-ranging Papilio sp. are also migratory species flying over forested
areas, thereby giving them an opportunity for visiting flowers in both open habitats and
forest canopy while some species like Papilio paris (Paris Peacock)and P. helenus (Red
Helen) are specifically canopy species and hence their habitat specificity (Spitzer et

129
al.,1993). The genera Graphium (3 sp.), Pathysa (4 sp.), Pachliopta (1 sp.) and Papilio (2
sp.) had preferences for the scattered open forests, which were observed to be mostly the
forest edges and gaps created by human disturbances. Such habitats or sampled transects
with open vegetation formations were mostly located near to human settlements. These sun-
loving species were also observed to frequently mud-puddle on wet soil in open sunny
patches near to human habitations, excreta of domestic animals and were also seen
frequently nectaring at such floral resources like Ixora coccinea, Hibiscus rosa sinensis,
Lantana camara, Vitex nugundo that occurred in higher abundances in areas of human
settlements. Exotic invasive species like Lantana camara has been recorded to be an
important nectar source for several species of Indian butterflies including some of the
Papilionidae species (Borkar et al., 2004). This herbaceous plant was frequently observed
growing along the edges of the transects in the open forests. The preference for the flowers
of L. camara by butterflies is mainly because of its colour, aroma, nectar and proximity to
the ground (Feltwell, 2001). The availability of preferred nectar sources like Hibiscus rosa
sinensis and Lantana camara, which have a yearlong flowering period could also be
considered to be a favourable biological factor determining the choice of such habitats by
these species. The host-plants of these sun-loving species belonged to the families
Lauraceae, Annonaceae, Magnoliaceae, Solanaceae and Aristolochiaceae. With the
exception of Aristolochiaceae, the host-plant occurrences of all these swallowtail species
were found to be higher in the areas of human habitation as cultivated species (Litsea sp.,
Magnolia pterocarpa, Cinnamomum sp.). The Graphium sp. (Jays and Bluebottles) have
been reported to expand their ranges to Cinnamomum tree plantations throughout Southeast
Asia (Haribal, 1994). Monoculture of Polyalthia longifolia, an important host-plant of
Graphium sp. in human settlements close to the forest edges and gaps could also be
attributed to the high abundances of Graphium sp. (Jays and Bluebottles) in such habitats
although monoculture–like conditions in ecosystems and especially plantations of economic
trees are normally known to cause a decline in floral diversity and hence a decrease in the
diversity of butterflies (Borkar et al., 2004; Kunte et al., 2005). Species like Graphium
sarpedon (Bluebottle), Papilio demoleus (Limes) are migratory and are able to fly over
canopy of large forests and establish themselves in small open places in the forest. They are
forest canopy visitors during some migrations only and are temporarily attracted by canopy
flowers. These are the opportunist species with wide geographic distribution and as migrants
are associated with disturbed and open habitats while some of these typical gap species are
also characteristic canopy flyers – they are able to fly over canopy of large forests (Spitzer

130
et al., 1993). Our studies also showed similar results where higher abundances of Graphium
sp.(Jays and Bluebottles), Papilio demoleus (Limes), Papilio polytes (Common Mormon)
were recorded in the disturbed habitats of study sites S4 and S5 as they were found flying in
the gaps or small open areas within the study area. The habitat preferences of the
Dragontails (Lamproptera sp.) were intermediate although they were observed to have
stronger preferences for the open forests in the study area. White Dragontail (Lamproptera
curius) is a typical gap species (Spitzer et al., 1993) and it showed the lowest abundances
amongst all the 28 species recorded in the study area. The status of Dragontails
(Lamproptera sp.) is ‘Vulnerable’ and there is lack of sufficient information on the host
plant availability of the Dragontails (Lamproptera sp.) in Assam. It was the only
monophagous specialist recorded in the forest reserve. The larval host-plant specificity and
adult habitat specialization could be the reasons attributed to its low abundance as also its
nearly restricted geographical range 3 could be correlated to its narrow ecological niches
and less adaptability to rapidly changing environmental conditions such as those associated
with habitat loss and degradation (Hamer et al., 1997; Hill et al., 1995; McKinney 1997;
Purvis et al., 2000).
Corresponding to the findings of Spitzer et al., (1987, 1993), Leps & Spitzer (1990)
and Ramos (2000) and also as predicted in our hypothesis, the results of the CCA ordination
showed that the swallowtail butterfly community in the forest reserve had a significant
correlation with the categorical variable ‘forest type’ and a distinctly heterogenous species
assemblage with respect to preference for open and closed forest types were found and
thereby suggests the use of this categorical factor – ‘forest type’ as an appropriate indicator
of habitat heterogeneity over this spatial scale.
The suitability of a habitat to sustain both immature and adult stages of butterflies is
dependant on the availability of oviposition (larval) food plants and adult nectar plants
which are available throughout the year so as to be able to sustain the minimum viable
population even during periods of environmental stress. In our study it was observed that the
forest-independent species like the Jays and Bluebottles (Graphium sp.), Limes (Papilio
demoleus), Swordtails and Zebras (Pathysa sp.), Common Rose (Pachliopta aristolochiae)
recorded in the open transects are probably better able to persist in the disturbed landscape
(e.g. human settlement areas as in study sites S4 and S5 of Rani range) as they are more
adaptable and better able to exploit a wide range of ecological niches (Jones et.al., 2001,
Harcourt et al., 2002) including a wide range of host-plants and this could also be related to
their wide geographical distributions (Jablonski, 1991; Spitzer et al., 1993). In contrast the

131
forest-restricted butterflies were nearly found only in the forests and not only had restricted
geographical ranges but the status of some species were ‘vulnerable’ and this could be
attributed to the fact that they are highly sensitive to even very small local damage along the
transects (Spitzer et al., 1997). An overview of the earlier records of Papilionidae species in
Assam (Evans, 1932), which have not been recorded since many years, also indicates
narrow geographical ranges for most of the species and hence a higher sensitivity to loss of
forest covers and host plants (Spitzer et al., 1997; Koh et al., 2004).
6.4.2 Seasonality of the Papilionidae
The ordination diagrams showed the continuum of seasonal abundance of butterflies
in the sampled transects of the open and closed forest types taking the effect of year and it
was observed that the relative abundance of the Papilionids was species specific and under a
significant influence of seasons. In all the five study sites of Garbhanga and Rani ranges the
mean abundances of swallowtail butterflies were significantly higher during the wet season
of both years while the relative position of the sites/transects (5-8 for wet season of year 1
and 13-16 for wet season of year 2) in the ordination plots showed the generalised seasonal
variations in the abundances of the butterflies. In Garbhanga range transects 3 and 4
representing closed forest during dry season of year 1 (2003) could be compared to show the
variations in abundances where transect 3 had higher abundances than transect 4. In year 2
(2004) the same transects were again sampled as 11 and 12, showing higher abundances in
transect 11 than 12. Similarly transects 8 and 16 representing closed forest during wet
season of years 1 (2003) and 2 (2004) could be compared to show higher abundances in site
8 during wet season of year 1 (2003). In the study sites of Garbhanga range Common Jay
(Graphium doson) and Tailed Jay (G. agammemnon) showed a predictable perennial
abundance, reaching a peak during the wet season (summer months). They were
encountered in the transects of the open forests in significantly high abundances while their
overall total abundance was strongly influenced by rainfall and therefore again their wet
season abundances were significantly higher. Hence their position in the constrained
ordination matrix is skewed towards the edge of the diagram. The red-bodied group
comprising of Windmills and Batwings (Atrophaneura sp.), Roses (Pachliopta sp.) and
Birdwings (Troides sp.) normally have their peak flight period during the cooler months -
first part of the dry season (Borkar et al., 2004) but in the study sites of Garbhanga range it
was seen that Golden Birdwing (Troides aeacus) had a peak abundance during the wet
132
season of year 2 while Common Birdwing (T. helena) did not show significant differences
in abundances between the dry and wet seasons of both years. Moreover the overall
abundances of the Birdwings (Troides sp.) was not strongly influenced by rainfall and they
could safely survive the dry season in riparian zones of the study area where Aristolochia
vines were found to grow gregariously. Similar observations were also reported on
abundances of Troides sp. with respect to the influence of monsoon seasonal climate and
favourable environmental conditions relating to occurrence of humid groves of gallery
forests with Aristolochiaceae vines near streams in Southeast Vietnam and a decline in their
abundance during the dry season (Spitzer, 1983). In the study sites of Rani range the effect of year on seasonal abundance of the
butterfly assemblages (genus-wise) was significant and highly correlated with axis 2. Jays
and Bluebottles (Graphium sp.) recorded higher abundances during dry season of year 1
while Common Raven (Papilio castor) showed higher abundances during wet season of
year 2 (2004). Limes (Papilio demoleus) had higher abundances during year 2 and the wet
season of year 2 showed higher abundances than year 1 (2003). Moreover the overall total
abundance of Limes was strongly influenced by the amount of rainfall and as a typical
representative species of the open forests, individuals were not encountered in the closed
forest transects and also dry season abundance was significantly low. That is why in the
constrained ordination maps, their position is skewed towards the edge of the diagram.
However the continuum of seasonal abundance on species assemblages showed that
amongst the red-bodied group in the closed forest, the Birdwings (Troides sp.) recorded the
highest abundances with no significant differences between the 2 years and season and this
is in conformity with the findings of Spitzer, 1983. In the open forests, seasonal differences
in abundance (dry and wet) were found in Common Rose (Pachliopta aristolochiae) but
there were no significant differences in abundances between the wet seasons of the 2 years
as indicated by the length of the arrow showing year as an independent variable on the
butterfly species assemblages within the sampled transects (see Fig. 5.23). Moreover the
effect of rainfall on the wet season abundances of Common Rose (Pachliopta
aristolochiae), including that of Tailed Jay (Graphium agammemnon) and Limes (Papilio
demoleus) was strongly significant.
The site scores could not be considered as strong meaningful predictors of butterfly
seasonality because such predictions are normally dependant on sampling effort and the data
on species seasonality is difficult to interpret if it is from a relatively short period because
the seasonality of forest butterflies seems to be determined not only by plant phenology and

133
climate but butterfly biogeography and fauna history evolution are also involved in the
seasonality phenomena (Spitzer et al., 1993). In our study it was seen that the most
characteristic patterns in abundance fluctuations were closely associated with the seasonal
monsoon climate with significant differences seen in the dry and wet season abundances in
all the study sites and this is in conformity with the findings of Spitzer et al., (1993) and
Leps & Spitzer (1990) on the seasonality of the East-Himalayan, Yunnan and Northern
Indochina butterfly fauna.. Our results were also found to closely correspond with our
hypothesis on the seasonality of the Papilionidae fauna of the study area.
6.4.3 Effect of rainfall as an independent variable on the swallowtail butterfly species
assemblages
While examining the seasonality of the butterfly species assemblages, we tried to
study the association between the combined effects of temperature, rainfall and humidity as
climatic parameters and butterfly abundances during the sampling period. The effect of rain
as an independent variable on the species abundance in the ordinations therefore included
the combined data on rain, temperature and humidity from the sampling period. In tropical
monsoon type of climate the variations in the temperature fluctuations between the dry and
wet seasons is very little whereas changes in rainfall is very high and this is the most
important factor affecting the seasonality of tropical insects (Hill et al., 2003; Wolda, 1989).
Although the constrained ordinations showed a significantly strong correlation between
rainfall and butterfly abundance, thereby predicting the influence of the monsoon climate on
butterfly seasonality, significantly large variations in abundance levels of species with
rainfall was not found. Species like the Limes (Papilio demoleus), Jays (Graphium sp.),
Common Rose (Pachliopta aristolochiae) showed strong positive correlations with rainfall
and were abundant all throughout the monsoons. Other species like Golden Birdwing
(Troides aeacus), Common Birdwing (Troides helena), Red Helen (Papilio helenus) and
Windmills (Atrophaneura sp.) from the closed forest and Bluebottles (Graphium sarpedon
sarpedon), Mormons (Papilio sp.) Swordtails and Zebras (Pathysa sp.) from the open
forests showed moderate seasonal trends with rainfall. While the open forest species reached
a peak in the summer months, the red-bodied Birdwings (Troides sp.) and Windmills and
Batwings (Atrophaneura sp.) had their flight period peak in the last part of the wet season
while Red Helen (Papilio helenus) had its flight period during the late monsoon and early
part of dry season. Some species like the Crimson Rose (Pachliopta hector) and Common
Raven (Papilio castor) were strictly seasonal and confined to the monsoons only. Such a

134
type of seasonal trend could be attributed to a synchrony with the phenology of food plants
and especially in case of perennially occurring species, availability of food plants round the
year is implicated (Spitzer, 1983). Again the combined effects of temperature, rainfall and
humidity on various other aspects of butterfly ecology such as mate-location, egg-laying,
nectaring, egg-survival, host-plant growth and habitat structure could have also accounted
for the seasonal variations in the species assemblages within the study period (Pollard,
1988; Dennis & Shreeve, 1991). Microclimatic conditions created by temperature and
moisture gradients, which are quite independent of habitat types, defined by vegetation can
also help in determining the distribution and local abundance of butterflies on a small scale
(Whittaker, 1952; Scott, 1986). In our study, such local microclimatic conditions could have
also accounted for variations in species abundances. We could still consider our results to be
corresponding with the findings of Spitzer et al. (1993) on the seasonality pattern of the
Southeast Asian Papilionidae and the influence of the monsoon climate on the abundance
fluctuations of the butterfly fauna in Vietnam. However for examining the complete
seasonality of the East Himalayan Papilionidae, the study period was short and more
intensive studies over a period of several seasons are required.
6.4.4 Effect of altitude as an independent variable on the abundance and distribution
pattern of the swallowtail butterfly species assemblage
The effect of altitude on the abundance and distribution of swallowtail butterflies
was significant (p<0.001) in the three study sites of Garbhanga range (see Chapter 5 : Figs.
5.20, 5.21 & 5.22). A similar result was also found for the two study sites of Rani range (see
Chapter 5 : Figs. 5.23, 5.24 & 5.25). The forest dependant species had preferences for
higher elevations while the open forest species preferred the gaps at lower elevations.
Elevation can affect the distribution of butterflies across time and space because cloud
cover, precipitation and wind speed increase and ambient temperature decreases at higher
elevations (Fleishman et al., 1998). Although the altitudinal variations in the sampled
transects of Garbhanga and Rani ranges were not large, differences in abundances between
open and closed forest transects along a narrow elevational gradient were observed. Even
narrow elevational gradients could sometimes influence some of the biological activities of
the butterflies like fecundity and opportunities to lay eggs (Boggs & Murphy, 1997). In the
study area, the distribution of the swallowtail butterflies pertaining to their habitat
specificity and abundances at different altitudes could also have been attributed to the fact
that the sampled transects of the open and closed forests were located at different elevations

135
- the gaps were located at lower elevations and the abundance of the gaps decreased with
distance from the forest edge and villages and increasing elevation. Although environmental
factors related to altitude and climate (temperature and precipitation) have been known to
account for most variances in the interspecific differences in the distribution of butterflies
and birds (Storch et al., 2003), in our study only climate relating to the typical dry and wet
monsoon periods were known to strongly affect the abundances of butterflies as already
discussed on the basis of our findings and predicted in our hypothesis. But contradictory to
the findings of Storch et al. (2003), our results showed a less strong but still significant
correlation between the narrow elevational gradients or altitude as an independent variable
and butterfly abundances and distribution. But as again already mentioned in our partial
conclusion on the multivariate ordination of the Papilionidae, the correlation could have
been attributed more to the location of the open and closed forest transects at lower and
higher elevation gradients respectively rather than other factors. However it is known from
pervious studies that for butterflies minimum altitude is much more important than
maximum altitude (Storch et al., 2003).
6.4.5 Effect of geographical position (latitude and longitude) on the abundance and
distribution pattern of the swallowtail butterfly species assemblage
There has been no scientific work on butterfly composition and distribution of
North-east India (Eastern Himalayas) in the recent years except in the Sikkim Himalayas
(Haribal, 1992) and for Assam in particular the contemporary documentation on the
Papilionidae was restricted to authorative inventory and checklists (Arora & Mondal, 1981;
Kunte et al., 2005). New species records are lacking due to insufficient taxonomic and
survey-related work and one of the foremost strategies for this is the need for geographical
mapping of different taxa. In our study the purpose for examining the effects of
geographical position (latitude and longitude) on the Papilionidae composition and
distribution within the protected reserve is the first effort towards butterfly mapping. Our
study area is an ecotone and such regions as ‘hybrid zones’ are normally known to harbour a
rich species diversity (Storch et al., 2003) and therefore the biogeography of the region is an
important part of such studies. Latitude and longitude can cause differences in local species
composition (Storch et al., 2003). Therefore even if on a relatively small scale it is
necessary to consider these effects on distribution patterns. In our constrained ordinations it
was seen that the species composition, abundance and distribution patterns were
significantly related to habitat factors (forest types) but this we could consider to be a by-

136
product of similar geographical structure of habitat and species data. This could also have
been the underlying cause for the significant correlation of geographical position with
species assemblages atleast for the study sites of Garbanga range (see Figs. 5.20, 5.21 &
5.22) although the correlation was not significant for the study sites of Rani range (see Figs.
5.23, 5.24 & 5.23), and also the overall geographical size of the study area was not
sufficiently large enough for such kind of study. As the transects sampled in the five study
sites of both the ranges (Garbhanga and Rani) were geographically located close to each
other, the variation effect of latitude and longitude can be safely negated as the transects
were positioned mainly keeping in view the forest types and not the geographical positions.
The GIS map on land-use cover of the protected Forest Reserve (see Chapter 4 : Fig. 4.2)
showed the superimposed butterfly collection sites where the initial phase of research work
pertaining to building up the reference collection was conducted and these sites could be
identified as ‘butterfly hotspots’ within the reserve. However our ordination results as well
as results from previous studies demonstrate that although remote sensing data can reveal
some important associations between species distribution and habitats, they are not
appropriate for revealing all the important ecological factors that can affect the distribution
of species perceiving habitats on finer scales (Storch et al., 2003). Therefore as far as
conservation is concerned, even for the invertebrate taxa, the studying of habitat
requirements of the individual species in the field as well as their distribution mapping must
be a combined effort. Contradictory to the findings of Storch et al. (2003) and also our
hypothesis predicting the significant influence of geographical position as an independent
variable on butterfly abundance and distribution, our ordination results did not show an
overall significant correlation between geographical position and swallowtail butterfly
abundance and distribution pattern.
6.5 Effect of season and forest/habitat type on species diversity, richness,
evenness and rarefaction estimates:
6.5.1 Species diversity in the study sites by forest type and season
Measures of species diversity play a central role in ecology and conservation biology
(Whittaker, 1960; Peet, 1974; Pielou, 1975; Magurran, 1988). Some of the most commonly
employed diversity measures were also used in our studies. The overall species assemblage
in the pooled transects of the five study sites showed a homogenous pattern. Conflicting

137
patterns of butterfly diversity, richness, evenness and rarefaction produced by the different
indices showed the complexity of discriminating among different habitats in a landscape.
The objective of calculating the different indices was primarily to examine the varying
effects of season and forest type on the homogenous species assemblage within the study
area as shown by the different indices. While both Shannon (H’) and Simpson’s index (D)
account for the abundance of species, H’ is sensitive to changes in abundance of rare or
intermediate abundant species and hence to sample size. However as a dominance measure,
Simpson’s index (D) considers the abundance of the most common species and is less
sensitive to species richness and sample size. The Inverse Simpson index (1/D), one of the
most meaningful diversity indices, reflects the evenness of species abundance although it
may be influenced by common species. Another diversity index, the Fisher’s α which is
very similar to Inverse Simpson, is not affected by size of sampling area and is less affected
by an abundance of rare species than the other measures. It principally considers the total
number of individuals and is not so sensitive to sample size. This is a result of its
dependence on the numbers of species of intermediate abundance (Magurran, 1988). As the
data from the 20 fixed transects within the five study sites were pooled for multivariate
analysis and the total diversity in a pooled set of data can exceed or equal the average
diversity within the community, therefore these measures of diversity with different
sampling bias and variance were used to examine the varying effects of season and forest
type on the species richness, evenness, rarefaction and diversity of the Papilionidae within
the study area.
In Garbhanga range there was no seasonal variation in species diversity but in
relation to habitat/forest type, species diversity was significantly higher in the closed forest
in all cases. However in Rani range, only Shannon’s index (H’) differed significantly
between seasons and was found to be higher during the wet seasons of both years while
Simpson’s (D), Inverse Simpson’s (1/D) and α-diversity were found to vary significantly
between habitats - D and 1/D were higher in the open forests while α-diversity was higher in
the closed forests. Higher diversity in the closed forest habitats of Garbhanga range could be
attributed to several favourable environmental conditions like good canopy cover which is
necessary for the shade-preferring, forest-restricted canopy species especially the Windmills
and Batwings (Atrophaneura sp.), Paris Peacock (Papilio paris), Red Helen (P. helenus)
and Yellow Helen (P. nephelus). It was observed that sunlight could still penetrate the
canopy thereby enhancing the flight and survival of these forest-dependant species. Suitable
riparian zones maintaining muddy patches that are used by adult butterflies were frequently
138
observed in the closed forest transects of this range. Although the results of the CCA
ordination showed low to intermediate abundances of the forest-restricted species, higher
diversity could be related to the mixed assemblage of rare, common and intermediate
species with varying levels of abundance in the closed forest transects. A total of 16 species
of Papilionids were confined within the closed forest habitats of Garbhanga range out of
which six species (Atrophaneura dasarada, A. varuna, Troides aeacus, Papilio castor,
Papilio nephelus, Papilio krishna) had restricted geographical ranges 1 (Eastern Himalayas)
and 2 (Northeast India & Indo-China) . Number of species with range 3 was the highest (9
sp.). Only one species (Papilio helenus) had the widest range 4 (Indo-Australian). The
species with range 3 (Indo-Malayan) recorded the lowest abundance as individual butterflies
and therefore were classified as rare in the ordination results. The six species with restricted
range (1 & 2) also recorded moderate abundances. However the intermediate species
(neither open or closed forest restricted) like the Mormons (Papilio sp.), which were
classified as fairly common in the ordination results and with geographic range 3, recorded
moderate to high abundances in the closed forest. Spearman’s rank correlation between the
species mean abundance and geographic range also indicated a similar trend. Again some of
these species like the Mormons and Peacocks (Papilio sp.) are also known migrants and the
potential mobility of the adult butterflies can affect the sample size. However as the
diversity measures considered all range of species from rare to common as well as the mean
species abundance from the pooled data set, therefore the results could be considered as
meaningful.
Differences in the landscape structure of the study sites in Garbhanga and Rani
ranges were also observed both visually during our field surveys and in the satellite
imageries (see Chapter 4 : Figs. 4.1 & 4.2), which could have influenced the differences in
the diversity of the species assemblages between the study sites of the two ranges.
Differences in the landscape features could be related to differences in microhabitat features
for adult butterflies like light, moisture, topography as well as microclimatic conditions
(Scott, 1986). In the study sites of Rani range, amongst the 14 forest-restricted species, only
three species with geographic distribution ranging from 2 (Indo-China) to 3 (Indo-Malayan)
recorded high abundances and were classified as common while another six forest restricted
species with geographic distribution ranging from 1 (Eastern Himalayas) to 4 (Indo-
Australian) recorded moderate to low abundances and were classified as less common and
rare. A high Shannon’s diversity (H’) during the wet season of both years in Rani range
could be attributed to favourable microclimatic conditions that may have been ideal for the

139
adult butterflies. Temperature and moisture gradients even at a small-localised scale are
known to influence the distribution and local abundance of butterflies and many other
terrestrial taxa (Whittaker, 1952). The study sites of Rani range were located in closer
proximity to human settlements where disturbance in the form of small-wood collection,
grazing and shifting agriculture were observed. The findings from previous research studies
have shown that disturbance can sometimes favour species by enhancing herbaceous and
vines growth and creating gaps suitable for sun-basking and mud-puddling (Ghazoul, 2002).
A similar condition could have also resulted in a higher H’ diversity of the butterflies in the
disturbed study sites S4 and S5 of Rani range. As H’ diversity is more sensitive to rare or
common species and the abundances of the some of the common widespread species from
the genera Graphium (Jays and Bluebottles) and Papilio (Limes, Common Raven, Red
Helen) were found to be significantly higher during the wet season, this could have also
contributed to the higher H’ diversity during the wet seasons. Again the occurrence of
household plantations was higher as there was an abundance of cultivated Citrus and
Polyalthia longifolia plantations in the study sites of Rani range. However there were no
significantly large differences in the vegetation structure between the two sampled study
sites S1 and S4 of the two ranges with respect to trees and under-storey species composition
which could represent the general vegetation profile of the entire reserve. Therefore
microclimatic conditions could alone have accounted for a higher H’-diversity of butterflies
in Rani range. Higher diversity in the scattered or open forest habitats of Rani range as
indicated by Simpson’s and Inverse Simpson’s index could have resulted due to moderate to
high abundances of common species with wider geographic ranges like the Graphium sp.
(Jays and Bluebottles,). But α-diversity was higher in the closed forest habitats and this
could be again attributed to the higher abundances of shade – preferring forest-restricted
species (see Figs. 5.25 & 5.26). This contradicts with the results of previous studies where
α-diversity of tropical butterflies was found to be higher in the forest edges, gaps and
disturbed areas (Leps & Spitzer, 1990; Spitzer et al., 1993; Spitzer et al., 1997; Ramos,
2000). This index is also less affected by the abundance of the rarest or the commonest
species than either H’ (Shannon’s) or λ/D (Simpson’s) and depends more on the number of
species of intermediate abundance (Magurran, 1988). Our ordination results on the group
and species assemblages showed the varying levels of abundance of the Papilionidae across
the dry and wet seasons of the 2 year study period in the study area and accordingly their
categorisation into rare, common and intermediate species. The results on the swallowtail

140
butterfly diversity indices within the study area by forest type and season could also be
interpreted in the light of the ordination results on group and species abundances.
6.5.2.Species richness, evenness and rarefaction in the study sites by forest type and
season
There were no significant differences in species richness by forest type or season in
all the study sites of Garbhanga and Rani ranges as probably all the recorded species were
encountered in almost all the transects in varying levels of abundance and secondly could
also be related to the pooled data.. The evenness and rarefaction estimates were found to be
higher in the closed forest habitats of Garbhanga range and in the open forest habitats of
Rani range. Differences in landscape structure and microclimatic conditions could have had
a combined effect on the variations in the evenness and rarefaction estimates of butterflies
between the open and closed forest habitats. In most of the landscapes in India, two factors
associated with human disturbance are known to influence the species diversity and richness
of flora and fauna - grazing by cattle and fires (Kunte, 1997). This holds particularly true for
butterflies where vegetation is primarily affected by such kinds of disturbance. Although the
gradients of disturbance in the study sites of Garbhanga and Rani ranges were not measured,
the levels of disturbance were higher in the study sites of Rani range and the landscape
structure also differed between these study sites. Higher species evenness in the disturbed
open forests of Rani range could be attributed to higher abundances of wide-ranging
generalist species that were more commonly associated with the open transects near to
human settlements where abundance of cultivated varieties of food plants were available.
According to Novotny (1991), a high disturbance level favours generalists irrespective of
habitat distinctiveness. However the conditions were different in the study sites of
Garbhanga range where favourable microclimatic conditions associated with fewer
disturbances could have contributed to higher species evenness in the closed forests habitats.
But again it is to be noted here that one of the study sites (S3) was heavily disturbed by
shifting cultivation (see Chapter 4 : Fig. 4.2) but there was an abundance of grasses and
shrubs accompanied by vines in the areas of regeneration and this site could be said to
represent a typical example of vegetation created by traditional agricultural activities as in
Indo-China region. Most of the wide-ranging opportunist species are normally known to be
associated with such kinds of habitats and some of these species are also known to be
common migrants (Spitzer et al., 1993). Therefore an assemblage of diverse ecological
conditions within the closed forest transects could have contributed to higher species

141
evenness in the closed forests of Garbhanga range. However for a clear evaluation of the
different diversity parameters of the Papilionidae fauna within the protected reserve, further
data from an extended time period are required. Moreover in tropical environments diversity
or species richness measures often increase with disturbance, concurrent with a decrease in
conservation value (Basset et al., 1998). In our study although we did not quantify and
analyse the levels of disturbance, such factors have to be considered in depth for future
monitoring studies. In many butterfly assemblages, forest disturbance allows a group of
mobile, widespread and generalist taxa to colonize and coexist with much of the existing
fauna thereby enhancing the overall diversity (Hamer et al., 1997; Spitzer et al., 1993,
1997). Such migrants are typically species of low conservation concern and it is not always
sensible to give them equal weighting as the restricted range habitat specialists in
conservation assessments (Lewis & Basset, 2007).
In our findings, the overall abundances of some of the typical wide ranging gap
species associated with disturbances like the Graphium (Jays and Bluebottles) and Papilio
sp. (Limes and Common Mormon) were found to be higher particularly during the wet
season and this could have contributed to higher diversity in the open forest habitats of Rani
range. However in Garbhanga range it was seen that the closed forests were more diverse
and this could be attributed to higher wet season abundances of some of the endemics like
Atrophaneura dasarada (Great Windmill) as well as non-endemic species like Papilio paris
(Paris Peacock) and Atrophaneura polyeuctes (Common Windmill). Therefore depending
upon the local microclimatic conditions prevailing in different but closely located habitats
or landscapes, results can not only vary but can also be very contradictory. Sometimes it is
also considered reasonable to restrict analysis to endemics (Lewis et al., 1998) or to weigh
the conservation value of a species to reflect its geographic range or rarity in a similar way
to indices that take into account the taxonomic similarity of species for conservation
assessments (Vane-Wright et al., 1991; Williams et al., 1991). In our study one limitation
was the low levels of sampling due to which sometimes even a widespread species could be
recorded as locally rare although we did not find such a trend in our results. However our
analysis was not restricted to endemic taxa and neither did we remove the rare species from
the analysis. Even if the sampling effort was equal across all sites, species diversity
becomes a questionable criterion when habitats with different productivity or disturbance
levels are compared or when the number of rare species is large (Dufrene & Legendre,
1997). Therefore taking into consideration all these factors, we could still consider our
results to be statistically meaningful. Our results on the higher Papilionidae species diversity

142
in the open forests were corresponding to the findings of Ramos (2000) although our results
on higher Papilionidae diversity in the closed forests of Garbhanga were contradictory to the
findings of Ramos (2000) but corresponding to our hypothesis on expected higher species
diversity in the closed forest habitats of the study area. We also did not find any significant
differences in species richness between the two forest types which is contradictory to our
hypothesis on expected higher species richness in the closed forests. Also contradictory to
our hypothesis, we did not find any significant differences in the Papilionidae species
diversity between seasons, although only Shannon’s diversity (H’) was found to be
significantly higher during wet season of the study period only in the study sites of Rani
range and this could have been attributed to higher disturbance levels in the study sites
which is known to favour some of the wide-ranging generalist species as already predicted
in some previous studies (Novotny, 1991).
6.6 Butterfly assemblages and indicator taxa:
6.6.1 Indicator species defined by transect abundance of butterflies in open and closed
forest
Multivariate techniques are highly useful tools for identifying sets of indicator
species for different habitats. The IndVal method is good for classification and
identification of indicator species as this method reflects the local patterns of habitat
heterogeneity indicating which assemblage could be considered as an appropriate indicator
of these habitat types (Dufrene & Legendre, 1997; Kremen, 1992). Moreover the IndVal
can be calculated independently for each species, and the sampling sites (habitat/forest
types) can be categorised subjectively or quantitatively (McGeoch & Chown, 1998). This
method is however dependant on the degree to which species maintain high and significant
indicator values (IndVals) when tested in different locations and times. As IndVal reflects
frequency of occurrence (abundance), abundance changes are likely to alter year-to-year
indicator values. However, the IndVal method may accommodate such abundance changes
because IndVal is calculated by comparing a species’ frequency of occurrence between
habitat types, i.e. relative differences in frequency of occurrence between habitat types,
rather than absolute values (McGeoch et al., 2002). Therefore we analysed our data on
species abundance in the fixed transects of the five study sites within the protected reserve
both location or transect –wise by forest type and season-wise. In our study area, two main

143
sets of butterfly assemblages were identified, which showed characteristic properties of
indicator species. In total, thirteen Papilionidae species were identified as characteristic of
the two different assemblages : Bluebottle (Graphium sarpedon), Tailed Jay (G.
agammemnon), Common Jay (G. doson), Great Zebra (Pathysa xenocles), Great Windmill
(Atrophaneura dasarada), Common Windmill (A. polyeuctes), Common Batwing (A.
varuna), Golden Birdwing (Troides aeacus), Common Birdwing (Troides helena), Common
Rose (Pachliopta aristolochiae), Lime (Papilio demoleus), Red Helen (Papilio helenus) and
Common Raven (Papilio castor). One assemblage was characterised by the strong relative
abundance of forest dependant Atrophaneura sp. (Windmills and Batwings), Troides sp.
(Birdwings) and Papilio sp. (Red Helen and Common Raven) and the other assemblage was
characterised by the high relative abundance of forest independent Graphium sp. (Jays and
bluebottles), Pathysa xenocles (Great Zebra), Pachliopta aristolochiae (Common Rose) and
Papilio demoleus (Limes). Tailed Jay (G. agammemnon), Bluebottles (G. sarpedon),
Common Rose (P. aristolochiae) and Limes (Papilio demoleus) are known migrants (New
& Thornton, 1992) and characteristic canopy flyers visiting flowers in both ruderal habitats
and forest canopy (Spitzer et al., 1993). Although the Limes (Papilio sp.) showed indicator
properties, on an overall they did not score high IndVals in the study sites of the forest
reserve when groups were defined by values of the average transect abundance. However
when species assemblages were defined by values of season, Yellow Helen (Papilio
nephelus) and Common Raven (Papilio castor) scored high IndVals in the study sites of
Rani range while Red Helen (P. helenus) scored a high IndVal in the study sites of
Garbhanga range. Therefore the identification of indicator species both location or transect-
wise by forest type and season-wise was significant because it produced different results but
gave some insight into how different variables can influence the indicator properties of the
butterfly assemblages.
In the study sites of Garbhanga range, when the species assemblages were defined
by values of average abundance in transect space, Common Rose (P. aristolochiae),
Common Jay (Graphium doson), Tailed Jay (G. agammemnon), Bluebottle (G. sarpedon),
Great Zebra (Pathysa xenocles) and Limes (Papilio demoleus) scored high IndVals
(p<0.05) and could be identified as indicator species characteristic for the open forests or
gaps with disturbance (see Table 5.8). The vegetation in the transects where high
abundances of Jays and Bluebottles (Graphium sp.) were recorded was dominated by both
wild and cultivated varieties of Cinnamomum sp., Litsea sp. which are the primary food
plants of the Graphium sp. As vegetation is known to integrate many ecological factors that

144
may determine the distribution and abundance of butterfly species and specifically in case of
the host plants which represent the larval resources and have been known to show
significant correlations with the butterfly species (Sawchik et al., 2003), our results on the
correlation between the high abundances and indicator properties of Graphium sp. in the
open forest transects of Garbhanga range could be related to the vegetation or the larval
food-plant availability. Similarly the availability of other plants that may provide nectar
sources for the adults as well as the conditions necessary for sun-basking or mating places
could have been more favourable for all these species in the given habitat type. Again
disturbance increases the abundance of herbaceous growth and vines and favours species
normally frequenting tree fall gaps and streams (Ghazoul, 2002). The indicator properties of
Jays and Bluebottles (Graphium sp.) and Common Rose (Pachliopta aristolochiae) as
characteristic gap species could be correlated to moderate levels of disturbance in the open
forest transects of Garbhanga range.
However in the open forest transects of study sites S4 and S5 in Rani range, where
monoculture of Polyalthia longifolia was dominant and the levels of disturbance were also
much higher, comparatively lower abundances of Jays and Bluebottles (Graphium sp.) were
recorded. As butterfly distributions are expected to covary with the distribution of their host
plants even at small scales within forest stands (DeVries, 1988; Beccaloni, 1997), changes
in the type of forest vegetation including host plants may reflect differences in the
composition and abundance of butterfly communities among sites (Beccaloni, 1997).
Secondly disturbance-induced environmental changes are likely to affect the abundances of
some species in an assemblage more than others (Erhardt & Thomas, 1991). Higher levels
of disturbance in the sampled transects of Rani range which were in closer proximity with
the forest villages and edges could have resulted in environmental variations that did not
favour some species and could have been the reason attributed to the non-detection of
Tailed Jay (Graphium agammemnon) and Common Rose (Pachliopta aristolochiae) as
indicator taxa in the study sites of Rani range. The four species which showed indicator
properties in the disturbed open forest transects in the study sites of Rani range were
Common Jay (Graphium doson), Bluebottle (G. sarpedon), Great Zebra (Pathysa xenocles)
and Limes (Papilio demoleus).
It is important to argue here that the Rutaceae feeders (Papilio sp.- Mormons and
Limes) had recorded high abundances in the open transects of all the study sites within the
forest reserve which could be correlated to the high abundances of their host-plants (wild
and cultivated varieties of Citrus sp.) within the study sites although this correlation was
145
based on visual observation and we had quantitatively measured the larval food-plant
abundances for only two study sites, S1 and S4 which could be considered to represent the
overall food-plant profile of the study area. However only one species, Papilio demoleus
(Limes) scored an IndVal >45% (p<0.05) in the study sites of both the ranges and could be
selected as an indicator species for open disturbed habitats. Papilio demoleus is normally
associated with disturbed habitats and is a characteristic species for open transects (Lien &
Yuan, 2003) and our studies also showed similar results. The IndVal method which is
known to be sensitive to species abundances could have obscured the identity of
characteristic species as a result of interseasonal differences in abundances levels between
the study sites of the two ranges (McGeoch et al., 2002). Another reason could be attributed
to transect sampling error as this method has certain limitations. The species representation
reflects not only its abundance, but also its activity and unless the activity differs
considerably among habitats, the preferences are estimated correctly by all statistical
methods used (Spitzer et al., 1997). Therefore the typical gap species which could be
detected as characteristic indicator species for open ruderal transects within the forest
reserve were Common Jay (Graphium doson), Bluebottle (G. sarpedon), Great Zebra
(Pathysa xenocles) and Limes (Papilio demoleus). These were also opportunistic, generalist
species with wider geographic distribution and according to Brown (1984), generalist
species can be simultaneously locally abundant and widely distributed as a result of their
ability to exploit a wide range of resources on both local and regional scales. Such species
are associated with disturbed and open habitats (Spitzer et al., 1993). Our results on the
characteristic indicator species for gaps with moderate to high disturbance also showed a
similar trend. However another important factor to be considered while evaluating our
results was that normally such gap species like particularly the Graphium (Jays and
Bluebottles) are also canopy fliers and migrants, and the transect method is less efficient for
canopy fliers.
6.6.2 Indicator species defined by values of mean seasonal abundance of butterflies
Although habitat-specificity is a comparatively inflexible species-specific trait
(Southwood, 1977; Greenslade, 1983), the abundance of species in an assemblage may
change over time with season and weather conditions (Wolda, 1988; Tauber et al., 1998).
Although inter-annual differences in say for example weather patterns are likely to have
only minor effects on the IndVal of a species if it is similarly affected by environmental
variability across all habitats or sites where it is found, our studies showed different results

146
when the average abundance of the species assemblage was defined by values of season. A
total of eight species met the indicator species criteria (see Tables 5.9 & 5.12). The observed
IVs (Indicator Value) of six species from the red-bodied group Windmills and Batwings
(Atrophaneura sp.), Birdwings (Troides sp.) and Roses (Pachliopta sp.) were statistically
significant at p≤0.005. In Garbhanga range, the red-bodied species Great Windmill
(Atrophaneura dasarada), Common Windmill (A. polyeuctes), Common Batwing (A.
varuna) and Golden Birdwing (Troides aeacus) with significant IndVals of >80% (p<0.005)
and the black-bodied canopy species Red Helen (Papilio helenus, IV >65%, p<0.005) could
be selected as potential indicator species. In Rani range, four species from the red-bodied
group- Common Batwing (Atrophaneura varuna), Golden Birdwing (Troides aeacus),
Common Birdwing (T. helena), Common Rose (Pachliopta aristolochiae) and one black-
bodied species, Common Raven (Papilio castor) with significant IndVals >65% (p≤0.005)
could be selected as indicator species. Again only one species, Common Rose (P.
aristolochiae) characteristic of gaps and open forests with disturbance scored a high
observed IV (> 80%, p<0.005) as compared to other species that scored lower IVs (>65%).
Amongst the potential indicators identified in the forest reserve by values of seasonal
abundances, with the exception of Common Rose (P. aristolochiae) and Red Helen (Papilio
helenus), the other species had restricted geographic distribution. Again with the exception
of Common Rose (Pachliopta aristolochiae), these seasonal indicator species were mostly
forest-restricted and could be distinctly divided into two groups- the red-bodied
monophagous Aristolochiaceae feeders (6 sp.) and the black-bodied oligophagus Rutaceae
feeders (2 sp.). The observed IVs of the potential indicator species were clearly influenced
by the differences in the seasonal abundance. The two species which scored high IndVals in
the study sites of both the ranges were Common Batwing (Atrophaneura varuna) and
Golden Birdwing (Troides aeacus). While the former is a typical stenotopic closed canopy
species, the latter is known to be a typical gap species associated with disturbed secondary
forest habitats (Spitzer et al.,1997), although in our study sites Golden Birdwing (T. aeacus)
was recorded in higher abundances in the closed forest transects during the wet seasons of
both years. Moreover this species is known to safely survive dry seasons along riparian
corridors where there are normally an abundance of Aristolochiaceae vines (Spitzer, 1982)
and this is also the reason why this species, although a habitat specialist actually benefits
from increased disturbance as increased canopy openness and light penetration favours
vines and herbaceous growth. The forest-restricted Atrophaneura sp.(Windmills and
Batwings) were on an overall observed in very low abundances in the disturbed open areas.
147
Such species are highly sensitive to even very small local damage along the transects
(Spitzer et al., 1997). They could therefore be considered as ‘asymmetrical indicators’:
their seasonal presence could not be predicted as in all sites/transects of one habitat type, but
still contributed to the habitat specificity (Dufrene & Legendre, 1997).
Our results suggest that the set of seven species that could be possibly selected as
indicators for the particular habitat types – Tailed Jay (Graphium agammemnon), Bluebottle
(G. sarpedon), Great Zebra (Pathysa xenocles), Limes (Papilio demoleus), Common Rose
(Pachliopta aristolochiae), Common Raven ((Papilio castor) and Golden Birdwing
(Troides aeacus) may constitute a useful tool for conservation. The five indicator species for
the open transects were opportunistic species with wide geographic distribution and such
species are known to be very good colonists of extreme early successional habitats (Leps &
Spitzer, 1990). The two indicators for the closed forest transects had restricted distribution
and these are mostly stenotopic species and such taxons seem to be of endemic distribution
in Northern Indo-China or the East Himalaya (Leps & Spitzer, 1990). All the sites/transects
showed the presence of at least one of these species. They are easily recognisable and
moderately sensitive to human disturbance. One particular advantage in the case of the Jays
and Bluebottles (Graphium sp.), Limes (Papilio demoleus), Golden Birdwing (Troides
aeacus) and Common Rose (Pachliopta aristolochiae) is the considerable knowledge about
their life history and ecology (Spitzer, 1982; Spitzer et al., 1997). Therefore the
identification of indicator species both by mean transect and seasonal abundances thereby
determining their habitat specificity could be considered as an useful tool for conservation.
Our results on the identification of a mixed assemblage of four common species with wider
geographic ranges and associated with disturbed habitats or forest types corresponds with
the findings of Ramos (2000) as well as our hypothesis on indicator species selection
criteria. Similarly the indicator properties shown by the two endemic closed forest restricted
species and one endemic gap species also corresponds with the higher conservation
priorities of restricted range species as observed by Spitzer et.al., (1993), although we did
not predict the selection of restricted range species as indicators in our hypothesis. But our
findings on this mixed assemblage could be considered as significant because the gap
species are generally mobile, opportunistic species with low conservation value (Vane-
Wright et al., 1991) and are not always considered to be reliable indicators of habitat quality
while at the same time they are also reported to have the lower risks of extinction because
they are less likely to be isolated, demographically and genetically than less mobile species
(Macdonald & Johnson, 2001).

148
CHAPTER 7 : RECOMMENDATIONS FOR CONSERVATION 7.1 Study overview The study on the species richness and relative abundance of the Papilionidae was
done for the first time in Rani-Garbhanga Forest Reserve, Assam, India. The results showed
a still high number of Papilionidae species. The local extinction of several Papilionidae
species was noted. The conservation value of a biological community is determined not only
by its richness and diversity, but also by the rarity and endemicity of its constituent species
and the ability of species to maintain viable populations in the face of disturbance pressure
(Ghazoul, 2002). In our present study, we recorded 28 species of Papilionidae upto the
species level, out of which four species were endemic to the Eastern Himalayas - Great
Windmill (Atrophaneura dasarada), Common Raven (Papilio castor), Chain Swordtail
(Pathysa aristeus), Great Zebra (Pathysa xenocles) and amongst them two species were
forest-restricted (Atrophaneura dasarada and Papilio castor) while the other two species
were associated with open/scattered forest habitats (Pathysa aristeus and Pathysa xenocles).
In comparison to the 69 species of Papilionidae documented in Northeast India by Evans
(1932) and Talbot (1939) out of which the distribution range of five species were described
to be endemic to Assam, the status of three species were reported to be very rare and they
are presently protected by law in India. All these three species are forest-restricted and have
been rarely recorded in the Eastern Himalayas in the past years and also not recorded in our
present study. Based on our results on the multivariate ordination on the Papilionidae
assemblage within the study area, 16 species were found to be associated with the closed
forests while another 12 species were associated with the open forests. Out of the 16 forest
restricted species, two species were endemic to the Eastern Himalayas with restricted range
score 1 and another four species were endemic to Northeast India and Indo-China with
restricted range score 2. Nine species had ‘Indo-Malayan’ distribution with a range score 3
and only one species had ‘Indo-Australian’ distribution with the widest range score 4.
Amongst the 12 gap species, only two species were endemic to the Eastern Himalayas with
range score 1 while five species had an ‘Indo-Malayan’ distribution with range score 3 and
another five species had an ‘Indo-Australian’ distribution with the widest range score 4. Our

149
results on the multivariate ordination of the swallowtail butterfly assemblage and their
categorization into two clear-cut strata with respect to habitat association lends support to
the hypothesis that the most vulnerable species are also the species with restricted
distribution and the loss of these species will lead to increasing regional homogeneity of the
butterfly fauna (Thomas, 1991; Spitzer et al., 1993; Hill et al., 1995; Hamer et al., 1997).
Such results could hold meaningful implications for future conservation strategies because
our studies showed that amongst the 28 identified species, only eight species with restricted
range scores 1 and 2 were endemic to the Eastern Himalayas and Indo-China and out of
these, six species were associated with the closed forest and two species were associated
with the open forest or gaps. While most of the ecologists consider the forest restricted
endemic taxa to be the more endangered groups requiring conservation priority, endemics
from the open and more disturbed habitats also cannot be ignored (Ramos, 2000).
Although we did not conduct an intensive vegetation sampling within our study area,
based on actual field observations, vegetation sampling in two study sites and reference
from literature, our identification and documentation of the host-plants will not only play an
important role in the future conservation process but will also contribute towards a better
understanding of the biology and ecology of these butterflies. In the present study, the host-
plant identification helped in the categorization of the diet breadth of the Papilionidae. Our
results on the correlation between the mean abundance and feeding guild of the Papilionidae
indicated a weak but significant and positive correlation and an increasing mean abundance
from ‘Specialist’ to ‘Generalist’ and ‘Monophagy’ to ‘Polyphagy’ could be considered to be
an important aspect for future conservation and eco-restoration programs. Our results also
suggest a that a more detailed investigation should be done on the larval food-plant diversity
of the Papilionidae and the probable use of vegetation as a management variable for future
butterfly monitoring activities is recommended.
The hypothesis that endemic species which are more sensitive to habitat disturbances
are confined to the closed canopy habitat and also have higher conservation value whereas
the more widely distributed opportunistic species which can better adapt to environmental
changes probably due to their ability to utilize a wide range of resources are therefore more
often found in the gaps and disturbed habitats was confirmed. Although the correlation
results were not strongly significant, they were still positive for atleast three of the study
sites in Garbhanga range. We could consider the variations in the mean abundance of the
species assemblages with different distribution ranges as probable indications of changes in

150
habitat conditions (Pollard, 1992) and incorporate this aspect of our study for future
conservation programs.
The relative abundance of the Papilionidae assemblage was found to be dependant
on season and this is in conformity with the studies on the seasonality of the butterflies in
Southeast Asia (Vietnam) by Spitzer et. al., (1993) and also corresponds to our hypothesis
on the prediction of an overall higher wet season abundance and the influence of the
monsoon climate on the seasonality of the Papilionidae within the study area. While
comparing the mean seasonal abundances, the wet season abundances were significantly
higher than the dry season abundances for both the years in all the study sites of Rani and
Garbhanga ranges. With respect to genus-wise mean abundances, Graphium (Jays and
Bluebottles) and Papilio (Mormons, Peacocks, Helens, Ravens and Limes) recorded the
highest values throughout the study period within the protected reserve.
More important for conservation is the assessment of the status of butterflies that are
confined to certain forest habitats and of butterflies that have restricted-range distributions.
If forest disturbance results in a loss of these species then both richness and heterogeneity of
the regional butterfly community will diminish, even though diversity may increase at local
scales (Spitzer et al., 1993, 1997; Hamer et al., 1997). Some of the major limitations in our
study were that butterfly sampling was restricted to only a specified study area and time
period covering two dry and two wet seasons and our sampling effort was not equal across
all the five study sites of the study area. This could have affected our sample size and the
results. Secondly although the entire study area was a disturbed secondary forest, the scales
of disturbance were not measured and neither was a detailed vegetation sampling done. We
only identified the host –plant resources of the Papilionidae within the study area although
we did not make an in-depth analysis of the correlation between the host-plant abundances
and the butterfly abundances. The probable extinction or endangered status of most of the
described species from the previous records of Evans (1932) and Talbot (1939) suggests of
a similar situation as was predicted for the Southeast Asian butterfly fauna of Singapore
(Koh et al., 2004) where larval host-plant specificity and adult habitat specialization were
the two important determinants of butterfly extinctions. We therefore need to incorporate
intensive vegetation sampling in the future studies for assessing such probabilities of co-
extinction of butterflies and their host-plants.
Although statistical information is a useful guide for designing conservation and
management strategies for disturbed and non-disturbed habitats, decisions about the
conservation value of each species has to be made using other information also (Spitzer et

151
al., 1997). Moreover the protection of high - diversity sites does not guarantee the effective
conservation of rare or spatially restricted organisms (Prendergast et al., 1993). Hence
representative diversity would be a more satisfactory criterion which implies a list of the
typical species assemblages for habitats or forest types as in case of our study or even
ecological factor combinations. Such species lists or scores for habitats would be very
useful in evaluating the comparative richness of sites (Dufrene & Legendre, 1997). That is
why we selected the method of multivariate analysis for our studies. Based on our results
from multivariate ordination by taking the separating effects of forest and season as
categorical variables for testing the abundance and distribution pattern of the Papilionidae
species assemblage as well as based on actual field observations, we could consider the red-
bodied group comprising of the Windmills and Batwings (Atrophaneura sp.), Birdwings
(Troides sp.) and Roses (Pachliopta sp.) from the closed forests to be of high conservation
value and priority based on their sole dependence on the specific host-plant Aristolochia sp.
which is an important medicinal plant and the extinction of this host-plant will ultimately
lead to the extinction of the red-bodied taxa. Moreover the closed forest restricted taxa with
small geographic range are particularly sensitive to even small-scale disturbance (Spitzer et
al., 1997) and therefore our conservation strategy must be directed towards the protection of
such specific habitats which can otherwise endanger the survival of these stenotopic closed
forest taxa. As for the other closed forest and gap species from the genera Papilio,
Graphium and Pathysa which are primarily dependant on the families Rutaceae, Lauraceae
and Annonaceae for larval feeding, a serious threat to their survival is still not predicted in
the near future as they are mostly opportunist and can easily adjust to disturbances and can
also fly over canopy of large forests and establish themselves in open ruderal habitats
(Spitzer et al., 1993). Our results showed a higher abundance of open-forest associated or
gap species. Therefore monitoring such wide-ranging opportunist species can be practical so
long as the disturbance levels do not become too intensive. For our future monitoring
program design, we could also consider evaluating the impact of management practices as
proposed in our conservation implications and thus weigh the species abundances in a site in
order to account more for the typical rather than vagrant species. Then we could consider
using CCA to match a species assemblage to environmental factors like specifically
vegetation variables and thus select a subset of species as indicators for more intensive
monitoring as suggested by Kremen, 1992. As for the effects of environmental variables on
the Papilionidae species assemblages, we could consider our results on the effects of season,
year and rainfall which accounted for most variance in the abundance and distribution of the

152
Papilionidae assemblages as statistically significant. The abundance of some of the group
assemblages like the Jays and Bluebottles (Graphium sp.), Zebras and Swordtails (Pathysa
sp.), Ravens and Helens (Papilio sp.), Batwings (Atrophaneura sp.), Limes (Papilio
demoleus), Common Rose (Pachliopta aristolochiae) and Birdwings (Troides sp.) were
strongly influenced by rainfall. However the seasonality of the ‘East-Himalayan’ butterflies
have to be much explored and our study is the first attempt of its kind to address such issues.
The effect of altitude on the butterfly abundance and distribution was on an
overall also found to be significant, with some of the closed forest restricted species found
in higher abundances at higher elevations and open forest dependant species found at higher
abundance at lower elevations. However the narrow elevational gradient between the
transects in the study sites and the sampling design could have influenced the ordination
results. As for the effect of geographical position (latitude and longitude) on the species
abundance and distribution, although the results were not strongly significant, we could
understand that such a kind of study covering larger areas will be necessary and helpful in
the future for the butterfly-monitoring program with emphasis on butterfly mapping within
specific protected areas in the region.
When tested by the two variables forest type and season we found that the
closed forests were more diverse in the study sites of Garbhanga range and the open forests
were more diverse in the study sites of Rani range. Higher diversity in the closed forest sites
of Garbhanga range indicated its high conservation value and also the identification of the
closed forest restricted species was important for setting the conservation priorities. A
similar trend was also observed for the evenness and rarefaction estimates for the species
assemblages when tested by forest type and season. The evenness and rarefaction estimates
were higher for the closed forest transects in the study sites of Garbhanga range and for the
open/scattered forest transects in the study sites of Rani range. Season as a variable did not
affect the species diversity of the Papilionidiae in the study sites of Garbhanga range, but a
higher Shannon’s diversity was found during the wet seasons of both the years in the study
sites of Rani range. There were no significant differences in species richness by forest type
and season across all the five study sites throughout the two-year study period. Measures of
local diversity are widely used to characterize species assemblages, but they give no
information on species composition or conservation value (Hill et al., 1995; Lewis, 2001).
Moreover high diversity does not insure that a site has a high ecological value (Dunn, 1994).
There is clearly a need for identifying characteristic indicator species in the
field of nature conservation for monitoring and management. Butterflies are good indicators

153
of habitat quality as they respond rapidly to modification of vegetation (Dewenter &
Tscharntke, 1997) Identification of characteristic indicator taxa by transect and seasonal
abundances also produced contradictory results where a mixed assemblage of both open
and closed forest dependant species showed significantly high IndVals. The indicators of
the forest habitat were mostly endemic species but one of the indicator species from the
open habitat was also an endemic. We could consider our attempt to identify the indicator
species by seasonal abundances to be a statistically more meaningful effort as the
seasonality of the typical ‘East-Himalayan’ butterfly fauna seems to be correlated with
rainfall and phenology of vegetation and such factors or elements can be suitably used for
biomonitoring of the butterflies in general and the Papilionidae in particular. So finally a
mixed assemblage of seven species from all the five study sites were selected as the
indicator species out of which two indicator species were closed forest endemics and five
were indicators from the open forest and amongst them one was an endemic species. These
open forest indicators makes it evident that some of the canopy forest of Papilionidae can
still survive in heavily disturbed fragmented forests because of their high mobility and larval
food plant availability. All these seven indicators not only scored high IndVals but what
was more important was that they are moderately sensitive to human disturbances, there is
sufficient knowledge about their biology and their monitoring by taking into account the
seasonality factor can be considered to be a more practical approach towards assessment of
habitat quality.
7.2 Implications for Conservation of Butterflies Butterfly conservation in Northeast India including Assam is now getting a major
impetus due to the continued efforts of a group of conservation biologists who have always
stressed on the need and importance of focusing conservation efforts towards the
invertebrate taxa and particularly the insects as this region harbors as good an insect
diversity as rich plant diversity. However these conservation efforts could become fruitful
only if a scientific approach towards the problems and threats confronting the conservation
issues are dealt with and fundamental information on the biology and ecology at species
level is acquired.

154
7.2.1 Threats to butterfly habitats
7.2.1.1 Habitat Exploitation and Fragmentation
The effects of anthropogenic pressures on tropical landscapes has been a major issue
since the population in the tropical countries have almost trebled since 1950 and is projected
to grow further by 2030 (Wright, 2005). In India while habitat encroachment around
protected areas only has drawn a lot of attention in the past, continuous and illegal
exploitation of forest resources even in non-protected areas eventually leading to forest
degradation has been a continuous threat to the survival of wildlife. In Northeast India,
deforestation has already reduced the forest cover and what remains now are mostly
fragmented habitats and conservation efforts should be directed towards these landscapes of
forest fragments. However the situation in case of butterflies is different because they
exhibit high host specificity and their breeding habitats are defined by the spatial availability
of host plants which may represent patches of suitable habitat in a sea of unsuitable foliage
(Lewis & Basset, 2007). Specialist feeders are hardly affected in such situations finally
leading to their occurrence as patchy populations or metapopulations on fragmented
resource patches. Therefore conservation efforts should cover not only the ‘endemic
generalist’ and ‘rare’ species’ but also the endemic specialists with small geographic ranges
since they are more likely to be endangered by habitat disturbance. In Assam another major
threat to the butterfly habitats has been the tea plantations. The use of pesticides and
monoculture conditions prevailing in tea gardens has been a major threat to the indigenous
vegetation. For Assam this is a detrimental situation as most of the protected reserves are
surrounded by or have tea plantations in their proximity and more forested areas are being
cleared for new tea plantations.
In case of Rani-Garbhanga landscape, serious anthropogenic pressures exist in the
form of (1) an existing railway track and a highway connecting the capital city to the airport
running along the northern boundary of the reserve; (2) a 900 acres organic tea plantation
located to the north-west side of Rani range; (3) encroachment by illegal immigrant workers
trying to find employment in the nearby urban areas; (4) illegal logging activities of timber
smugglers due to sharing of common boundary with the Garo hills of Meghalaya; (5) earth-
cutting from the hills and establishment of brick-making factories; (6) Shifting cultivation in
the southern part of the reserve; and (7) Elephant poaching.
Saw/timber mills have also been observed to be mushrooming at the northern
bordering areas of the reserve. Another serious threat has been industrial development along

155
the periphery of the reserve. Due to the steep terrain of the reserve on the Assam side it has
always been difficult for the Assam forest personnel to monitor anti-forest activities. This
has worked to the advantage of the timber smugglers and poachers from the Meghalaya side
and both illegal logging and poaching have been reported to be more rampant in Rani Forest
Reserve due to its sensitive common boundary with Meghalaya in the south. While some of
the local nature conservation organizations have been protesting against these issues,
recently an amusement park covering an area of 5.45 ha has come up on a large-scale in the
north-western part of the reserve. So with such challenging problems the conservationists
have to work towards the protection and management of the existing habitats and landscape.
7.2.1.2 Illegal trade in butterflies Although the illegal trade in butterflies in Northeast India has never been an
important part of the issue on the illegal trade in wildlife, however this activity has been
going on since 1950s and there have been several reports of butterfly smugglers being
arrested in Sikkim, Arunachal Pradesh and Meghalaya. There is no such information from
Assam about trade in butterflies and yet this matter has to be given a serious look into in
order to prevent such activities in the future. From our present study in Rani-Garbhanga
Landscape, three of the identified Papilionidae species are listed in Appendix II of the
Indian Wildlife (Protection) Act, 1972. However there are more of such vulnerable species
from the other butterfly families. There must be a directive for the anti-poaching camp
within the reserve for monitoring all kinds of illegal activities. An anti-poaching camp
established by the Hoolock Gibbon Conservation Project (US Fish and Wildlife Service,
2006) is already functional within the reserve. However from the legal point of view what is
most urgently needed is the implementation of CITES legislation in the entire Northeast
region of India.
7.2.2 The role of butterflies in conservation
In the conservation and management plan for Rani-Garbhanga Landscape, butterflies
and particularly the Papilionidae can be taken as tools for habitat protection. Butterflies have
always played a useful role in ecological impact assessments and continued monitoring of
ecological health (Pullin, 1995). Their potential value as ecological ‘indicator taxa’ is due to
their varied ecological requirements throughout their life history where as adults they rely on
nectar, fruits, dung and carrion for energy and on specific host plants for laying eggs. The

156
presence of the host-plants in turn requires specific ecological conditions. Therefore as a
taxon they are highly sensitive to microclimatic heterogeneity and disturbance (Kremen,
1994; Sparrow et al. 1994; Daily & Ehrlich, 1996; Brown, 1997). The strong habitat
specificity of the Papilionidae observed in our studies can be used for monitoring the health
of the vegetation along varying gradients of disturbance within the forest reserve. The
Papilionidae are known to respond strongly to even slight disturbance and previous studies
have also established the co-extinctions of butterflies and their host plants (Koh et al., 2004).
They can be therefore used for even studying the effects of forest management. The present
study identified some important food plants of the swallowtail butterflies and a majority of
these food plants were found to have medicinal and economic value. The traditional
indigenous knowledge of the local ethnic tribes of Northeast India including Assam has
always played a very important role in forest conservation and management practices. The
local conservation agencies can play an important role by collaborating with the Forest
Department and promoting the planting of medicinal plants under the Joint Forest
Management (JFM) program. Creation of awareness of butterfly conservation amongst the
local people has to be initiated. Butterfly-plant interactions highlighting the ecological role of
butterflies as one of the potential plant pollinators and the dependence of the butterflies on
plants for egg-laying, larval feeding and adult nectaring have to be elucidated.
In the oriental culture including the Hindu folklore, butterflies have been regarded as
an auspicious symbol of nuptial rites and rebirth. Artistic descriptions of butterflies have
always been very popular in many cultures. The cultural aspect could also be integrated into
the conservation strategy. While the local people living in the fringe areas of non-protected
and protected forests and reserves are the greater stakeholders in conservation, the other
suitable target groups are the youth (school and under-graduate students) and the managers of
ecotourism. Exhibitions and workshops popularizing the science of butterfly conservation
amongst school students is suggested to be one of the most effective strategies. However the
conservation strategy targeting the undergraduate students has to be taken up with a more
scientific approach and has to involve the Forest department and the existing conservation
agencies who are interested in promoting butterfly conservation. Several proposals were
made for upgrading Rani-Garbhanga Landscape into a wildlife sanctuary by some of the local
environmental bodies and for also declaring it a ‘Butterfly Sanctuary’ by the Department of
Entomology and Environmental Biology of Gauhati University, Assam. This can be regarded
as a positive progress towards promoting butterfly conservation in this protected reserve.

157
7.2.3 Recommendations for conservation of butterflies in Rani-Garbhanga Lansdscape
The following directives are being suggested as part of a bio-monitoring program for
butterflies in general and Papilionidae in particular in the protected forest reserve :
7.2.3.1 In-situ conservation
• Habitat restoration and management – assessment of habitat quality by frequently
monitoring the disturbance levels and conducting vegetation sampling.
• Design research projects for establishing the monitoring of butterflies – intensive
field-work to gather more base-line data on the Papilionidae diversity within the
forest reserve and to check their population density at regular intervals.
Identification of the threats to the butterfly habitats must be observed.
• Extensive scientific research on the biology of the species.
• Food-plant monitoring – estimation of the abundances and species diversity and
richness of the host-plants and to test their correlation with the butterfly abundances.
• Check the presence of some of the probably or suspected to be extinct Papilionidae
species in the nearby forest reserves (Jarasal and Kwasing Reserve forests) and study
the causes of their probable extinction.
• To investigate the possibilities of a re-introduction program for some of the
endangered species.
7.2.3.2 Ex-situ conservation
• Involvement of the local people in the ex-situ conservation of the food-plants of
the Papilionidae as majority of the host-plant species are of medicinal and
economic value. The target group should be rural women who are the greater
stakeholders in such ‘benefit-sharing’ programs.
• Prepare brochures in a simple but the local language for spreading mass
awareness about the role of butterflies in the ecosystem and their effective
conservation through conservation of their food-plants.
• Establish a ‘Butterfly Garden’, where initially the breeding of some common
species could be introduced to be followed by the captive breeding of some
endangered species. The primary step should be the creation of a suitable
‘butterfly habitat’ through proper landscaping and introduction of some suitable
host-plants and maintenance of optimum temperature (25-29οC) and humidity

158
(60-80%) conditions as climatic preferences of butterflies is one of the important
parameters for designing such a project. As we have already found in our studies,
with respect to host preferences, polyphagy and monophagy aspects must be
considered while designing the garden and particularly with the Papilionidae
assemblage, viable populations of a good species assemblage can be sustained
through selection of the appropriate host-plants as already identified from
previous and our present studies. As part of the scientific research, regular
monitoring of the seasonal population trends two times in a year- dry and wet
seasons must be conducted. As part of the eco-tourism enterprise, along with
‘butterfly exhibitory’, rural upliftment programmes through ranching of the
butterflies as ‘dead-stock’ and plantation activites could be incorporated into the
‘conservation awareness’ drive although at the initial stages the outcome could
not be predicted to be very profitable.
Due to lack of scientific documentation and research studies on the
Papilionidae of Assam in recent times, there have always been a lot of questions to be
answered on issues relating to the precise species record from Assam. In-depth
scientific studies on the dry and wet season forms and polymorphic female forms
particularly amongst the genus Papilio that exhibit a classic example of batesian
mimicry in South east Asia have to be addressed in the future. Recent studies in South-
east Asia have reported high butterfly species richness in forest reserves and have also
assessed the effectiveness of forest reserves (protected old secondary and primary
forests), fragments (scattered ruderal vegetation) and urban parks (artificially
revegetated habitats) in conserving butterfly diversity in urbanized tropical landscape
(Koh & Sodhi, 2004). Our vision on the establishment of a ‘butterfly garden’ within
Rani-Garbhanga Landscape will prove to be very effective in the eco-restoration of the
local butterfly population because suitable locations near natural forests have been
predicted to result in the re-colonization of more number of species as compared to
locations near urban areas. (Mathew & Anto, 2007). Our recommendation on upgrading
this protected reserve into a ‘Wildlife sanctuary’ or even declaring it as a ‘Butterfly
Park’ and also looking into the possiblities of establishing this ‘Butterfly Garden’ will
fulfill atleast one of the conservation implications as suggested by Miller & Hobbs
(2002) that sometimes such disturbed, fragmented landscapes represent an extreme on
the continuum of desirable environmental conditions which very often the conservation

159
biologists overlook during ecosystem management. Ongoing deforestation and human
disturbance have been some of the most important events affecting the present
Papilionidae community within Rani-Garbhanga Reserve Forest. We can consider our
present research findings on the species diversity, abundance and distribution pattern of
the Papilionidae species assemblage within Rani-Garbhanga landscape in relation to
some environmental variables as preliminary results but they still indicate the direction
along which we have to formulate our future monitoring program. Such a program must
not only consider the major environmental gradients like the monsoon seasonality
factor, but butterfly density and patterns of diversity within a mosaic of landscape and
vegetation types or variables must be intensively explored. The monitoring of selected
species is also necessary for observing the seasonal population trends which can also
help to provide evidence of the threats to the Papilionidae community within the
protected Reserve.

PART IV
REFERENCES, APPENDICES, PHOTO SECTION
• REFERENCES
• APPENDICES
• PHOTO SECTION

REFERENCES

160
REFERENCES: Arora, G.S. & Mondal, D.K. 1981. On the Papilioninae (Papilionidae, Lep.) from Arunachal Pradesh and adjoining areas of Assam in North-Eastern India. Rec. Zool. Surv. India Occ. Paper, 29 : 1-65. Barua, K.K., Kakati, D. & Kalita, J. 2004a. Diversity of Butterfly Fauna of Garbhanga Reserve Forest, Assam. Journal of Ecobiology. 16(4) : 241-265. Barua, K.K., Kakati, D. & Kalita, J. 2004b. Present Status of Swallowtail Butterflies in Garbhanga Reserve Forest, Assam, India. Zoos’ Print Journal 19(4): 1439-1441. Basset, Y. 1991a. The seasonality of arboreal arthropods foraging within an Australian rainforest tree. Ecological Entomology, 16: 265-278. Basset, Y. 1991b. Leaf production of an over storey rainforest tree and its effects on the temporal distribution of associated insect herbivores. Oecologia. 88: 211-219. Basset, Y., Novotny, V., Miller, S.E. & Springate, N.D. 1998. Assessing the impact of forest disturbance on tropical invertebrates: some comments. Journal of Applied Ecology 35: 461-466. Beccaloni, G.W. 1997. Vertical stratification of the ithomiine butterfly (Nymphalidae:Ithomiinae) mimicry complexes: the relationship between adult flight height and larval host-plant height. Biological Journal of the Linnean Society 62: 313-341. Braby, M.F. 1995. Reproductive seasonality in tropical satyrine butterflies: strategies for the dry season. Ecological Entomology 20: 5-17. Bingham, C.T. 1907. Fauna of British India. Butterflies, Volume 2. London : Taylor and Francis; Calcutta and Simla, Thacker, Spink, & Co. Blau, W.S. 1980. The effect of environmental disturbance on a tropical butterfly population. Ecology 61: 1005-1012. Blair, R.B. & Launer, A.E. 1997. Butterfly diversity and human land-use: Species assemblages along an urban gradient. Biological Conservation 80: 113-125. Breedlove, D.E, & Ehrlich, P.R. 1968. Plant-herbivore coevolution: Lupines and lycaenids. Science 162 : 671-672. Brown, J.H. 1984. On the relationship between abundance and distribution of species. Am. Nat. 124: 255-279. Brown, K.S. Jr. 1991. Conservation of neotropical environments: insects as indicators. In: Collins, N.M. & Thomas, J.A. (eds). The Conservation of Insects and their Habitats. Academic Press, London. Pp. 449-504.

161
Brown, Jr; K.S. 1997. Diversity, disturbance, and sustainable use of Neotropical forests: insects as indicators for conservation monitoring. J. Insect Conserv. 1: 25–42. Brues, C.T., 1920. The selection of food plants by insects, with special reference to lepidopterous larvae. Am. Nat. Pp. 127-141. Boggs, C.L. & Murphy, D.D. 1997. Community composition in mountain ecosystems: climatic determinants of montane butterfly distributions. Global Ecology and Biogeography Letters 6: 39-48. Botkin, D.B., Estes, J.E., McDonald R.M. & Wilson M.V. 1984. Studying the Earth’s vegetation from space; Bioscience 34. 508. Boriani, L., Burgio, G., Marini, M. & Genghini, M. 2005. Faunistic study on butterflies collected in Northern Italy rural landscape. Bulletin of Insectology 58 (1): 49-56. Borkar, M.R. & Komarpant, N. 2004. Diversity, abundance and habitat associations of butterfly species in Bondla wildlife Sanctuary of Goa, India. Zoos’ Print Journal 19 (10): 1648- 1653. Borah, K., Thakuria, K., Baruah, K.K., Sarma, N.K. & Deka, K. 2005. Man-Elephant conflict problem: A case study. Zoos’ Print 7: 22-25. Bowman, D.J.M.S., Woinarski, J.C.Z., Sands D.P.A., Wells A. & McShane V.J. 1990. Slash-and-burn agriculture in the west coastal lowlands of Papua New Guinea: responses of birds, butterflies and reptiles. Journal of Biogeography 17: 227–239. Butler, AG. 1879. On a collection of Lepidoptera from Cachar. Trans. Entomol. Soc. London. Pp. 1- 8. Champion, H.G. & Seth, S.K. 1968. The Forest Types of India, The Manager of Publications, Delhi. Chew, F.S. 1980. Food plants preferences of Pieris caterpillars (Lepidoptera). Oecologia 46: 347-353. Cleary, D.F. & Genner, M.J. 2004. Changes in rain forest butterfly diversity following major ENSO-induced fires in Borneo. Global Ecology and Biogeography 13 (2) : 129–140. Collins, N.M. & Morris, M.G. 1985. Threatened Swallowtail Butterflies of the world. IUCN Red Data Book. IUCN, Gland & Cambridge. Pp. 401. Cottrell, C.B. 1984. A phytophagy in butterflies: its relationship to myrmecophily. Zoological Journal of the Linnean Society, 80: 1-57. Courtney, S.P. & Chew, F.S. 1987. Coexistence and host use by a large community of Pierid butterflies: habitat is the templet..Oecologia. 71. Pp. 210. D’Abrera, B. 1982. Butterflies of the Oriental Region. Part 1. Hill House, Melbourne. Pp. 244.

162
Davis, D.E. 1945. The annual cycle of plants, mosquitoes, birds and mammals in two Brazilian forests. Ecological Monographs. 15: 243-295. Day, M., Wiley, C.J., Playford, J. & Zalucki, M.P. 2003. Lantana: Current Management Status and Future Prospects. ACIAR, Canberra, ACT, Australia. Daily, G.C. & Ehrlich, P.R. 1996. Nocturnality and species survival. Ecology 93 (21): 11709-11712 Daniel, J.C. & H.S. Datye. 1995. A Week with Elephants. Bombay Natural History Society, Bombay, India. De Niceville, L. 1881, 1882, 1883 & 1885. Notes on the Butterflies of Sikkim. Journal of Royal Asiatic Society of Bengal. De Niceville, L. 1889. On new or little known Butterflies from the Indian Region. J.Asiat. Soc. Bengal (II) 57 (4) : 273-293 , pl. 13-14. De Niceville, L. & Gammie, G.A. 1890. A List of the Butterflies of Sikkim. The Gazetteer of Sikkim. Dennis, R.L.H. & Shreeve, T.G. 1991. Climatic change and the British butterfly fauna: opportunities and constraints. Biological Conservation. 55: 1-16. DeVries, P.J. 1988. Stratification of fruit-feeding nymphalid butterflies in a Costa-Rican rainforest. Journal of Research on the Lepidoptera 26: 98-108. De Vries, P.J., Murray, D. & Lande, R. 1997. Species diversity in vertical, horizontal and temporal dimensions of a fruit-feeding butterfly community in an Equadorian rainforest. Biological Journal of the Linnaean Society 62: 343-364. DeVries, P. J. & Walla, T.R. 2001. Species diversity and community structure in neotropical fruit-feeding butterflies. Biological Journal of the Linnean Society 74: 1-15.
Steffan-Dewenter, I., Tscharntke, T. 1997. Early succession of butterfly and plant communities on set-aside fields. Oecologia 109: 294-302.
Dethier, V.G. 1954. Evolution of feeding preferences in phytophagous insects. Evolution 8 : 33–54.
Dethier, V.G. 1959. Food plant distribution and density and larval dispersal as factors affecting insect populations. Canadian Entomologist 91 : 581-596. Dethier, V.G. & Fuller, W.C. 1961. Variation in Plebejus icarioides (Lycaenidae). Food-plant specificity. J. Lepid. Soc. 15: 34-42. Didham, R.K. & Springate, N.D. 2003. Determinants of temporal variation in community structure (Pp. 28-39) in Basset, Y., Novotny, V., Miller, S.E., & Kitching, R.I. Arthropods

163
of tropical forests. Spatio-temporal dynamics and resource use in the canopy. Cambridge University Press, Cambridge. Doherty, W. 1889. Notes on Assam Butterflies. J. AS-Soc. Bengal 58 : 18-34. Dobzhansky, T. & Pavan, C. 1950. Local and seasonal variations in relative frequencies of species of Drosophila in Brazil. Journal of Animal Ecology 19: 1-14. Dover, J.W., Sparks, T.H. & Greatorex-Davies, J.N. 1997. The importance of shelter for butterflies in open landscapes. Journal of Insect Conservation 1 : 89–97 Dufrene, M. & Legendre, P. 1997. Species assemblages and indicator species : the need for a flexible asymmetrical approach. Ecol. Monogr., 67 : 345-366. Duggin, J.A. & Gentle, C.B. 1998. Experimental evidence on the importance of disturbance intensity for invasion of Lantana camara L. in dry rainforest –open forest ecotones in north-eastern NSW, Australia. For. Ecol. Manag. 109. Pp. 279-292. Dunn, Ch. 1994. Gaps in GAP. Plant Science Bulletin 40: 120-121. Dyer, L.A. 1995. Tasty generalists and nasty specialists? Antipredator mechanisms in tropical lepidopteran larvae. Ecology 76: 1483-1496. Elwes, H.J. 1880. A Catalogue of the Lepidoptera of Sikkim. Proceedings of the Zoological Society of London. Elwes, H.J. & Moller, Otto. 1888. The Catalogue of the Butterflies of Sikkim. Transactions of Entomological Society of London. Pp. 269-464. Elwes, H.J. 1891. On butterflies collected by Mr. W. Doherty in Nagh and Karen hills. Peack. Proc. Zool. Soc. London. Ehrlich, P.R. 1958. The comparative morphology, phylogeny and higher classification of the butterflies. University of Kansas Science Bulletin 39: 305-370. Ehrlich, P. & Ehrlich, A. 1961. How to Know the Butterflies. Dubuque, Iowa: Wm. C. Brown Company Publishers. Ehrlich, P.R. & Gilbert, L.E. 1973. Population structure and dynamics of the tropical butterfly Heliconius ethilla. Biotropica 5: 69–82 Ehrlich, P.R. & Raven, P.H. 1964. Butterflies and plants: a study in coevolution. Evolution 18: 586-608. Ehrlich, P.R. & Gilbert, L.E. 1973. Population structure and dynamics of the tropical butterfly, Heliconius ethilla. Biotropica 5 (2 ): 69-82. Ehrlich, P.R., White, R.R., Singer, M.C., McKechnie, S.W. & Gilbert, L.E. 1975. Checkerspot butterflies: A historical perspective. Science 188:221-228.

164
Ehrlich, P. R. 1986. Ecological understanding is not free: The case for basic research. Amicus Journal 7: 7-8. Evans, W.H. 1932. The Identification of Indian Butterflies. (2nd Ed. Revised), Bombay Natural History Society, Mumbai, India. Pp. 454. Erhardt, A. 1985. Diurnal Lepidoptera: sensitive indicators of cultivated and abandoned grassland. Journal of Applied Ecology. 22: 849-861. Erhardt, A. & Thomas, J.A. 1991. Lepidoptera as indicators of change in semi-natural grasslands of lowland and upland Europe. In: N.M. Collins and J.A. Thomas, Editors, The Conservation of Insects and Their Habitats, Academic Press, San Diego, CA. Pp. 213–234. Ellenberg, H., Weber, H.E., Dull, R. 1992. Indicator values of plants in Central Europe. Scripta Geobotanica. Goltze Verlag, Gottingen. Eliot, J.N. 1992. The Butterflies of the Malay Peninsula (4th edn.) Malayan Nature Society, Kuala Lumpur, Malaysia. Emmel, Th. C. & Leck, Ch. F. 1970. Seasonal changes in the organization of tropical rain forest butterfly populations in Panama. Journal of Research on the Lepidoptera 8: 133-152. Endo, S. & Nihira, I. 1990. Larval food of Japanese butterflies. Group ‘TAMAMUSHI’, Tokyo (In Japanese). Fensham, R.J., Fairfax, R.J. & Cannell, R.J. 1994. The invasion of Lantana camara L. in Forty Mile Scrub National Park, North Queensland. Austr. J. Ecol. 19 : 297-305. Fensham, R.J. 1994. Phytophagous insect -woody sprout interactions in tropical eucalypt forest. I. Insect herbivory. Australian Journal of Ecology 19: 178-188. Feltwell, 2001. Field guide to the butterflies and other and other insects of Britain. Oxford University Press. Pp. 352. Fleishman, E., Austin, G.T. & Weiss, A.D. 1998. An empirical test of Rapoport’s rule: Elevational gradients in montane butterfly communities. Ecology. 79 (7): 2482-2493. Fleishman, E., Murphy, D.D. & Brussard, P.F. 2000. A new method for selection of umbrella species for conservation planning. Ecol. Appl., 10 : 569-579. Fimbel, R.A., Grajal, A. & Robinson, J.G. 2001. The Cutting Edge: conserving wildlife in logged tropical forests. Columbia University Press, New York. Pp. 700. Fiedler, K. 1998. Diet breadth and host plant diversity of tropical-vs. temperate-zone herbivores: South-East Asian and West Palaearctic butterflies as a case study. Ecological Entomology 23 : 285-297. Fogden, M.P.L. 1972. The seasonality and population dynamics of equatorial forest birds in Sarawak. Ibis 114: 307-343.

165
FAO/UNEP. 1981. Tropical forest resources assessment project. Technical report No. 3. FAO, Rome. FSI 1999. State of Forest Report -1999. Forest Survey of India (Ministry of Environment and Forests), Government of India. Dehradun. FSI 2000. State of Forest Report 1999. Forest Survey of India (Ministry of Environment and Forests), Government of India. Dehradun. Pp.119. FSI 2003. State of Forest Report 2001. Application of Satellite Based Remote Sensing for Monitoring and Mapping of India’s Forest and Tree Cover Gardner, S.M., Cabido, M.R., Valladares, G.R. & Diaz, S. 1995. The influence of habitat structure on arthropod diversity in Argentines semi-arid Chaco forest. Journal of Vegetation Science 6: 349-356. Gaston, K.J. & Lawton, J.H. 1990. Effects of scale and habitat on the relationship between regional distribution and local abundance. Oikos 58 (3): 329-335. Gauld, I.D. & Gaston, K.J. 1992. Plant allelochemicals, tritrophite interactions and the anomalous diversity of tropical parasitoids: the ‘nasty’ host hypothesis. Oikos 65: 353-357.
Ghazoul, J. 2002. Impact of logging on the richness and diversity of forest butterflies in a tropical dry forest in Thailand. Biodiversity and Conservation 11 :521-541.
Gentry, A.H. 1995. Seasonally Dry Tropical Forests (eds S.H., Bullock, Mooney, H.A. & Medina, E.). Cambridge University Press, Cambridge. Pp. 146-194.
Gibbs, D.G. & Leston, D. 1970. Insect phenology in a forest cocoa-farm locality in west Africa. Journal of Applied Ecology 7: 519-548. Gilbert, L.E. 1971. The effect of resource distribution on population structure in the butterfly Euphrydryas editha: Jasper Ridege vs. Del Puerto Canyon colonies. PhD. Thesis. Stanford University Press, Princeton, N.J. Gilbert, L. & Singer, M.C. 1975. Butterfly ecology. Annu. Rev. Ecol. Syst. 6, 365-397. Gilbert, L. E. 1980. Coevolution of animals and plants: a 1979 postscript. Coevolution of Animals and Plants. Austin, University of Texas Press. Revised, ed. Pp. 247-263. Greenslade, P.J.M. 1983. Adversity selection and the habitat templet. American Naturalist 122 : 352–356. Groombridge, B. & Jenkins, M.D. 2000. Global biodiversity: earth’s living resources in the 21st century. World Conservation Press, Cambridge. Gupta, I.J. & Shukla, J.P.N. 1988. Records of the Zoological Survey of India. Occasional Paper No. 109. Calcutta.
166
Hamer, K.C., Hill, J.K., Lace, L.A. & Langhan, A.M. 1997. Ecological and biogeographical effects of forest disturbance on tropical butterflies of Sumba, Indonesia. Journal of Biogeography 24: 67-75. Hamer, K.C., Hill, J.K., Benedick, S., Mustafa, N. Sherratt, T.N., Maryati, M. & Chey, V.K. 2003. Ecology of butterflies in natural and selectively-logged forests of northern Borneo: the importance of habitat heterogeneity. Journal of Applied Ecology 40: 150-162. Hamer, K.C., Hill, J.K., Mustaffa, N., Benedick, S., Sherratt, T.N., Chey, V.K. & Maryati, M. 2005. Temporal variation in abundance and diversity of butterflies in Bornean rain forests: opposite impacts of logging recorded in different seasons. Journal of Tropical Ecology 21: 1-9. Harcourt, A.H., Coppeto, S.A. & Parks, S.A. 2002. Rarity specialization and extinction in primates. Journal of Biogeography 29: 445-456. Haribal, M. 1992. The Butterflies of Sikkim Himalaya. Sikkim Nature Conservation Foundation (SNCF), Gangtok. Haribal, M. 1994. Butterflies of Sikkim Himalaya and their Natural History. Sikkim Nature Conservation Foundation (SNCF), Gangtok. Hill, J.K., Hamer, K.C., Dawood, M.M., Tangah, J. & Chey, V.K. 2003. Rainfall but not selective logging affect changes in abundance of a tropical forest butterfly in Sabah, Borneo. Journal of Tropical Ecology 19: 35-42. Cambridge University Press. Hooker, J.D. 1855. Notes of Naturalist in Bengal, The Sikkim and Nepal Himalayas, The Khasia Mountains, etc. Himalayan Journals Vol. 1. Reg & Philip Remington, London. Pp. 143. Hooker, J.D. 1872-1897. Flora of British India. Vols. 1-7. L. Reeve & Co., Ashford, Kent, UK. Holloway, J.D. 1987. Macrolepidoptera diversity in the indo-australian tropics: geographic, biotopic and taxonomic variations. Biological Journal of the Linnaean Society 30: 225-241. Holloway, J.D., Kirg-Spriggs, A.H. & Chey, V.K. 1992. The response of some rain forest insect groups to logging and conversion to plantation. Phil. Trans. R. soc. Lond. B, 335, 425-436. Holl, K.D. 1995. Nectar resources and their influence on butterfly communities on reclaimed coal surface mine. Restoration Ecol. 3, 76-85. Hoft, R. & Hoft, M. 1995. The differential effects of elephants on rain forest communities in the Shimba Hills, Kenya. Biological conservation 73: 67-79. Houghton, R.A., Woodwell, G.M. 1981. Biotic contributions to global carbon cycle: the role of remote sensing In: Proceedings of Seventh International Symposium on Machine Processing of Remote Sensing Data, West Lafayette, Indiana. Pp. 593-602.

167
Hill, J.K., Hamer, K.C., Lace, L.A. & Banham, W.M.T. 1995. Effects of selective logging on tropical butterflies on Buru, Indonesia. Journal of Applied Ecology 32: 454-460. Hill, J.K. & Hamer, K.C. 2004. Determining impacts of habitat modification on diversity of tropical forest fauna: the importance of spatial scale. Journal of Applied Ecology 41: 744-754. Hurlbert S.H. 1971. The nonconcept of species diversity: a critique and alternative parameters. Ecology 52: 577–586. Hynniewta, T.M. & Baishya, A.K. 1992. Floristic wealth of North-East India. Proc. Zool. Soc., Assam (Spl. Ed.). Pp. 23-33. IFFN (International Forest Fire News) 2002. Fire Situation in India. Int. Forest Fire News, 26: 23-27. Igarashi, S. & Fukuda, H. 1997. The Life Histories of Asian Butterflies, Vol. I. Tokai University Press, Tokyo, Japan. Ishii, M. 1993. Transect counts of butterflies. In: Yata O and Ueda K (eds) Decline and Conservation of Butterflies in Japan II. The Lepidopterological Society of Japan & the Nature Conservation Society of Japan, Osaka, Japan [in Japanese with English summary] Pp. 91-101. IUCN 1991. The Conservation Atlas of Tropical Forests: Asia and the Pacific. London and Basingstoke: Macmillan Press Ltd. Invasive Species Specialist Group, IUCN. 2001. 100 World’s Worst Invasive Alien species. Available from URL: http://www.issg.org/booklet.pdf. Islam, M.Z & Rahmani, A.R. 2004. Important Bird Areas in India: priority sites for conservation. Indian Bird Conservation Network. Bombay Natural History Society and Birdlife International (U.K). Pp. XVIII+1133. ICBP, 1992. Putting Biodiversity on the Map: Priority Areas for Global Conservation. ICBP, Cambridge. Jablonski, D. 1991. Extinctions: a palaeontological perspective. Science 253. 754-757. Janzen, D.H. 1986. Biodiversity (ed. Wilson, E.O.), National Academy Press, Washington. 130-137. Johnstone, R.C.B. 1967. Elephant protection problems in Budongo tropical high forest. Uganda Forestry Department Paper presented at the 9th Commonwealth Forestry Conference, New Delhi, 1968. (Manuscript in Oxford Forestry Institute Library). Jones, M.J., Sullivan, M.S., Marsden, S.J. & Linsley, M.D. 2001. Correlates of extinction risk of birds from two Indonesian islands. Biological Journal of the Linnaean Society 73: 65-79.
168
Kanjilal, V.N., Kanjilal, P.C., Das, A., De, R.N. & Bor, N.L. 1934-1940. Flora of Assam, 5 Vols. Government Press, Shillong India. Kitahara, M. & Fuji, K. 1994. Biodiversity and community structure of temperate butterfly species within a gradient of human disturbance: an analysis based on the concept of generalist vs. specialist strategies. Researches on Population Ecology 36: 187-199. Koh, L.P. & Sodhi, N.S. 2004. Importance of Reserves, fragments and Parks for butterfly conservation in a tropical urban landscape. Ecological Applications 14 (6): 1695-1708. Koh, L.P., Sodhi, N.S. & Brook, B.W. 2004. Ecological Correlates of Extinction Proneness in Tropical Butterflies. Conservation Biology 18(6): 1571-1578. Koh, L.P., Sodhi, N.S. & Brook, B.W. 2004. Co-extinctions of tropical butterflies and their hostplants. Biotropica 36(2): 272- 274. Kremen, C. 1992. Assessing the indicator properties of species assemblages for natural areas monitoring. Ecological Applications 2: 203-217. Kremen, C. 1994. Biological inventory using target taxa: a case study of butterflies of Madagascar. Ecological Applications 4: 407-422. Kremen, C., Colwell, R.K., Erwin, T.L., Murphy, D.D., Noss, R.F. & Sanjayan, M.A. 1993: Terrestrial Arthropod Assemblages: Their use in conservation planning. Conservation Biology 7: 796-808. Kent, M. & Coker, P. 1992. Vegetation description and analysis - a practical approach. John Wiley and Sons, New York. Krebs, C. J. 1989. Ecological Methodology. Harper Collins Publishers Inc., New York, N.Y. Kunte, K. 1997. Seasonal patterns in butterfly abundance and species diversity in four tropical habitats in northern western ghats. J. Biosci., 22 (5) : 593-603. Kunte, K., Joglekar, A., Utkarsh, G. & Pramod, P. 1999. Patterns of butterfly, bird and tree diversity in the Western Ghats. Current Science 77 (4): 577-586. Kunte, K., Agashe, D. & Date, P. 2005. Checklist of Butterflies of India. Digitized version of information from W.H.Evans’s Identification of Indian butterflies (1932, 2nd ed.). Laurance, W.F. 1999. Ecology and management of fragmented tropical landscapes – introduction and synthesis. Biological Conservation 91: 101-107. Laws, R.M., Parker, I.S.C. & & Johnstone, R.C.B. 1970. Elephants and their habitats in North Bunyoro, Uganda. East African Wildlife Journal 8: 163-180. Laws, R.M., Parker, I.S.C. & & Johnstone, R.C.B. 1975. Elephants and their habitats: the ecology of elephants of North Bunyoro, Uganda. Clarendon Press, Oxford, UK. Pp. 376.

169
Lawton, J.H., Bignell, D.E., Bolton, B., Bloemers, G.F., Eggleton, P., Hammond, P.M., Hodda, M., Holt, R.D., Larsen, T.B., Mawdsley, N.A., Strok, N.E., Shrivastava, D.S. & Watt, A.D. 1988. Biodiversity inventories, indicator taxa and effects of habitat modification in tropical forest. Nature 391: 72-76. Leather, S.R. 1990. The analysis of species-area relationships, with particular reference to macrolepidoptera on Rosaceae: how important is insect data-set quality? Entomologist, 109: 8-16. Leps, J. & Spitzer, K. 1990. Ecological determinants of butterfly communities (Lepidoptera, Papilionoidea) in the Tam Dao Mountains, Vietnam. Acta Entomol. Bohemoslov 87: 182-194. Lewis, O.T., Wilson, R.J. & Harper, M.C. 1998. Endemic butterflies on Grande Comore: habitat preferences and conservation priorities. Biological conservation 85: 113-121. Lewis, O.T. 2001. Effect of experimental selective logging on tropical butterflies. Conservation Biology 15: 389-400. Lewis, O.T. & Basset, Y. 2007. Insect Conservation in Tropical Forests. Insect Conservation Biology. The Royal Entomological Society. Lien, V.V. & Yuan, D. 2003. The differences of butterfly (Lepidoptera, Papilionoidea) communities in habitats with various degrees of disturbance and altitudes in tropical forests of Vietnam. Biodiversity and Conservation 12: 1099-1111. Loertscher, M., Erhardt, A., Zettel, J. 1995. Microdistribution of butterflies in a mosaic-like habitat: the role of nectar sources. Ecography 18 : 15-26. Macdonald, D.W. & Johnson, D.D.P. 2001. Dispersal in theory and practice: consequences for conservation in biology (Pp. 358-372) in Clobert, J., Danchin, E., Dhondt, A.A. & Nichols, J.D. Dispersal. Oxford University Press, Oxford, United Kingdom. Mani, M.S. 1986. Butterflies of the Himalaya. Oxford and IBH Co. Pvt. Ltd., New Delhi. Magurran, A. E. 1988. Ecological diversity and its measurement. Princeton University Press, Princeton, N. J.
Mathew, G. & Anto, M. 2007. In situ conservation of butterflies through establishment of butterfly gardens: A case study at Peechi, Kerala, India. Current Science 93 (3): 337-347.
Medina, E. 1995. Seasonally Dry Tropical Forests (eds S.H., Bullock, Mooney, H.A. & Medina, E.). Cambridge University Press, Cambridge. Pp. 221-242.
McGeoch, M.A. & Chown, S.L. 1998. Scaling up the value of bioindicators. Trends in Evolution and Ecology 13 : 46-47.
McGeoch, M.A., Van Rensburg, B.J. & Botes, A. 2002. The verification and application of bioindicators: a case study of dung beetles in a savannah ecosystem. J. Appl. Ecol., 39 : 661-672.
McCune, B. & Mefford, M.J. 1999. PC-ORD 4.0 for Windows. Multivariate analysis of
170
ecological data. MjM Software, Gleneden Beach, Oregon, USA. McKinney, M.L. 1997. Extinction vulnerability and selectivity: combining ecological and palaeontological views. Annual Review of Ecology and Systematics 28: 495-516. Miller, J.R. & Hobbs, R.J. 2002. Conservation where people live and work. Conservation Biology 16 : 330-337. Ministry of Law and Justice, India (1972). The Wildlife (Protection) Act, 1972 and Revised List of Schedules to the Wildlife Protection Act, 1972, coming into force from 2-10- 1980. Molina, J.M. & Palma, J.M. 1996. Butterfly diversity and rarity within selected habitats of western Andalusia, Spain (Lepidoptera:Papilionoidea and Hesperioidea). Nota Lepidopterologica 78: 267-280. Murphy, D.D. 1983. Nectar sources as constraints on the distribution of egg masses by the checkerspot butterfly. Euphydryas chalcedona (Lepidoptera:Nymphalidae).Environ. Entomol. 12, 463-466. Myers, N. 1984. The primary source: Tropical forests and our future. W.W. Norton, New York. Myers, N., Mittermeier, A.R., ‘Mittermeier, C.G., da Fonseca, G.A.B. & Kent, J. 2000. Biodiversity hotspots for conservation priorities. Nature, 403 :853-858. New, T.R. 1991. Butterfly Conservation. Oxford University Press, South Melbourne, Australia. New, T.R. & Collins, N.M. 1991. Swallowtail butterflies- An Action Plan for their Conservation. IUCN, Gland, Switzerland. New, T.R. & Thornton, I.W.B. 1992. The butterflies of Anak Krakatau, Indonesia: faunal development in early succession. J. Lepid. Soc. 46: 83-96. New, T.R., Pyle, R.M., Thomas, J.A., Thomas, C.D. & Hammond, P.C. 1995. Butterfly Conservation Management. Annual Review of Entomology 40: 57-83. Novotny, V. 1991. Effect of habitat persistence on the relationship between geographic distribution and local abundance. Oikos 61: 431-433. Novotny, V. & Basset, Y. 1998. Seasonality of sap-sucking insects (Auchenorrhyncaa, Hemiptera) feeding on Ficus (Moracea) in a lowland rainforest in New Guinea. Oecologia 115: 514-522. Olson, D.M. & Dinerstein, E. 1998. The Global 200: A Representation Approach to Conserving the Earth’s Most Biologically Valuable Ecoregions. Conservation Biology 12 (3): 502-515.

171
Opler, P.A. & Krizek, G.O. 1984. Butterflies East of the Great Plains. John Hopkins University Press, Baltimore, Maryland. Owen, D.F. 1969. Species diversity and seasonal abundance in tropical Sphingidae (Lepidoptera). Proceedings of the Royal entomological society of London, (A) 44: 10-12. Owen, D. 1971. Tropical butterflies: the ecology and behaviour of butterflies in the tropics with special reference to African species. Clarendon Press, Oxford. Pp. 228 Owen, D.F. & Chamber, D.O. 1972. Species diversity and seasonal abundance in Charaxes butterflies (Nymphalidae). Journal of Entomology, (A) 46: 135-143. Parsons, R.E. & Cantlie, K. 1947. The butterflies of the Khasi and Jaintia hills. Assam. J. Bombay Natural History Soc. 47: 198-522. Parmesan, C. 1996. Climate change and species’ range. Nature, 382. 765-766. Peet, R.K. 1974. The Measurement of Species Diversity. Annual Review of Ecology and Systematics 5: 285-307. Pielou, E.C.1975. Ecological Diversity, Wiley, New York. Pimm, S.L. 1998. Ecology – the forest fragment classic. Nature 393: 23-24. Pinratana, A. 1992. Butterflies of Thailand (Vol.I). 3rd Revised Edition. Papilionidae, Danaidae. Vikram Press, Bangkok, Thailand. Pollard, E. 1977. A method for assessing changes in the abundance of butterflies. Biol. Conserve. 12: 116-134. Pollard, E. 1979. Population ecology and change in range of the White Admiral butterfly Ladoga camilla L. in England. Ecological Entomology 4 : 61-74. Pollard, E. 1988. Temperature, rainfall and butterfly numbers. Journal of Applied Ecology 25: 819-828. Pollard, E. 1992. Monitoring populations of a butterfly during a period of range-expansion. In: Biological Recording of Changes in British Wildlife, (Ed. P.T. Harding) Pp. 60-64. HMSO, London. Pollard, E. & Yates, T.J. 1993. Monitoring Butterflies for Ecology and Conservation. Chapman & Hall, London. Pp. 274. Porter, K. 1992. Eggs and egg-laying. In: Dennis, R.L.H. (Ed.), The Ecology of Butterflies in Britain. Oxford University Press, Oxford. Pp. 46-72. Prendergast, J.R., Quinn, R.M., Lawton, J.H., Eversham, C. & Gibbons, D.W. 1993. Rare species, the coincidence of diversity hotspots and conservation strategies. Nature 365: 335-337.
172
Proctor, J., Haridasan, K., Smith, G.W. 1998. How far North does Lowland Tropical Evergreen Rainforest Go? Global Ecology and Biogeography Letters. 7 (2) : 141-146 Purvis, A., Agapow, P.M., Gittleman, J.L. & Mace, G.M. 2000. Non-random extinction and the loss of evolutionary history. Science 288: 328-330. Pullin, A.S. 1995. Ecology and Conservation of Butterflies. Chapman and Hall, London Ramakrishnan, P.S. 1993. Shifting Cultivation and Sustainable Development (An inter-disciplinary Study from North-Eastern India. Oxford University Press, New Delhi.
Ramakrishnan, P.S. 1999. Ecology in developing countries: The emerging paradigms. Proc. Indian National Science Acad.( 65) B: 51-82.
Ramos, F.A. 1996(2000). Nymphalid butterfly communities in an Amazonian forest fragment. Journal of Research on the Lepidoptera. 35: 29-41. Ramos, F.A. 1992. Diversidade de borboletas (Rhopalocera) em uma area da amazonia oriental (Acailandia MA). Master thesis. Universidade de Brasilia, Brasilia, Brazil. Ravenscroft, N.O.M. 1994. The ecology of the chequered skipper butterfly Carterocephalus palaemon in Scotland: food plant quality and population range. J. Appl. Ecol. 31, 623-630. Rauscher, M.D. & Feeny, P. 1980. Herbivory, plant density and plant reproductive success: the effect of Battus philenor on Aristolochia reticulata . Ecology 61: 905-917. Rausher, M.D. & Papaj, D.R. 1983. Demographic Consequences of Discrimination among Conspecific Host Plants by Battus philenor Butterflies. Ecology, Vol. 64 (6) : 1402-1410. Robinson, M.H. & Robinson, B. 1970. Prey caught by a sample population of the spider Argiope argentata (Araneae: Araneidae) in Panama: a year’s census data. Zoological Journal Linnean Society 49: 345-357. Rosenthal, G.A. & Berenbaum, M.R. 1992. Herbivores: their interactions with Secondary Plant Metabolites, 2nd edn. II. Ecological and Evolutionary Processes. Academic Press, San Diego, California. Roy, P.S. 1996. Forest fire and degradation assessment using satellite remote sensing and geographic information system. Satellite Remote Sensing and GIS Applications in Agricultural Meteorology : 361-400. Samways, M.J. 1994. Insect conservation Biology. Chapman & Hall, London. Sawchik, J., Dufrene, M., & Lebrun, P. 2003. Estimation of habitat quality based on plant community, and effects of isolation in a network of butterfly habitat patches. Acta. Oecol 24: 25-33

173
Scriber, J.M. 1973. Latitudinal gradients in larval feeding specialization of the world Papilionidae (Lepidoptera). Psyche 80 : 355-373. Scriber, J.M., Lederhouse, R.C. & Hagen, R.H. 1991. Food plants and evolution within Papilio glaucus and Papilio troilus species groups (Lepidoptera: Papilionidae), Pp. 341-371. In Price, P.W:, Lewinsohn, T.M., Fernandes, G.W. & Benson, W.W. (Eds.), Plant-animal Interactions. Wiley-Interscience, New York. Scriber, J.M., Tsubaki, Y. & Lederhouse, R.C. (Eds.). 1995. Swallowtail Butterflies: their Ecology and Evolutionary Biology. Scientific Publishers, Gainesville, Florida. Scoble, M.J. 1992. The Lepidoptera: Form, Function and Diversity. Oxford University Press, New York. Scott, J.A. 1986. The Butterflies of North America. Stanford University Press, Stanford, California. Shankar, U. 2001. A case of high tree diversity in a sal (Shorea robusta)- dominated lowland forest of Eastern Himalaya: Floristic composition, regeneration and conservation. Current Science. Vol. 81 (7) : 776-786. Shapiro, A.M. 1975. The temporal component of butterfly species diversity. In: Cody M.L. and Diamond J.M. (eds.), Ecology and Evolution of Communities. Belknap Press of Harvard University Press, Cambridge, Masssachusetts, Pp. 181-195. Sharp, M.A., Parks, D.R. & Ehrlich, P.R. 1974. Plant resources and butterfly habitat selection. Ecology 55: 870-875. Sharma, P.K., Ladha, J.K., Verma, T.S., Bhagat, R.M. & Padre, A.T. 2003. Rice wheat productivity and nutrient status in a Lantana (Lantana sp.) amended soil. Biol. Fert. Soils 37 : 108-114. Sheil, D. 1996. The ecology of long term change in a Ugandan rain forest. PhD thesis, Department of Plant Sciences, University of Oxford, UK. Pp. 229. Shreeve, T.G. 1992. Adult behaviour. In: Dennis, R.L.H. (Ed.), The Ecology of Butterflies in Britain. Oxford University Press, Oxford. Pp. 22-45. Shreeve, T.G. & Mason, C.F. 1980. The number of butterfly species in woodlands. Oecologia (Berl) 45 : 414 418. Skole, David & Tucker, C. 1993. Tropical Deforestation and Habitat Fragmentation in the Amazon: Satellite Data from 1978 to 1988. Science 25 Vol. 260 (5116) : 1905-1910. Singer, M.C., Ehrlich, P.R., Gilbert, L.E. 1971. Butterfly feeding on Lycopsid. Science 172: 1341-1342. Singer, M.C. & Ehrlich, P.R. 1991. Host specialization of satyrine butterflies, and their response to habitat fragmentation in Trinidad. J. Res. Lepidoptera 30: 248-256.

174
Singer, M.C. 1971. Evolution of food plant preferences of the butterfly Euphydryas editha. Evolution 35 : 383-389. Singh, J.S. & Singh, S.P. 1987. Forest vegetation of the Himalaya. Botanical Review 53: 80-192. Simonson, S.E., Opler, P.A., Stohlgren, T.J., & Chong, G.W. 2001. Rapid assessment of butterfly diversity in a montane landscape. Biodiversity and Conservation 10: 1369-1386. Slansky Jr., F. 1972. Latitudinal gradients in species diversity of the New world swallowtail butterflies. J. Res. Lepid. 11(4): 201-217. Slansky F. 1993. Nutritional ecology: the fundamental quests for nutrients. Caterpillars – Ecological and Evolutionary Constraints on Foraging (ed. by N.E. Stamp and T.E. Casey). Chapman & Hall, New York. Pp. 29-91. Southwood, T.R.E. 1977. Habitat, the templet for ecological strategies? J. Anim. Ecol. 46: 337 365. South, R. 1913. A list of butterflies collected by Captain F.M. Bailey in western China, south-eastern Tibet and the Mishimi hills. J. Bombay Nat. Hist. Soc. 22 (3): 598-615 Sparrow, H.R., Sisk, T.D., Ehrlich, P.R. & Murphy, D.D. 1994. Techniques and guidelines for monitoring Neotropical butterflies. Conservation Biology. 8: 800-809. Spitzer, K. 1982. The bionomic strategy of a swallowtail (Troides aeacus Feld.) in South East Asia. Ziva 30 (2) : 66 (In Czech). Spitzer, K. 1983. Seasonality of the Butterfly Fauna in Southeastern Vietnam (Papilionoidea). The Journal of Research on the Lepidoptera. 22(2): 126-130. Spitzer, K., Leps, J. & Soldan, T. 1987. Butterfly communities and habitat of seminatural savanna in southern Vietnam (Papilionoidea, Lepidoptera). Acta Entomol. Bohemoslov., 84: 200-208. Spitzer, K., Novotny, V., Tonner, M. & Leps, J. 1993. Habitat preferences, distribution and seasonality of the butterflies (Lepidoptera, Papilionoidea) in a mountain tropical rain forest, Vietnam. Journal of Biogeography 20: 109-121. Spitzer, K., Jaros, J., Havelka, J. & Leps, J. 1997. Effect of small-scale disturbance on butterfly communities of an Indochinese montane rainforest. Biological Conservation 80: 9-15. Stattersfield, A.J., Crosby, M.J., Long A.J. & Wedge D.C. 1998. Endemic bird areas of the world: priorities for biodiversity conservation. Birdlife International. StatSoft. 1995. STATISTICA for Windows. StatSoft Inc., Tulsa, OK. Stork, N.E. 1988. Insect diversity: facts, fiction and speculation. Biological Journal of the Linnaean Society. 35: 321-337.
175
Storch, D., Konvicka, M., Benes, J., Martinkova, J. & Gaston, K.J. 2003. Distribution patterns in butterflies and birds of the Czech Republic: separating effects of habitat and geographical position. Journal of Biogeography 30: 1195-1205. Strong, D.J. Jr., Lawton, J.H., Southwood, R. 1984. Insects on plants: Community patterns and mechanisms. Blackwell, London, England. Stuhsaker, T.T., Lwanga, J.S. & Kasenene, J.M. 1996. Elephants, selective logging and forest regeneration in the Kibale forest, Uganda. Journal of Tropical Ecology 12: 45-64. Sutton, S.L. & Collins, N.M. 1991. Insects and tropical forest conservation. Pp. 405-424 in Collins, N.M. & Thomas, J.A. (eds.) The Conservation of insects and their habitats. Academic Press, London. Swengel, A.B. 1996. Effects of fire and hay management on abundance of prairie butterflies. Biological conservation 85 (2): 73-85. Swinhoe, C. 1893. A List of Lepidoptera of the Khasi hills. Trans.Cast. Soc. London. PT II. Pp. 396-432. Talbot, G. 1939. The Fauna of British India, Including Ceylon and Burma. Butterflies Vol. I. (Papilionidae & Pieridae) Taylor and Francis Ltd., London, reprint New Delhi 1975. Pp. 600. Tauber, M. J., Tauber, C.A., Nyrop, J.P. & Villani, M.G. 1998. (Forum Article). Moisture, a vital but neglected factor in the seasonal ecology of insects: hypotheses & tests of mechanisms. Environ. Entomol. 27: 523-530. Terborgh, J. 1999. Requiem for Nature. Island Press, Washington. Ter Braak, C.J.F. 1986. Canonical correspondence analysis: a new eigenvector technique for multivariate direct gradient analysis. Ecology 67: 1167-1179. Thakur, M.L., Ahmad, M. & Thakur, R.K. 1992. Lantana weed (Lantana camara var. aculeata Linn) and its possible management through natural insect pests in India. Ind. For. 118 : 466-488. Thomas, J.A. 1983. A quick method for estimating butterfly numbers during surveys. Biological Conservation 27: 195-211. Thomas, C.D. 1991. Habitat use and geographic ranges of butterflies from the wet lowlands of Costa Rica. Biol. Cons. 55 : 269-281. Thomas, C.D. & Malorie, H.C. 1985. Rarity, species richness and conservation: Butterflies of the atlas mountains in Morocco. Biological Conservation 33: 95-117. Thompson, J.N. 1994. The Coevolutionary Process. University of Chicago Press, Chicago.

176
Turner, J.R.G., Gatehouse, C.M. & Corey, C.A. 1987. Does solar energy control organic diversity? Butterflies, moths and the British climate. Oikos, 48 :195-205. Tytler, H. 1915. Notes on Some New and Interesting Butterflies from Manipur and the Naga Hills.Part.2. J. Bombay Nat. Hist. Soc. 23: 502-515. Tyler, H.A., Brown, K.S. Jr. & Wilson, K.H. 1994. Swallowtail Butterflies of the Americas : a Study in Biological Dynamics, Ecological Diversity, Biosystematics and Conservation Scientific Publishers, Gainesville, Florida. Varshney, R.K. & Chanda, S.K. 1971. Butterflies of Northeast India. Indian Museum Bul. Vol. 1. Vane-Wright, R.I. 1972. Pre-courtship activity and a new scent organ in butterflies. Nature 239 : 338-340. Vane-Wright, R.I. 1978. Ecological and behavioural origins of diversity in butterflies. The Diversity of Insect Faunas (ed. by L.A. Mound and N. Waloff). Blackwell Scientific Publishers, Oxford, U.K. Pp. 56-70. Vane-Wright, R.I., Humphries, C.J. & Williams, P.H. 1991. What to protect? Systematics and the agony of choice. Biological Conservation 55: 235-254.
von Euw, J., Reichstein, T. & Rothschild, M. 1968. Aristolochic acid in the swallowtail butterfly Pachlioptera aristolochiae. Isr. J. Chem. 6: 659-670.
Vu, V.L. & Dang, T.D. 2002. Species composition, habitat preferences and abundance of butterflies (Lepidoptera, Rhopalocera) of Cuc Phuong National Park. Proceedings of the 4th Vietnam National Conference on Entomology. Agriculture Publishing House, Hanoi, Vietnam. Pp. 285-297. Walpole, M.J. & Sheldon, I.R. 1999. Sampling butterflies in tropical rainforest: an evaluation of a transact walk method. Biological Conservation 87: 85.91. Warren, M.S., Pollard, E. & Bibby, T.J. 1986. Annual and long-term changes in a population of the wood white butterfly Leptidea sinapis. J. Anim. Ecol. 55:707–719 Wells, S.M., Pyle, R.M. & Collins, N.M. 1983. The IUCN Invertebrate Red Data Book. IUCN, Gland and Cambridge. Pp. 632. Whittaker, R.H. 1952. A study of summer foliage insect communities in the Great Smoky Mountains. Ecological Monographs 22: 1-44. Whittaker, R.H. 1960. Vegetation of the Siskiyou Mountains, Oregon and California. Ecological Monographs 30: 279-338 Whitmore, T.C. & Sayer, J.A. 1992. Tropical Deforestation and Species Extinction. Chapman & Hall. 176 pp.

177
Wiklund, C. 1975. The evolutionary relationship between adult oviposition preferences and larval host plant range in Papilio machaon L. Oecologia 18: 185-197. Wiklund, C. 1981. Generalist vs. specialist oviposition behaviour in Papilio machaon (Lepidoptera) and functional aspects of the hierarchy of oviposition preferences. Oikos 36: 163-170. William, P.H., Humphries, C.J. & Vane-Wright, R.I. 1991. Measuring biodiversity: taxonomic relatedness for conservation priorities. Australian Journal of Systematics and Botany. Pp. 665-679.
Williams, A.C. & Johnsingh , A.J.T. 1996. Status survey of elephants and their habitats in Garo hills, North-east India. GAZAH 16: 43-60.
Williams, A.C. Johnsingh , A.J.T. 1996. Threatened elephant corridors in Garo hills, north-east India. GAZAH 16: 61-68.
Williams, A.C. & Johnsingh , A.J.T. 1996. Elephant capture in Meghalaya, north-east India - The past and the future. GAZAH 17: 1-7.
Wilson, E.O. 1987. The little things that run the world. (The importance and conservation of invertebrates). Conservation Biology. 14: 1055-1065. Wing, I.D. & Buss, I.O. 1970. Elephants and forests. Wildlife Monographs 19 : 92. Wood, B. & Gillman, M.P. 1998. The effects of disturbance on forest butterflies using two methods of sampling in Trinidad. Biodiversity and Conservation 7: 597-616. Wood, P.A. & Samways, M.J. 1992. Landscape element pattern and continuity of butterfly flight paths in an ecologically landscaped botanic garden, Natal, South Africa. Biological Conservation 58: 149-166. Wolda, H. 1977a. Fluctuations in abundance of some Homoptera in a neotropical forest. Proceedings of the third Symposium of Tropical Ecology, (Lubumbashi). Wolda, H. 1978b. Seasonal fluctuations in rainfall, food and abundance of tropical insects. American Naturalist 112: Pp. 1017- 1045. Wolda, H. 1988. Insect seasonality: why? Annual Review of Ecology and Systematics 19: 1-18. Wolda, H. 1989. Seasonal cues in tropical organisms. Rainfall? Not necessarily! Oecologia 80:437–442. Wright, R.T. 2005. Environmental Science. Pearson Prentice Hall, New Jersey. Wynter-Blyth, M.A. 1957. Butterflies of the Indian Region, Bombay Natural History Society, Mumbai, India. Pp. 523+72pls.

178
WWF/IUCN. 1995. Centres of plant diversity: A guide and strategy for their conservation. Vol. 2. Asia, Australasia and the Pacific. World Conservation Union Publications Unit, Cambridge, UK. WWF –India. 2002. Joint Forest Management. Policy practice and prospects. WWF India and IIED, London. Yamamoto, M. 1988. On the research method for butterfly assemblages. Special Bulletin of the Lepidopterological Society of Japan 6: 191-210 [in Japanese with English abstract]

APPENDICES

179
Appendix: 3
3.1 Rainfall, Maximum temperature and Relative humidity (Monthly mean) for the years 1996 - 2000 in the study area
Months Rainfall (mm) Temperature (°C) Humidity (%) January 5.82 23.4 69.0 February 17.26 27.2 55.2 March 64.24 26.4 49.4 April 121.16 32.0 59.6 May 301.36 32.9 70.8 June 250.48 32.08 78.0 July 257.26 29.9 85.2 August 287.56 31.5 82.4 September 190.36 31.9 83.0 October 107.08 30.96 76.8 November 10.94 28.2 81.4 December 6.04 25.84 75.6
3.2 Rainfall, Maximum temperature and relative humidity (Monthly mean) for the years 2001-2005 in the study area
Months Rainfall (mm) Temperature (°C) Humidity (%) January 27.1 23.04 72.8 February 29.0 25.56 61.2 March 63.8 29.02 52.2 April 125.1 30.68 59.2 May 287.94 30.56 72.6 June 382.92 31.38 80.0 July 341.5 32.42 80.0 August 357.42 32.58 81.6 September 201.22 31.68 82.0 October 114.9 30.6 78.4 November 10.32 27.78 77.6 December 6.38 24.14 75.4

180
Appendix 4 : 4.1. Monthly total rainfall, mean relative humidity and mean maximum temperature during the
butterfly-sampling period (2003-2004). Data used in multivariate analysis for examining the
effects of season (dry and wet) as categorical variable and amount of rainfall as independent
environmental variable on butterfly abundance and distribution.
Month & Year
Monthly total rainfall for 2003-2004 (mm)
Monthly mean relative humidity (%)
Monthly mean maximum temperature (°C)
January 2003 76.10 80 21.0February 2003 61.30 70 24.5March 2003 83.30 56 28.0April 2003 102.50 61 30.0May 2003 319.80 76 32.2June 2003 487.60 80 30.5July 2003 343.70 82 32.3August 2003 378.70 86 32.1September 2003 242.80 83 31.0October 2003 24.80 77 30.7November 2003 0.00 75 28.5December 2003 0.00 70 23.5January 2004 19.40 68 24.9February 2004 30.00 56 25.3March 2004 120.80 56 28.3April 2004 156.40 63 30.6May 2004 170.90 68 32.4June 2004 349.80 85 31.9July 2004 199.80 76 33.6August 2004 315.80 82 33.3September 2004 28.20 80 33.4October 2004 149.10 77 30.1November 2004 6.70 77 27.5December 2004 0.00 74 24.9
Total annual rainfall in 2003 = 2061 mm
Total annual rainfall in 2004 = 1547 mm

181
Appendix 4 (continued):
4.2 : The butterfly abundance data from the 20 transects of the five study sites in Garbhanga and Rani ranges were pooled by season, year and forest type for multivariate analysis.
Sites Season Year Transect Forest type 1 Dry 1 T1 SCF 2 Dry 1 T2 SCF 3 Dry 1 T3 CF 4 Dry 1 T4 CF 5 Wet 1 T1 SCF 6 Wet 1 T2 SCF 7 Wet 1 T3 CF 8 Wet 1 T4 CF 9 Dry 2 T1 SCF 10 Dry 2 T2 SCF 11 Dry 2 T3 CF 12 Dry 2 T4 CF 13 Wet 2 T1 SCF 14 Wet 2 T2 SCF 15 Wet 2 T3 CF 16 Wet 2 T4 CF
SCF = Scattered or open forest CF = Closed forest
T1 and T2 = Transects in scattered or open forest T3 and T4 = Transects in closed forest Categorical variables : Forest type (Scattered /Open forest and Closed forest) Season (Dry season – January to March) (Wet season – August to October) Continuous independent variables : Year (Year 1 = 2003, Year 2 = 2004)
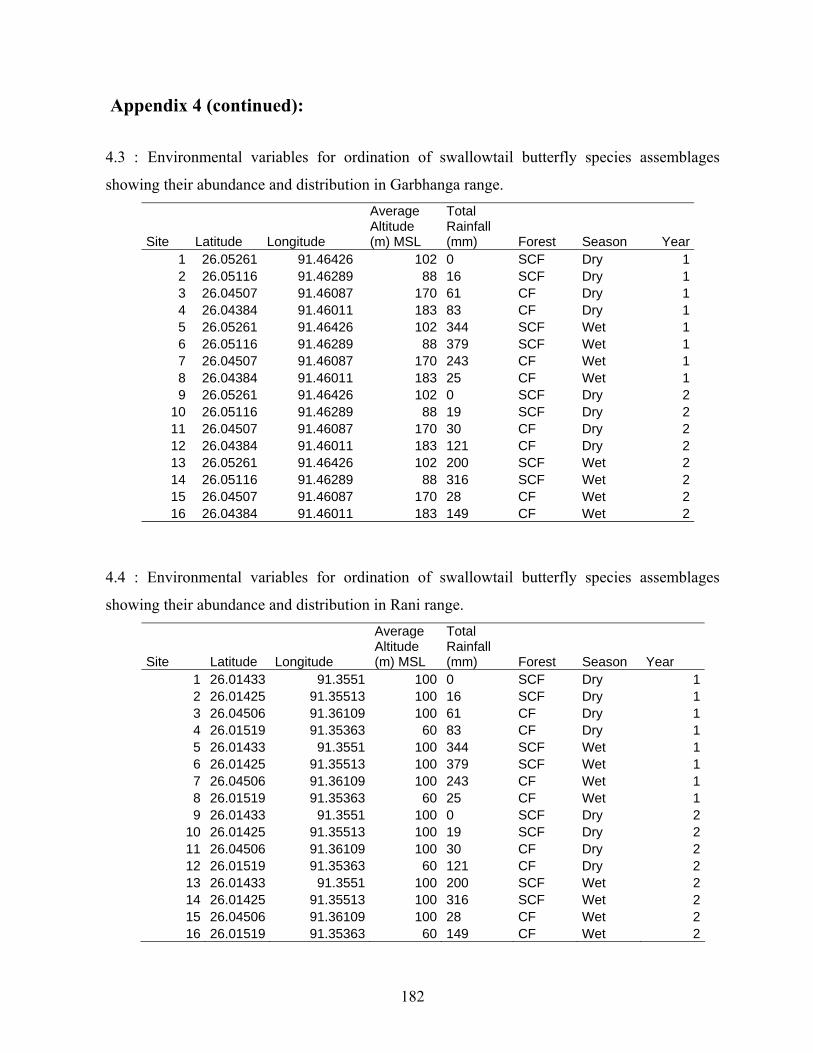
182
Appendix 4 (continued): 4.3 : Environmental variables for ordination of swallowtail butterfly species assemblages
showing their abundance and distribution in Garbhanga range.
Site Latitude Longitude
Average Altitude (m) MSL
Total Rainfall (mm) Forest Season Year
1 26.05261 91.46426 102 0 SCF Dry 12 26.05116 91.46289 88 16 SCF Dry 13 26.04507 91.46087 170 61 CF Dry 14 26.04384 91.46011 183 83 CF Dry 15 26.05261 91.46426 102 344 SCF Wet 16 26.05116 91.46289 88 379 SCF Wet 17 26.04507 91.46087 170 243 CF Wet 18 26.04384 91.46011 183 25 CF Wet 19 26.05261 91.46426 102 0 SCF Dry 2
10 26.05116 91.46289 88 19 SCF Dry 211 26.04507 91.46087 170 30 CF Dry 212 26.04384 91.46011 183 121 CF Dry 213 26.05261 91.46426 102 200 SCF Wet 214 26.05116 91.46289 88 316 SCF Wet 215 26.04507 91.46087 170 28 CF Wet 216 26.04384 91.46011 183 149 CF Wet 2
4.4 : Environmental variables for ordination of swallowtail butterfly species assemblages
showing their abundance and distribution in Rani range.
Site Latitude Longitude
Average Altitude (m) MSL
Total Rainfall (mm) Forest Season Year
1 26.01433 91.3551 100 0 SCF Dry 12 26.01425 91.35513 100 16 SCF Dry 13 26.04506 91.36109 100 61 CF Dry 14 26.01519 91.35363 60 83 CF Dry 15 26.01433 91.3551 100 344 SCF Wet 16 26.01425 91.35513 100 379 SCF Wet 17 26.04506 91.36109 100 243 CF Wet 18 26.01519 91.35363 60 25 CF Wet 19 26.01433 91.3551 100 0 SCF Dry 2
10 26.01425 91.35513 100 19 SCF Dry 211 26.04506 91.36109 100 30 CF Dry 212 26.01519 91.35363 60 121 CF Dry 213 26.01433 91.3551 100 200 SCF Wet 214 26.01425 91.35513 100 316 SCF Wet 215 26.04506 91.36109 100 28 CF Wet 216 26.01519 91.35363 60 149 CF Wet 2

183
Appendix 5 : 5.1 : Total number of individuals of each plant type sampled in the study sites S1 (Garbhanga) and S4 (Rani) during
Study sites S1 (Garbhanga) S2 (Rani) Plant category
Trees
Herb/Shrubs
Climbers
Trees
Herb/Shrubs
Climbers
Number of species 74
63
32
72 62 33
Total number of individuals
1079 1137 481 1009 1155 475

184
Appendix 5 (Continued) :
5.2: Rarefaction method (Hulbert, 1971) of species richness estimation for trees, herbs/shrubs
and climbers sampled as total number of individuals in study site S1 (Garbhanga range).
NO. OF EXPECTED NO. VARIANCE STANDARD INDIVIDUALS OF SPECIES (Eq. 10.2) DEVIATION (Eq. 10.1) 2800 169.0000 .0000 .0000 2500 168.8987 .0958 .3095 2200 168.6105 .3491 .5908 1900 168.0789 .7897 .8887 1600 167.1232 1.5387 1.2404 1300 165.3742 2.8243 1.6806 1000 162.0260 5.0688 2.2514 700 154.9935 9.0656 3.0109 400 137.0824 15.8924 3.9865 100 69.3470 12.7228 3.5669
5.3: Rarefaction method (Hulbert, 1971) of species richness estimation for trees, herbs/shrubs and
climbers sampled as total number of individuals in study site S4 (Rani range). NO. OF EXPECTED NO. VARIANCE STANDARD INDIVIDUALS OF SPECIES (Eq. 10.2) DEVIATION (Eq. 10.1) 2800 167.0000 .0000 .0000 2500 166.9134 .0836 .2891 2200 166.4997 .4482 .6695 1900 165.7641 1.0473 1.0234 1600 164.4933 2.0154 1.4196 1300 162.2825 3.5737 1.8904 1000 158.3093 6.0746 2.4647 700 150.5644 10.0983 3.1778 400 132.3509 16.3343 4.0416 100 67.7431 12.8837 3.5894

185
Appendix 5 (Continued):
5.4: Tree families, genera and species sampled as total number of individuals in study sites S1
and S4 in Rani-Garbhanga Reserve Forest, Assam. Species Family Status Economic
value S1 S4
Shorea robusta Gaertn. Dipterocarpaceae Timber 21 38 Shorea assamica Dyers. Dipterocarpaceae Timber 35 16 Bauhinia variegata L. Caesalpiniaceae Adult nectar plant 29 5 Bauhinia purpurea L. Caesalpiniaceae Medicinal 22 12 Gmelina arborea L. Verbenaceae Medicinal 8 26 Sharaka indica L. Caesalpiniaceae Larval food plant &
adult nectar plant Medicinal 13 2
Aegel marmelos L. Rutaceae Larval food plant Medicinal 17 11 Litsea sebifera Pers. Lauraceae Larval food plant Medicinal 20 0 Litsea chinensis Sonn. Lauraceae Larval food plant Medicinal 0 8 Magnolia pterocarpa Roxb. Magnoliaceae Larval food plant Medicinal 8 0 Magnolia grandiflora L. Magnoliaceae Larval food plant 0 6 Michelia champaca L. Magnoliaceae Larval food plant Essential oil 6 9 Murrya koeningii L. Rutaceae Larval food plant Aromatic
food flavouring
16 13
Cinnamomum zylenicum L. Lauraceae Larval food plant & adult nectar plant
Essential oil Medicinal
12 0
Cinnamomum tamala Fr. Lauraceae Larval food plant Medicinal 9 0 Cinnamomum camphora F.Nees.
Lauraceae Larval food plant & adult nectar plant
Medicinal 0 8
Polyalthia longifolia Sonn. Annonaceae Larval food plant Urban plantations
0 46
Citrus aurantifolia Swingle Rutaceae Larval food plant Medicinal 20 37 Citrus orientalis L. Rutaceae Larval food plant Medicinal 13 40 Citrus grandis L. Rutaceae Larval food plant 25 27 Zanthoxylum budrunga Roxb. Rutaceae Larval food plant &
adult nectar plant Medicinal 12 25
Z rhetsa Roxb. Rutaceae Larval food plant Medicinal 5 30 Z hamiltonianum Roxb. Rutaceae Larval food plant 26 20 Z oxyphyllum Roxb. Rutaceae Larval food plant Edible seed 14 0 Vitex peduncularis Wall. Verbenaceae 0 21 Vitex pubescens Vahl Verbenaceae 15 0 Ficus religiosa L. Moraceae Holy tree 23 12 Ficus bengalensis L. Moraceae Medicinal 10 4 Ficus hispida L. Moraceae Medicinal 0 5 Ficus Roxburghii Wall. Moraceae Fodder 0 1 Ficus elastica Roxb. Moraceae Rubber 0 11 Lagerstoemia parviflora Roxb.
Myrtaceae Adult nectar plant 5 10
Mangifera indica L. Anacardiaceae 18 45 Emblica officinalis Gaertn. Euphorbiaceae Adult nectar plant Medicinal 12 40

186
Appendix 5 (Continued)
Species Family Status Economic value
S1 S4
Spondias pinnata L. Sapindaceae 4 7 Garcinia speciosa Wall Clusiaceae Medicinal 2 2 G. pedunculata Roxb. Clusiaceae Medicinal 0 4 G. xanthochymus Hook. Clusiaceae Adult nectar plant 9 0 Salix tetrasperma Roxb. Salicaceae Medicinal 16 21 Tetrameles nudiflora R.Br. Tetramelaceae 20 5 Trewia nudiflora L. Euphorbiaceae Adult nectar plant 7 13 Terminalia chebula Retz. Combretaceae Adult nectar plant Medicinal 12 0 Terminalia arjuna (Roxb.) W. & A.
Combretaceae Adult nectar plant Medicinal 0 10
Tectona grandis L. Verbenaceae Adult nectar plant Timber 31 20 Cassia fistula L. Caesalpinaceae Adult nectar plant Medicinal 0 18 Albizzia lebbeck (L.) Benth. Leguminoceae Medicinal 10 0 Albizzia chinensis (Osbeck) Merr.
Leguminoceae Medicinal 0 4
Schima walichii (DC.) Korth. Theaceae Adult nectar plant Timber 14 9 Cordia grandis Roxb. Cordiaceae Medicinal 4 6 Echinocarpus assamicus Benth.
Elaeocarpaceae 15 0
Macaranga indica Wight Euphorbiaceae Adult nectar plant 17 0 Macaranga dendiculata Muell. Arg.
Euphorbiaceae 0 3
Semecarpius anacardium L.f. Anacardiaceae Medicinal 16 11 Grewia elastica Royle Malvaceae 20 4 Cordia dichotoma G.Forst. Cordiaceae 22 0 Artocarpus lakoocha Roxb. Moraceae Adult nectar plant 16 0 Artocarpus heterophyllus Lam.
Moraceae 21 15
Holarrhena antidysentrica Wall.
Apocynaceae Adult nectar plant Medicinal 16 41
Evodia meliaefolia Benth. Rutaceae Larval food plant 7 11 Bischofia javanica Bl. Euphorbiaceae Timber 2 0 Lannea grandis (Dennst.) Engl.
Anacardiaceae 13 0
Lannea coromandelica (Houtt.) Merr.
Anacardiaceae 9 13
Calicarpa arborea Roxb. Verbenaceae 14 5 Lithocarpus spicatus (Sm.) Rehder & Wils.
Fagaceae 0 14
Sapium baccatum Roxb. Euphorbiaceae 10 4 Trema orientalis Bl. Ulmaceae 5 16 Butea monosperma Lam. Taub.
Fabaceae 11 0

187
Appendix 5 (Continued)
Species Family Status Economic value
S1 S4
Elaeocarpus aristatus Roxb. Elaeocarpaceae 4 0 Erythrina variegata L. Fabaceae Pulp for
paper 16 0
Protium serratum Wall. ex Colebr.) Engl.
Busseraceae 5 0
Sterculia villosa Roxb. Sterculiaceae Pulp for paper
12 0
Callicarpa macrophylla Vahl. Verbenaceae 4 0 Zizyphus mauritiana Lam. Rhamnaceae Adult nectar plant Medicinal 3 15 Moringa oleifera Lam. Moringaceae Adult nectar plant Medicinal 30 18 Alstonia scholaris L. R.Br. Apocynaceae Adult nectar plant Medicinal 19 6 Annona squamosa L. Annonaceae Larval food plant &
adult nectar plant Medicinal 21 12
Dryptes/Camelia assamica (J. W. Mast.) Kitam
Theaceae 0 7
Sapindus mukorosii Gaertner Sapindaceae Medicinal 6 0 Mesua ferrea L. Clusiaceae Medicinal 7 0 Meliosma simplicifolia Roxb. Meliosmaceae 0 4 Aesculus assamica Griff. Hyppocastanaceae Adult nectar plant 18 11 Myristica angustifolia Lam. Myristicaceae 0 5 Flacourtia jangomas (Lour.) Raeusch
Flacourtiaceae 0 3
Paramichelia baillonii (Pierre) Hu
Magnoliaceae 0 2
Castanopsis indica (Roxb. ex Lindl.)
Fagaceae 14 0
Dipterocarpus macrocarpus Veque
Dipterocarpaceae 10 37
Tricalysia singularis K. Schum.
Rubiaceae 0 14
Oroxylum idicum Vent. Bignoniaceae Medicinal 0 3 Streblus asper Lour. Moraceae 11 2 Careya arborea Roxb. Myrtaceae 0 4 Dendrocalamus hamiltonii Nees & Arn. ex Munro
Poaceae Pulp for paper
86 61
Sterospermum chelonoides DC.
Bignoniaceae Timber 0 5
Syzygium cuminii L. Myrtaceae Adult nectar plant Medicinal 6 4 Diospyros variegata Kruz. Ebenaceae Medicinal 1 3 Bridelia retusa Spreng. Euphorbiaceae 0 4 Machilus bombycina King. Lauraceae Muga worm
foodplant 0 5
Crataeva nurvula Buch Ham. Capparidaceae Adult nectar plant Medicinal 16 0 Gynocordia odorata R-Br. Flacourtiaceae Adult nectar plant Medicinal 25 0

188
Appendix 5 (Continued): 5.5: Herb/Shrub families, genera and species sampled as total number of individuals in study
sites S1 and S4 in Rani-Garbhanga Reserve Forest, Assam. Species Family Status Economic
Value S1 S4
Calotropis gigantia Br. Aselepiadaceae Adult nectar plant Medicinal 23 14 Rauvolfia serpentina Benth. Apocynaceae Medicinal 16 5 Cannabis sativa L. Papaveraceae Adult nectar plant Narcotic 22 17 Solanum indicum L. Solanaceae Medicinal 17 26 Solanum nigrum L. Solanaceae Larval food plant &
adult nectar plant Medicinal 12 32
Solanum khasianum Clarke Solanaceae Medicinal 9 2 Solanum verbascifolium L Solanaceae Medicinal 11 3 Nerium indicum Mill. Apocynaceae Adult nectar plant 15 7 Punica granatum L. Punicaceae Adult nectar plant Medicinal 28 17 Glycosmis pentaphylla (Retz.) DC
Rutaceae Larval food plant 44 31
Murrya paniculata (L.) Jack Rutaceae Adult nectar plant 29 16 Stephania hernandifolia Walp.
Mensipermaceae Adult nectar plant Medicinal 12 10
Costus speciosus (J. König) Smith
Zingiberaceae Adult nectar plant Medicinal 29 15
Cassia occidentalis L. Caesalpinaceae 27 16 Cassia tora L. Caesalpinaceae 22 19 Cassia sophera L. Caesalpinaceae Adult nectar plant 19 25 Canna orientalis Rose Caesalpinaceae Adult nectar plant 26 10 Datura stramonium L. Solanaceae Adult nectar plant 15 13 Grewia hirsuta Vahl. Tillaceae Medicinal 8 6 Grewia sapida Roxb. ex DC., Tillaceae 5 9 Lantana camara L. Verbenaceae Adult nectar plant Invasive sp. 47 62 Sida acuta Burm. f. Malvaceae 4 19 Sida cordifolia L. Malvaceae Adult nectar plant Medicinal 23 12 Clerodendron indicum (Linn.) Kuntze
Verbenaceae Medicinal 36 37
Clerodendron infortunatum Gaertn.
Verbenaceae Adult nectar plant Medicinal 32 20
Adhatoda vasica Nees. Acanthaceae Adult nectar plant Medicinal 21 48 Ricinus communis L. Euphorbiaceae Foodplant of
silkworm 19 2
Eupatorium odoratum L. Siam weed
Compositae Medicinal Invasive species
41 50
Ficus heterophylla L. Moraceae 3 7 Coffea bengalensis Roxb. Rubiaceae Coffee 17 9 Curcuma aromatica Salisb. Zingiberaceae Medicinal 13 2 Mimosa himalayana Gamble Leguminosae 3 18 Musa sanguinea Hook. f. Musaceae Medicinal 9 5
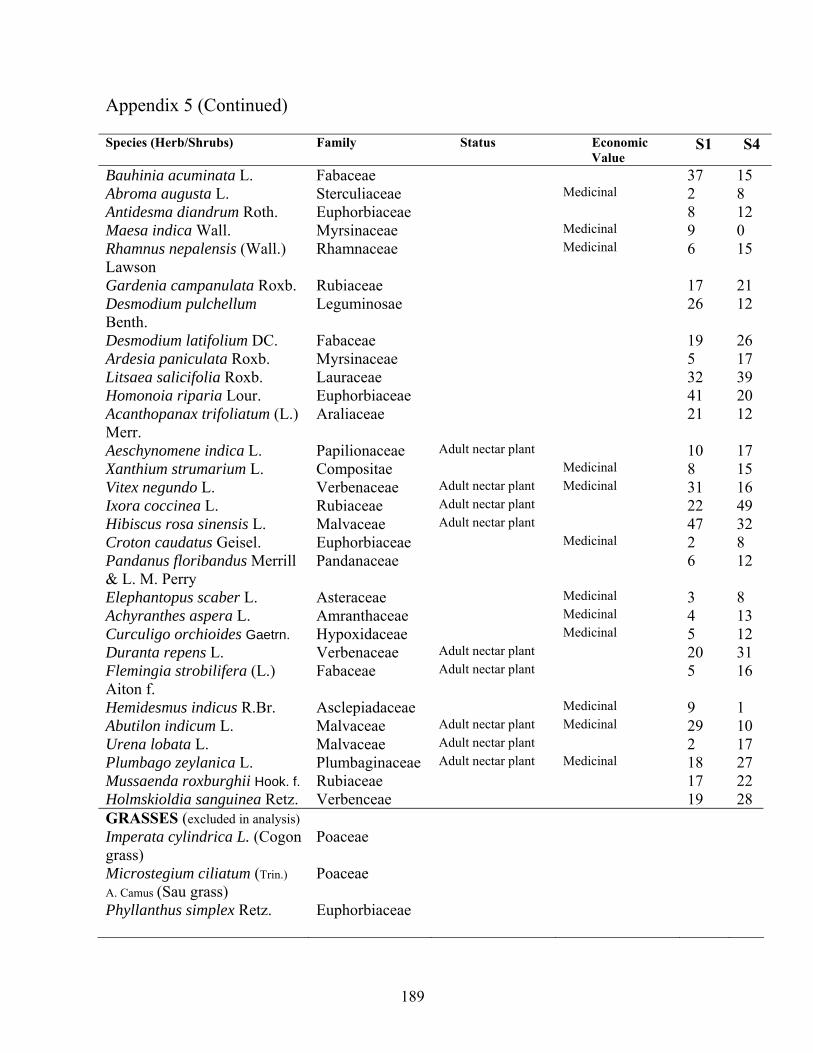
189
Appendix 5 (Continued)
Species (Herb/Shrubs) Family Status Economic Value
S1 S4
Bauhinia acuminata L. Fabaceae 37 15 Abroma augusta L. Sterculiaceae Medicinal 2 8 Antidesma diandrum Roth. Euphorbiaceae 8 12 Maesa indica Wall. Myrsinaceae Medicinal 9 0 Rhamnus nepalensis (Wall.) Lawson
Rhamnaceae Medicinal 6 15
Gardenia campanulata Roxb. Rubiaceae 17 21 Desmodium pulchellum Benth.
Leguminosae 26 12
Desmodium latifolium DC. Fabaceae 19 26 Ardesia paniculata Roxb. Myrsinaceae 5 17 Litsaea salicifolia Roxb. Lauraceae 32 39 Homonoia riparia Lour. Euphorbiaceae 41 20 Acanthopanax trifoliatum (L.) Merr.
Araliaceae 21 12
Aeschynomene indica L. Papilionaceae Adult nectar plant 10 17 Xanthium strumarium L. Compositae Medicinal 8 15 Vitex negundo L. Verbenaceae Adult nectar plant Medicinal 31 16 Ixora coccinea L. Rubiaceae Adult nectar plant 22 49 Hibiscus rosa sinensis L. Malvaceae Adult nectar plant 47 32 Croton caudatus Geisel. Euphorbiaceae Medicinal 2 8 Pandanus floribandus Merrill & L. M. Perry
Pandanaceae 6 12
Elephantopus scaber L. Asteraceae Medicinal 3 8 Achyranthes aspera L. Amranthaceae Medicinal 4 13 Curculigo orchioides Gaetrn. Hypoxidaceae Medicinal 5 12 Duranta repens L. Verbenaceae Adult nectar plant 20 31 Flemingia strobilifera (L.) Aiton f.
Fabaceae Adult nectar plant 5 16
Hemidesmus indicus R.Br. Asclepiadaceae Medicinal 9 1 Abutilon indicum L. Malvaceae Adult nectar plant Medicinal 29 10 Urena lobata L. Malvaceae Adult nectar plant 2 17 Plumbago zeylanica L. Plumbaginaceae Adult nectar plant Medicinal 18 27 Mussaenda roxburghii Hook. f. Rubiaceae 17 22 Holmskioldia sanguinea Retz. Verbenceae 19 28 GRASSES (excluded in analysis) Imperata cylindrica L. (Cogon grass)
Poaceae
Microstegium ciliatum (Trin.) A. Camus (Sau grass)
Poaceae
Phyllanthus simplex Retz.
Euphorbiaceae

190
Appendix 5 (Continued)
5.6: Climber families, genera and species sampled as total number of individuals in study sites
S1 and S4 in Rani-Garbhanga Reserve Forest, Assam. Species (Climbers) Family Status Economic
value S1 S4
Mucuna prurita (L.)Hook. Fabaceae Medicinal 10 7 Embelia ribes Burm. Myrsinaceae 5 16 Embelia nagushia Don.Prodr.E.
Myrsinaceae 4 0
Clematis cadmia Buch.-Ham. ex Wall.
Ranunculaceae 13 18
Dalbergia tamarindifolia Roxb.
Fabaceae Medicinal 14 5
Dalbergia albiflora L. Fabaceae 6 5 Bauhinia anguinea L. Caesalpiniaceae 10 29 Bauhinia vahlii W. et. A. Caesalpiniaceae 12 8 Megistostigma burmanica Kurz.
Euphorbiaceae 16 10
Butea parviflora Roxb. Fabaceae Medicinal 15 19 Jasminum scandens Vahl.
Oleaceae 5 11
Jasminum coarctatum Roxb.
Oleaceae 0 19
Merremia umbellata L. Hallier f.
Convolvulaceae 40 12
Acacia rugata (Lam.) Voigt
Fabaceae 6 0
Acacia pinnata Fabaceae 18 4 Thunbergia grandiflora Roxb.
Acanthaceae 12 18
Caesalpinia crista L. Fabaceae Medicinal 15 21 Ficus scandens Roxb. Moraceae 25 14 Millettia auriculata Baker ex. Brand.
Papilionaceae 9 6
Smilax zeylanica L. Liliaceae Medicinal 11 4 Smilax macrophylla Roxb.
Liliaceae 0 10
Combretum decandrum Roxb.
Combretaceae 5 18
Delima sarmentosa (L.) Dilleniaceae 18 27 Vitis repanda (Vahl) Wight & Arn.
Vitaceae 9 6
Hibiscus fragrans Malvaceae 8 3 Mussaenda glabra Vahl. Rubiaceae 6 14 Dioscorea kamoonensis Kunth.
Dioscoreaceae 14 6
Entada scandens L. Fabaceae 0 14
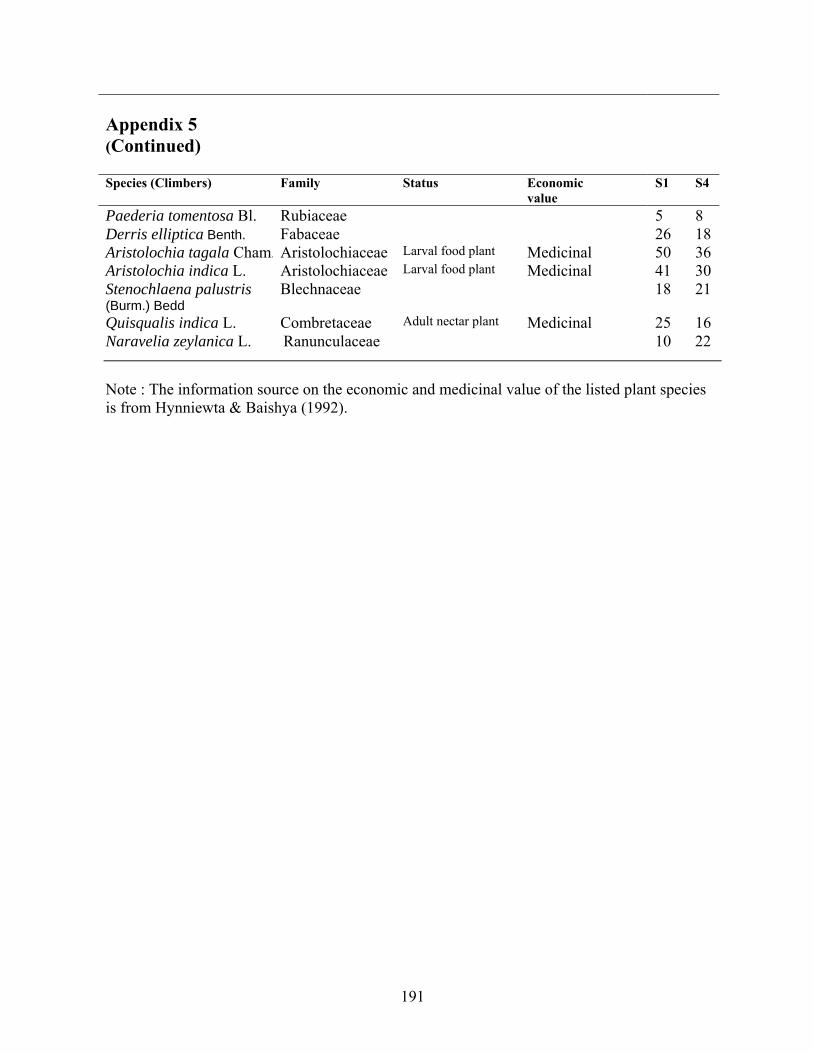
191
Appendix 5 (Continued)
Species (Climbers)
Family Status Economic value
S1 S4
Paederia tomentosa Bl. Rubiaceae 5 8 Derris elliptica Benth. Fabaceae 26 18 Aristolochia tagala Cham. Aristolochiaceae Larval food plant Medicinal 50 36 Aristolochia indica L. Aristolochiaceae Larval food plant Medicinal 41 30 Stenochlaena palustris (Burm.) Bedd
Blechnaceae 18 21
Quisqualis indica L. Combretaceae Adult nectar plant Medicinal 25 16 Naravelia zeylanica L. Ranunculaceae 10 22
Note : The information source on the economic and medicinal value of the listed plant species is from Hynniewta & Baishya (1992).

192
5.7 : Number of plant families and number of trees, herb/shrub and climber species per family
sampled in study sites S1 (Garbhanga) and S4 (Rani) within the study area.
Plant family
Tree species
Herb/Shrub species
Climber species
Total number of species
Fabaceae 2 3 9 14 Rutaceae 10 2 0 12 Verbenaceae 6 6 0 12 Euphorbiaceae 7 4 1 12 Caesalpiniaceae 3 4 3 10 Moraceae 8 1 1 10 Rubiaceae 1 4 2 7 Malvaceae 1 5 1 7 Lauraceae 6 0 0 6 Solanaceae 0 5 0 5 Magnoliaceae 4 0 0 4 Apocynaceae 2 2 0 4 Clusiaceae 4 0 0 4 Anacardiaceae 4 0 0 4 Leguminoceae 2 2 0 4 Myrsinaceae 0 2 2 4 Combretaceae 2 0 2 4 Myrtaceae 3 0 0 3 Dipterocarpaceae 2 0 0 2 Poaceae 1 2 0 3 Annonaceae 2 0 0 2 Aristolochiaceae 0 0 2 2 Papilionaceae 0 1 1 2 Zingiberaceae 0 2 0 2 Flacourtiaceae 2 0 0 2 Rhamnaceae 1 1 0 2 Ascelepiadaceae 0 2 0 2 Theaceae 2 0 0 2 Sapindaceae 2 0 0 2 Cordiaceae 2 0 0 2 Elaeocarpaceae 2 0 0 2 Fagaceae 2 0 0 2 Dilleniaceae 1 0 1 2 Sterculiaceae 1 1 0 2 Tillaceae 2 0 0 2 Ranunculaceae 0 0 3 3 Oleaceae 0 0 2 2 Liliaceae 0 0 2 2 Bignoniaceae 2 0 0 2 Compositae 0 2 0 2 Moringaceae 1 0 0 1 Capparidaceae 1 0 0 1 Mensispermaceae 0 1 0 1

193
Appendix 5 (Continued) 5.7 : (Continued) Plant family
Tree species
Herb/Shrub species
Climber species
Total number of
speciesHyppocastanaceae 1 0 0 1Plumbagenaceae 0 1 0 1Punicaceae 0 1 0 1Acanthaceae 0 1 0 1Salicaceae 1 0 0 1Tetramelaceae 1 0 0 1Ulmaceae 1 0 0 1Burseraceae 1 0 0 1Meliosmaceae 1 0 0 1Myristicaceae 1 0 0 1Ebenaceae 1 0 0 1Musaceae 0 1 0 1Araliaceae 0 1 0 1Pandanaceae 0 1 0 1Asteraceae 0 1 0 1Amranthaceae 0 1 0 1Hypoxidaceae 0 1 0 1Convolvulaceae 0 0 1 1Vitaceae 0 0 1 1Dioscoreaceae 0 0 1 1Blechnaceae 0 0 1 1Papaveraceae 0 1 0 1 Total 99 63 35 197

194
5.8 : The important host-plant families for Papilionidae in South-East Asia (Fukuda et al., 1992;
Igarashi & Fukuda, 1997) and the important larval food-plants of the swallowtail butterflies
identified in Rani-Garbhanga Reserve Forest, Assam. The host-plant records were reliably
examined from literature (Haribal, 1992; Ackery, 1991; Igarashi & Fukuda, 1997).
Plant family Number of associated larval food-plant
species
Aristolochiaceae Aristolochia tagala
Aristolochia indica
Rutaceae Zanthoxyllum oxyphyllum
Zathoxyllum hamiltonianum
Zanthoxyllum rhetsa
Zanthoxyllum budrunga
Citrus aurantifolia
Citrus orientalis
Citrus grandis
Murrya koeningii
Glycosmis pentaphylla
Aegle marmelos
Evodia meliaefolia
Lauraceae Litsea sebifera
Litsea chinensis
Cinnamomum zeylanicum
Cinnamomum tamala
Cinnamomum camphora
Magnoliaceae Magnolia grandiflora
Magnolia pterocarpa
Michelia champaca
Annonaceae Polyalthia longifolia
Annona squamosa
Solanaceae Solanum nigrum
Fabaceae Saraca indica

195
Appendix 5 (Continued)
5.9 : Plant families and number of species representing the larval and adult food-plant sources
of the Papilionidae within study sites S1 and S4 of Rani-Garbhanga Reserve Forest.
Larval host-plants and adult nectaring plants
Family
Number of larval food plant species
Number of Adult nectaring species
Rutaceae 11 2 Lauraceae 5 2 Annonaceae 2 1 Magnoliaceae 3 0 Aristolochiaceae 2 0 Caesalpiniaceae 1 5 Verbenaceae 0 5 Euphorbiaceae 0 4 Combretaceae 0 3 Apocynaceae 0 3 Malvaceae 0 3 Solanaceae 1 2 Myrtaceae 0 2 Rubiaceae 0 1 Fabaceae 0 1 Papilionaceae 0 1 Moringaceae 0 1 Papaveraceae 0 1 Capparidaceae 0 1 Zingiberaceae 0 1 Flacourtiaceae 0 1 Mensispermaceae 0 1 Clusiaceae 0 1 Hyppocastanaceae 0 1 Plumbagenaceae 0 1 Ramnaceae 0 1 Punicaceae 0 1 Ascelepiadaceae 0 1 Moraceae 0 1 Theaceae 0 1 Acanthaceae 0 1
Total number of species 25 50
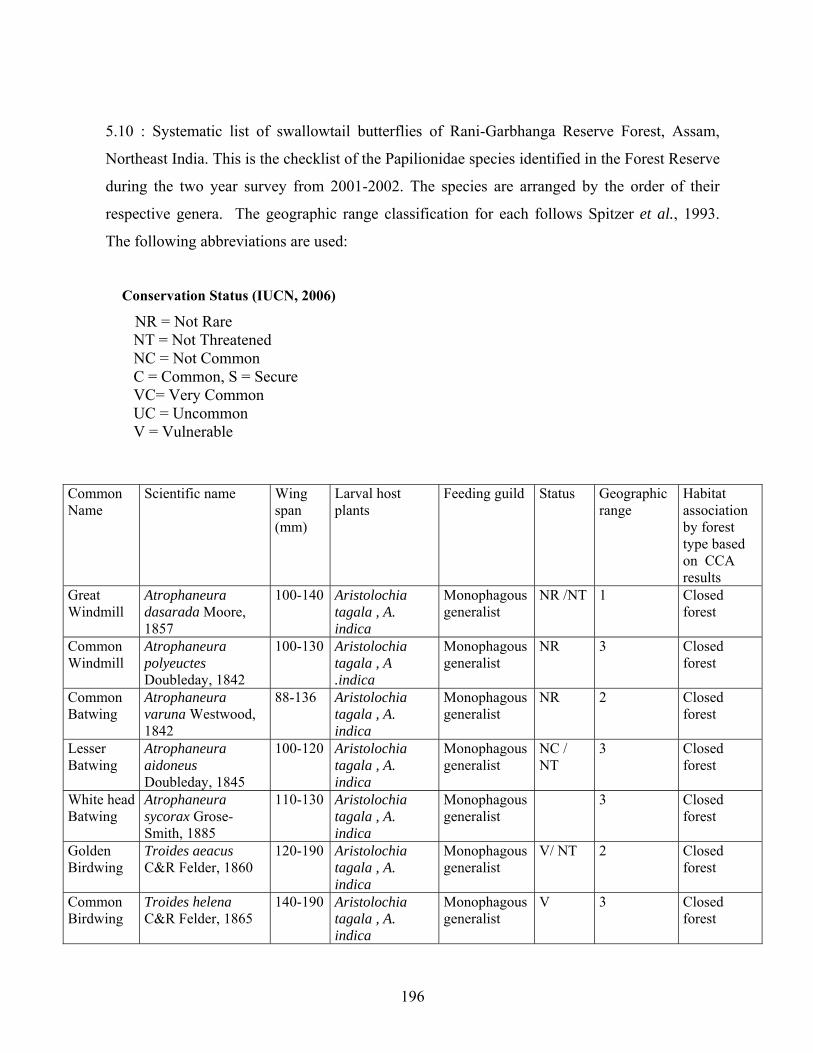
196
5.10 : Systematic list of swallowtail butterflies of Rani-Garbhanga Reserve Forest, Assam,
Northeast India. This is the checklist of the Papilionidae species identified in the Forest Reserve
during the two year survey from 2001-2002. The species are arranged by the order of their
respective genera. The geographic range classification for each follows Spitzer et al., 1993.
The following abbreviations are used:
Conservation Status (IUCN, 2006)
NR = Not Rare NT = Not Threatened NC = Not Common C = Common, S = Secure VC= Very Common UC = Uncommon V = Vulnerable
Common Name
Scientific name Wing span (mm)
Larval host plants
Feeding guild Status Geographic range
Habitat association by forest type based on CCA results
Great Windmill
Atrophaneura dasarada Moore, 1857
100-140 Aristolochia tagala , A. indica
Monophagous generalist
NR /NT 1 Closed forest
Common Windmill
Atrophaneura polyeuctes Doubleday, 1842
100-130 Aristolochia tagala , A .indica
Monophagous generalist
NR 3 Closed forest
Common Batwing
Atrophaneura varuna Westwood, 1842
88-136 Aristolochia tagala , A. indica
Monophagous generalist
NR 2 Closed forest
Lesser Batwing
Atrophaneura aidoneus Doubleday, 1845
100-120 Aristolochia tagala , A. indica
Monophagous generalist
NC / NT
3 Closed forest
White head Batwing
Atrophaneura sycorax Grose-Smith, 1885
110-130 Aristolochia tagala , A. indica
Monophagous generalist
3 Closed forest
Golden Birdwing
Troides aeacus C&R Felder, 1860
120-190 Aristolochia tagala , A. indica
Monophagous generalist
V/ NT
2 Closed forest
Common Birdwing
Troides helena C&R Felder, 1865
140-190 Aristolochia tagala , A. indica
Monophagous generalist
V
3 Closed forest

197
Common Rose
Pachliopta aristolochiae Fabricius, 1775
80-110 Aristolochia tagala , A indica
Monophagous generalist
VC/ NT 3 Scattered/ open forest
Crimson Rose
Pachliopta hector Linnaeus, 1758
90-100 Aristolochia tagala , A. indica
Monophagous generalist
NT (Protected)
3 Closed forest
Common Mormon
Papilio polytes Cramer, 1775
80-100 Aegel marmelos, Glycosmis pentaphylla, Murrya koeningii, Citrus sp., Zanthoxylum sp. Evodia meliaefolia
Oligophagous generalist
VC/ NT 3 Intermediate
Great Mormon
Papilio memnon Linnaeus, 1758
120-150 A. marmelos, G pentaphylla, M. koeningii, Citrus and Zanthoxylum sp. Evodia meliaefolia
Oligophagous generalist
C / NT 3 Closed forest
Common Raven
Papilio castor Wd., 1909
100-130 A marmelos, G. pentaphylla, M koeningii, Citrus and Zanthoxylum sp.
Oligophagous generalist
C / NT 1 Closed forest
Red Helen Papilio helenus Linnaeus, 1758
100-120 A. marmelos, G. pentaphylla, M. koeningii, Citrus and Zanthoxylum rhetsa
Oligophagous generalist
C/ NT 4 Closed forest
Yellow Helen
Papilio nephelus Westwood, 1845
115-130 A. marmelos, G. pentaphylla, M. koeningii, Citrus and Zanthoxylum sp.
Oligophagous generalist
C/ NT 2 Closed forest
Common Peacock
Papilio polyctor Moore, 1758
120-150 Citrus aurantifolia, Zanthoxylum oxyphyllum, Z hamiltonianum
Oligophagous generalist
C/ NT 3 Closed forest
Paris Peacock
Papilio paris, Linnaeus 1758
90-120 Wild and cultivated citrus plants
Oligophagous generalist
C 3 Closed forest
Krishna Peacock
Papilio krishna Moore, 1857
120-130 Wild and cultivated Citrus sp.
Oligophagous generalist
UC 2
Closed forest
Lime Papilio demoleus 80-100 Solanum Polyphagous VC 4 Scattered/

198
butterfly Linnaeus, 1758 nigrum, Citrus sp., G. pentaphylla, M..koeningii, A.. marmelos
generalist open forest
Common Mime
Chilasa clytia Linnaeus, 1758
Litsea sebifera Cinnamomum zeylanicum
Monophagous generalist
C/ NT (Protected)
3 Closed forest
Chain Swordtail
Pathysa aristeus Doubleday, 1846
85-90 Annona squamosa, Michleia sp.
Polyphagous generalist
Protected
1 Scattered/ Open forest
Five-Bar swordtail
Pathysa antipathies Fabricius, 1787
80-95 Annona squamosa,., Michelia sp.
Polyphagous generalist
3 Scattered/ Open forest
Great Zebra
Pathysa xenocles De Niceville, 1897
85-120 Annona squamosa,, Michelia sp.
Polyphagous generalist
C/ NT 1 Scattered/ Open forest
Lesser Zebra
Pathysa macareus Fruhstorfer, 1902
80-100 Annona squamosa, Michelia sp.
Polyphagous generalist
C/ NT 4 Scattered/ Open forest
Common Jay
Graphium doson C&R Felder, 1864
70-80 Magnolia grandiflora, Polyalthia longifolia, M. champaca, Cinnamomum sp.
Polyphagous generalist
S 4 Scattered/ Open forest
Tailed Jay Graphium agammemnon Linnaeus, 1758
85-100 A. squamosa, P longifolia, Michelia champaca
Polyphagous generalist
C/NT & S
4 Scattered/ Open forest
Blue Triangle/ Common Bluebottle
Graphium sarpedon Linnaeus, 1758
80-90 Saraca indica, Cinnamomum zeylanicum, A. squamosa, P longifolia, Litsea chinensis
Polyphagous generalist
S 4 Scattered/ Open forest
Green Dragontail
Lamproptera meges Tytler
40-50 Illigera cordata Monophagous specialist
NT /V 3 Intermediate
White Dragontail
Lamproptera curius Fabricius, 1787
40-50 Illigera cordata Monophagous specialist
NT7V 3 Intermediate

199
5.11 : Systematic list of swallowtail butterflies from the Indian Himalayan region (excluding the
Apollos, Parnassius species) and Peninsular India. (Evans, 1932; Talbot, 1939; Mani, 1986; Haribal,
1994). The species are arranged according to their geographic range distribution. The species
identified and recorded in the present study in Rani-Garbhanga Reserve Forest, Assam, India are
indicated in bold letters.
Endemic Species English name Distribution
range Status (Evans, 1932)
Present status (IUCN, 2006)
Atrophaneura coon cachariensis Butler, 1865
Common Clubtail Assam VR Rarely recorded
Papilio bootes bootes Westwood, 1842
Tailed Redbreast Assam R Protected by law in India
Papilio elephenor elephenor Doubleday, 1845
Yellow-crested Spangle
Assam VR Protected by law in India
Pathysa macareus lioneli, Fruh.1902 Lesser Zebra Assam NR C/NT Pathysa xenocles xenocles, Db., 1842
Great Zebra Assam NR C/NT
Atrohaneura dasarada dasarada Moore, 1857
Great Windmill Sikkim-Assam NR NR/NT
Pathysa eurous sikkimica, Heron Six-Bar Swordtail Sikkim-Assam NR NT Pathysa aristeus anticrates, Db. 1846
Chain Swordtail Sikkim-Assam R Protected
Meandrusa gyas gyas, Westwood, 1841
Brown Gorgon Sikkim-Assam R Protected
Meandrusa payeni evan Doubleday, 1845
Yellow Gorgon Sikkim-Assam NR NT
Teinopalpus imperialis imperialis Hope, 1843
Kaiser-I-Hind Sikkim-Assam R Appendix-II , Protected by law
Atrophaneura zaleucus Hewitson, 1865
Burmese Batwing Shan states, S.Burma
NT NC
Atrophaneura crassipes Oberthur, 1879
Black Windmill Manipur-Shan states
VR Protected by law in India
Atrophaneura alcinous pembertoni, M.
Pemberton’s Chinese Windmill
Sikkim-Bhutan VR Not known
Atrophaneura alcinous tytleri, Evans.
Tytler’s Chinese Windmill
Manipur-Chin hills
R Not known
Papilio bootes mixta Tytler, 1915 Tailed Redbreast Manipur, Nagas, N.Burma
R Not known
Papilio mahadeva Moore, 1878 Burmese Raven Shan-S. Burma NC Papilio castor polas, Jord. Common Raven Sikkim NR C/NT Papilio machaon sikkimensis, Moor, 1884
Common Yellow Swallowtail
Sikkim-Bhutan Not known

200
Pathysa macareus indicus, Rothschild
Lesser Zebra Sikkim NR C/NT
Pathysa xenocles phrontis, DeN. Great Zebra Sikkim NT
Bhutanitis lidderdalei Atkinson, 1873
Bhutan glory Bhutan, Naga & Chin hills
R Needs monitoring
Atrophaneura latreillei kabrua Tytler, 1915
Rose Windmill Assam-N.Burma
R Protected by law in India
Atrophaneura polla de Niceville, 1897
De Niceville’s Windmill
Assam-N.Burma
VR Protected by law in India
Atrophaneura nevilli Wood-Mason, 1896
Neville’s Windmill Assam-S.Shan VR NT/Protected by law in India
Atrophaneura philoxenus polyeuctus, Db.
Common Windmill Sikkim -Burma C NR
Chilasa agestor agestor Gray, 1832 Tawny Mime Sikkim-Dawnas
NR NT
Chilasa epicydes epicydes, Hewitson, 1862
Lesser Mime Sikkim-N.Burma
NT/ Protected by law in India
Chilasa slateri slateri, Hewitson, 1857
Blue-Striped Mime Sikkim-N.Burma
R R/ Protected by law in India
Chilasa paradoxa telearchus Hewitson, 1852
Great Blue Mime Assam-Burma R R/ Protected by law in India
Papilio memnon agenor, L. 1758 Great Mormon Sikkim-Burma C C/NT Papilio protenor euprotenor, Fruh. 1908
Spangle Sikkim-N.Burma
NR C/NT
Papilio polyctor ganesa, M. 1758 Common Peacock Sikkim-N.Burma
C C/NT
Papilio arcturus arcturus Westwood, 1842
Blue Peacock Nepal-Dawnas NR NT
Papilio krishna, M. 1857 Krishna Peacock Sikkim-Burma NR NC/NT Papilio castor castor Westwood, 1842
Common Raven Assam-N.Burma
NR C/NT
Papilio machaon verityi Fruhstorfer, 1907
Common Yellow Swallowtail
Assam, N.Burma
R NR/ Protected
Pathysa glycerion Gray, 1813 Spectacle Swordtail Sikkim-N.Burma
NR NC
Pathysa agetes agetes, Westwood, 1841
Four-Bar Swordtail Sikkim-N.Burma
NR C/NT
Pathysa nomius swinhoei Moore 1878
Spot Swordtail Assam- S.Burma
NR NT
Pathysa antipathies pompilius, F. 1787
Five-Bar Swordtail Sikkim-Burma C NT
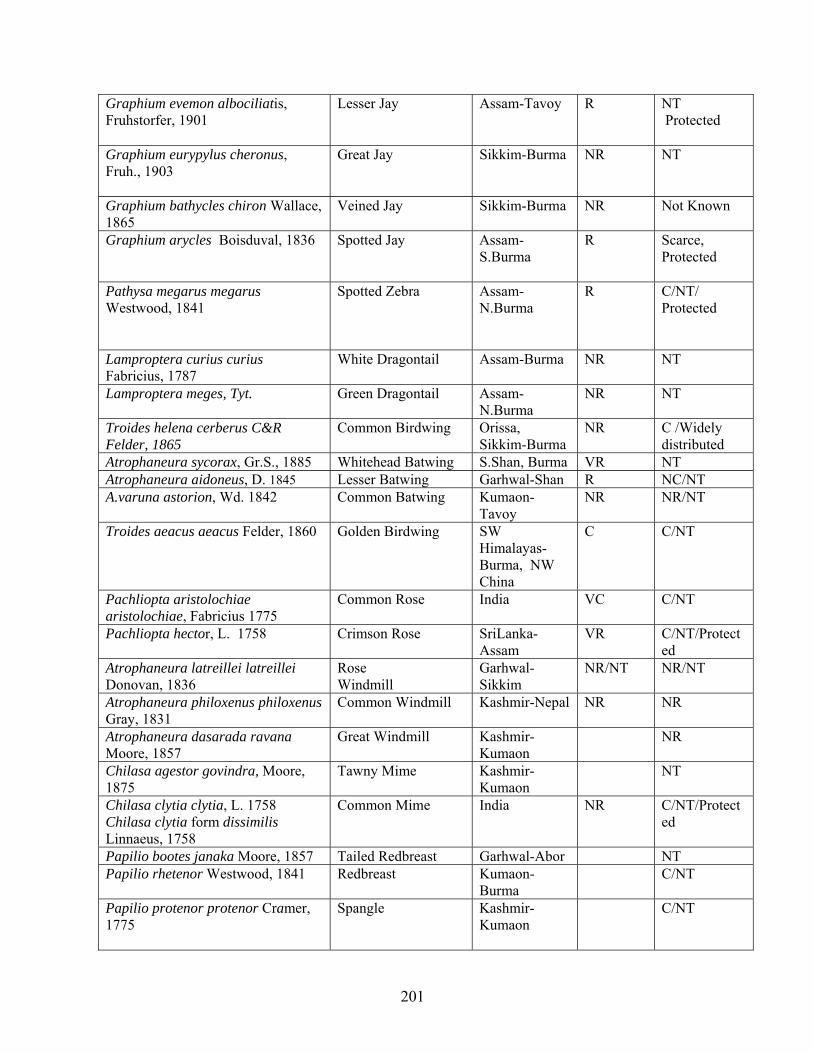
201
Graphium evemon albociliatis, Fruhstorfer, 1901
Lesser Jay Assam-Tavoy R NT Protected
Graphium eurypylus cheronus, Fruh., 1903
Great Jay Sikkim-Burma NR NT
Graphium bathycles chiron Wallace, 1865
Veined Jay Sikkim-Burma NR Not Known
Graphium arycles Boisduval, 1836 Spotted Jay Assam-S.Burma
R Scarce, Protected
Pathysa megarus megarus Westwood, 1841
Spotted Zebra Assam-N.Burma
R C/NT/ Protected
Lamproptera curius curius Fabricius, 1787
White Dragontail Assam-Burma NR NT
Lamproptera meges, Tyt. Green Dragontail Assam-N.Burma
NR NT
Troides helena cerberus C&R Felder, 1865
Common Birdwing Orissa, Sikkim-Burma
NR C /Widely distributed
Atrophaneura sycorax, Gr.S., 1885 Whitehead Batwing S.Shan, Burma VR NT Atrophaneura aidoneus, D. 1845 Lesser Batwing Garhwal-Shan R NC/NT A.varuna astorion, Wd. 1842 Common Batwing Kumaon-
Tavoy NR NR/NT
Troides aeacus aeacus Felder, 1860 Golden Birdwing SW Himalayas-Burma, NW China
C C/NT
Pachliopta aristolochiae aristolochiae, Fabricius 1775
Common Rose India VC C/NT
Pachliopta hector, L. 1758 Crimson Rose SriLanka- Assam
VR C/NT/Protected
Atrophaneura latreillei latreillei Donovan, 1836
Rose Windmill
Garhwal-Sikkim
NR/NT NR/NT
Atrophaneura philoxenus philoxenus Gray, 1831
Common Windmill Kashmir-Nepal NR NR
Atrophaneura dasarada ravana Moore, 1857
Great Windmill Kashmir-Kumaon
NR
Chilasa agestor govindra, Moore, 1875
Tawny Mime Kashmir-Kumaon
NT
Chilasa clytia clytia, L. 1758 Chilasa clytia form dissimilis Linnaeus, 1758
Common Mime India NR C/NT/Protected
Papilio bootes janaka Moore, 1857 Tailed Redbreast Garhwal-Abor NT Papilio rhetenor Westwood, 1841 Redbreast Kumaon-
Burma C/NT
Papilio protenor protenor Cramer, 1775
Spangle Kashmir-Kumaon
C/NT

202
Papilio polyctor polyctor Boisduval, 1836
Common Peacock Chitral-Kumaon
C/NT
Papilio paris paris, L. 1758 Paris Peacock Orissa, Kumaon-Burma
C C/NT
Papilio arcturus arius, Roth. Blue Peacock Kashmir-Kumaon
NT
Papilio crino Fabricius, 1792 Common Banded Peacock
SriLanka, S.India-Bengal
NT
Papilio helenus helenus, L.1758 Red Helen Mussourie-Burma
C/NT
Papili nephelus chaon, Westwood, 1844
Yellow Helen Orissa, Nepal-N.Burma
C C/NT
Papilio polytes romulus Cr. 1775 Papilio polytes stichius
Common Mormon India, Burma, Srilanka
VC C/NT
Papilio demoleus demoleus, L 1758 Lime butterfly India, N.Burma, Srilanka
VC VC
Papilio machon asiaticus, Ménétriés Common Yellow Swallowtail
Chitral-Nepal C/NT
Pathysa eurous cashmirensis, Roth. Six-Bar Swordtail Kashmir-Kumaon
C/NT
Pathysa nomius nomius Esper, 1798 Spot Swordtail S.India-Sikkim, Srilanka
C/NT
Graphium cloanthus Westwood, 1841
Glassy bluebottle Kashmir-Burma
NR C/NT
Graphium sarpedon sarpedon, Fd. 1758
Common Bluebottle Kashmir-Burma
C VC/NT
Graphium doson eleius, Fr. 1902 Common Jay South India, Bengal
C C
Graphium doson axion, Fd. 1864 Common Jay Kumaon-Burma
C C
Graphium agammemnon agammemnon, L. 1758
Tailed Jay Kumaon-Burma
C C/NT
Iphiclides podalirius Linnaeus 1758 Scarce Swallowtail Himalayas More monitoring needed
Troides helena minos Cramer, 1779 Southern Birdwing South India C/NT Pachliopta jophon pandiyana Moore, 1881
Malabar Rose South India NC/NT
Papilio polymnestor polymnestor Cramer, 1775
Blue Mormon South India C/NT
Papilio paris tamilana Moore, 1881 Tamil Peacock South India C C/NT
Papilio buddha Westwood, 1872 Malabar Banded Peacock
South India NR/NT Protected

203
Papilio dravidarum Wood-Mason, 1880
Malabar Raven South India UC/NT
Papilio helenus daksha, Moore Red Helen South India NR Papilio demoleus liomedon Moore, 1874
Malabar Banded Swallowtail
South India VC VC
Pathysa antipathes naira, Moore, 1881
Five bar Swordtail South India NT
Graphium sarpedon teredon C & R Felder, 1864
Common Bluebottle South India, Srilanka
VC
Graphium agammemnon menides Fruhstorfer, 1904
Tailed Jay South India, Srilanka
C C/NT
NOTE:
• Papilio sakontala Hewitson, 1864 described from Northern India eastwards to Assam and Naga hills by D’Abrera, 1982 is thought by some authors (Evans, 1932; Antram, 1924) to be a form of Papilio polytes rather than a good species (Collins & Morris, 1985).
• In the Indian Himalayan region, the sub-family Parnassiinae (Apollos) are represented by 14 species, which have not been included in the Papilionidae checklist.
• The nominate sub-species are protected by law in India under the ‘The Wildlife (Protection) Act, 1972 .
• Species described from the Andamans and Nicobar Islands have not been included.

204
Appendix 5 (Continued):
5.12 : Total number of swallowtail butterflies sampled as individuals in the study sites S1, S2,
S3, S4 and S5 in Rani-Garbhanga Reserve Forest.
Season Year
Total number of individuals
Dry season 1 2921 Wet season 1 6469 Dry season 2 3025 Wet season 2 6004 • Year 1 = 2003
• Year 2 = 2004
2921
6469
3025
6004
0
1000
2000
3000
4000
5000
6000
7000
tota
l abu
ndan
ce
Dry Year 1 Wet Year 1 Dry Year 2 Wet Year 2
Season and year
5.13 : Total number of swallowtail butterflies sampled as individuals during the dry and wet
seasons of the 2-year study period from the 20 fixed transects of study sites S1, S2, S3, S4 and
S5 of Rani-Garbhanga Reserve Forest, Assam, India.

205
Appendix 5 (Continued) : 5.14 : Categorization of the larval feeding guild of the Papilionidae recorded in Rani-
Garbhanga Reserve Forest, Assam. The diet breath classification follows Endo & Nihira (1990)
and Kitahara & Fuji (1994).
Larval Feeding Guild Range of host-plant use
Monophagous Specialist Single species from one genus and family Monophagous Generalist Two or more species from one genus and
family Oligophagous Generalist Several species from different genera,
single family Polyphagous Generalist Several species from different genera and
different families

206
Appendix 5 (Continued): 5.15 Total number of swallowtail butterfly individuals (Genus/Group-wise) recorded during
Line transect sampling in the open/scattered and closed forest habitats of Garbhanga range
during the dry and wet seasons of year 1 (2003).
YEAR 1 (2003) D-SC-T1 D-SC-T2 D-CL-T3 D-CL-T4 W-SC-T1 W-SC-T2 W-CL-T3 W-CL-T4 Windmills(Atrophaneura sp.) 13 2 16 26 45 51 72 216Batwings (Atrophaneura sp.) 0 1 4 2 3 3 17 21Birdwings (Troides sp.) 10 13 12 29 22 37 69 82Roses (Pachliopta sp.) 21 11 9 3 43 34 8 6Dragontail (Lamproptera sp.) 2 3 2 2 4 5 3 0Swordtails (Pathysa sp.) 42 26 2 0 67 59 11 0Zebras (Pathysa sp.) 43 67 4 0 57 81 12 0Jays (Graphium sp.) 112 369 20 13 530 897 32 34Bluebottles (G. sarpedon) 349 256 13 7 951 310 18 16Peacocks (Papilio sp.) 32 19 28 40 37 35 49 52Mormons (Papilio sp.) 41 65 30 11 116 102 37 22Helens (Papilio sp.) 37 21 30 26 45 52 69 35Limes (Papilio demoleus) 119 131 18 0 149 129 27 5C. Raven (Papilio castor) 47 20 41 27 51 31 99 36Common Mime (Chilasa clytia) 16 9 12 4 23 27 20 5
5.16: Total number of swallowtail butterfly individuals (Genus/Group-wise) recorded during
Line transect sampling in the open/scattered and closed forest habitats of Garbhanga range
during the dry and wet seasons of year 2 (2004).
YEAR 2 (2004)
D-SC-T1 D-SC-T2 D-CL-T3 D-CL-T4 W-SC-T1 W-SC-T2 W-CL-T3 W-CL-T4 Windmills(Atrophaneura sp.) 5 4 22 32 37 63 90 344Batwings(Atrophaneura sp.) 1 0 3 3 16 2 8 23Birdwings (Troides sp.) 12 9 14 36 15 18 101 90Roses (Pachliopta sp.) 11 9 5 5 45 12 3 5Dragontail (Lamproptera sp.) 5 1 1 0 2 0 1 3Swordtails (Pathysa sp.) 29 31 1 0 54 50 7 0Zebras (Pathysa sp.) 31 41 3 0 65 61 10 0Jays (Graphium sp.) 177 342 15 9 237 949 30 22Bluebottles (G. sarpedon) 582 432 10 12 791 598 11 10Peacocks (Papilio sp.) 29 20 21 30 22 41 27 48Mormons (Papilio sp.) 52 59 22 15 87 74 46 24Helens (Papilio sp.) 29 16 19 22 42 36 31 37Lime (Papilio demoleus) 100 116 14 3 118 197 41 2C. Raven (Papilio castor) 26 29 33 16 32 40 83 11Common Mime (Chilasa clytia) 17 5 7 2 42 35 14 9

207
5.17: Total number of swallowtail butterfly individuals (species assemblages) recorded during Line
transect sampling in the open/scattered and closed forest habitats of Garbhanga range during the dry
and wet seasons of year 1 (2003).
Dry and Wet seasons of Year 1 (2003) D-SC-T1 D-SC-T2 D-CL-T3 D-CL-T4 W-SC-T1 W-SC-T2 W-CL-T3 W-CL-T4Common Windmill 4 0 7 12 13 23 39 119Great Windmill 9 2 9 14 32 28 33 97White Headed Batwing 0 0 0 1 0 0 4 3Lesser Batwing 1 1 3 1 2 1 6 11Common Batwing 0 0 1 0 1 2 7 7Golden Birdwing 4 5 4 8 10 21 28 59Common Birdwing 6 8 8 21 12 16 41 23Common Rose 20 9 7 3 41 32 6 5Crimson Rose 1 2 2 0 2 2 2 4Green Dragontail 2 1 2 1 2 3 1 0White Dragontail 0 2 0 1 2 2 2 0Chain Swordtail 19 14 0 0 43 27 7 0Five-Bar Swordtail 23 12 2 0 24 32 4 0Great Zebra 31 43 3 0 37 56 8 0Lesser Zebra 12 24 1 0 20 25 4 0Common Mime 16 9 12 4 23 27 20 5Common Jay 72 197 13 8 389 594 26 19Tailed Jay 40 172 7 5 241 303 6 15Common Peacock 11 9 14 17 15 13 20 21Paris Peacock 3 2 1 6 4 8 8 2Krishna Peacock 18 8 13 27 18 14 21 30 Common Mormon 30 47 19 7 83 64 22 13Great Mormon 11 18 11 4 33 38 15 9Red Helen 12 4 18 11 29 28 42 17Yellow Helen 25 17 12 15 16 24 27 18Common Raven 47 20 41 27 51 31 99 36Common Bluebottle 349 256 13 7 951 310 18 16Lime Butterfly 119 131 18 0 149 129 27 5
D = Dry season W = Wet season SC = Scattered/Open forest CL = Closed forest T1 & T2 = Transacts in open forest T3 & T4 = Transacts in closed forest
• The names of the swallowtail butterflies are given by their common names.

208
5.18: Total number of swallowtail butterfly individuals (species assemblages) recorded during Line
transect sampling in the open/scattered and closed forest habitats of Garbhanga range during the dry
and wet seasons of year 2(2004).
Dry and Wet seasons of Year 2 (2004)
D-SC-T1 D-SC-T2 D-CL-T3 D-CL-T4 W-SC-T1 W-SC-T2 W-CL-T3 W-CL-T4Common Windmill 2 1 10 11 16 13 27 123Great Windmill 3 3 12 21 21 50 63 163White Headed Batwing 0 0 0 1 2 0 2 2Lesser Batwing 1 1 1 1 8 1 4 16Common Batwing 0 0 2 1 6 1 2 5Golden Birdwing 6 3 7 13 8 12 72 48Common Birdwing 6 6 7 23 7 6 29 42Common Rose 11 8 5 3 42 11 3 1Crimson Rose 0 1 0 2 3 1 0 2Green Dragontail 4 1 1 0 2 0 0 2White Dragontail 1 0 0 0 0 0 1 1Chain Swordtail 13 17 1 0 24 19 5 0Five-Bar Swordtail 16 14 0 0 30 31 2 0Great Zebra 17 29 3 0 40 43 6 0Lesser Zebra 14 12 0 0 25 18 4 0Common Mime 17 5 7 2 42 35 14 9Common Jay 84 207 9 4 177 682 18 13Tailed Jay 93 135 6 5 60 267 12 9Common Peacock 15 8 10 12 18 18 9 14Paris Peacock 0 2 1 0 1 5 1 10Krishna Peacock 15 10 11 12 3 18 17 24Common Mormon 39 32 14 8 59 46 18 10Great Mormon 13 27 8 7 28 28 28 14Red Helen 18 7 12 10 31 21 18 21Yellow Helen 11 9 7 12 11 15 13 16Common Raven 26 29 33 16 32 40 83 11Common Bluebottle 582 432 10 12 791 598 11 10Lime Butterfly 100 116 14 3 118 197 41 2
D = Dry season W = Wet season SC = Scattered/Open forest CL = Closed forest T1 & T2 = Transacts in open forest T3 & T4 = Transacts in closed forest
• The names of the swallowtail butterflies are given by their common names.

209
5.19: Total number of swallowtail butterfly individuals (Genus/Group-wise) recorded during Line
transect sampling in the open/scattered and closed forest habitats of Rani range during the dry and
wet seasons of year 1 (2003).
YEAR 1 (2003) D-SC-T1 D-SC-T2 D-CL-T3 D-CL-T4 W-SC-T1 W-SC-T2 W-CL-T3 W-CL-T4Windmills (Atrophaneura sp.) 3 3 4 6 7 5 8 7Batwings (Atrophaneura sp.) 0 2 3 5 5 9 10 12Birdwings (Troides sp.) 7 5 8 12 14 15 13 21Roses (Pachliopta sp.) 9 4 3 5 36 40 11 8Dragontails (Lamproptera sp.) 0 4 5 8 0 10 11 6Swordtails (Pathysa sp.) 16 8 4 7 42 51 12 0Zebras (Pathysa sp.) 26 15 8 3 30 18 11 5Jays (Graphium sp.) 22 14 0 0 50 42 17 3Bluebottles (G. sarpedon) 21 16 0 0 72 46 12 0Mimes (Chilasa clytia) 5 3 6 4 2 5 10 14Peacocks (Papilio sp.) 0 4 2 2 10 8 9 3Mormons (Papilio sp.) 33 27 39 22 49 43 61 57Helens (Papilio sp.) 0 17 26 25 17 20 46 47Limes (Papilio demoleus) 15 28 0 0 29 52 19 0Ravens (Papilio castor) 0 18 21 30 23 32 41 40
5.20 : Total number of swallowtail butterfly individuals (Species assemblages) recorded during Line
transect sampling in the open/scattered and closed forest habitats of Rani range during the dry and
wet seasons of year 2 (2004).
YEAR 2 (2004) D-SC-T1 D-SC-T2 D-CL-T3 D-CL-T4 W-SC-T1 W-SC-T2 W-CL-T3 W-CL-T4Windmills (Atrophaneura sp.) 5 0 2 1 4 2 4 6Batwings (Atrophaneura sp.) 0 1 6 2 3 7 4 14Birdwings (Troides sp.) 4 6 10 9 20 12 17 14Roses (Pachliopta sp.) 3 5 1 0 29 33 9 7Dragontails (Lamproptera sp.) 0 3 7 2 4 7 5 2Swordtails (Pathysa sp.) 10 14 3 2 37 22 7 0Zebras (Pathysa sp.) 13 10 4 2 27 25 8 3Jays (Graphium sp.) 10 8 5 0 41 27 20 0Bluebottles (G.sarpedon) 14 11 0 0 51 30 8 0C. Mime (Chilasa clytia) 0 0 10 3 0 1 17 11Peacocks (Papilio sp.) 0 1 4 6 7 1 5 7Mormons (Papilio sp.) 25 15 40 14 50 21 47 40Helens (Papilio sp.) 0 11 14 20 22 41 32 30Limes (Papilio demoleus) 21 17 0 0 40 67 10 0Ravens (Papilio castor) 7 19 25 11 26 47 54 67

210
5.21: Total number of swallowtail butterfly individuals (species assemblages) recorded during
Line transect sampling in the open/scattered and closed forest habitats of Rani range during the
dry and wet seasons of year 1 (2003).
Dry and Wet seasons of Year 1 (2003)
D-SC-T1 D-SC-T2 D-CL-T3 D-CL-T4 W-SC-T1 W-SC-T2 W-CL-T3 W-CL-T4Common Windmill 2 3 1 4 3 4 5 3Great Windmill 1 0 3 2 4 1 3 4Lesser Batwing 0 0 1 3 2 3 2 5Common Batwing 0 1 2 2 3 6 8 7Golden Birdwing 2 3 4 5 8 6 4 11Common Birdwing 5 2 4 7 6 9 9 10Common Rose 9 3 3 4 36 39 9 8Crimson Rose 0 1 0 1 0 1 2 0Green Dragontail 0 2 3 6 0 3 8 4White Dragontail 0 2 2 2 0 7 3 2Chain Swordtail 11 3 3 4 19 32 7 0Five-Bar Swordtail 5 5 1 3 23 19 5 0Great Zebra 14 10 3 2 17 12 8 3Lesser Zebra 12 5 5 1 13 6 3 2Common Jay 16 8 0 0 38 27 11 3Tailed Jay 6 6 0 0 12 15 6 0Common Peacock 0 3 2 1 7 5 4 1Krishna Peacock 0 1 0 1 3 3 5 2Common Mormon 16 10 20 10 27 25 14 23Great Mormon 17 17 19 12 22 18 47 34Red Helen 0 8 9 12 6 10 19 18Yellow Helen 0 9 17 13 11 10 27 29Common Bluebottle 21 16 0 0 72 46 12 0Lime Butterfly 15 28 0 0 29 52 19 0Common Mime 5 3 6 4 2 5 10 14Common Raven 0 18 21 30 23 32 41 40
D = Dry season W = Wet season SC = Scattered/Open forest CL = Closed forest T1 & T2 = Transacts in open forest T3 & T4 = Transacts in closed forest
• The names of the swallowtail butterflies are given by their common names.

211
5.22: Total number of swallowtail butterfly individuals (species assemblages) recorded during
Line transects sampling in the open/scattered and closed forest habitats of Rani range during the
dry and wet seasons of year 2 (2004).
Dry and Wet seasons of Year 2 (2004)
D-SC-T1 D-SC-T2 D-CL-T3 D-CL-T4 W-SC-T1 W-SC-T2 W-CL-T3 W-CL-T4 Common Windmill 3 0 2 1 4 2 3 4Great Windmill 2 0 0 0 0 0 1 2Lesser Batwing 0 0 2 0 0 2 0 4Common Batwing 0 1 4 2 3 5 4 10Golden Birdwing 3 1 3 4 4 5 8 6Common Birdwing 1 5 7 5 16 7 9 8Common Rose 3 5 1 0 27 33 9 7Crimson Rose 0 0 0 0 2 0 0 0Green Dragontail 0 1 1 0 3 2 2 0White Dragontail 0 2 6 2 1 5 3 2Chain Swordtail 4 6 2 2 27 14 3 0Five-Bar Swordtail 6 8 1 0 10 8 4 0Great Zebra 7 4 3 2 18 10 3 1Lesser Zebra 6 6 1 0 9 15 5 2Common Jay 8 5 4 0 31 16 13 0Tailed Jay 2 3 1 0 10 11 7 0Common Peacock 0 1 3 4 4 1 2 4Krishna Peacock 0 0 1 2 3 0 3 3Common Mormon 11 8 13 6 35 8 14 11Great Mormon 14 7 27 8 15 13 33 29Red Helen 0 5 7 9 8 19 10 14Yellow Helen 0 6 7 11 14 22 22 16Common Bluebottle 14 11 0 0 51 30 8 0Lime Butterfly 21 17 0 0 40 67 10 0Common Mime 0 0 10 3 0 1 17 11Common Raven 7 19 25 11 26 47 54 67
D = Dry season W = Wet season SC = Scattered/Open forest CL = Closed forest T1 & T2 = Transacts in open forest T3 & T4 = Transacts in closed forest
• The names of the swallowtail butterflies are given by their common names.

212
Appendix 5 (Continued): Summary of multivariate analyses
5.23 : Garbhanga range: 5.23.1 : CCA (formula = km2 ~ lat. + long. + alt. + forest + season + year + class + rain + relative humidity + tempr. data = km2env)
Inertia Rank Total 0.7119 Constrained 0.6165 6 Unconstrained 0.0954 9
Note: Inertia is mean squared contingency coefficient Some constraints were aliased because they were collinear (redundant) 5.23.2 : Eigenvalues for constrained axes:
CCA1 CCA2 CCA3 CCA4 CCA5 CCA6 0.444800 0.085232 0.063837 0.014316 0.005352 0.002960
5.23.3 : Eigenvalues for unconstrained axes: CA1 CA2 CA3 CA4 CA5 CA6 CA7 CA8 0.0443515 0.0161758 0.0104091 0.0082800 0.0054979 0.0052432 0.0023398 0.0021577 CA 9 0.0009469 > Km2.pl2<-plot (km2.cca, scaling=TRUE) > Anova (km2.cca) 5.23.4 : Permutation test for cca under direct model: Model: cca (formula = km2 ~ lat + long + alt + forest + season + year + class + rain + relative humidity + tempr. data = km2env)
Df Chisq F N.Perm Pr(>F) Model 6 0.6165 9.6932 200 < 0.005 *** Residual 9 0.0954 Significance codes: 0 '***' 0.001 '**' 0.01 '*' 0.05 '.' 0.1' '' 1

213
5.24: Rani range:
5.24.1 : CCA (formula = km8 ~ lat + long + alt + forest. + season. + year + class + rain + relative humidity + tempr. data = km8env)
Inertia Rank Total 0.42122 Constrained 0.32978 6 Unconstrained 0.09144 9
Inertia is mean squared contingency coefficient Some constraints were aliased because they were collinear (redundant) 5.24.2 : Eigenvalues for constrained axes:
CCA1 CCA2 CCA3 CCA4 CCA5 CCA6 0.255326 0.036822 0.017222 0.008136 0.006708 0.005569
5.24.3 : Eigenvalues for unconstrained axes: CA1 CA2 CA3 CA4 CA5 CA6 CA7 CA8 0.019951 0.017955 0.012911 0.011875 0.010739 0.007223 0.004451 0.003432 CA9 0.002904 > Km8.pl2<-plot (km8.cca, scaling=TRUE) > Anova (km8.cca) 5.24.4 : Permutation test for cca under direct model Model: cca (formula = km8 ~ lat + long + alt + forest. + season. + year + class + rain + relative humidity + tempr. data = km8env)
Df Chisq F N.Perm Pr(>F) Model 6 0.3298 5.4097 200 < 0.005 *** Residual 9 0.0914 Significance codes: 0 '***' 0.001 '**' 0.01 '*' 0.05 '.' 0.1 ' ' 1

214
Appendix 5 (Continued):
5.25: Diversity parameters analysed for the swallowtail butterfly species assemblages from the
pooled abundance data of 12 transects of 3 study sites (S1, S2 & S3) at Garbhanga range during
dry and wet seasons of 2003 & 2004 using the program ‘R’.
Forest Season Year H' (Shannon) Simpson Inv.Simpson
R2
(Rarefaction)
Fisher’s Alpha (α) S
Pielou’s Evenness J
SC Dry 1 2.766497 0.91961 12.4393 1.92182 5.536415 24 0.870501SC Dry 1 2.1607 0.809174 5.240385 1.810469 4.950827 24 0.679882CL Dry 1 2.79747 0.918866 12.32532 1.923263 6.984631 24 0.880246CL Dry 1 2.731795 0.922763 12.94717 1.927569 5.996335 21 0.897282SC Wet 1 2.29681 0.824332 5.692563 1.825054 4.514152 25 0.713544SC Wet 1 2.112108 0.768853 4.326255 1.769397 4.523184 26 0.648264CL Wet 1 2.832178 0.918445 12.26164 1.920293 6.120917 27 0.85932CL Wet 1 2.488723 0.879519 8.300028 1.881236 4.406428 21 0.817443SC Dry 2 2.540552 0.883759 8.60283 1.885884 4.948487 22 0.821908SC Dry 2 2.126201 0.796058 4.903363 1.797465 5.080599 24 0.669026CL Dry 2 2.766722 0.918348 12.24711 1.923914 6.800231 22 0.895077CL Dry 2 2.637316 0.916886 12.03164 1.922311 5.481607 19 0.895694SC Wet 2 2.684602 0.897216 9.729183 1.898507 5.072187 25 0.834019SC Wet 2 1.898288 0.711689 3.46848 1.712205 4.126455 24 0.597312CL Wet 2 2.635105 0.900399 10.04003 1.9024 5.704034 25 0.818641CL Wet 2 2.337819 0.844023 6.411216 1.845544 4.839412 23 0.745598
KEY :
Sites 1-4 - Dry season of year 1 (2003)
Sites 5-8 Wet season of year 1
Sites 9-12 Dry season of year 2 (2004)
Sites13-16- Wet season of year 2
• All the sites (1-8 for year 1 and 9-16 for year 2) represent the 12 pooled transects and
each site or transect is sampled twice in a year – e.g. site 1 sampled during dry season of
year 1 is resampled as site 5 during wet season of year 1.
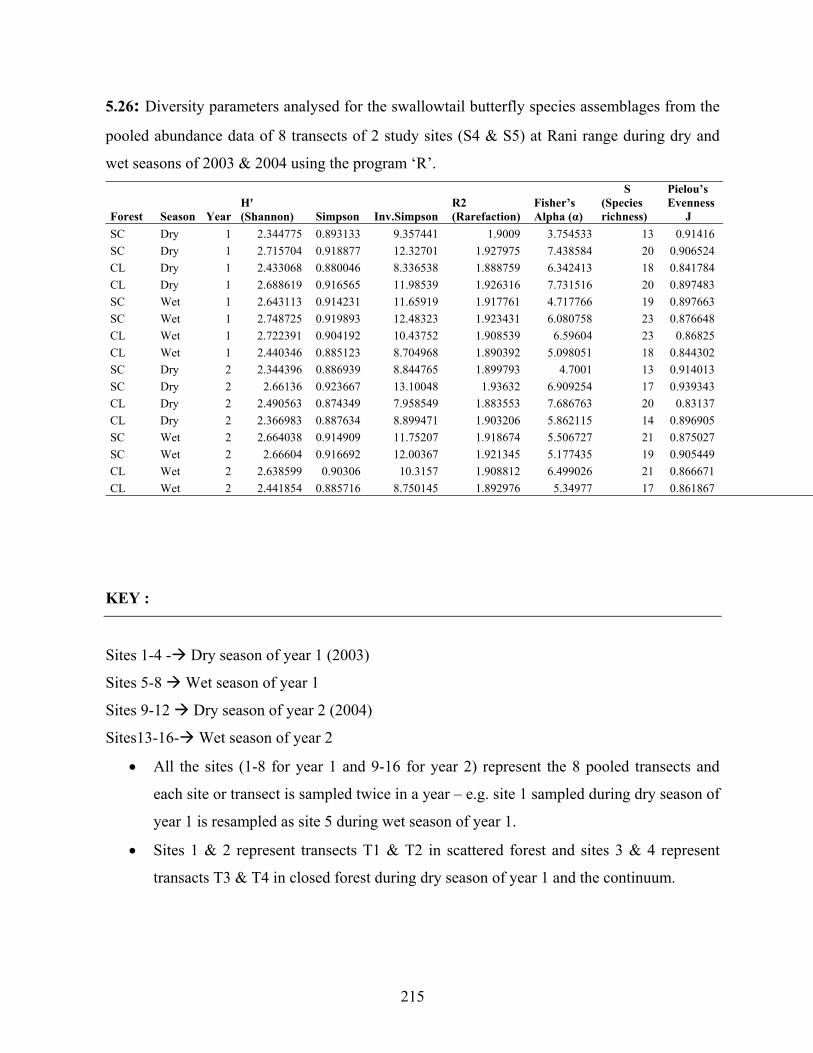
215
5.26: Diversity parameters analysed for the swallowtail butterfly species assemblages from the
pooled abundance data of 8 transects of 2 study sites (S4 & S5) at Rani range during dry and
wet seasons of 2003 & 2004 using the program ‘R’.
Forest Season Year H' (Shannon) Simpson Inv.Simpson
R2 (Rarefaction)
Fisher’s Alpha (α)
S (Species richness)
Pielou’s Evenness J
SC Dry 1 2.344775 0.893133 9.357441 1.9009 3.754533 13 0.91416 SC Dry 1 2.715704 0.918877 12.32701 1.927975 7.438584 20 0.906524 CL Dry 1 2.433068 0.880046 8.336538 1.888759 6.342413 18 0.841784 CL Dry 1 2.688619 0.916565 11.98539 1.926316 7.731516 20 0.897483 SC Wet 1 2.643113 0.914231 11.65919 1.917761 4.717766 19 0.897663 SC Wet 1 2.748725 0.919893 12.48323 1.923431 6.080758 23 0.876648 CL Wet 1 2.722391 0.904192 10.43752 1.908539 6.59604 23 0.86825 CL Wet 1 2.440346 0.885123 8.704968 1.890392 5.098051 18 0.844302 SC Dry 2 2.344396 0.886939 8.844765 1.899793 4.7001 13 0.914013 SC Dry 2 2.66136 0.923667 13.10048 1.93632 6.909254 17 0.939343 CL Dry 2 2.490563 0.874349 7.958549 1.883553 7.686763 20 0.83137 CL Dry 2 2.366983 0.887634 8.899471 1.903206 5.862115 14 0.896905 SC Wet 2 2.664038 0.914909 11.75207 1.918674 5.506727 21 0.875027 SC Wet 2 2.66604 0.916692 12.00367 1.921345 5.177435 19 0.905449 CL Wet 2 2.638599 0.90306 10.3157 1.908812 6.499026 21 0.866671 CL Wet 2 2.441854 0.885716 8.750145 1.892976 5.34977 17 0.861867
KEY :
Sites 1-4 - Dry season of year 1 (2003)
Sites 5-8 Wet season of year 1
Sites 9-12 Dry season of year 2 (2004)
Sites13-16- Wet season of year 2
• All the sites (1-8 for year 1 and 9-16 for year 2) represent the 8 pooled transects and
each site or transect is sampled twice in a year – e.g. site 1 sampled during dry season of
year 1 is resampled as site 5 during wet season of year 1.
• Sites 1 & 2 represent transects T1 & T2 in scattered forest and sites 3 & 4 represent
transacts T3 & T4 in closed forest during dry season of year 1 and the continuum.

PHOTO SECTION

216
PAPILIONIDAE PHOTO SECTION
1. Photos of identified species of Papilionidae upto nominate sub-species level in Rani-Garbhanga Reserve Forest, Assam, India during the period of field survey from 2000-2002.
1.1 The red-bodied group – Windmills and Batwings (Atrophaneura sp.), Roses (Pachliopta sp.) and Birdwings (Troides sp.)
GREAT WINDMILL (Atrophaneura dasarada dasarada) COMMON WINDMILL (Atrophaneura species) (MALE)
WHITE-HEAD BATWING (Atrophaneura sycorax) COMMON WINDMILL (Atrophaneura polyeuctes polyeuctes)

217
LESSER BATWING (Atrophaneura aidoneus) COMMON BATWING (Atrophaneura varuna astorion)
COMMON BIRDWING (Troides helena cerberus) MALE COMMON BIRDWING (Troides helena cerberus) FEMALE
GOLDEN BIRDWING (Troides aeacus aeacus) MALE GOLDEN BIRDWING (Troides aeacus aeacus) FEMALE

218
COMMON ROSE (Pachliopta aristolochiae aristolochiae) CRIMSON ROSE (Pachliopta hector)
1.2 Black-bodied group – Mormons, Helens, Peacocks, Limes (Papilio sp.) and Mimes (Chilasa sp.)
GREAT MORMON (Papilio memnon agenor) MALE GREAT MORMON (Papilio memnon agenor) Polymorphic females
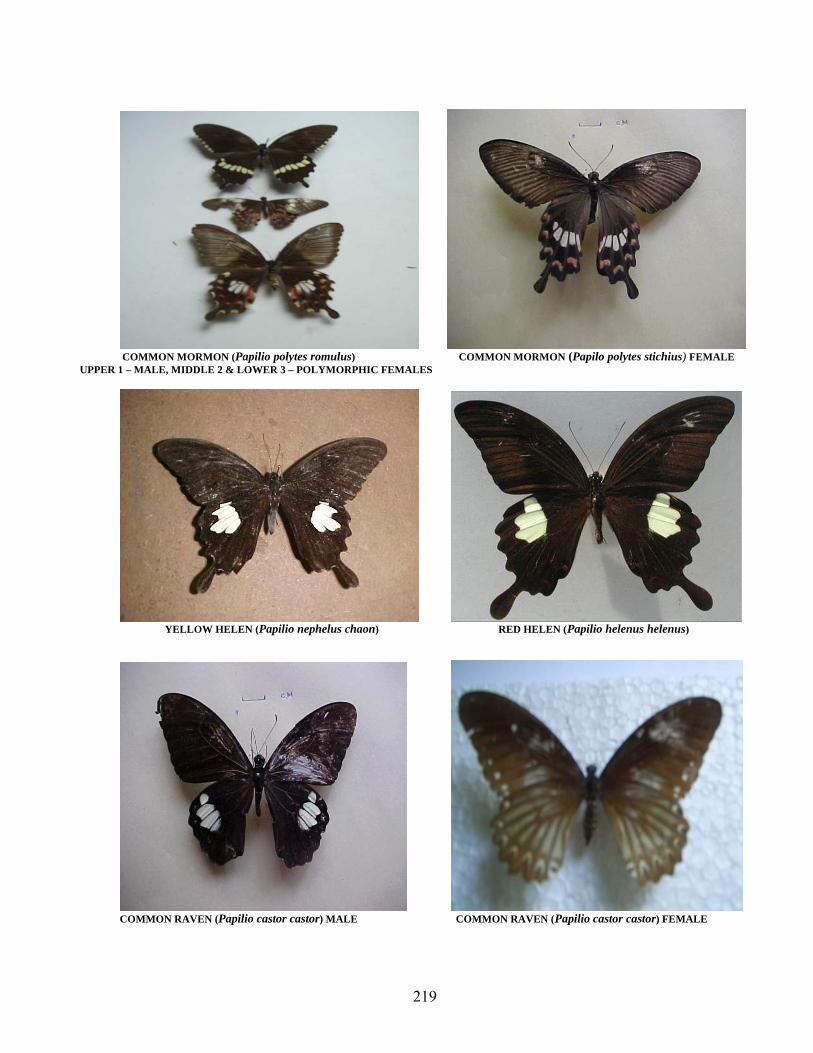
219
COMMON MORMON (Papilio polytes romulus) COMMON MORMON (Papilo polytes stichius) FEMALE UPPER 1 – MALE, MIDDLE 2 & LOWER 3 – POLYMORPHIC FEMALES
YELLOW HELEN (Papilio nephelus chaon) RED HELEN (Papilio helenus helenus)
COMMON RAVEN (Papilio castor castor) MALE COMMON RAVEN (Papilio castor castor) FEMALE

220
PARIS PEACOCK (Papilio paris paris) COMMON PEACOCK (Papilio polyctor ganesa)
KRISHNA PEACOCK (Papilio krishna krishna) LIME BUTTERFLY (Papilio demoleus )
COMMON MIME (Chilasa clytia clytia) COMMON MIME (Chilasa clytia dissimilis)

221
1.3 Swordtails and Zebras (Pathysa sp.)
FIVE-BAR SWORDTAIL (Pathysa antiphates pompilius) CHAIN SWORDTAIL (Pathysa aristeus anticrates)
GREAT ZEBRA (Pathysa xenocles xenocles) LESSER ZEBRA (Pathysa macareus lioneli)
1.4 Dragontails (Lamproptera sp.)
WHITE DRAGONTAIL (Lamproptera curius curius) GREEN DRAGONTAIL (Lamproptera meges)

222
1.5 Jays and Bluebottles (Graphium sp.)
COMMON JAY (Graphium doson axion) TAILED JAY (Graphium agammemnon agammemnon)
COMMON BLUEBOTTLE (Graphium sarpedon sarpedon)

223
2. Photos of Papilionidae larvae on their host-plants
4th instar larva of Common Rose (Pachliopta aristolochiae 4th instar larva of Golden Birdwing (Troides aeacus aeacus) feeding on aristolochiae) feeding on mature leaf of Aristolochiae tagala mature leaf of Indian Birthwort (Aristolochiae tagala
5th instar larva of Golden Birdwing (Troides aeacus aeacus) 2nd instar larva of Common Bluebottle (Graphium sarpedon sarpedon) forms chimaster and begins pupation on the host-plant Cinnamomum tamala
3rd instar larva of Tailed Jay (Graphium agammemnon 3rd and 4th instar larvae of Common Mime (Chilasa clytia) on the agammemnon) feeding on the host plant Polyalthia longifolia host plant Litsea sebifera

224
3. Swallowtail butterflies mud-puddling on wet soil and nectaring on flowers
COMMON JAY (Graphium doson axion) LIME BUTTERFLY (Papilio demoleus) and COMMON MIME (Chilasa clytia)
COMMON JAYS (Graphium doson axion) COMMON MORMON (Papilio polytes) nectaring on Ixora species
PARIS PEACOCK (Papilio paris paris) feeding on Lantana camara COMMON BIRDWING(Triodes helena cerberus )nectaring on Lantana camara

225
4. Egg and Chrysalis of swallowtail butterflies (Papilionidae)
The egg of Common Rose (Pachliopta aristolochiae) Chrysalis of Common Rose (Pachliopta aristolochiae) on the host-plant Aristolochia tagala
Pupa of Common Jay (Graphium doson axion) Pupa of Tailed Jay (Graphium agammemnon agammemnon)
Chrysalis of Golden Birdwing (Troides aeacus) Chrysalis of Common Mime (Chilasa clytia)

226
5. Adult nectar sources and larval food-plants of Papilionidae
Lantana camara – one of the preferred adult nectar sources Hibiscus rosa chinensis – adult nectar source
Ixora coccinea – adult nectar source Vitex negundo – adult nectar source
Indian Birthwort (Aristolochia tagala) – food-plant of Aristolochia tagala cultivated in gardens for it’s medicinal the red-bodied Papilionidae in the study area properties