diversity and abundance of t4-like bacteriophages in situ · 3 microfluidic based digital pcr, we...
TRANSCRIPT

1
Diversity and abundance of T4-like
bacteriophages in situ
A. D. Tadmor
Department of Biochemistry and Molecular Biophysics
California Institute of Technology, Pasadena, CA 91125
Abstract
With 5 to 25 phages per cell in a given environment, phages are the most abundant
biological entities on the planet, yet relatively little is known about their abundance
and diversity. Using degenerate primers targeting the gp23 capsid protein for T4-like
phages we demonstrate the presence of T4-like phages in marine samples (Stony
beach) and microbial mats found in a brackish river setting (Trunk River). Based on
dilution of these samples and estimated efficiency of the degenerate primers and the
DNA extraction we estimate that 1g of mat contains at least ~105-6
of these T4-like
phages. Based on PCR fragments size we suspect that these phages are cyanophages,
a conclusion that agrees with the known fact that these mats contain cyanobacteria.
Using the digital PCR technology we demonstrate that "all bacterial" primers/probe
can amplify single rDNA targets extracted from a marine environment. In addition we
demonstrate that T4-like degenerate primers can amplify single T4 amplicons on chip.

2
Introduction
Phages are the most abundant genetic entities in the biosphere being 5 to 25 times
more abundant than bacteria [1]. Figure 1 shows a 2mL sample of marine water
collected from Stony beach filtered through a 0.02um Anodic filter and stained with
SYBR gold. The faint spots are probably mostly phages while larger spots are
bacteria. Small free floating DNA may also potentially contribute, although it would
be much fainter and diffuse than phages. While bacteria and Eukaryotes can be
stained with FISH probes via the 16S rRNA, there is no equivalent probe for phages
so there is no direct why to explore phages abundance diversity and host specificity.
Figure 1. SYBR gold staining of a marine sample from Stony beach.
Here we wished to focus on a subfamily of phages. Metagemoic and TEM analysis
indicate that tailed phage dominate marine environments [2,3] and metagemoic
analysis suggest that out of these, myophage constitutes 11-23% of uncultured marine
(pacific) samples [2]. In a recent study, the diversity of T4-like phages of the
myophage subgroup has been assessed for a wide range of environments. Using
degenerate primers and probes based on this protein, coupled with the power of a
10 µm

3
microfluidic based digital PCR, we wish to explore T4-like phage diversity and
abundance in environmental samples at a single cell/phage resolution.
We demonstrate the ability to amplify single molecule 16S targets (from a marine
environment) and single T4 amplicon targets (a positive control). Using conventional
PCR with the degenerate primers we show that Trunk river mats are apparently
enriched with cyanophages. Amplification of the Trunk river mat DNA on chip was
not successful apparently because cyanophages have a codon missing in the probe
sequence. The Stony beach sample may have been amplified on chip however its
concentration was too low and so just one amplicon was detected. Unfortunately
experiments were cut short due to a malfunction in the dPCR in the final week of the
course so further experiments were not possible.
Digital PCR
Digital PCR, or dPCR, using the 12.975 Fluidigm chip, allows amplification of 9180
6nL wells in 12 panels of 975 reactions each (figure 2). The term "digital" comes
from the fact that when the sample is diluted so that there is one target per well, the
chip can be read as absence/presence of single molecule targets. Single molecule
amplification is possible on chip due to two main reasons: (1) The reaction volume
reduces possible contamination. (2) Since reaction volumes are decreased by
25uL/6nL= 4167, the fluorescence of the dPCR wells increase by this factor. Thus to
achieve the threshold of detection one needs log2(4167)=12 less cycles compared with
conventional QPCR. Single molecule detection in QPCR fails because by the time the
Ct cycle is reached the sample is usually overtaken by primer dimer products. In
dPCR this problem is eliminated by the need for considerably less cycles. In addition
the optical system on the dPCR is cooled to -20 degC eliminating thermal noise.

4
(a) (b)
(c)
Figure 2. (a) The Fluidigm 12.975 dPCR chip. (b) CCD image of ROX reference dye
loaded into the 9180 panels (used for normalization). (c) Fluidigm NanoFlex IFC
Controller used to prime the chip and load the sample on to the chip and the Biomark
which includes the cooled optical system, the light source, a flatbed thermal cycler
and a vacuum system to attach the chip to the flatbed thermal cycler.
NanoFlex
BioMark

5
Results and Discussion
Primer/probe design
The degenerate T4 primers/probe were designed to target the gp23 capsid protein of
T4-like phages. It has been demonstrated in the past that this protein is well conserved
among T4-like phages and that the phylogeny derived from this protein resembles the
phylogeny based on the entire genome sequence of these phages [3]. 13 genomes of
T4-like phages were downloaded and primers and a probe were designed based on
these genomes. Due to the divergence of the cyanophages (3/10 genomes), especially
in the probe region (Fig. 10), probe design excluded these genomes. Three primer sets
were designed to work with a single probe (Fig 3).
Figure 3. Relative location of primer/probe sets designed for the gp23 capsid protein.
Distance in amino acids is relative to the forward primer, which is offset by 110
amino acids relative to the start of the gene.
On chip efficiency of degenerate T4-like primer/probe
To measure the efficiency the T4-like degenerate primers/probe, primers were first
run on a conventional thermocycler using primer set #2 and T4 phages as targets. The
PCR product was purified and the concentration of DNA was measured using the
NanoDrop, yielding 14.5 ng/µL. Since the amplicon length is know to be 803bp for
the T4 genome, this amounts to 1.67·1010
targets/ µL. These amplicons were then
diluted 1:4·105, 1:4·10
6, 1:4·10
7, 1:4·10
8, 1:4·10
9. 8 µL PCR reaction mixes were
prepared (see material and methods) which included 2.1 µL of the diluted samples. In
addition a non template control was also loaded. The resulting chip hits can be
observed in Fig. 4.
#3

6
The Ct for the T4 amplicons can be seen to be around 29. This Ct is expected based
on the fact that QPCR standard curves in 25 µL volumes for these primers yield a Ct
of 41 for one amplicon (using the same master mix) Fig 5. Since the reaction chamber
volume is 25 µL/6 nL =4167, the Ct for the dPCR is expected to be lower by
log2(4167)=12, as observed (41-12=29). To see this, assume that the QPCR reached a
fluorescence threshold of f due to the synthesis of N molecules.
Thus ( )
0 02 tC QPCRN Nf f= = where f0 is the fluorescence of a single molecule. Since for
the dPCR f0→4167 f0 then at the same Ct we have ( )
0 2 4167tC QPCRN f= . To obtain the
same fluorescence threshold 2( ) log (4167)
0 2 tC QPCRN f
−
= . Thus Ct(dPCR) = Ct(QPCR)-
12. The fact that this prediction is observed in Fig 4. suggests that the reaction is
scaled linearly as we decrease the volume by a factor of 4167.
Figure 4. Screen shot of BioMark data analysis software. The left six panels were
covered since they were not relevant to this experiment.
NTC
7
100
102
104
106
108
15
20
25
30
35
40
45
Initial number of copies (based on titer)
Ct
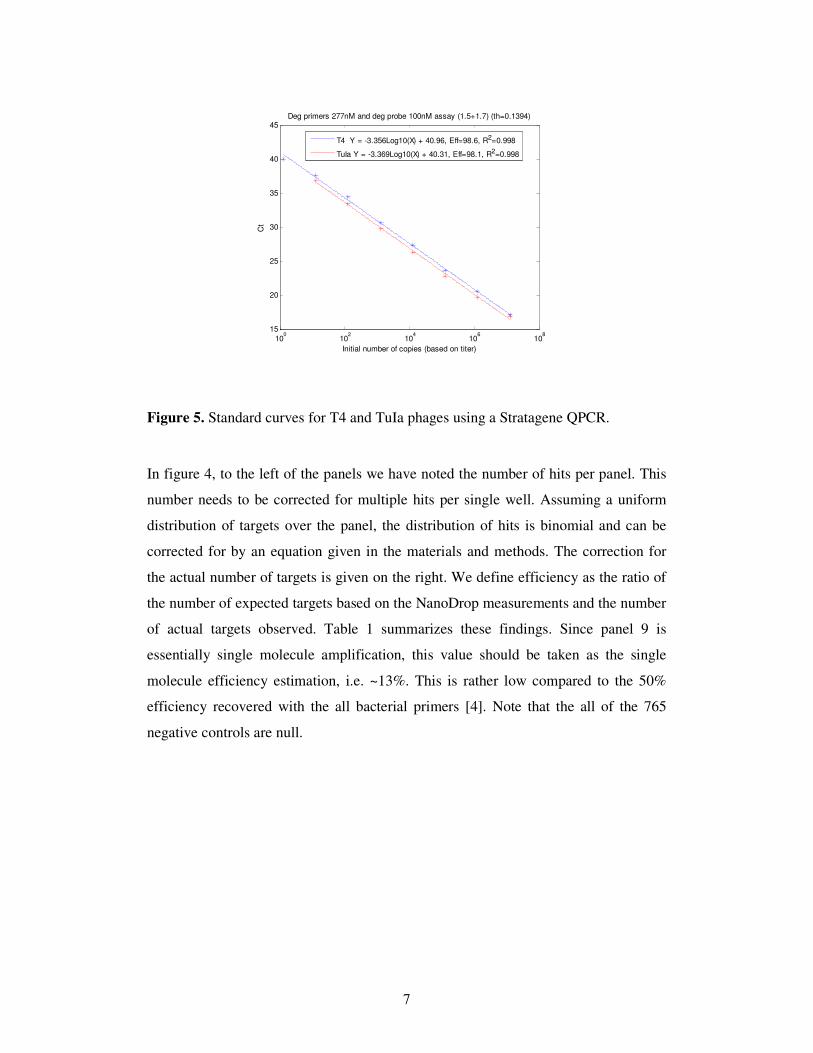
Deg primers 277nM and deg probe 100nM assay (1.5+1.7) (th=0.1394)
T4 Y = -3.356Log10(X) + 40.96, Eff=98.6, R2=0.998
TuIa Y = -3.369Log10(X) + 40.31, Eff=98.1, R2=0.998
Figure 5. Standard curves for T4 and TuIa phages using a Stratagene QPCR.
In figure 4, to the left of the panels we have noted the number of hits per panel. This
number needs to be corrected for multiple hits per single well. Assuming a uniform
distribution of targets over the panel, the distribution of hits is binomial and can be
corrected for by an equation given in the materials and methods. The correction for
the actual number of targets is given on the right. We define efficiency as the ratio of
the number of expected targets based on the NanoDrop measurements and the number
of actual targets observed. Table 1 summarizes these findings. Since panel 9 is
essentially single molecule amplification, this value should be taken as the single
molecule efficiency estimation, i.e. ~13%. This is rather low compared to the 50%
efficiency recovered with the all bacterial primers [4]. Note that the all of the 765
negative controls are null.

8
Number of targets Number of expected
targets
Efficiency %
Panel 7 2358 50300 4.7
Panel 8 419 5030 8.3
Panel 9 65 503 12.9
Panel 10 7 50 14
Panel 11 1 5 30
Table 1. Number of observed targets vs. number of expected tagets, and the
corresponding efficiencies.
Environmental samples
Trunk river sample
The Trunk river sample was the top layer of a microbial mat - see figure 6. DNA was
extracted from 0.5g of the top layer of this mat. The concentration of DNA extracted
was 23 and 19 ng/µL with 260nm/280nm=1.98 and 2.15 and 260nm/230nm=0.95 and
1.13 (batch #1 - 23 ng/µL - was used for subsequent analysis).
Stony beach sample
Approximately 265mL of sea water from Stony beach was collected and subsequently
filtered through a 0.02µm Anodisc filter. Since T4 is roughly this size it was hoped
that this will trap free phages. In a previous experiment where only 50mL of marine
water was filtered, if cells were removed first by using a 0.22 µm or 0.45 µm filter no
phage DNA signal was detected. This may be due to the low amount of initial DNA
or it may suggest that most of the T4 phages that were collected were associated with
cells in the environment.

9
(a) (b)
Figure 6. Sampling sites. (a) Trunk river. (b) Microbial mat collected from Trunk
river.
A conventional thermocycler PCR using primer sets 1,2 and 3 was carried out on the
Trunk river DNA. The gel can be observed in figure 7.
Figure 7. Gel electrophoresis for Trunk river and Stony beach samples (1% agarose,
60V for ~ 2h). Lanes: (1) 100bp ladder; T4 phage + control using primers set (2) #1,
(3) #2, (4) #3; Trunk river DNA sample using primer sets (5) #1, (6) #2, (7) #3; Stony
beach DNA sample using primer sets (8) # (9) #2, (10) #3.

10
Observed target sizes Trunk river and Stony beach are summarized in table 2 and
compared with the expected target sizes for T4 (also observed in lanes 1, 2 and 3) and
expected target sizes for cynophages.
T4 (bp) Cynophage
(bp)
Observed Trunk
river (bp)
Observed
Stony B. (bp)
Primer set 1 540-552 507-516 ~550 ~620?
Primer set 2 754-780 594-626 ~600 ~600
Primer set 3 797-830 636-671 ~700 ~650
Table 2. Observed and expected target sizes for T4-like phages.
From table 2 we conclude that these fragments most resemble cynophages and not
T4-like phages. This is consistent with the fact the microbial mats are known to be
abundant with cyanobacteria, especially near the top of the mat where the mat is still
aerobic.
Clone libraries on the PCR product using the TOPO 2.1 kit to verify this conclusion
were not successful since the only sequences to show up w were ~75bp segments
consisting of the forward and reverse primers, despite the fact that 2/3 of the samples
were PCR purified. According to the kit, purification should take out <100bp primer
dimers. This raises the possibility that either the plasmid is toxic to the cell or that it is
removed by the cell, although this is not conclusive.
Estimation of phage concentration in Trunk river sample.
To estimate the concentration of phages in the trunk river sample, the sample was
diluted 1:10,1:50,1:100,1:250,1:1000 and the dilutions were PCR amplified. Results
can be seen in figure 8.

11
Figure 8. Gel for T4 dilution series. Lane (1): 100bp ladder. (2) NTC. (3) T4 phage
positive control. (4) 1:10 dilution (5) 1:50 (6) 1:100 (7) 1:250 (8) 1:1000.
From figure 8 we conclude that the concentration of phages is >100 targets/2 µL since
2 µL were loaded onto the conventional PCR. Since the dPCR loads 2.1 µL of sample
into the chip, and about 1/2 of this is actually loaded into PCR wells, the number of
targets loaded onto the panel are 50/µL*2.1/2 ~ 50 targets. Since dPCR efficiency is
~10% we expect 5 targets or more.
Note that we can also estimate the number of phages in 0.5g of soil. If there are 50
phages per µL, using Mobio we extracted 100 µL, thus there are 50*100=5000 targets
extracted from 0.5g. If we assume that PCR efficiency can be translated to regular
PCR (since we saw Ct are linearly transformed from QPCR to dPCR), then there is an
efficiency factor of 0.1. We will show below that the Mobio DNA extraction
efficiency seems to be also about 0.1. Thus there are about 500,000 cyanophages(?)
per 0.5g, or 1e6 cynophages per g.
On chip detection of T4-like environmental phage DNA
To check if environmental samples contained T4-like phages we loaded samples from
Trunk river and Stony Beach (figure 9). Even though the positive and poison control
were good, only the Stony beach sample exhibited a hit. The Trunk river targets
12
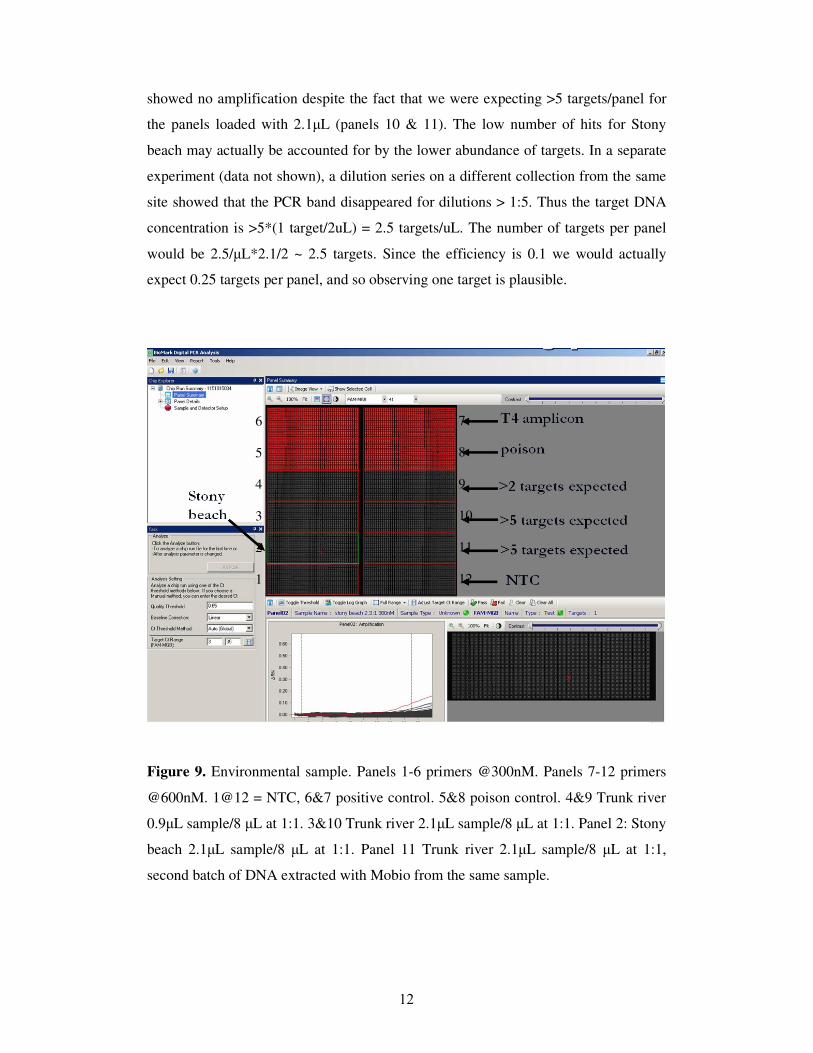
showed no amplification despite the fact that we were expecting >5 targets/panel for
the panels loaded with 2.1µL (panels 10 & 11). The low number of hits for Stony
beach may actually be accounted for by the lower abundance of targets. In a separate
experiment (data not shown), a dilution series on a different collection from the same
site showed that the PCR band disappeared for dilutions > 1:5. Thus the target DNA
concentration is >5*(1 target/2uL) = 2.5 targets/uL. The number of targets per panel
would be 2.5/µL*2.1/2 ~ 2.5 targets. Since the efficiency is 0.1 we would actually
expect 0.25 targets per panel, and so observing one target is plausible.
Figure 9. Environmental sample. Panels 1-6 primers @300nM. Panels 7-12 primers
@600nM. 1@12 = NTC, 6&7 positive control. 5&8 poison control. 4&9 Trunk river
0.9µL sample/8 µL at 1:1. 3&10 Trunk river 2.1µL sample/8 µL at 1:1. Panel 2: Stony
beach 2.1µL sample/8 µL at 1:1. Panel 11 Trunk river 2.1µL sample/8 µL at 1:1,
second batch of DNA extracted with Mobio from the same sample.
6
5
4
3
2
1
7
8
9
10
11
12

13
The failure to amplify Trunk river samples can be explained if we conclude that the
targets are cyanophages. The reason is that cyanophages have a codon missing right in
the probe sequence (figure 10).
Figure 10. Probe sequence of 13 aligned gp23 amino acids and nucleotide sequences.
The last three genomes are for cyanophages and a codon is missing in them.
Sequences were aligned with clustalW and displayed with CINEMA.
On chip detection of environmental 16S DNA
In the next experiment we attempted to amplify 16S all bacterial primers from
environmental DNA isolated from Stony beach (figure 11). In panel 3 we demonstrate
single molecule amplification. Assuming 50% efficiency for these primers and probe
[4], after correcting for the Binomial multiple target factor, the average number of
targets per uL of DNA is =(83 targets)*(dilution=104)*8uL/0.9uL/(765 wells * 6*10
-
3uL/well)/(eff =0.5) = 3.2·10
6 targets/uL. This agrees with an estimate based on the
NanoDrop: assuming (4.3ng/uL NanoDrop)*(1uL)/( 2·106 bp * 1.08·10
-21 g/bp) =
2·106 targets/uL. Where we have assumed that each genome is about 2Mbp and has a

14
copy number of 1. Based on the dPCR we can back calculate that there should be
6·105
“cells”/mL in this environment. However DAPI counts on samples from the
same environment yield 8.5·106
cells/mL. Although ~20% of these are Eukaryoric
based on comparison of CARD FISH to DAPI counts (we did during the first weeks),
this still yields 6.8·106
cells/mL. Thus apparently the DNA extraction yield of the
Mobio kit is apparently 10%. This also agrees with the above estimate based on the
NanoDrop concentration.
Figure 11. 16S amplification off DNA extracted from Stony beach. Panel 1=NTC.
Panel 5- 1:102 dilution of 1:1 0.9uL sample; Panel 6- 1:10 dilution of 1:1 0.9uL
sample; Panel 4- 1:103 dilution of 1:1 0.9uL sample; Panel 3- 1:10
4 dilution of 1:1
0.9uL sample; Panel 2- 1:105 dilution of 1:1 0.9uL sample. This chip was loaded
without Krytox and therefore some wells slightly dehydrated over time, possibly
explaining the change in the baseline observed in the ROX and VIC channels.
6
5
4
3
2
1

15
Conclusions
We have demonstrated single molecule amplification of rRNA and apparently the
gp23 capsid protein in cyanophages. All of the reactions tested were simplex
reactions. The trunk river sample appears to have on order of >105-6
cyanophage per
g. This estimate is based on the 1:100 dilution, above which there is no more PCR
product. Thus 100 targets/2uL of PCR yields 50 targets/uL. Since the Mobio kit
yielded about 100uL of DNA, there are 5000 targets per 0.5g. Taking into account
primer/probe efficiency of 0.1 and Mobio PCR extraction efficiency of 0.1 (albeit it
may be different for soil and should actually be estimated for DNA extraction from
this environment) yields about (10000 targets/g)*10*(1-10 1/eff.)=105-6
cyanophage
per g. This number can be compared with the number of cells in that environment.
Unfortunately we do not have DAPI or FISH probes for this sample, however, based
on the NanoDrop concentration of the sample of about 20ng/uL and assuming 2Mbp
per cell and an rRNA copy number of 1 this yields 20ng/uL * 1uL/(2e6bp*1.08e-21
g/bp)=1e7/uL. Since about 50uL of DNA were extracted, and assuming a Mobio
efficiency of 0.1, this comes out to 5e9 cells/0.5g, or 1e10 cells/g. It has been
estimated elsewhere that the top 10cm of prokaryotes in unconsolidated subsurface
sediments is 2.2e8 [5], thus there may potentially to be >1 cyanophage for every 102-
104 cells. It would be interesting to estimate directly the concentration of
cyanobacteria in this mat and ascertain the number of cyanobacteria to the number of
cyanophages in a given mass of mat.
Further conclusions are that concentration of the marine water by 5300 is not enough
to yield hits on the dPCR. At least 10 times this volume should be concentrated
perhaps in combination with more efficient DNA extraction methods. Another
possibility is to use more specific primers that would increase amplification
efficiency.
Finally it appears it would be worthwhile sample other sediment environments in
search for T4-like phages or alternatively one could design a probe specific for
cyanophages using the same primer set.

16
Material and Methods
Extraction of DNA
Stony beach sample:
Approximately 265mL of sea water were filtered through a Whatman Anodisc 47
0.02µm filter (cat #68095002). The filter was shattered into small pieces and loaded
to a 2mL bead solution provided in the Mobio ultraclean soil DNA isolation kit (cat
#12800-100). The tube was loaded onto to a bead beater for 30sec. The rest of the
protocol is provided in the kit. Sample was processed promptly after collecting it.
Trunk river sample:
0.5g of the top 1.5cm layer of a mat from Trunk river were loaded into 2mL bead
solution provided in the Mobio ultraclean soil DNA isolation kit. The tube was loaded
onto to a bead beater for 30sec. The rest of the protocol is provided in the kit. Sample
was stored on ice until it reached the lab and processed on the same day.
DNA concentration
DNA concentration was measured using the NanoDrop spectrophotometer.
Degenerate primers and probe for T4-like phages.
For T4-like phages degenerate primers and a probe were designed for the gp23 capsid
protein of T4-like phages. These sequences were designed to target 10/13 genome
sequences downloaded from NCBI. Three genome sequences were for cynophages
and excluded from the design due to their large sequence divergence.
Three sets of forward reverse primers were designed:
Primer set #1 for gp23:
Forward: 2.11.d2/8.F.1 5'-GAARTIATGCTGGAAATCAACCGIGA-3'
2.11.d2/8.F.2 5'-GAARTIATGGCTGAAATCAACCGIGA-3'
2.11.d2/8.F.3a 5-'GARATICTTCTGGAAATCAACCGIGA-3'
2.11.d2/8.F.4a 5-'GARATICTTGCTGAAATCAACCGIGA-3'

17
Reverse:
2.10.d4/8.R.1a 5'-CRTAICGAGTYTTGAAGCCIATIAC-3'
2.10.d4/8.R.2a 5'-GTAACGIGTCTTRAAGCCIATYTTIGG-3'
Primer set #2 for gp23:
Forward: 2.9.d4/6.F.1a 5'-TGYGGTGTTCAGCCIATGAIIRG-3'
2.9.d2/6.F.2a 5'-CTGGTGTTCAGCCIATGAIIRG-3'
Reverse: 2.6.d2/8.R.1 5'-GCIATTTCAACIGCTTCTTTGTCIATYTG-3'
2.6.d6/8.R.2 5'-GCIATTTCGTTHGCTTCTTTGTCIATYTG-3'
Primer set #3 for gp23:
Forward: 2.7.d2/4.F.1 5'-ATGGTICGYCGTGCIATICC-3'
2.7.d2/4.F.2 5'-GIATGGTIAGRCGTGCIATICC-3'
Reverse: same as #2.
Reverse probe for gp23:
2.5.d1/2.P.1 5'-/FAM/AGGATTCACCIGCCCAICGAGCACC/BH Quencher 1/-3'
2.5.d1/2.P.2 5'-/FAM/AGCTTTCACCIGCCCAICGAGCACC /BH Quencher 1/-3'
All bacterial rRNA primers and probe [4].
357 forward 5'-CTCCTACGGGAGGCAGCAG-3'
1492 reverse 5'-TACGGYTACCTTGTTACGACTT-3'
1389 reverse probe 5'-/ HEX/CTTGTACACACCGCCCGTC/BH Quencher 1/-3'
Amplicon length for T4 is 1175 bp.
All primers and probes were ordered from IDT.
Purification of PCR products
PCR product was purified using the Qiagen PCR purification kit using a centrifuge.
Instructions are given in the kit.
PCR
Conventional thermocycler:
12.5 µL of biorad IQ multiplex mastermix, 200nM of forward and reverse degenerate
T4 primers final concentration and sample to complete 25 µL. PCR program was

18
98°C 30s, 97°C 30s, 95°C 2min, [56°C 30s, 58°C 30s, 60°C 30s, 98°C 15s] x 40
cycles, 60°C for 10 min [4]. Usually 2 µL of sample were loaded.
On chip:
Simplex protocol was: 4 µL of biorad IQ multiplex mastermix, 300nM to 600nM of
forward and reverse degenerate primers final concentration, 200nM probe final,
50nM Stratagene ROX reference dye final concentration, 0.4 µL Fluidigm sample
loading reagent and sample to complete 8 µL. For T4 2.1 µL of sample were loaded.
For 16S 0.9 µL of sample were loaded. Usually 2-3 times this volume was prepared
as a master mix.
Preparing running and analyzing chips:
BioMark 12.765 Digital Array donated by Fluidigm were used. Chips were first
loaded with Krytox and primed with the Fluidigm NanoFlex IFC Controller. Then
each of the 12 panels was loaded with 9 µL of sample. Two control chanels were
loaded with 9 µL of NF water. Next, chip was loaded via the NanoFlex and then
inserted into the Fluidigm BioMark cycler. PCR program was 98°C 30s, 97°C 30s,
95°C 2min, [56°C 30s, 58°C 30s, 60°C 30s, 98°C 15s] x 40 cycles, 60°C for 10 min
[4]. Data analysis was preformed using the BioMark digital PCR analysis software.
Estimation of the number of targets per well
Given a sample with a target concentration of c, and assuming loading a volume of v
to 8 µL, the number of targets per well (x) is given by
x = c·v[µL]·765·6·10-3
/8. c·v[µL] is the number of targets per 8 µL mix, and out of
these 8 µL only 765·6·10-3/8 are loaded onto the 765 wells (since about half of the
volume is "dead" volume not in PCR wells).
Correction for binomial distribution offset
Given y hits per panel, the actual number of targets can be back-calculated using the
formula: x=log(1 - y/n)/log(1 - 1/n), where n is the number of wells per panel (765)
[6] (see supporting information). The relation between x and y cam be seen in figure
S1.

19
0 100 200 300 400 500 600 700 8000
1000
2000
3000
4000
5000
6000
y (number of hits)
x (
num
ber
of
targ
ets
)
Figure S1. Relation between number of hits per panel and the number of targets
loaded to that panel assuming an amplification efficiency of 100%.
References:
1. Fuhrman JA (1999) Marine viruses and their biogeochemical and ecological
effects. Nature 399: 541-548.
2. Breitbart M, Salamon P, Andresen B, Mahaffy JM, Segall AM, et al. (2002)
Genomic analysis of uncultured marine viral communities. Proceedings of the
National Academy of Sciences of the United States of America 99: 14250-
14255.
3. Filee J, Tetart F, Suttle CA, Krisch HM (2005) Marine T4-type bacteriophages, a
ubiquitous component of the dark matter of the biosphere. Proceedings of the
National Academy of Sciences of the United States of America 102: 12471-
12476.
4. Ottesen EA, Hong JW, Quake SR, Leadbetter JR (2006) Microfluidic digital PCR
enables multigene analysis of individual environmental bacteria. Science 314:
1464-1467.
5. Whitman WB, Coleman DC, Wiebe WJ (1998) Prokaryotes: The unseen majority.
Proceedings of the National Academy of Sciences of the United States of
America 95: 6578-6583.

20
6. Warren L, Bryder D, Weissman IL, Quake SR (2006) Transcription factor profiling
in individual hernatopoietic progenitors by digital RT-PCR. Proceedings of the
National Academy of Sciences of the United States of America 103: 17807-
17812.