diversification in indian agriculture towards high-value crops
TRANSCRIPT
IFPRI Discussion Paper 00727
November 2007
Diversification in Indian Agriculture towards High-Value Crops
The Role of Smallholders
P. S. Birthal, National Centre for Agricultural Economics and Policy Research P. K. Joshi, National Centre for Agricultural Economics and Policy Research
Devesh Roy, International Food Policy Research Institute and
Amit Thorat, Jawaharlal Nehru University
Markets, Trade and Institutions Division

INTERNATIONAL FOOD POLICY RESEARCH INSTITUTE.
The International Food Policy Research Institute (IFPRI) was established in 1975. IFPRI is one of 15 agricultural research centers that receive principal funding from governments, private foundations, and international and regional organizations, most of which are members of the Consultative Group on International Agricultural Research.
FINANCIAL CONTRIBUTORS AND PARTNERS
IFPRI’s research, capacity strengthening, and communications work is made possible by its financial contributors and partners. IFPRI gratefully acknowledges generous unrestricted funding from Australia, Canada, China, Denmark, Finland, France, Germany, India, Ireland, Italy, Japan, the Netherlands, Norway, the Philippines, Sweden, Switzerland, the United Kingdom, the United States, and the World Bank.

IFPRI Discussion Paper 00727
November 2007
Diversification in Indian Agriculture towards High-Value Crops
The Role of Smallholders
P. S. Birthal, National Centre for Agricultural Economics and Policy Research P. K. Joshi, National Centre for Agricultural Economics and Policy Research
Devesh Roy, International Food Policy Research Institute and
Amit Thorat, Jawaharlal Nehru University
Markets, Trade and Institutions Division

PUBLISHED BY
INTERNATIONAL FOOD POLICY RESEARCH INSTITUTE 2033 K Street, NW Washington, DC 20006-1002 USA Tel.: +1-202-862-5600 Fax: +1-202-467-4439 Email: [email protected]
www.ifpri.org
Notices: 1 Effective January 2007, the Discussion Paper series within each division and the Director General’s Office of IFPRI were merged into one IFPRI-wide Discussion Paper series. The new series begins with number 00689, reflecting the prior publication of 688 discussion papers within the dispersed series. The earlier series are available on IFPRI’s website at www.ifpri.org/pubs/otherpubs.htm#dp. 2 IFPRI Discussion Papers contain preliminary material and research results. They have not been subject to formal external reviews managed by IFPRI’s Publications Review Committee, but have been reviewed by at least one internal and/or external researcher. They are circulated in order to stimulate discussion and critical comment
Copyright 2007 International Food Policy Research Institute. All rights reserved. Sections of this material may be reproduced for personal and not-for-profit use without the express written permission of but with acknowledgment to IFPRI. To reproduce the material contained herein for profit or commercial use requires express written permission. To obtain permission, contact the Communications Division at [email protected].

iii
Contents
Acknowledgments............................................................................................................................v
Abstract ...................................................................................................................................... vi
1. Introduction................................................................................................................................1
2. Data and Measurement of Variables..........................................................................................4
3. Diversification Towards Fruits and Vegetables at the Macro Level .........................................5
4. Household Participation in Cultivation of Fruits and Vegetables by Farm Size .....................13
5. Conclusions..............................................................................................................................26
Appendix ......................................................................................................................................27
References ......................................................................................................................................28
iv
List of Tables
1. Composition and growth of agricultural sector in India (in constant 1993-94 prices) .......... 6
2. Compound annual growth rate in agriculture and horticulture across major states............... 6
3. Share of landholders by size (1998)....................................................................................... 8
4. Determinants of growth in high-value food production: fixed effects regressions for fruits and vegetables ............................................................................................................ 12
5. Participation of categories of farm households in cultivation of fruits and vegetables ...... 15
6. Share of different farm categories in area under vegetables and fruits (%)......................... 16
7. Distribution of households growing either vegetables or fruits or both in India (%) ......... 16
8. Share of vegetables and fruits in total cropped area of the growing households (%)......... 17
9. Scale of production (area put under cultivation) of vegetables and production of the growing households (ha)...................................................................................................... 17
10. Characteristics of growers versus non-growers of fruits and vegetables............................. 19
11. Results of logit regression for participation in fruit and vegetable cultivation.................... 23
12. Tobit regression on share of land devoted to fruit and vegetable cultivation by households............................................................................................................................ 25
A.1. Panel unit root test ............................................................................................................... 27
List of Figures
1. Percentage of smallholders in total landholdings in various states over time (1981, 1991 and 2003) ........................................................................................................... 8
2. Share of land allocated to fruits and vegetables in the various states over time (1980, 1991, 2003)................................................................................................................. 9

v
ACKNOWLEDGMENTS
We would like to thank our colleagues at IFPRI for their valuable help. Comments received during our
workshop “From Plate to Plough: Agricultural Diversification in India and Implications for Smallholders”
held at Delhi in September 2006 were useful for improving the study. Any errors are solely attributable to
the authors.

vi
ABSTRACT
Agricultural diversification towards high-value crops can potentially increase farm incomes, especially in a country like India where demand for high-value food products has been increasing more quickly than that for staple crops. Indian agriculture is overwhelmingly dominated by smallholders, and researchers have long debated the ability of a smallholder-dominated subsistence farm economy to diversify into riskier high-value crops. Here, we present evidence that the gradual diversification of Indian agriculture towards high-value crops exhibits a pro-smallholder bias, with smallholders playing a proportionally larger role in the cultivation of vegetables versus fruits. The observed patterns are consistent with simple comparative advantage-based production choices. The comparatively high labor endowments of the small farmers, as reflected in their greater family sizes, induce them to diversify towards vegetables. Although fruit cultivation is also labor intensive (as compared to cultivation of staples), fruits are relatively capital intensive, making them a less advantageous choice for smallholders who tend to have low capital endowments. Furthermore, both the probability of participation in fruit and vegetable cultivation as well as land allocation to horticulture decreases with the size of landholdings in India. Small or medium holders do not appear to allocate a greater share of land to fruits or vegetables. However, the share allocated to vegetables is significantly higher if the family size is bigger, while the reverse is true in the case of fruits.
Keywords: Diversification, smallholders, high-value agriculture

1
1. INTRODUCTION
Although agriculture occupies a shrinking share of India’s national economy, achieving rapid growth in
agriculture remains a major policy concern nationwide. The contribution of agriculture to India’s gross
domestic product (GDP) fell from 40% in 1980/81 to 21% in 2004/05. However, 72% of India’s
population lives in rural areas, and three-fourths of the people making up these rural populations depend
on agriculture and allied activities for their livelihoods. Furthermore, the agricultural sector is the main
source of employment in India, comprising 57% of the country’s labor force in 1999/2000.
Between 1980/81 and 1995/96, the agricultural sector in India grew at a rate of 3.3% per year,
and this growth had a significant impact on poverty reduction. This is consistent with the findings of
Ravallion and Datt (1996) and Warr (2003), who showed that growth in the agricultural sector is more
poverty-reducing than growth in other economic sectors. However, despite the past growth in this sector,
agriculture in India is now beset with problems. Most importantly, agricultural growth decelerated to
2.1% between 1996/97 and 2002/03, largely due to a decline in the food grain segment that grew at
merely 0.6%. Given the high dependence of the poor on agriculture, the stagnation in this sector is
currently threatening to stall poverty reduction in India.
Under such a scenario, the fundamental question is: how can agricultural growth be accelerated?
The potential to increase growth through staples appears limited, mainly because the demand for staples
has stagnated. The consumption patterns have diversified towards high-value agricultural commodities
(HVA) such as fruits, vegetables, dairy, poultry, fish, and processed food (Ravi and Roy 2006). This
demand shift is underpinned by sustained income growth and urbanization; Ravi and Roy (2006) project
demand in India through 2020, and show that the diversification in consumption patterns towards high-
value agricultural products will become more pronounced with income growth and changes in other
determinants such as urbanization. Moreover, globalization has created new opportunities for the export
of high-value products. Diaz-Bonilla and Recca (2000) observed an accelerated flow of exports of high-
value food commodities from developing to developed countries.
From the perspective of poverty reduction, diversification is particularly appealing. Most high-
value food commodities are labor-intensive, have low gestation periods and generate quick returns.
Hence, they offer a perfect opportunity for smallholders to utilize surplus labor and augment their
incomes (Joshi et al. 2002; Barghouti et al. 2005; Weinberger and Lumpkin, 2005). Previous studies in
South and Southeast Asia have indicated that diversification towards high-value food commodities
supports the development of innovative supply chains and opens new vistas for augmenting income,
generating employment and promoting exports (Barghouti et al. 2004; Pingali 2004; Deshingkar et al.
2003; Pokharel 2003; Wickramasinghe et al. 2003; Goletti 1999). Moreover, food and income security

2
have been shown to increase in regions where agricultural diversification takes place, particularly
favoring horticulture, animal husbandry, and aquaculture (Barghouti et al. 2005; Dorjee et al. 2002).
However, the transition towards high-value agriculture is not without constraints, especially for
smallholders. If the high-value commodities are products that the farmers have not grown before, the
farmers may lack necessary information on production methods, marketing opportunities, and the
probable distribution of net returns. This problem is particularly acute when the target consumers have
very specific quality requirements and/or strict food safety requirements. Of course, the farmers can
attempt to gather information, but this often involves a fixed cost (one not related to the level of output),
thus giving an advantage to larger-scale farmers (Minot and Roy, 2006). Larger farmers are often better
able to bear the risks associated with producing and marketing high-value commodities.
Furthermore, a small farmer who allocates land to a commercial crop often has to depend on
market purchases to meet food requirements, resulting in an additional source of risk. Some high-value
agricultural commodities also require significant investments, including the use of specific inputs. For
example, fruit production typically means that the farmer must plant trees and wait 3-5 years for them to
begin producing. Finally, the production and marketing of highly perishable high-value commodities
benefit from the producing farm being located near markets and good marketing infrastructure (Torero
and Gulati, 2004).
Farmers in developing countries such as India, particularly poor farmers, often do not have the
savings or credit access needed to make these investments and purchase the necessary inputs. However,
high-value commodities like fruits and vegetables may become viable prospects when these constraints
are relieved through intervention. Furthermore, smallholders tend to have greater labor endowments (i.e.
larger families), meaning that they may be better suited in cultivating labor intensive high-value crops.
The competitiveness of small farmers relative to large farmers is not fixed and can change over
time, usually as a result of changes in physical, human, or social capital. Farmers may acquire new
equipment or build irrigation works (physical capital) that reduce the cost of production. Farmer skills
(human capital) can also change over time as a result of learning-by-doing and/or through outside
technical assistance (Minot and Roy, 2006).
There has been some debate as to whether a smallholder-dominated economy can actually
diversify, and whether smallholders participate significantly in production diversification towards high-
value products. Here, we use both aggregate and household-level data to address this question in the
context of crop diversification towards fruits and vegetables in India. The time period for the state-level
analysis spans more than two decades, from 1980/81 to 2002/03.
During this period, India became self-sufficient in grain production (during the 1990s), which
might have triggered diversification out of staples. Also, the food basket of consumers underwent a

3
significant change during the 1990s; the per capita consumption of cereals declined, while that of high-
value commodities increased considerably. Moreover, India initiated economic reforms in 1991. Since
then, a number of policy initiatives have been undertaken to liberalize markets and improve agriculture-
industry linkages. A priori, it is expected that these developments played a role in inducing
diversification.
Using state-level information on the percentage of landholdings belonging to smallholders, along
with various indicators of diversification in agriculture, we show that diversification away from cereals
into fruits and vegetables is significantly higher in states with a greater share of smallholders. Our fixed
effects specification suggests that these results are robust after controlling for observed and unobserved
state level factors.
Further, using household-level data for a single time period, we assess crop choices across the
various farm sizes and show that the probability of a given household diversifying into vegetable
cultivation is higher for smaller farmers, but that no such bias exists in the case of fruits. This can likely
be explained by the relatively lower labor requirements and greater capital intensity (in terms of both
start-up and working capital) required for cultivation of fruits, both of which work against small farmers.
Larger families show a higher tendency to diversify mainly into vegetables, whereas family size does not
significantly impact diversification into fruits. Finally, in both fruits and vegetables, the probability of
diversifying into the respective commodity (fruit or vegetable) declines with increasing land size.
The paper is organized as follows: section 2 briefly describes the data and measurement of
variables used herein, section 3 examines the contribution and growth of high-value food production at
the national and state levels, section 4 discusses smallholder participation in high-value food production,
based on secondary household level data, and conclusions are presented in section 5.

4
2. DATA AND MEASUREMENT OF VARIABLES
We herein use secondary data from several published sources. The values for various agricultural
commodities come from the National Accounts Statistics prepared by the Central Statistical Organization
(CSO), Ministry of Statistics and Program Implementation, Government of India. The data on crop areas
and production are from the publications of the Directorate of Economics and Statistics, Ministry of
Agriculture, Government of India. The data on infrastructure, technology, etc. are from statistical
yearbooks published by the various state governments.
In this paper, the smallholder is defined as a farmer with less than or equal to 2 hectares of land.
For analysis of smallholder participation in HVA, the household-level data come from the National
Sample Survey Organization (NSSO) [54th round in 1998, dealing with cultivation practices (GOI, 1999)].
The sample comprises approximately 50,000 households.
We employ three measures of diversification towards fruits and vegetables. The first measure is
the gross value of horticultural output at constant prices at the state level. The second measure is the share
of fruits and vegetables in the overall value of agricultural output at constant 1993-94 prices. The total
value of agricultural output contains other farm and non-farm high-value products, such as high-quality
rice and livestock products, and fish. The last measure is the share of agrarian land devoted to fruits and
vegetables in each state, and can be considered a true indicator of crop diversification.
5
3. DIVERSIFICATION TOWARDS FRUITS AND VEGETABLES AT THE MACRO LEVEL
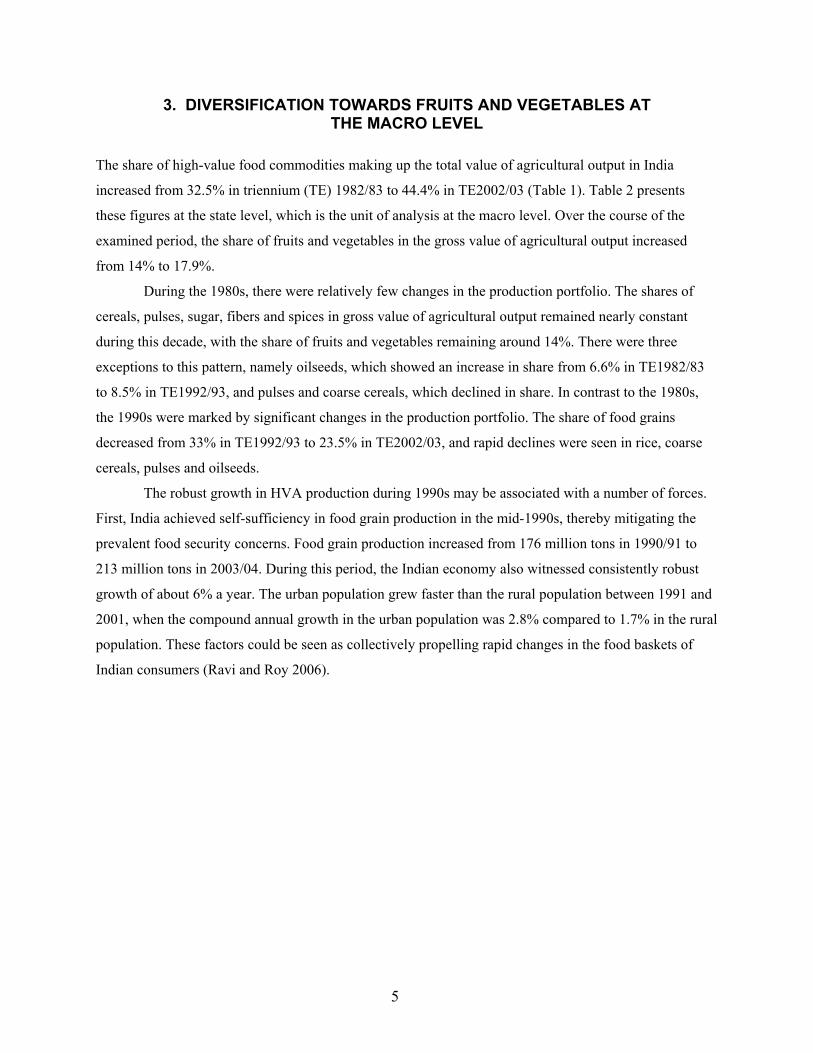
The share of high-value food commodities making up the total value of agricultural output in India
increased from 32.5% in triennium (TE) 1982/83 to 44.4% in TE2002/03 (Table 1). Table 2 presents
these figures at the state level, which is the unit of analysis at the macro level. Over the course of the
examined period, the share of fruits and vegetables in the gross value of agricultural output increased
from 14% to 17.9%.
During the 1980s, there were relatively few changes in the production portfolio. The shares of
cereals, pulses, sugar, fibers and spices in gross value of agricultural output remained nearly constant
during this decade, with the share of fruits and vegetables remaining around 14%. There were three
exceptions to this pattern, namely oilseeds, which showed an increase in share from 6.6% in TE1982/83
to 8.5% in TE1992/93, and pulses and coarse cereals, which declined in share. In contrast to the 1980s,
the 1990s were marked by significant changes in the production portfolio. The share of food grains
decreased from 33% in TE1992/93 to 23.5% in TE2002/03, and rapid declines were seen in rice, coarse
cereals, pulses and oilseeds.
The robust growth in HVA production during 1990s may be associated with a number of forces.
First, India achieved self-sufficiency in food grain production in the mid-1990s, thereby mitigating the
prevalent food security concerns. Food grain production increased from 176 million tons in 1990/91 to
213 million tons in 2003/04. During this period, the Indian economy also witnessed consistently robust
growth of about 6% a year. The urban population grew faster than the rural population between 1991 and
2001, when the compound annual growth in the urban population was 2.8% compared to 1.7% in the rural
population. These factors could be seen as collectively propelling rapid changes in the food baskets of
Indian consumers (Ravi and Roy 2006).

6
Table 1. Composition and growth of agricultural sector in India (in constant 1993-94 prices)
Commodity Share in gross value of agricultural output (%)
Compound annual growth (%)
TE1982/83 TE1992/93 TE2002/03 1980/81 to 1991/92
1992/93 to 2002/03
Crops 77.3 74.3 70.9 2.8 2.5 Rice 14.6 15.1 12.9 4.0 1.5 Wheat 7.9 8.2 7.7 3.2 2.6 Coarse cereals 4.9 3.9 2.8 0.4 -0.1 Pulses 5.6 4.6 3.3 1.2 -.0.1 Food grains 33.0 31.8 26.8 2.8 1.4 Oilseeds 6.6 8.5 6.7 6.0 0.3 Sugar 6.0 5.9 6.4 3.5 4.4 Fiber 3.4 3.3 2.5 2.9 -0.03 Drugs and narcotics 1.6 1.4 1.7 1.9 4.5 Spices 2.1 2.2 2.6 4.3 4.4 Fruits and vegetables 14.0 13.5 17.9 2.5 6.0 Total agriculture 100.0 100.0 100.0 3.2 2.9 High-value (including livestock)
32.5 35.9 44.4 4.1 5.0
Rest 67.5 64.1 55.6 2.7 1.5 Source: GOI (various years), National Accounts Statistics.
Table 2. Compound annual growth rate in agriculture and horticulture across major states
State Agriculture Horticulture 1980/81 to 1991/92 1992/93 to 2002/03 1980/81 to
1991/92 1992/93 to
2002/03 Haryana 3.1 3.0 0.3 15.8 Himachal Pradesh 3.2 3.1 4.9 6.3 Jammu & Kashmir 3.5 3.3 4.2 5.4 Punjab 3.8 2.0 7.5 4.1 Uttar Pradesh 2.8 2.6 1.5 9.9 Bihar 3.5 3.9 0.5 10.8 Orissa 2.6 0.8 2.6 5.5 West Bengal 5.8 3.6 4.5 6.7 Assam 2.5 2.2 3.9 4.4 Andhra Pradesh 2.9 4.0 -0.04 4.4 Karnataka 4.0 4.0 9.0 4.5 Kerala 2.9 2.9 0.3 3.0 Tamilnadu 3.4 2.6 3.5 5.9 Gujarat -0.2 2.0 1.1 4.3 Madhya Pradesh 4.3 1.3 4.2 6.6 Maharashtra 2.3 3.2 5.4 5.3 Rajasthan 3.1 2.5 10.5 11.4
Source: GOI (various years), National Accounts Statistic.
Moreover, the green revolution technologies that were instrumental in boosting cereal production
started showing signs of fatigue in the late 1980s, leading to depression in farm incomes. This, together
with increasing demand for high-value food commodities, prompted farmers to diversify into higher value

7
food commodities. To a limited extent, diversification was also supported by the fact that various policies
shifted from cereals towards high-value food commodities, especially horticulture (during the 1990s). The
National Horticulture Board was established in 1984 to boost production, disseminate information,
provide technical know-how and services and strengthen backward and forward linkages. This emphasis
on horticulture continued in subsequent years with the 2005 launch of the National Horticulture Mission,
which was aimed at increasing production, processing and exports of horticultural products.
Furthermore, a number of regulations were amended to facilitate private sector participation in
the food sector. The Agricultural Produce Market Committee Act, which previously restricted
transactions outside state-designated markets, was amended in several states to allow direct sale/purchase
of agricultural commodities between producers and processors through institutional mechanisms like
contract farming, producers’ associations and formal/informal cooperatives. Moreover, the institutional
lending agencies were allowed to finance such schemes. Until recently, the processing of a number of
agricultural products was reserved for small-scale industries; now, many items have been de-reserved. In
addition, a number of fiscal incentives are now offered to the processing industry, including reduction in
excise and corporate taxes, as well as reduced import duties on imported machines and equipment.
Crop Diversification and the Role of Smallholders
Though smallholders dominate Indian agriculture, there are substantial inter-state differences in the share
of smallholders in agricultural holdings, as well as in the share of smallholders in total land holdings over
time. Table 3 presents the share of smallholders in landholdings for the major states in India for the year
1998.
Figure 1 shows the percentage distribution of smallholder shares with regard to total state land
holdings over time. The share of smallholders changes over time in every state examined. All states
exhibit a trend towards fragmentation of landholdings as the population pressure increases, likely because
the need for land is not offset by generation of non-farm opportunities, resulting in sequential decreases in
holding size.
Moreover, there is sizeable time-dependent variation in the state-level diversification towards
fruits and vegetables. Figure 2 (below) shows the percentage area allocated to fruits and vegetables in the
various states over time. For most states, a greater proportion of land area is allocated to the cultivation of
fruits and vegetables over time. 1
1 The sharp reduction in share of land allocated to fruits and vegetables seen in the mountainous states of Jammu and
Kashmir, is due to a militant insurgency that started in the early 1990s.

8
Table 3. Share of landholders by size (1998)
State Small Medium Large Andhra Pradesh 78.6 14.0 7.4 Assam 87.1 10.8 2.1 Bihar 89.5 7.8 2.7 Gujarat 68.9 17.4 13.7 Haryana 59.6 23.6 16.8 Himachal Pradesh 92.6 5.8 1.6 Jammu & Kashmir 94.2 4.9 0.9 Karnataka 72.7 16.1 11.2 Kerala 98.0 1.5 0.5 Madhya Pradesh 63.5 24.4 12.1 Maharashtra 68.4 19.4 12.2 Orissa 90.7 7.4 1.9 Punjab 57.3 22.9 19.8 Rajasthan 59.2 20.4 20.4 Tamilnadu 88.9 7.8 3.3 Uttar Pradesh 87.3 9.2 3.5 West Bengal 95.7 3.9 0.4
Source: Agricultural Census.
Figure 1. Percentage of smallholders in total landholdings in various states over time (1981, 1991 and 2003)
Kerala
Andhra Pradesh
Assam
Bihar
Gujarat
Haryana
Himachal Pradesh
Jammu and Kashmir
Karnataka Madhya Pradesh
Maharashtra
Orissa
Punjab
Rajasthan
Tamil NaduUttar PradeshWest Bengal
48
58
68
78
88
98
1981 1991 2003
Year
Andhra PradeshAssamBiharGujaratHaryanaHimachal Pradesh Jammu and KashmirKarnatakaKeralaMadhya PradeshMaharashtraOrissaPunjabRajasthanTamil NaduUttar PradeshWest Bengal
Source: National Accounts Statistics, various years.

9
Figure 2. Share of land allocated to fruits and vegetables in the various states over time (1980, 1991, 2003)
Andhra PradeshAssam
Bihar
Gujarat
Haryana
Himachal Pradesh
Jammu &Kashmir
Karnataka
Kerala
Madhya Pradesh
Maharashtra
Orissa
Punjab
Rajasthan
Tamil Nadu
Uttar Pradesh
West Bengal
0
5
10
15
20
25
1981 1991 2003
Andhra PradeshAssamBiharGujaratHaryanaHimachal PradeshJammu &KashmirKarnatakaKeralaMadhya PradeshMaharashtraOrissaPunjabRajasthanTamil NaduUttar PradeshWest Bengal
Source: National Accounts Statistics, various years.
To assess the relationship between diversification at the state level and the share of landholdings
with the smallholders, the fixed effects regression for our analysis is specified as:
* *it i t it itI d SmXα β δ γ θ ε= + + + + + (1)
itI is one of the three dependent variables, value of horticultural output at the state level (at constant 1980-
81 prices), share of horticulture in the value of agricultural output at the state level (in constant prices)
and share of agricultural land devoted to horticultural production respectively. The last two dependent
variables measure diversification relative to other crops (in terms of share in value and in land area
respectively).
In equation (1), the coefficient of interest isθ , which captures the state-level share of
smallholders in total landholdings (the variable )itsm . In the regression, we control for several time- and

10
state-dependent variations in demand ( d )- and supply-side factors ( )X .The dummy variables iα and tβ
denote the state-level and time-fixed effects, respectively. All dependent and explanatory variables are
transformed to their natural logarithms, in order to smooth out the resulting series. The identification of
the coefficients comes from within-state changes over time.
Since the panel data results could suffer from spurious regression due to non-stationarity of the
time series variables, we tested for the stationarity of the variables using the Im-Pesaran-Shin (IPS) test
for the three panels. The IPS test assumes that under the null hypothesis, all series in the panel are non-
stationary processes. Under the alternative hypothesis, a fraction of the series in the panel are assumed to
be stationary.
The methodology is an extension of the Augmented Dickey Fuller (ADF) test. In the IPS test,
ADF regressions are computed for each unit, and a standardized statistic is computed as the average of the
Lagrange Multiplier (LM) tests for each equation. Adjustment factors are used to derive a test statistic
that is distributed as a standard normal under the null hypothesis. IPS also propose the use of a group–
mean t bar statistic, where the statistics from each ADF test are averaged across the panel; again,
adjustment factors are needed to translate the distribution of the t bar into a standard normal variate under
the null hypothesis. Table A.1 in the appendix give the IPS t bar statistics (with 2 lags) for the three
panels used in the regressions. Based on the IPS test, the variables included in the three regressions are
stationary.
In the fixed effect regressions, demand-side factors such as population density, urbanization and
per capita income in each state are included as controls. 2 On the supply side, water availability (irrigation
and rainfall), production technology, resource endowment (land and labor), and infrastructure (roads and
markets) facilitate diversification towards fruits and vegetables. Thus, the regression further controls for
irrigation, annual rainfall, land holding size and roads. HVA is labor intensive; thus, in order to capture
the economic availability of labor, we use the real wage rate of agricultural labor as one of the control
variables on the supply side. To capture the effect of the relative profitability of fruits and vegetables, we
further include the relative price of fruits and vegetables with respect to cereals in each state.
Furthermore, crop diversification towards fruits and vegetables often requires greater start-up
capital, making credit an important variable. Non-institutional credit is largely sought for non-productive
activities, while institutions mainly provide credit for production related activities. Thus, the availability
of institutional credit is also included as an explanatory variable.
2 In terms of demand-side controls, the factors affecting demand could well be beyond the state level (e.g. per capita
income in neighboring states). Since the variable of interest is the share of smallholders in states, we let these omitted variables be subsumed in the error term. However, in states with low levels of infrastructure, such as roads and post-harvest technology, the role of local demand is amplified.

11
The coefficient reflecting the smallholders’ share in landholdings is highly significant in all three
regressions. The fixed effect specification controls for several unobserved state-level variables that do not
change over time (e.g. agro-climactic conditions). Similarly, time-fixed effects capture various state level
changes relevant for inducing diversification (e.g. tastes and preferences). Technological changes that
could be important drivers of diversification are controlled by time fixed effects. The results are presented
in Table 4.
Does this aggregate evidence thus indicate that small farmers are more likely to adopt
horticulture? In order to answer this question, we next analyze household-level information from a
national sample survey on cultivation practices. As discussed above, there are both pros and cons for
participation of small farmers in high-value agriculture compared to the large farmers. We show in the
next section that smallholders in India appear biased toward diversifying into the cultivation of vegetables
but not fruits.

12
Table 4. Determinants of growth in high-value food production: fixed effects regressions for fruits and vegetables
Explanatory variables Fixed effects regression (dependent variable – Value of horticultural output at constant 1980-81 prices
Fixed effects regression (dependent variable – share of fruits and vegetables in agricultural output at constant 1993-94 prices)
Fixed effects regression (dependent variable – share of fruits and vegetables in agricultural land area in state)
Percentage of landholdings belonging to smallholders (< 2 hectares)
2.80(6.55)***
2.40(6.66)***
2.35(5.69)***
Average size of landholding in state
0.26 (1.71)** 0.19(1.75)* 0.01(0.11)
Per capita income in state
0.23(1.82)* -0.17 (1.60) 0.20(1.54)
Urbanization in state
-1.01 (-2.44) -0.54(-1.56) -0.78(-1.88)*
Irrigation (% of land area irrigated)
-0.02(-0.34) -0.01(-0.29) -0.01(-0.16)
Rainfall (annual in mm)
0.01(0.31) -0.06(-1.85)** 0.005(0.11)
Agricultural wage (in Rs per day)
-0.20(-2.33)** -0.18(-2.53)** -0.32(-4.06)***
Agricultural credit (total agricultural credit/total cultivated land area)
-0.002 (-0.11) 0.002 (0.16) 0.01(1.17)
Roads (paved roads per 100 square km)
-0.08(-2.21)** -0.005 (-0.07) -0.28 (-3.26)***
Markets per 100 square km in the state)
0.10(1.78)* 0.01 (0.26) 0.11(2.19)**
Population density
-0.13(-0.71) 0.48 (2.87)*** 1.06(5.21)***
Relative prices of fruits and vegetables
0.78(7.01)*** 0.74(7.80)*** -0.34(-4.69)***
Year fixed effects
Yes Yes Yes
State fixed effects
Yes Yes Yes
R-squared 0.86 0.97 0.97
No. of observations 341 341 341 Notes: *denotes 10% level of significance, ** denotes 5% level of significance and *** denotes 1% level of significance. Terms in parentheses are the t statistics.

13
4. HOUSEHOLD PARTICIPATION IN CULTIVATION OF FRUITS AND VEGETABLES BY FARM SIZE
Regional Heterogeneity and the Role of Smallholders in the Cultivation of Fruits and Vegetables
India is characterized by considerable heterogeneity in soils, topography, rainfall, temperature, irrigation,
infrastructure and socio-economic conditions. This has both demand- and supply-side implications for the
relative profitability of different crops, and therefore affects the participation of smallholders in
cultivation of fruits and vegetables. India includes 29 states that are broadly divided into five regions: the
north (Haryana, Himachal Pradesh, Jammu & Kashmir, Punjab and Uttaranchal, Uttar Pradesh), east
(Bihar, Jharkhand, Orissa and West Bengal), northeast (Assam, Arunachal Pradesh, Meghalaya, Manipur,
Nagaland, Sikkim and Tripura), west (Chattishgarh, Gujarat, Goa, Madhya Pradesh, Maharashtra and
Rajasthan), and south (Andhra Pradesh, Karnataka, Kerala and Tamil Nadu). Although this classification
does not fully capture within-region variations in agro-climatic attributes, the states in a particular region
tend to be homogeneous to a certain degree of approximation. Because of the acknowledged between-
region variations, we felt that it was important to control for a given farmer’s agro-economic zone and
geographical location in our household-level analysis.
The major states in the northern region have alluvial soils and good irrigation facilities (72-96%
of the gross cropped area is irrigated). The eastern states are broadly similar in agro-climatic conditions,
with a generally humid climate, normal rainfall over 1200 mm per year, and the amount of irrigated area
as percentage of gross cropped area ranging between 28% in Orissa to 48% in Bihar. Likewise, the
northeastern states also are homogenous with respect to soils, topography and rainfall. The western and
southern states largely represent semi-arid climates (with the exception of some arid parts of Rajasthan in
the western region) with less than 40% of the areas currently under irrigation.
In terms of food crops, the northern region has been called the cradle of the green revolution, and
is highly specialized in the production of rice and wheat. Food grains accounted for 38.5% of the gross
value of agricultural output in TE2002/03, with similar values seen consistently over the previous two
decades. Sugarcane and oilseeds are other important crops in this region, although the importance of
oilseeds in this region has declined over time, while the share of fruits and vegetables has increased
considerably since the early 1990s. Some states in the northern region suffer from acute labor shortages,
resulting in higher wage rates and discouraging the production of labor-intensive HVA crops.
The eastern region is most backward in terms of agricultural development. In the northeast, the
agro-climatic conditions are favorable for horticulture, and for spices and aromatic and medicinal plants.
This region includes some of the most remote areas in India, and lack of infrastructure and subsequent
market underdevelopment is acute, even more so than in the eastern region. In the south, rice is the main

14
staple crop. Its share, however, has declined considerably since the early 1990s. Fruits and vegetables are
important everywhere in the region, except in Andhra Pradesh, where fruits and vegetables accounted for
less than 10% of the agricultural output in TE2002/03.
Agriculture in the western region is largely rain fed and is highly diversified. Recent years have
seen rapid increases in HVA production in this region, largely due to various technological and
institutional interventions. The robust growth in fruit and vegetables in Maharashtra can be attributed to a
strong network of cooperatives and producers’ associations. Given the scarcity of water in Maharashtra,
the government made substantial investment in watersheds and technologies in an effort to enhance the
efficiency of water use (e.g. drip-fed irrigation and sprinklers). The area under drip irrigation in
Maharashtra increased from a mere 500 hectares (ha) during the 1980s to about 1.0 million ha in 2002.
Moreover, in 1990 the state government in Maharashtra linked horticultural production with the
Employment Guarantee Scheme (EGS), which mandated that every beneficiary was supposed to put at
least 0.2 ha of land to horticultural crops, and provided government-subsidized inputs (e.g. planting
materials). This had a strong effect on horticultural production in this region.
At the national level in India, land holdings of less than 2 hectares comprise nearly 81% of the
holdings and account for 41.4% of the land area based on 1996 agricultural census (see Table 3). The
proportion of smallholders is highest in the eastern region (91.7% of holdings accounting for 65.3% of the
land area) and is lowest in the western region (64.5% of holdings accounting for 26.8% of the land area).
In the north and northeast, about 86% of the farm households are smallholders. Inter-state differences in
the proportions of small landholdings are given in Table 3.
In terms of national crop distributions, 15.3% of farm households grow vegetables and 4.6%
grow fruits (Table 5). Nearly 16% of households with less than 2 hectares grow vegetables. The
corresponding figures for medium and large farm households are 14.8 and 10.4%, respectively. The
proportion of households growing fruits is also higher among smallholders.
Smallholder participation in vegetable cultivation is highest in the northeastern region (65.5%),
while the participation rate in the north is similar to the national average and those in the western and
southern regions are below the national average. Participation rates also vary across farm categories in the
different regions. In the north, large farms participate in vegetable cultivation less than small and
medium-sized farms. In the east, the proportion of vegetable-growing households is the least among
marginal farmers followed by large farmers. In the south, the participation rate is higher among the large
farmers followed by marginal, medium and small farmers.

15
Table 5. Participation of categories of farm households in cultivation of fruits and vegetables
North East Northeast South West National % Households Vegetables Small 15.8 21.1 65.5 8.1 5.6 15.8 Medium 15.3 29.0 75.9 8.0 8.3 14.8 Large 12.7 22.3 74.5 8.7 6.9 10.4 All 15.6 21.6 66.9 8.1 6.4 15.3 Fruits Small 2.2 1.1 4.5 17.6 1.5 5.0 Medium 2.0 1.9 6.1 6.7 1.3 2.7 Large 2.9 0.0 4.9 6.4 2.2 3.0 All 2.3 1.1 4.7 15.7 1.5 4.6 % Of gross cropped area Vegetables Small 2.32 4.02 14.20 2.36 1.36 2.97 Medium 1.67 2.78 10.28 1.63 1.05 1.80 Large 1.31 2.31 10.59 1.23 0.82 1.20 All 1.91 3.52 12.73 1.83 1.04 2.12 Fruits Small 0.65 0.23 0.83 3.93 0.44 1.02 Medium 0.39 0.37 1.03 2.56 0.29 0.67 Large 0.47 0.00 1.13 2.25 0.57 0.78 All 0.54 0.22 0.92 3.08 0.46 0.86
Source: GOI (1999): Cultivation practices in India.
A comparatively high proportion of farmers in the southern region (15.7%) grow fruits, and there
is a distinct negative relationship between participation rate and farm size. The medium farmers dominate
fruit cultivation in the northeast, while in other regions, the proportion of fruit-growing households is
highest among large farmers.
Table 5 presents the area allocation to fruits and vegetables by farm size. In general, farmers
allocate a relatively small proportion of their land to vegetables and fruits. Across the farm categories, the
percentages of area under vegetables tend to decline with farm size. A similar relationship holds for fruits,
except that large farmers allocate more area to fruits compared to small and medium farmers. The pattern
of area allocation to vegetables differs by region, with the northeast having the highest area under
vegetables (12.7%), followed by the east (3.5%), north (1.9%) and west (1%).
Assuming identical productivity among different farm sizes, smallholders contribute 61% to
vegetable and 52% to fruit production, which is a much higher share than their share in arable land (41%).
Furthermore, these shares could well be an underestimation if the productivity on small farms is higher
which is likely because of higher labor endowments of the smallholders. In contrast, large farmers, who
constitute 6.8% of the farm households and occupy 34.3% of the arable land, contribute only 18.1% to
vegetable production and 28.8% to fruit production.

16
The regional pattern of area allocated to fruits corresponds with the various participation rates.
Except in the south and northeast, the proportion of area under fruits shows a U-shaped relationship with
farm size. In the northeast it increases with farm size, while in the south the proportion is higher among
the marginal farmers, but relatively little difference is seen in the allocation of land among the other
farmer categories.
To summarize, small and large landholders appear to participate in HVA at similar levels, while
smallholders participate significantly more in vegetables. Most vegetables have a short production cycle,
generate quick returns, require less capital and are relatively labor-intensive, making them ideal for the
cropping schemes of smallholders.
Table 6. Share of different farm categories in area under vegetables and fruits (%)
North East Northeast South West National Vegetable growing households
Small 86.7 89.4 84.7 82.7 57.2 83.5 Medium 9.5 8.7 12.2 10.6 27.4 11.9 Large 3.8 1.9 3.1 6.7 15.4 4.6
Vegetable area Small 61.9 74.4 68.6 58.1 37.4 61 Medium 20.6 16.2 21.0 20.5 27.5 20.9 Large 17.5 9.4 10.4 21.4 35.1 18.1
Fruit growing households Small 85.3 88.8 83.1 92.9 61.4 88.4 Medium 8.7 11.2 14.0 4.6 17.8 7.1 Large 6.0 0.0 2.9 2.5 20.8 4.5
Fruit area Small 62.1 65.8 55.4 57.5 27.5 51.9 Medium 16.7 34.2 29.3 19.2 17.4 19.3 Large 22.2 0.0 15.4 23.3 55.1 28.8
Source: GOI (1999): Cultivation practices in India.
Indeed, Table 7 shows little convergence in crop choices between fruits and vegetables. Growers
of fruits and vegetables are distinctly different in the sense that they rarely combine cultivation of fruits
and vegetables. Nearly 93% vegetable growers never cultivate both fruits and vegetables simultaneously.
Similarly 76% of the fruit growers do not cultivate vegetables.
Table 7. Distribution of households growing either vegetables or fruits or both in India (%)
Farm category Vegetable growers Fruit growers Vegetables but no
fruits Both vegetables
and fruits Fruits but no
vegetables Both fruits and
vegetables Small 92.3 7.7 75.7 24.3 Medium 95.9 4.1 77.1 22.9 Large 95.2 4.8 83.6 16.4 All 92.8 7.2 76.1 23.9
Source: GOI (1999): Cultivation practices in India.
17
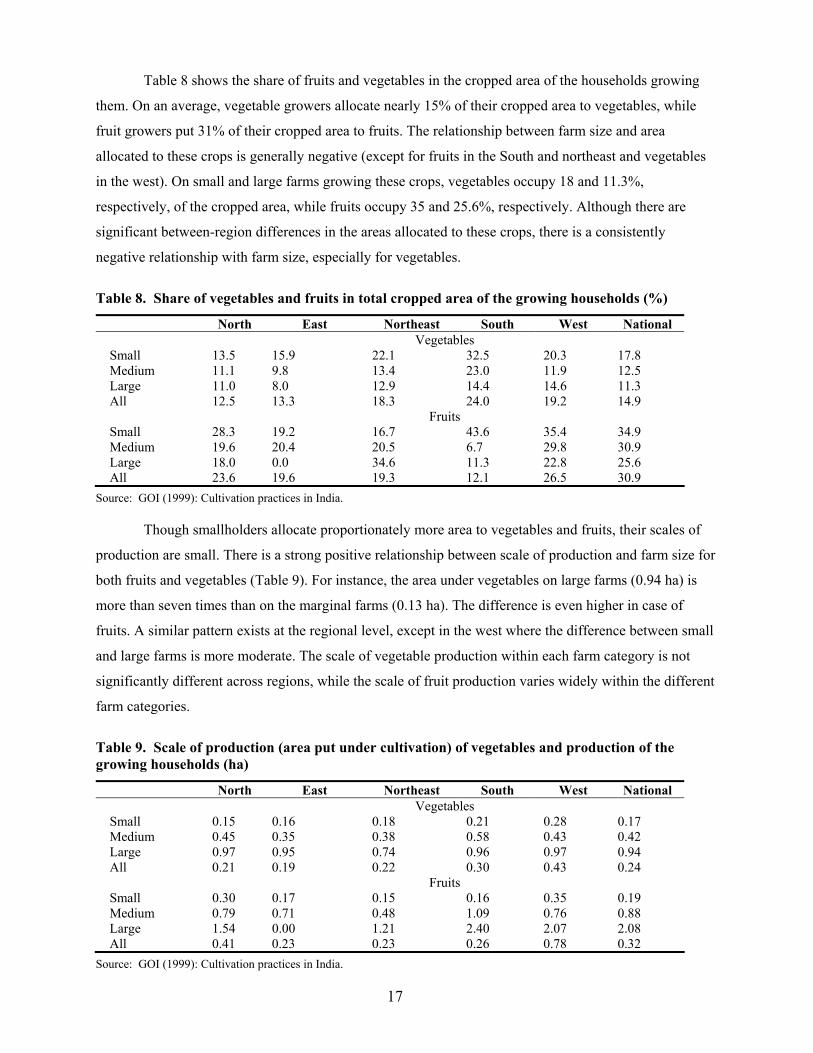
Table 8 shows the share of fruits and vegetables in the cropped area of the households growing
them. On an average, vegetable growers allocate nearly 15% of their cropped area to vegetables, while
fruit growers put 31% of their cropped area to fruits. The relationship between farm size and area
allocated to these crops is generally negative (except for fruits in the South and northeast and vegetables
in the west). On small and large farms growing these crops, vegetables occupy 18 and 11.3%,
respectively, of the cropped area, while fruits occupy 35 and 25.6%, respectively. Although there are
significant between-region differences in the areas allocated to these crops, there is a consistently
negative relationship with farm size, especially for vegetables.
Table 8. Share of vegetables and fruits in total cropped area of the growing households (%)
North East Northeast South West National Vegetables Small 13.5 15.9 22.1 32.5 20.3 17.8 Medium 11.1 9.8 13.4 23.0 11.9 12.5 Large 11.0 8.0 12.9 14.4 14.6 11.3 All 12.5 13.3 18.3 24.0 19.2 14.9 Fruits Small 28.3 19.2 16.7 43.6 35.4 34.9 Medium 19.6 20.4 20.5 6.7 29.8 30.9 Large 18.0 0.0 34.6 11.3 22.8 25.6 All 23.6 19.6 19.3 12.1 26.5 30.9
Source: GOI (1999): Cultivation practices in India.
Though smallholders allocate proportionately more area to vegetables and fruits, their scales of
production are small. There is a strong positive relationship between scale of production and farm size for
both fruits and vegetables (Table 9). For instance, the area under vegetables on large farms (0.94 ha) is
more than seven times than on the marginal farms (0.13 ha). The difference is even higher in case of
fruits. A similar pattern exists at the regional level, except in the west where the difference between small
and large farms is more moderate. The scale of vegetable production within each farm category is not
significantly different across regions, while the scale of fruit production varies widely within the different
farm categories.
Table 9. Scale of production (area put under cultivation) of vegetables and production of the growing households (ha)
North East Northeast South West National Vegetables Small 0.15 0.16 0.18 0.21 0.28 0.17 Medium 0.45 0.35 0.38 0.58 0.43 0.42 Large 0.97 0.95 0.74 0.96 0.97 0.94 All 0.21 0.19 0.22 0.30 0.43 0.24 Fruits Small 0.30 0.17 0.15 0.16 0.35 0.19 Medium 0.79 0.71 0.48 1.09 0.76 0.88 Large 1.54 0.00 1.21 2.40 2.07 2.08 All 0.41 0.23 0.23 0.26 0.78 0.32
Source: GOI (1999): Cultivation practices in India.

18
Determinants of a Household’s Diversification towards Fruits and Vegetables
The comparisons above show that smallholders have a greater participation in vegetables and comparable
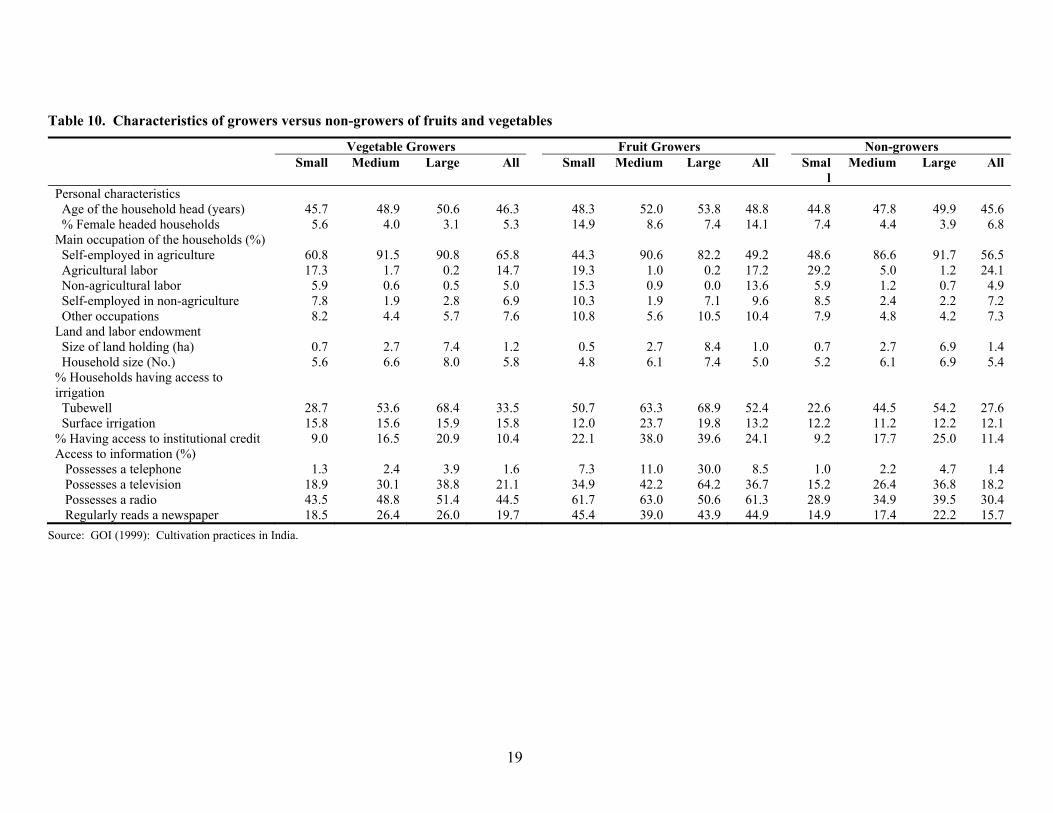
contribution in fruits relative to large farmers. Table 10 summarizes the characteristics of fruit and
vegetable growers compared to non-growers. Overall, the non-growers of fruits and vegetables are
marginally younger. The proportion of female-headed households is lowest among vegetable growers
(5.3%) and highest among the fruit growers (14.1%). Vegetable growers have larger families compared to
fruit growers or non-growers, who have similar family sizes. This observation is consistent with the
notion that vegetable production, which is a more labor-intensive is more often undertaken by households
with greater labor endowments.
Agriculture is the main occupation of two-thirds of the vegetable growers, 49.2% of the fruit
growers and 56.5% of the non-growers. Agricultural labor is the second most important occupation for
non-growers (24.1%) and vegetable growers (14.7%). Non-farm employment (self-employment in non-
agricultural activities, non-agricultural wage employment and employment in public and private sector) is
higher for fruit growers than for the other categories.
Notably, the fruit and vegetables growers have smaller land holdings compared to the non-
growers, and have better access to their own sources of irrigation compared to non-growers. Overall,
nearly 48% of vegetable growers and 62% of fruit growers have access to some source of irrigation,
compared to only 39% of non-growers.
Fruits require more capital compared to vegetables and staple crops, meaning that farmers
seeking to cultivate fruit must often supplement their own resources by borrowing from institutional and
non-institutional sources. Twenty-four percent of fruit growers, compared to only 10.4% of vegetable
growers and 11.4% of non-growers availed themselves of institutional credit. Since high-value food
production is also information-intensive, more HVA farmers had access to sources of information, such as
radio, television and newspapers.
Based on the summary discussion above, we next examine whether smallholders in India have a
significantly higher participation in undertaking fruit/vegetable cultivation after we control for various
characteristics.
19
Table 10. Characteristics of growers versus non-growers of fruits and vegetables
Vegetable Growers Fruit Growers Non-growers Small Medium Large All Small Medium Large All Smal
l Medium Large All
Personal characteristics Age of the household head (years) 45.7 48.9 50.6 46.3 48.3 52.0 53.8 48.8 44.8 47.8 49.9 45.6 % Female headed households 5.6 4.0 3.1 5.3 14.9 8.6 7.4 14.1 7.4 4.4 3.9 6.8 Main occupation of the households (%) Self-employed in agriculture 60.8 91.5 90.8 65.8 44.3 90.6 82.2 49.2 48.6 86.6 91.7 56.5 Agricultural labor 17.3 1.7 0.2 14.7 19.3 1.0 0.2 17.2 29.2 5.0 1.2 24.1 Non-agricultural labor 5.9 0.6 0.5 5.0 15.3 0.9 0.0 13.6 5.9 1.2 0.7 4.9 Self-employed in non-agriculture 7.8 1.9 2.8 6.9 10.3 1.9 7.1 9.6 8.5 2.4 2.2 7.2 Other occupations 8.2 4.4 5.7 7.6 10.8 5.6 10.5 10.4 7.9 4.8 4.2 7.3 Land and labor endowment Size of land holding (ha) 0.7 2.7 7.4 1.2 0.5 2.7 8.4 1.0 0.7 2.7 6.9 1.4 Household size (No.) 5.6 6.6 8.0 5.8 4.8 6.1 7.4 5.0 5.2 6.1 6.9 5.4 % Households having access to irrigation
Tubewell 28.7 53.6 68.4 33.5 50.7 63.3 68.9 52.4 22.6 44.5 54.2 27.6 Surface irrigation 15.8 15.6 15.9 15.8 12.0 23.7 19.8 13.2 12.2 11.2 12.2 12.1 % Having access to institutional credit 9.0 16.5 20.9 10.4 22.1 38.0 39.6 24.1 9.2 17.7 25.0 11.4 Access to information (%) Possesses a telephone 1.3 2.4 3.9 1.6 7.3 11.0 30.0 8.5 1.0 2.2 4.7 1.4 Possesses a television 18.9 30.1 38.8 21.1 34.9 42.2 64.2 36.7 15.2 26.4 36.8 18.2 Possesses a radio 43.5 48.8 51.4 44.5 61.7 63.0 50.6 61.3 28.9 34.9 39.5 30.4 Regularly reads a newspaper 18.5 26.4 26.0 19.7 45.4 39.0 43.9 44.9 14.9 17.4 22.2 15.7
Source: GOI (1999): Cultivation practices in India.

20
Regression Analysis for a Household’s Participation in Fruit/Vegetable Cultivation
We estimate a logit model separately for vegetable and fruit growers, with participation as a binary
dependent variable. The explanatory variables include household characteristics and their access to inputs
(e.g. credit and infrastructure). In addition, we control for each farmer’s location by including dummies
for the agro-climatic region and state of each farming household. Furthermore, we investigate the
participation of the farmers by size in terms of the area of the agrarian land allocated to fruits and
vegetables (i.e. as a continuous measure of participation). Since there are several corner solution
responses (zeros), we estimate a Tobit model separately for the share of land allocated to fruits or
vegetables, respectively. In the sample comprising 50,000 households, approximately 20% of the
households cultivated either fruits or vegetables, and little intersection was observed between the two.
The farmer characteristics included in the regressions are experience and managerial skills, where
age of the head of household proxies for experience and managerial skill. To capture diminishing returns
to experience, we also include age squared as a control variable. Indeed, to the extent that HVA involves
more risk, and younger people are likely to be less risk averse, age could have the opposite effect. As
reported by von Braun (1994), female managers are less likely to participate in cash crop production.
Thus, the gender of the head of the household is included in the analysis. Female-headed households are
less likely to participate in labor-intensive HVA activities due to greater opportunity cost of labor and
possibly due to greater risk aversion.
Vegetable and fruit cultivation is labor-intensive and thus favors households with greater stocks
of family labor. In our participation regressions (logit and tobit), we take the household size as a proxy for
labor availability. Apart from labor, the most important resource is land. The size of landholdings,
however, may have both a positive and negative influence on cultivation of vegetables and fruits. Large
holders may allocate a higher proportion of land to vegetables and fruits simply because more land is
available, whereas land availability may be an important constraint for smallholders who also need to
meet their own subsistence requirements with grain. Since fruit and vegetable production is labor-
intensive, sufficient availability of labor in a smallholder household may enable small farmers to
undertake cultivation of these crops more easily, compared to the relatively labor-constrained large
landholders. Here, we run two specifications in the participation regressions, one with a categorical
dummy (smallholder and medium holder with large holder as the excluded category), and the other with
land size as a continuous variable.
Ceteris paribus, a household’s occupation is an important determinant of its crop choices.
Households engaged in non-farm activities are expected to indulge less in labor-intensive crops because

21
of competing uses of labor and a relative lack of skill, especially with regards to skill-intensive farm
activities. The NSSO dataset classifies households based on their main income sources, namely self-
employment in agricultural activities, self-employment in non-agricultural activities, agricultural labor,
non-agricultural labor and others (employment in public and private sector). We include dummies for
these employment categories as control variables.
We also include farmer’s access to irrigation as an explanatory variable. High-value crops are
capital-intensive, and farmers (especially smallholders) are often capital constrained. Credit markets in
India are dominated by informal moneylenders, and a farmer’s access to institutional credit may be
limited. To capture the effect of borrowing on the decision to grow fruits and vegetables, a dummy for
access to institutional credit is included in the set of explanatory variables.
The information requirements of HVA tend to be high compared to those for staple crops. Thus,
the search costs for information are higher for HVA. Farmers typically obtain information through
different channels, including extension agents, newspapers, radio, television and the telephone. In recent
years, the public extension system in India has reportedly become increasingly inefficient (NSSO 2005),
and farmers have been forced to rely on alternative private sources of information. In order to capture the
effect of information, dummy variables for a household’s possession of a radio, television and/or
telephone, as well as newspaper readership, are included in the model. Well-informed households are
expected to participate more in fruit and vegetable production.
The cropping choice of a household is ultimately determined by relative prices and off-farm
supply-side factors such as local infrastructure. Urbanization and infrastructure are expected to have a
positive effect on a farmer’s decision to grow fruits and vegetables. The share of urban population and
road density in the relevant district are included as explanatory variables from outside the NSSO dataset.
As in our state-level analysis, the caveat for these demand-side factors is that, conditional on
infrastructure availability, the demand factors could have non-localized influences.
Agro-ecological factors, such as rainfall, temperature, length of growing period, and soil type are
important determinants of crop composition. To examine their effects on diversification, dummy variables
for the agro-ecological environment in which the farmer resides (arid, rainfed, irrigated, hills and
mountains, or coastal) were created and included in the explanatory variables. Agriculture in India is a
state subject, and agricultural policies vary from state to state. In order to capture the effects of state
policies, state dummies were introduced in the model as explanatory variables.
The results from the regression are shown in Tables 11 and 12. Our variables of interest are the
farm and household sizes. As expected, the dummies for marginal and small farms are significant for
vegetables in the logit specification (without controlling for land size). Importantly, when the land size
variable is included, it is negative and significant for both fruits and vegetables, indicating that the

22
probability of diversification towards fruits and vegetables decreases with farm size. The effect of
household size is positive and significant for vegetables, which is consistent with the greater labor
requirements for vegetable production. The coefficient of household size is negative and significant in
case of fruits. In general, fruits require more labor in the initial years of their life cycle, but their labor
requirements decrease substantially once the plants have attained maturity.
The tobit results shown in Table 12 present a continuous variant of household participation in
fruits and vegetables. The dependent variables are the shares of land allocated to fruits and vegetables,
respectively. There did not appear to be a statistically significant effect of smallholding on the share of
land allocated to fruits or vegetables (though it is positive for vegetables). As in case of the dichotomous
participation variable, the greater the land size, the smaller the share of land allocated to fruit and
vegetable production. The importance of household size as a determinant of family labor supply is borne
out by the continuous measure of participation. Household size has a positive and significant impact on
the land allocated to vegetables, and a negative and significant impact on the allocation to fruits.

23
Table 11. Results of logit regression for participation in fruit and vegetable cultivation
Logit Vegetables Marginal effects (logit
regression for vegetables)
Fruits Marginal effects (logit
regression for fruits)
Vegetables Marginal effects (logit regression for vegetables)
Fruits Marginal effects (logit
regression for fruits)
Explanatory variables Dependent variable:
Growers =1, otherwise=0
Dependent variable:
Growers =1, otherwise=0
Dependent variable:
Growers =1, otherwise=0
Dependent variable:
Growers =1, otherwise=0
Coefficient (z-statistic)
Coefficient (z-statistic)
Coefficient (z-statistic)
Coefficient (z-statistic)
Age of the household head
0.03(6.70)***
0.005(6.27)***
0.02(2.68)***
0.0007(2.67)**
0.03(6.78)***
0.004(5.39)***
0.02(2.81)***
0.0007(2.76)***
Age squared of the household
-0.0004 (-7.61)***
-0.00005 (-6.81)***
-0.0002(-2.36)** -0.00006 (-2.37)**
-0.0004(-7.64)*** -0.00005 (-6.26)***
-0.0002(-2.45)** -0.00006 (-2.40)**
Sex of the household head, male =1 otherwise =0
-0.27(-5.50)** -0.03 (-4.14)***
0.12(1.81)* 0.003(1.7)* -0.27(-5.62)*** -0.02(-3.14)*** 0.10(1.59) 0.002(1.49)
Self-employed in agriculture
0.31(5.82)***
0.04(5.99)*** -0.23(-3.20)** -0.006(-3.20)***
0.34(6.42)*** 0.05(6.93)*** -0.15(-2.03)** -0.002(-2.43)**
Agricultural labor
-0.14(-2.44)** -0.07 (-10.64)***
-0.35(-3.94)*** -0.008 (-4.29)***
-0.15(-2.47)** -0.07(-10.35)*** -0.34(-3.91)*** -0.008 (-4.24)***
Self-employed in non-agriculture
0.04(0.70)
0.006(0.69)
-0.34(-3.34)***
-0.007 (-3.57)***
0.04(0.71)
0.005(0.48)
-0.33(-3.23)***
-0.007 (-3.42)***
Other occupations
0.21(3.76) 0.03(3.58)*** -0.42(-4.75)***
-0.009 (-5.39)***
0.10(1.61)* 0.04(3.98)*** -0.39(-4.42)*** -0.009 (-5.41)***
Small farm
0.32(1.68)*
0.04(1.81)*
-0.05(-0.17)
-0.001(-0.12)
Medium farm
-0.07(-0.36) -0.001(-0.71) -0.71(-1.97)** -0.01 (-2.79)***

24
Table 11. Continued
Logit Vegetables Marginal effects (logit regression for vegetables)
Fruits Marginal effects (logit regression
for fruits)
Vegetables Marginal effects (logit regression for vegetables)
Fruits Marginal effects (logit
regression for fruits)
Landholding size
-0.03
(-6.32)***
-0.008(-6.86)***
-0.07
(-5.76)***
-0.002
(-4.50)***
Household size (No.)
0.03(6.99)***
0.005(8.04)*** -0.02(-2.80)***
-0.0008(-3.02)*** 0.03(7.51)*** 0.006(8.58)*** -0.01(-2.00)** -0.006(-2.42)**
Access to irrigation (tubewell =1, otherwise =0)
0.26(8.95)*** 0.05(9.08)*** 0.73(14.57)*** 0.02(12.49)*** 0.28(9.49)*** 0.03(8.59)*** 0.75(14.92)*** 0.02(12.22)***
Access to information variables
Yes Yes Yes Yes
Zone and state dummies
Yes Yes Yes Yes
Urbanization -0.01 (-11.38)***
-0.002(-14.71)*** 0.01(8.32)*** 0.0003(8.22)*** -0.01 (-11.12)***
-0.002 (-14.82)***
0.01(8.44)*** 0.0003(8.29)***
Road density 0.0007(2.42)** 0.0006(11.71)*** -0.001(-1.88) -0.00004(-2.78)*** 0.0007(2.32)** 0.0006(12.72)*** -0.001(-1.86)* -0.00004 (-2.81)**
Log-likelihood
-21580.74 -8163.03 -21576.13 -8152.74
Pseudo R-squared
0.14 0.21 0.14 0.21
No. of observations
47599 46501 47599 46501
Notes: *-denotes significance at 10% level, **-denotes significance at 5% level, ***-denotes significance at 1% level.

25
Table 12. Tobit regression on share of land devoted to fruit and vegetable cultivation by households
Tobit Share of land area under vegetables
Share of land area under
fruits
Share of land area under vegetables
Share of land area under fruits
Explanatory variables Coefficient (t-statistic)
Coefficient (t-statistic)
Coefficient (t-statistic)
Coefficient (t-statistic)
Age of the household head
0.006(5.66)*** 0.008(2.26)** 0.007(5.26)*** 0.009(2.41)**
Age squared of the household
-0.0008(-6.62)*** -0.00006(-1.86)**
-0.00008(-6.76)*** -0.00007(-1.97)
Sex of the household head, male =1 otherwise =0
-0.04(-3.76)*** 0.07(2.73)*** -0.04(-3.97) 0.06(2.54)**
Self-employed in agriculture
-0.04(-4.25)*** -0.16(-5.44)*** -0.03(-3.12)*** -0.12(-4.16)***
Agricultural labor
-0.06(-5.05)*** -0.15(-4.55)*** -0.06(-5.05)*** -0.15(-4.50)***
Self-employed in non-agriculture
-0.006(-0.42) -0.14(-3.58)*** -0.005(-0.37) -0.13(-3.50)***
Other occupations
-0.01(1.29) -0.18(-5.33)*** -0.01(-1.01) -0.17(-5.70)***
Small farm
0.06(1.44) -0.02(-0.21)
Medium farm
-0.04(-0.93) -0.26(-1.99)**
Household size (No.)
0.004(4.17)*** -0.01(-3.55)*** 0.005(5.12)*** -0.009(-2.68)**
Land size
-0.01(-10.04)*** -0.03(-6.95)***
Access to irrigation (tubewell =1, otherwise =0)
0.06(9.45)*** 0.26(13.66)*** 0.07(10.43)*** 0.27(14.16)***
Access to irrigation (surface water =1, otherwise =0)
0.04(5.36)*** -0.10(-4.37)*** 0.04(5.37)*** -0.09(-4.16)***
Access to institutional credit
-0.05(-5.40)*** 0.16(7.12)*** -0.04(-4.96)*** 0.17(7.52)***
Possess telephone
-0.04(-6.24)*** 0.10(5.54)*** -0.03(-5.57)*** 0.11(6.06)***
Possess radio
0.08(14.81)*** 0.25(14.48)*** 0.08(14.92)*** 0.24(14.27)***
Zone and state dummies
Yes Yes Yes
Urbanization
-0.001(-7.99)*** 0.005(9.94)*** -0.001(-7.62)*** 0.005(10.10)***
Road density
0.0002(4.15)*** -0.0001(-0.91) 0.0002(3.90)*** -0.002(-1.01)
N 47599 47599 47599 47599 Notes: *-denotes significance at 10% level, **-denotes significance at 5% level, ***-denotes significance at 1% level.

26
5. CONCLUSIONS
One of the main channels through which diversification towards high-value crops can reduce poverty is
via the participation of small farmers. However, although smallholders have the benefits of proportionally
larger labor pools, this may be offset by constraints such as lack of access to credit. Thus, there is
continued debate as to whether smallholders can successfully diversify into the high-value sector.
Using state level data from India, we herein show that smallholders show more participation in
high-value fruit and vegetable production compared to larger farms. The household-level analysis,
however, points to differences within the category of fruits and vegetables. The high capital intensity and
greater gestation lags in fruits seem to be deterrents for small farmers having a minimal capital base
(physical and human) and a low appetite for the riskier fruit market.
This is not to say, of course, that the observed level of diversification is necessarily the optimal
level. Given the high labor endowments in India and the preponderance of smallholders, the share of
resources allocated to high-value agriculture continues to be relatively small, although it is increasing
over time. Conditional on supporting infrastructure and institutions, smallholders have an advantage when
adopting labor-intensive crops such as vegetables. The bias towards vegetables rather than fruits clearly
points to the role of enabling factors in transforming the potential advantages of the smallholders (such as
larger families) into realized crop choices that favor high-value products.

27
APPENDIX
Table A.1. Panel unit root test
Variables IPS (t-bar) ifv -1.92** fv -1.77** areafv -1.71**

28
REFERENCES
Barghouti, S., S. Kane, K. Sorby and M. Ali. 2005. Agricultural diversification for the poor: guidelines for practitioners. Agriculture and Rural Development Discussion Paper 1. Washington D.C.: The World Bank. 48 pp.
Deshingkar P., U. Kulkarni, L. Rao and S. Rao 2003. Changing food systems in India: resource-sharing and marketing arrangements for vegetable production in Andhra Pradesh, Development Policy Review 21 (5–6), pp. 627–639.
Dorjee et al., 2002. Genetic diversity of Bhutanese yak (Bos grunniens) using microsatellite markers. Proceedings of the third international congress on yak, in Lhasa, China, 4-9 September 2000. International Livestock Research Institute (ILRI), Nairobi, pp. 197-201.
GOI (Government of India). 1999. Cultivation practices in India. National Sample Survey Organization, Ministry of Statistics and Program Implementation, New Delhi.
____. 2000. Report of the standing sub-committee for assessment of availability and requirement of water for diverse uses in the country. Central Water Commission, New Delhi, India.
____. 2001. Employment and unemployment situation in India, 1999/2000. National Sample Survey Organization, Ministry of Statistics and Program Implementation, New Delhi.
____. 2005. Vision, Strategy, and Action plan for food processing industries in India. Ministry of Food Processing, New Delhi.
____. 2005. Indebtedness of farmer households. National Sample Survey Organization, Ministry of Statistics and Program Implementation, New Delhi.
____. 2005. Access to modern technology for farming. National Sample Survey Organization, Central Statistical Organization, Ministry of Statistics and Program Implementation, New Delhi.
GOI (various years). National Accounts Statistics. Central Statistical Organization, Ministry of Statistics and Program Implementation, New Delhi.
Goletti F. 1999. Agricultural diversification and rural industrialization as a strategy for rural income growth and poverty reduction in Indochina and Myanmar. MSSD Discussion Paper No. 30. Washington DC: International Food Policy Research Institute
Gulati A., and M. Torero. 2004. http://www.lenntech.com/water-food-agriculture. Use of water in food and agriculture.
Joshi, P.K., P.S. Birthal and V. Bourai. 2002. Socioeconomic constraints and opportunities in rainfed rabi cropping in rice fallow areas of India. International Crops Research Institute for the Semi-arid Tropics, Patancheru, India.
Minot, N., and D. Roy. 2006. Impact of High-value agriculture and modern marketing channels on poverty: A Conceptual frame work. Draft report MTID, IFPRI Washington D.C.
National Accounts Statistics Prepared by Central Statistical Organisation
Pingali, P. 2004. “Climate Change and Food Systems.” Paper presented at the OECD Global Forum on Sustainable Development: Development and Climate Change, ENV/EPOC/GF/SD/RD(2004)11/FINAL, OECD, Paris.
Pokharel, C. 2003. Agricultural diversification in Nepal. Paper presented at the International Workshop on Agriculture Diversification and Vertical integration and vertical integration in South Asia, 5-7 November 2003, New Delhi, India, jointly organized by ICRISAT, FICCI and IFPRI
Ravallion, M., and G. Datt. 1996. How important to India’s poor is the sectoral composition of growth in India. World Bank Economic Review, Vol. 10, 1-25.
Ravi, C., and D. Roy 2006. Consumption patterns and food demand projections, a regional analysis. Draft Report submitted to IFPRI, New Delhi.

29
von Braun, J. 1994. Agricultural commercialization: impacts on income and nutrition and implications for policy. Food Policy, Vol. 20 (3): 187-202.
Warr, P.G. 2003. Poverty and economic growth in India. In: Economic reforms and the liberalization of the Indian economy, K. Kalirajan and U. Sankar (eds). Edward Elgar, Cheltenham, UK and Northampton, MA, USA.
Wickramasinghe, P.J., T. Abeysekera, and A. Herath. 2003. Agricultural Diversification in Sri Lanka. Paper presented at the International Workshop on Agricultural diversification and Vertical integration in South Asia,“ November 5-7, New Delhi, India jointly organized by ICRISAT, FICCI and IFPRI.

RECENT IFPRI DISCUSSION PAPERS
For earlier discussion papers, please go to www.ifpri.org/pubs/pubs.htm#dp. All discussion papers can be downloaded for free.
726. Farmer preferences for milpa diversity and genetically modified maize in Mexico: A latent class approach. Ekin Birol, Eric Rayn Villalba, Melinda Smale, 2007.
725. Generating plausible crop distribution and performance maps for Sub-Saharan Africa using a spatially disaggregated data fusion and optimization approach. Liangzhi You, Stanley Wood, and Ulrike Wood-Sichra, 2007.
724. Assessing the impact of the national agricultural advisory services (NAADS) in the Uganda rural livelihoods. Samuel Benin, Ephraim Nkonya, Geresom Okecho, John Pender, Silim Nahdy, Samuel Mugarura, Edward Kato, and Godfrey Kayobyo, 2007.
723. Rural Investments to Accelerate Growth and Poverty Reduction in Kenya. James Thurlow, Jane Kiringai, and Madhur Gautam, 2007.
722. Smallholders’ Commercialization through Cooperatives: A Diagnostic for Ethiopia. Tanguy Bernard, Eleni Gabre-Madhin, Alemaheyu Seyoum Taffesse, 2007.
721. Understanding Policy Volatility in Sudan. Khalid El Harizi, El Sayed Zaki, Betina Prato, and Ghada Shields, 2007.
720. The impact of the Central America free trade agreement on the Central American textile maquila industry. Hans G.P. Jansen, Sam Morley, Gloria Kessler, Valeria Piñeiro, and Marco Sánchez, 2007.
719. The Food retail revolution in poor countries: Is it coming or is it over?: Evidence from Madagascar. Bart Minten, 2007.
718. The economic impact and the distribution of benefits and risk from the adoption of insect resistant (bt) cotton in West Africa. Jose Falck-Zepeda, Daniela Horna, and Melinda Smale, 2007.
717. Quality control in non-staple food markets: Evidence from India. Marcel Fafchamps, Ruth Vargas Hill, and Bart Minten, 2007.
716. Investment, subsidies, and pro-poor growth in rural India. Shenggen Fan, Ashok Gulati, and Sukhadeo Thorat, 2007.
715. Risk aversion in low income countries: Experimental evidence from Ethiopia. Mahmud Yesuf and Randy Bluffstone, 2007.
714. Micro-level analysis of farmers’ adaptation to climate change in southern Africa. Charles Nhemachena, and Rashid Hassan, 2007.
713. Resource abundance and regional development in China. Xiaobo Zhang, Li Xing, Shenggen Fan, Xiaopeng Luo, 2007.
712. Is food insecurity more severe in south Asia or sub-saharan Africa?: A comparative analysis using household expenditure survey data. Lisa C. Smith and Doris Wiesmann, 2007.
711. Managing conflict over natural resources in greater Kordofan, Sudan: Some recurrent patterns and governance implications. El Fatih Ali Siddig, Khalid El-Harizi, and Betinna Prato, 2007.
710. Mortality, mobility, and schooling outcomes among orphans: Evidence from Malawi. Mika Ueyama, 2007.
709. Agricultural Technology Choices for Poor Farmers in Less Favored Areas of South and East Asia . John Pender, 2007
708. Sharing Science, Building Bridges, and Enhancing Impact: Public–Private Partnerships in the CGIAR. David J. Spielman, Frank Hartwich, and Klaus von Grebmer, 2007.
707. Policies to Promote Cereal Intensification in Ethiopia: A Review of Evidence and Experience. Derek Byerlee, David J. Spielman, Dawit Alemu, and Madhur Gautam, 2007.
706. Sistemas de Innovación Piscícola en la Amazonia Boliviana: Efectos de la Interacción Social y de las Capacidades de Absorción de los Pequeños Agricultores. Frank Hartwich, Vicente Eguez Camacho, Mario Monge, y Luis Ampuero Ramos, 2007.
705. The Role of Clustering in Rural Industrialization:A Case Study of the Footwear Industry in Wenzhou. Zuhui Huang, Xiaobo Zhang, and Yunwei Zhu, 2007.
704. The Economics of GM Food Labels: An Evaluation of Mandatory Labeling Proposals in India. Sangeeta Bansal, Bharat Ramaswami, 2007.

INTERNATIONAL FOOD POLICY RESEARCH INSTITUTE
www.ifpri.org
IFPRI HEADQUARTERS
2033 K Street, NW Washington, DC 20006-1002 USA Tel.: +1-202-862-5600 Fax: +1-202-467-4439 Email: [email protected]
IFPRI ADDIS ABABA
P. O. Box 5689 Addis Ababa, Ethiopia Tel.: +251 11 6463215 Fax: +251 11 6462927 Email: [email protected]
IFPRI NEW DELHI
CG Block, NASC Complex, PUSA New Delhi 110-012 India Tel.: 91 11 2584-6565 Fax: 91 11 2584-8008 / 2584-6572 Email: [email protected]