diver-operated suction sampling in … · diver-operated suction sampling in norwegian cobble...
TRANSCRIPT
Crustaceana 88 (2) 184-202
DIVER-OPERATED SUCTION SAMPLING IN NORWEGIAN COBBLEGROUNDS: TECHNIQUE AND ASSOCIATED FAUNA
BY
HALLDIS RINGVOLD1), JOHN-ARVID GRYTNES2) and GRO I. VAN DER MEEREN3,4)1) Sea Snack Norway, NO-5055 Bergen, Norway
2) Institute of Biology, University of Bergen, NO-5020 Bergen, Norway3) Institute of Marine Research, Austevoll Research Station, NO-5392 Storebø, Norway
ABSTRACT
Marine cobble habitats in shallow waters are rich in faunal assemblages and known settlinggrounds for valuable fishery resources such as lobsters and crabs. Sampling these grounds ischallenging as traditional techniques do not efficiently collect fast-moving benthic invertebrates.Typically, fast moving crustaceans are not sampled according to actual densities. This study usedairlift suction sampling, pioneered in North America, to quantify benthic faunal assemblages incobble grounds across 68 sampling locations in south-western Norway. In total, 72 species of benthicinvertebrates (5276 individual specimens) were identified, with an overall sampling efficiency of76.4%. Polychaeta and decapod crustaceans dominated the samples, with species diversity (ShannonIndex, H ′) highest in Location 3. Cluster and Ordination analyses were further used to relateassemblages to a number of selected variables. Overall, the study highlights that suction samplingprovides a low-cost and efficient method for quantifying mobile benthic fauna in structurallycomplex marine habitats (i.e., cobble).
RÉSUMÉ
Les habitats marins à galets en eau peu profonde sont riches en assemblages fauniques et sontdes fonds de recrutement connus pour les ressources halieutiques de valeur comme les homards etles crabes. L’échantillonnage des ces fonds est un défi car les techniques traditionnelles ne récoltentpas efficacement les invertébrés benthiques se déplaçant rapidement. Typiquement, vu les densitésactuelles, les Crustacés à déplacement rapide ne sont pas échantillonnés. Cette étude utilise unéchantillonnage par aspiration, pionnier en Amérique du Nord, pour quantifier les assemblagesbenthiques sur les fonds de galets au niveau de 68 points d’échantillonnage dans le sud-ouestde la Norvège. Au total, 72 espèces d’invertébrés benthiques ont été identifiées (5276 spécimensindividuels) avec une efficacité d’échantillonnage totale de 76,4%. Les Polychètes et les CrustacésDécapodes dominent dans les échantillons, avec une diversité spécifique (Index de Shannon, H ′) laplus élevée pour Location 3. Des analyses typologiques et de classification étaient utilisées par lasuite pour relier les assemblages à un nombre sélectionné de variables. Au total, l’étude souligneque l’échantillonnage par aspiration fournit une méthode efficace et peu coûteuse pour quantifier lafaune mobile benthique dans les habitats marins structurellement complexes (i.e., galets).
4) Corresponding author; e-mail: [email protected]
© Koninklijke Brill NV, Leiden, 2015 DOI 10.1163/15685403-00003406

SUCTION SAMPLING IN NORWAY 185
INTRODUCTION
While sampling techniques such as cores, dredges, grab shots, and bottomnets have been successful at sampling soft bottom habitats (Tunberg, 1981;Josefson, 1985; Dahle et al., 1998), quantitative sampling of epifauna in cobble orboulder substrata has traditionally been problematic, especially when interstitial,fast swimming species are being targeted. The development of the airlift suctionsampler in the 1980s (Incze & Wahle, 1991), provided researchers with theopportunity to address this issue. Initially pioneered to investigate the spatial andtemporal patterns of benthic recruitment within the American lobster Homarusamericanus (H. Milne Edwards, 1837) (cf. Incze & Wahle, 1991), the techniqueprovided quantitative estimates for a range of mobile species in this previouslyinaccessible habitat (fig. 1). This lead to an increased biological understandingin a wide range of benthic animals, especially highly mobile invertebrates, thatpreviously avoided traditional sampling techniques.
In 1997 this method was introduced to Europe for a collaborative-Europeanproject aimed at sampling newly settled, shelter-restricted European lobster Homa-rus gammarus (Linnaeus, 1758) (FAIR CT-96-1775; see Mercer et al., 2001).The study identified a rich variety of interstitial benthos in cobble ground, andprovided the first quantitative estimates for many species in such habitats (Linnaneet al., 2001). However, in addition to substrate, a number of environmentalvariables such as depth, temperature, salinity, currents, and waves are also knownto influence benthic biodiversity (Tunberg, 1981, 1982; Persson, 1983; Aschan,1988; Boudreau et al., 1992), even at reduced spatial scales (Tunberg, 1982). Theaim of this study was to analyse the suitability of airlift suction sampling as amethod for describing the biodiversity of both a mixed- and hard bottom substratesin Norwegian waters. This was undertaken by describing the associated fauna andspecies diversity within six separate dive locations. The study also examined theinfluence of environmental factors in relation to species diversity within these sites.
MATERIAL AND METHODS
Suction sampler
The airlift consisted of a black PVC tube (170 cm length, 7.0 cm diameter) witha SCUBA cylinder supplying air fitted 10 cm above the mouth. The other end ofthe tube was affixed to a 1 mm mesh nylon bag that could be removed, closedand replaced underwater. The suction sampler was operated by two divers and wasused in conjunction with a 0.5 m2 quadrat constructed from buoyant PVC piping,a 30 cm high sheet of 1 mm mesh curtain, and a heavy chain base. This designprevented the escape of mobile decapods from the quadrat (fig. 1).

186 HALLDIS RINGVOLD, JOHN-ARVID GRYTNES & GRO I. VAN DER MEEREN
On sampling, the quadrat was placed haphazardly on a suitable cobble patch.The cobble stones were then removed by hand by one diver while the secondoperated the airlift, ensuring that the mouth of the tube reached into the interstitialspaces of the substratum. Divers worked slowly until all of the interstitial spaceswere exposed and sampled. Periodically, sample bags were returned to the surface.They were not lifted out of the water until all sampling at the sample locationwas done. During transportation to the lab they were kept in tanks filled withambient temperature sea water. Transportation time never exceeded 1 h. If notanalysed immediately at the arrival at the lab, the tanks were fitted with run-throughsea water overnight and then preserved for future examination. Sampling at eachlocation lasted for a maximum of 90 min.
To test for sampling efficiency, two different sample stations per locations weresampled twice in rapid succession. Based on the combined number of specimensfrom each sample, the fractions (%) of specimens in the first effort were calculatedand noted as sampling efficiency at that location. This was done in all but onelocation (Loc 2).
After sampling all collected animals, grouped by order, were preserved in 4%buffered Formaldehyde for a week, before being washed in freshwater and furtherpreserved in 70% ethanol. All nomenclature was checked at the website of theWorld Register of Marine Species (WoRMS). As the LEAR project was focusedon decapod crustaceans and possible prey species, only Crustacea, Polychaeta,Mollusca, and Echinodermata were identified to species level.
Sampling sites
The sampling sites were located at Bjørnafjorden and Korsfjorden (fig. 2) at thefollowing co-ordinates:
Latitude (N)/Longitude (E)Location 1 Vinnes 60°09′00′′/05°34′48′′
Location 2 Os 60°10′54′′/05°28′30′′
Location 3 Turtelsvik 60°13′18′′/05°19′18′′
Location 4 Langøy 60°13′00′′/05°18′01′′
Location 5 Eidholmen 60°06′09′′/05°15′45′′
Location 6 Skårøy 60°08′36′′/05°09′54′′
Locations 1, 4, 5, and 6 were all sampled from August-October 1997, whileLocations 2 and 3 were sampled from August-September 1998. Locations 1, 2,3, and 5 were at Bjørnafjorden, and Locations 4 and 6 were at Korsfjorden. Eachsite location ranged from 2 to 13 m with an average depth of approximately 7-8 mdepth. The substrata found in Locations 1, 2, 3, and 5 consisted of cobble in/on

SUCTION SAMPLING IN NORWAY 187
Fig. 1. A, Schematic drawings of the i, diver-operated airlift suction sampler rigged with samplingbag; ii, valve to air-connection from a scuba tank; iii, handle for support; iv, elastic band forattachment of empty sample bags; v, 1 mm mesh sampling bags (three rolled together, one fullview); vi, band for attachment of the bag to the top of the suction tube and for closing the filledbag; vii, 0.5 m2 sample quadrant constructed with buoyant PVC pipe line; viii, 0.3 m high curtainof 1 mm mesh, weighted down by a heavy chain and lifted by the PVC pipe line fitted inside. B,
Demonstration of the use of the equipment by two divers. Drawing by H. Ringvold.
Fig. 2. Map showing the six locations in the Korsfjord/Bjørnafjord area in southern Norway (blackstars). The six locations are: Loc 1, Vinnes; Loc 2, Os; Loc 3, Turtelsvik; Loc 4, Langøy; Loc 5,
Eidholmen; Loc 6, Skårøy.

188 HALLDIS RINGVOLD, JOHN-ARVID GRYTNES & GRO I. VAN DER MEEREN
softer sediments (coarse sand (Loc 2)) or sand/silt mixtures (Locations 1, 3, 5),while at Locations 4 and 6 small boulders and cobble dominated among pocketsof sand. The variable “Location”, which explained most of the variation in thedata set, possibly included other, non-measured but important variables for speciescomposition, such as current, wave exposure, algal cover, seasonal variations intemperature and salinity, as well as sediment type. The sea temperature and salinityat the surface, 1 m depth, 5 m depth, and 10 m depth was measured by the use ofa standard Ruttner water sampler at each location once a month through 1998.Salinity was measured using a WTW™ electrode.
Ordination and diversity analyses
A two-way cluster analysis using PC-Ord (Version 6, Bray-Curtis Index andGroup average Linkage) was performed that factored in both stations and speciesbased on presence-absence data. Ordination analyses were then used to identifypossible patterns in species distribution in relation to environmental variables.A preliminary Detrended Correspondence Analysis (DCA) revealed a gradientlength of 3.53, and a unimodal method was chosen (Lepš & Šmilauer, 2003).Correspondence Analyses (CA; Lepš & Šmilauer, 2003) was used to find the maingradient in species composition, and a Canonical Correspondence Analyses (CCA;Lepš & Šmilauer, 2003) was chosen to investigate the relationship between speciescomposition variation and different explanatory variables (location, depth, salinity,and temperature). All species abundances were log-transformed prior to analysesand rare species down-weighted.
To evaluate the significance of the different explanatory variables, permutationtests were performed. This analysis used the default options in the package “vegan”(Oksanen et al., 2009) in R (R Development Core Team, 2010), if not otherwisestated. Temperature and salinity at sampling depth were estimated through linearinterpolation of measured environmental parameters at each location. At Loca-tion 5, as some sample stations depths were missing, these were set at 10 m, sincethe remaining depths were within a narrow depth range of 9.5 m to 10.7 m.
Since the primary focus of the study was to examine mobile crustaceans, allpolychaeta species samples were grouped, and the Shannon Index (H ′) (Shannon& Weaver, 1949) and Evenness (J ) Index (Pielou, 1966) were calculated for eachlocation.
RESULTS
Physical variables
The two innermost Locations (1 and 2) had more marked thermoclines andhigher temperature and salinity variations throughout the year compared to the

SUCTION SAMPLING IN NORWAY 189
other locations. According to the monthly measurements in 1998, the temperatureat the sampled locations varied between 1.8°C at 1 m depth and 1.1°C at 10 mdepth among the locations, both above and below the thermocline. Salinities at 1to 10 m depth for all locations were between 29.4 (Location 1) and 32.4 (Location6) in August, and above 31.3 in September. At Location 2, typical with less salinityand higher inter-location variety in surface water, surface salinity was down to 19.2after rainfall in August. The surface salinity at all other locations was above 24.8in August and all locations had a surface salinity above 27.4 in September. Thetemperature at 1 m depth went from approx. 13°C in July and September to apeak at 16.4°C in September. At 10 m depth the variations were from 11.7°C to14.7°C in the same time period. The thermocline moved from about 6 m to 10-11 m depth from July to September. Salinities in the surface varied. In both yearsthe majority of the samples was collected above the thermocline, in the warmerand less saline layer of the littoral zone. Even with annual and seasonal variations,the water temperature and salinity were within the normal range (Bakke & Sands,1977).
Suction sampling
A total of 68 sites (34 m2) were sampled with an average sampling efficiency of76.4% among all locations (table I).
Fauna samples
A total of 5276 animals across 72 species were sampled from the six locations,ranging from 1593 animals (245.1 ind/m2) to 229 animals (45.8 ind/m2) (Loca-tions 5 and 3, respectively) (table I). High numbers of Turritella sp. were found inhigh density at Location 5 and sporadic in Loc 6, and not any other locations. Thetotal density of specimens per m2 ranged from 6.0 at Location 5 to 9.5 at Loca-tion 2 (table I). Sixteen species (21%), including seven crustacean species (10%),were found at all locations (table II). Maximum richness was found at Location 4(46 specimens, table I). Across all locations the crustaceans dominated by numbers(2685), followed by polychaetes (873), echinoderms (367), and molluscs (263).
The decapods Athanas nitescens (Leach, 1813), Upogebia deltaura (Leach,1815), Galathea squamifera Leach, 1814, Pisidia longicornis (Linnaeus, 1767),Liocarcinus navigator (Herbst, 1794), Pandalina brevirostris (Rathke, 1843),and Pagurus bernhardus (Linnaeus, 1758) were found to be the most commoncrustaceans at all locations. The polychaetes Pherusa plumosa (O. F. Müller,1776), Glycera lapidum Quatrefages, 1866, Terebellides stroemi M. Sars, 1835,and Hilbigneris gracilis (Ehlers, 1868) were also found at all locations, while therarely seen polychaete Arenicolides ecaudata (Johnston, 1835) was sampled at

190 HALLDIS RINGVOLD, JOHN-ARVID GRYTNES & GRO I. VAN DER MEEREN
TA
BL
EI
Dat
e,de
pth,
num
bers
ofsa
mpl
est
atio
ns,a
ndar
easa
mpl
ed(m
2),
sam
plin
gef
ficie
ncy
(mea
n±
SD,%
)of
the
tota
lnu
mbe
rof
spec
imen
ssa
mpl
edin
the
first
oftw
osu
cces
sive
bout
sof
suct
ion
sam
ples
intw
ote
stsa
mpl
est
atio
ns,t
otal
num
bers
ofsp
ecim
ens
per
loca
tions
and
per
m2,s
peci
esdi
vers
ity:H
′ ,H
′ max
and
even
ness
(J)
Loc
atio
nD
ate
Dep
thSa
mpl
eSa
mpl
ing
Spec
imen
sSp
ecie
sSp
ecie
sE
venn
ess
(min
-max
,m)
stat
ions
effic
ienc
y(%
)di
vers
ity(J
)
Nos
.m
2M
ean
SDN
os.
m2
Tota
lpe
rm
2H
′H
′ max
123
Sept
embe
r19
977.
7-8.
612
6.0
830
138.
0043
7.17
2.67
53.
762
0.71
12
09Ja
nuar
y19
982.
0-7.
58
4.0
77.6
15.2
837
209.
2538
9.50
2.66
53.
636
0.73
33
14A
ugus
t199
82.
0-8.
010
5.0
63.9
15.3
229
45.8
037
7.40
3.05
3.60
90.
845
410
July
1997
8.5-
10.5
126.
061
.814
.695
015
8.33
467.
673.
021
3.82
90.
789
527
Aug
ust1
997
9.5-
10.7
136.
581
.822
.715
9324
5.08
396.
001.
468
4.02
20.
401
618
Sept
embe
r19
9711
.0-1
4.0
136.
585
.413
.084
012
9.23
436.
622.
904
3.66
10.
772
Ove
rall
2.0-
14.0
6834
74.1
16.1
652
7992
5.69
72
Loc
atio
ns:1
,Vin
nes;
2,O
s;3,
Tur
tels
vik;
4,L
angø
y;5,
Eid
holm
en;6
,Skå
røy.

SUCTION SAMPLING IN NORWAY 191
TA
BL
EII
Cla
ssifi
catio
nta
ble
for
alll
ocat
ions
and
over
all
Phyl
um/
Subp
hylu
mC
lass
Ord
er/
Infr
aord
erTa
xon
Aut
hori
tyL
ocat
ion
All
loca
tions
12
34
56
Cni
dari
aH
ydro
zoa
Hyd
rozo
ain
det.
01
01
00
2C
rust
acea
Mal
acos
trac
aA
mph
ipod
aA
mph
ipod
ain
det.
1412
559
02
020
0A
nom
ura
Gal
athe
adi
sper
saB
ate,
1859
023
013
374
101
331
Gal
athe
ain
term
edia
Lilj
ebor
g,18
5184
20
012
098
Gal
athe
asq
uam
ifer
aL
each
,181
424
185
2578
3091
433
Gal
athe
ast
rigo
sa(L
inna
eus,
1761
)0
80
1515
947
Pag
urus
bern
hard
us(L
inna
eus,
1758
)8
1111
635
1384
Pis
idia
long
icor
nis
(Lin
naeu
s,17
67)
1586
1131
2549
217
Bra
chyu
raE
bali
atu
mef
acta
(Mon
tagu
,180
8)1
00
00
01
Lio
carc
inus
navi
gato
r(H
erbs
t,17
94)
218
7616
2015
2336
8L
ioca
rcin
uspu
sill
us(L
each
,181
6)3
00
46
316
Mac
ropo
dia
rost
rata
(Lin
naeu
s,17
61)
147
00
13
25P
irim
ela
dent
icul
ata
(Mon
tagu
,180
8)0
02
00
02
Xan
tho
pili
pes
A.M
ilne-
Edw
ards
,186
70
290
24
843
Car
idea
Ath
anas
nite
scen
s(L
each
,181
3)44
506
674
2519
6C
arid
ion
gord
oni
(Spe
nce
Bat
e,18
58)
00
09
32
14H
ippo
lyte
vari
ans
Lea
ch,1
814
032
10
00
33P
anda
lina
brev
iros
tris
(Rat
hke,
1843
)15
181
1412
165
139
535
Geb
iidea
Upo
gebi
ade
ltaur
a(L
each
,181
5)2
34
155
1140
Isop
oda
Idot
eagr
anul
osa
Rat
hke,
1843
10
00
00
1M
ysid
aM
ysid
ain
det.
00
01
00
1C
rust
acea
Sum
med
up44
381
814
950
229
647
726
85E
chin
oder
mat
aA
ster
oide
aFo
rcip
ulat
ida
Ast
eria
sru
bens
Lin
naeu
s,17
5823
275
70
870
192 HALLDIS RINGVOLD, JOHN-ARVID GRYTNES & GRO I. VAN DER MEERENT
AB
LE
II(C
ontin
ued)
Phyl
um/
Subp
hylu
mC
lass
Ord
er/
Infr
aord
erTa
xon
Aut
hori
tyL
ocat
ion
All
loca
tions
12
34
56
Mar
thas
teri
asgl
acia
lis
(Lin
naeu
s,17
58)
00
11
07
9Pa
xillo
sida
Ast
rope
cten
irre
gula
ris
(Pen
nant
,177
7)2
00
00
02
Spin
ulos
ida
Hen
rici
ape
rfor
ata
grou
p(O
.F.M
ülle
r,17
76)
00
00
13
4H
enri
cia
pert
usa
grou
p(O
.F.M
ülle
r,17
76)
00
00
01
1E
chin
oide
aC
amar
odon
taE
chin
uses
cule
ntus
Lin
naeu
s,17
581
10
40
17
Cly
peas
teri
oda
Ech
inoc
yam
uspu
sill
us(O
.F.M
ülle
r,17
76)
10
03
00
4Ir
regu
lari
a(i
nfra
clas
s)Ir
r.E
chin
oide
ain
det.
01
521
2211
60H
olot
huro
idea
Apo
dida
Lep
tosy
napt
acf
.in
haer
ens
(O.F
.Mül
ler,
1776
)0
01
00
01
Oph
iuro
idea
Oph
iuri
daO
phio
com
ina
nigr
a(A
bild
gaar
d,in
O.F
.Mül
ler,
1789
)3
132
234
146
Oph
ioph
olis
acul
eata
(Lin
naeu
s,17
67)
01
130
429
65O
phiu
raal
bida
Forb
es,1
839
2711
3912
36
98E
chin
oder
mat
aSu
mm
edup
5754
5410
134
6736
7M
ollu
sca
Biv
alvi
aE
uhet
erod
onta
(inf
racl
ass)
Hia
tell
aar
ctic
a(L
inna
eus,
1767
)3
00
13
07
Lim
oida
Lim
asp
.0
00
01
01
Luc
hino
ida
Luc
inom
abo
real
is(L
inna
eus,
1767
)37
12
49
861
Myo
ida
Mya
aren
aria
Lin
naeu
s,17
580
00
01
12
Mya
trun
cata
Lin
naeu
s,17
580
03
20
16
Myt
iloid
aM
odio
lus
mod
iolu
s(L
inna
eus,
1758
)0
00
10
01
Myt
ilus
edul
isL
inna
eus,
1758
30
00
00
3Pe
cten
oida
Chl
amys
isla
ndic
a(O
.F.M
ülle
r,17
76)
10
00
00
1V
ener
oida
Cer
asto
derm
aed
ule
(Lin
naeu
s,17
58)
22
02
24
12

SUCTION SAMPLING IN NORWAY 193
TA
BL
EII
(Con
tinue
d)
Phyl
um/
Subp
hylu
mC
lass
Ord
er/
Infr
aord
erTa
xon
Aut
hori
tyL
ocat
ion
All
loca
tions
12
34
56
Ven
erid
aein
det.
60
10
00
7G
astr
opod
aC
aeno
gast
ropo
da(s
ubcl
ass)
Turr
itel
lasp
.0
00
011
3145
1179
Het
erob
ranc
hia
(sub
clas
s)O
pist
hobr
anch
iain
det.
10
00
00
1L
ittor
inim
orph
aTr
ivia
arct
ica
(Pul
tene
y,17
99)
10
00
26
9N
eoga
stro
poda
Buc
cinu
mun
datu
mL
inna
eus,
1758
00
19
156
31N
eriti
daE
uspi
rani
tida
(Don
ovan
,180
4)23
10
40
129
Tro
choi
dae
(fam
ily)
Gib
bula
cine
rari
a(L
inna
eus,
1758
)0
00
12
03
Poly
plac
opho
raP
olyp
laco
phor
ain
det.
127
327
733
89M
ollu
sca
Sum
med
up89
1110
5142
6026
3N
emat
oda
Nem
atod
ain
det.
63
117
91
37N
emer
tini
Ano
pla
Lin
eus
long
issi
mus
(Gun
neru
s,17
70)
62
02
27
19N
emer
tinii
ndet
.1
00
03
04
Ann
elid
aPo
lych
aeta
Err
antia
Aph
rodi
tifor
mia
Ale
ntia
gela
tino
sa(M
.Sar
s,18
35)
01
00
00
1E
unic
ida
Hilb
igne
ris
grac
ilis∗
(Ehl
ers,
1868
)2
15
14
114
Phyl
lodo
cida
Eum
ida
sang
uine
a(Ö
rste
d,18
43)
00
10
00
1G
lyce
rala
pidu
m∗
Qua
tref
ages
,186
633
106
187
276
Har
mot
hoe
frag
ilis
∗M
oore
,191
08
10
4537
113
204
Hyp
eret
eone
foli
osa∗
(Qua
tref
ages
,186
5)0
02
00
02
Kef
erst
eini
aci
rrat
a∗(K
efer
stei
n,18
62)
00
215
08
25N
epht
yspe
nte∗
Rai
ner,
1984
00
319
518
45N
erei
spe
lagi
ca∗
Lin
naeu
s,17
5816
621
23
20
194

194 HALLDIS RINGVOLD, JOHN-ARVID GRYTNES & GRO I. VAN DER MEEREN
TA
BL
EII
(Con
tinue
d)
Phyl
um/
Subp
hylu
mC
lass
Ord
er/
Infr
aord
erTa
xon
Aut
hori
tyL
ocat
ion
All
loca
tions
12
34
56
Phy
llod
oce
cf.g
roen
land
ica∗
Örs
ted,
1842
00
20
00
2Po
lych
aeta
Sede
ntar
iaA
reni
colid
ae(f
amily
)A
reni
coli
des
ecau
data
(Joh
nsto
n,18
35)
04
20
00
6Sa
belli
daO
wen
iafu
sifo
rmis
Del
leC
hiaj
e,18
440
00
240
024
Scol
ecid
aN
otom
astu
sla
teri
ceus
Sars
,185
10
00
31
04
Scal
ibre
gma
infla
tum
Rat
hke,
1843
30
10
02
6Sc
olop
los
arm
iger
(Mül
ler,
1776
)6
037
146
1477
Trav
isia
forb
esii
John
ston
,184
03
00
00
03
Spio
nida
Aon
ides
oxyc
epha
la(S
ars,
1862
)0
840
50
089
Mal
acoc
eros
fuli
gino
sa(C
lapa
rède
,187
0)0
10
00
01
Tere
belli
daC
irri
form
iate
ntac
ulat
a∗(M
onta
gu,1
808)
534
70
14
51Pe
ctin
aria
sp.
10
22
21
8P
heru
sapl
umos
a(M
ülle
r,17
76)
32
12
33
14Te
rebe
llide
sst
roem
iiSa
rs,1
835
33
14
114
26Po
lych
aeta
Sum
med
up23
316
274
155
7917
087
3Po
rife
raPo
rife
rain
det.
10
00
00
1Si
punc
ula
Sipu
ncul
idea
Gol
fingi
ida
Gol
fingi
avu
lgar
is(d
eB
lain
ville
,182
7)6
20
222
436
Uro
chor
data
Asc
idia
cea
Tun
icat
ain
det.
30
01
010
14Ph
yla
are
liste
dac
cord
ing
toN
iels
en(2
012)
.Spe
cies
wer
eco
llect
edat
six
dist
inct
loca
tions
inso
uthe
rnN
orw
ay.C
rust
acea
,Ech
inod
erm
ata,
Mol
lusc
a,an
dPo
lych
aeta
wer
ede
fined
tosp
ecie
sif
poss
ible
,whi
leot
herp
hyla
wer
em
ainl
ygr
oupe
das
“ind
et”.
Num
bers
ofsp
ecim
ens
are
sum
med
upfo
reac
hlo
catio
n,ea
chph
ylum
and
subp
hylu
mfo
rC
rust
acea
,and
over
all.
Taxa
inbo
ldfa
cein
dica
teta
xafo
und
inal
lsix
loca
tions
.Bol
dfac
enu
mbe
rsin
dica
tesp
ecie
sw
ithm
ore
than
30%
ofal
lspe
cim
ens
whe
resa
mpl
edin
one
ortw
olo
catio
ns.L
ocat
ions
:1,V
inne
s;2,
Os;
3,T
urte
lsvi
k;4,
Lan
gøy;
5,E
idho
lmen
;6,S
kårø
y.∗ T
hese
taxa
belo
ngto
grou
psw
ithse
vera
lsim
ilar-
look
ing
spec
ies
and
ther
em
ight
bem
ore
than
one
spec
ies
with
inth
ese
inth
esa
mpl
es.

SUCTION SAMPLING IN NORWAY 195
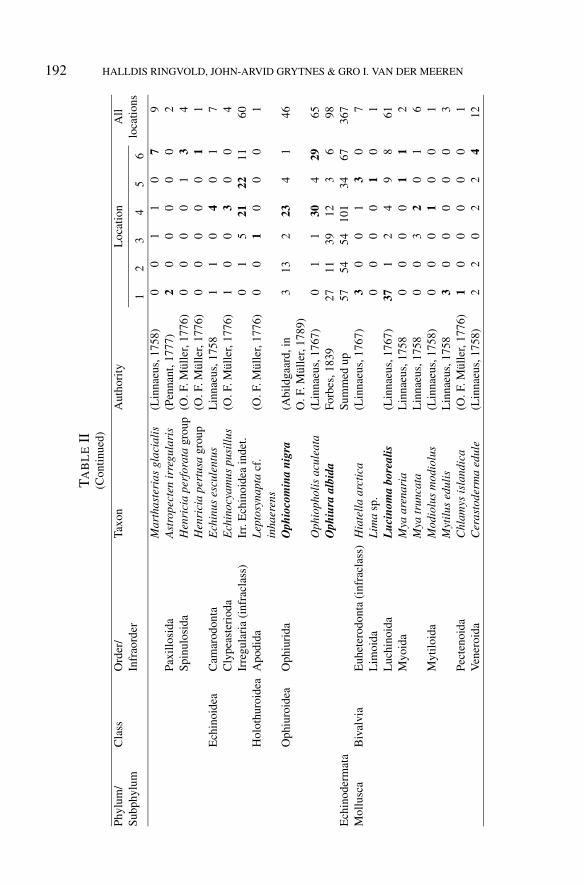
two locations (2 and 3). Both Sedentaria and Errantia polychaetes were sampled,including highly mobile phyllodicidan species like Nereis pelagica Linnaeus, 1758and Phyllodoce cf. groenlandica Örsted, 1842 (table II). Echinoderms, especiallyOphiuroidea, but also Asteroidea like Asterias rubens (Linnaeus, 1758) were foundin relatively high amounts at all stations (table II).
The Shannon Index (H ′) varied from 1.47 (Location 5) to 3.05 (Location 3). TheEvenness (J ) values were high at all locations (0.71 to 0.85) with the exception ofLocation 5 (0.40) (table I).
Ordination and diversity analyses
Dendrogramme outputs, based on the presence-absence data of species andstations, resulted in three main species clusters (clusters 1, 2, and 3) (fig. 3).Cluster 1 (Location 5) showed no similarity with the other clusters. Cluster 2and 3 were distinguished at approx. 30% similarity. Cluster 1 was dominated byTurritella sp. and Lima sp., while cluster 2 (Locations 1 and 3) was dominated byOphiura albida Forbes, 1839 and Amphipoda indet. Cluster 3 (Locations 2, 4, and6) was dominated by P. longicornis, Pandalina brevirostris (Rathke, 1843), and G.squamifera. Locations 2, 4, and 6 showed the highest in-site similarity (approx.85%), whereas Locations 1 and 3 showed approx. 60% similarity. A sequenceof four main species clusters (W, X, Y, and Z) were distinguished at approx.30% similarity, with W representing hyperbenthos and Crustacea, X Mollusca andCrustacea, Y a mix of taxa, and Z Mollusca and Crustacea, respectively.
A CA ordination plot indicated that the first axis explained 16% of the totalvariation in the species data set, while abiotic factors represented by the secondaxis explained 12% (fig. 4A). The CA clearly separated all sampling stations atLocation 5 along the first axis, indicating that Location 5 differs from the restdue to lower species variation. The other localities were less clearly separatedalong the second axis, indicating that although they do differ in several abioticvariables, these differences are not clear-cut. Regarding the CCA-plot, the variable“Location” alone explained 34% of the total inertia (2.17), i.e., the total variationin the data set (fig. 4B). CCA1 and CCA2 were not much lower than CA1 andCA2, indicating that the variables (location, depth, salinity, and temperature)included in the CCA explained a large part of the main variation in the speciescomposition. Maximum explained variation with all variables is 38%. Each of thevariables temperature, depth, and salinity explained 7, 8, and 8%, respectively.Total variation explained by salinity, depth, and temperature together was 16%.

196 HALLDIS RINGVOLD, JOHN-ARVID GRYTNES & GRO I. VAN DER MEEREN
Fig. 3. A two-way cluster analysis using PC-Ord (Version 6, Bray-Curtis Index and Group averageLinkage) was performed factoring in both stations and species based on presence-absence data. Allsamples were above 14 m, on cobble grounds with variation in currents, temperatures, and waveexposure, off the western Norwegian coast (Bray-Curtis with Group Average Linkage). The speciesand groups are listed in full in table II. Loc 5 is not clustered with any other locations with lowestspecies variation. Locations 2, 4, and 6 show highest in-site similarity (approx. 85%), whereaslocations 1 and 3 show approx. 60% similarity. The six locations are: Loc 1, Vinnes; Loc 2, Os;
Loc 3, Turtelsvik; Loc 4, Langøy; Loc 5, Eidholmen; Loc 6, Skårøy.
SUCTION SAMPLING IN NORWAY 197
DISCUSSION
Suction sampler: efficiency and limitations of the sampling method
While this study found that airlift suction sampling has high levels of samplingefficiency, it is limited to specific depths and substrate types. Based on the samplingundertaken in Norwegian waters we suggest that the optimal working depth rangeis 2 to 30 m. The primary advantage of this sampling technique is its ability tocatch, and thereby quantify, highly mobile crustacean species such as: Cancerpagurus Linnaeus, 1758, Liocarcinus navigator (Herbst, 1794), and Galathea sp.Notably, however, the technique was ineffective at capturing small fish speciessuch as gobiids (Gobiidae indet.) despite the fact that some species were observedat relatively high densities in some sites.
The efficiency of the sampler was highly dependent on the substrate type. Onenotable disadvantage with the suction sampler is that where the shell sand is largerthan the mesh size of the sampling bags, this substrate crushes much of the sampledepifauna in a relatively short period of time (Linnane et al., 2001). All the chosenNorwegian locations had a finer substrate and this problem was avoided. Theresults suggested that the highest sampling efficiency occurred on homogenousrock and multi layered cobble grounds, with low levels of silt and coarse particlesand few heavy rocks and boulders. Another sampling limitation was the angle ofthe substrate. Horizontal crevices were impossible to sample without modificationsof the sampling tube. The primary advantage of the technique lies in its ability tosample highly mobile invertebrates. While grabs and cores appear to be relativelyefficient on sand and gravel substrata (Flannagan, 1970), they are unlikely tocapture fast moving taxa. The results presented in this study indicate that suctionsampling was highly efficient at capturing a wide range of mobile invertebrates,especially crustaceans in mixed and cobble substrata, in habitats that wouldnormally be unsuited to traditional techniques such as cores, grabs, or nets.
Fauna samples
High densities of smaller decapod crustaceans, usually missing from grab-and core collections, were commonly collected. These included small Brachyura,various Anomura species, as well as the shrimp Athanas nitescens (Leach, 1813),along with other epifauna species. Interestingly, A. nitescens were previouslyregarded as one of the rarer species along the western Norwegian coast, with thelast record from the late 1800s (see Brattegard, 2001, for historic list). However,this study revealed that this well-camouflaged, rapid-swimming shrimp is actuallyvery common in cobble grounds within shallow coastal waters.
A total of 72 species were found, of which 71 have previously been describedin the Hordaland region (Brattegard, 2001). One polychaete species (Arenicolides

198 HALLDIS RINGVOLD, JOHN-ARVID GRYTNES & GRO I. VAN DER MEEREN
SUCTION SAMPLING IN NORWAY 199
ecaudata) was positively identified for the first time in the region (Ringvold et al.,1999).
Marine benthic macrofauna has previously been described from the nearbyFanafjorden using van Veen grab shots on soft bottoms (Lie, 1978). These studiesindicated that the Annelida were the dominating phylum with Polychaeta as thedominating class, followed by the phyla Mollusca, Arthropoda, represented bythe subphylum Crustacea, and Echinodermata. The fauna collected in this presentstudy were dominated by the Crustacea. Lie (1978) identified the difference inbenthic fauna composition between soft and hard bottoms, but suggested that suchdifferences were due to variations in sampling methods.
Although all sampling locations had a high proportion of cobble as the dominantsubstrate (>30%), only 21% of species were found at all locations. In many cases,more than 30% of one species was found within one or two locations, suggestingthat the presence of cobble alone cannot explain the variation among the locations.
The data in the present study revealed largest in-site cluster similarity betweenLocations 1 and 3 (mixtures of cobble in/on softer sediments), as well as Loca-tions 4 and 6 (cobble and boulders/pockets of sand), thus indicating that substratecould be of importance regarding species distribution. Since substrate was meantto be a common quality among the locations, it was not included in the ordina-tion analysis. Nonetheless, Location 2 (mixtures of cobble in/on softer sediments)clustered with Locations 4 and 6 showed a higher presence of hyperbenthos. Loca-tion 5 did not cluster with any other location, most probably due to the quantitativedominance of Turritella sp. (fig. 2). Four main species-clusters could also be de-tected (W, X, Y, and Z). No clear abiotic factors to explain the phenomenon wasfound but different taxa dominated in each cluster: W, hyperbenthos and Crustaceadomination; X, Mollusca and Crustacea domination; Y, mix of few taxa; and Z,Mollusca and Crustacea domination, respectively.
Moderate Shannon Index (H ′) values were found at five locations (3.05-2.67).The two innermost Locations (1 and 2), also with slightly higher temperature andsalinity variations throughout the year, showed a slight decline compared to theouter Locations 3, 4, and 6. The lower diversity at all these three locations was
Fig. 4. Ordination and diversity analysis. A, The relationship in species composition between thesix locations as shown by Correspondence Analysis (CA); Loc 1, Vinnes (grey dot); Loc 2, Os(black dot); Loc 3, Turtelsvik (grey diamond); Loc 4, Langøy (black square); Loc 5, Eidholmen(star); Loc 6, Skårøy (grey triangle). B, The relationship between the different samples along the twofirst axes of a Constrained Correspondence Analysis (CCA) with the constraining variables, depth,salinity, temperature, and locality. The three continuous variables are shown as lines (higher values ofthe variable in question in the direction of the line away from origin), whereas the nominal variables(locality) are shown as larger symbols at their average placement along the two axes. C, The species
optima along the same two axes as used in panel B.

200 HALLDIS RINGVOLD, JOHN-ARVID GRYTNES & GRO I. VAN DER MEEREN
mainly due to few dominating species. At Location 5, a low Shannon Index wascalculated (1.468), due to the dominance of Turritella sp. Evenness (J ) was highat all locations (except Location 5) (0.711-0.845). This indicates a relatively evenoccurrence of species among the sample stations within each location.
Ordination and diversity analyses
The gradient found in DCA analysis could to a high degree be explainedby the variables measured. Nonetheless, the variable “Location” explains mostof the variation in the current dataset (34%). The CA and CCA-plot supportsthe Two-way Cluster analysis. Location 5 is clearly separated from the otherlocations (fig. 4A-C). This is most likely due to the high amounts of the gastropodTurritella sp. which is found mainly at Location 5, except from one singlequadrat at Location 6. Locations 1 and 3, both bays with influx of ocean water,but also some water retention attributes, are relatively similar regarding speciescomposition. Similarities at both locations are the absence of Galathea dispersa,and the large amounts of Ophiura albida. Locations 4 and 6, being sampleddeeper than the rest and parts of the ocean-exposed Korsfjorden, are the mostsimilar locations regarding species composition (fig. 4), e.g., Galathea dispersa,Ophiopholis aculeata (Linnaeus, 1757), and Polyplacophora indet.
CONCLUSIONS
Airlift suction sampling is highly efficient at capturing and quantifying a widerange of invertebrate epifaunal species in cobble grounds, especially highly mobilecrustaceans (Linnane et al., 2003; Evans et al., 2013). The sampled animals werein general undamaged and alive, and in excellent condition for both taxonomicanalyses and behavioural experiments (Linnane et al., 2001; Mercer et al., 2001;van der Meeren, pers. obs., 2005). Ordination Analysis, based on location, depth,salinity, and temperature, was shown to separate locations in terms of speciescomposition. Variables like quantitative data on substrate composition, algae cover,current and wave patterns, as well as seasonal variation in physical variables, werenot included but could contribute to further explaining clustering variation withinand between the locations. Fauna collections sampled by the suction samplerare well suited for statistical analyses, allowing comparisons between specificlocations. While commonly applied in many areas along the North American coast,we recommend that suction sampling should also be used for benthic ecological,taxonomic and biodiversity surveillance studies in shallow waters also outsideNorth America.

SUCTION SAMPLING IN NORWAY 201
ACKNOWLEDGEMENTS
This research was funded by the European Community through the researchproject LEAR FAIR CT-1775-96 and by the Institute of Marine Research. Wewish to thank Eivind Oug at NIVA (Norwegian Institute for Water Research) whoidentified the Polychaeta, Mr. Eoin D. Browne, the University of Cork, Ireland, forassisting us through the summer of 1998, the co-divers Hannu Koponen and VidarWennevik for their efforts, the laboratory staff at Austevoll Research Station forthe salinity analyses, and senior engineer Kjell Bakkeplass at IMR for the map.We are also indebted to the two referees, whose comments and suggestions haveled to great improvements on the text and the figures. Dr. Adrian Linnane (PIRSA-SARDI, Australia) has been to tremendous help with language corrections andvaluable suggestions for the final version of the text.
REFERENCES
ASCHAN, M., 1988. Softbottom macrobenthos in a Baltic archipelago: spatial variation and optimalsampling strategy. Ann. Zool. Fennici, 25: 153-164.
BAKKE, J. L. W. & N. SANDS, 1977. Hydrographical studies of Korsfjorden, western Norway, inthe period 1972-1977. Sarsia, 63: 7-16.
BOUDREAU, B., Y. SIMARD & E. BOURGET, 1992. Influence of a thermocline on verticaldistribution and settlement of postlarvae of the American lobster (Homarus americanus Milne-Edwards). J. Exp. Mar. Biol. Ecol., 162: 35-49.
BRATTEGARD, T., 2001. Distribution of marine, benthic macroorganisms in Norway. A tabulatedcatalogue. Research Report 2001-3. Directorate for Nature Management. (Updated version ofDN 1997-1.)
DAHLE, S., G. STANISLAV, N. DENISENKO, V. DENISENKO & S. J. COCHRANE, 1998. Benthicfauna in the Pechora Sea. Sarsia, 83: 183-210.
EVANS, J., N. J. ATTRILL, J. A. BORG, P. A. COTTON & S. P. J. SCHEMBRI, 2013. Macrofaunaldiversity of infralittoral cobble beds in the Maltese Islands. Rapp. Comm. int. Mer Médit., 40:688.
FLANNAGAN, J. F., 1970. Efficiencies of various grabs and corers in sampling freshwater benthos.J. Fish. Res. Board Can., 27: 1691-1700.
INCZE, L. S. & R. A. WAHLE, 1991. Recruitment from pelagic to early benthic phase in lobstersHomarus americanus. Mar. Ecol. Prog. Ser., 79: 77-81.
JOSEFSON, A. B., 1985. Distribution of diversity and functional groups of marine benthic infaunain the Skagerrak (eastern North Sea) — can larval availability affect diversity? Sarsia, 70: 229-249.
LEPŠ, J. & P. ŠMILAUER, 2003. Multivariate analysis of ecological data using CANOCO. (Cam-bridge University Press, Cambridge).
LIE, U., 1978. The quantitative distribution of benthic macrofauna in Fanafjorden, western Norway.Sarsia, 63: 305-316.
LINNANE, A., B. BALL, J. P. MERCER, R. BROWNE, G. VAN DER MEEREN, H. RINGVOLD,C. BANNISTER, D. MAZZONI & B. MUNDAY, 2001. Searching for the early benthic phase(EBP) of the European lobster: a trans-European study of cobble fauna. Hydrobiologia, 465:63-72.

202 HALLDIS RINGVOLD, JOHN-ARVID GRYTNES & GRO I. VAN DER MEEREN
LINNANE, A., B. BALL, B. MUNDAY, R. BROWNE & J. P. MERCER, 2003. Faunal description ofan Irish Cobble Site using Airlift suction sampling. Biol. & Environ. Proc. of the Royal IrishAcad. 1/2003, 103: 41-48.
MERCER, J. P., R. C. A. BANNISTER, G. I. VAN DER MEEREN, V. DEBUSE, D. MAZZONI,S. LOVEWELL, R. BROWNE, A. LINNANE & B. BALL, 2001. An overview of the LEAR(Lobster Ecology and Recruitment) project: the results of field and experimental studies on thejuvenile ecology of Homarus gammarus in cobble. Mar. Fresh. Res., 52: 1291-1302.
NIELSEN, C., 2012. Animal evolution. Interrelationships of the living phyla (3rd ed.). (OxfordUniversity Press, Oxford).
OKSANEN, J., R. KINDT, P. LEGENDRE, P. O’HARE, G. L. SIMPSON, P. SOLYMOS, M. H. H.STEVENS & H. WAGNER, 2009. Vegan: community ecology package. R package version 1.15-3. (R Foundation for Statistical Computing, Vienna).
PERSSON, L.-E., 1983. Temporal variation in coastal macrobenthic community structure, Hanö Bay(S. Baltic). J. Exp. Mar. Biol. Ecol., 68: 277-293.
PIELOU, E. C., 1966. The measurement of species diversity in different types of biologicalcollections. J. Theor. Biol., 13: 131-144.
R DEVELOPMENT CORE TEAM, 2010. R: a language and environment for statistical computing.(R Foundation for Statistical Computing, Vienna).
RINGVOLD, H., G. I. VAN DER MEEREN & E. OUG, 1999. New records of Arenicolides ecaudata(Johnston) (Annelida, Polychaeta) from Norwegian waters. Sarsia, 85: 93-96.
SHANNON, C. E. & W. WEAVER, 1949. The mathematical theory of communication. (Universityof Illinois Press, Urbana, IL).
TUNBERG, B., 1981. Two bivalve communities in a shallow and sandy bottom in Raunefjorden,western Norway. Sarsia, 66: 257-266.
— —, 1982. Quantitative distribution of the macrofauna in a shallow, sandy bottom in Raunefjorden,western Norway. Sarsia, 67: 201-210.
WAHLE, R. A., K. M. CASTRO, O. TULLY & S. J. COBB, 2013. Homarus. In: B. PHILLIPS (ed.),Lobsters biology, aquaculture and fisheries: 221-258. (Wiley-Blackwell, Chichester).
First received 11 April 2014.Final version accepted 19 January 2015.