district: public plan
TRANSCRIPT

DISTRICT: Public Plan Needs Assessment for ESSER 3.0
NOTE:

Tennessee Department of Education • tn.gov/education
1
DISTRICT: Robertson County Schools Public Plan - Needs Assessment for ESSER 3.0 General Information
LEA Name Robertson County Schools Director of Schools Dr. Chris Causey
Address 800 M.S. Couts Blvd. Springfield, TN 37172
Phone # (615 ) 384-5588
Students & Enrollment
Mission & Vision Mission-To ensure each student is prepared to succeed in life. Vision- Robertson County Schools will enable all students to reach and exceed high academic standards while empowering them to succeed in a technologically advanced and culturally diverse society.
Grades Served PreK-12 # of Schools 25 Total Student Enrollment 13,803
Race
/ Et
hnic
ity American Indian/Alaska Native 1% Asian 1%
Black/African American 12% Hispanic 10%
Native Hawaiian/Pacific Islander <1% White 73%
Multiracial 4% Economically Disadvantaged 26% English learners 7%
Students with Disabilities 16% Foster <1%
Students Experiencing Homelessness 1% Students in Military Families 1%
Migrant <1% Students with High-Speed Internet at Home 90%
This needs assessment for ESSER 3.0 is built to be a summary of the major elements to consider in strategic planning for effective resource allocation for those funds. The department also encourages updates to ESSER 1.0 and 2.0 spending plans to align with needs as they are updated and developed. Local plans and those submitted through InformTN for the comprehensive district plans will likely be more detailed and thorough, with specific call-outs by individual school need. The state template is intended to provide the public with a data snapshot to inform community engagement related to the needs of the district that ESSER 3.0 dollars may support.

Remember that a needs assessment is to specifically name those areas where additional support, resources, or attention would positively benefit students. That requires the identification of areas to strengthen as a result of the pandemic. The needs assessment may also include areas that were already focus areas for the district that have been exacerbated as a result of the pandemic and where additional investment may be warranted or beneficial.
Tennessee Department of Education • tn.gov/education
2
ACADEMICS Topic Supporting Data and Notes Interpretation of Data and Identified Needs Kindergarten
50%+ School Year Remote
Provide information on any increase in the number of students whose “first time” experience in a formal school setting will be 2021-2022.
We only had 8 virtual kindergarten students, all at TNCA. The district only offered virtual instruction for elementary students through the first semester.
Instructional Days
Days In-Person
Total number of in-person days in the 2020-21 school year (number of days and percent of the year) for elementary, middle, and high schools in your district.
165
Days Virtual
Total number of virtual days in the 2020-21 school year (number of days and percent of the year) for elementary, middle, and high schools in your district.
Grade Band # Virtual Days 2020-21
Percent Virtual 2020-21
Elementary Schools 2 days 1.2% Middle Schools 7 days 4.2% High Schools 7 days 4.2%
Quarantine Closures
Summarize the number of days or weeks schools were closed due to quarantine and how that varied across the district. Differentiate between elementary, middle, and high schools and only provide summaries in the context of broad impact (number of students impacted, on average).
Most schools in our district were not impacted by quarantine to the point of closure during the 2020-2021 school year. Springfield Middle School (approximately 750 students) closed for 7 days at the end of the first semester. Springfield High School (approximately 1200 students) closed for 7 days as well. Both closures were due to the high quarantine rate of students and staff as required through contact tracing protocols in place at the time. During the closure, virtual instruction was provided for all classes.
Additional Impacts on Instructional Time
Summarize any other significant impacts on instructional time (more than 5 days). Examples may include: staffing shortages, weather or natural disasters, technology access or issues, etc.
The majority of the schools in our district were not impacted to the point of closure during the 2020-2021 school year.
Overall Impact Summarize engagement in virtual instruction, by grade band. This should include the academic and relational experience during the 2020-21 school year.
Initially, approximately 25% of our student body chose the virtual option allowing adequate space for in-person instruction during the first semester of the school year. Parents were given the opportunity to change from the virtual option to the face-to-face option every nine weeks and many families decided to return to face-to-face instruction within the first two nine-week periods of the 2020 school year. Pre-K through fifth grade students were able to attend in person for learning during the entire school year except for two days prior to Winter Break when the entire system went virtual due to rising Covid rates. Elementary families were given the opportunity to select a virtual or in person option every nine weeks. Most elementary students returned to in person instruction by the second quarter. Middle and High School families were also given the option to attend in person or virtually each nine-week period. Following, the second nine-week period, due to the increased enrollment, the district experienced difficulties maintaining social distancing and cases were beginning to rise district-wide. All grade levels went virtual two days prior to the Winter Break. By January 2021, due to rising Covid infection rates, the decision was made for grades six through twelve to attend school using a hybrid model during the third term of the school year. Starting in mid-February through the end of March, the Robertson County Health Department began rolling out the Covid vaccinations to district staff. By the fourth term, all students were back in class for face-to-face learning.

Remember that a needs assessment is to specifically name those areas where additional support, resources, or attention would positively benefit students. That requires the identification of areas to strengthen as a result of the pandemic. The needs assessment may also include areas that were already focus areas for the district that have been exacerbated as a result of the pandemic and where additional investment may be warranted or beneficial.
Tennessee Department of Education • tn.gov/education
3
ACADEMICS-CONTINUED Topic Supporting Data and Notes Interpretation of Data and Identified Needs Overall Impact (Continued)
Summarize engagement in virtual instruction, by grade band. This should include the academic and relational experience during the 2020-21 school year.
The return to in person instruction was attributed to difficulties many of our families experienced with supporting their children with the online platform, assisting students who required academic accommodations, and lack of adequate childcare so that parents could return to work. The district, experienced reduced student engagement and attendance during the 2020-21 school year due to changing schedules, uncertainty, and virtual and hybrid learning. This caused many of our most at-risk students to suffer learning loss and fall further behind. A great need exists for programs of remediation, redelivery, extra time, and support as life returns to normal. Students with disabilities and other special populations were disproportionately impacted because of the many scheduling and routine changes that were required to adapt to during hybrid and virtual instruction. Teachers attempted to mitigate these concerns by collaborating with families to help with the changes and transitions. Additionally, our music programming experienced declining enrollment. Our band programs system-wide experienced a drop in enrollment by 24%. Learning loss, in band and choral music classes, occurred due to member quarantines and lost group rehearsal time. Performances were reduced and band students lost leadership training opportunities.
As the district shifted to remote learning in March of 2020, and a hybrid learning model for middle and high school students during the third term in 2021, teachers expressed the need for support in providing high-quality remote instruction. As a result, the district began considering moving the 1:1 initiative down through the 6th grade. Additional support is needed to maintain and support classroom technology and the district network. During the 2021 school year, the use of online textbooks was identified as a need due to the increased use of mobile devices. The increase in online learning created a demand for online access to textbooks. Online texts and materials will assist the district in meeting student needs as we continue to navigate the pandemic.

Remember that a needs assessment is to specifically name those areas where additional support, resources, or attention would positively benefit students. That requires the identification of areas to strengthen as a result of the pandemic. The needs assessment may also include areas that were already focus areas for the district that have been exacerbated as a result of the pandemic and where additional investment may be warranted or beneficial.
Tennessee Department of Education • tn.gov/education
4
Student Achievement, Instructional Materials and Interventions Benchmark Data
Provide the district average for beginning, middle, and end-of-year diagnostic/screener data comparisons. Provide overall data as well as by student group.
ELEMENTARY ELA DATA- Analysis of running records in January 2021 show second-grade running record data averaging .3 to .8 levels above the mid-year recommended level of proficiency. Sight word data from January 2021 shows second-grade students fluently reading 184 out of 220 words from the Dolch Sight Word list. The ELA universal screener data (winter 2021) indicates that 28 percent of elementary students in grades kindergarten through fifth grades scored below the 25th percentile, an increase in performance of seven percentage points from 2020 (35%). In a review of the most recent TNReady results, the percentage of second-grade students at each performance level met or exceeded the state average in six out of eight reporting categories. The percent of students in grades three through five scoring On-Track or Mastered in ELA decreased slightly from 30.7 percent in 2017-2018 to 30.4 percent in 2018-2019. On-Track or Mastered percentages increased in most student groups, with English Language Learners improving by 5.2 percentage points. Students in the Super Subgroup and Students with Disabilities showed decreases of 0.3 and 0.8 respectively. Forty-four percent of all students in grades three through five scored in the Approaching performance level (Level 2), highlighting the urgent need for improving Tier I instruction. The overall TVAAS composite for grades four and five landed at 2.63, a significant change from -4.70 in 2017-2018. However, the third grade ELA growth composite of -1.39 poses a challenge. ELEMENTARY MATH DATA- Though well below the target for proficiency, student results in mathematics showed improvement from the previous school year. Spring 2021 benchmark results show: • 2nd Grade Students- 65 percent performing at or above grade level an increase of 16 percentage
points from the fall benchmark (49%). • 3rd Grade Students-62 percent performing at or above grade level an increase of 5 percentage points
from the fall benchmark (57%). • 4th Grade Students- 57 percent performing at or above grade level an increase of 1 percentage point
from the fall benchmark (56%). • 5th Grade Students- 38 percent performing at or above grade level a decrease of 9 percentage points
from the fall benchmark (47%). The mathematics universal screener (easyCBM) indicated that 24 percent of students in kindergarten through fifth grade scored below the 25th percentile in winter 2021, an increase of eleven percentage points from 2020 (35%). In a review of TNReady results, the percentage of all students in grades three through five scoring On-Track or Mastered in mathematics increased from 32.2% in 2017-2018 to 36.5% in 2018-2019, an improvement of 4.3 percentage points. The On-Track or Mastered percentages for each student group increased as well: Black/Hispanic/Native American Students (from 19.0% to 22.7%), Economically Disadvantaged Students (from 19.6% to 23.5%), English Language Learners (from 17.9% to 22.1%), Students in the Super Subgroup (from 21.0% to 24.1%), and Students with Disabilities (13.7% to 17.1%). The overall TVAAS composite score for grades four and five was 2.63, a significant change from -4.70 in 2017-2018. While these improvements are celebrated, much work is still needed. Students in grades two, three, four, and five performed below the state in all areas except for second grade measurement concepts. Additionally, 31 to 35 percent of students in each of grades two through five scored in the Approaching performance level (Level 2) and the third-grade growth composite in math is -4.03, highlighting the urgent need for improving Tier I instruction and targeting skill deficits in math.

Remember that a needs assessment is to specifically name those areas where additional support, resources, or attention would positively benefit students. That requires the identification of areas to strengthen as a result of the pandemic. The needs assessment may also include areas that were already focus areas for the district that have been exacerbated as a result of the pandemic and where additional investment may be warranted or beneficial.
Tennessee Department of Education • tn.gov/education
5
Benchmark Data (Continued)
Provide the district average for beginning, middle, and end-of-year diagnostic/screener data comparisons. Provide overall data as well as by student group. (Continued)
MIDDLE ELA DATA- It was the district's first year using the CKLA Amplify ELA materials, and we opted to use the series benchmark assessments. Benchmark scores were not submitted to the district. The ELA universal screener data (winter 2021) indicates that 19 percent of middle school students in grades six through eight scored below the 25th percentile, an increase in performance of ten percentage points from 2020 (29%). The percent of students in grades 6-8 scoring On-Track or Mastered in ELA increased from 27.2 percent in 2017-2018 to 28.7% in 2018-2019. This is an increase of 1.5 percent of all students. Additionally, when analyzing student groups, there was an increase of On-Track and Mastered in the Black/Hispanic/Native American Student Group (from 16% to 17.7%), English Language Learners (from 6.1% to 11.3%), and Students with Disabilities (from 7.1% to 9.1%), and Economically Disadvantaged Students (from 14.4% to 17.9%). In addition, the Students in the Super Subgroup increased from 15.6% to 18.3%. While the increases are promising, all subgroups continue to score significantly below the All-Students group. Furthermore, the number of students represented in these performance levels must increase at a greater rate. MIDDLE MATH DATA- Spring 2021 benchmark results show: • 6th Grade Students- 39 percent performing at or above grade level a decrease of 6
percentage points from the fall benchmark (45%). • 7th Grade Students-31 percent performing at or above grade level a decrease of 28
percentage points from the fall benchmark (59%). • 8th Grade Students Math Benchmark- 38 percent performing at or above grade level a
decrease of 5 percentage points from the fall benchmark (43%). • 8th Grade Students Algebra Benchmark-73 percent performing at or above grade level a
decrease of 6 percentage points from the fall benchmark (67%). The Math universal screener data (winter 2021) indicates that 27 percent of middle school students in grades six through eight scored below the 25th percentile, a decrease in performance of two percentage points from 2020 (25%). The percent of students in grades 6-8 scoring On-Track or Mastered in Math increased from 28.8% in 2017-2018 to 34.2% in 2018-2019. This is an increase of 5.4% of all students. When analyzing student groups, there was an increase of On-Track and Mastered in all groups except Students with Disabilities Student Group (9.3% to 8.9%). An intentional focus on improving academic outcomes for students in subgroups was centered around training teachers and staff on the challenges of poverty. Examples of training include Poverty Simulation, Restorative Practices, and Grading Practices. It is apparent that this training has had a positive effect evidenced by the increase of students scoring On-Track and Mastered in the Economically Disadvantaged Student Group (from 17.7% in 2017-2018 to 19.7% in 2018-2019), the Black/Hispanic/Native American Student Group (from 15.1% in 2017-2018 to 20.4% in 2018-2019), the English Language Learner Group (from 11.7% in 2017-2018 to 12.1% in 2018-2019). While the increases are promising, all subgroups continue to score significantly below the All-Students group. Additionally, benchmark data from the 2020-21 school year indicate that learning was lost at all grade levels in mathematics between the fall and spring benchmark assessments.

Remember that a needs assessment is to specifically name those areas where additional support, resources, or attention would positively benefit students. That requires the identification of areas to strengthen as a result of the pandemic. The needs assessment may also include areas that were already focus areas for the district that have been exacerbated as a result of the pandemic and where additional investment may be warranted or beneficial.
Tennessee Department of Education • tn.gov/education
6
Benchmark Data (Continued)
Provide the district average for beginning, middle, and end-of-year diagnostic/screener data comparisons. Provide overall data as well as by student group. (Continued)
HIGH SCHOOL ELA DATA- The only high school to administer the SchoolNet benchmark data was Springfield high school due to their ATSI designation. Spring ELA benchmark data show that in English 1 28% of students were proficient, in English 2 17% of students were proficient. All subgroup categories scored below 5% proficiency indicating that much learning was lost during the school year. The district will implement SchoolNet benchmarking in all high schools during the 2021-22 school year. Several subgroups made laudable gains in the on-track or mastered metric in ELA--All students grew from 25.8% to 31.9% (+6.1%), the BHN subgroup grew from 10% to 17.1% (+7.1), the ED subgroup grew from 14.1% to 15.2% (+1.1%), and the Super subgroup grew from 12.5% to 15.9% (+3.4%). At the same time, we must note decreases in both the ELL subgroup and the SWD. Especially concerning are our EL students, where we note a 0% OTM rate for the last school year. In examining the overall performance data, while we are pleased with the growth, we must acknowledge that the percentage of students failing the assessment is 68%; at the same time, 56% of students are in the approaching category, close to achieving success. HIGH SCHOOL MATH DATA- The only high school to administer the SchoolNet benchmark data was Springfield high school due to their ATSI designation. Spring Math benchmark data show that in Algebra 1 0% of students were proficient, in Algebra 2 2% of students were proficient, and in Geometry 23% of students were proficient. All subgroup categories scored below 4% proficiency indicating that much learning was lost during the school year. The district will implement SchoolNet benchmarking in all high schools during the 2021-22 school year. Several subgroups made laudable gains in the on-track or mastered metric in Mathematics -- All students grew from 22.8% to 26.1% (+3.3%), the BHN subgroup grew from 11.1% to 14.4% (+3.3%), the ED subgroup grew from 10.8% to 13% (+2.2%), the EL subgroup grew from 2.4% to 4% (+1.6%), and the Super subgroup grew from 11.5% to 13.3% (+1.8%). At the same time, we must note a decrease in the SWD subgroup which fell from 6% to 2.3% (-3.7). When looking at proficiency rates, we note an overall failure rate of 73.8%. While the growth in our subgroup performance is laudable, a 74% failure rate points to a major failure of Tier 1 instruction.
Literacy Summarize the impact of early reading compared to previous years. Provide overall data as well as by student group.
A review of the district's early literacy data shows a need to grow better readers. First through second-grade district-level reading assessments in January 2021 include running record data that reported students averaging .3 to .8 levels above the mid-year recommended level of proficiency. Sight word data from January 2021 shows second-grade students fluently reading 184 out of 220 words from the Dolch Sight Word list. Most alarming, universal screener data (winter 2021) indicates that 35 percent of students in grades kindergarten through second grades are scoring below the 25th percentile. In a review of the most recent TNReady results, the percentage of second-grade students at each performance level met or exceeded the state average in six out of eight reporting categories.

Remember that a needs assessment is to specifically name those areas where additional support, resources, or attention would positively benefit students. That requires the identification of areas to strengthen as a result of the pandemic. The needs assessment may also include areas that were already focus areas for the district that have been exacerbated as a result of the pandemic and where additional investment may be warranted or beneficial.
Tennessee Department of Education • tn.gov/education
7
Interventions (Above and Beyond RTI)
Summarize any proactive interventions included in 2020-21 to address potential concerns, as applicable.
The district implemented activities to align curriculum, instruction, and assessment for optimizing student learning. These activities included pacing guides aligned with state standards, increased walkthroughs, the implementation of SchoolNet benchmarks in grades 3-8, professional learning communities and principal meetings focused on strengthening Tier I instruction, and professional development designed to help teachers create tasks aligned to the rigor of the standards. These activities were designed to address school and district achievement issues. Additionally, the district implemented a systemwide after-school program in 2020-2021 that provided instruction to reduce skills gaps, intervention, and credit recovery. Every school in district hosted an after-school program that targeted “school-dependent” students.
School Activities and Enrichment
Summarize any impacts on enrichment programs, school activities, etc. during the 2020-21 school year.
The district saw a drop in participation and attendance in enrichment and after-school activities during the 2020-21 school year. This was especially detrimental to the many school-dependent students that we serve throughout Robertson County. Our music programming experienced declining enrollment. Our band programs system-wide experienced a drop in enrollment by 24%. Learning loss, in band, occurred due to member quarantines and lost group rehearsal time. Performances were reduced and band students lost leadership training opportunities.
ACT
Summarize ACT data for your district (participation and outcomes) compared to previous years. Provide overall data and by student group.
District Name School Name 2020 Average Composite Score
2019 Average Composite Score
Robertson County East Robertson High School 18.5 19.2 Robertson County Greenbrier High School 19.7 19.7 Robertson County Jo Byrns High School 19.2 19.5 Robertson County Robertson Co. Virtual School 21.4 *
Robertson County Robertson County Alternative Learning Center 15.9 14.7
Robertson County Springfield High School 18.9 18.3
Robertson County Tennessee Connections Academy 9-12 19.2
Robertson County White House Heritage High School 21.5 21.3
When reviewing the ACT data, the district scores fall behind the state average in all measures except mathematics, where we have experienced growth over the prior year. In fact, our scores have increased in the composite measure, the ELA measure, and the mathematics measure. At the same time, we note that our subgroup scores have fallen behind the state in all categories. In examination of the root cause, the large-scale interruption during the past year has impacted student academic performance. Many ACT testing centers closed during the pandemic interrupting the typical schedule followed by RCS junior year students. These closings and schedule changes impacted ACT participation and performance. Based on 2020 data, 37.5% of students met the college readiness benchmark compared to 40.3% in comparable districts. It does, however, represent an increase over our previous year's performance (33%). Additionally, our individual subgroup performance falls behind the “All Students” performance.

Remember that a needs assessment is to specifically name those areas where additional support, resources, or attention would positively benefit students. That requires the identification of areas to strengthen as a result of the pandemic. The needs assessment may also include areas that were already focus areas for the district that have been exacerbated as a result of the pandemic and where additional investment may be warranted or beneficial.
Tennessee Department of Education • tn.gov/education
8
STUDENT READINESS Topic Supporting Data and Notes Interpretation of Data and Identified Needs
Transitions and Pathways
Transitions into Middle School
Summarize challenges for students new to middle school during the 2020-21 school year.
The district facilitates student transitions from grade band to grade band through multiple efforts. On the student level, school visits and special program reviews are arranged for incoming students during the school day. These visits are designed to prepare and help students adjust to their new learning environment, routines, and structure. This year, these activities happened virtually which didn’t allow for the connection, and spontaneity that typically occurs with the face-to-face event. The method for assessing academic aptitude, and interests had to be modified as well. Additionally, all sixth-grade students will be rezoned in the fall of 2021. Four meetings were held throughout the district to provide information and allow for public comment, unfortunately, these meetings were not well attended. All students served under the special education umbrella had IEP team meetings specifically designed to address the transition. These meeting occurred as they typically have in the past and provided a highly focused, individualized transition experience to assist these students in changing settings as smoothly as possible. Additional options for communicating transition information are being developed along with an exploration of student summer programming.
Transitions from Middle School
Summarize challenges related to students who are leaving middle school in Spring 2021.
The district typically facilitates school visits and special program reviews are arranged for incoming students during the school day. These visits are designed to prepare and help students adjust to their new learning environment, routines, and structure. This year, some of these activities happened virtually which didn’t allow for the connection, and spontaneity that typically occurs with the face-to-face event. Students transitioning to the high school attend special program meetings which are scheduled to provide families with options available to students (e.g., magnet program, scholarship availability, CTE opportunities, high school course requirements, dual enrollment, college collaborative, AP). Due to the pandemic, these meetings were not as well attended as in past school years. Teachers and administrators facilitated some vertical planning sessions to ensure a smooth transition from school to school.
Transitions into High School
Summarize challenges for students new to high school during the 2020-21 school year.
The main challenge was that of acclimating students to the various types of learning the year called for such as getting accustomed to the fully online model, adapting to Microsoft Teams instruction, and shifting to hybrid learning model during the third quarter. The large-scale interruption during the past year impacted student academic performance on the ACT. Many ACT testing centers closed during the pandemic interrupting the typical schedule followed by RCS junior year students. These closings and schedule changes impacted ACT participation and performance. As a district, we will work to strengthen high school transitional pathways to increase student ACT participation in the junior year of high school and the number of “ready graduates” overall in Robertson County.
Remember that a needs assessment is to specifically name those areas where additional support, resources, or attention would positively benefit students. That requires the identification of areas to strengthen as a result of the pandemic. The needs assessment may also include areas that were already focus areas for the district that have been exacerbated as a result of the pandemic and where additional investment may be warranted or beneficial.
Tennessee Department of Education • tn.gov/education
9
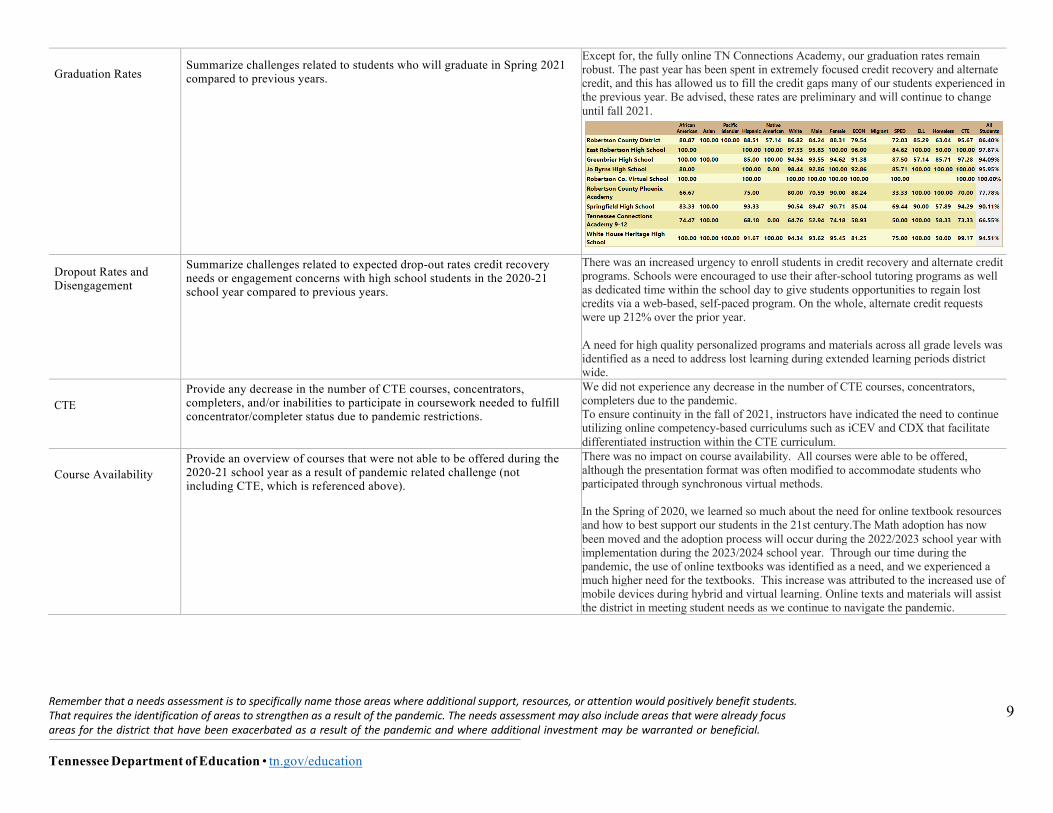
Graduation Rates
Summarize challenges related to students who will graduate in Spring 2021 compared to previous years.
Except for, the fully online TN Connections Academy, our graduation rates remain robust. The past year has been spent in extremely focused credit recovery and alternate credit, and this has allowed us to fill the credit gaps many of our students experienced in the previous year. Be advised, these rates are preliminary and will continue to change until fall 2021.
Dropout Rates and Disengagement
Summarize challenges related to expected drop-out rates credit recovery needs or engagement concerns with high school students in the 2020-21 school year compared to previous years.
There was an increased urgency to enroll students in credit recovery and alternate credit programs. Schools were encouraged to use their after-school tutoring programs as well as dedicated time within the school day to give students opportunities to regain lost credits via a web-based, self-paced program. On the whole, alternate credit requests were up 212% over the prior year. A need for high quality personalized programs and materials across all grade levels was identified as a need to address lost learning during extended learning periods district wide.
CTE
Provide any decrease in the number of CTE courses, concentrators, completers, and/or inabilities to participate in coursework needed to fulfill concentrator/completer status due to pandemic restrictions.
We did not experience any decrease in the number of CTE courses, concentrators, completers due to the pandemic. To ensure continuity in the fall of 2021, instructors have indicated the need to continue utilizing online competency-based curriculums such as iCEV and CDX that facilitate differentiated instruction within the CTE curriculum.
Course Availability
Provide an overview of courses that were not able to be offered during the 2020-21 school year as a result of pandemic related challenge (not including CTE, which is referenced above).
There was no impact on course availability. All courses were able to be offered, although the presentation format was often modified to accommodate students who participated through synchronous virtual methods. In the Spring of 2020, we learned so much about the need for online textbook resources and how to best support our students in the 21st century.The Math adoption has now been moved and the adoption process will occur during the 2022/2023 school year with implementation during the 2023/2024 school year. Through our time during the pandemic, the use of online textbooks was identified as a need, and we experienced a much higher need for the textbooks. This increase was attributed to the increased use of mobile devices during hybrid and virtual learning. Online texts and materials will assist the district in meeting student needs as we continue to navigate the pandemic.

Remember that a needs assessment is to specifically name those areas where additional support, resources, or attention would positively benefit students. That requires the identification of areas to strengthen as a result of the pandemic. The needs assessment may also include areas that were already focus areas for the district that have been exacerbated as a result of the pandemic and where additional investment may be warranted or beneficial.
Tennessee Department of Education • tn.gov/education
10
Special Populations and Mental Health
Special Populations
Summarize challenges related to supporting students with disabilities, English learners, students experiencing homelessness, students in foster care, migrant students, and economically disadvantaged students during the 2020-21 school year.
Robertson County School district has seen a significant impact on students with disabilities and other special populations brought about by the Covid pandemic. Many students experienced learning loss beyond that of their peers as parents struggled to engage students with the necessary interventions to encourage learning. Teachers struggled to serve their students in a virtual environment as these students required accommodations and modifications in the virtual environment. Many students were accustomed to receiving gestural or physical prompting to re-engage them during learning and this was difficult within the remote and hybrid settings. Although this population of students was provided with accommodations and modifications such as built-in breaks, teacher redirection, and extended time to complete lessons. Teachers who were not within physical proximity of their students witnessed that these students seemed to struggle more to attend to task and complete work. The hybrid environment created difficulty for these students who required additional structure and routine and have difficulty adapting to the change. Student attendance and assignment completion decreased during virtual days as engaging in online learning became overwhelming. Teachers struggled with utilizing online learning to connect with their students. Many teachers leaned into the requirements of the virtual and hybrid model but reported feeling overwhelmed trying to engage the student population. The addition of effective instructional strategies, materials, and well-trained staff (including educational assistants) to meet the needs of underrepresented student subgroups and intervention materials for students with skill deficits will assist in mitigating learning loss. Learning loss and remediation programs will play a large role in regaining the ground that was lost during the Covid pandemic. The math consultant hired to work with Springfield High School teachers on its ATSI designation identified graphing calculators as a need for their “at risk” students.
Mental Health, Behavioral and Other Supports, Interventions and Staffing
Summarize challenges related to mental and behavioral health. As applicable, include limitations related to observation and interaction with student in the virtual learning environment.
Robertson County School District recognizes a need for the development of a plan to assist in addressing disciplinary practices that cause students in certain subgroups to be excluded from access to their Tier I instruction. Even though the subgroup students with disabilities had a decrease of 9.0%, it was still the largest identified subgroup for discipline infractions. As the district has seen a steady decrease over the past 3 years in both ISS and OSS disciplinary actions for students with disabilities, we still rank well above the state average across all districts. While the district notes the decrease in overall numbers for the subgroup of students with disabilities, it does acknowledge the continued need for improvement. Providing additional mental health services and support personnel through an expansion of Phoenix Academy (which serves as our district alternative learning center) would allow for an expansion of the restorative practice model which could be utilized to reduce the impact from the ACEs (Adverse Childhood Experiences) that many of our students have experienced. 34.8% of stakeholders responding to our community feedback survey ranked providing keeping students and staff healthy and in school as the most important expenditure for reopening safely and remaining open. 17.3% of respondents ranked creating a district health and wellness location as the most important component of our health and safety plan. Mental health services and supports could also be offered through an onsite district health clinic.

Remember that a needs assessment is to specifically name those areas where additional support, resources, or attention would positively benefit students. That requires the identification of areas to strengthen as a result of the pandemic. The needs assessment may also include areas that were already focus areas for the district that have been exacerbated as a result of the pandemic and where additional investment may be warranted or beneficial.
Tennessee Department of Education • tn.gov/education
11
Special Populations and Mental Health-CONTINUED School Nurses Summarize challenges related to shortages or limitations in school nurses While we had nurses available in every school building, the time spent contact tracing during
the 2020-21 school year became overwhelming and left little time for nurses to attend to daily responsibilities. Therefore, demonstrating the need for an additional floating nurse to assist with contact tracing, implementation of Covid protocols, and coordination with the local health department.
EDUCATORS Topic Supporting Data and Notes Interpretation of Data and Identified Needs
Staff Retirements Summarize differences in the number of staff retirements during the 2020-21 school year as compared to previous years. Please differentiate between instructional staff and other staff.
Certified staff retirements for 2020 – 2021 were 15 compared to the 2019 – 2020 school year which had no personnel report in the months of April and May due to COVID and 13 retired. The previous year, 2018 – 2019, 20 retired.
Classified staff retirements for 2020 – 2021 were 34 compared to the 2019 – 2020 school year which had no personnel report in the months of April and May due to COVID and 22 retired. The previous year, 2018 – 2019, 13 retired.
Staff Resignations Summarize differences in the number of staff resignations which occurred during the 2020-21 school year as compared to previous years. Please differentiate between instructional staff and other staff.
Certified staff resignations for 2020 – 2021 were 89 compared to the 2019 – 2020 school year which had no personnel report in the months of April and May due to COVID and 75 resigned. The previous year, 2018 – 2019, 83 resigned.
Classified staff resignations for 2020 – 2021 were 57 compared to the 20219 – 2020 school year which had no personnel report in the months of April and May due to COVID and 34 resigned. The previous year, 2028 – 2019, 41 resigned.
Extended Quarantines Provide the number and percent of instructional staff and non- instructional staff who faced more than two quarantine periods (10 days or longer).
Ninety-five total employees reported facing 10 or more days of quarantine in 2020 through March 31, 2021. Approximately one-third of the 95 were classified employees.
Classroom Vacancies Provide the total vacancies for the teacher of record in the district during the 2020-21 school year.
There were seven classroom vacancies for teachers of record in the 2020 – 2021 school year.
Other Vacancies Summarize any other critical vacancies that impacted the district during the 2020-21 school year.
As stated above in the Special Populations section of this assessment, the addition of effective instructional strategies, materials, and well-trained staff (to include contract consultants, and educational assistants) to meet the needs of underrepresented student subgroups and intervention materials for students with skill deficits will assist in mitigating learning loss. Learning loss and remediation programs will play a large role in regaining the ground that was lost during the Covid pandemic. Additionally, providing additional mental health services and support personnel through an expansion of Phoenix Academy would allow for an expansion of the restorative practice model. The challenges of changing regulations and compliance with State and Federal mandates revealed the need for employees who would be responsible for compliance involving changing emergency funding and protocols as well as overseeing federal compliance with facilities projects.
Remember that a needs assessment is to specifically name those areas where additional support, resources, or attention would positively benefit students. That requires the identification of areas to strengthen as a result of the pandemic. The needs assessment may also include areas that were already focus areas for the district that have been exacerbated as a result of the pandemic and where additional investment may be warranted or beneficial.
Tennessee Department of Education • tn.gov/education
12
OTHER CONSIDERATIONS Topic Supporting Data and Notes Interpretation of Data and Identified Needs
Access to Technology
Provide the percent of time when students learning in a virtual environment did not have consistent access to a device. Provide this information for elementary, middle, and high school grade bands.
Identified students participating in the virtual environment had access to Verizon Hotspots prior to the beginning of instruction at all grade levels. The pandemic revealed issues of equity which were particularly evident regarding technology access. There was tremendous variance in families related to access to devices and access to Internet. Variability was also found in teachers' abilities to utilize technology to provide continued learning opportunities and in families' abilities to assist students. These needs were directly related to the focus areas Planning for Long Term Closures and Education Technology in ESSER 1.0. Allowable expenditures in these areas include training related to distance learning, Wi-Fi support / Internet access, software for expanding student learning opportunities, and technology infrastructure, including devices and equipment for students and teachers. These areas were a primary focus of the district application. For the 2021-2022 school year, the district plans to move the 1:1 initiative down through the 6th grade. Additional Laptops and carts are needed to accomplish this goal.
Access to High- Speed Internet
Summarize student and staff access to high-speed Internet during virtual instruction, how that changed over the year, and how that might have impacted opportunity and access.
In June of 2020, a survey was conducted of RCS parents. Of the parents who completed the survey, 934 students were identified as not having Internet access at home. Of these 934 students, approximately 400 chose the virtual option for learning. As a result, 400 Verizon Hotspots were purchased with ESSER 1.0 funds for these virtual option students so that they would have Internet access when instruction began. Our district technology team set up a hotline to assist parents and students with technical troubleshooting which worked well for our online and hybrid user community. However, the majority of our technology staff was deployed to meet these needs. This reduced availability for troubleshooting at the building level and revealed the need for extra technical support at the building level. Additional Information Systems Technicians will ensure that educators can focus on instruction without technical interruptions. This supports the district goal that 85% of classrooms will integrate technology effectively and with fidelity.
Facility Constraints
Summarize facility constraints that impacted instruction (ie. space concerns leading to hybrid schedules).
Initially, approximately 25% of our student body chose the virtual option allowing adequate space for in-person instruction during the first semester of the school year. Parents were given the opportunity to change from the virtual option to the face-to-face option every nine weeks and many families decided to return to face-to-face instruction within the first two nine-week periods of the 2020 school year. This was attributed to difficulties many of our families experienced with supporting their children with the online platform, assisting students who required academic accommodations, and lack of adequate childcare so that parents could return to work. Following, the second nine-week period, due to the increased enrollment, we experienced difficulties maintaining social distancing and cases were beginning to rise district-wide. All grade levels went virtual two days prior to the Winter Break. By January 2021, due to rising Covid infection rates, the decision was made for grades six through twelve to attend school using a hybrid model during the third term of the school year. Starting in mid-February through the end of March, the Robertson County Health Department began rolling out the Covid vaccinations to district staff. By the fourth term, all students were back in class for face-to-face learning. Pre-K through fifth grade students remained in person all year.

Remember that a needs assessment is to specifically name those areas where additional support, resources, or attention would positively benefit students. That requires the identification of areas to strengthen as a result of the pandemic. The needs assessment may also include areas that were already focus areas for the district that have been exacerbated as a result of the pandemic and where additional investment may be warranted or beneficial.
Tennessee Department of Education • tn.gov/education
13
OTHER CONSIDERATIONS -CONTINUED Topic Supporting Data and Notes Interpretation of Data and Identified Needs
Facility Constraints (Continued)
Summarize facility constraints that impacted instruction (i.e., space concerns leading to hybrid schedules). (Continued)
Air Quality Issues: ESSER 2.0 funds have been obligated for new HVAC systems in three of our schools, Westside Elementary, Krisle Elementary, and Springfield Middle School. During COVID-19, we have learned that the need for outside air has greatly increased, and improvements in ventilation and indoor air quality are needed to deter the spread of COVID-19 and other airborne illnesses. Overcrowding: Overcrowding due to enrollment increases and community growth is an issue at several of our schools. Overcrowding has been addressed with rezoning, portable classrooms, and building modifications. Renovation projects are prioritized based on the District Facility Plan. ESSER 3.0 funds will allow for renovations to take place sooner than originally scheduled allowing for additional class size reduction and social distancing for safe in-person instruction. Due to the rising Covid infection rates at the end of the second term, the decision was made for grades six through twelve to attend school using a hybrid model during the third term of the school year. This situation revealed the importance of providing wellness programs and services for faculty, staff, and students to boost and maintain attendance. Locating a health clinic and personnel within the district has been a consideration as data shows that improved employee/student attendance because of on-site, efficient medical care results in greater student academic achievement. Creating a culture where educators and staff members are supported remains a priority, additionally 34.8% of stakeholders responding to our community feedback survey ranked initiatives to keep students and staff healthy and in school as the most important expenditure for reopening safely and remaining open.
Other Foundational Needs & Considerations
To ensure active monitoring of ESSER grant allocations, preparation of program budgets, schedules, budget amendments, and compliance with statutory requirements the district will hire an ESSER Grant Coordinator, and ESSER Project Manager for facilities. These two positions will be responsible for the administration of ESSER grant projects and programming. The responsibilities of the ESSER Grant Coordinator include monitoring compliance of grant funding and implementation of grant-funded programs, data analysis, budgeting, and reporting. The responsibilities of the ESSER Project Manager include overseeing ESSER-funded projects and collecting the documentation necessary for fiscal management to ensure federal compliance including the Davis-Bacon Act on all facilities projects. Aging Technology and Devices: There is a need to replace technology and devices throughout the district that have “aged out.” The district is in the process of phasing in interactive Promethean boards throughout the district and teachers who had access to these interactive boards were able to adapt to hybrid and virtual instruction with greater ease.

Tennessee Department of Education • tn.gov/education
14
Summary of Key Priorities For each of the sections below, list the top 3 investments your district will make to address the data indicated above and accelerate student achievement. ACADEMICS 1 After-school tutoring and transportation
2 RTI contract interventionists and contract instrumental and vocal specialists
3 Technology Tutors to support after-school technology integration and the 1:1 initiative in grades 6-12
STUDENT READINESS 1 Extended personalized programs and materials to address learning loss and acceleration:
• Discovery Education • Achieve 3000/Amplify Close Reading • Odyssey Ware • Additional sheet music/method books to remediate learning loss • ACT Online Prep • Graphing Calculators SHS “at risk” students • Power of ICU • Video Library of exemplary foundational skills lessons
2 Math textbook adoption-high quality materials for mathematics instruction
3 iCEV and CDX to facilitate competency-based differentiated instruction in the CTE curriculum
EDUCATORS 1 Professional development stipends for educational assistants to provide lower ratio instruction that is aligned and implemented with fidelity
2 Contract Consultant-Mentor/Coach for educators and administrators with an emphasis on reduction in the achievement gap within traditionally underserved populations.
3 Mental health support personnel at Phoenix Academy which serves as our alternative learning center for our “at risk” student population
FOUNDATIONAL ELEMENTS 1 Greenbrier Middle School Renovation & Health Clinic/Supplemental Floating Nurse
2 1:1 Devices for 6th & 7th Grades & Information Systems Technicians
3 ESSER Facilities Manager & Grant Coordinator