district of saanich agriculture and food security plan ... · 1 district of saanich agriculture and...
TRANSCRIPT

1
District of Saanich Agriculture and Food Security Plan Background Report
Prepared by: Upland Agricultural Consulting Version 1 - May 25, 2016
2
Table of Contents Table of Tables .............................................................................................................................................. 3
Table of Figures ............................................................................................................................................. 4
Acronyms ...................................................................................................................................................... 5
1.0 Introduction ............................................................................................................................................ 6
1.1 Purpose of Background Report ........................................................................................................... 6
1.2 The Agriculture and Food Security Plan Process ................................................................................. 6
1.3 Definitions of Agriculture and Food Security ...................................................................................... 6
2.0 General Context Review ......................................................................................................................... 7
2.1 Community Overview ......................................................................................................................... 7
2.2 Farmland in the District of Saanich ..................................................................................................... 9
2.3 Farming: Historical Context on the Saanich Peninsula ..................................................................... 11
2.4 Current Planning Context for Agriculture ......................................................................................... 13
2.4.1 Federal ........................................................................................................................................... 13
2.4.2 Provincial ........................................................................................................................................ 14
2.4.3 Local and Regional Planning and Agriculture ............................................................................. 17
2.4.4 Local and Regional Agriculture and Food Security Initiatives .................................................... 19
3.0 Environmental Context ......................................................................................................................... 20
3.1 Surface Water ................................................................................................................................... 20
3.2 Groundwater ..................................................................................................................................... 21
3.3 Irrigation and Water Servicing .......................................................................................................... 25
3.4 Soils of the Saanich Area ................................................................................................................... 26
3.5 Agricultural Capability of the Saanich Area ...................................................................................... 28
3.6 Invasive Species in Southern Vancouver Island ................................................................................ 29
3.7 Weather and Growing Degree Days ................................................................................................. 30
3.8 Climate Change ................................................................................................................................. 31
4.0 Rural Agricultural Profile ....................................................................................................................... 33
4.1 Methodology ..................................................................................................................................... 33
4.2 Farm Numbers and Size .................................................................................................................... 33
4.3 Farm Class Status .............................................................................................................................. 35
4.4 Crop Production ................................................................................................................................ 36
4.5 Livestock Production ......................................................................................................................... 37
4.6 Farm Practices ................................................................................................................................... 38
4.7 Farm Valuation .................................................................................................................................. 39
4.8 Farmer Profile ................................................................................................................................... 40

3
4.9 Land Tenure ...................................................................................................................................... 41
5.0 Urban Agriculture and Food Access ...................................................................................................... 42
5.1 Organizations Working Towards Food Self-Sufficiency in Saanich ................................................... 42
5.2 Community Gardens in Saanich ........................................................................................................ 42
5.3 Food and Agriculture Programs in Saanich ....................................................................................... 43
5.4 Emergency Food Relief in Saanich .................................................................................................... 43
6.0 References ............................................................................................................................................ 44
Table of Tables Table 1. Demographics of the District of Saanich. ........................................................................................ 9 Table 2. Farmed Land in the District of Saanich. (Statistics Canada). ........................................................... 9 Table 3. Wells per Municipality in the CRD (Kenny, 2004). ........................................................................ 22 Table 4. Description of major aquifers within the District of Saanich. ...................................................... 22 Table 5. Weather normals from 1981 - 2010 in Saanich (Environment Canada, 2016). ............................ 30 Table 6. Potential agricultural impacts of climate change. ......................................................................... 31 Table 7. Climate Projections for the Capital Regional District in the 2020s, 2050s, and 2080s (PCICS,
2014). .......................................................................................................................................................... 32 Table 8. Total area being farmed in the District of Saanich.. Source: Statistics Canada ............................ 34 Table 9. Size of Farms in the District of Saanich. Source: Statistics Canada ............................................... 34 Table 10. Area of Land in Crops in the District of Saanich (Hectares). Source: Statistics Canada .............. 34 Table 11. BC Assessment Farm Income Summary – District of Saanich (Jurisdiction 308) ........................ 36 Table 12. Other Crop Types in the District of Saanich (Hectares). Source: Statistics Canada. ................... 37 Table 13. Greenhouse and Mushroom Production in the District of Saanich. Source: Statistics Canada. . 37 Table 14. Livestock Production in the District of Saanich from 1996 to 2011. Source: Statistics Canada . 38 Table 15. Farm Practices in the District of Saanich (Hectares). Source: Statistics Canada. ........................ 38 Table 16. Gross Margin for Farms in Saanich. Source: Statistics Canada. .................................................. 39 Table 17. Revenue per Hectare for Farms in Saanich. Source: Statistics Canada. ...................................... 39 Table 18. Distribution of gross farm receipts in District of Saanich in 2011. .............................................. 39 Table 19. Farm Operator Profile for the District of Saanich. Source: Statistics Canada. ............................ 40 Table 20. Hours Spent Per Week Working for the Farm Operation. Source: Statistics Canada. ................ 41 Table 21. Land Tenure in the District of Saanich (Hectares). Source: Statistics Canada. ........................... 41 Table 22. Farm Ownership Models in Saanich (Number of Farms Reporting). Source: Statistics Canada. 41

4
Table of Figures Figure 1. Map of Capital Regional District municipalities. ............................................................................ 8 Figure 2. Locations of farms inside and outside the ALR in the District of Saanich (2015). ....................... 10 Figure 3. Irvine family at Rose Bank Farm in 1892. (Saanich Archives). ..................................................... 11 Figure 4. Mrs Martin Mallett feeding hens at farm on Ruby Road – 1900 (Saanich Archives). ................. 11 Figure 5. Borden farm harvesting and stooking wheat sheaves – 1908 (Saanich Archives). ..................... 11 Figure 6. Geoffrey Vantreight with First Nations farm workers on the Vantreight strawberry farm in
Gordon Head 1910 (Saanich Archives). ...................................................................................................... 12 Figure 7. George Watson early Saanich Reeve at Barrie Road Farm – 1910s (Saanich Archives). ............. 12 Figure 8. Sheep on Rithet farm the Lockes leased the property in 1930s (Saanich Archives). .................. 12 Figure 9. Silo on the north side of Rogers farm – 1916 (Saanich Archives). ............................................... 12 Figure 10. Watersheds of the Greater Victoria area (Capital Regional District). ........................................ 20 Figure 11. Aquifers in the Elk Lake area (Kenny, 2004). ............................................................................. 23 Figure 12. Aquifers in the District of Saanich (Kenny, 2004). ..................................................................... 24 Figure 13. Map of soils series for Saanich area (Day et al, 1959). .............................................................. 26 Figure 14. Agricultural Capability map. Source: Agricultural Land Commission map archives. ................. 28 Figure 15. Priority invasive species in the Capital Region. .......................................................................... 29 Figure 16. Total Number of Farms in the District of Saanich. Source: Statistics Canada ............................ 33 Figure 17. Crop Types in the District of Saanich (Hectares). Source: Statistics Canada. ............................ 36 Figure 18. Total Farm Capital Value in the District of Saanich. Source: Statistics Canada ......................... 40

5
Acronyms AAFC Agriculture and Agri-Food Canada AFSP Agriculture and Food Security Plan AGRI BC Ministry of Agriculture ALC Agricultural Land Commission ALR Agricultural Land Reserve ARDCorp Agriculture Research and Development Corporation BCA BC Assessment BCAC BC Agriculture Council BCCDC BC Centre for Disease Control BCEMB BC Egg Marketing Board BCMH BC Ministry of Health BCMMB BC Milk Marketing Board BC MPA BC Milk Producers Association BCMoE BC Ministry of Environment BCMSCD BC Ministry of Community, Sport, and Cultural Development BSE Bovine Spongiform Encephalopathy CFIA Canadian Food Inspection Agency CLI Canadian Land Inventory CRD Capital Regional District CSA Community Supported Agriculture DPA Development Permit Area DoS District of Saanich FIRB Farm Industry Review Board FPPA Farm Practices Protection (Right to Farm) Act GDD Growing Degree Days IAF Investment Agriculture Foundation of BC IH Island Health LGA Local Government Act LTSA Land Title and Survey Authority of BC LUI Land Use Inventory MIR Meat Inspection Regulation OCP Official Community Plan SPWC Saanich Peninsula Water Commission SSFPA Small Scale Food Processor Association

6
1.0 Introduction The District of Saanich has set forth a target to develop a local Agriculture and Food Security Plan (AFSP) to enhance agriculture and the local food system and to ensure a healthy, sustainable and stable food supply for the future. A Task Force will assist staff and Upland Agricultural Consulting to prepare an action plan and implementation strategy by 2017. The project will seek opportunities to establish partnerships within the community amongst individuals who have a working knowledge of local agriculture and food systems including in the areas of: production; food processing; distribution; marketing; and recovery. Agricultural plans recognize farming as the highest and best use of agricultural land and focus on developing strategies to support a viable food system at the local level. The intent of the Plan is to provide guidance to local government and support local planning efforts. The project will include a strong focus on farming, but will also explore issues related to urban food production and community food security.
1.1 Purpose of Background Report The purpose of the background report is to provide data and information that will help to identify trends, issues and opportunities related to agriculture and food security in Saanich. Throughout the process, additional research will be undertaken to add to the findings that are detailed in this report.
1.2 The Agriculture and Food Security Plan Process In October 2014, District of Saanich Council, endorsed a Terms of Reference for the formation of an Agriculture and Food Security Task Force for the purpose of preparing an Agriculture and Food Security Plan. The Task Force was selected in accordance with the Terms of Reference and was in place at approximately the same time that work was initiated on the Plan. The mandate of the Task Force is to act as an advisory body for the development of the comprehensive Agriculture and Food Security Plan for Saanich. The project process involves a phased approach that includes: background scoping and issues analysis, stakeholder engagement and feedback, and the development of recommended actions together with an implementation strategy. Engagement with the public and stakeholders will be conducted according to a Public Engagement Strategy created specifically for the AFSP. Engagement events and initiatives are expected to take place during 2016 and early 2017. The background report will serve as an important foundational document to inform the planning process and policy development.
1.3 Definitions of Agriculture and Food Security It can be difficult for any community to agree upon the terms used to describe food production at a regional level. Definitions outlined by dictionaries, Statistics Canada, and the BC Assessment Authority (BCAA) help to provide a starting point for discussion. The AFSP Task Force has come up with the following working definitions of “agriculture” and “food security” for the purposes of this project.

7
Agriculture:
Sustainable agriculture enhances environmental quality and the resource base on which it depends;
provides for basic human food and fiber needs; is economically viable; and enhances the quality of life for
farmers and society as a whole over the long term.
Food security:
Food security exists when all people at all times have access to sufficient, safe, nutritious food to
maintain a healthy and active life.
Throughout this document data from both Statistics Canada and BC Assessment are used. These agencies define agriculture and farming slightly differently: A “census farm” as described by Statistics Canada:
An agricultural operation that produces at least one of the following products intended for sale: crops (hay, field crops, tree fruits or nuts, berries or grapes, vegetables, seed); livestock (cattle, pigs, sheep, horses, game animals, other livestock); poultry (hens, chickens, turkeys, chicks, game birds, other poultry); animal products (milk or cream, eggs, wool, furs, meat); or other agricultural products (Christmas trees, greenhouse or nursery products, mushrooms, sod, honey, maple syrup products).
In the Agricultural Census, an agricultural operation is defined as: “a farm, ranch or other operation that produces agricultural products intended for sale.” Farm status (or farm class) as determined by BC Assessment is based on:
a) land used for a qualifying agricultural use; b) land used for a purpose that contributes to a qualifying agricultural use; c) land used for a farmer’s dwelling; d) land in an agricultural land reserve (ALR) that is used for a retired farmer’s dwelling; e) land used for the training and boarding of horses when operated in conjunction with horse
rearing; and f) in some cases, vacant land associated with a farm.
A combination of the above-mentioned definitions, the project Terms of Reference, and discussions with farmers and other stakeholders will be used to ensure that a variety of levels and types of food production and concepts for food security are captured in the AFSP to accurately describe what is occurring in the District of Saanich.
2.0 General Context Review
2.1 Community Overview The Capital Region District (CRD) (see Figure 1) encompasses 2,441 km2, which is home to just under 400,000 people. The CRD is the regional government for 13 municipalities (Sidney, North Saanich, Central Saanich, Saanich, Oak Bay, Victoria, Esquimalt, View Royal, Highlands, Langford, Colwood, Metchosin and Sooke) and three electoral areas (Juan de Fuca, Salt Spring Island and Southern Gulf Islands) on the southern tip of Vancouver Island.

8
The District of Saanich spans 103.44 km2 of the Saanich Peninsula and is the most populous municipality on Vancouver Island. It is named after the Saanich First Nation, meaning “emerging land” or “emerging people”. It is the largest municipality in the Capital Regional District and occupies a major and central area of the region located immediately north of the City of Victoria, sharing boundaries with Highlands, View Royal, Esquimalt, Oak Bay, and Central Saanich. Saanich is the gateway to the metropolitan core with key transportation links to the airport, ferry terminal, Western Communities, Saanich Peninsula, and the rest of Vancouver Island. Approximately half the Municipality is urban and half rural/agricultural – a dual role that has influenced its character and development. The District of Saanich encompasses the following neighbourhoods:
- Cordova Bay - Royal Oak - Carey - Tillicum - North Quadra - Blenkinsop
- Gordon Head - Cadboro Bay - Shelbourne - Quadra - Saanich Core - Rural Saanich
Figure 1. Map of Capital Regional District municipalities.1
1 Capital Regional District Maps: Administrative Boundaries.

9
The total population for the District of Saanich in 2011 was 109,752 with an increase of 1.4% since 2006. There were 49,670 total private dwellings with 31,310 census families in 2011. Table 1. Demographics of the District of Saanich2.
2006 2011
Population 108,265 109,752
Population Increase 43,225 (1971-2006) 1,487 (1.4% change since 2006)
Total private dwellings 44,575 49,670
Age
- 0 to 14 years 16,015 15,040
- 15 to 64 years 73,110 74,665
- 65 years and over 19,140 20,045
Total number of census families 31,180 31,310
2.2 Farmland in the District of Saanich A total of 18% (1,872 ha) of the land in the District of Saanich is included in the Agricultural Land Reserve (ALR). In general, residents support small-scale and full-time farming activities in the rural area. Very little land has been excluded from the ALR since its inception in 1974, unlike some other communities in BC. The Census of Agriculture data from 2006 and 2011 also found that 21% of the land within the District of Saanich was being actively farmed in 2011, which indicates that areas outside of the ALR are also farmed. Table 2. Farmed Land in the District of Saanich. (Statistics Canada).
2006 % 2011 %
Jurisdictional area 11,178 ha 100% 10,378 ha 100%
ALR 1,854 ha (2008) 17% 1,872 ha (2012) 18%
Total area farmed 1,713 15% 2,222 21%
Food production in urban areas is also a priority for the District of Saanich. The Strategic Plan (2014 – 2018) includes goals to increase backyard vegetable gardens and poultry keeping by 66% by 2036; and increase community gardens from 2 to 12 by 2036.
2 Statistics Canada Census Data, 2011. http://www12.statcan.gc.ca/census-recensement/2011/as-sa/fogs-spg/Facts-csd-eng.cfm?Lang=eng&GK=CSD&GC=5917021

10
Figure 2. Locations of farms inside and outside the ALR in the District of Saanich (2015).

11
2.3 Farming: Historical Context on the Saanich Peninsula The Coast Salish people inhabited the Saanich Peninsula for thousands of years before the arrival of James Douglas and other colonial settlers. The Songhees and Saanich First Nations used the area for hunting, fishing and gathering plants3. Archaeological evidence of midden sites containing shell remains, ash deposits from fires and evidence of food processing can be found along the sea shore and inland on the Peninsula4.
In the mid-1850s, employees of the Hudson’s Bay Company and colonial settlers began transforming the Peninsula into one of the oldest agricultural settlements in BC. James Douglas as chief factor of Fort Victoria and Governor of the Colony of Vancouver Island purchased land around Victoria, Saanich and Sooke from the aboriginal peoples. As gold was discovered along the Fraser River, this changed Fort Victoria from a fur trading post to a colonial settlement. The Colony of Vancouver Island granted settlements of 100 acres for single men and 200 acres for married couples. In 1962, the land in the Elk/Beaver Lake area was surveyed to implement a water supply system and the City purchased 408 acres around the lake for water reservoir use. This area is now a Regional Park. Shortly thereafter in 1963, a stage coach began running a daily service to Saanich, which further encouraged farming, logging and land speculations. By the turn of the century, the District of Saanich was renowned for its cultivation of fruit and flowers.
3 Rural Saanich Local Area Plan, 2007. 4 Saanich Archives. District of Saanich website: http://www.saanich.ca/discover/artsheritagearc/saanicharchives/
Figure 3. Irvine family at Rose Bank Farm in 1892. (Saanich Archives).
Figure 4. Mrs Martin Mallett feeding hens at farm on Ruby Road – 1900 (Saanich Archives).
Figure 5. Borden farm harvesting and stooking wheat sheaves – 1908 (Saanich Archives).

12
Currently, there are 16,406 hectares of farmland in the CRD, which is contained within the ALR. The Saanich Peninsula accounts for 38% of the CRD’s ALR. Over the last 50 years, the region’s food system, not unlike the food systems of most communities in BC, has undergone changes in response to a globalized economy coupled with advances in food technology and a subsidized fossil-fuel based distribution system. It is estimated that in 1960 over 85% of Vancouver Island’s food supply was produced locally whereas today locally-produced food accounts for only 10% of the food consumed on the Island56. Most of the food is brought to Vancouver Island by ferry or airplane. Vancouver Island experiences limited food system resiliency, evidenced by the fact that, in an emergency, there is only a three-day supply of fresh food in stores in the region. Access to sufficient healthy food, or food security, is also tied to income level and the availability of a diversity of food choices.
5 MacNair, E. (2004). A baseline assessment of food security in British Columbia’s Capital Region. Victoria, BC: CR-FAIR. http://www.farmfolkcityfolk.ca/GrowingGreenDocs/Jan_2004_Baseline_Assessment.pdf
6 Haddow, Wayne. Consumers are King. FarmSpeak, Summer 2001. Island Farmers Alliance.
Figure 6. Geoffrey Vantreight with First Nations farm workers on the Vantreight strawberry farm in Gordon Head 1910 (Saanich Archives).
Figure 7. George Watson early Saanich Reeve at Barrie Road Farm – 1910s (Saanich Archives).
Figure 9. Sheep on Rithet farm the Lockes leased the property in 1930s (Saanich Archives).
Figure 8. Silo on the north side of Rogers farm – 1916 (Saanich Archives).

13
2.4 Current Planning Context for Agriculture Agricultural land and uses are regulated by several levels of government. As a result, local producers may be subject to municipal, regional, provincial and federal government policies. Furthermore, agricultural production is not an issue addressed by one department, one piece of legislation, or single level of government. Some regulations are wide in scope and far-reaching, such as national and international trade agreements, while others are site-specific or issue-specific, such as zoning or meat processing regulations. As a result, no one piece of legislation has the capacity to address agricultural issues in an integrated and holistic manner. The agriculture industry is regulated and influenced by policy, legislation and regulation at the local, provincial and federal government levels. Awareness of jurisdictional responsibilities and authority can be useful in defining policy, strategies, actions and pilot projects that can be taken by local government and those that require broader collaboration for specific issues. This section summarizes some of the more influential policies and regulations. A fulsome discussion is provided in Deborah Curran’s report Capital Regional District Agricultural Legal & Policy Scan (2009)7.
2.4.1 Federal Federal government regulation addresses a number of areas including trade practices, public health and the protection of the natural environment. They also support agriculture through a number of funding programs. Strategic Initiatives Growing Forward 2 is designed to help the agricultural industry position itself to respond to future opportunities and to realize its full potential as a significant contributor to the economy. An estimated $426.90 million is being invested in BC through Growing Forward 2 from 2013 to 2018. Canada Agricultural Products Act The Canada Agricultural Products Act regulates the import, export and inter‐provincial trade and marketing of agricultural products. The Canadian Food Inspection Agency (CFIA) administers many of the agricultural import and export activities. This Act standardizes agricultural grading and inspecting procedures across Canada. Additional Federal Legislation Affecting Agriculture Additional federal legislation that influences various aspects of the agriculture industry include:
Canada Grain Act
Fertilizers Act
Canada Wildlife Act
Fisheries Act
Consumer Packaging and Labelling
Act Food and Drugs Act
Customs Act
7 Curran, D. 2009. Capital Regional District Agricultural Legal & Policy Scan. https://www.crd.bc.ca/docs/default-source/crd-document-library/committeedocuments/planningtransportationandprotectiveservicescommittee/20090515/agenda-item-5---attachment-1-(second-paper)R.pdf?sfvrsn=0
Health of Animals Act
Excise Tax Act
Migratory Birds Convention Act
Excise and Import Permits Act
Pest Control Products Act
Farm Debt Mediation Act
Plant Protection Act

14
Farm Income Protection Act
Seeds Act
Farm Products Agencies Act
Species at Risk Act
Feeds Act
Transportation of Dangerous Goods Act
2.4.2 Provincial The Province of BC primarily regulates agriculture through the Agricultural Land Commission (ALC), who
oversees the Agriculture Land Reserve (ALR); and the Ministry of Agriculture. A number of regulations
and initiatives are in place to support agriculture and protect the natural environment.
Strategic Initiatives In 2008, the BC Ministry of Agriculture released a BC Agriculture Plan for the province entitled Growing a Healthy Future for BC Families. The plan outlined 23 strategies to sustain and facilitate the growth and diversification of the agriculture industry. The 2012 BC Jobs Plan Agri-foods Strategy builds on the initiatives undertaken through the BC Agriculture Plan by setting priorities and actions to guide the growth of the agricultural sector over a five year period in three key areas: 1. Focus on high‐quality, high‐value products; 2. Expand domestic and international markets; and 3. Enhance the agri-food sector’s competitiveness. In 2012, the Province also provided a $2 million investment in a Buy Local program to help agricultural industries and retail operations promote BC foods. The funding assisted local businesses and organizations to launch or expand their marketing campaigns, including the farmers markets and several regional agricultural producer associations. Most recently, in 2015, the Province released the BC Agri-food and Sea Food Strategic Growth Plan. The plan recognizes three key challenges and opportunities: achieving economic growth, adapting to climate change, and maintaining food supply security. The Plan aims to harness these opportunities and position the agrifood and seafood sector for continued future growth. The Plan provides direction for economic growth with a new, ambitious goal to increase the sector’s annual revenues to $15 billion per year by 2020. Agricultural Land Commission Act Up to the 1970s nearly 6,000 hectares of prime agricultural land were lost each year to urban and other uses in BC. The Provincial government responded by introducing BC's Land Commission Act on April 18, 1973. The Agricultural Land Commission (ALC) was created with the following mandate:
To preserve agricultural land;
To encourage farming on agricultural land in collaboration with other communities of interest;
To encourage local governments, first nations, the provincial government and its agents to enable and accommodate farm use of agricultural land and uses compatible with agriculture in their plans, bylaws, and policies.
The ALC administers the ALC Act and is responsible for the ALR, a provincial zone in which agriculture is recognized as the priority use. The purpose of the ALR is to ensure that the province’s agricultural land base is preserved and available for farm uses both now and in the future. The ALC Act takes precedence over, but does not replace, other legislation and bylaws that may apply to the ALR. Local and regional

15
governments, as well as other Provincial agencies, are expected to plan in accordance with the Provincial policy of preserving agricultural land. On March 27, 2014, the Provincial government introduced Bill 24 - Agricultural Land Commission Amendment Act. The Bill subsequently passed on May 14, 2014 creating two ALR zones, six regional panels and incorporating changes to ALC governance. Vancouver Island remains in Zone 1, which maintains the same priorities for decision-making regarding exclusion, non-farm use, and subdivision applications, but will do so by a three-person regional panel. Agricultural Land Reserve Use, Subdivision and Procedure Regulation The Agricultural Land Reserve Use, Subdivision and Procedure Regulation, adopted in 2002, specifies permitted land uses within the ALR. This regulation identifies farm activities and other, non‐farm uses permitted in the ALR, notification requirements for soil removal and placement of fill, procedures for submitting applications and identifies filing requirements. Land use activities not included in the Regulation, such as subdividing land, building additional residences or excluding land from the ALR, require approval by the ALC through the application process. New regulations for the ALR Act, as directed by Bill 24, were released in mid-2015. The majority of the changes are related to the ability to process farm items on ALR (a co-operative model is now permitted), the establishment of breweries and meaderies as a permitted use, the allowable production of marijuana, and clarifying the allowance of secondary suites and secondary dwellings in Zone 1 and Zone 2. Farm Practices Protection Act The Farm Practices Protection (Right to Farm) Act was passed in 1996. The intent of the Act is to protect farms, using “normal farm practices”, from unwarranted nuisance complaints involving dust, odour, noise and other disturbances. The Farm Practices Board, now called the Farm Industry Review Board (FIRB), was established to deal with complaints that arise from the Act and to determine whether the issue results from normal farm practices. The FPPA protects farms both in and outside of the ALR, although those outside the ALR must obtain Class 9 (Farm) status from BC Assessment. Local Government Act Certain provisions of the Local Government Act address farming activities through community planning; zoning; nuisance regulations; removal and deposit of soil; weed and pest control; water use and drainage. Land Title Act The Land Title Act gives Approving Officers the power to assess potential impacts of proposed subdivisions on farmland. The Approving Officer is the Provincial Approving Officer (PAO) with the Ministry of Transportation and Infrastructure. Each municipality has their own Approving Officer who is responsible for all subdivision application within the municipal boundaries. BC Assessment Act Section 23 of the Assessment Act and BC Reg 411/95, the Classification of Land as a Farm Regulation (the “Farm Class Regulation”), set out the requirements that must be met for land to be classified as “Farm” for assessment and tax purposes. Land classified as Farm must be used all or in part for primary agricultural production.

16
Water Sustainability Act The Water Sustainability Act (WSA) is the principal water management legislation in BC and plays a key role in the sustainability of BC’s water supply. The Act provides for the licensing of activities including use, diversion, and storage of water. The Act also addresses the nature of permitted changes to stream courses under application. The WSA leaves the mechanisms for granting groundwater licences to be developed through Provincial regulations, which are currently in development. This could give Provincial and local governments more time to consult with water users in water scarce regions before unsustainable users of water are locked in to new licences. The WSA allows the provincial government to make orders to protect “critical environmental flows” in times of scarcity, meaning flows to protect fish populations and aquatic ecosystems. Water for agriculture is acknowledged in the WSA as an important interest that may warrant specific attention in certain watersheds.
Water Sustainability Plans The new Water Sustainability Act augments the current ability to undertake Water Sustainability Plans under Part 4 of the Water Act. The intent is to have a watershed-defined or issue-defined process where interested parties, including local governments, the provincial government, water users and First Nations, can come to an agreement about most aspects of water. Plans are not limited to water allocation but may consider water quality, drought planning, water sharing, changes to existing licences, and anything else set out in the terms of reference. Water Sustainability Plans may designate “dedicated agricultural water”, also known as agricultural water reserves. This allows the water sustainability planning process to prioritize or establish unique rules for agriculture, which will be particularly useful when considering how reductions in water use will be handled through drought planning and management. Provincial Agriculture Zone Wildlife Program The Provincial Agriculture Zone Wildlife Program (PAZWP) was developed in 2009 to accommodate special objectives in agricultural zones and provide special opportunities for hunters. PAZWP helps coordinate crop damage prevention, mitigation and compensation strategies for damage done by certain species of wildlife. PAZWP has helped increase hunting opportunities in agricultural areas and ungulate winter range zones. Agricultural Waste Control Regulation and Organic Matter Recycling Regulation - Environmental Management Act The Agricultural Waste Control Regulation and associated Code of Practice fall under the Environmental Management Act. These regulate practices for using, storing and managing agricultural waste material in order to prevent pollution. The Regulation and the Code deal with agricultural waste storage and on‐farm composting. The Organic Matter Recycling Regulation specifies how composting is conducted in commercial facilities, including feedstock, size, technology, siting and procedures, and compost quality. Meat Inspection Regulation Until 2004, meat inspection in BC was decentralized and the decision to implement inspection programs for locally marketed meat was left to the discretion of local governments. On-farm slaughter for commercial purposes was legal and largely unsupervised. In 2003, the BSE (Bovine Spongiform Encephalopathy) outbreak, also known as “made cow” disease was the catalyst for province regulation of meat inspection. The Meat Inspection Regulation (MIR) established the requirements for all provincially licensed slaughter facilities in BC. The regulation came into force in 2004, and compliance became

17
mandatory on September 30, 2007. The graduated licensing approach includes several levels of slaughter operation for provincially licensed facilities:
Class A facilities include slaughter and ‘cut and wrap’ services;
Class B facilities include slaughter only;
Class C was temporarily introduced in 2007 to make it possible for many slaughter operators to become fully licensed. These licenses have been phased out;
Class D ‐ Retail Sales – permits direct producer sales to local consumers and to retail establishments with geographic restrictions. Restricts production to between one and 25 animal units (approximately 11,350 kg live weight); and
Class E ‐ Direct Sales –permits direct producer sales to local consumers. Restricts production to between one and 10 animal units (approximately 4,540 kg live weight). Class E licenses are also limited to the designated geographic areas but may be available to other rural and remote areas of the province on a case‐by‐case basis.
BC Environmental Farm Plan Program The Canada‐BC Environmental Farm Plan (EFP) Program is a voluntary program that assists farmers in developing an environmental action plan for their farm that enhances natural resources and reduces the possibility of accidental harm to soil, air, water and biodiversity values. Those who enroll in the program become eligible for cost-share funding for certain on-farm Best Management Practices projects through the Growing Forward ARDCorp program.
2.4.3 Local and Regional Planning and Agriculture The manner in which agriculture is considered at the policy level is through the Local Government Act (LGA), Regional Growth Strategy (RGS), and the Official Community Plan (OCP) of the District of Saanich, and subsequently through regulations in the zoning bylaws. These documents are critical to the way in which local governments can support local food production and increase farm viability. Both the RGS and OCP provide long-term visions and strategies for future land use, development, and servicing, among other areas regulated by the LGA. The OCP bylaw is required to contain a Regional Context Statement, which describes how the policies are aligned with the RGS. The zoning bylaw regulates and permits uses within these land uses, or zones, representing current land use. The District of Saanich’s Strategic Plan, OCP, and Rural Saanich Local Area Plan all recognize agriculture as a significant contributor to the region's landscape, identity and economy. Collectively, these plans express a commitment to the preservation and strengthening of the region's rural economy and lifestyle, including the protection of lands capable of agricultural productivity, encouraging a diverse and profitable agricultural sector and supporting a sustainable and resilient local food system. The District of Saanich OCP’s policies connected to agriculture and food security have the following objectives:
To support initiatives to ensure a healthy, sustainable, and stable food supply within the region;
Protect the ALR;
Develop appropriate regulations and guidelines for future rural and urban farming;
Encourage innovative farming and local marketing;

18
Improve soil capabilities; and
Encourage environmentally sound agricultural practices. The following priorities are highlighted in the OCP:
Protection of agricultural land for current and future generations
Access to safe and nutritious food supply, at a reasonable cost; and
Opportunities for food production in both rural and urban areas. District of Saanich Zoning Bylaw 8200 Municipal zoning bylaws regulate and permit uses within zones. Zoning bylaws can influence agricultural land in several ways, including through the setting of minimum parcel sizes and maximum building foot prints, setting parameters around secondary dwellings, setbacks, and establishing the potential for subdivision of agricultural lands, to name a few. The A zone is the main zone for agricultural activity within the District of Saanich. The A zone includes: A1: Minimum 2 ha (4.8 acres) agricultural lots with a single dwelling permitted. A1DF: Minimum 2 ha (4.8 acres) demonstration farm with a single dwelling permitted. A2: Minimum 4 ha (9.9 acres) agricultural lots with two dwellings permitted. A3: Minimum 2 ha (4.8 acres) agricultural lots with a farm market use permitted. A4: Minimum 4 ha (9.9 acres) agricultural lots with a single dwelling permitted. Permissions for use by an animal pound, RV storage, a youth camp, landscape contractors, and use of explosives, have also been created for specific parcels within the A zones. Animals Bylaw The District of Saanich regulates the keeping of all animals, including farm animals, poultry, hens and bees in rural and urban areas through the Animals Bylaws. The regulations apply to the keeping of animals or bees for the production of food or fiber in urban and rural Saanich and include restrictions based on the size of a parcel and the setbacks to the property line. On properties that are zoned “Rural”, the Animals Bylaw allows for the keeping of:
Beehives at a distance of at least 6.05m (20 ft) from any property line:
Farm animals on parcels greater than 0.2 ha (1/2 acre);
10 poultry on parcels greater than 1,114.9 m2 (12,000 ft2);
30 poultry on lots greater than 1,858 m2 (20,000 ft2); and
No number limit for poultry on properties larger than 0.4 ha (43,056 ft2). On residential zoned properties, the following is permitted:
No more than 2 farm animals on a single family residential lot greater than 0.65 ha (1.6 acres);
A total of 5 hens on a single family residential lot larger than 557 m2 (6,000 ft2);
No more than 10 poultry on lots greater than 1,114.9 m2 (12,000 ft2); and
No more than 4 beehives on single family residential lots greater than 465 m2 (5,005 ft2) at a distance of at least 6.05 m (20 ft) from any property line.

19
2.4.4 Local and Regional Agriculture and Food Security Initiatives The Saanich region is rich with local organizations and initiatives aimed at increasing food security and creating a resilient agricultural sector. These include:
CRD Regional Growth Strategy and Food Systems Sub-strategy (2016)
CRD Roundtable on the Environment: Food and Agriculture Subcommittee (2009)
CRD Food Charter
Saanich Peninsula Agriculture Plan (1997)
District of Saanich Climate Action Plan and Climate Adaptation Plan
District of Saanich Urban Forest Strategy
District of Saanich Parks Master Plan
District of Saanich Boulevard Tree Planting Partnership
District of Saanich Local Food Procurement Bylaw
CR FAIR Farmland Trust Report
CR FAIR Baseline Assessment of Food Security
Vancouver Island Community Research Alliance (VICRA): Creating a Land Inventory and Urban Food Landscape on Vancouver Island (2011)

20
3.0 Environmental Context The Saanich Peninsula region has a relatively mild climate, highly fertile land, and more growing degree days than most regions of BC. The Peninsula lies within the Coastal Douglas fir biogeoclimatic zone and includes a variety of land types from dry rocky outcrops to low-lying marshy lands with underlying clay and/or peat soils. The area is quite arid as a result of it’s geographic location in the rainshadow of Sooke Hills and the Olympic Mountains. By comparison, the City of Penticton in the Okanagan receives more annual rainfall than Saanich. As long as irrigation water can be accessed, the region is well-suited to growing a wide variety of crops and is one of the more productive growing regions in Canada.
3.1 Surface Water The capital region is comprised of over 300 watersheds that are over 100 hectares in size, numerous smaller watersheds, plus variable sized natural and urban influenced drainage areas which drain to the shoreline without a creek.
Figure 10. Watersheds of the Greater Victoria area (Capital Regional District).

21
Key watersheds in the District of Saanich include: - Tod Creek watershed (6% of watershed land use is agriculture)
- Colquitz River watershed (12% of watershed land use is agriculture)
- Noble Creek watershed (62% of watershed land use is agriculture)
- Hospital Creek watershed (26% of watershed land use in agriculture)
The Colquitz River has one of the largest watersheds within the Capital Regional District, draining an area of about 49km2. It extends from Elk/Beaver Lake in the north and eventually drains into Portage Inlet. The topography within the watershed is generally flat, with an average gradient of 0.6%8. Several tributaries enter the Colquitz, including Swan, Blenkinsop, Viaduct and Durrell creeks. In the 1970s, the District of Saanich adopted a program of land acquisition and protection for the watershed, resulting in the almost complete protection of the creek corridor by 2013. The many resources of the Colquitz River watershed have been valued for thousands of years by Coast Salish First Nations. Soon after European settlement, a dam was constructed in 1860 at the outlet of Beaver Lake to store water for a saw mill operation nearby. In the early 1870s, several more dams were constructed on Beaver Lake to provide a drinking water supply for Victoria. As more farms became established in the area, the creek supplied water for crop irrigation and livestock. Several industries and commercial operations adjacent to the Colquitz also used significant amounts of water. Early residents valued the Colquitz for the excellent swimming holes and trout fishing along its banks. Until the mid-1950s many people regularly fished all along the length of the Colquitz right up to the dam at Beaver Lake. Cutthroat trout were the main target, as well as the salmon during the fall spawning run. Salmon were once so numerous during spawning season in the Colquitz that farmers speared them and tossed them on their fields for fertilizer.
3.2 Groundwater Aquifers of the Capital Regional District were mapped in 20049 (see Figures 11 and 12). Glacial and glaciofluvial modification of the landscape has resulted in the presence of significant water bearing deposits, formed from the sands and gravels of Capilano Sediments, Quadra and Cowichan Head Formations. Sand and gravel aquifers at Bazan Bay, Hagan Creek, Keating, West Saanich Road and Cordova Bay, on the Saanich Peninsula are thought to be used largely for commercial and irrigation supplies, but may provide domestic water supplies in areas where connection to the municipal distribution system is not available.
8 Capital Regional District – Featured Watersheds. https://www.crd.bc.ca/education/our-environment/watersheds/featured-watersheds/colquitz-creek/history-uses 9 Kenny, S. 2004. Aquifers of the Capital Regional District. University of Victoria and BC Ministry of Water, Land, and Air Protection.
http://www.env.gov.bc.ca/wsd/plan_protect_sustain/groundwater/aquifers/aquifers_crd/aquif_crd.html

22
Table 3. Wells per Municipality in the CRD (Kenny, 2004).
Municipality Number of Wells
North Saanich 1,394
Saanich 757
Central Saanich 664
District of Highlands 373
Metchosin 340
Langford 135
Sooke 88
Sidney 24
View Royal 19
Victoria 5
Esquimalt 4
Oak Bay 3
Total 3,806
The BC Ministry of Environment’s water atlas indicates four main aquifers underlying the District of Saanich: Durrance, Karmutsen, Cordova Bay, and Wark-Colquitz (see Table 4)10. The aquifers are categorized as moderately vulnerable, which indicates that demand exceeds productivity or recharge.
Table 4. Description of major aquifers within the District of Saanich11.
Name Durrance IIC(7) 613
Karmutsen IIIB(7) 614
Cordova Bay 616 IIC(9)
Wark – Colquitz 680 IIB(12)
Size 0.093 km2 16 km2 7.8 km2 209 km2
General Location
West of West Saanich Road, along Durrance Road near the junction with Wallace Drive.
The southern boundary is north of Observatory Hill in Saanich, northern boundary is at West Saanich Road and Stelly’s Cross Road in Brentwood Bay.
Includes underlying Elk Lake. Western boundary is found east of Old West Saanich Road. Eastern boundary is in Cordova Bay along Lochside Drive and Wesley Road, extending southward to Royal Oak Drive.
The second largest aquifer in the CRD. Juan de Fuca and Georgia Strait form the SE boundaries, and the western boundary is formed by Finlayson Arm, in the Saanich Inlet. The northern boundary is Elk & Durrance Lakes; while the SW boundary extends from Finlayson Arm to Langford Lake, and SE along the Survey Mountain Fault boundary to Esquimalt Lagoon.
Type Unconsolidated, sand and gravel deposits.
Partially confined, volcanic bedrock and limestone.
Partially confined, unconsolidated material.
Partially confined. Unconsolidated sand, gravel, silt, till and clay.
Depth 3 to 31 m (median is 20 m)
8 to 250 m (median is 55 m)
9 m to 59 m (median is 23 m)
4.3 m to 250 m (median is 61 m)
Productivity Unknown Low Moderate Low
Vulnerability Low Moderate Low Moderate
Use Mainly domestic, some agricultural.
30% domestic, 70% commercial and agricultural.
13% domestic, commercial (golf), and agricultural.
Mainly domestic, some agricultural.
Demand Moderate Low Moderate Moderate
10 BC Ministry of Environment Water Resource Atlas. Interactive mapping tool. http://maps.gov.bc.ca/ess/sv/wrbc/ 11 Kenny, S. 2004. Aquifers of the Capital Regional District. University of Victoria and BC Ministry of Water, Land, and Air Protection. Appendix
C. http://www.env.gov.bc.ca/wsd/plan_protect_sustain/groundwater/aquifers/aquifers_crd/pdfs/append_c.pdf

23
Figure 11. Aquifers in the Elk Lake area (Kenny, 2004).
Legend: Red squares: unconsolidated aquifer wells Yellow squares: bedrock aquifer wells Green squares: observation wells Black dashed line: boundary between groundwater aquifers. Red “x”: Highly vulnerable bedrock aquifer Yellow “x”: Moderately vulnerable bedrock aquifer Green “x”: Low vulnerability bedrock aquifer. Red “dots”: Highly vulnerable unconsolidated aquifer Yellow “dots”: Moderately vulnerable unconsolidated aquifer Green “dots”: Low vulnerability unconsolidated aquifer.

24
Figure 12. Aquifers in the District of Saanich (Kenny, 2004).
Legend: Red squares: unconsolidated aquifer wells Yellow squares: bedrock aquifer wells Green squares: observation wells Black dashed line: boundary between groundwater aquifers. Red “x”: Highly vulnerable bedrock aquifer Yellow “x”: Moderately vulnerable bedrock aquifer Green “x”: Low vulnerability bedrock aquifer. Red “dots”: Highly vulnerable unconsolidated aquifer Yellow “dots”: Moderately vulnerable unconsolidated aquifer Green “dots”: Low vulnerability unconsolidated aquifer.

25
3.3 Irrigation and Water Servicing The Capital Region District Regional Water Supply Commission and the Saanich Peninsula Water Commission (SPWC) provide water to the Saanich Peninsula. However, the District of Saanich is not served by the SPWC, rather installation and maintenance of the local water distribution system is performed by the District of Saanich with water purchased from the CRD. A 2005 study commissioned by the CRD12 found that 35% of farmers interviewed rely entirely on domestic water for irrigation, while another 18% use a combination of domestic water, wells, creeks, and dugouts. Some producers are reluctant to use domestic water because the cost is considered high. The 1997 Saanich Peninsula Agriculture Plan13 also found that farmers in the region rely on a mix of municipal connections, surface water, and groundwater sources for irrigation. Wells and dugout water storage systems offer secondary sources of water. Dugout storage is more popular on bigger lot sizes and smaller farms generally rely on municipal water. The District Saanich has 560 km of water pipe and five reservoirs. As stated in the Water Utility Bylaw #812514, meters are installed to measure all water consumed by customers with the exception of those residents in rural areas who are on wells. There are approximately 30,000 water meters in Saanich. Meters are read once every four months and utility accounts are billed once every four months. The District of Saanich provides an Agricultural Water Service Connection to the waterworks system to permit the supply of water for irrigation. The current water rates are as follows:
- Regular water rate: $1.56/m3
- Agricultural water rate: $0.77/m3
- Farm water rate: $0.21/m3
The Farm water rate is provided to Farm Class 9 status properties that are serviced by an Agricultural
Water Connection. All irrigation systems must use restrictive devices, which reduce the flow of water from
the nozzle or sprinkler by at least 25%.
12 Capital Regional District, 2005. Agricultural Water Use and Conservation Study. https://www.crd.bc.ca/docs/default-source/water-
pdf/agriculture_study.pdf?sfvrsn=2 13 Holm, W. 1997. Saanich Peninsula Agricultural Plan. 14 District of Saanich Water Utility Bylaw #8125. http://www.saanich.ca/living/pdf/waterutility8124.pdf

26
3.4 Soils of the Saanich Area The soils found in the District of Saanich were formed primarily from marine deposits and are fine to moderately textured15. Soil limitations to agriculture include poor drainage, high clay content, and rocky or dense subsoils. Drainage, irrigation, subsoiling, and soil conservation to minimize erosion are all beneficial management practices. Pockets of organic (peat) soils can be found in some depressional areas. These soils are acidic, shallow, have poor drainage and may be subject to subsidence if cultivated. . Figure 13 shows the general soil types present in Saanich. A description of each soil class is found below the map.
Figure 13. Map of soils series for Saanich area (Day et al, 1959).
15 JH Day, L. Farstad, DG Laird, 1959. Soil Survey of Southeast Vancouver Island and Gulf Islands, BC. Report #6 of the BC Soil Survey. Research
Branch, Canada Dept. of Agriculture. www.sis.agr.ca/cansis/publications/surveys/bc/bc6/index.html

27
Soil series in Saanich contain many that are amenable to agricultural production, including: Sa – Saanichton Clay and clay loam soil, well drained, gently sloping with few or no stones. Topsoil includes 2 inches of dark brown granular and permeable clay loam or clay over permeable clay subsoils and fine textured marine materials. Drought resistant. These are Acid Dark Brown soils. Class 1 agricultural soils, very good for a variety of agricultural production including berries, vegetables, flower bulbs, and forage. C – Cowichan A clay loam, poorly drained, level to depressional topography, stone free. Topsoil is six to eight inches of dark grey brown to black granular clay loam over coarse textured till subsoils. These soils fall within the Dark Gray Gleysol group. Class 2 agricultural soil, good for cereals, grasses, clover, bulbs, and veggies. Performs best if drained and fertilized. Cd – Cadboro Gravelly sandy loam, well drained, undulating to steeply sloping topography, moderately to very stony on glacial till. Deep topsoil is eight to ten inches of dark greyish brown permeable granular sandy loam. These soils fall within the Black soils group. Generally located in relatively dry microclimates (less than 800 mm of precipitation a year). Class 2 agricultural soils, good for growing strawberries, vegetables, and flowers. S - Shawnigan Gravelly sandy loam, well drained with undulating to steeply sloping topography. Moderately to very stony. Topsoil includes 18 to 20 inches of pale brown and light yellowish brown permeable granular gravelly sandy loam over over a grey compact and very slowly permeable gravelly sandy loam till. These soils are Brown Podzols. Class 3 agricultural soils, mainly impeded for production by slope and stoniness. T - Tolmie Sandy loam or loam, poorly drained, level to depressional topography, stone free. Top soil includes 6-9 inches of dark brown to black granular and permeable fine sandy loam to sandy clay loam over sandy clay subsoils and medium to fine textured marine materials or glacial till. These are Dark Grey Gleysols. Class 2 agricultural soils good for potatoes, berries, hay, and pasture.

28
3.5 Agricultural Capability of the Saanich Area The agricultural capability rating in the Saanich is generally very high, with most soils either prime in their unimproved states or improvable to prime (Classes 1 – 3). Improvements may include irrigation, drainage, and removing stones. There are some areas where the soil class ratings dips to Classes 5-7, with the main limitation being rocky outcrops and steep slopes.
Figure 14. Agricultural Capability map. Source: Agricultural Land Commission map archives.
Legend: Class 1 to 7: unimproved agricultural capability class Class (1 to 7): improved agricultural capability class Subclasses: D – poor soil structure E – erosion damage I – inundation or flooding M – low moisture holding capacity N – salinity damage P – stoniness interferes with farm activity R – shallow soils due to bedrock T – adverse topography (steep) W – excess water (requires drainage) X – minor cumulative limitations

29
3.6 Invasive Species in Southern Vancouver Island Invasive species, primarily plants, have known impacts to the agriculture and livestock industry. Loss of native grasslands and forest plants to the spread of invasive plants has lead to the loss of forage for both livestock and wildlife. Many invasive species also pose health threats to livestock and wildlife due to toxins or burrs causing physical injury. The Coastal Invasive Species Committee16 is a member of the Invasive Species Council of BC, and manages a Noxious Weeds program that aims to prevent the introduction of new species of noxious weeds and invasive plants and to reduce the spread of existing noxious weed infestations. Regional management of invasive species is made possible in the Capital Region by CRISP, a sub-committee of the Coastal Invasive Species Committee. CRISP members are representatives of the local governments within the Capital Region, major land managers and key partners. CRISP partners share information, strategize for better invasive management in the region and address key priorities by working together. Some of the priority invasive species in the Capital Region are17:
Garlic mustard
Knotweeds
Burdock species
St. John’s Wort
Knapweeds
Toadflax
Giant hogweed
Common tansy
Yellow flag iris
Golden willow
Gorse
Milk thistle
Scotch thistle
Purple loosestrife
In addition to plants, the Golden Nematode is
an invasive species and an infestation that
began in the 1960s has resulted in hundreds
of acres of Saanich Peninsula farmland being
placed under quarantine. No potatoes,
16 Coastal Invasive Species Committee http://www.coastalisc.com 17 Coast Priority Invasive Plant list: http://www.coastalisc.com/images/stories/CRISP/CRISP_Invasive_Plant_Species_list_by_Category_June_18-2013.pdf
Figure 15. Priority invasive species in the Capital Region.

30
tomatoes, or eggplants can be grown in the quarantine area, which is in Central Saanich.
3.7 Weather and Growing Degree Days The Saanich Peninsula is one of the mildest in Canada, with relatively mild winters and cool dry summers. There are several microclimates on the Saanich Peninsula, and those areas that are low-lying and away from the coastline can experience frost and freezing in the autumn and spring. The maritime climate is variable mainly due to topographical changes. Much of the Saanich Peninsula can be described as having a Cool Mediterranean Climate, with scant rain in July and August. As a result of this mild climate, the growing season is very long, averaging 240 freeze-free days since 198118. This results in a long growing season, with over 2,000 growing degree days above +5oC per year. This is on par, or even higher, than growing degree days found in the North Okanagan. Growing degree days (GDD) are a weather-based indicator for assessing crop development. It is a measure of heat accumulation used to predict plant and pest development rates such as the date that a crop reaches maturity. Daily GDD values are added together from the beginning of the season, providing an indication of the energy available for plant growth. GDD units can be used to assess the suitability of a region for production of a particular crop; estimate the growth-stages of crops, weeds or the life stages of insects; predict maturity and cutting dates of forage crops; estimate the heat stress on crops; plan spacing of planting dates to produce separate harvest dates. Table 5. Weather normals from 1981 - 2010 in Saanich (Environment Canada, 2016).
Saanichton CDA
Station Elevation (m) 61.0
Longitude 123°25'08.000" W
Latitude 48°37'18.000" N
Days per year with minimum temperatures < than 0oC 30.7
Days per year with maximum temperatures > than 20oC 70.5
Days per year with maximum temperatures > than 0oC 362.8
Days per year of rain 156.1
Annual Precipitation (snow + rain) (mm) 908.2
Rainfall (mm) July and August 47
Degree days greater than 10oC 862.4
Degree days greater than 5oC 2083.4
Day with measurable sunshine 297.1
Average date of last spring frost March 20
Average date of first fall frost November 17
Average frost free period (days) 241
18 Environment Canada Weather Normals: Saanichton CDA station. Accessed February 2016.
http://climate.weather.gc.ca/climate_normals/results_1981_2010_e.html?stnID=87&lang=e&StationName=saanich&SearchType=Contains&st
nNameSubmit=go&dCode=

31
3.8 Climate Change Farmers are accustomed to the weather influencing their activities and weather-dependent decisions are a part of farming life. Adapting to climate change, however, involves a more systematic assessment and response. Agriculture is highly vulnerable to changes in climatic conditions and even small shifts could have significant consequences for farm viability and food production. Despite the challenges of applying broad climate models, some general projections are anticipated in BC between now and 2050. Additional secondary effects may include a range of conditions described in Table 619. Table 6. Potential agricultural impacts of climate change.
Climate Change Condition Potential Agricultural Impacts
Changing hydrological regime, decrease in summer precipitation
Decrease in productivity and quality of crops and livestock under water stress, increased costs, reduction in water supply (at times of high demand), increase in management complexity
Increasing precipitation and variability of precipitation (especially in spring & fall)
Interruptions to planting, input applications and harvesting, increase in excessive moisture and site-specific flood risk, increase in pressure on drainage and water management, interruptions to pollination, decrease in light levels, increase in nutrient and input leaching, increase in management complexity
Changing crop suitability ranges Inconsistent productivity, quality & therefore prices; increase in suitability for new varieties of forage and field vegetable crops, increase in suitability of new crops
Changes in pests and diseases Increase in winter survival rates, increase in number of cycles in a year, introduction of new pests and diseases, increase in management costs, complexity, uncertainty, increase in delays or prevention of pollination
Increase in extreme weather events (storms, wind, extreme heat)
Decrease in productivity and quality, increase in building maintenance and damage costs, decrease in heating costs, increase in cooling and ventilation costs, interruptions to regional infrastructure and supply lines
Climate change impacts to other growing regions
Increase in feed or other input costs, increase in demand for food production/local food
Although there is general consensus regarding the impacts of climate change, how these might impact specific microclimates is uncertain - yet critical for agricultural producers concerned with the effects of climate change and precipitation within their specific locale. Modelling suggests that climate change in the Saanich area will bring about an increase in GDDs, a decrease in spring snowfall, a decrease in summer rains, and an increase in frost-free days.
19 BC Agriculture and Food Climate Action Initiative. Regional forecasting. http://www.bcagclimateaction.ca/regional/vancouver-island/

32
Table 7. Climate Projections for the Capital Regional District in the 2020s, 2050s, and 2080s (PCICS, 2014)20.
2020 change from 1961-1990
baseline
2050 change from 1961-1990
baseline
2080 change from 1961-1990
baseline
Characteristic Season Range Median Range Median Range Median
Mean Temperature Annual +0.4oC to +1.3oC +0.9oC +1.0oC to +2.3oC +1.6oC +1.4oC to +3.8oC +2.5oC
Precipitation Annual -2% to +7% +3% -2% to +12% +6% -1% to +18% +8%
Summer -20% to +7% -8% -30% to +1% -18% -44% to +1% -20%
Winter -4% to +10% +1% -4% to +16% +5% -2% to +23% +9%
Snowfall Winter -46% to -7% -24% -59% to -23% -40% -77% to -29% -56%
Spring -60% to -7% -32% -70% to -19% -53% -86% to -25% -74%
Growing Degree Days Annual
+115 to +344
degree days
+259 degree
days
+264 to +664
degree days
+453 degree
days
+379 to +1,143
degree days
+741 degree
days
Frost-free days Annual +3 to +13 days +8 days +9 to +20 days +14 days +12 to +26 days +20 days
20 Pacific Climate Impacts Consortium. Plan2Adapt tool. Accessed February 2016: https://pacificclimate.org/analysis-tools/plan2adapt

33
4.0 Rural Agricultural Profile A profile of agriculture in the District of Saanich provides a snapshot of agricultural production in the region to be able to examine issues such as farm profitability, diversity of agricultural commodities and the area of land under production. [Agricultural Land Use Inventory results from 2005 to be incorporated here…waiting for Ministry of Ag to send this to us.]
4.1 Methodology The latest available data from Statistics Canada for Census Consolidated Subdivision (CCS) 21 – Saanich was the 2011 Census of Agriculture. The focus of this agricultural profile is on data gathered between 1996 and 2011 to explore trends. Some of the tables contain an ‘x’ to secure privacy and eliminate the potential for identification when numbers are very small. For some categories, only 2006 and 2011 statistics are provided as 1996 and 2001 data is Regional District--level. Some information was provided in the Ministry of Agriculture’s Agriculture in Brief document for 1996 and 2001, which has been used here. An Agricultural Land Use Inventory (ALUI) for the Saanich Peninsula was conducted by the Ministry of Agriculture in 2005. These numbers are currently being summarized by the Ministry of Agriculture and will be included here once the summary is completed. The data in the ALUI is expected to support the 2006 Census data. This profile is expected to be representative of the actual farming practices in the District of Saanich, however numbers are no expected to be exact as these are self-reported figures and/or information seen at the time of the inventory from the field.
4.2 Farm Numbers and Size The total number of farms has been increasing slightly since 1996, with a substantial increase of 68 farms from 2006 to 2011.
Figure 16. Total Number of Farms in the District of Saanich. Source: Statistics Canada
245 246 251
319
0
100
200
300
400
1996 2001 2006 2011
Total Number of Farms

34
Table 8. Total area being farmed in the District of Saanich.. Source: Statistics Canada
1996 2001 2006 2011
Total farmed area (hectares) 1,821 3,052 1,713 2,222
It is unclear why the amount of farmed area jumped from 1,821 ha in 1996 to 3,052 ha in 2011. However, during that timeframe there was an increase in reported “unmanaged pasture” land from 379 ha to 1,030 ha. Therefore, the majority of the increased in farmed areas cannot be attributed to increased crop production. The average farm size remained steady at approximately 7 ha from 2006 to 2011. The vast majority of farms (96%) were under 69 acres, which is consistent with the average farm size and number of farms. There was a slight increase in the number of larger farms between 2006 and 2011. Table 9. Size of Farms in the District of Saanich. Source: Statistics Canada
2006 % 2011 %
Total Farms 251 100% 319 100%
Under 10 acres 171 68% 213 67%
10 - 69 acres 70 28% 94 29%
70 - 129 acres 4 2% 5 2%
130 - 179 acres 4 2% 2 1%
180 - 239 acres 0 0% 2 1%
240 - 399 acres 1 0.3% 2 1%
400 - 559 acres 1 0.3% 1 0.3%
560 acres and over
0 0% 0 0%
About 40% of the actively farmed land in Saanich is in crops, while the remainder is in natural unmanaged pasture or other land uses. Only a small percentage is managed pasture. Table 10. Area of Land in Crops in the District of Saanich (Hectares). Source: Statistics Canada
1996 % 2001 % 2006 % 2011 %
Total area farmed 1,821 100% 3,052 100% 1,713 100% 2,222 100%
Area land in crops 696 38% 1,086 36% 531 31% 885 40%
Tame or seeded pasture (managed)
129 7% 113 4% x x 173 8%
Natural land for pasture (unmanaged)
379 21% 1,030 34% 476 28% 323 15%
Total area all other land (incl xmas tree area)
na na na na 584 34% 387 17%

35
4.3 Farm Class Status The Assessment Act is administered by BC Assessment, a provincial Crown Corporation responsible for the classification of properties in B.C. for property assessment and tax purposes. Farm classification is a voluntary program providing the benefit of a low tax rate for assessed properties. Even though property may be zoned as agricultural land, or in the provincial ALR, farm classification will only be granted if the land (or at least a portion of it) is being actively used for primary agricultural production and it meets the other requirements of the Act. Only land can be classified as farmland - buildings (residences and outbuildings) are classified separately, typically as residential. Land qualifies for farm classification under the following conditions:
The land is used for “primary agricultural production”;
The land is the site of “a farmer’s dwelling”;
The land is used for training and boarding horses in a horse rearing operation;
The land otherwise contributes to primary agricultural production such as land used for drainage, irrigation, buffers and windbreaks.
Agricultural production for purely on-site consumption and the breeding and raising of pets, other than horses, does not qualify. A certain minimum amount of income must be produced from the primary agricultural production, and these requirements vary depending on the total land area. Minimum income requirements are calculated as follows:
a) $10,000 on land less than 0.8 ha (1.98 acres); b) $2,500 on land between 0.8 ha (1.98 acres) and 4 ha (10 acres) c) On land larger than 4 ha (10 acres), you must earn $2,500 plus 5% of the actual value of any farm
land in excess of 4 ha; d) $10,000 in order to qualify unused land where the area in production by the owner makes up at
least 25% of the portion of the parcel outside the ALR. Some sales of qualifying agricultural products must occur every year.
The BC Assessment Farm Income Summary for the District of Saanich denotes a total of 71 farms with Farm status (Class 9). Of these farms, the majority (70%) are in the $2,500 income threshold category, indicating that most farms are between 0.8 ha and 4 ha. Only a small number of farms have farm status and are under 0.8 ha. Table 10 presents income ratio data for BC Assessment farms in the District of Saanich. Income ratio is an indication of financial health of the farming operation. Any farm hovering around 1.0 is only just achieving the required minimum income levels. For example, a small 2 acre farm with an income ratio of 5.0 would be reporting a gross farm income of $50,000. A larger 8 acre farm with an income ratio of 2.0 would be reporting a gross farm income of $5,000. In the District of Saanich there are 19 farms (27% of BC Assessment listed farms) reporting around the 1.0 income ratio level. There are also 28 farms (39% of BC Assessment listed farms) reporting at least a 2.0 income ratio level. This indicates a split in financial success in Saanich farms, with some struggling while others are doing well.

36
Table 11. BC Assessment Farm Income Summary – District of Saanich (Jurisdiction 308)
Minimum Income Levels
Income Ratio Group $10,000 (< 0.8 ha or 2
acres)
$2,500 (0.8 – 4 ha or 2 to
10 acres)
$2,500+5% (> 4 ha or 10
acres)
Grand Total
1.000 - 1.249 0 16 3 19
1.250 - 1.499 1 5 1 7
1.5 - 1.749 0 9 2 11
1.75 - 1.999 0 3 2 5
2.000 - 2.999 1 7 0 8
3.000 - 4.999 0 4 4 8
5.000 - 9.999 1 2 3 6
>=10.000 1 3 2 6
4 50 17 71
4.4 Crop Production Field crops are the predominate crop type in Saanich with fruits, berries, and nuts as the second most common.
Figure 17. Crop Types in the District of Saanich (Hectares). Source: Statistics Canada.
Total field crops increased from 508 ha and 73 farms reporting in 1996 to 649 ha and 116 farms reporting in 2011. The major field crop types grown in Saanich are tame hay (managed pasture) (468 ha), alfalfa and alfalfa mixtures (115 ha), potatoes for seed (36 ha), and spring wheat (13 ha). Berry and tree fruit production has also grown substantially since 1996 from 52 ha to 125 ha in 2011. The predominate crops are blueberries (30 ha), other fruits, berries and nuts (22 ha), strawberries (20 ha), apples (14 ha), grapes (12 ha), and raspberries (11 ha).
Field Crops, 649
Fruits, Berries and Nuts, 125
Vegetables, 76
Nursery Products, 28
Christmas Trees, 11
Crop Types

37
Total vegetable production in the region decreased from 90 ha in 1996 to 76 ha in 2011. However, production increased between 2006 and 2011 from 36 ha to 76 ha with substantial increases in production for carrots, squash and zucchini, other vegetables, pumpkins and sweet corn. The production of nursery products and Christmas trees has remained quite consistent over time, but much of the data for other crop types has been suppressed for confidentiality reasons. Table 12. Other Crop Types in the District of Saanich (Hectares). Source: Statistics Canada.
1996 2001 2006 2011
Nursery products 23 28 23 28
Sod grown for sale x x 0 x
Christmas trees x x 10 11
Total greenhouse production has fluctuated over time with peak production occurring in 1996 and 2006. In 2011, the highest amount of production was in greenhouse flowers, but the largest number of farms reporting was in greenhouse vegetables. There are only a couple of operations in the region growing mushrooms and total production has been suppressed for confidentiality reasons. Table 13. Greenhouse and Mushroom Production in the District of Saanich. Source: Statistics Canada.
1996 1996 (m2) 2001 2001 (m2) 2006 2006 (m2) 2011 2011 (m2)
Total area under glass, plastic or other protection
35 42,980 41 27,903 32 42,123 34 30,364
Total greenhouse area in use on census day
na na na na 3221 41,907 34 30,286
Greenhouse flowers na na na na 15 33,067 12 12,522
Greenhouse vegetables na na na na 14 7,979 17 11,689
Other greenhouse products na na na na 6 860 11 6,074
Total growing area for mushrooms
2 x 2 x 1 x 2 x
4.5 Livestock Production Livestock production has remained relatively stable over time, with a few exceptions. The most common form of livestock agriculture in the District of Saanich in 2011 was in hens and chickens at 130 farms reporting. Horse and pony operations are also common at 64 farms. Sheep and lamb production increased from 29 farms in 2006 to 45 farms in 2011 as did cattle and calves from 25 farms in 2006 to 39 farms in 2011. Other livestock production remained stable over that same time period.
21 The "number of farms reporting" does not equal the sum of the parts because farms reporting more than one category (or
activity) are only counted once.

38
Table 14. Livestock Production in the District of Saanich from 1996 to 2011. Source: Statistics Canada
1996 1996 2001 2001 2006 2006 2011 2011
# of Farms
# of Animals
# of Farms
# of Animals
# of Farms
# of Animals
# of Farms
# of Animals
Total hens and chickens 102 189,791 99 71,543 104 28,848 130 18,656
Turkeys 9 x 12 279 9 210 10 111
Other poultry 25 257 12 396 16 180 23 443
Total cattle and calves 57 526 41 901 25 803 39 606
Milk cows 7 60 2 x 0 0 2 x
Beef cows 39 155 28 x 23 368 20 x
Total pigs 14 x 7 37 8 107 9 99
Total sheep and lambs 40 1,021 28 501 29 443 45 789
Horses and ponies 67 512 54 400 56 450 64 434
Goats 16 182 20 128 16 106 17 187
Rabbits 7 81 2 x na na 4 138
Llamas and alpacas 6 35 7 74 8 69 10 69
Colonies of bees harvested for honey
15 x 21 x 18 x 19 77
4.6 Farm Practices The data reported by Statistics Canada indicates that farms in the District of Saanich tend to use sustainable production practices. Despite the increase in in total area of farms from 1,713 ha in 2006 to 2,222 ha in 2011, the amount of irrigated hectares decreased by 50 ha. Herbicide, insecticide, and fungicide use also decreased from 2006 to 2011 with a small increase in commercial fertilizer use. The use of lime increased substantially from 25 ha in 2006 to 87 ha in 2011, which could be due to increasing soil acidity in the region. Table 15. Farm Practices in the District of Saanich (Hectares). Source: Statistics Canada.
1996 2001 2006 2011
Irrigated 310 294 373 323
Commercial fertilizer na na 320 363
Herbicides na na 55 47
Insecticides na na 40 19
Fungicides na na 89 21
Lime na na 25 87
Manure - solid or composted (on surface) na na 31 38
Manure - solid or composted (incorporated) na na 2 64

39
4.7 Farm Valuation From 2006 to 2011 farms in Saanich became less profitable. The gross margin dropped from 8.31% in 2006 to 2.58% in 2011, meaning that for every dollar of sales, the farmer only earned 2.56 cents of profit. The BC gross margin average was 11.3% in 2011, so Saanich falls below the average range in the Province for profitability. Interestingly, gross farm receipts and total operating expenses decreased from 2006 to 2011 despite moderate inflation over that time period. Table 16. Gross Margin for Farms in Saanich. Source: Statistics Canada.
Year Gross Farm Receipts ($) Total Operating Expenses ($) Gross Margin22
2006 13,840,241 12,690,798 8.31%
2011 12,262,894 11,946,261 2.58%
The revenue per hectare for farms in the region also decreased from 2006 to 2011, but rose substantially since 2001. However, when adjusted for inflation, the numbers look different (Bank of Canada – consumer price index data inflation calculator www.bankofcanada.ca/rates/related/inflation-calculator/). In 2011, the $5,519 earned per ha equates to just $4,118 in 1996 dollars. This means that farmers have lost 25% over the last 15 years on a per hectare basis when adjusted for inflation at 1.93%. Table 17. Revenue per Hectare for Farms in Saanich. Source: Statistics Canada.
Year # of Farms Gross Receipts ($) Avg per Farm ($) Total Farm Area (Ha) Avg per Ha ($)
1996 245 10,285,904 $41,983 1,821 $5,648.00
2001 246 9,720,875 $39,516 3,952 $2,460.00
2006 251 13,840,241 $55,140 1,713 $8,080.00
2011 319 12,262,894 $38,441 2,222 $5,519.00
Perhaps not surprisingly then, 68% of farms were earning less than $10,000 in gross farm receipts in 2011.
Less than half of the farms are making over $10,000 and only 10% are making more than $50,000 per year.
Table 18. Distribution of gross farm receipts in District of Saanich in 2011.
Gross Farm Receipts in 2011 Number of Farms % of Farms
Under $10,000 218 68
$10,000 to $24,999 44 14
$25,000 to $49,999 24 8
$50,000 to $99,999 12 4
$100,000 to $249,999 12 4
$250,000 to $499,999 2 <1
$500,000 to $999,999 6 2
$1,000,000 to $1,999,999 1 <1
$2,000,000 and over 0 0
Total Farms 319
22 Gross Margin % = Gross Farm Receipts – Total Operating Expenses / Gross Farm Receipts x 100

40
Total farm capital has risen substantially from $154 million in 1996 to $418 million in 2011. Capital value in land and buildings is 97% of the total cost, indicating that land prices have increased steadily. The majority of farms (61%) fall within $500,000 and $1,499,999 with only 13% below $500,000.
Figure 18. Total Farm Capital Value in the District of Saanich. Source: Statistics Canada
4.8 Farmer Profile Only 0.4% of the population in the District of Saanich was actively involved in farming in 2011, according to the census of agriculture. However, the number of farmers did increase from 345 in 2006 to 495 in 2011. The number of farmers over 55 years of age and the increase in average age of farmers since 2006 indicates that few young people are pursuing farming as a career. Table 19. Farm Operator Profile for the District of Saanich. Source: Statistics Canada.
Farmers spent less time working on the farm in 2011 than they did in 2006. The number of farmers working > 40 hrs/week dropped from 90 to 70, while the number working < 20 increased from 165 to 275.
153,577,543 146,568,200
232,603,907
418,419,397
0
50,000,000
100,000,000
150,000,000
200,000,000
250,000,000
300,000,000
350,000,000
400,000,000
450,000,000
1996 2001 2006 2011
Total Farm Capital Value ($)
2006 2011
Total Population 108,265 109,752
Total Number of operators 345 (0.3%) 495 (0.4%)
Male 215 (62%) 280 (57%)
Female 140 (41%) 215 (43%)
Under 35 years 15 (4%) 20 (4%)
35 to 54 years 155 (45%) 180 (35%)
55 years and over 175 (51%) 305 (61%)
Average Age (years) 55.0 57.3
Farms with one operator 160 155
Farms with two or more operators 195 345

41
Table 20. Hours Spent Per Week Working for the Farm Operation. Source: Statistics Canada.
2006 2011
Less than 20 165 275
20 to 29 N/A 95
30 to 40 N/A 55
20 to 40 95 N/A
More than 40 90 70
4.9 Land Tenure Land tenure can be an indication of farm stability. Those leasing land have less tenure stability than those who own their land. Ownership tens to facilitate investments in infrastructure. In the District of Saanich, 86% of the land was owned in 2011, while 17.4% of the land was either leased from governments, rented or leased from others, crop-shared from others, or used through other arrangements. This represents a high level of farm stability in land tenure. Table 21. Land Tenure in the District of Saanich (Hectares). Source: Statistics Canada.
2006 % 2011 %
Total farm area 1,713 100% 2,222 100%
Area owned 1,533 89% 1,910 86%
Leased from governments x X x X
Rented or leased from others 189 11% 329 15%
Crop-shared from others x x x X
Land area used through other arrangements 24 1% 9 0.4%
Total area of land used by others 53 3% 43 2%
Farm ownership is predominantly through sole proprietorship in Saanich (63%) with a smaller proportion in a partnership with no written agreement. This is consistent with other areas of the Province. Table 22. Farm Ownership Models in Saanich (Number of Farms Reporting). Source: Statistics Canada.
2006 % 2011 %
Total Number of Farms 251 100% 319 100%
Sole proprietorship 177 71% 203 64%
Partnership with written agreement 5 2% 3 1%
Partnership with no written agreement 44 18% 74 23%
Family corporation 21 8% 28 9%
Non-family corporation 4 2% 10 3%
Other (institution, community pasture, etc.) 0 0% 1 0.3%

42
5.0 Urban Agriculture and Food Access
5.1 Organizations Working Towards Food Self-Sufficiency in Saanich In addition to rural farmland, urban agriculture contributes to food security in Saanich. There are a number of organizations working towards enhancing food self-sufficiency in the region. Some of these are located in the District of Saanich, while others work with farmers and communities within Saanich, but are located outside of the Saanich borders.
- LifeCycles Project Society - Capital Region Food and Agriculture Initiatives Roundtable (CRFAIR) - Saanich Neighbourhood Place - Fernwood NRG - Greater Victoria Compost Education Centre - Capital Region Beekeepers Association - Healthy Harvest Cooperative - Saanich Communities in Harvest Program - Saanich Community Food Bank Garden - City Harvest Coop – SPIN farming - Island Chef Collaborative - Victoria Native Friendship Centre - Victoria Horticultural Society - Victoria Master Gardener Association - Vancouver Island Coastal Communities Indigenous Foods Network (VICCIFN)
5.2 Community Gardens in Saanich The District of Saanich has a strong community gardens policy. They define a community garden as a site operated by volunteers and:
Used for the production of produce for personal use
Where instructional programming may be offered
Where plots and services are provided to members in exchange for a fee The community gardens in Saanich include: Gorge Park Community Gardens: This site includes an irrigation system; gravel path; rain garden, berms and swale; split rail fencing; portable toilet, and a garden shed. Saanich Neighbourhood Place: This organization funded by the help of the District of Saanich grows a small plot near their kitchen and holds food growing and meal making skill courses for families. Agnes Street Gardens (613 Agnes St): This garden has been in operation for over 30 years and is managed by the Agnes Street Gardener’s Association. There are approximately 80 plots. Capital City Allotment Association (641 Kent Rd): These allotment gardens have been operational since the 1970s and are located on land between the Pat Bay Highway and Carey Road. There are approximately 140 plots.
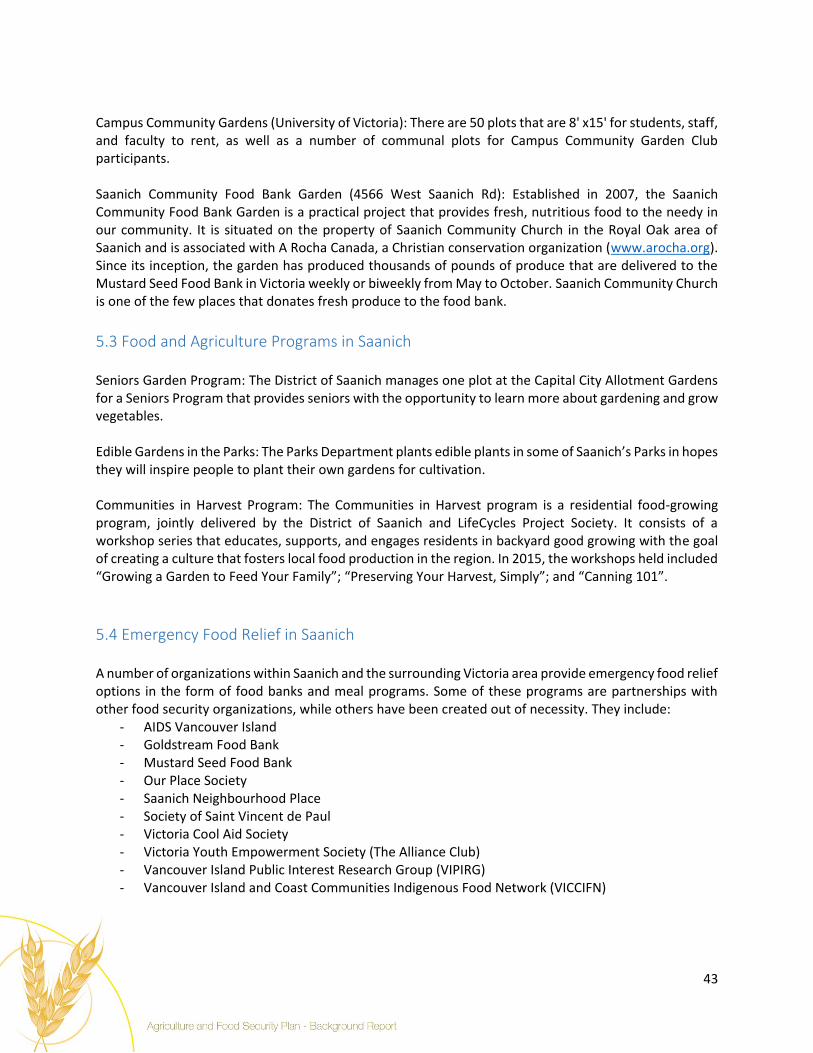
43
Campus Community Gardens (University of Victoria): There are 50 plots that are 8' x15' for students, staff, and faculty to rent, as well as a number of communal plots for Campus Community Garden Club participants. Saanich Community Food Bank Garden (4566 West Saanich Rd): Established in 2007, the Saanich Community Food Bank Garden is a practical project that provides fresh, nutritious food to the needy in our community. It is situated on the property of Saanich Community Church in the Royal Oak area of Saanich and is associated with A Rocha Canada, a Christian conservation organization (www.arocha.org). Since its inception, the garden has produced thousands of pounds of produce that are delivered to the Mustard Seed Food Bank in Victoria weekly or biweekly from May to October. Saanich Community Church is one of the few places that donates fresh produce to the food bank.
5.3 Food and Agriculture Programs in Saanich Seniors Garden Program: The District of Saanich manages one plot at the Capital City Allotment Gardens for a Seniors Program that provides seniors with the opportunity to learn more about gardening and grow vegetables. Edible Gardens in the Parks: The Parks Department plants edible plants in some of Saanich’s Parks in hopes they will inspire people to plant their own gardens for cultivation.
Communities in Harvest Program: The Communities in Harvest program is a residential food-growing program, jointly delivered by the District of Saanich and LifeCycles Project Society. It consists of a workshop series that educates, supports, and engages residents in backyard good growing with the goal of creating a culture that fosters local food production in the region. In 2015, the workshops held included “Growing a Garden to Feed Your Family”; “Preserving Your Harvest, Simply”; and “Canning 101”.
5.4 Emergency Food Relief in Saanich A number of organizations within Saanich and the surrounding Victoria area provide emergency food relief options in the form of food banks and meal programs. Some of these programs are partnerships with other food security organizations, while others have been created out of necessity. They include:
- AIDS Vancouver Island - Goldstream Food Bank - Mustard Seed Food Bank - Our Place Society - Saanich Neighbourhood Place - Society of Saint Vincent de Paul - Victoria Cool Aid Society - Victoria Youth Empowerment Society (The Alliance Club) - Vancouver Island Public Interest Research Group (VIPIRG) - Vancouver Island and Coast Communities Indigenous Food Network (VICCIFN)

44
6.0 References Agriculture and Agri-Food Canada (AAFC), 1998. The Canadian System of Soil Classification, 3rd Edition. http://sis.agr.gc.ca/cansis/taxa/cssc3/intro.html Agriculture and Agri-Food Canada (AAFC), 2010. Agriculture and Agri-Food Canada. http://www.agr.gc.ca/index_e.php Agricultural Land Commission (ALC), 2010. Agricultural Land Commission. http://www.alc.gov.bc.ca/legislation/legislation_main.htm BC Agriculture and Food Climate Action Initiative. Regional forecasting. http://www.bcagclimateaction.ca/regional/vancouver-island/ BC Ministry of Environment Water Resource Atlas. Interactive mapping tool. http://maps.gov.bc.ca/ess/sv/wrbc/ BC Laws, 2003. Community Charter. http://www.bclaws.ca/EPLibraries/bclaws_new/document/ID/freeside/03026_00 BC Laws, 2004. Food Safety Act: Meat Inspection Regulation. http://www.bclaws.ca/EPLibraries/bclaws_new/document/ID/freeside/10_349_2004 BC Laws, 2008. Agricultural Waste Control Regulation. http://www.bclaws.ca/EPLibraries/bclaws_new/document/ID/freeside/10_131_92 Capital Regional District Maps: Administrative Boundaries. https://www.crd.bc.ca/docs/default-source/legislative-pdf/crd-administrative-boundaries.pdf?sfvrsn=4 Capital Regional District – Featured Watersheds. https://www.crd.bc.ca/education/our-environment/watersheds/featured-watersheds/colquitz-creek/history-uses Capital Regional District, 2005. Agricultural Water Use and Conservation Study. https://www.crd.bc.ca/docs/default-source/water-pdf/agriculture_study.pdf?sfvrsn=2 Coastal Invasive Species Committee http://www.coastalisc.com Coast Priority Invasive Plant list: http://www.coastalisc.com/images/stories/CRISP/CRISP_Invasive_Plant_Species_list_by_Category_June_18-2013.pdf Curran, D. 2009. Capital Regional District Agricultural Legal & Policy Scan. https://www.crd.bc.ca/docs/default-source/crd-document-library/committeedocuments/planningtransportationandprotectiveservicescommittee/20090515/agenda-item-5---attachment-1-(second-paper)R.pdf?sfvrsn=0 Curran, D. 2014. British Columbia’s New Water Sustainability Act – Waiting for the Details http://poliswaterproject.org/sites/default/files/Bill%2018%202014%20Summary%20May%2013%202014.pdf Day, J.H., L. Farstad, DG Laird, 1959. Soil Survey of Southeast Vancouver Island and Gulf Islands, BC. Report #6 of the BC Soil Survey. Research Branch, Canada Dept. of Agriculture. www.sis.agr.ca/cansis/publications/surveys/bc/bc6/index.html

45
District of Saanich Water Utility Bylaw #8125. http://www.saanich.ca/living/pdf/waterutility8124.pdf District of Saanich. Rural Saanich Local Area Plan, 2007. Environment Canada Weather Normals: Saanichton CDA station. Accessed February 2016. Haddow, Wayne. Consumers are King. FarmSpeak, Summer 2001. Island Farmers Alliance. Holm, W. 1997. Saanich Peninsula Agricultural Plan. Kenk and Sondheim, 1987. The BC Ministry of Environment and Parks Thematic Mapping Geographic Information System. CAPAMP. Volume 1: Data entry and validation procedures for soil, agriculture capability, surficial geology and the all-purpose entity. MOEP Manual 10. Surveys and Resource Mapping Branch, Ministry of Environment and Parks. Kenny, S. 2004. Aquifers of the Capital Regional District. University of Victoria and BC Ministry of Water, Land, and Air Protection. http://www.env.gov.bc.ca/wsd/plan_protect_sustain/groundwater/aquifers/aquifers_crd/aquif_crd.html MacNair, E. (2004). A baseline assessment of food security in British Columbia’s Capital Region. Victoria, BC: CR-FAIR. http://www.farmfolkcityfolk.ca/GrowingGreenDocs/Jan_2004_Baseline_Assessment.pdf Ministry of Environment, 2013. BC Water Resources Atlas http://www.env.gov.bc.ca/wsd/data_searches/wrbc/ Pacific Climate Impacts Consortium. Plan2Adapt tool. Accessed February 2016: https://pacificclimate.org/analysis-tools/plan2adapt Revised Statutes of BC (RSBC), 1996. Right to Farm Act (Farm Practices Protection Act). Revised Statutes of BC. http://www.bclaws.ca/EPLibraries/bclaws_new/document/ID/freeside/00_96131_01 Revised Statutes of BC (RSBC), 1996a. BC Assessment Act. http://www.bclaws.ca/EPLibraries/bclaws_new/document/ID/freeside/00_96020_01 Revised Statutes of BC (RSBC), 1996b. Land Title Act. http://www.bclaws.ca/EPLibraries/bclaws_new/document/ID/freeside/96250_00 Rosella, L., 2001. Sunshine Coast: A Place to Be. Heritage House Publishing. Saanich Archives. District of Saanich website: http://www.saanich.ca/discover/artsheritagearc/saanicharchives/ Smith, B. 1998. Planning for Agriculture in BC. Agricultural Land Commission. http://www.alc.gov.bc.ca/publications/planning/Planning_for_Agriculture/index.htm Statistics Canada, 2012. Agricultural Census: Farm operator data. Released May, 2012. http://www.statcan.gc.ca/ca-ra2011/index-eng.htm Statistics Canada Census Data, 2011. http://www12.statcan.gc.ca/census-recensement/2011/as-sa/fogs-spg/Facts-csd-eng.cfm?Lang=eng&GK=CSD&GC=5917021 Statistics Canada. 2011. Census of Agriculture, Farm Data and Farm Operator Data. Statistics Canada. 2006. Census of Agriculture, Farm Data and Farm Operator Data. catalogue no. 95-629-XWE. http://www.statcan.gc.ca/pub/95-629-x/4/4123931-eng.htm

46
Statistics Canada. 2001. Census of Agriculture, Farm Data and Farm Operator Data. Statistics Canada. 1996. Census of Agriculture, Farm Data and Farm Operator Data. West Coast Environmental Law (WCEL), 2014. Strengths and weaknesses of the new Water Sustainability Act. http://wcel.org/resources/environmental-law-alert/strengths-and-weaknesses-new-water-sustainability-act West Coast Environmental Law (WCEL), 2005. Protecting the Working Landscape of BC. Prepared by D. Curran.