district level workshop capacity building of panchayat raj institutions
DESCRIPTION
District Level Workshop Capacity Building of Panchayat Raj Institutions. Dhalai District Administration. Backward Region Grant Fund. Earlier Rashtriya Sam Vikas Yojana [RSVY] Objectives To redress regional imbalances in development Bridge Critical Gaps - PowerPoint PPT PresentationTRANSCRIPT

1
District Level Workshop
Capacity Building of Panchayat Raj Institutions
Dhalai District Administration

2
Backward Region Grant Fund
• Earlier Rashtriya Sam Vikas Yojana [RSVY]
• Objectives– To redress regional imbalances in development– Bridge Critical Gaps– Support to PRIs for planning, implementation and
monitoring– Strengthen Panchayat and Municipal Governance

3
RSVY Funding
Year Component Yearly Entitlement
Fund Received
Expenditure Incurred
UC Position
Balance UC
2003-04 to
2007-08RSVY 4500 4500 4500 4500 00
Total 4500 4500 4500 4500 00

4
Fund Received and Utilized
Year Yearly Entitlement
Fund Received
Expenditure Incurred
UC Position
Balance UC
2006-07 1221.00 0.00 0.00 0.00 0.00
2007-08 1221.00 10.00 10.00 10.00 0.00
2008-09 1221.00 1098.00 1098.00 1098.00 0.00
2009-10 1221.00 769.00 769.00 769.00 0.00
2010-11 1221.00 1096.00 0.00 0.00 1096.00
Total 6105.00 2973.00 1877.00 1877.00 1096.00

5
Fund Received and UtilizedYear Yearly
EntitlementFund Received
Expenditure Incurred
UC Position
Balance UC
2006-07 100.00 0.00 0.00 0.00 0.00
2007-08 100.00 0.00 0.00 0.00 0.00
2008-09 100.00 83.61 83.61 83.61 0.00
2009-10 100.00 88.84 80.37 80.37 8.46
2010-11 100.00 55.00 0.00 0.00 55.00
Total:- 500.00 227.45 163.98 163.98 63.46

6
SL. NO.
Project item
Name of Block
TotalABS SLM DBN MNU CMN
1 Power 186.68 0.00 117.87 34.10 59.40 398.05
2 Education 17.26 16.36 56.19 44.48 54.26 188.55
3 Medical 15.55 10.00 10.00 10.00 10.00 55.55
4 PGP 0.00 0.00 5.00 20.00 0.00 25.00
5 Fisheries 3.00 12.00 16.00 0.00 0.00 31.00
6 Nagar Panchayat, KMP 60.00
7 Nagar Panchayat, ABS 10.85
Total : 222.49 38.36 205.06 108.58 123.66 769.00
Sector-Wise Allocation 2009-10
7
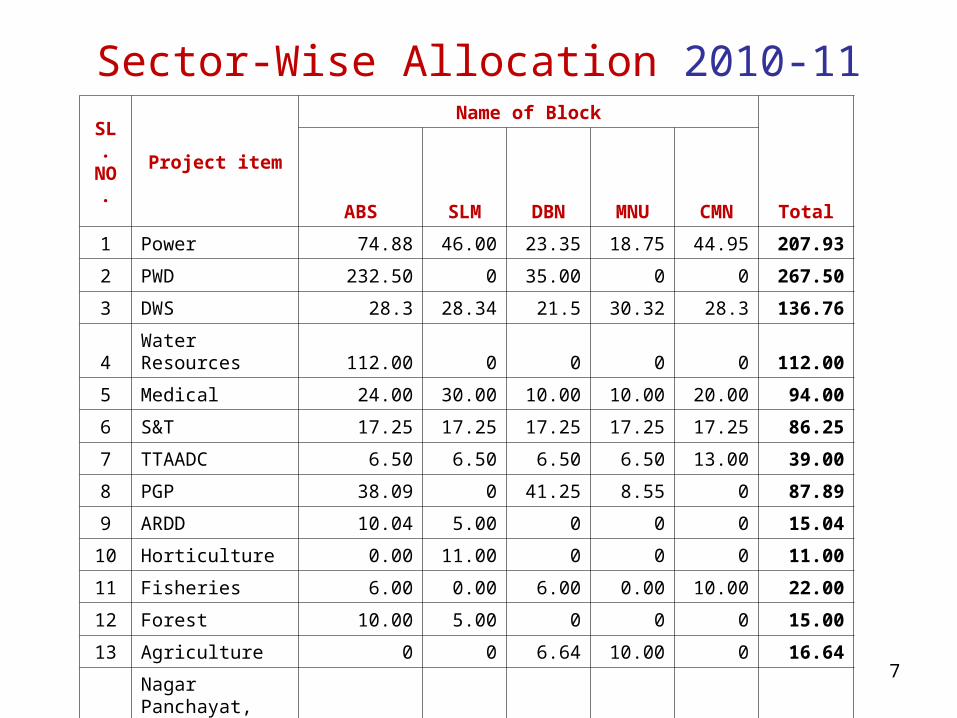
SL. NO
.Project item
Name of Block
TotalABS SLM DBN MNU CMN
1 Power 74.88 46.00 23.35 18.75 44.95 207.93
2 PWD 232.50 0 35.00 0 0 267.50
3 DWS 28.3 28.34 21.5 30.32 28.3 136.76
4 Water Resources 112.00 0 0 0 0 112.00
5 Medical 24.00 30.00 10.00 10.00 20.00 94.00
6 S&T 17.25 17.25 17.25 17.25 17.25 86.25
7 TTAADC 6.50 6.50 6.50 6.50 13.00 39.00
8 PGP 38.09 0 41.25 8.55 0 87.89
9 ARDD 10.04 5.00 0 0 0 15.04
10 Horticulture 0.00 11.00 0 0 0 11.00
11 Fisheries 6.00 0.00 6.00 0.00 10.00 22.00
12 Forest 10.00 5.00 0 0 0 15.00
13 Agriculture 0 0 6.64 10.00 0 16.64
14Nagar Panchayat, ABS 109.99
Total :- 559.56 149.09 167.49 101.37 133.50 1221.00
Sector-Wise Allocation 2010-11

8
Major Works 2009-10 11 KV LT Line at ABS/DBN/MNU/CMN : Rs. 398.05 Lakhs
Teacher Accomodation : Rs. 77.00 Lakhs
Class Room Furniture : Rs. 61.30 Lakhs
Infrastructure Dev. at KMP. NP : Rs. 60.00 Lakhs
Market Stall at DBN/MNU : Rs. 25.00 Lakhs
Health Sub-Centre (5 Nos.) : Rs. 50.00 Lakhs

9
Major Works 2010-11• 11 KV LT Line & LT Line Extension : Rs. 207 Lakhs
• Deep Tube Wells and IRPs : Rs. 175 Lakhs
• Improvement of Ampi-Dangabari Road : Rs. 137 Lakhs
• Prevention of River Erosion at Kulai etc : Rs. 112 Lakhs
• Health Sub-Centers : Rs. 94 Lakhs
• Solar Home Lighting Systems : Rs. 86 Lakhs
• Infra. Dev of ARDD, Fisheries, Agri. Forest:Rs. 68 Lakhs
• Roads and Drains in Ambassa NP :Rs. 109Lakhs

10
Capacity Building - Infrastructure
• Construction/ Extension of Panchayat Ghar• Computers, Printers, UPS to GPs/ ADC Villages• Telephone and Internet Connections• Establishment of Training Center in DZP Building. • Establishment of Computer Lab at Ambassa & SIPARD.• Setting-up of Planning Cell at Block Level. • Three Storied Panchayat Training Center

11
Capacity Building- Training1. Trainers Training Program:
– 30 Trainers– 2 weeks Course at SIPARD
2. Foundation Course for Elected Representatives– 1320 Elected Representatives– 6 days course– 50 Batches of 30 each at DZP Training Center &
SIPARD3. Basic Functional Course for Elected Representatives
– 300 Elected Representatives– 6 days course– 10 Batches of 20 each.

12
Capacity Building - Training
4. Accounting and Auditing:– 300 officials from all GP/ADC village– 6 days course– 10 batches of 30 each
5. Basic Computer Training:– Elected Representatives and Officials– 6 days course– 35 batches of 20 each at DZP and SIPARD

13
Name of Block
Total No. of Computers, UPS, Printer available at Block Level
Total No. of GP/ ADC Villages
Total No. of computers, UPS, Printer Sanctioned at Block/GP/ADC Village
Level
Total No. of computers, UPS, Printer Supplied
at Block/GP/ADC Village Level
No. GP/ADC villages having Internet
connectivity
Ambassa 8 28 C-29, UPS-29, P-29 C-23, UPS-23, P-23 2
Chawmanu 10 14 C-15, UPS-15, P-15 C-5, UPS-5, P-5 1
Dumburnagar 7 19 C-20, UPS-20, P-20 C-7, UPS-7, P-7 3
Manu 9 26 C-27, UPS-27, P-27 C-25, UPS-25, P-25 1
Salema 7 43 C-44, UPS-44, P-44 C-0, UPS-0, P-0 1
TOTAL : 41 130 C-135, UPS-135, P-135 C-60, UPS-60, P-60 8
ICT Infrastructure with PRIs upto Sep 2010

14
Labour Budget for 2010-11
Target of Employment Generation : 71.49 Lakhs Mandays.
Estimated Amount for Wage Payments : Rs. 71.49 Crores.
Administrative and Contingency Expenditure : Rs. 7.58 Crores
Material Component as per Labour Budget : Rs. 47.23 Crores.
Total Labour Budget for 2010-11 : Rs. 126.30 Crores
Fund Availability in 2010-11
Opening balance as on 31.03.2010 : Rs. 49.77 Lakhs.
Central Share : Rs. 4698.08 Lakhs
State Share : Rs. 202.57 Lakhs
Misc. receipt (Bank Interest) : Rs. 5.17 Lakhs
Total fund available during 2010-11 : Rs. 4955.59 Lakhs.
Fund Utilization in 2010-11
Utilised on wages component : Rs. 2380.00 Lakhs (62%)
Utilised on pure Material component : Rs. 1458.16 Lakhs (38%)
Utilised on Admn. Expenditure : Rs. 133.65 Lakhs (3%)
Status on utilization of fund (as on 30-09-2010) : Rs. 3971.81 Lakhs.

15
Expenditure & Mandays Generation upto Sep 2010
Name of Block
Total fund
received
Expenditure (In Lakhs) Manday Generated (In Lakhs)
Target as per
LB
Actual Exp.
Upto Sep ‘09 in
2009-10
As per MIS
Target as per
LB
Actual MD
generated
Upto Sep ‘09 in
2009-10
As per MIS
Ambassa 841.02 788.10 757.33279.62
628.82 4.46 4.121.65
3.73
Chawmanu 602.68 435.51 495.00201.45
424.06 2.47 2.751.52
2.57
Dumburnagar 824.54 786.50 681.98302.15
486.11 4.45 4.432.7
2.95
Manu 1033.15 1100.48 998.37415.2
647.04 6.23 6.173.16
4.72
Salema 1304.37 1144.82 1039.13455.47
862.84 6.48 6.333.66
4.96
TOTAL 4605.76 4255.41 3971.811653.89
3048.87 24.09 23.8012.69
18.93

16
Name of Block
Total No. of Job Card
Holders
No. of Job card Holders Demanded
Employment
No. of Job Card
Holders Provided
Employment
Average mandays generated
Upto Sep’ 09(2009-
10)
Mandays generated (in lakhs)
Average (as per demand)
Average (as per total J/Cards)
Ambassa 11826 9198 9198 4.12 41 31 19
Chawmanu 7012 6761 6761 2.75 41 39 22
Dumburnagar
12056 9145 9145 4.43 48 38 22
Manu 17051 16012 16012 6.17 38 36 18
Salema 24650 15674 15674 6.33 40 26 16
TOTAL : 72595 56790 56790 23.80 42 33 19
Demand and Provision of Mandays upto Sep 2010

17
Name of Block
Total Fund
available
Total Expenditure
Expenditure on wages
Expenditure on
materials
Wage - Material ratio
Ambassa 841.02 757.33 412.00 345.33 56:44
Chawmanu 602.68 495.00 275.00 220.00 56.44
DBN 824.54 681.98 443.00 238.98 65:35
Manu 1033.15 998.37 617.00 381.37 62:38
Salema 1304.37 1039.13 633.00 406.13 61:39
TOTAL : 4605.76 3971.81 2380.00 1591.81 60:40
Wage Material Ratio upto Sep 2010

18
Name of Block
Water harvesting (in nos. & Ha)
Formation of road (in nos. &
KM)
Brick Soling road (in nos.
& Km)
Culvert
Irrigation
facilities (in ha)
Extension of
irrigation channel (in Km)
Plantation (in ha)
No. Ha. No. Km No. Km
Ambassa 54 26.4 58 52 1 1 3 17 42
Chawmanu 16 7.5 75 137 14 10.26 3 0 0 63
DBN 67 17.25 79 32.75 12 9.75 0 17.5 2.75 94
Manu 7 2.01 72 87 2 2.25 0 74 15 0
Salema 53 33.5 93 115 26 38.83 0 79 79 26.4
TOTAL : 197 86.66 377 423.75 55 62.09 6 187.5 96.75 225.4
Assets Created upto Sep 2010

19
Name of Block
Water harvesting (20 - 25%)
Drought Proofing
(Plantation) (15 - 20%)
Irrigation facilities (20 - 25%)
Road Connectivity
(15 - 20%)
Others (0- 5%)
Ambassa 27 22 14 30 10
Chawmanu 7 16 0 78 1
Dumburnagar 37 13 10 31 8
Manu 5 0 3 72 14
Salema 20 15 25 20 5
TOTAL : 19 13 10 46 8
Sector-wise Expenditure upto Sep 2010

20
Name of Block
Fund
Agri/
Fishery
HH &
Forest ARDD ADC others TOTALHorti Sericulture
Ambassa
Requirement of fund 92.09 58.49 45.54 91.79 15.06 106.99 95.87 505.83
Fund placed 45.60 58.47 14.70 57.58 10.98 23.57 58.55 269.45
Fund utilized 2.50 51.00 0.00 3.15 2.66 6.79 38.08 104.18
Chawmanu
Requirement of fund 53.61 33.08 11.58 99.90 9.86 16.31 73.43 297.78
Fund placed 10.00 33.08 7.55 48.08 1.50 16.31 66.70 183.23
Fund utilized 2.91 19.55 4.20 23.23 0.00 5.29 27.09 82.27
Dumburnagar
Requirement of fund 96.00 91.53 11.58 0.00 0.00 95.40 54.79 349.30
Fund placed 6.54 25.50 3.38 0.00 0.00 28.62 29.35 93.38
Fund utilized 0.00 22.29 0.00 0.00 22.66 27.09 72.04
Manu
Requirement of fund 78.05 77.37 11.68 96.82 3.33 78.58 116.36 462.19
Fund placed 12.28 21.16 7.00 80.26 1.00 29.99 71.70 223.39
Fund utilized 0.00 12.69 0.00 10.46 0.00 15.42 54.67 93.23
Salema
Requirement of fund 43.43 70.29 44.79 57.03 24.60 76.12 62.33 378.60
Fund placed 6.90 29.84 13.44 25.00 7.38 15.08 48.77 146.41
Fund utilized 1.75 23.73 4.23 7.42 5.06 10.92 38.52 91.62
TOTAL :
Requirement of fund
363.18 330.76 125.18 345.54 52.86 373.40 402.78 1993.70
Fund placed 81.31 168.05 46.06 210.92 20.86 113.57 275.08 915.86
Fund utilized 7.16 129.26 8.43 44.26 7.72 61.08 185.45 443.34
Convergence with Line Depts. upto Sep 2010

21
DistrictNo. of
job card holder
No. of Accounts opened in Banks
No. of Accoun
ts opened in Post Office
Total no. of
account opened
% of Job card
holders having account
% Job card holders getting wages
through A/c
% of Job card
holders getting
wages by cash
Ambassa 11826 10791 0 10791 91% 87% 0
Chawmanu 7012 6945 0 6945 99% 100% 0
DBN 12056 12056 0 12056 100% 100% 0
Manu 17051 13748 2017 15765 92% 88% 0
Salema 24650 17562 5818 23380 98% 98% 0
TOTAL : 72595 61102 7835 68937 95% 95% 0
Bank and Post Office Accounts upto Sep 2010

22
Name of Block
No. of Block level officers engaged for
inspection of MGNREGA works
No. of works inspected by them
Block Level% of
inspectionDist. level
% of inspec
tion
Ambassa 7 80 39 35 18
Chawmanu 2 98 85 8 3.5
Dumburnagar 12 144 89 33 11
Manu 7 35 25 0 0
Salema 14 150 39 0 0
TOTAL : 42 507 51 76 33
Inspection of Works in Sep 2010

23
Name of Block
Total No. of Job card holders
No. of uncovered job card holders
No. of job card holders taken into
B.C. Model
Ambassa 11826 5518 6308
Chawmanu 7012 7012 0
Dumburnagar 12056 0 12056
Manu 17051 17051 0
Salema 24650 24650 0
TOTAL : 72595 54231 18364
Extension of BC Model upto Sep 2010

24
Panchayat Development Fund 2009-10 Sl. No
Block Panchayat Samiti / BAC Share GP/Village Share Total Received
Total Expenditure
Received Expenditure Received Expenditure
1 ABS17.77402 17.77402 56.34221 56.34221 74.11623 74.11623
2 CMN12.37410 12.15500 30.95244 27.74419 43.32654 39.89919
3 DBN19.38160 12.26820 50.06143 50.06143 69.44303 62.32963
4 MNU29.68430 29.68430 90.18819 90.18819 119.87249 119.87249
5 SLM39.41257 39.41257 68.99426 51.87049 108.40683 91.28306
6 DZP22.86169 22.86169
7 Total118.62659 111.29409 296.53853 276.20651 438.02681 410.36229

25
Panchayat Development Fund 2010-11Sl. No
Name of Block
Panchayat Samiti / BAC Share
GP/Village Share Total Received
Total Expenditure
Received Expenditure Received Expenditure
1 ABS5.85077
0.00000 15.29637 8.81898 21.14714 8.81898
2 CMN4.10522
0.00000 9.58927 0.00000 13.69449 0.00000
3 DBN6.43003
0.00000 15.01967 0.00000 21.44970 0.00000
4 MNU36.1815
28.91018 26.10420 26.10420 62.28570 55.01438
5 SLM11.88436
2.86135 21.85267 13.88772 33.73703 16.74907
6 DZP 7.60000 0.60000
7Total 64.45188 31.77153 87.86218 48.81090 159.91406 81.18243

26
12th Finance Commission 2009-10
Sl. No
Name of
Block
Panchayat Samiti / BAC Share GP/Village Share Total Received
Total Expenditure
Received Expenditure Received Expenditure
1 ABS0.00000
0.00000 47.18270 36.28510 47.18270 36.28510
2 CMN37.18270
35.30000 28.00000 23.60000 65.18270 58.90000
3 DBN0.18250
0.18250 39.00000 33.90000 39.18250 34.08250
4 MNU0.00000
0.00000 60.18270 60.18270 60.18270 60.18270
5 SLM0.00000
0.00000 64.50000 44.47123 64.50000 44.47123
6DZP 1.83000 0.00000
7Total 37.36520 35.48250 238.86540 198.43903 278.06060 233.92153

27
12th Finance Commission 2010-11Sl. No
Name of
Block
Panchayat Samiti / BAC Share GP/Village Share Total Received
Total Expenditure
Received Expenditure Received Expenditure
1 ABS 0.000000.00000
0.00000 0.00000 0.00000 0.00000
2 CMN 0.000000.00000
6.80500 0.00000 6.80500 0.00000
3 DBN 0.000000.00000
10.65867 0.20000 10.65867 0.20000
4 MNU 0.000000.00000
16.32457 0.00000 16.32457 0.00000
5 SLM 0.000000.00000
23.37677 0.00000 23.37677 0.00000
6 DZP 0.00000 0.00000
7 Total 0.000000.00000
57.16501 0.20000 57.16501 0.20000

28
13th Finance Commission 2010-11
Sl. No
Name of
Block
Panchayat Samiti / BAC Share GP/Village Share Total Received
Total Expenditure
Received Expenditure Received Expenditure
1 ABS 7.652940.00000
12.75419 0.00000 20.40713 0.00000
2 CMN 4.961610.00000
8.26946 0.00000 13.23107 0.00000
3 DBN 8.260570.00000
13.76779 0.00000 22.02836 0.00000
4 MNU 12.147200.00000
20.24556 0.00000 32.39276 0.00000
5 SLM 16.046680.00000
26.73852 0.00000 42.78520 0.00000
6DZP 8.73605 0.00000
Total 49.06900 0.00000 81.77552 0.00000139.5806
00.00000

29
Thank You