district a - isu school of education - iowa state university
TRANSCRIPT

P R O J E C T A A I M S : A L G E B R A A S S E S S M E N T A N D I N S T R U C T I O N – M E E T I N G S T A N D A R D S
Alignment of Algebra Curriculum, Assessment, and Instructional Practices in District A:
A Case Study of Spring 2004
Jeannette R. Olson, M.S.
Linda Lind, Ph.D.
Anne Foegen, Ph.D.
Iowa State University
December 2007
Project AAIMS is funded by the U.S. Department of Education,
Office of Special Education Programs, Grant # H324C030060

Project AAIMS District A Case Study - 1
Project AAIMS (Algebra Assessment and Instruction: Meeting Standards) is a federally funded project that has two objectives. The first is to examine the alignment of algebra1 curriculum, instruction, and assessment in general and special education. The second is to develop and validate algebra assessments tools for use in general and special education classes. This case study focuses on the first objective – it examines the alignment of algebra curriculum, instruction, and assessment for students with and without disabilities in one of the three districts participating in Project AAIMS.
We begin this case study by describing our data sources. This description is followed by background information about District A, a brief description of the teachers and students who participated in this project, and a summary of the algebra curriculum in this district. Next, we take a closer look at algebra instruction in District A, as well as discuss the district’s assessment results. We conclude the case study by addressing our findings related to the alignment of curriculum, instruction, and assessment for students with and without disabilities in this school district.
Sources of Data
In an attempt to explore the similarities and differences in curriculum, instruction, and assessment for general education and special education students enrolled in District A’s algebra classes, the research team gathered information for this case study during the spring of 2004 using a variety of methods. We reviewed documents, conducted twenty-four observations of algebra, and interviewed teachers and an administrator.
Document Review Members of the research team analyzed the district’s annual reports, standards and benchmarks, website, algebra textbooks, and 2000-2002 School Improvement Plan. We also examined the Iowa School Profile for this district on the Iowa Department of Education website, as well as student progress reports (printouts of electronic grade book pages) and standardized test math scores for students from whom we had student and parent consent for additional information about algebra achievement. Our goal in conducting this review was to identify District A’s established curriculum, instruction, and assessment guidelines, as well as its achievement results. Observations Two types of classroom observations were conducted concurrently. The first type used a systematic, momentary time sampling observation system, while the second type used an anecdotal observation form to document aspects of instruction that may not have been captured with the former system. Whereas the momentary time sampling observations used predetermined codes and required observers to record only the most prevalent student behavior, teacher behavior, instructional organization, and task format, the codes for the expected tasks, teacher actions, and student actions during the anecdotal observations were derived after all the data had been collected. (See Olson, Foegen, and Lind, 2006 for a thorough description of the momentary time sampling observation results and Olson, Foegen,
1 Throughout this case study any time we refer to algebra, we mean beginning algebra courses such as Algebra I or Pre-Algebra.

Project AAIMS District A Case Study - 2
and Lind, 2007 for a comprehensive examination of the anecdotal observation data.) We believe that by using these two observation methods we were able to develop a more complete depiction of the algebra curriculum and instruction approaches used in District A’s algebra classes. Interviews Four group interviews were conducted with the participating teachers. During two of the interviews questions were asked of all the teachers. Later, the general education teachers and then the special education teachers were interviewed as separate groups. The principal participated in an individual interview. All of the interviews were tape recorded and transcribed for later review and analysis. (See Appendix A for a copy of the interview protocols.) Having the opportunity to analyze data from multiple sources allowed us to develop a more complete description of the algebra curriculum, instructional practices, and assessment approaches for students with and without disabilities in District A. This description begins with some background information about the district.
The School District
The participating school district, which was formed in 1957, serves four small towns as well as the rural agricultural areas between the towns. Approximately 7,000 residents live within the 85 square miles of the district. The district’s website describes the location as a place that “provides the opportunities of small town living while enjoying access to metropolitan activities.” In 2003-04, the junior/senior high school had an enrollment of approximately 600 students; about 12 percent of these students received special education services. Approximately 13 percent of the district’s students were eligible for free and reduced lunch, and three percent were of diverse backgrounds in terms of race, culture and ethnicity. Nearly 87% of District A’s graduates plan to pursue post-secondary education/training. More than 81% scored 20 or higher on the ACT. Although the district has a very low drop out rate (only three students dropped out in 2003-2004), students with IEPs leave school before graduating at a much higher rate than their general education classmates. The Teachers Participating teachers included two general education algebra teachers (one high school teacher and one middle school teacher) and two special education algebra teachers. All of the teachers held standard Iowa teacher’s licenses. One general education teacher had a 7-12 mathematics endorsement, while the other had a K-6 mathematics endorsement and a middle school endorsement. Both of the special education teachers had special education endorsements. (At the time of this case study, both of these teachers had taught algebra for four years; however, under the current IDEA regulations, they would not be considered highly qualified algebra teachers.) Two teachers had additional graduate work beyond a Bachelor’s degree and one of the special education teachers had a Master’s degree. All of the teachers had at least three years of teaching experience (range 3 to 24 years) and a minimum of two years teaching algebra (range 2 to 4 years). The middle school general education teacher taught the eighth grade Algebra course. The high school general education teacher taught five algebra classes (three Algebra 1 classes, one Algebra IA class, and one Algebra IB class) throughout the day. One special education teacher taught pre-algebra to a small group of students with disabilities, while the other taught Algebra Special

Project AAIMS District A Case Study - 3
Education to another small group of ninth grade students identified as having deficits in the area of mathematics. The Students Student participants included youth in the eighth through twelfth grade (13 to 18 years old) who were currently enrolled in a beginning algebra course. The student participants included students with and without disabilities. While the majority of general education students took Algebra I in ninth grade, there were some 10th, 11th, and 12th grade students enrolled in most of the various algebra options. Of the 141 students taking algebra, about thirteen percent were special education students. Six of these students received algebra instruction from a special education teacher (those in Algebra Special Education or Pre-Algebra Special Education). A total of 63 students were enrolled in the three Algebra I classes and 57 students were enrolled in either Algebra IA or Algebra IB. These general education classes included students with IEPs; however, none of the 15 students in the eighth grade Algebra I class had IEPs during the case study semester. Four students with disabilities were enrolled in Algebra Special Education, and two students with disabilities were enrolled in the Pre-Algebra Special Education course. The Curriculum District A requires three years of high school math for graduation. As a result, most students must take at least one Algebra class. At the time of this study the district’s junior/senior high school offered several alternatives for algebra instruction. Advanced students could take algebra in 8th grade, one year ahead of the typical timeline. At the high school level, which used a traditional seven-period schedule, students could choose between Algebra I, the traditional course, taught over the course of an academic year, or Algebra IA and Algebra IB. With the IA/IB option, students completed the algebra course over a two-year time period. This slower pace was intended to allow additional time to master the concepts of algebra for students who might experience difficulty with this subject. In addition to these options, students who were receiving special education services could choose to enroll in either a Pre-Algebra course or an Algebra I course taught by a special education teacher. Enrollment in the eighth grade Algebra I class was limited to advanced students who have earned appropriate scores on the math section of the Iowa Tests of Basic Skills (ITBS) and an algebra aptitude test. Students who enroll in the traditional Algebra I class have usually earned at least a passing grade in their eighth grade math class, while students with poor math grades are encouraged to take Algebra 1A. (Algebra 1A is a slower paced version of Algebra 1 that focuses on the first six chapters of the textbook over the course of a full academic year. Students who enroll in this course have the option of finishing the traditional Algebra I curriculum by taking Algebra 1B in a subsequent year.) For students with disabilities, the IEP teams select the most appropriate course option after considering the student’s motivation, work habits, strengths, weaknesses, and the pace of instruction in each option. The typical sequence of mathematics courses for general education students is Algebra I in ninth grade, Geometry in tenth grade, and Algebra 2 in Eleventh grade. Most students do not take a mathematics class during their senior year. The district standards and benchmarks for grades seven through ten include the following goals related to algebra:

Project AAIMS District A Case Study - 4
Understand basic algebra Solve linear equations involving one or two steps. Write and solve algebraic equations (a+x=b, ax=b, a+x=b+x) Represent situations that involve variable quantities with expressions, equations,
inequalities and metrics Use a variety of models (e.g., written statement, algebraic formula, tables of input-
output values, graphics) to represent functions, patterns, and relationships Use tables and graphs as tools to interpret expressions, equations, and inequalities
The district adopted new mathematics textbooks in 2000. The traditional high school Algebra I classes and the eighth grade Algebra I class used Algebra I published by McDougal Little (Larson, Boswell, Kanold, & Stiff, 2001b). The Pre-Algebra Special Education, Algebra IA, and Algebra IB classes used Algebra I: Concepts and Skills, which is also published by McDougal Littell (Larson, Boswell, Kanold, & Stiff, 2001a). The copyright page from this textbook indicates that this book focuses on the essentials of algebra and it was “written to make algebra concepts and skills understandable to all students.” These textbooks were chosen because they fit well with the district’s standards and benchmarks. A cursory review of the textbook revealed that all of the district standards are addressed in the first six chapters of these twelve chapter textbooks. The Algebra Special Education class used an algebra book published by the American Guidance Service (Haenisch, 1998) that was designed for students who need additional help in understanding new concepts in algebra. It uses a step by step approach and has a reading level of 3.5. When we looked at the algebra curriculum for students with and without disabilities, we did not find major differences. There were special education students in all of the general education algebra courses (Algebra I, Algebra IA, and Algebra IB) except for eighth grade Algebra I, which only had advanced students. Special education students in these courses used the same materials and received the same assignments as their general education peers. The eighth grade Algebra I and the high school Algebra I classes were studying similar topics during our observations. As we noted earlier, the students in the Pre-Algebra Special Education, Algebra IA, and Algebra IB classes used a different textbook than the eighth grade Algebra I class and the high school Algebra I classes; however, their book was published by the same company. This text addressed similar topics in each chapter using simpler language in the explanations and more “checkpoints” or opportunities for guided practice in each lesson. It also included more opportunities for “Maintaining skills” in each chapter. The students in the Pre-Algebra Special Education class were working on assignments from the same chapter as the Algebra IA class when we made our observations, which surprised us because the Pre-Algebra Special Education class is a prerequisite for the Algebra Special Education course which is supposed to be equivalent to Algebra IA. Although the students in the Algebra Special Education class used a different textbook by a different publisher, they were learning some of the same algebra topics as their Algebra IA and Pre-Algebra Special Education peers. (The reader should note that this district no longer has separate special education and general education algebra courses. Now, courses that are equivalent to Algebra IA and Algebra IB are co taught by a general education math teacher and a special education teacher.)

Project AAIMS District A Case Study - 5
Algebra Instruction in District A
In this section of this case study, we will focus on instruction in each of the different beginning algebra classes. What follows is a glimpse at the algebra instruction in each course based on three observations of each class near the end of the school year. (Algebra I was observed nine times as there were three sections of this course. It was the only course with multiple sections.) The following descriptions provide an overview of each type of beginning algebra class, drawing from the observation and interview data. Pre-Algebra Special Education This class was held in a regular sized classroom with many desks and some work tables for students. The two students who were enrolled in this course had IEP’s with a math goal and needed to solidify some of their math skills before they moved on to Algebra Special Education or Algebra IA. A special education teacher taught this course during the last period of the school day (Period 7). Each day was different in this class. During our observations students worked on an assignment the whole class period on one day, they spent the period reviewing material on another day, and on a third day they began the class with a question and answer review time which was followed by guided practice and then an in class assignment that was checked by the teacher at the end of the period. This teacher moved through the pre-algebra curriculum at her students’ pace, as evidence by her comments during the interview with special education teachers, “If they get it, we move on. If they don’t, we keep working on it.” This teacher spent a majority of her time reviewing content, providing individual student assistance, and modeling algebraic skills. In addition, she was expected to work with students from other classes, including other math classes, as they completed their assignments in her room at the same time she was teaching the algebra students. Algebra Special Education Algebra Special Education is intended to be equivalent to Algebra IA, but with fewer students and more opportunity to review basic math skills and more individualized instruction to meet students’ learning needs. Four students were enrolled in this class (as compared to 29 in the Algebra IA class). All of the students in this class had math goals in their IEPs. They worked in a small room with a teacher’s desk and several student tables. A second special education teacher taught this class, which met at the beginning of the school day (Period I). This teacher provided students with a list of assignments for each chapter without including any due dates because it sometimes took students longer to learn some of the algebra concepts and skills than others. Consequently, she did not have a set timetable for completing each chapter. The class period began with the teacher introducing a new concept or skill or leading an interactive review of the previous day’s content. This activity usually took ten minutes or less. An assignment was given and the students began to work. During the work time the teacher did paperwork, worked with individual algebra students, or assisted other students who came for help with assignment for other classes. Most students

Project AAIMS District A Case Study - 6
finished their assignment in about twenty minutes and then they checked their work or turned it in to the teacher to check. This teacher believes that it is important for her students to be able to finish their work and have it checked before the end of the period so that the teacher and the students can see how well they understand the current algebra topic. She aims for “Quality in smaller amounts of time.” Once students turned in their work they worked on homework for their other classes or read the newspaper or a magazine for the remainder of the class time. Algebra IA The Algebra IA classroom was filled with student desks that were arranged in rows, a teacher’s desk, and a few tables at the sides of the room. There was a chalkboard-sized dry erase board at the front of the room. In addition, an overhead projector was set up near the front of the room for the teacher to use as he moved through the day’s lesson. This course is a general education class that progresses through beginning algebra content at a slower pace than the traditional Algebra I course. In essence, this course addresses the first half of the content that is included in Algebra I during a full academic year instead of one semester. Twenty-nine students were enrolled in Algebra IA, with at least two students who had IEPs, one of which included a math goal. This class was taught by the high school general education algebra teacher during the last class period of the day (Period 7). The class period started with a rebus puzzle (called a “Plexer”) to get students thinking. Between five to ten minutes was devoted to this activity. Checking homework usually came next and lasted five to ten minutes. This time included opportunities for the students to ask questions about different homework problems and to have the teacher review some or all of the steps needed to solve a particular problem. The third activity on most days was a short lesson when the teacher introduced or reinforced a new algebra topic or skill. After this instruction students worked on an assignment for nearly one half of the class period. The Algebra IA teacher spent the most time monitoring students as they worked on individual assignments. He also provided a good deal of individual student assistance. Slightly less time was devoted to modeling new skills and presenting new content. Algebra IB The Algebra IB course was taught in the same classroom as the Algebra IA course by the same general education algebra teacher. Like the Algebra IA course this is a slower paced version Algebra I. It addresses the second half of the content that is included in Algebra I. Twenty-eight students were enrolled in this class. At least four of the students received special education services, and one of these students had a math goal on his or her IEP. This class met at the beginning of the day (Period I). A typical Algebra IB class started with the same kind of warm up as the other classes taught by this teacher. Next, students usually checked their homework from the previous day with the teacher answering students’ questions about the previous day’s work or showing how to solve a particular problem. On some days the teacher presented new content which was followed by opportunities for the students to participate in some guided practice. On other days students went straight to working on a homework assignment or a worksheet. Students were generally given at least half of the class period to work on the current assignment.

Project AAIMS District A Case Study - 7
In this class the teacher typically spent the most time providing individual student assistance and leading reviews. On the days he introduced new content he explained the new topic and modeled new problem solving techniques. Algebra I The three Algebra I classes were taught by the same teacher in the same room as the Algebra IA and Algebra IB classes. Most of the twenty-three students were ninth graders; however some of them were tenth, eleventh, or twelfth graders. Two of the algebra I students for who we obtained consent had IEPs. This is the traditional beginning algebra course that spans the duration of an academic year. Typically, two or three weeks are spent exploring the skills and concepts in each of the twelve chapters in the algebra textbook. All three of the traditional Algebra I classes followed the same general pattern. Class started with a warm up activity, which was often a rebus puzzle that was displayed using the overhead projector. Once this puzzle was solved (usually in a little over 5 minutes), students started checking their homework by comparing their answers with the answers that were displayed using an overhead projector. Students asked questions about any of the problems that they found challenging, and then the teacher showed how to solve these problems. This took almost half of the class period. Next, the teacher spent a few minutes introducing the new content for the day and provided several examples for the students to see how to solve problems of this type. Once students seemed to understand the new procedures and content, they started to work on the assignment with about one third of the period left. In Algebra I, the teacher spent more time modeling how to solve problems when students were checking their homework than he did in the Algebra IA and IB classes. Students spent less time working on assignments in this class; consequently, the teacher spent slightly less time providing individual student assistance. Eighth Grade Algebra I The eighth grade Algebra I classroom looked very much like the high school Algebra I classroom with a chalkboard-sized dry erase board in front of rows of desks and an overhead projector for the teacher to use. One of the main differences was the size of the class. Only 15 students were taking algebra I this year. Nevertheless, this class was larger than it had been in the past according to the school principal. None of these students received special education services. This course is designed for advanced students who met certain admissions criteria (reaching a designated score on the math section of the ITBS, as well as on an algebra aptitude test). A middle school math teacher taught this class which was scheduled for the middle of the school day (period 4). On a typical day this class period was 50 minutes in length with 25 minutes of class, a 24 minute lunch break, and then 25 more minutes of class time. This class began with a mathematics activity that stimulated every day life such as paying rent or purchasing insurance. Next, students checked their homework, unless they were getting a test back. In that case the teacher would go over the test. More than half of the class period was spent going over new content, using manipulatives when appropriate. Once the teacher finished her lesson, the students had

Project AAIMS District A Case Study - 8
about one fifth of the period to start working on their homework assignment for that day. The teacher worked with individual students as they started their assignments. The eighth grade algebra I teacher spent most of her time modeling algebra problem solving strategies and explaining new content. The students in this class did not have much time to work on assignments during class time so she spent less time providing individual student assistance when compared to the other District A algebra teachers. This teacher spent about the same amount of time on each chapter in the algebra textbook as her high school algebra colleague. Instruction Across Beginning algebra Classes in District A The above descriptions of the different algebra classes provide a very broad overview of how class time was spent. We also conducted a closer examination of the quantitative and qualitative data from the study and identified some interesting insights into what algebra instruction looks like for students in general education and special education classes. (Readers interested in a more detailed treatment of the quantitative data from the momentary time sampling observations are referred to Olson, Foegen, and Lind, 2006. Those interested in the narrative data from the anecdotal observations are referred to Olson, Foegen, and Lind, 2007.) When we considered our data on the instructional organization of the various algebra classes we found that, as a whole, general education teachers tended to use whole class instruction quite a bit more often than special education teachers did while special education teachers used much more time for independent work. The data from the anecdotal observations indicated that what happens during whole class instruction also varies. General education teachers used whole class instruction to check homework, present new content, and do a little review. Special education teachers used most of their whole class instruction time leading reviews and relatively little time presenting new content. When we examined the data for the individual classes, we found that the Algebra IA and IB classes were more similar to the special education classes, with greater amounts of time devoted to independent work. We found that independent work time included time spent working on algebra assignments, as well as time spent working on assignments for classes other than algebra. In the Algebra IA and IB classes students worked on an assignment for a class other than algebra during fifteen percent of the observations, while this occurred during nearly 30% of the Algebra Special Education class observations. For all of the rest of the classes this percentage was zero. The similarities between the Algebra IA/IB classes and special education classes were also evident when one looks at the data regarding task format, another dimension of instruction included in the momentary time sampling observations. The Algebra I classes spent twice as much time engaged in lectures or discussions than their Algebra IA/IB and special education peers. When one looks at what was happening during lectures or discussions, several different teaching behaviors were evident. Teachers might be teaching, modeling, explaining, modeling how to solve homework problems, leading a review or discussing warm up exercises. If one eliminates warm up activities, which were only used by one teacher, the only real differences between the Algebra IA and IB classes and the special education algebra classes had to do with the amount of time spent checking homework and reviewing material. The difference in the amount of time checking homework between these two groups was probably due to the fact that

Project AAIMS District A Case Study - 9
students in one special education class checked their assignments during class and rarely had any homework. When comparing the traditional Algebra I classes and the eighth grade Algebra I class, the major differences were in the amount of time checking homework, modeling algebraic procedures, and explaining class content. In the eighth grade class much less time is spent checking homework, and correspondingly more time is spent modeling and explaining than in the Algebra I classes.
Assessment The participating algebra teachers from District A reported using a wide variety of formal and informal assessment tools and strategies in their classes. These ranged from reading students’ body language during a lesson to grading and interpreting chapter tests. The district used two standardized tests for part of its mandatory assessment process to comply with the requirements of the No Child Left Behind Act. The ITBS were used for the eighth grade students and the Iowa Tests of Educational Development (ITED) were used for the high school students. General education teachers used the time they spend checking homework during the beginning of class to informally judge whether or not students are learning the concepts and skills related to the content for a particular chapter. If students had many questions, then some reteaching or additional examples were needed before the class proceeded to new content. If there were very few questions, then the teachers moved on to the next topic. General education teachers used quizzes and tests to determine most of the students’ algebra grades. The general education teacher who taught the eighth grade algebra class did score every homework assignment using a three point scale, and required students to fix any missed problems to get full credit for the homework. Quizzes were given in the middle of a chapter and tests were given at the end of chapter for all the traditional Algebra I, Algebra IA, and Algebra IB classes. In the eighth grade Algebra I class, there was a quiz or a chapter test each week. Special education algebra teachers were more likely to use worksheets or shorter quizzes that were given more often to evaluate students’ understanding of algebra concepts. One teacher gave concept quizzes instead of chapter tests and assigned points for each step correct in the problem solving process instead of having each problem on a test worth one point. These teachers also reported occasionally counting a homework assignment as a quiz, as well as giving points for attendance. Before delving into an examination the measures of algebra achievement that were used for this case study, it is important to consider what District A’s participating teachers had to say about some of the difficulties one faces as an algebra teacher. They reported that many students expect algebra to be easy and were often discouraged when they found out that it was not. Even in the eighth grade Algebra I class that was made up of advanced students, the students were surprised by the challenges they faced as they tried to understand some of the more abstract aspects of algebra. Many students came into algebra classes without a clear understanding of how to perform basic operations involving integers, especially subtracting negative numbers. For students who had IEPs the idea that a letter can stand for a number was a very big hurdle to jump over as they start learning algebra. Even students who did not have a disability found learning how to use the distributive property correctly quite difficult.

Project AAIMS District A Case Study - 10
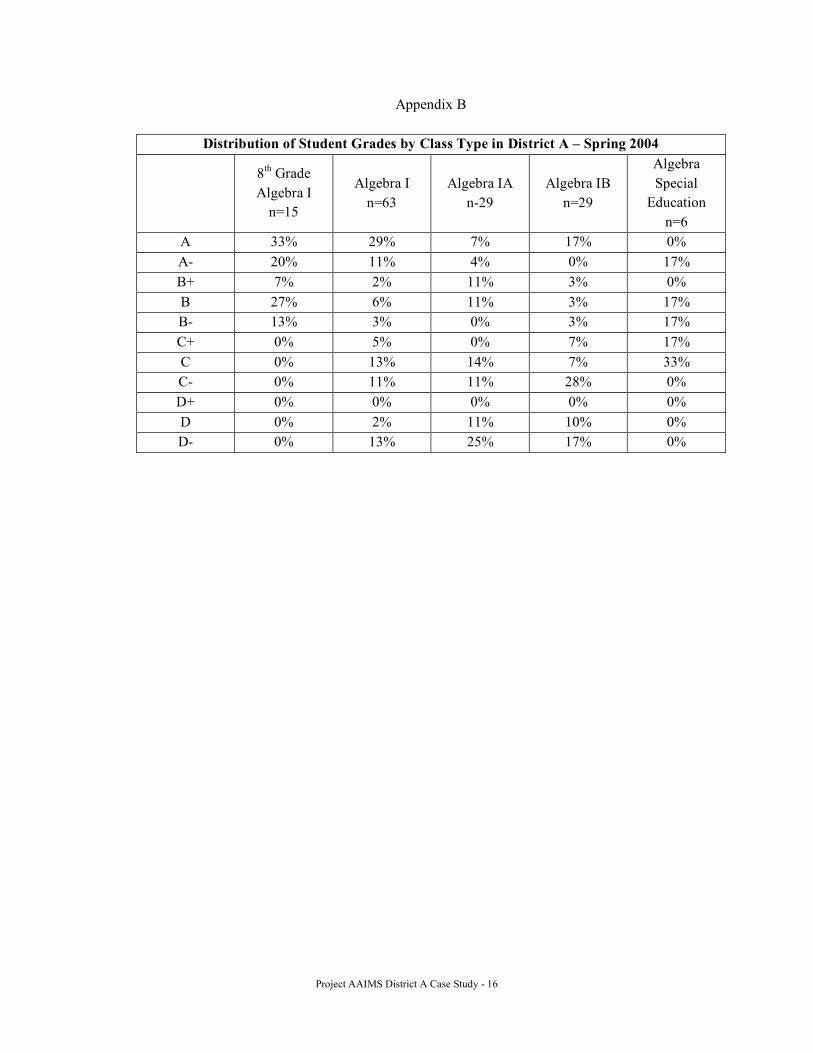
Students were often reluctant to ask for help when they did not understand a new algebra concept. Special education teachers reported that this was especially true for special education students who were enrolled in general education algebra classes. One strategy they used was to allow these students to work on algebra assignments in a special education classroom while their peers were working in the general education classroom. Sometimes students with IEPs had an extra period where they could work on assignments in a resource room. General education teachers reported that this strategy often led to more student success in algebra classes. For this case study, the researchers chose to use grades and ITBS or ITED test scores as measures of algebra achievement. Although both of these measures are not perfect indicators of a student’s mastery of algebra, they are important yardsticks when it comes to decisions about a student’s future coursework and a district’s standing with regard to the adequate yearly progress goals set by the state of Iowa. As far as algebra grades are concerned, 100% of the students in the eighth grade algebra I class and the special education classes earned a C or better. Sixty-nine percent of the traditional Algebra I students earned a C or better, as did 47% of the students in the Algebra IA class. Only 40% of the students in the Algebra 1B class earned grades of C or better. When one compares each type of class, one finds the greatest percentage of As in the eighth grade Algebra I class (33%; however, the percentage for the traditional Algebra I class was not much less with 29%, and the Algebra 1B class had the third highest percentage (17%. On the other end of the spectrum, the class with the greatest percentage of Fs was the Algebra IA class, with one quarter of the students earning a failing grade for their algebra course. The same percentage of students earned an F as earned an A in Algebra IB (17%). Thirteen percent of the students in the Algebra I class earned an F for their course grade. When one looks at individual class types, it is interesting to see which grades were most prevalent for each class. In the Algebra I class, As were the most prevalent grade with Cs and Fs being the second most prevalent grades. One third of the eighth grade Algebra I students earned As while more than a quarter earned Bs. The grade earned by the greatest percentage of algebra I students was an F, with a C as the next most common grade. In the Algebra IB class students were most likely to earn a C-, with an A or F being the next most likely grades. Since the special education classes were so small the researchers combined the data for these classes and found that a C was earned by one third of the students in these classes. (See Appendix B for information about grade distributions for each type of algebra class.) We wanted to use an algebra achievement test as our second measure of algebra achievement; however, we were unable to find a test that met our requirements. Therefore we decided to use the ITBS and ITED tests because these are the measures used for determining mathematics proficiency in Iowa. We begin with a discussion of district proficiency rates. Next, we will address proficiency rates for the beginning algebra students from whom we obtained student and parent consent. The overall proficiency percentages for grades 8, 9, 10, and 11, ranged from 73 to 90 percent for the 2003-2004 academic year. Most of these proficiency rates were above state averages and well above national averages. Nevertheless, these percentages have gone down each year since 2001-2002 with the eleventh grade percentage now below the Iowa average (Iowa Department of Education School Profiles, 2005).

Project AAIMS District A Case Study - 11
Looking at the algebra achievement of students with and without disabilities was a critical part of Project AAIMS. An examination of the disaggregated data reported by the district revealed that only 20% of the eleventh grade students with disabilities in District A scored at or above the 41st percentile (Iowa’s proficiency standard) in the 2003-2004 academic year, while 87.8% of the eleventh grade students without IEPs met or exceeded this standard. The proficiency percentage for District A’s students with disabilities is less than the state average for this group and lower than the 2002-2003 rate of 30.8%. (The proficiency percentage also dropped for the students without IEPs. In 2002-2003 the rate for general education students was 88.4% proficient.) The proficiency rates for students enrolled in a beginning algebra class during the Spring of 2004 from whom we obtained consent were higher than the district percentages. When we looked at the ITBS scores for the eighth grade Algebra I students, we found that 100% of these students (n=15) were considered proficient. The high school students took the ITED. The Algebra I students (n=48) had a 94% proficiency rate, while the percentage for students (n=42) enrolled in either Algebra IA or Algebra IB was 67%. When we combined the two special education algebra classes, we found that 50% of these students (n-6) reached the Iowa proficiency standard. These data indicate that students who are currently enrolled in a beginning algebra class have higher proficiency rates than the general student population taking these standardized tests.
Examining Alignment Between General and Special Education
After analyzing the data collected through document review, observations and interviews, the research team has come to some conclusions about the alignment of curriculum, instruction, and assessment in algebra classes for students with and without disabilities. To address the question of curriculum alignment, we looked at the data from the observations and the document reviews. When general education and special education students were in the same general education algebra class (traditional Algebra I, Algebra IA, and Algebra IB), they studied the same material and did the same assignments. This was the case for the majority of students with and without disabilities enrolled in District A’s algebra course; consequently, the logical conclusion is that the curriculum was aligned for most students. However, when we looked at the curriculum for Algebra IA and Algebra Special Education, the only two equivalent special education and general education algebra courses, a different picture emerged. The students in the Algebra Special Education class used a different textbook than their Algebra IA peers. The content that the Algebra Special Education class was studying during our observations near the end of the school year matched the content in chapter 4 of the textbook that the algebra IA students were using. The Algebra IA students were working on concepts from chapter 6 for this test. Clearly, the Algebra Special Education students had not been exposed to as much content as their peers in Algebra IA. The research team used data from the observations to determine the alignment of instruction for students with and without disabilities. It is true that the majority of students received the same kinds of instruction because they took general education algebra classes that were taught by the same teacher. Although we did not expect teachers to teach algebra in exactly the same way, we were surprised by the

Project AAIMS District A Case Study - 12
differences in the amount of class time devoted to whole class instruction and independent work when we compared general education algebra classes to special education classes. Looking at the data from our observations for each type of class, we were perplexed by the amount of time devoted to modeling procedures for solving algebra problems with much more time devoted to demonstrating algebra problem solving strategies in most of the general education classes than in the special education classes. As far as the alignment of assessment is concerned, we will comment on district level assessment and classroom level assessment. The district used the Iowa Tests of Basic Skills (Grades K-8) or the Iowa Tests of Education Development (grades 9-12) to meet the reporting requirements set forth by the Iowa Department of Education, as well as the United States Department of Education. It is important to point out that all of the algebra students took these tests, which means that there is complete alignment between general education and special education when it comes to the assessments that yield proficiency percentages that are reported to the public. When it comes to classroom level assessment, it is difficult to determine the alignment between assessment practices in the general education and special education algebra classes. The frequency and comprehensiveness of the assessments were definitely different. Students in special education classes were evaluated more often, but their assessments focused on fewer concepts than those used in general education classes. Part of the difference in the number of assessments was a practical matter. It is much easier to grade more frequent quizzes when one has four students than when one has over one hundred students. For the majority of students with and without disabilities District A’s algebra curriculum, instructional practices, and assessment approaches were aligned because these students are enrolled in the general education algebra classes. However, when we compare general education algebra classes with special education algebra classes, there was not as much alignment. It may be that complete alignment is not the most important goal to strive for; instead, we may need to find other ways of helping all students master critical algebra concepts and skills to be successful adults. ADDENDUM Since the data collection for this case study was completed District A moved from offering separate special education and general education beginning algebra classes to offering a general education Pre-algebra classes that are cotaught by a general education teacher and a special education teacher.

Project AAIMS District A Case Study - 13
References
Haenisch, S. (1998). Algebra. American Guidance Service: Circle Pines, Minnesota. Iowa Department of Education School Profiles. Biennium 2002-2004. Retrieved 6/28/2005, from
http://www.iowaschoolprofiles.com. Larson, R., Boswell, L., Kanold, T., & Stiff, L. (2001a). Algebra I: Concepts and Skills. McDougal Littell: Evanston. Larson, R., Boswell, L., Kanold, T., & Stiff, L. (2001b). Algebra I. McDougal Littell: Evanston. Olson, J., Foegen, A., & Lind, L. (2006). Classroom observation data for District A: Momentary time
sampling (Technical Report 1). Project AAIMS, Department of Curriculum and Instruction, Iowa State University, Ames, Iowa. Available at http://www.ci.hs.iastate.edu/aaims.
Olson, J., Foegen, A., & Lind, L. (2007). Classroom observation data for District A: Anecdotal
observation results (Technical Report 3). Project AAIMS, Department of Curriculum and Instruction, Iowa State University, Ames, Iowa. Available at http://www.ci.hs.iastate.edu/aaims.

Project AAIMS District A Case Study - 14
APPENDIX A Interview Questions for District A Teachers and Administrators: Project AAIMS
All Teachers: (20 minutes)
1. Describe how the math curriculum is currentl6y organized at the high school level; what is the general sequence by grade level?
2. When was the text adopted for algebra? How did this process work? How satisfied are you with the text? Are different texts used for different algebra courses?
3. How do you decide which students enroll in which algebra options? 4. What is the level of satisfaction with student achievement in algebra in Ballard? In math more
generally? 5. Has math been an area of focus in the district in the past few years? Professional development
activities? School improvement plans? Strategies? 6. What challenges do students experience in Algebra? Are there specific aspects of algebra that
present the most difficulty for students? General Education Teachers: (20-30 minutes)
1. What do you enjoy most about teaching algebra? What frustrations do you experience? 2. What is your typical teaching routine? Structure for presenting a unit? A lesson? 3. How do you assess student learning in algebra? 4. What are the similarities and differences between students with and without disabilities in general
education algebra classes? Are there particular strengths the students with disabilities bring? Particular difficulties they experience?
5. To what extent, if at all, does having students with disabilities in your class impact your teaching? 6. What kinds of information about students with disabilities do you receive from the students’
special education teachers? 7. To what extend do you collaborate with special education teachers to meet students’ needs?
Describe the form this collaboration takes. What barriers do you encounter in your efforts to collaborate?
8. What kinds of teaching strategies/activities do you find are most effective for teaching algebra? Do these differ for students with disabilities? Students in general? Students in different algebra courses (1 vs aA/aB)?
9. What types of support would you like to see provided regarding students with disabilities in your classes? (to you or to the students)
10. What are your thoughts regarding the option for students with disabilities to take algebra taught by a special education teacher?
11. [IF TIME] Is there any additional information you’d like to have in order to support your instructional decisions? Needs that this project might address?
All Special Education Teachers (20 minutes)
1. What kinds of information about the students with disabilities on your caseload to you provide to the students’ general education (algebra) teachers?
2. To what extent do you collaborate with general education teachers to meet students’ needs? Describe the form this collaboration takes. What barriers to you encounter?

Project AAIMS District A Case Study - 15
3. What types of support would you like to see provided regarding students with disabilities in general education algebra classes? (to the teacher or to the students)
4. What are your thoughts regarding the option for students with disabilities to take algebra taught by a special education teacher?
5. Are there particular difficulties that your students experience when they are enrolled in algebra courses?
Algebra Special Education Teachers:
1. What do you enjoy most about teaching algebra? What frustrations do you experience? 2. What is your typical teaching routine? Structure for presenting a unit? A lesson? 3. How do you assess student learning in algebra? 4. How does your algebra course differ from an algebra course taught by a general education
teacher? 5. What is your comfort level with teaching algebra? Do you find you need support from your
general mathematics colleagues for any content knowledge in algebra? 6. How do you assess student learning in algebra? 7. What kinds of teaching strategies/activities do you find are most effective for teaching algebra? 8. What are your thoughts regarding the option for students with disabilities to take algebra taught
by a special education teacher? 9. [IF ATIME] Is there any additional information you’d like to have in order to support your
instructional decisions? Needs that this project might address? Principal:
1. How does the textbook adoption process work in Ballard? When was the algebra textbook adopted?
2. What is the level of satisfaction within the district on the level of student achievement in algebra? In math more generally?
3. What is your general sense of the ITEDs data in math? Which grade levels complete ITEDS and ITBS?
4. Has math been an area of focus in the district in the past few years? Professional development activities? School improvement plans? Strategies?
5. What is the process for accessing student cum file data? Demographic information? ITED scores? 6. Are there any questions or concerns that you would like to see the project address during the next
few academic years?
Project AAIMS District A Case Study - 16
Appendix B
Distribution of Student Grades by Class Type in District A – Spring 2004
8th Grade Algebra I
n=15
Algebra I n=63
Algebra IA n-29
Algebra IB n=29
Algebra Special
Education n=6
A 33% 29% 7% 17% 0% A- 20% 11% 4% 0% 17% B+ 7% 2% 11% 3% 0% B 27% 6% 11% 3% 17% B- 13% 3% 0% 3% 17% C+ 0% 5% 0% 7% 17% C 0% 13% 14% 7% 33% C- 0% 11% 11% 28% 0% D+ 0% 0% 0% 0% 0% D 0% 2% 11% 10% 0% D- 0% 13% 25% 17% 0%