distribution network operators’ cost of capital for dpcr5 · distribution network operators’...
TRANSCRIPT

July 2009
Distribution Network Operators’ Cost of Capital for DPCR5 A Report for the DNOs

Project Team
Dr Richard Hern Tomas Haug Anthony Legg Svetlana Shcherbakova
NERA Economic Consulting 15 Stratford Place London W1C 1BE United Kingdom Tel: +44 20 7659 8500 Fax: +44 20 7659 8501 www.nera.com

Cost of Capital at DPCR5 Contents
NERA Economic Consulting
i
Contents
Executive Summary i Cost of Equity i Cost of Debt ii Cost of Capital iii
1. Introduction 1
2. Risk Free Rate 2 2.1. Risk Free Rate Based on Long-run Historic Averages 2 2.2. Risk Free Rate Based on “Current” Market Evidence 3 2.3. Conclusion 7
3. Equity Risk Premium 8 3.1. ERP Based on Long-run Historic Averages 8 3.2. ERP Based on “Current” Market Evidence 9 3.3. Conclusion 16
4. Beta 17 4.1. Comparator Analysis 17 4.2. Beta Estimates 20 4.3. Conclusion 20
5. Cost of Equity 21 5.1. “Historic” and “Current” CAPM Cost of Equity 21 5.2. Cross-Check on “Current” CAPM Estimate 21 5.3. Conclusion 23
6. Cost of Debt 25 6.1. Ofgem’s Approach at Past Reviews 25 6.2. NERA’s Approach 25 6.3. Market Evidence 26 6.4. Transaction and Pre-Funding Costs 29 6.5. Inflation Expectations 30 6.6. “Historic” and “Current” Cost of Debt 31 6.7. Conclusion 33
7. Cost of Capital 34 7.1. “Current” and “Historic” Cost of Capital 34 7.2. The Current Macroeconomic Outlook 34 7.3. Capital Market Conditions Post-Recovery 35

Cost of Capital at DPCR5 Contents
NERA Economic Consulting
ii
7.4. Conclusion 37
Appendix A. Gearing 39
Appendix B. Debt Beta 41 B.1. NERA Estimates 42
Appendix C. Inflation Expectations Methodology 43 C.1. The Sources of Inflation Expectations Data 43 C.2. Current Forecasts 44 C.3. Historic Forecasts 45
Appendix D. Macroeconomic Outlook 47
Appendix E. The Relationship Between Macroeconomic Factors and Financial Market Volatility 54

Cost of Capital at DPCR5 Introduction
NERA Economic Consulting
i
Executive Summary
In November or December 2009 Ofgem will set limits on the prices that electricity distribution network operators (DNOs) in England, Scotland and Wales can charge their customers during the five year period 2010-2015. As an input to DPCR5 the DNOs have commissioned NERA to estimate the cost of capital. In this report we present our best estimate of the cost of capital that should be allowed by Ofgem at DPCR5 based on data currently available. We recommend that Ofgem continue to review evidence up until the Final Proposals to ensure any new market developments are reflected in the final DPCR5 settlement.
In previous reviews Ofgem has estimated the cost of capital by relying most heavily on long-term time series data. Using long-term historic data to estimate the cost of capital assumes that historic averages provide a good indication of likely future conditions. However, the recent schism in financial markets precipitated by the credit crisis has drawn this assumption into question. In particular, the costs of equity and debt have both increased substantially recently compared to long-run historic levels. Further, the credit crisis has clouded the economic outlook to an extent that forecasts are surrounded by much higher uncertainty than is usually the case. This uncertainty means that it is unclear when market conditions will “normalise” and what that “new-normal” may be. Reflecting this uncertainty this report focuses on three issues:
1. The “current” cost of capital based on recent market evidence;
2. The “historic” cost of capital based on long-run historic data, and;
3. The weight to place on the “current” cost of capital taking into account recent economic forecasts and market commentary.
Below we summarise our assessment of the “current” and “historic” costs of equity and debt and the cost of capital. We then combine these “current” and “historic” costs of capital into an overall estimate of the DPCR5 cost of capital reflecting latest independent economic forecasts and assessments of the post-recovery “new-normal”.
Cost of Equity
In this report we estimate a “historic” and a “current” cost of equity based on both CAPM and DGM. The key constituent parameters of the CAPM cost of equity are set out below:
§ Risk Free Rate: Our historic estimate of the real risk-free rate of 2.5% is based on ten year trailing averages of UK swap rates adjusted for credit risk. All measures of the risk-free rate are currently below their long-term averages (even after taking into account the uncertainty of recent inflation expectations). For the purpose of this report, we use 1.0% as a central point estimate for the current risk-free rate.
§ Equity Risk Premium: The long-run historic estimate of the ERP is 5.4% based on arithmetic averages of historic market returns. Our analysis of the “current” ERP shows that there has been a fundamental re-pricing of risk in the market. Based on DGM analysis the “current” ERP is in a range of 7.2-9.5%, around 3% higher than pre-crisis levels of 3.9-6.2% and substantially above the long-run historic average of 5.4%. The

Cost of Capital at DPCR5 Introduction
NERA Economic Consulting
ii
increase in the ERP is further supported by evidence on the implied market volatility and CDS markets.
§ Beta: We conclude that National Grid and listed UK water and sewerage companies provide the best evidence about DNOs’ asset beta. Evidence from these companies suggests an asset beta for DNOs of around 0.35-0.45 over the long-term. Recent evidence indicates that DNOs’ asset beta may have decreased slightly recently and is now roughly in the range of 0.35-0.40.
Table 1 summarises our estimates of the cost of equity. We conclude on a “historic” CAPM-based cost of equity (at 60% gearing) in the range of 7.2-8.6%. Recent data shows a wider range for the cost of equity of 7.3-10.5%. Our DGM analysis shows a current range for the cost of equity of 8.0-10.6%, which overlaps with the top end of the range of our “current” CAPM estimates. Reflecting this overlap we conclude on a “current” cost of equity of 8.0-10.5%.
Table 1 Comparison of “Historic” and “Current” Estimates of the Cost of Equity (%)
“Historic” “Current” CAPM CAPM DGM
Cost of Equity 7.3 – 10.5 8.0 – 10.6 Overlap (CAPM / DGM)
7.2 – 8.6 8.0 – 10.5
Cost of Debt
Our analysis of DNOs’ cost of debt at DPCR5 is based on a broad range of data including evidence on funding costs from primary and secondary markets, costs of existing debt in companies’ debt portfolios, and transaction and pre-funding costs. Our analysis shows that:
§ Benchmark Historic Cost of Debt: DNOs’ existing debt has been raised at different stages of the business cycle over the past decade or so. Therefore, to estimate the benchmark historic cost of debt we average secondary market bond yields over 1999-2008. This data shows the benchmark nominal cost of existing debt is around 6.0%.
§ Benchmark Cost of New and Refinanced Debt: To estimate the cost of new and refinanced debt we focus on new bond issues to ensure any new issuance premium currently payable is included in our estimates. The nominal coupon on these bonds has been 5.1-6.4% for short-to-medium tenor bonds and 6.8-7.5% for long-tenor bonds.
§ Refinancing and New Debt Requirements: Our analysis of DNOs’ FBPQ capex plans and DNOs’ financial position indicates that around 50% of the debt that DNOs will have by the end of DPCR5 will have been raised over DPCR5. Assuming that DNOs raise debt evenly throughout DPCR5 means that on average over the period about 70% of the allowed cost of debt for DNOs should reflect the historic benchmark cost of debt.
§ Transaction and Pre-Funding Costs: Evidence on secondary market yields or recent bond issues do not include the costs of issuing debt such as bank, legal, trustee and agent fees. The efficiently incurred costs of raising debt in advance of when it is required to ensure that finance is available when it is required are also not included. We examine evidence

Cost of Capital at DPCR5 Introduction
NERA Economic Consulting
iii
from UK utilities and conclude that transaction and pre-funding costs have increased from around 15 bps historically to 60 bps currently.
§ Inflation Expectations: To obtain a real cost of debt we deflate nominal costs by inflation expectations derived from HM Treasury’s publication of City and independent forecasters’ forecasts of RPI inflation. Historic costs are deflated by average medium-term expectations over 1999-2008, while current costs are deflated by corresponding short-to-medium and long term expectations based on recent HMT publications.
Table 2 summarises our estimates of the real historic and current benchmark costs of debt. We conclude the historic benchmark real cost of debt is around 3.5% and the current benchmark cost of debt is 3.9-4.5%.
Table 2 “Historic” and “Current” Cost of Debt (%)
“Current” Short to Medium
Tenor Long Tenor “Historic”
Min Max Min Max Nominal Cost 6.00 5.13 6.38 6.75 7.50 Inflation Expectations 2.56 1.7 – 2.4 2.4 – 3.2 2.4 – 3.3 2.4 – 3.4
2.7 – 3.9 3.3 – 5.0 Real Cost Overlap 3.35
3.3 – 3.9 Transaction & Pre-funding costs 0.15 0.60 Total Real Cost of Debt 3.50 3.9 – 4.5
Cost of Capital
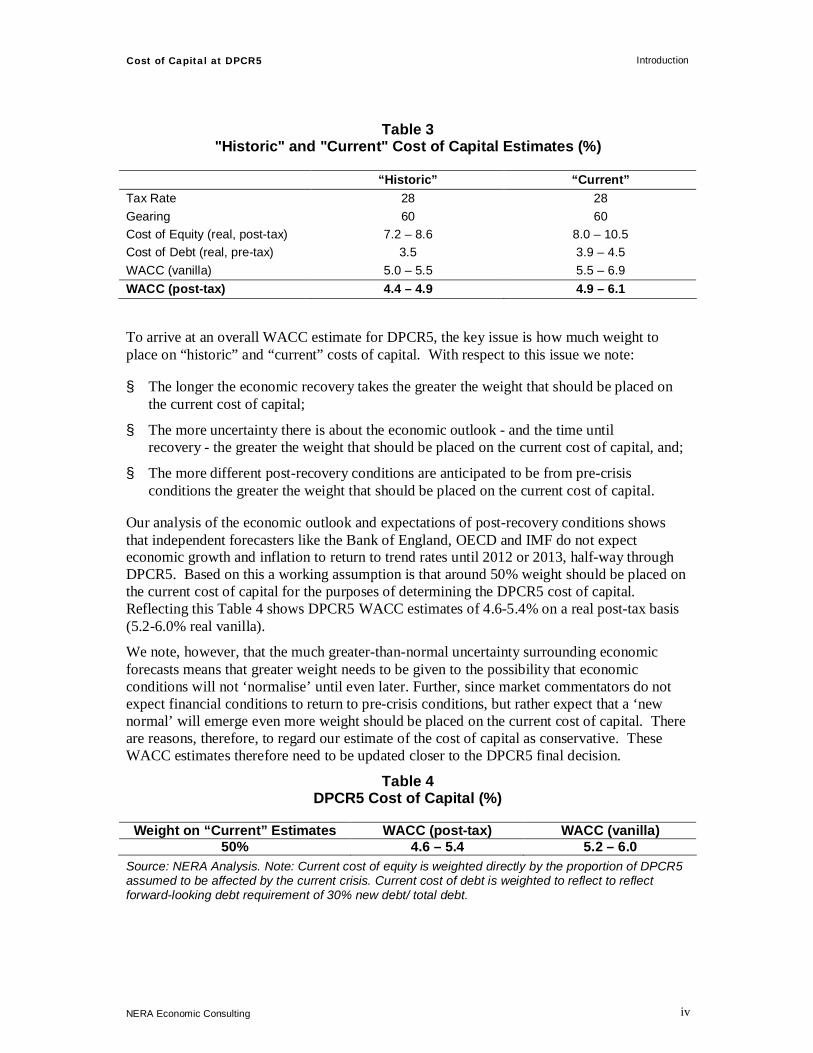
Table 3 summarises our estimates of the DNOs’ “historic” and “current” costs of capital which shows that:
§ The cost of capital of DNOs based on long-run historic data is in the range of 4.4-4.9% on a real post-tax basis (5.0-5.5% on a real vanilla basis), and;
§ The cost of capital of DNOs in the current market environment is somewhat higher and is in a range of 4.9-6.1% on a real post-tax basis (5.5-6.9% on a real vanilla basis).
Cost of Capital at DPCR5 Introduction
NERA Economic Consulting
iv
Table 3 "Historic" and "Current" Cost of Capital Estimates (%)
“Historic” “Current” Tax Rate 28 28 Gearing 60 60 Cost of Equity (real, post-tax) 7.2 – 8.6 8.0 – 10.5 Cost of Debt (real, pre-tax) 3.5 3.9 – 4.5 WACC (vanilla) 5.0 – 5.5 5.5 – 6.9 WACC (post-tax) 4.4 – 4.9 4.9 – 6.1
To arrive at an overall WACC estimate for DPCR5, the key issue is how much weight to place on “historic” and “current” costs of capital. With respect to this issue we note:
§ The longer the economic recovery takes the greater the weight that should be placed on the current cost of capital;
§ The more uncertainty there is about the economic outlook - and the time until recovery - the greater the weight that should be placed on the current cost of capital, and;
§ The more different post-recovery conditions are anticipated to be from pre-crisis conditions the greater the weight that should be placed on the current cost of capital.
Our analysis of the economic outlook and expectations of post-recovery conditions shows that independent forecasters like the Bank of England, OECD and IMF do not expect economic growth and inflation to return to trend rates until 2012 or 2013, half-way through DPCR5. Based on this a working assumption is that around 50% weight should be placed on the current cost of capital for the purposes of determining the DPCR5 cost of capital. Reflecting this Table 4 shows DPCR5 WACC estimates of 4.6-5.4% on a real post-tax basis (5.2-6.0% real vanilla).
We note, however, that the much greater-than-normal uncertainty surrounding economic forecasts means that greater weight needs to be given to the possibility that economic conditions will not ‘normalise’ until even later. Further, since market commentators do not expect financial conditions to return to pre-crisis conditions, but rather expect that a ‘new normal’ will emerge even more weight should be placed on the current cost of capital. There are reasons, therefore, to regard our estimate of the cost of capital as conservative. These WACC estimates therefore need to be updated closer to the DPCR5 final decision.
Table 4 DPCR5 Cost of Capital (%)
Weight on “Current” Estimates WACC (post-tax) WACC (vanilla) 50% 4.6 – 5.4 5.2 – 6.0
Source: NERA Analysis. Note: Current cost of equity is weighted directly by the proportion of DPCR5 assumed to be affected by the current crisis. Current cost of debt is weighted to reflect to reflect forward-looking debt requirement of 30% new debt/ total debt.

Cost of Capital at DPCR5 Introduction
NERA Economic Consulting
1
1. Introduction
In November or December 2009 Ofgem will set limits on the prices that electricity distribution network operators (DNOs) in England, Scotland and Wales can charge their customers during the five year period 2010-2015. As an input to DPCR5 the DNOs have commissioned NERA to estimate the cost of capital. In this report we present our best estimate of the cost of capital that should be allowed by Ofgem at DPCR5 based on data currently available. We recommend that Ofgem continue to review evidence up until the Final Proposals to ensure any new market developments are reflected in the final DPCR5 settlement.
In previous reviews Ofgem has estimated the cost of capital by relying most heavily on long-term time series data. Using long-term historic data to estimate the cost of capital assumes that historic averages provide a good indication of likely future conditions. However, the recent schism in financial markets precipitated by the credit crisis has drawn this assumption into question. In particular, the costs of equity and debt have both increased substantially recently compared to long-run historic levels. Further, the credit crisis has clouded the economic outlook to an extent that forecasts are surrounded by much higher uncertainty than is usually the case. This uncertainty means that it is unclear when market conditions will “normalise” and what that “new-normal” may be. Reflecting this uncertainty this report focuses on three issues:
§ The “current” cost of capital based on recent market evidence;
§ The “historic” cost of capital based on long-run historic data, and;
§ The weight to place on the “current” cost of capital taking into account recent economic forecasts and market commentary.
In this report we present our assessment of the “current” and “historic” costs of equity and debt and the cost of capital. We then combine these “current” and “historic” costs of capital into an overall estimate of the DPCR5 cost of capital reflecting latest independent economic forecasts and assessments of the post-recovery “new-normal”.
This report is structured as follows:
§ Section 2 sets out our analysis of the real risk-free rate
§ Section 3 presents our analysis of the equity risk premium;
§ Section 4 considers DNOs’ asset beta;
§ Section 5 concludes on the “historic” and “current” cost of equity taking into account evidence from both the CAPM and the DGM;
§ Section 6 presents evidence on the cost of debt, and;
§ Section 7 presents our estimate of the DPCR5 cost of capital taking into account our analysis of the “historic” and “current” and costs of capital.
The Appendices provide various supporting evidence.

Cost of Capital at DPCR5 Risk Free Rate
NERA Economic Consulting
2
2. Risk Free Rate
This section sets out long-run “historic” and “current” estimates of the real risk-free rate. This section is structured as follows:
§ Section 2.1 derives a risk free rate based on long-run historic trailing averages;
§ Section 2.2 estimates a risk free rate in the current market environment; and;
§ Section 2.3 concludes.
2.1. Risk Free Rate Based on Long-run Historic Averages
In this section, we present risk-free rate estimates based on long-run historic trailing averages based on different instruments, such as swap rates adjusted for inter-bank lending risk, index-linked gilt (ILG) yields, and deflated nominal gilt yields.
A good proxy for the risk-free rate within the context of the CAPM should be free of risk, liquid, free of restrictions upon the purchase of the asset, and the asset should not have characteristics other than its return distribution. We find that swap rates adjusted for credit risk largely fulfil these criteria whereas government bonds in part do not.1
For instance, government bonds can be used for collateral purposes which depresses their yields and therefore argues against their use. Further, some academics and participants in the UK capital markets, including the Bank of England, have argued that yields on UK government bonds are depressed due to inelastic demand by pension funds. This favours the use of swap rates rather than government bond yields as a proxy for the risk-free rate. Nonetheless, we recommend that conventional measure of the risk free rate should also be considered in order to inform a risk free rate for setting the regulatory allowed rate of return.
Table 2.1 shows the real risk-free rate based on long-run historic trailing averages using different measures of the risk free rate.
Table 2.1 Ten Year Trailing Averages of Risk Free Rate Measures (%)
Medium-term Maturity (5 Years)
Long-term Maturity (20 Years)
Risk-adjusted swap rates 2.5 2.3 Index Linked Gilts 2.1 1.7 Deflated Nominal Gilts 2.1 1.9 Notes: NERA analysis of Bloomberg data up to 30th April 2009.
Based on 10-year trailing averages of five year maturity swap rates adjusted for credit risk, the risk free rate is 2.5%.
1 In NERA “Cost of Capital for PR09” (June 2008), a report on behalf of Water UK, we explain in detail the concept of
deriving a swap-based risk free rate. The report is available at: http://www.water.org.uk/home/news/press-releases/cost-of-capital-for-pr09/080623-nera-water-uk-wacc-report-final.pdf.
Cost of Capital at DPCR5 Risk Free Rate
NERA Economic Consulting
3
2.2. Risk Free Rate Based on “Current” Market Evidence
This section sets out an estimate of the risk free rate in the current market environment. All market-based measures of the risk free rate are currently highly volatile, which makes it difficult to estimate the risk free rate with any precision.
2.2.1. Evidence from swap market
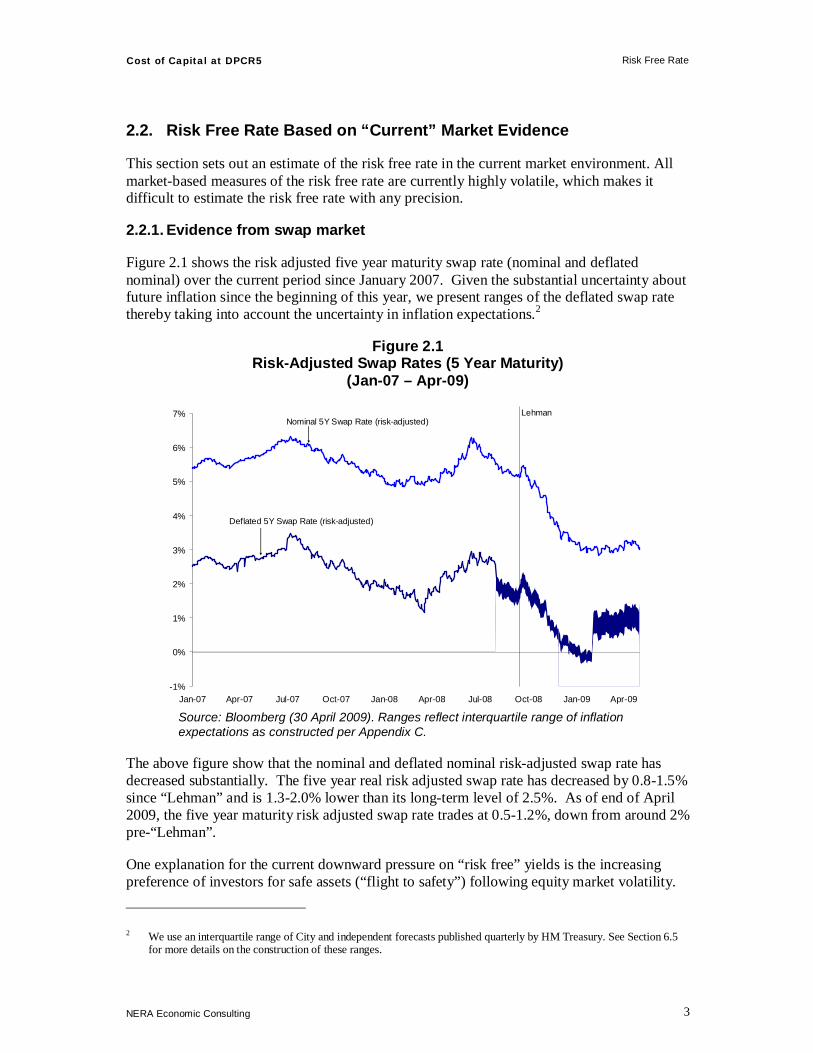
Figure 2.1 shows the risk adjusted five year maturity swap rate (nominal and deflated nominal) over the current period since January 2007. Given the substantial uncertainty about future inflation since the beginning of this year, we present ranges of the deflated swap rate thereby taking into account the uncertainty in inflation expectations.2
Figure 2.1 Risk-Adjusted Swap Rates (5 Year Maturity)
(Jan-07 – Apr-09)
-1%
0%
1%
2%
3%
4%
5%
6%
7%
Jan-07 Apr-07 Jul-07 Oct-07 Jan-08 Apr-08 Jul-08 Oct-08 Jan-09 Apr-09
LehmanNominal 5Y Swap Rate (risk-adjusted)
Deflated 5Y Swap Rate (risk-adjusted)
Source: Bloomberg (30 April 2009). Ranges reflect interquartile range of inflation expectations as constructed per Appendix C.
The above figure show that the nominal and deflated nominal risk-adjusted swap rate has decreased substantially. The five year real risk adjusted swap rate has decreased by 0.8-1.5% since “Lehman” and is 1.3-2.0% lower than its long-term level of 2.5%. As of end of April 2009, the five year maturity risk adjusted swap rate trades at 0.5-1.2%, down from around 2% pre-“Lehman”.
One explanation for the current downward pressure on “risk free” yields is the increasing preference of investors for safe assets (“flight to safety”) following equity market volatility.
2 We use an interquartile range of City and independent forecasts published quarterly by HM Treasury. See Section 6.5
for more details on the construction of these ranges.

Cost of Capital at DPCR5 Risk Free Rate
NERA Economic Consulting
4
For instance, the Financial Times states that “Gilt prices have been pushed up by increased demand from investors looking to move their money into safe havens. Over the past 18 months, investors have chosen to eschew risk for security and moved en masse to swap their equity holdings for safer asset classes such as government bonds and cash. As a result, yields on gilts have been driven to unusually low levels.”3
This means the “current” risk free rate has decreased since the collapse of Lehman Brothers and is now lower than its long-term level of 2.5%. However, it is important to emphasise that any decrease in the risk free rate is more than compensated by an offsetting increase in the forward-looking ERP, causing the overall cost of equity to increase, as we show in our conclusion on the overall cost of equity in Section 5.3.
We note that in the current market environment it is difficult to estimate a real risk free rate with any precision:
§ First, given the substantial uncertainty about future inflation since the beginning of this year, any ‘point-estimate” of the current real risk free rate is accompanied by a wide confidence interval. Note, we present ranges for deflated gilt yields and swap rates, taking into account the uncertainty in inflation expectations.
§ Second, inflation forecasts are only published on a quarterly basis, whereas nominal gilt yields and swap rates reflect changes in inflation expectations on a time continuous basis. This introduces a mismatch between real-time inflation expectations inherent in gilt yields and swap rates and the observable measure of inflation expectation.4
§ Third, the decrease in nominal yields is also driven by the impact of the introduction of quantitative easing in March 2009. Quantitative easing does not affect the true risk free rate as it is concerned with a policy measure to introduce more liquidity into the banking sector, rather than a change in investors’ preferences for risk. Hence its impact on nominal gilt yields is a further example of distortions in the government bond markets that can bias measures of the risk free rate. Note quantitative easing affects government bond yields directly, but not the swap market. This provides a good reason why swap rates are preferable to gilt yields in the current market environment.
2.2.2. Evidence from deflated nominal Gilt market
Figure 3.2 shows nominal and deflated nominal gilt yields. Recent uncertainty of inflation expectation introduces the same degree of imprecision in the derivation of real yields from nominal gilts as for swap rates. Gilt yields, as swap rates, have decreased significantly since “Lehman”. The decrease in nominal yields is also driven by the impact of the introduction of quantitative easing in March this year, which does not affect the swap market directly. Quantitative easing does not also affect the true risk free rate as it is concerned with a policy measure to introduce more liquidity into the banking sector, rather than a change in investors’
3 Financial Times (24 January 2009) “As gilt prices rise, fears of bubble grow” 4 During “normal” times of relative constant inflation expectation this mismatch does not introduce a material
imprecision into the calculation of real swap rates. However, during the current time of highly uncertain inflation expectations this mismatch introduces a degree of imprecision.

Cost of Capital at DPCR5 Risk Free Rate
NERA Economic Consulting
5
preferences for risk. Hence its impact on nominal gilt yields is a further example of distortions in the government bond markets that can bias measures of the risk free rate.
Figure 2.2 Nominal and Deflated Gilt Yields (5 Year Maturity)
(Jan-07 – Apr-09)
-1%
0%
1%
2%
3%
4%
5%
6%
7%
Jan-07 Apr-07 Jul-07 Oct-07 Jan-08 Apr-08 Jul-08 Oct-08 Jan-09 Apr-09
Lehman
Deflated 5Y Nominal Gilts
5Y Nominal Gilts
Source: Bloomberg (30 April 2009). See Section 6.5 for more details on the construction of the inflation expectations used in constructing ranges.
2.2.3. Evidence from index-linked Gilt market
The ongoing volatility in ILG markets confirms our earlier analysis that index-linked gilts do not provide a suitable basis for estimating the risk-free rate. Figure 3.4 shows that by the end of November 2008, five year maturity spot-rates increased to 4.3% and, as of end of April 2009, decreased to 0.9%. A recent paper by Campbell, Shiller and Viceira (May 2009) concludes that the volatility experienced in ILG yields was due to liquidity problems which were suddenly created after the Lehman bankruptcy.5
5 See Campbell, Shiller and Viceira (May 2009) “Understanding Inflation-Indexed Bond Markets”, NBER Working
Paper Series

Cost of Capital at DPCR5 Risk Free Rate
NERA Economic Consulting
6
Figure 2.3 Index Linked Gilt Yields
0%
1%
2%
3%
4%
5%
Jan-07 Apr-07 Jul-07 Oct-07 Jan-08 Apr-08 Jul-08 Oct-08 Jan-09 Apr-09
Yiel
d to
Mat
urity
5 years10 years20 years
Lehman
Source: Bank of England data (30 April 2009).
Figure 2.4 UK ILG Yield Curves at Different Points in Time
0.0
0.5
1.0
1.5
2.0
2.5
3.0
3.5
3 4 5 6 7 8 9 10 11 12 13 14 15 16 17 18 19 20 21 22 23 24 25
Years to Maturity
Yiel
d to
Mat
urity
(%)
31-Jul-07 (Pre Credit Crunch)
30-Apr-09 (Current)
31-Dec-08
-1.3%
-0.2%
Source: Bank of England data (30 April 2009).
Figure 2.4 shows the ILG yield curve at three points in time: 31 July 2007 (i.e. before the start of the current financial crisis - the end of the most recent period of stability), 31 December 2008 and 30 April 2009.

Cost of Capital at DPCR5 Risk Free Rate
NERA Economic Consulting
7
The five year maturity yield has decreased by around 1.5% since the onset of the financial crisis in July 2007 and 1.3% since December 2008.
Figure 2.4 also shows that the yield curve has been highly inverted at 31 July 2007 and 31 December 2008. By contrast, the current yield curve has a normal shape, i.e. is upward sloping. Evidence to explain the inversion of the UK yield curve is given in detail in NERA (2009). One of the key reasons noted, inter alia, by the Bank of England is the inelastic demand by pension funds for long-dated ILGs during times of limited supply.
Although doubts remain about ILG yields as a measure of the real risk free rate, in the current market environment of high inflation uncertainty, ILGs might be a less imprecise measure than any nominal instrument (swaps or gilts) which necessarily need to rely on an inflation forecast. Deriving real yields from nominal yields produce currently inconclusive wide ranges for the risk free rate.
2.3. Conclusion
Table 2.2 shows “historic” trailing averages and “current” estimates of risk-adjusted swap rates, ILG yields, and deflated gilt yields.
Table 2.2 Measures of the Real Risk-Free Rate (%)
Medium-term Maturity (5 Years)
Long-term Maturity (20 Years)
ILGs Deflated Gilts
Swap-Based ILGs Deflated
Gilts Swap-Based
30-Apr-09 0.9 0.2-0.9 0.5-1.2 1.2 1.2-2.2 0.4-2.3 Last 3 months 1.2 0.2-0.8 0.5-1.2 1.2 1.1-2.0 0.5-2.4 10 years 2.1 2.1 2.5 1.7 1.9 2.3 Notes: NERA analysis of Bloomberg data and HMT-published City and independent forecasts. Risk-free rate ranges based on interquartile ranges of annualised five-year inflation expectations.
Ten year trailing averages of UK swap rates adjusted for credit risk produce an estimate of the CAPM risk free rate of 2.5%. This estimate is slightly higher than long-run trailing averages of government bond yields of 2.1%. The difference might be explained by biases in government bond yields due to inelastic demand by pension funds and the fact that government bonds can be used for collateral purposes which depresses their yields.
Any estimate of the current risk free rate lies within a wide confidence interval, which makes it difficult to estimate a “current” estimate with any precision. However, all recent short-term measures of the risk free rate are below their long-term averages (even after taking into account the uncertainty of recent inflation expectations). For the purpose of this report, we use 1.0% as a central point estimate for the current risk free rate.
Cost of Capital at DPCR5 Equity Risk Premium
NERA Economic Consulting
8
3. Equity Risk Premium
This section sets out our estimates of the equity risk premium (ERP), considering both long-run historic averages and forward-looking evidence based on Dividend Growth Models (DGM). The section is structured as follows:
§ Section 3.1 presents long-run averages of market returns as the basis for the ERP;
§ Section 3.2 shows current evidence of the ERP based on the DGM; and;
§ Section 3.3 concludes.
3.1. ERP Based on Long-run Historic Averages
Using time series data on actual realised returns to estimate expected returns has theoretical support and is widely used by academics and practitioners. An estimate of the ERP based on long-run historical data is highly objective, easily understood and produces stable results over time which are all key criteria of good regulatory practice.
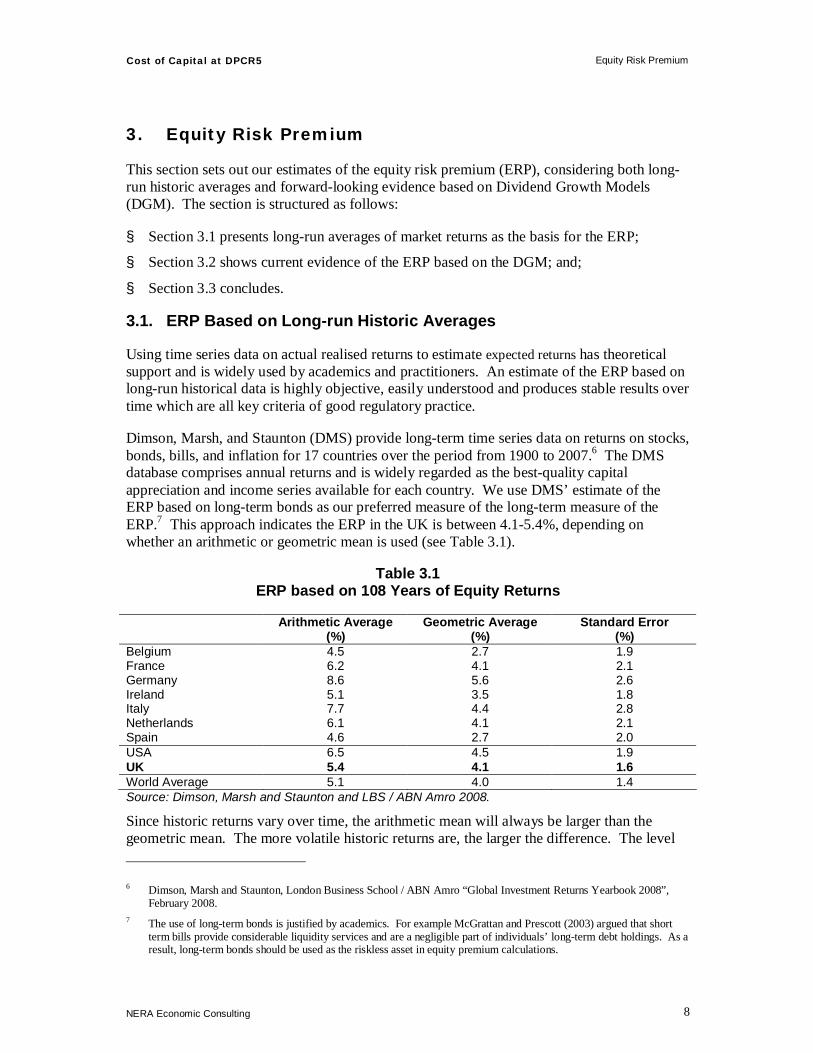
Dimson, Marsh, and Staunton (DMS) provide long-term time series data on returns on stocks, bonds, bills, and inflation for 17 countries over the period from 1900 to 2007.6 The DMS database comprises annual returns and is widely regarded as the best-quality capital appreciation and income series available for each country. We use DMS’ estimate of the ERP based on long-term bonds as our preferred measure of the long-term measure of the ERP.7 This approach indicates the ERP in the UK is between 4.1-5.4%, depending on whether an arithmetic or geometric mean is used (see Table 3.1).
Table 3.1 ERP based on 108 Years of Equity Returns
Arithmetic Average (%)
Geometric Average (%)
Standard Error (%)
Belgium 4.5 2.7 1.9 France 6.2 4.1 2.1 Germany 8.6 5.6 2.6 Ireland 5.1 3.5 1.8 Italy 7.7 4.4 2.8 Netherlands 6.1 4.1 2.1 Spain 4.6 2.7 2.0 USA 6.5 4.5 1.9 UK 5.4 4.1 1.6 World Average 5.1 4.0 1.4 Source: Dimson, Marsh and Staunton and LBS / ABN Amro 2008.
Since historic returns vary over time, the arithmetic mean will always be larger than the geometric mean. The more volatile historic returns are, the larger the difference. The level 6 Dimson, Marsh and Staunton, London Business School / ABN Amro “Global Investment Returns Yearbook 2008”,
February 2008. 7 The use of long-term bonds is justified by academics. For example McGrattan and Prescott (2003) argued that short
term bills provide considerable liquidity services and are a negligible part of individuals’ long-term debt holdings. As a result, long-term bonds should be used as the riskless asset in equity premium calculations.
Cost of Capital at DPCR5 Equity Risk Premium
NERA Economic Consulting
9
of volatility of historic returns will affect the actual returns required by an investor. Hence, in determining an appropriate ex ante ERP, the expected volatility of future returns must be adequately captured.
Note geometric averages implicitly assume zero volatility of market returns and hence an ERP based on geometric averages underestimates the risk investors were facing in the past when making an investment decision.
The arithmetic average of historic returns is the single best statistic for the forward-looking ERP if market volatility is expected to be the same in future as it has been in the past. This view is consistent with the majority of recent academic opinion. For instance, Professor Ian Cooper states that the arithmetic historical mean is “the single statistic that is favoured by many experts.”8 Other academics that support the use of arithmetic averages include Ibbotson and Goetzmann (2006), Dimson, Marsh and Staunton (2000), Cornell (1999), Holmans (1996) and Morin (1994). Note in a recent report for Water UK, we present a more detailed discussion of the appropriate method of estimating the ERP.9
Based on long-run historic arithmetic averages, which is the preferred statistic by the majority of academics and financial practitioners, the ERP is 5.4%.
3.2. ERP Based on “Current” Market Evidence
An implicit assumption of using long-run historic data is that past expectations are an unbiased estimate for future expectations. This assumption, however, is questionable at the current time of heightened market uncertainties.
This section provides recent market evidence to estimate a forward-looking measure of the ERP. Our analysis shows that the “current” estimate of the ERP is significantly higher than long-run historic averages.
3.2.1. ERP implied by the forward-looking DGM
To quantify the recent increase in the ERP, we provide evidence on changes in the forward looking ERP based on a ‘one-step’ DGM for the FTSE 100. In a one-step DGM, total market return (Rm) is equal to the prospective dividend yield of the market (D1/P0) plus the real long term growth rate of dividends for the market (g):
Rm =(D1/P0)+g
Bloomberg provides daily data on projected 12–months-ahead dividend yields for the FTSE 100 index.
8 Cooper, I (2004) “The Equity Market Premium: Comments on the Ofcom consultation document, Ofcom’s approach to
risk in the assessment of the cost of capital”, p3. 9 See NERA “Cost of Capital for PR09” (June 2008), a report on behalf of Water UK, available at:
http://www.water.org.uk/home/news/press-releases/cost-of-capital-for-pr09/080623-nera-water-uk-wacc-report-final.pdf.
Cost of Capital at DPCR5 Equity Risk Premium
NERA Economic Consulting
10
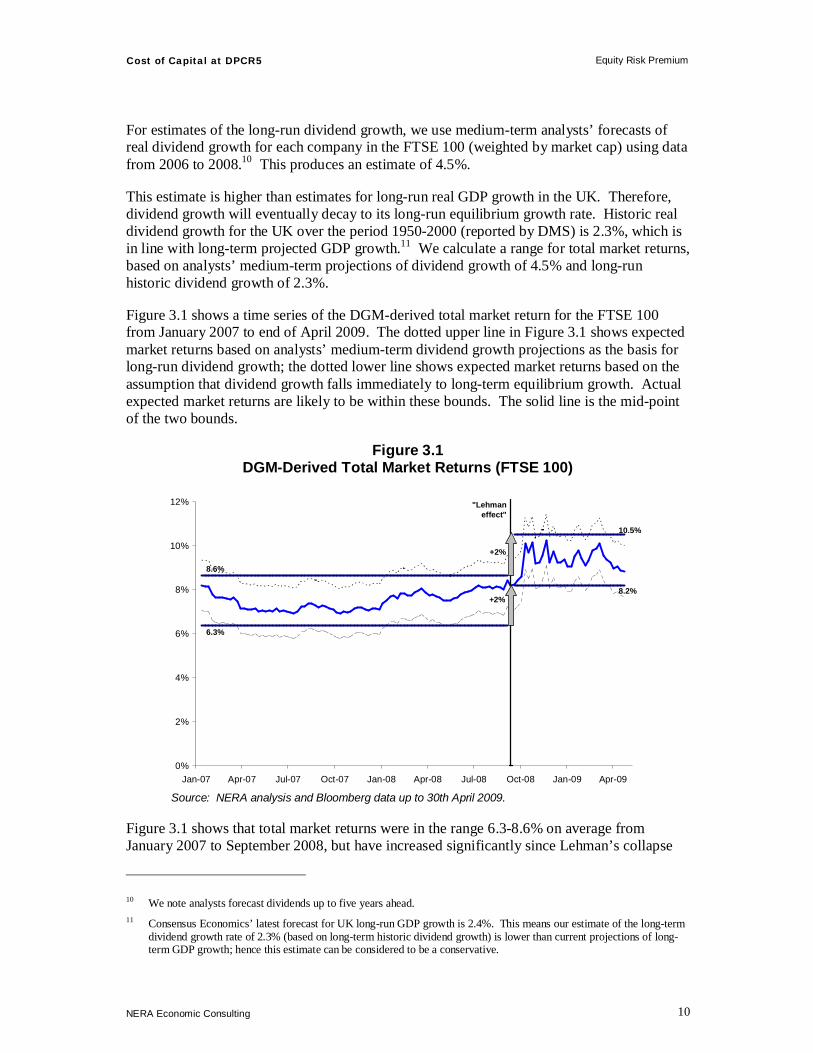
For estimates of the long-run dividend growth, we use medium-term analysts’ forecasts of real dividend growth for each company in the FTSE 100 (weighted by market cap) using data from 2006 to 2008.10 This produces an estimate of 4.5%.
This estimate is higher than estimates for long-run real GDP growth in the UK. Therefore, dividend growth will eventually decay to its long-run equilibrium growth rate. Historic real dividend growth for the UK over the period 1950-2000 (reported by DMS) is 2.3%, which is in line with long-term projected GDP growth.11 We calculate a range for total market returns, based on analysts’ medium-term projections of dividend growth of 4.5% and long-run historic dividend growth of 2.3%.
Figure 3.1 shows a time series of the DGM-derived total market return for the FTSE 100 from January 2007 to end of April 2009. The dotted upper line in Figure 3.1 shows expected market returns based on analysts’ medium-term dividend growth projections as the basis for long-run dividend growth; the dotted lower line shows expected market returns based on the assumption that dividend growth falls immediately to long-term equilibrium growth. Actual expected market returns are likely to be within these bounds. The solid line is the mid-point of the two bounds.
Figure 3.1 DGM-Derived Total Market Returns (FTSE 100)
0%
2%
4%
6%
8%
10%
12%
Jan-07 Apr-07 Jul-07 Oct-07 Jan-08 Apr-08 Jul-08 Oct-08 Jan-09 Apr-09
`
"Lehmaneffect"
6.3%
8.6%
8.2%
10.5%
+2%
+2%
Source: NERA analysis and Bloomberg data up to 30th April 2009.
Figure 3.1 shows that total market returns were in the range 6.3-8.6% on average from January 2007 to September 2008, but have increased significantly since Lehman’s collapse
10 We note analysts forecast dividends up to five years ahead. 11 Consensus Economics’ latest forecast for UK long-run GDP growth is 2.4%. This means our estimate of the long-term
dividend growth rate of 2.3% (based on long-term historic dividend growth) is lower than current projections of long-term GDP growth; hence this estimate can be considered to be a conservative.

Cost of Capital at DPCR5 Equity Risk Premium
NERA Economic Consulting
11
on 15 September 2008. The range of total market returns since then has shifted vertically to 8.2-10.5%, nearly 2% on average in comparison to the preceding 18 months.
Note for BAA (2007) and Stansted airport (November 2008), the CC recommended total expected market returns of 5-7%.12 Figure 3.1 shows that at the time the decision was made the CC’s range of total market returns cannot be reconciled with actual market data: average expected market returns over the period January 2007 to September 2008 has been in the range of 6.3-8.6%, significantly above the CC’s recommended range.
The time series of expected total market returns shown in Figure 3.1 can be used to derive a measure of the ERP over this period by subtracting the expected risk free rate at that time. Figure 3.2 presents a time series of the DGM-derived ERP from January 2007 to end of April 2009 using a swap-based risk-free rate.13
Figure 3.2 DGM-Derived ERP Based on Swap-Based Risk Free Rate
0%
2%
4%
6%
8%
10%
12%
Jan-07 Apr-07 Jul-07 Oct-07 Jan-08 Apr-08 Jul-08 Oct-08 Jan-09 Apr-09
"Lehmaneffect"
3.9%
9.5%
+3%
7.2%
+3%
6.2%
Source: NERA analysis and Bloomberg data up to 30th April 2009.
We note that the DGM indicates a sharp increase in the ERP in the period following the bankruptcy of Lehman Brothers. Figure 3.2 shows that the current ERP is in the range 7.2-9.5% versus a range of 3.9-6.2% before Lehman’s collapse. This means the ERP has increased by around 3% on average in comparison to the preceding 18 months.14
12 For BAA (2007), the CC recommended a risk free rate of 2.5% and an ERP of 2.5-4.5%. For Stansted (November
20080 the CC only recommended total market returns and did not state a recommendation for the ERP separately. 13 We deflate swap-rates using a central estimate of annualised inflation expectations over five years from HM Treasury’s
monthly publication of City and independent forecasters. 14 The ranges are based on the averages of the lower- and upper bonds for the 20 months before “Lehman” (12 September
2008) and the 8 months after “Lehman”.

Cost of Capital at DPCR5 Equity Risk Premium
NERA Economic Consulting
12
The increase in the average level of the ERP of around 3% is greater than the 2% increase in total market returns (see Figure 3.1). This is consistent with the decline in the risk-free rate over the period (see Section 2.2).
Note for BAA (2007) and Stansted airport (November 2008), the CC recommended an ERP of 3-5%. However, as Figure 3.2 above illustrates, the expected ERP was never as low as 3% over recent periods, and the trend value was in the range of 4-6% (5% on average) even before the financial crisis started.
From today’s point of view, the CC’s ERP recommendation severely underestimates actual required risk premiums: the ERP since Q4 2008 has been above 7%, well above the upper end of the CC’s ERP range of 3-5%. This shows that the CC’s recommendation no longer provides any guidance to current expected market returns.15
3.2.2. Implied market volatility as an indicator for ERP
We provide further evidence that the ERP has increased recently, by analysing the change in implied volatilities (backed out from ‘at the money’ financial call and put options) in equity markets over recent history. Implied market volatility is a key predictor for “real-time” changes in ERP.16 In Appendix E we provide a brief overview of the academic literature which clearly states a link between market volatility and the ERP.
Figure 3.3 Implied Volatility of the FTSE 100
0%
5%
10%
15%
20%
25%
30%
35%
40%
45%
50%
55%
60%
65%
Sep-07 Nov-07 Jan-08 Mar-08 May-08 Jul-08 Sep-08 Nov-08 Jan-09 Mar-09
3M 6M 12M 18M
"Lehmaneffect"
+50%
Average of 18 month implied
volatility
Source: Bloomberg. Note: implied volatility is derived from at the money call-options
15 Note: the value for the ERP under this method depends on the choice of security that is used to measure the risk free
rate. However, the overall value for the cost of equity (assuming an equity beta close to 1.0) is not affected significantly if the same measure of the risk free rate is used in the CAPM and in the derivation of the ERP to estimate the forward looking cost of equity.
16 For instance, the Bank of England states: “The VIX (Chicago Board Options Exchange Volatility index) is an index of volatility in the Standard and Poor’s 500 equity index implied from options prices and is widely used as a measure of global risk aversion” (Quarterly Bulletin 2008 Q1).

Cost of Capital at DPCR5 Equity Risk Premium
NERA Economic Consulting
13
Figure 3.3 shows the implied volatility of the FTSE 100 over different projected periods (3 months to 18 months). Currently, investors expect market volatility to stay for at least 18 months at levels which are around 50% higher than average expected volatility over the past 12 months preceding the collapse of Lehman.
The Bank of England publishes daily summary statistics on so-called option-implied probability density functions for the FTSE 100. We use the dispersion of expectations around the central (mean) forecast to demonstrate the degree of uncertainty and its skewness towards positive or negative outcomes.17
Figure 3.4 Uncertainty around Forward Expectations in the FTSE 100
-50%
-40%
-30%
-20%
-10%
0%
10%
20%
30%
40%
50%
Jan-07 Apr-07 Jul-07 Oct-07 Jan-08 Apr-08 Jul-08 Oct-08 Jan-09 Apr-09
90% 70% 50% 30%
Lehman
Source: NERA analysis of Bank of England data Notes: Time series based on demeaned percentiles of BoE’s option-implied probability density functions (based on three-month constant-maturity FTSE 100 options), normalised by the mean option-implied outcome
The shaded areas Figure 3.4 represent confidence intervals of 30%, 50%, 70% and 90% (from darkest to lightest) around the option-implied mean expectation for the FTSE 100. For example, in early May 2007, the data suggest that investors expected (with 90% confidence) the FTSE 100 in three months to lie no higher than 10% above their mean forecast and no lower than 15% below their mean forecast.
17 The Bank of England’s forward expectations are constructed assuming risk neutrality, whereas option prices are likely
to incorporate a premium to compensate risk-averse investors. Assuming risk neutrality therefore understates expected levels of the FTSE 100 relative to “true” risk-averse expected levels. We therefore focus on dispersion relative to the mean rather than absolute levels. See “Notes on the Bank of England Option Implied Probability Density Functions”, Bank of England

Cost of Capital at DPCR5 Equity Risk Premium
NERA Economic Consulting
14
We observe a dramatic rise in these confidence intervals following the collapse of Lehman in mid-September 2008. In October, implied 90% confidence intervals ranged over 90% around the mean compared to the 20-25% ranges that marked pre-crisis expectations. Crucially, although the relative dispersion of expectations has fallen since peaks last autumn, these data indicate that uncertainty remains well above historic levels and are more heavily skewed towards negative outcomes than has been the norm.
Overall, the evidence shows that uncertainty has increased significantly in equity markets since the beginning of the current downturn, particularly since the collapse of Lehman, and that volatility remains at elevated levels compared to 2007 for at least another 18 months. This increase in option-implied stock market volatility is associated with perceptions of increased risk, and therefore an increase in the ERP. Our analysis suggests that the ERP will stay for at least the coming 18 months at levels well above long-run averages.
3.2.3. Further evidence on ERP from CDS indices
In this section we provide further evidence that risk premiums in capital markets have increased significantly in recent months. We provide market evidence on the required premium of bearing bankruptcy risk. We show that bankruptcy risk and investors required return for bearing this risk has increased significantly in recent months. To this end, we draw on premiums of credit default swap (CDS) indices, which are derivative instruments to hedge credit risk on a group of entities, to show how investors’ required premiums for bearing bankruptcy risk has changed since the collapse of Lehman Brothers in September 2008.18
Although changes in CDS premiums reflect changes in the cost of insuring the debt of a company against bankruptcy, it is a close proxy for changes in the required risk premium for equity holders, since equity holders also bear bankruptcy risk for which they require adequate compensation.19 In fact, given that equity holders’ claim on the company’s cash flows is subordinated to bondholders’ claim, equity holders are exposed to higher bankruptcy risk and hence require even higher compensation. Therefore, changes in CDS premiums are likely to underestimate changes in risk premium demanded by equity holders.
Figure 3.5 shows CDS premiums of the iTraxx Europe index, which reflects the aggregate required premium for bearing bankruptcy risk of 125 investment grade rated companies, for both five-year and ten-year maturities.
Comparing the average level of these indices pre- and post-Lehman shows that the required premiums for bearing bankruptcy has increased by 125% (for ten-year maturity) and 250%
18 CDS indices constitute a benchmark for the cost to debtholders of protecting their investments against default. We
present data from the iTraxx Europe CDS index, which covers the 125 most actively-traded investment-grade European entities (rebalanced every six months), as well as iTraxx sectoral CDS indices. Standard contracts on the index are quoted in terms of insuring €10 million of debt for five or ten years (each company accounts for an equal proportion, 0.8%, of exposure). A 100bps level for a five-year index therefore corresponds to a €100,000 annual premium to insure €10 million of debt against default over five years. We interpret increases in these indices as indicative of investor expectations of the generic risk of default.
19 CDS premiums include a premium for counterparty risk (i.e. the risk that the transacting counterparty may not be able to meet its obligations), which may vary over time. Although there is reason to believe that this has increased, particularly following the collapse of AIG and Lehman Brothers in 2008, we assume for the purposes of this analysis that the increase is immaterial relative to the premium for default risk.

Cost of Capital at DPCR5 Equity Risk Premium
NERA Economic Consulting
15
(for five-year maturity). Although levels have fallen in 2009, we note that current levels (as of mid-June 2009) remain twice as high as average historic levels since 2004 (the earliest date CDS index data is available).
Our analysis shows that during period of low market volatility, the required premium to bear bankruptcy risk has increased from around 25-50 basis points to around 100-200 basis points in recent months. This piece of market evidence strongly suggests that the premium for holding equities, which bears even higher bankruptcy risk than reflected in CDS premiums, has increased by at least 50-175 basis points. If we were to include also non-investment grade entities in our analysis the increase in the required premium would be even higher.
Figure 3.5 iTraxx CDS Indices: Europe (bps)
0
50
100
150
200
250
Jun-04 Dec-04 Jun-05 Dec-05 Jun-06 Dec-06 Jun-07 Dec-07 Jun-08 Dec-08 Jun-09
iTraxx Europe (5yr)iTraxx Europe (10yr)
Lehman
Source: Bloomberg
This increase in risk and the required increase in premiums are reflected across all sub-sectors of the economy. We present data from iTraxx sub-indices focusing on European non-financials (100 entities) and European energy companies (20 companies) in Figure 3.6.
Figure 3.6 iTraxx CDS Indices: European (a) Non-Financials and (b) Energy (bps)
0
50
100
150
200
250
300
350
Jun-04 Dec-04 Jun-05 Dec-05 Jun-06 Dec-06 Jun-07 Dec-07 Jun-08 Dec-08 Jun-09
iTraxx Non-Financials (5yr)iTraxx Non-Financials (10yr)
Lehman
0
50
100
150
200
250
300
350
Jun-04 Dec-04 Jun-05 Dec-05 Jun-06 Dec-06 Jun-07 Dec-07 Jun-08 Dec-08 Jun-09
iTraxx Energy (5yr)
iTraxx Energy (10yr)
Lehman
Source: Bloomberg. Note: No data were available for Series 9 for non-financials. (b) (a)
Cost of Capital at DPCR5 Equity Risk Premium
NERA Economic Consulting
16
The average levels of non-financials indices have risen 156% (for ten-year maturity) and 326% (for five-year maturity), comparing post-Lehman averages to pre-Lehman averages. The charts show that current levels (around 100bps) for both maturities are significantly above the pre-Lehman levels (around 40-60bps).
Investors bearing bankruptcy risk of European energy companies require even higher premiums: before the summer of 2007, the indices were at 15-25bps. These also increased sharply by 250% (for ten-year maturity) and 350% (for five-year maturity). Although levels have fallen to 100bps since peaking early this year over 200bps, we note that this still constitutes at least a four-fold increase relative to pre-crisis levels.
3.3. Conclusion
In this section we have considered the ERP based on both long-run historic data and current market evidence. Our analysis shows the following:
§ The long-run historical estimate of the ERP is 5.4%.
§ Based on DGM analysis the “current” ERP is in a range of 7.2-9.5%, around 3% higher than pre-crisis levels of 3.9-6.2% and substantially above the long-run historical average of 5.4%.
§ Implied stock market volatility shows that the market expects volatility to remain significantly above historic averages for at least another 18 months, which suggests that the ERP is expected to remain at its current high levels for at least another 18 months.
§ Further evidence on risk premiums supports our analysis of an increased ERP since the onset of the financial crisis. For instance, investors require significantly higher risk premiums to compensate for bankruptcy risk in today’s market.
Overall, our analysis shows that there has been a fundamental re-pricing of risk in the market. Not taking this into account is likely to lead to a severe underestimation of the cost of capital over the forthcoming regulatory period.
Cost of Capital at DPCR5 Beta
NERA Economic Consulting
17
4. Beta
This section estimates DNO’s asset beta and structured as follows:20
§ Section 4.1 discusses the various sources of evidence about DNOs’ asset beta including listed DNOs and other regulated network operators;
§ Section 4.2 presents our estimates of DNOs’ asset beta; and;
§ Section 4.3 concludes.
4.1. Comparator Analysis
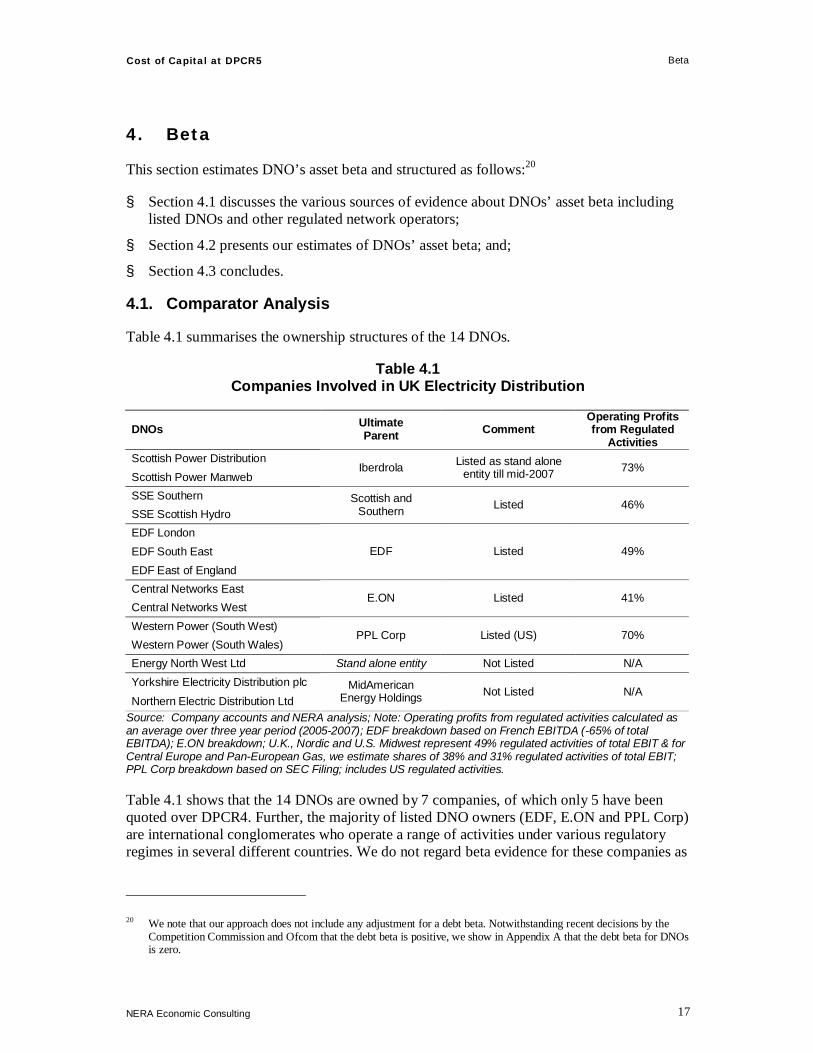
Table 4.1 summarises the ownership structures of the 14 DNOs.
Table 4.1 Companies Involved in UK Electricity Distribution
DNOs Ultimate Parent Comment
Operating Profits from Regulated
Activities Scottish Power Distribution Scottish Power Manweb
Iberdrola Listed as stand alone entity till mid-2007 73%
SSE Southern SSE Scottish Hydro
Scottish and Southern Listed 46%
EDF London EDF South East EDF East of England
EDF Listed 49%
Central Networks East Central Networks West
E.ON Listed 41%
Western Power (South West) Western Power (South Wales)
PPL Corp Listed (US) 70%
Energy North West Ltd Stand alone entity Not Listed N/A Yorkshire Electricity Distribution plc
Northern Electric Distribution Ltd MidAmerican
Energy Holdings Not Listed N/A
Source: Company accounts and NERA analysis; Note: Operating profits from regulated activities calculated as an average over three year period (2005-2007); EDF breakdown based on French EBITDA (-65% of total EBITDA); E.ON breakdown; U.K., Nordic and U.S. Midwest represent 49% regulated activities of total EBIT & for Central Europe and Pan-European Gas, we estimate shares of 38% and 31% regulated activities of total EBIT; PPL Corp breakdown based on SEC Filing; includes US regulated activities.
Table 4.1 shows that the 14 DNOs are owned by 7 companies, of which only 5 have been quoted over DPCR4. Further, the majority of listed DNO owners (EDF, E.ON and PPL Corp) are international conglomerates who operate a range of activities under various regulatory regimes in several different countries. We do not regard beta evidence for these companies as
20 We note that our approach does not include any adjustment for a debt beta. Notwithstanding recent decisions by the
Competition Commission and Ofcom that the debt beta is positive, we show in Appendix A that the debt beta for DNOs is zero.

Cost of Capital at DPCR5 Beta
NERA Economic Consulting
18
useful indicators of the beta for UK DNOs. We focus instead upon Scottish Power and Scottish and Southern.
Since Scottish Power has the highest proportion of profits from UK electricity distribution it should provide the best evidence of DNOs’ beta. However, we note that there are two main drawbacks with treating Scottish Power as representative of DNOs generally: (i) Scottish Power’s beta may be affected by its other business, notably its unregulated activities both in the UK and internationally, and;21 (ii) our analysis is curtailed by Scottish Power’s delisting during DPCR4. Due to takeover speculation we are able to focus on market data up until 8 November 2006, which is just 18 months of DPCR4.
Although around half of Scottish and Southern’s operating profit comes from UK regulated electricity businesses, much of this comes from electricity generation and transmission, rather than distribution. As a result, we see Scottish and Southern as a less reliable source of evidence about DNOs’ beta than Scottish Power.
Overall, neither of these companies are an ideal source of data about the DNOs’ beta. As a consequence we also consider evidence from a number of comparator companies, which are listed in Table 4.2.
Table 4.2 DNO Comparator Companies for Beta Analysis
DNOs Other Energy Water Scottish Power Viridian United Utilities
Scottish and Southern National Grid Severn Trent Pennon Kelda Northumbrian
Viridian and National Grid are potentially useful comparators due to their involvement in UK energy network businesses. However Viridian’s potential usefulness is, like Scottish Power’s, curtailed by its delisting in 2006, and National Grid has previously, and continues to have, a large (regulated) business in the US.
UK water and sewerage companies (WaSCs) may also provide useful evidence as these companies are primarily network operators, notwithstanding that there are important differences between water and electricity networks. Moreover, while most of the UK WaSCs currently have only limited non-regulated businesses, this has not always been the case historically.
Figure 4.1 below shows six month rolling asset for all of the potential DNO comparators.
21 Scottish Power operates an international energy business comprising (regulated) electricity transmission and
distribution and (unregulated) energy supply in the UK, as well as electricity generation, gas storage and energy management activities in the UK, US and Canada. The regulated T & D business comprised around three-quarters of operating profit in 2005/06. A break-down of T & D into its constituent parts is not publicly available. We note, however, that in the past regulated UK T & D activities have represented a smaller proportion of overall operating profit; SPW has previously had interests in British water and telephony and, from 1999-2005 operated regulated activities in the US (through its subsidiary Pacificorp).

Cost of Capital at DPCR5 Beta
NERA Economic Consulting
19
Figure 4.1 Six Month Rolling Asset Betas for UK Companies (1999-2009)
0.0
0.2
0.4
0.6
0.8
1.0
1999 2000 2001 2002 2003 2004 2005 2006 2007 2008 2009
National GridScottish & SouthernViridianScottish Power
0.0
0.2
0.4
0.6
0.8
1.0
1999 2000 2001 2002 2003 2004 2005 2006 2007 2008 2009
Severn TrentPennonKeldaUnited UtilitiesNorthumbrianScottish Power
Source: NERA Analysis of Bloomberg data until 30th April 2009. Equity betas calculated with reference to the FTSE All-Share Index and Blume-adjusted before de-levering (using average debt-to-equity ratio over the prior six months) to produce an asset beta.
We note the following:
§ Scottish Power’s beta is higher than what we would expect from a pure-play DNO. A likely explanation for this is that Scottish Power’s unregulated business has a higher systematic risk, which is reflected in its beta estimate.
§ Scottish and Southern’s asset beta is considerably more volatile than that of Scottish Power. We place less weight on evidence from Scottish and Southern as a result;
§ Due to the relative illiquidity of its stocks Viridian’s asset beta was low relative to other utility networks for several years (until 2005). We do not regard Viridian as a useful comparator as a result.
Cost of Capital at DPCR5 Beta
NERA Economic Consulting
20
The beta estimates of National Grid and the UK water companies are the best indicators of DNOs’ beta.
4.2. Beta Estimates
We consider estimates of beta over both the short and long-term. The use of both short and long term estimates allows any changes in current betas to be identified which we can feed into our current CAPM cost of equity. Long-term estimates are more appropriate for a long-run historic-evidence based CAPM.
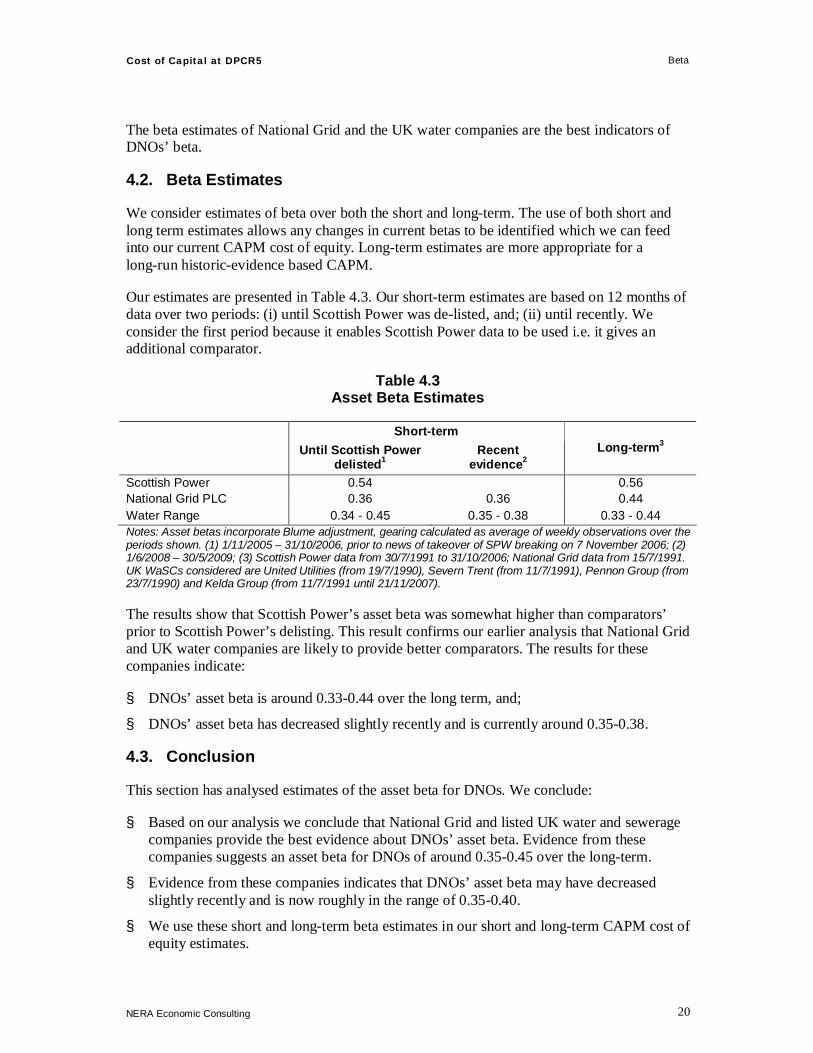
Our estimates are presented in Table 4.3. Our short-term estimates are based on 12 months of data over two periods: (i) until Scottish Power was de-listed, and; (ii) until recently. We consider the first period because it enables Scottish Power data to be used i.e. it gives an additional comparator.
Table 4.3 Asset Beta Estimates
Short-term
Until Scottish Power delisted1
Recent evidence2
Long-term3
Scottish Power 0.54 0.56 National Grid PLC 0.36 0.36 0.44 Water Range 0.34 - 0.45 0.35 - 0.38 0.33 - 0.44 Notes: Asset betas incorporate Blume adjustment, gearing calculated as average of weekly observations over the periods shown. (1) 1/11/2005 – 31/10/2006, prior to news of takeover of SPW breaking on 7 November 2006; (2) 1/6/2008 – 30/5/2009; (3) Scottish Power data from 30/7/1991 to 31/10/2006; National Grid data from 15/7/1991. UK WaSCs considered are United Utilities (from 19/7/1990), Severn Trent (from 11/7/1991), Pennon Group (from 23/7/1990) and Kelda Group (from 11/7/1991 until 21/11/2007).
The results show that Scottish Power’s asset beta was somewhat higher than comparators’ prior to Scottish Power’s delisting. This result confirms our earlier analysis that National Grid and UK water companies are likely to provide better comparators. The results for these companies indicate:
§ DNOs’ asset beta is around 0.33-0.44 over the long term, and;
§ DNOs’ asset beta has decreased slightly recently and is currently around 0.35-0.38.
4.3. Conclusion
This section has analysed estimates of the asset beta for DNOs. We conclude:
§ Based on our analysis we conclude that National Grid and listed UK water and sewerage companies provide the best evidence about DNOs’ asset beta. Evidence from these companies suggests an asset beta for DNOs of around 0.35-0.45 over the long-term.
§ Evidence from these companies indicates that DNOs’ asset beta may have decreased slightly recently and is now roughly in the range of 0.35-0.40.
§ We use these short and long-term beta estimates in our short and long-term CAPM cost of equity estimates.

Cost of Capital at DPCR5 Cost of Equity
NERA Economic Consulting
21
5. Cost of Equity
This section sets out our estimate of the “historic” and “current” cost of equity and is structured as follows:
§ Section 5.1 sets out the “historic” and “current” cost of equity based on the CAPM;
§ Section 5.2 provides a cross check on the CAPM-derived cost of equity drawing on the DGM; and;
§ Section 5.3 concludes on the overall cost of equity.
5.1. “Historic” and “Current” CAPM Cost of Equity
Our analysis shows that the cost of equity for DNOs has increased in 2009 compared to long-run historic estimates. Table 5.1 presents our estimated ranges of the historic and current cost of equity, based on the CAPM. Our cost of equity numbers are based on a 60% gearing, which we consider to be consistent with an A- credit rating (see Appendix A).
Table 5.1 “Historic” and “Current” CAPM Estimates (%)
“Historic” “Current” Risk-Free Rate 2.5 1.0 Equity Risk Premium 5.4 7.2 - 9.5 Asset Beta 0.35 – 0.45 0.35 – 0.40 Debt Beta 0 0 Equity Beta 0.88 – 1.13 0.88 – 1.00 Gearing 60 60 Cost of Equity (Range) 7.2 – 8.6 7.3 – 10.5 Source: NERA analysis
Based on long-run historic data, the overall cost of equity implied by our parameter estimates is in the range of 7.2-8.6%. Recent data shows a wider range for the cost of equity of 7.3-10.5%. Below, we cross-check this result with the DGM and find that this increase is also supported by this alternative model (see Section 5.2).
5.2. Cross-Check on “Current” CAPM Estimate
As a check on the CAPM, we calculate the cost of equity using the alternative DGM model for a number of comparators.
We employ a two-stage DGM22 and draw on company-specific data for the following quoted comparators: United Utilities, Pennon, Severn Trent, Northumbrian and National Grid.
22 We estimate the DGM-derived cost of equity for quoted Water companies in our report for Water UK, where we
discuss the ‘two-stage’ DGM methodology in detail (see NERA “Cost of Capital for PR09” (June 2008), available at: http://www.water.org.uk/home/news/press-releases/cost-of-capital-for-pr09/080623-nera-water-uk-wacc-report-final.pdf, Section 7.1).
Cost of Capital at DPCR5 Cost of Equity
NERA Economic Consulting
22
Our dividend growth model requires three primary data inputs for each company: (1) share price at the ex-dividend date23; (2) short-term dividend forecasts, and (3) estimated long term dividend growth rates.
For short-term dividend forecasts, we use explicit forecasts of dividend payments provided by analysts to Bloomberg. Explicit forecasts are generally available up to 5 years ahead. There is however no universal standard by which long-term expected dividend growth rates (after the explicit dividend forecasts) are derived. We report DGM-derived cost of equity ranges based on long run real UK GDP growth at time of estimation (i.e. 2.4% p.a. in 2008).24
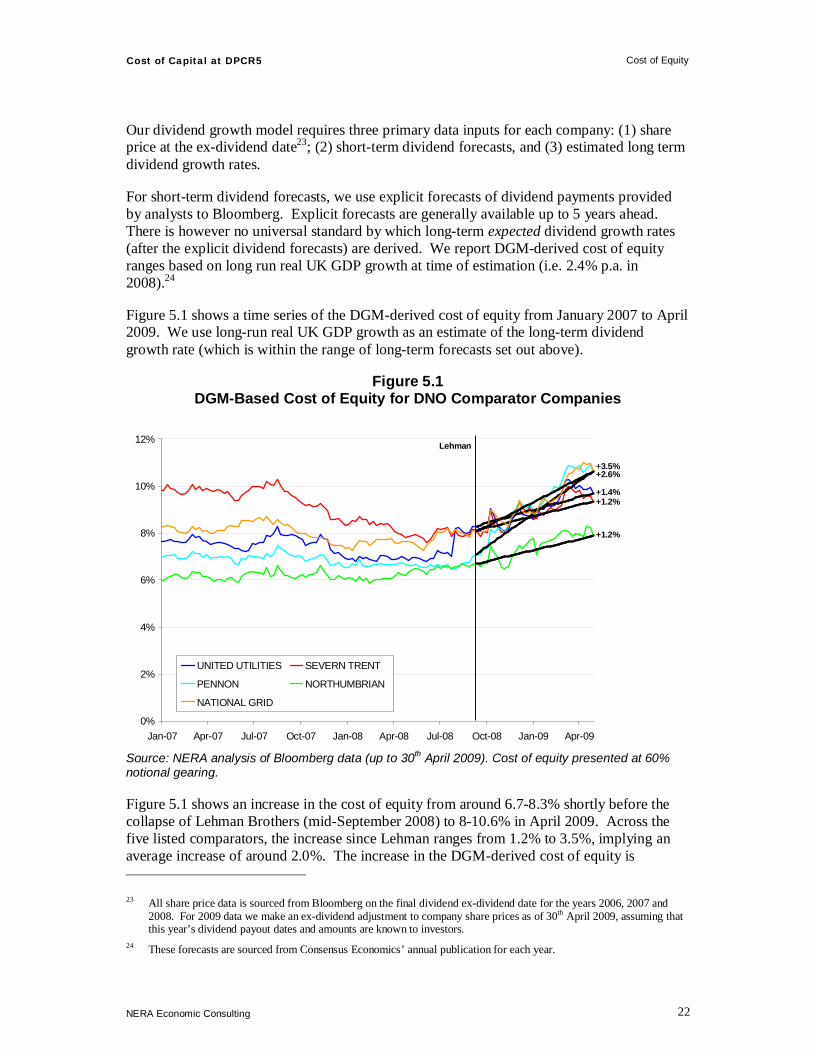
Figure 5.1 shows a time series of the DGM-derived cost of equity from January 2007 to April 2009. We use long-run real UK GDP growth as an estimate of the long-term dividend growth rate (which is within the range of long-term forecasts set out above).
Figure 5.1 DGM-Based Cost of Equity for DNO Comparator Companies
Source: NERA analysis of Bloomberg data (up to 30th April 2009). Cost of equity presented at 60% notional gearing.
Figure 5.1 shows an increase in the cost of equity from around 6.7-8.3% shortly before the collapse of Lehman Brothers (mid-September 2008) to 8-10.6% in April 2009. Across the five listed comparators, the increase since Lehman ranges from 1.2% to 3.5%, implying an average increase of around 2.0%. The increase in the DGM-derived cost of equity is 23 All share price data is sourced from Bloomberg on the final dividend ex-dividend date for the years 2006, 2007 and
2008. For 2009 data we make an ex-dividend adjustment to company share prices as of 30th April 2009, assuming that this year’s dividend payout dates and amounts are known to investors.
24 These forecasts are sourced from Consensus Economics’ annual publication for each year.
0%
2%
4%
6%
8%
10%
12%
Jan-07 Apr-07 Jul-07 Oct-07 Jan-08 Apr-08 Jul-08 Oct-08 Jan-09 Apr-09
UNITED UTILITIES SEVERN TRENT
PENNON NORTHUMBRIAN
NATIONAL GRID
Lehman
+1.2%
+1.2%
+3.5%
+1.4%
+2.6%
Cost of Capital at DPCR5 Cost of Equity
NERA Economic Consulting
23
consistent with the observed increase in the CAPM-derived cost of equity, based on current market data.
We also note that the current range for the DGM cost of equity of 8.0-10.6% overlaps with the top end of the range of our CAPM estimates of both historic and current cost of equity.
5.3. Conclusion
Our analysis shows that the current cost of equity for DNOs has increased compared to long-run historic trailing averages. We use the overlap of the DGM-derived figures and CAPM-derived figures of the current cost of equity to arrive at a composite range for the current cost of equity for DNOs.
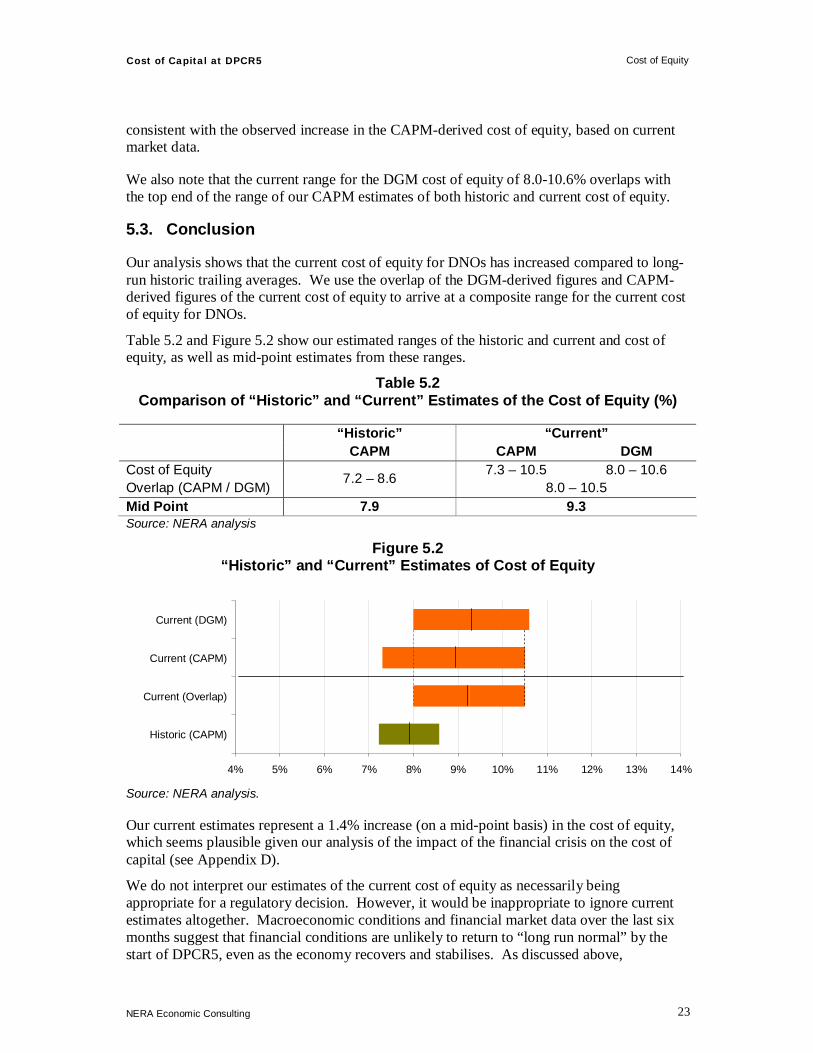
Table 5.2 and Figure 5.2 show our estimated ranges of the historic and current and cost of equity, as well as mid-point estimates from these ranges.
Table 5.2 Comparison of “Historic” and “Current” Estimates of the Cost of Equity (%)
“Historic” “Current” CAPM CAPM DGM
Cost of Equity 7.3 – 10.5 8.0 – 10.6 Overlap (CAPM / DGM)
7.2 – 8.6 8.0 – 10.5
Mid Point 7.9 9.3 Source: NERA analysis
Figure 5.2 “Historic” and “Current” Estimates of Cost of Equity
4% 5% 6% 7% 8% 9% 10% 11% 12% 13% 14%
Historic (CAPM)
Current (Overlap)
Current (CAPM)
Current (DGM)
Source: NERA analysis.
Our current estimates represent a 1.4% increase (on a mid-point basis) in the cost of equity, which seems plausible given our analysis of the impact of the financial crisis on the cost of capital (see Appendix D).
We do not interpret our estimates of the current cost of equity as necessarily being appropriate for a regulatory decision. However, it would be inappropriate to ignore current estimates altogether. Macroeconomic conditions and financial market data over the last six months suggest that financial conditions are unlikely to return to “long run normal” by the start of DPCR5, even as the economy recovers and stabilises. As discussed above,

Cost of Capital at DPCR5 Cost of Equity
NERA Economic Consulting
24
macroeconomic projections are also marked by unusual uncertainty. It is not clear how long the recession will last or what post-recovery conditions will resemble. A prudent methodology should take into account the fact that conditions over DPCR5 may resemble neither long-run historic conditions nor current conditions but some intermediate point between the two.
This might be done by weighting the “historic” and “current” evidence on the cost of equity based on economic forecasts on the length of the recession, the speed of the recovery and the state of the economy and financial markets following recovery. The longer that the current crisis lasts, the slower the recovery to stable conditions, and the more different stable conditions to pre-crisis conditions, the more weight should be placed on current market evidence.
For example, historic and current estimates of the cost of equity could be blended using equal weighting: using the mid-points of our historic (7.9%) and current (9.3%) ranges, this implies an indicative estimate of the cost of equity over DPCR5 of 8.6%.

Cost of Capital at DPCR5 Cost of Debt
NERA Economic Consulting
25
6. Cost of Debt
This section discusses the estimation of the cost of debt for DNOs and is set our as follows:
§ Section 6.1 sets out Ofgem’s approach of setting the allowed cost of debt at past reviews.
§ Section 6.2 describes our approach to estimating the cost of debt for DNOs at DPCR5;
§ Section 6.3 presents market evidence on the cost of debt;
§ Section 6.4 considers other costs such as transaction and pre-funding costs;
§ Section 6.5 sets out inflation expectations;
§ Section 6.6 set out the “historic” and “current” estimates of the cost of debt; and;
§ Section 6.7 concludes.
6.1. Ofgem’s Approach at Past Reviews
In estimating the cost of debt at the Transmission Price Control Review (TPCR) in 2006, Ofgem relied on ten year trailing averages.
However, at the Gas Distribution Price Control Review (GDPCR) in December 2007, Ofgem did not solely rely on ten year trailing averages, but also considered market conditions at the time. In particular Ofgem stat that they had regard to the following in estimating the cost of debt at GDPCR:
§ Short-term trends in the market cost of debt including evidence from actual debt costs achieved by the companies;
§ Trends in the market cost of debt over a ten-year period; and
§ Longer-term equilibria in the market cost of debt.
Ofgem states in its Final Proposal on the GDPCR: “Within initial and updated proposals, Ofgem concluded that the cost of debt of 3.55% appropriately balanced the spot rates for the cost of debt, the ten year trailing average, and the long-term averages.”25
6.2. NERA’s Approach
We present data on cost of debt for the DNOs drawing on both current and time series information. We focus upon historic benchmark yields (as opposed to actual embedded debt costs). The use of benchmark yields provides DNOs an incentive to outperform the average benchmark yield over the interest rate cycle, the benefits of which will eventually feed through to customers. By contrast, setting DNOs’ historic cost of debt equal to embedded debt costs removes any incentive for DNOs to finance themselves efficiently.
Our estimate of DNOs’ cost of debt for DPCR5 is composed of the following elements:
25 Ofgem (December 2007) Gas Distribution Price Control Review: Final Proposals, p102.

Cost of Capital at DPCR5 Cost of Debt
NERA Economic Consulting
26
§ Funding costs based on yield data drawn from primary and secondary markets;
§ Costs of existing debt in companies’ debt portfolios;
§ Transaction costs including legal fees, payments to loan arrangers and fees for structured and proprietary funding products, and;
§ Pre-funding costs relating to the (necessary and efficient) arrangement of funding before it is required.
There is an argument for setting the cost of debt at each price review equal to the current costs of debt at the time. However, we do not think that it would be appropriate for Ofgem to shift its cost of debt methodology completely to a “current” cost methodology, at a time when current debt costs are high. This would lead to windfall gains to companies with low embedded costs of debt of long maturities.
Instead, we propose a regulatory methodology to estimate the cost of debt, which takes into account that the sector has raised debt in the past at more favourable rates than currently observed and that companies face higher debt costs in financing new capex over DPCR5 than in the past. We propose that the sector will be allowed a cost of debt which is the weighted average of the following two components:
§ Long-term time series evidence on the cost of debt for the proportion of debt the sector will not be refinanced over DPCR5;
§ Current evidence on the cost of debt for the proportion of new debt (i.e. refinancing of existing debt and new debt to finance new capex over DPCR5).
We looked at the maturity profile of the sector to estimate the proportion of debt that will need refinancing prior to the end of the regulatory period in 2015. Further, we investigated the requirement of new debt to finance the investment programme over DPCR5.
6.3. Market Evidence
Long-run trailing averages of yield-to-maturities on outstanding bonds provide a good benchmark measure of the cost of debt for DNOs. However, during the current period of high market volatility yield data from the primary market shows that issuers need to pay an issuance premium in order to place their issue.
Figure 6.1 shows sterling denominated A and BBB benchmark yields in the secondary market (excluding financials) over the last ten years.26 Figure 6.1 shows that:
§ Yields on both A and BBB rated debt decreased steadily between 2000 and 2006, but have since increased;
§ Yields peaked in late 2008 at over 7% and 9% for A and BBB rated debt, respectively;
26 We use benchmark yields for A and BBB rated corporate bonds omitting financial institutions as financial institutions
have been disproportionately affected by the current market turmoil. The maturities on the benchmark yields change slightly over the period but are 10 to 15 years.

Cost of Capital at DPCR5 Cost of Debt
NERA Economic Consulting
27
§ Yields on BBB rated debt have for most of the past decade been only slightly above yields on A rated debt, and;
§ The gap between yields on A and BBB rated debt has increased sharply in the last twelve months (or so) reflecting the impact of the credit crisis.
Figure 6.1 Sterling Benchmark Yields (Non-Financials)
4%
5%
6%
7%
8%
9%
10%
Jan-98 Jan-99 Jan-00 Jan-01 Jan-02 Jan-03 Jan-04 Jan-05 Jan-06 Jan-07 Jan-08 Jan-09
Non-Financials A 10+Non-Financials BBB 10+
Source: IBOXX data until 30th April 2009.
Table 6.1 shows ten year “historic” trailing averages and “current” benchmark bond yields. The cut-off date for our analysis is 30 April 2009.
Table 6.1 Sterling Benchmark Yields (Non-Financials) (%)
Rating “Current” (4 months average)
Ten year “Historic” Trailing Average1 Difference
A 6.6 6.0 0.6 BBB 8.5 6.4 2.1 Source: NERA analysis of IBOXX data. Averages presented are based on non-financial bonds with more than ten years to maturity. Data cut-off point is 30 April 2009. Note: (1) calculated over 10 full calendar years (1999 – 2008)
Table 6.1 shows that the ten year trailing average yield of A rated non-financial bonds was around 6.0%. This compares to an estimate of 6.6% in the current market environment. For BBB rated debt, the difference between “current” and “historic” is even more pronounced.
Note that yield data for A rated debt may understate the benchmark yield for DNOs, since the typical DNO is more likely to issue at “A-”. Further, this yield data does not include an issuance premium a company is likely to pay in order to place a new issue on the market.

Cost of Capital at DPCR5 Cost of Debt
NERA Economic Consulting
28
Table 6.2 shows evidence on recent bond issues by A or A- rated utilities.
Table 6.2 Recent Bond Issues: January – April 2009
Issuer S&P /
Moody's Rating
Amount £m
Issue Date
Tenor (years)
Coupon Yield
Short to Medium Tenor AT&T INC A / A2 750 30/04 8 5.875% VATTENFALL AB A- / A2 350 15/04 10 6.125% UNITED UTILIT WATER PLC A- / A3 275 25/03 13 5.747% CENTRICA PLC A *- / A3 400 10/03 13 6.375% CENTRICA PLC A *- / A3 250 10/03 5 5.125% SOUTHERN WATER SRVCS FIN A- / A3 300 05/03 10 6.125% SCOTTISH & SOUTHERN ENER A / A2 700 05/02 5 5.769% E.ON INTL FINANCE BV A / A2 350 23/01 5 5.125% SEVERN TRENT WATER UTIL A / A2 400 22/01 9 6.045% Range 5.1-6.4% Average 5.8% Long Tenor AT&T INC A / A2 1100 30/04 31 7.000% VATTENFALL AB A- / A2 1000 15/04 30 6.875% E.ON INTL FINANCE BV A / A2 700 23/01 30 6.750% NATL GRID ELECT TRANS A- / A3 379 13/01 22 7.496% Range 6.8-7.5% Average 7.0% Source: NERA analysis of Bloomberg data. Note: Ratings are at the time of issue, *- indicates rating was on negative watch. Bonds selected are rated A or A-, GBP only, issued by utilities or telecoms, fixed coupon only, bullet repayment only, not index-linked, not subordinated, non-fungible, do not feature coupon step-ups in the event of rating downgrade, not a private placement, not puttable and not callable.
Table 6.2 shows the following:
§ Coupons offered on new bond issues have been in a wide range of 5.1-7.5%, with longer-dated bonds showing significantly higher coupons;
§ Short-to-medium tenor bonds have had coupons of 5.1-6.4%, and;
§ Long tenor bonds have attracted higher coupons of 6.8-7.5%.
We consider short-to-medium tenor and long tenor bonds separately since the yield curve is steeply sloped.
The distinction between tenors is also important because most recent bond issues have been at short-tenor and seemingly low coupons, whereas DNOs would typically prefer to issue much longer tenors at higher coupons to match the lives of their assets, reduce re-financing risk and to minimise transaction costs. Differences in short and long term inflation expectations also need to be taken into account; we address this issue later.

Cost of Capital at DPCR5 Cost of Debt
NERA Economic Consulting
29
We note that EDF issued a £1.5b 25-year bond on the 2nd of June with a coupon of 6.125%, which is somewhat lower than the cost of long-tenor bonds presented above. This EDF issue is not, however, representative of the cost of debt for DNOs since the bond was issued at the parent company level which is 85% owned by the French government and has a stronger A+/Aa3 rating than the DNOs. It should also be noted that the EDF issue was executed at a substantial discount to face value meaning that the coupon effectively paid on this bond was about 6.4%.
6.4. Transaction and Pre-Funding Costs
Transaction costs
The cost of debt finance excludes transaction costs such as bank, legal, trustee and agent fees. Note that the Competition Commission recognised the need to make allowance for these costs during the Heathrow and Gatwick (2007) and Stansted (2008) reviews where it included 15 bps and 10 bps, respectively, within the cost of debt to compensate for the costs of raising new debt.
Based on our own analysis of bond issues by UK utilities companies we estimate that transaction costs amount to 7 bps both historically and currently.
Pre-funding and liquidity costs
Companies typically “pre-fund” in three ways:
§ By arranging finance in advance of when it is needed – the company incurs a cost related to the margin between the cost of the facility and the return on the deposited funds, referred to as the ‘cost of carry’;
§ By arranging revolving credit facilities, the company will typically incur commitment fees on undrawn monies, and;
§ By retaining cash on the balance sheet to meet short term funding requirements - the cost of these funds is again related to the ‘cost of carry’ via the opportunity cost of retaining the cash.
Since companies cannot be assured that finance will be available in sufficient quantities when it is required, pre-funding is an efficient debt-raising strategy. Also, from a pure cost-benefit point of view, pre-funding is likely to be cost effective: taking out debt incurs fixed costs, such as due-diligence fees charged by banks. It is therefore less costly to take out debt in larger sizes (and incur pre-funding costs) than in a series of smaller facility sizes. Since these pre-funding arrangements represent efficient financing decisions the associated costs should be compensated.
Based on our consultation with UK utilities companies and our analysis of publicly available data we conclude that pre-funding costs amount to about 8 bps historically and 53 bps in the current market environment. Table 6.3 summarises our analysis of transaction and pre-funding costs.

Cost of Capital at DPCR5 Cost of Debt
NERA Economic Consulting
30
Table 6.3 Transaction and Pre-funding Costs (bps p.a.)
Historic Current Transaction costs 7 7 Pre-funding costs 8 53 Total 15 60
Source: NERA analysis.
6.5. Inflation Expectations
In order to estimate the real cost of debt from nominal data, we need a measure of expected inflation. In the current market environment, expectations of future inflation are very volatile by historical standards. Reflecting this heightened uncertainty we construct ranges around our recent measures of inflation expectations. Historically, however, we estimate inflation expectations as an average of point estimates over the 1999-2008 period.
Appendix C discusses how we construct measures of inflation expectations for various horizons both currently and historically and the choice of data source. Our preferred source of data on inflation expectations is HM Treasury’s publication of City and independent forecasters’ forecasts for the UK economy. Using the February 2009 publication – the most recent with medium term forecasts included – we construct measures of short, medium and long-term inflation expectations as detailed below in Table 6.4 which shows:
§ Expected inflation for a five-year maturity was 1.7-2.4% per annum and 2.4-3.2% per annum for fifteen year maturity, and;
§ Inflation expectations for a 20-year horizon were 2.4-3.3% per annum, slightly lower than the 2.4-3.4% per annum range for a 30-year horizon.
Table 6.4 Medium-Term Inflation Expectation Ranges: 25th/75th Percentile (% p.a.)
Short-to-medium term Long-term 5 year 10 year 15 year 20 year 30 year
Feb 2009 1.7-2.4 2.2-3.0 2.4-3.2 2.4-3.3 2.4-3.4 Source: NERA analysis of HMT-published City and independent forecasts.
Most bond issuance this year has been limited to medium-tenor bonds of five to fifteen years maturity. We apply our measure of inflation expectations for the five-to-fifteen year period to the nominal bond costs presented earlier (Table 6.2) to derive real costs of debt. Likewise, since DNOs would usually prefer to issue long tenor bonds we apply our measure of inflation expectations over the twenty-to-thirty year period to the long-tenor nominal bond costs presented earlier.
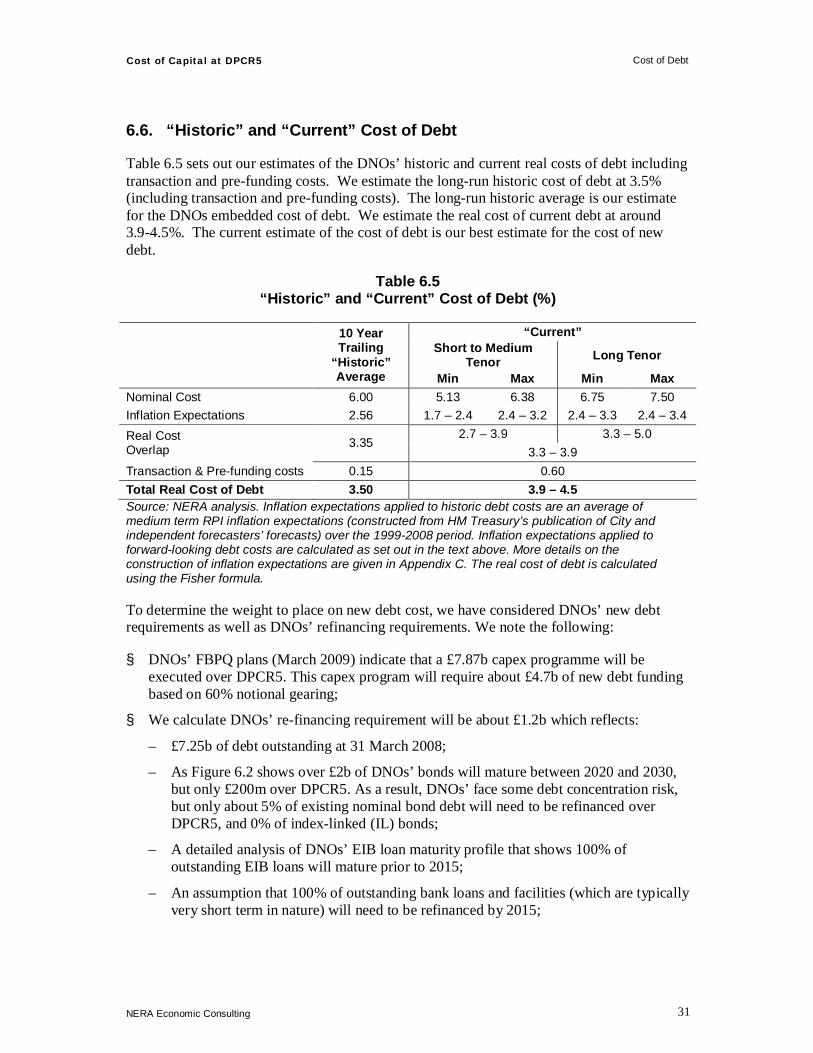
Cost of Capital at DPCR5 Cost of Debt
NERA Economic Consulting
31
6.6. “Historic” and “Current” Cost of Debt
Table 6.5 sets out our estimates of the DNOs’ historic and current real costs of debt including transaction and pre-funding costs. We estimate the long-run historic cost of debt at 3.5% (including transaction and pre-funding costs). The long-run historic average is our estimate for the DNOs embedded cost of debt. We estimate the real cost of current debt at around 3.9-4.5%. The current estimate of the cost of debt is our best estimate for the cost of new debt.
Table 6.5 “Historic” and “Current” Cost of Debt (%)
“Current” Short to Medium
Tenor Long Tenor
10 Year Trailing
“Historic” Average Min Max Min Max
Nominal Cost 6.00 5.13 6.38 6.75 7.50 Inflation Expectations 2.56 1.7 – 2.4 2.4 – 3.2 2.4 – 3.3 2.4 – 3.4
2.7 – 3.9 3.3 – 5.0 Real Cost Overlap 3.35
3.3 – 3.9 Transaction & Pre-funding costs 0.15 0.60 Total Real Cost of Debt 3.50 3.9 – 4.5 Source: NERA analysis. Inflation expectations applied to historic debt costs are an average of medium term RPI inflation expectations (constructed from HM Treasury’s publication of City and independent forecasters’ forecasts) over the 1999-2008 period. Inflation expectations applied to forward-looking debt costs are calculated as set out in the text above. More details on the construction of inflation expectations are given in Appendix C. The real cost of debt is calculated using the Fisher formula.
To determine the weight to place on new debt cost, we have considered DNOs’ new debt requirements as well as DNOs’ refinancing requirements. We note the following:
§ DNOs’ FBPQ plans (March 2009) indicate that a £7.87b capex programme will be executed over DPCR5. This capex program will require about £4.7b of new debt funding based on 60% notional gearing;
§ We calculate DNOs’ re-financing requirement will be about £1.2b which reflects:
– £7.25b of debt outstanding at 31 March 2008;
– As Figure 6.2 shows over £2b of DNOs’ bonds will mature between 2020 and 2030, but only £200m over DPCR5. As a result, DNOs’ face some debt concentration risk, but only about 5% of existing nominal bond debt will need to be refinanced over DPCR5, and 0% of index-linked (IL) bonds;
– A detailed analysis of DNOs’ EIB loan maturity profile that shows 100% of outstanding EIB loans will mature prior to 2015;
– An assumption that 100% of outstanding bank loans and facilities (which are typically very short term in nature) will need to be refinanced by 2015;
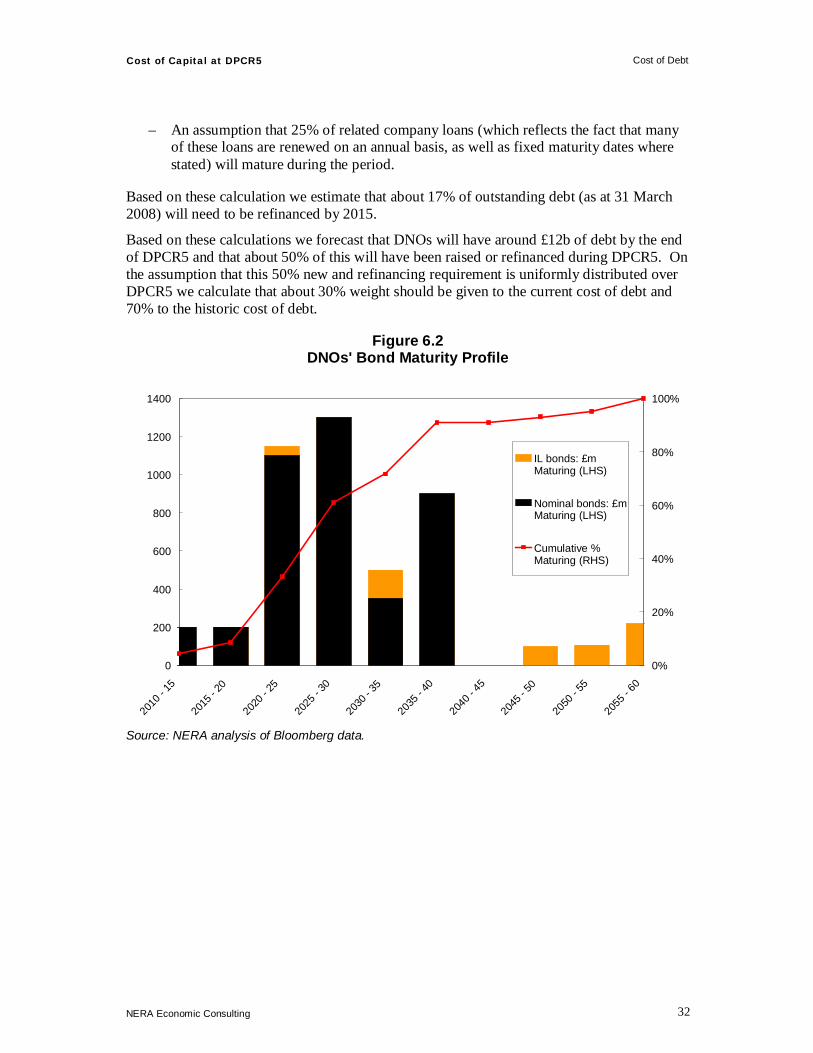
Cost of Capital at DPCR5 Cost of Debt
NERA Economic Consulting
32
– An assumption that 25% of related company loans (which reflects the fact that many of these loans are renewed on an annual basis, as well as fixed maturity dates where stated) will mature during the period.
Based on these calculation we estimate that about 17% of outstanding debt (as at 31 March 2008) will need to be refinanced by 2015.
Based on these calculations we forecast that DNOs will have around £12b of debt by the end of DPCR5 and that about 50% of this will have been raised or refinanced during DPCR5. On the assumption that this 50% new and refinancing requirement is uniformly distributed over DPCR5 we calculate that about 30% weight should be given to the current cost of debt and 70% to the historic cost of debt.
Figure 6.2 DNOs' Bond Maturity Profile
0
200
400
600
800
1000
1200
1400
2010
- 15
2015
- 20
2020
- 25
2025
- 30
2030
- 35
2035
- 40
2040
- 45
2045
- 50
2050
- 55
2055
- 60
0%
20%
40%
60%
80%
100%
IL bonds: £mMaturing (LHS)
Nominal bonds: £mMaturing (LHS)
Cumulative %Maturing (RHS)
Source: NERA analysis of Bloomberg data.
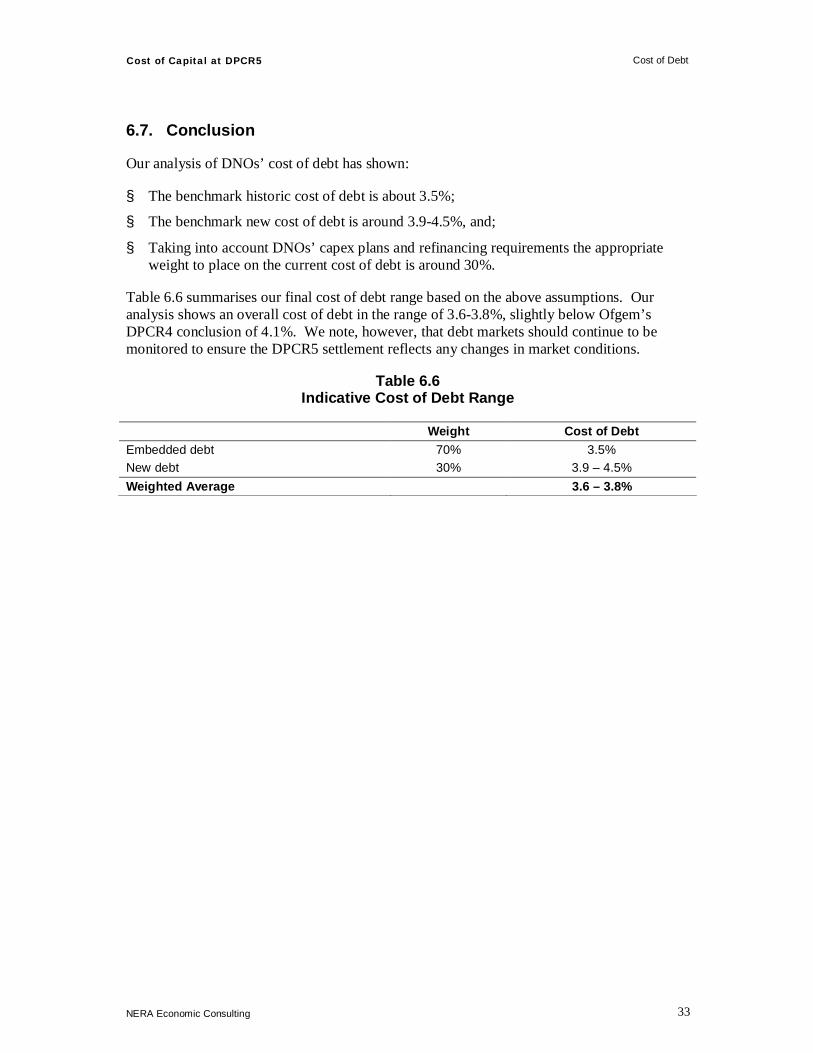
Cost of Capital at DPCR5 Cost of Debt
NERA Economic Consulting
33
6.7. Conclusion
Our analysis of DNOs’ cost of debt has shown:
§ The benchmark historic cost of debt is about 3.5%;
§ The benchmark new cost of debt is around 3.9-4.5%, and;
§ Taking into account DNOs’ capex plans and refinancing requirements the appropriate weight to place on the current cost of debt is around 30%.
Table 6.6 summarises our final cost of debt range based on the above assumptions. Our analysis shows an overall cost of debt in the range of 3.6-3.8%, slightly below Ofgem’s DPCR4 conclusion of 4.1%. We note, however, that debt markets should continue to be monitored to ensure the DPCR5 settlement reflects any changes in market conditions.
Table 6.6 Indicative Cost of Debt Range
Weight Cost of Debt Embedded debt 70% 3.5% New debt 30% 3.9 – 4.5% Weighted Average 3.6 – 3.8%

Cost of Capital at DPCR5 Cost of Capital
NERA Economic Consulting
34
7. Cost of Capital
7.1. “Current” and “Historic” Cost of Capital
Table 7.1 summarises our analysis of the constituent WACC components and shows our estimates of the DNOs cost of capital, based on long-term historic trailing averages and on current market evidence.
Table 7.1 “Historic” and “Current” WACC Estimates
“Historic” “Current” Tax Rate 28% 28% Gearing 60% 60% Cost of Equity (real, post-tax) 7.2 – 8.6% 8.0 – 10.5% Cost of Debt (real, pre-tax) 3.5% 3.9 – 4.5% WACC (vanilla) 5.0 - 5.5% 5.5-6.9% WACC (post-tax) 4.4 – 4.9% 4.9 – 6.1% Source: NERA Analysis.
A key issue for setting the cost of capital at DPCR5 is how much weight to place on current evidence versus historic data. Essentially this issue boils down to two questions:
§ How long will current conditions persist for i.e. how long will the recovery take?
§ What capital market conditions will prevail following the recovery?
We address each of these issues below.
7.2. The Current Macroeconomic Outlook
We have reviewed a range of evidence on the economic outlook, particularly in terms of GDP growth and inflation. Our analysis shows the following:27
§ The central forecasts of independent forecasters like the Bank of England, OECD and IMF indicate that:
– Economic growth is expected to be negative in 2009 and close to zero in 2010;
– Economic growth is not expected to return to pre-crisis rates until 2012 or 2013, halfway through the next price control period;
§ These central projections have been revised down considerably over the past year;
§ The experience of past severe recessions suggests that the current recession could be much longer than forecast;
§ Inflation is expected to be very low if not negative in the short-term, and;
27 A detailed summary of our analysis is included in Appendix A.

Cost of Capital at DPCR5 Cost of Capital
NERA Economic Consulting
35
§ The degree of uncertainty around the forecasts of growth and inflation is much higher than usual meaning that less weight should be attached to central projections than would normally be the case.
In summary, the economic outlook is very uncertain. In particular, there is considerable uncertainty about how deep the recession will be and how long it will last. Current forecasts of GDP growth and inflation are marked by wider confidence intervals than is usual, often placing greater weight on downside risk. Further, the dispersion of different forecasts is greater than usual. We therefore conclude that there is a substantial risk that macroeconomic conditions will not normalise over DPCR5.
The longer the recovery takes the greater the weight that should be placed on current data when determining the DPCR5 cost of capital. If it is anticipated that economic growth will not return to trend rates until 2012-13 – about half-way through DPCR5 - and that the cost of capital does not revert to long-run historical averages until economic growth normalises then around 50% weight should be placed on both current and historic data for DPCR5 WACC-setting purposes. Different recovery scenarios would lead to different weights on current and historic data.
7.3. Capital Market Conditions Post-Recovery
Recent market commentary has focused on what will be the “new normal” i.e. post-recovery macroeconomic and financial market conditions. In particular, commentators have addressed how conditions are likely to differ from pre-crisis conditions. Our survey of recent commentary, outlined below, shows that future conditions are expected to be quite different from past conditions.
Citigroup CEO Vikram Pandit recently discussed the new normal in a speech at the National Summit in June 2009, stating that current capital market conditions, while still strained, were probably closer to the new normal than the conditions that prevailed five years ago:
“I’m not so sure we go back to the world we were in. … I know the slack’s going to get picked up by the capital markets – and there are some encouraging signs of the happening … but we also have to acknowledge that we’re going to have to think restructuring businesses, restructuring industries, to reflect a world where you have cost of capital, where you do have less credit available (and) the cost of credit is higher.”28
Mohamed El-Erian, CEO of PIMCO (which runs the Total Return Fund, the world’s largest bond fund) expressed similar sentiments in PIMCO’s May 2009 Secular Outlook (entitled “A New Normal”):
“Markets will revert to a mean, but it will not look anything like that of recent years. Relative to where it is coming from, the financial system will be de-levered, de-globalized, and re-regulated. Global growth will be lower and
28 “Citi CEO: markets recovering but won’t be the same”, Reuters, 15 June 2009
<http://www.reuters.com/article/rbssFinancialServicesAndRealEstateNews/idUSN1523054620090615>, accessed 18 June 2009
Cost of Capital at DPCR5 Cost of Capital
NERA Economic Consulting
36
unemployment higher, notwithstanding the continued rotation of dynamism away from industrial countries and toward emerging economies. Price formation in many markets will be influenced by the legacy and, in some cases, continuation of direct government involvement. … For a financial industry known for its famously short memory (and related infrastructures and behavior), this will feel like a new normal. Adaptations will be needed as the configuration of risks and returns shift, government debt balloons, and capital structures potentially migrate toward a simplified structure consisting just of equity and senior debt instruments.”29
El-Erian also stated that “the equity risk premium will now reflect a permanently higher threat of subordination” and that “premiums across risk factors and markets will reflect in a seemingly permanent fashion the bout of disruptions to the sanctity of contracts and the capital structure, as well to the autonomy of key economic institutions.”
Commentary in the financial press has mirrored these statements. Among these, we cite two recent articles from the Financial Times:
§ “What can we say about the next expansion? Forecasts are inevitably speculative but some factors seem to be taking shape. … either through regulation or impaired balance sheets, it seems unlikely that leverage will be so high in the next expansion, which suggests an increase in the real cost of capital. This will be further exacerbated by higher risk premiums - the Great Moderation has been rudely interrupted and financial markets will once again be concerned about risk.”30
§ “.. regardless of the pattern of GDP in 2009-10, how can markets realistically price the large uncertainties surrounding the global economy in the medium term? … probabilities are as far as we can go, for we have no reliable templates, and that alone argues for sustainably higher risk premiums. We do know, though, that a higher cost of capital and weaker trend growth, not least because of demographic change, are baked in the cake.”31
We conclude from this commentary that post-recovery equity and credit conditions are not expected to resemble those that prevailed over the mid-2000s. This fundamental shift in investors’ appetite for risk means greater weight should be given to current data when determining the overall DPCR5 cost of capital.
29 Mohamed El-Erian, “Secular Outlook: A New Normal”, May 2009,
<http://www.pimco.com/LeftNav/PIMCO+Spotlight/2009/Secular+Outlook+May+2009+El-Erian.htm>, accessed 18 June 2009
30 Andrew Jones, “Managing fluctuations”, The Financial Times, 22 January 2009 31 George Magnus, “Reasons why bear market rally will stall and reverse”, The Financial Times, 21 May 2009

Cost of Capital at DPCR5 Cost of Capital
NERA Economic Consulting
37
7.4. Conclusion
Our analysis of current and long-run historic data has shown that:
§ The cost of capital of DNOs, based on long-run historic data is in the range of 4.4-4.9% on a real post-tax basis (5.0-5.5% on a real vanilla basis), and;
§ The cost of capital of DNOs in the current market environment is somewhat higher and is in a range of 4.9-6.1% on a real post-tax basis (5.5-6.9% on a real vanilla basis).
To arrive at an overall WACC estimate for DPCR5 an assumption about how much weight to place on “historic” and “current” costs of capital needs to be made. With respect to this assumption we note:
§ The longer the economic recovery takes the greater the weight that should be placed on the current cost of capital;
§ The more uncertainty about the economic outlook - and the time until recovery - there is the greater the weight that should be placed on the current cost of capital, and;
§ The more different post-recovery conditions are anticipated to be from pre-crisis conditions the greater the weight that should be placed on the current cost of capital.
Our analysis of the economic outlook and expectations of post-recovery conditions has shown that:
§ Independent forecasters like the Bank of England, OECD and IMF do not expect economic growth and inflation to return to trend rates until 2012 or 2013, half-way through DPCR5;
§ These forecasts are characterized by much greater uncertainty than would normally be the case meaning that greater weight needs to be given to the possibility that economic conditions will not ‘normalise’ until even later, and;
§ Market commentators do not expect financial conditions to return to pre-crisis conditions, but rather expect that a ‘new normal’ will emerge where the cost of capital is higher.
Based on these factors we conclude that around 50% weight should be placed on the current cost of capital for the purposes of determining the DPCR5 cost of capital. This weighting scheme is primarily predicated on economic growth and inflation ‘normalising’ in 2012 or 2013.
A cautious approach might, however, place even more weight on downside scenarios that point to a return to trend economic conditions later in DPCR5, while the emergence of a ‘new normal’ also points to a greater weighting on the current cost of capital. Reflecting these scenarios Table 7.2 shows our final WACC estimates based on different assumptions on the proportion of DPCR5 affected by the current market conditions. These estimates also take into account the 70/30 existing/new debt weightings discussed in Section 6 since the historic/current WACC weightings only affect the cost of new and refinanced debt.

Cost of Capital at DPCR5 Cost of Capital
NERA Economic Consulting
38
Based on our central conclusion that 50% weighting should be attached to the current cost of capital we conclude that the DPCR5 cost of capital should be 4.6-5.4% on a real post-tax basis (5.2-6.0% real vanilla).32
Table 7.2 DPCR5 Cost of Capital (%)
Weight on “Current” Estimates WACC (post-tax) WACC (vanilla) 50% 4.6 – 5.4 5.2 – 6.0 75% 4.7 – 5.6 5.3 – 6.2
100% 4.8 – 5.8 5.4 – 6.5 Source: NERA Analysis. Note: Current cost of equity is weighted directly by the proportion of DPCR5 assumed to be affected by the current crisis. Current cost of debt is weighted to reflect to reflect forward-looking debt requirement of 30% new debt/ total debt.
32 The 4.6-5.4% range is based on a cost of equity of 7.6-9.5% and a cost of debt of 3.6-3.7%. The cost of equity is
obtained by weighting the historic cost of equity of 7.2-8.6% and the current cost of equity of 8.0-10.5% on a 50/50 basis. The cost of debt is obtained by weighting the historic cost of debt of 3.5% and the current cost of debt of 3.9-4.5% on an 85/15 basis where the 85% weighting reflects 70% of debt that will not be refinanced or newly raised over DPCR5 plus 50% x 30% reflecting the impact of the 50/50 historic/current WACC weights upon the 30% of debt that will be newly raised or refinanced over DPCR5.
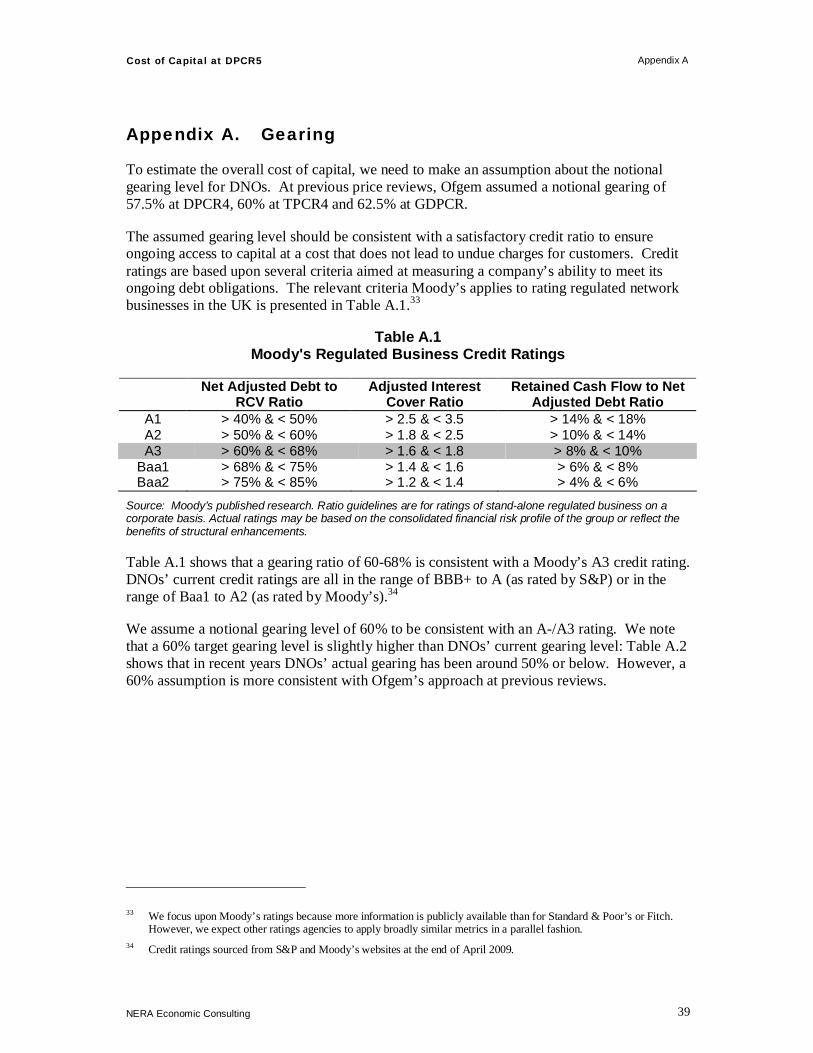
Cost of Capital at DPCR5 Appendix A
NERA Economic Consulting
39
Appendix A. Gearing
To estimate the overall cost of capital, we need to make an assumption about the notional gearing level for DNOs. At previous price reviews, Ofgem assumed a notional gearing of 57.5% at DPCR4, 60% at TPCR4 and 62.5% at GDPCR.
The assumed gearing level should be consistent with a satisfactory credit ratio to ensure ongoing access to capital at a cost that does not lead to undue charges for customers. Credit ratings are based upon several criteria aimed at measuring a company’s ability to meet its ongoing debt obligations. The relevant criteria Moody’s applies to rating regulated network businesses in the UK is presented in Table A.1.33
Table A.1 Moody's Regulated Business Credit Ratings
Net Adjusted Debt to RCV Ratio
Adjusted Interest Cover Ratio
Retained Cash Flow to Net Adjusted Debt Ratio
A1 > 40% & < 50% > 2.5 & < 3.5 > 14% & < 18% A2 > 50% & < 60% > 1.8 & < 2.5 > 10% & < 14% A3 > 60% & < 68% > 1.6 & < 1.8 > 8% & < 10%
Baa1 > 68% & < 75% > 1.4 & < 1.6 > 6% & < 8% Baa2 > 75% & < 85% > 1.2 & < 1.4 > 4% & < 6%
Source: Moody’s published research. Ratio guidelines are for ratings of stand-alone regulated business on a corporate basis. Actual ratings may be based on the consolidated financial risk profile of the group or reflect the benefits of structural enhancements.
Table A.1 shows that a gearing ratio of 60-68% is consistent with a Moody’s A3 credit rating. DNOs’ current credit ratings are all in the range of BBB+ to A (as rated by S&P) or in the range of Baa1 to A2 (as rated by Moody’s).34
We assume a notional gearing level of 60% to be consistent with an A-/A3 rating. We note that a 60% target gearing level is slightly higher than DNOs’ current gearing level: Table A.2 shows that in recent years DNOs’ actual gearing has been around 50% or below. However, a 60% assumption is more consistent with Ofgem’s approach at previous reviews.
33 We focus upon Moody’s ratings because more information is publicly available than for Standard & Poor’s or Fitch.
However, we expect other ratings agencies to apply broadly similar metrics in a parallel fashion. 34 Credit ratings sourced from S&P and Moody’s websites at the end of April 2009.
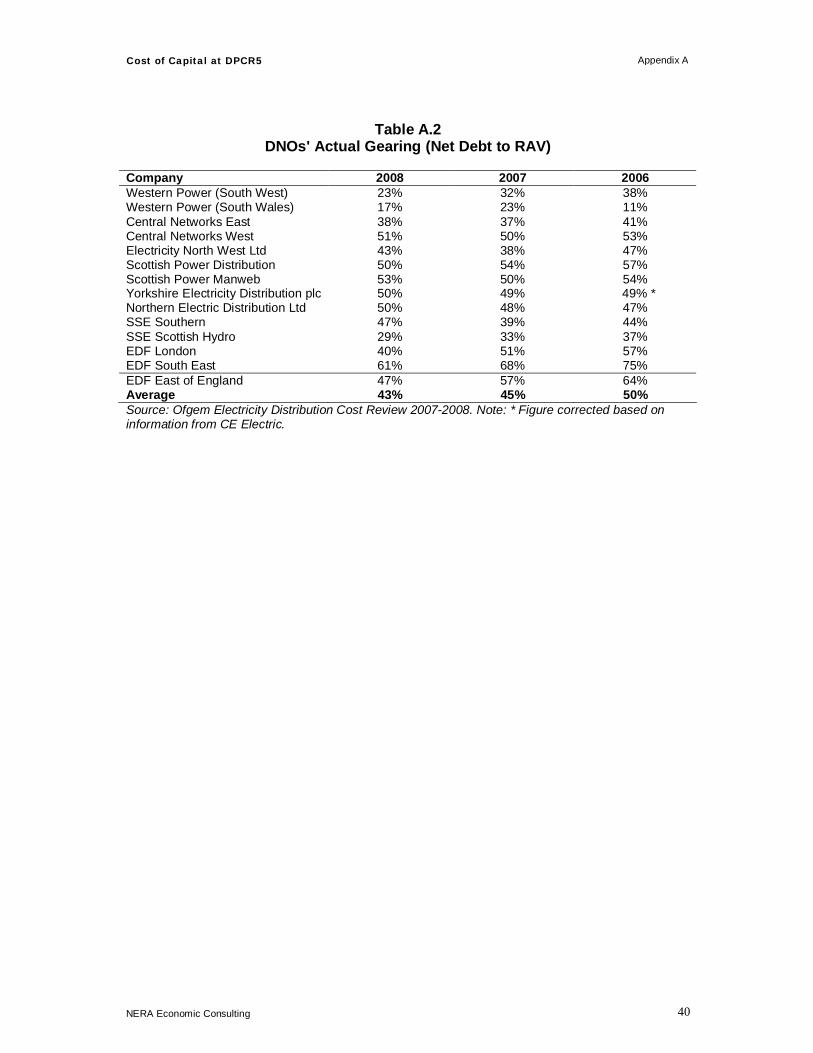
Cost of Capital at DPCR5 Appendix A
NERA Economic Consulting
40
Table A.2 DNOs' Actual Gearing (Net Debt to RAV)
Company 2008 2007 2006 Western Power (South West) 23% 32% 38% Western Power (South Wales) 17% 23% 11% Central Networks East 38% 37% 41% Central Networks West 51% 50% 53% Electricity North West Ltd 43% 38% 47% Scottish Power Distribution 50% 54% 57% Scottish Power Manweb 53% 50% 54% Yorkshire Electricity Distribution plc 50% 49% 49% * Northern Electric Distribution Ltd 50% 48% 47% SSE Southern 47% 39% 44% SSE Scottish Hydro 29% 33% 37% EDF London 40% 51% 57% EDF South East 61% 68% 75% EDF East of England 47% 57% 64% Average 43% 45% 50% Source: Ofgem Electricity Distribution Cost Review 2007-2008. Note: * Figure corrected based on information from CE Electric.
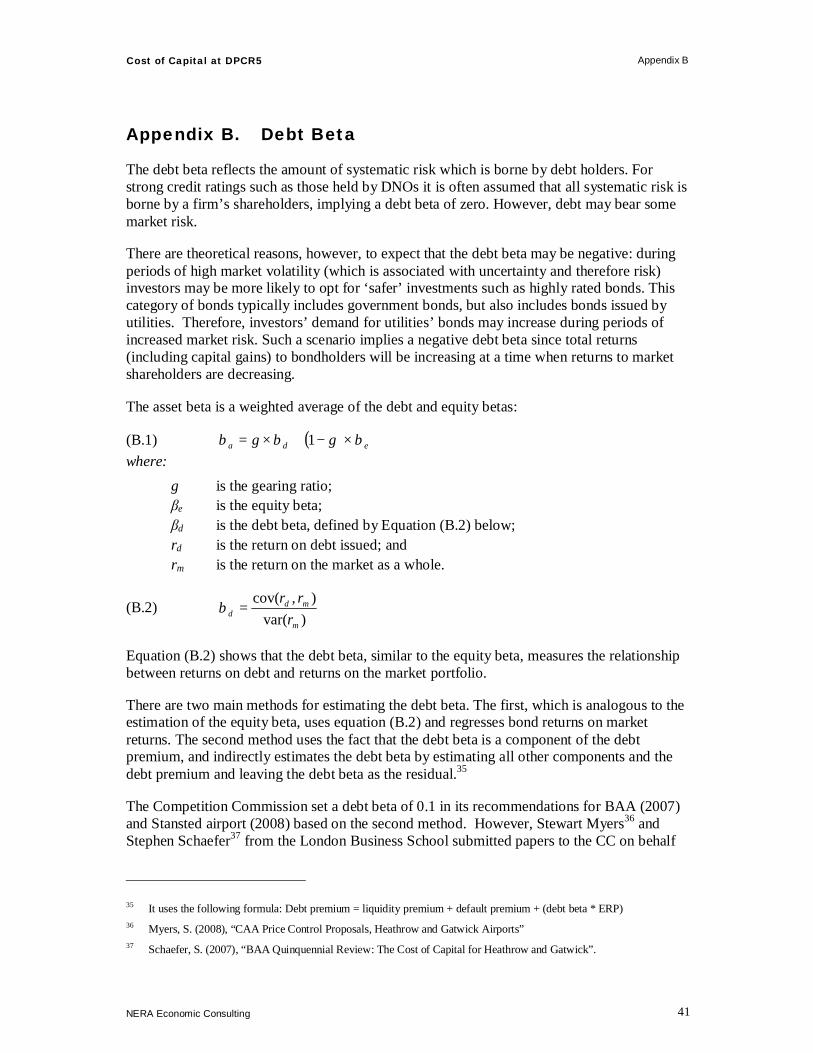
Cost of Capital at DPCR5 Appendix B
NERA Economic Consulting
41
Appendix B. Debt Beta
The debt beta reflects the amount of systematic risk which is borne by debt holders. For strong credit ratings such as those held by DNOs it is often assumed that all systematic risk is borne by a firm’s shareholders, implying a debt beta of zero. However, debt may bear some market risk.
There are theoretical reasons, however, to expect that the debt beta may be negative: during periods of high market volatility (which is associated with uncertainty and therefore risk) investors may be more likely to opt for ‘safer’ investments such as highly rated bonds. This category of bonds typically includes government bonds, but also includes bonds issued by utilities. Therefore, investors’ demand for utilities’ bonds may increase during periods of increased market risk. Such a scenario implies a negative debt beta since total returns (including capital gains) to bondholders will be increasing at a time when returns to market shareholders are decreasing.
The asset beta is a weighted average of the debt and equity betas:
(B.1) ( ) eda gg βββ ×−+×= 1 where:
g is the gearing ratio; βe is the equity beta; βd is the debt beta, defined by Equation (B.2) below; rd is the return on debt issued; and rm is the return on the market as a whole.
(B.2) )var(
),cov(
m
mdd r
rr=β
Equation (B.2) shows that the debt beta, similar to the equity beta, measures the relationship between returns on debt and returns on the market portfolio.
There are two main methods for estimating the debt beta. The first, which is analogous to the estimation of the equity beta, uses equation (B.2) and regresses bond returns on market returns. The second method uses the fact that the debt beta is a component of the debt premium, and indirectly estimates the debt beta by estimating all other components and the debt premium and leaving the debt beta as the residual.35
The Competition Commission set a debt beta of 0.1 in its recommendations for BAA (2007) and Stansted airport (2008) based on the second method. However, Stewart Myers36 and Stephen Schaefer37 from the London Business School submitted papers to the CC on behalf
35 It uses the following formula: Debt premium = liquidity premium + default premium + (debt beta * ERP) 36 Myers, S. (2008), “CAA Price Control Proposals, Heathrow and Gatwick Airports” 37 Schaefer, S. (2007), “BAA Quinquennial Review: The Cost of Capital for Heathrow and Gatwick”.
Cost of Capital at DPCR5 Appendix B
NERA Economic Consulting
42
of BAA in which they investigated debt betas using the first approach and concluded that the debt beta was zero (or very close to).
B.1. NERA Estimates
We estimate the debt beta with a six-month rolling OLS regression of total returns to UK corporate bonds (by credit rating) on total returns to the FTSE All-Share Index. We focus upon all corporate bonds rather than just DNOs’ bonds since this provides more data, thereby increasing the robustness of our estimates and avoiding any biases to our estimates that the illiquid trading of some bonds in the secondary market may cause. The risk of corporates and DNOs of a particular credit rating should be the same, notwithstanding that credit ratings reflect both systematic and company-specific risk factors. In particular, unless the credit ratings of DNOs or corporates are unequally affected by the impact of company-specific factors (e.g. most DNOs’ credit ratings are stronger than their systematic risk would imply because of DNO and company specific factors) then the estimated debt beta from corporates’ bond series will be the same as for DNOs.
Figure B.1 shows six-month rolling debt beta estimates for BBB rated corporates over 1999-2009. We present estimates for a BBB rating only for presentational reasons: estimates at an A rating are very similar. We note that the estimated debt beta is statistically negative or zero over virtually the entire period. Indeed, the estimate is only statistically significantly positive for 4% of the time.
Figure B.1 Debt Beta Estimates: BBB Rated Corporates
-0.25
-0.20
-0.15
-0.10
-0.05
0.00
0.05
0.10
0.15
0.20
0.25
Apr-99 Apr-00 Apr-01 Apr-02 Apr-03 Apr-04 Apr-05 Apr-06 Apr-07 Apr-08 Apr-09 Source: NERA analysis of Bloomberg and IBOXX data until 30th April 2009. Notes: Light lines indicate 95% confidence interval around point estimates.
Based on this evidence we conclude that the debt beta is zero. The asset beta estimates presented in this report proceed on this basis.
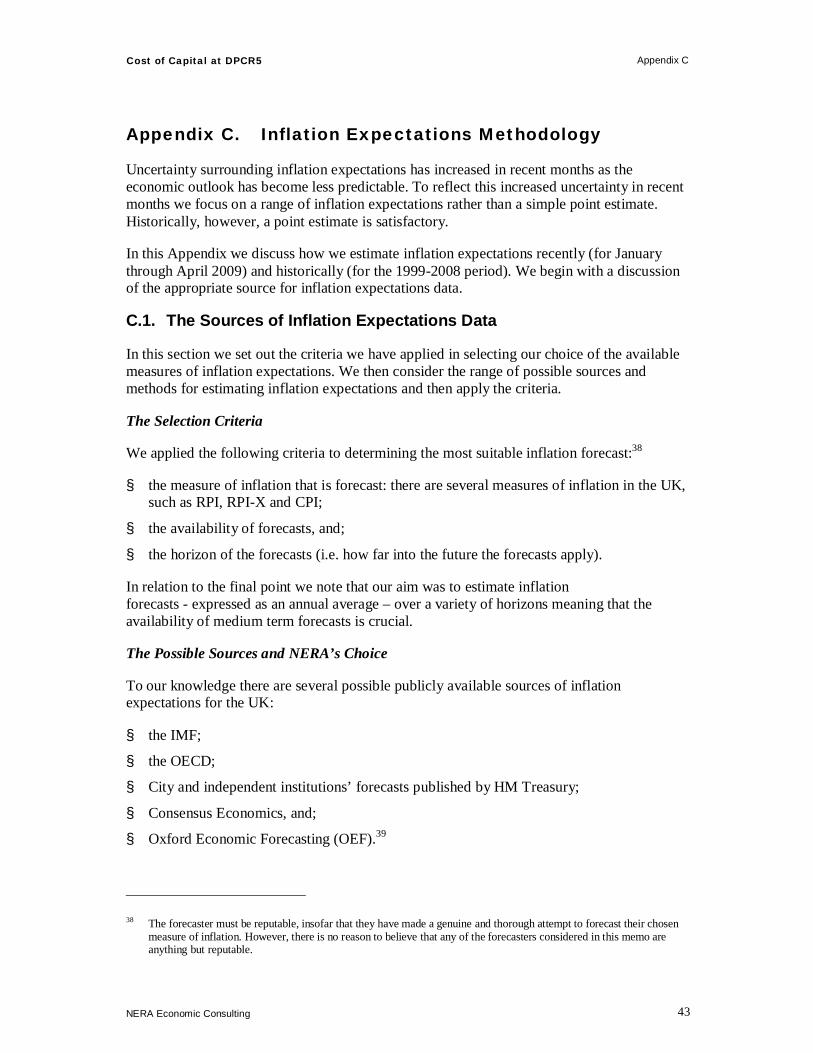
Cost of Capital at DPCR5 Appendix C
NERA Economic Consulting
43
Appendix C. Inflation Expectations Methodology
Uncertainty surrounding inflation expectations has increased in recent months as the economic outlook has become less predictable. To reflect this increased uncertainty in recent months we focus on a range of inflation expectations rather than a simple point estimate. Historically, however, a point estimate is satisfactory.
In this Appendix we discuss how we estimate inflation expectations recently (for January through April 2009) and historically (for the 1999-2008 period). We begin with a discussion of the appropriate source for inflation expectations data.
C.1. The Sources of Inflation Expectations Data
In this section we set out the criteria we have applied in selecting our choice of the available measures of inflation expectations. We then consider the range of possible sources and methods for estimating inflation expectations and then apply the criteria.
The Selection Criteria
We applied the following criteria to determining the most suitable inflation forecast:38
§ the measure of inflation that is forecast: there are several measures of inflation in the UK, such as RPI, RPI-X and CPI;
§ the availability of forecasts, and;
§ the horizon of the forecasts (i.e. how far into the future the forecasts apply).
In relation to the final point we note that our aim was to estimate inflation forecasts - expressed as an annual average – over a variety of horizons meaning that the availability of medium term forecasts is crucial.
The Possible Sources and NERA’s Choice
To our knowledge there are several possible publicly available sources of inflation expectations for the UK:
§ the IMF;
§ the OECD;
§ City and independent institutions’ forecasts published by HM Treasury;
§ Consensus Economics, and;
§ Oxford Economic Forecasting (OEF).39
38 The forecaster must be reputable, insofar that they have made a genuine and thorough attempt to forecast their chosen
measure of inflation. However, there is no reason to believe that any of the forecasters considered in this memo are anything but reputable.

Cost of Capital at DPCR5 Appendix C
NERA Economic Consulting
44
It is also possible to construct inflation expectations by comparing yields on index-linked and nominal gilts of the same maturity. Since index-linked gilts (ILGs) are indexed to the Retail Price Index (RPI), this method provides an estimate of expected RPI inflation. However, well documented distortions in the ILG market mean that the implied inflation expectations are currently biased. A further alternative is evidence from inflation swaps. The RPI swap rate is a direct measure of inflation expectations (leaving the issue of inflation risk premiums to one side) since it is the fixed rate that must be paid to be guaranteed inflation payments in return – since the contract must be NPV neutral when entered, the fixed rate is the expected annually compounded RPI inflation rate. Our assessment is that the RPI swaps market, particularly at the long end, is affected by the same institutional factors as the ILG market: while there are a lot of pension funds willing to pay to receive inflation, there are few parties (likely to be limited to utilities and other regulated entities with RPI-linked income) willing to pay inflation. This leads to RPI swap rates that provide implausible estimates of RPI inflation.
The appropriate measure of inflation for current purposes is RPI. However, the available forecasts are for a range of measures of inflation: the IMF and OECD both only provide forecasts for the Harmonized Index of Consumer Prices (HICP);40 Consensus Economics forecasts CPI; HM Treasury and OEF both forecast CPI, RPI and RPI-X.41 Based on the foregoing we narrowed our choice to between the OEF and HM Treasury RPI forecasts.
Before turning to the details of the forecasts’ availability and horizon recall that our aim is to obtain a measure of medium-term inflation expectations. OEF publishes forecasts of RPI four times a year, on a quarterly basis up to four years ahead. By comparison, HM Treasury publishes forecasts several times a year for the current year and one year ahead. HM Treasury, since August 2008, publishes medium-term RPI inflation forecasts quarterly. Historically, HMT has published medium-term RPI forecasts quarterly between November 1997 and November 2003 (with the exception of November 2001 and May 2003). Forecasts from both sources are available since 1997. As a result, OEF has more historic data available – having forecast RPI continuously - but HMT has the advantage of drawing upon a range of forecasters, rather than a single forecaster. Having balanced the available forecasts we have decided to adopt HMT forecasts as our preferred measure.
C.2. Current Forecasts
Each quarter HM Treasury publishes medium-term RPI inflation expectations of a range of City and independent forecasters.42 We note that HMT provides some summary statistics of the forecasts, but we draw on the individual City and independent forecasts which are also published. Typically, the forecasts are available for around 12 City forecasters and 12 39 The Bank of England also publishes projections for CPI in its quarterly inflation report. However, these projections are
the BoE’s estimates based on market expectations of interest rates. As a result, these projections do not necessarily reflect the BoE’s nor the market’s inflation expectations.
40 The HICP is calculated according to European Union guidelines to ensure its comparability across EU member states and is used primarily for statistical purposes.
41 We note that as of August 2008 HM Treasury no longer publishes quarterly medium-term RPI-X inflation forecasts. These have been replaced with quarterly medium-term RPI forecasts, which in future could provide a viable alternative to the OEF forecasts.
42 See “Forecasts for the UK Economy” available on HMT’s website. Publications are available monthly, but medium-term RPI forecasts are only published each quarter in February, May, August and November.

Cost of Capital at DPCR5 Appendix C
NERA Economic Consulting
45
independent forecasters. Each forecaster usually provides a forecast of annual RPI inflation in each year out to a five-year horizon including the current year.43
Using this data we construct a range of inflation expectations in each quarter by:
1. For each forecaster we construct a series of annual RPI inflation expectations out to the desired horizon (e.g. 20 years) by:
– Taking the first three years of forecasts as given.
– Constructing an estimate of trend inflation based on the average of fourth and fifth year ahead annual RPI forecasts, or, if the fourth year ahead only is available we use that number as our estimate of trend inflation.44
– Applying the trend annual inflation forecast obtained in (b) to each year out to the desired horizon.45
2. We then calculate an annualised average rate expected RPI inflation for each forecaster over the forecast horizon by averaging the series of annual RPI inflation expectations out to the desired horizon (constructed in step 1).
3. We then use the 25th and 75th percentiles of the forecasters’ annual average forecasts (obtained from step 2) to form our range of inflation expectations in any quarter. That is, we effectively drop the lowest 25% and upper 25% of forecasts as outliers.
C.3. Historic Forecasts
For the period 1999-2008 we construct a monthly series of inflation expectations over various horizons as follows:
1) For one and two-year ahead RPI forecasts we rely directly upon HMT’s monthly publication of one and two-year ahead RPI inflation forecasts;
2) For longer-term forecasts we incorporate data from HMT’s publication about medium term inflation expectations. In particular, we estimate the expected fifth-year-ahead inflation rate by:
a) For those monthly publications without a medium-term forecast we set the medium-term forecasts equal to the preceding quarters’ forecasts;
b) For the period February 2004 to May 2008 when medium-term forecasts were not published we derive a medium-term inflation forecast by setting the fifth-year ahead forecast equal to the Bank of England’s CPI target (of 2% p.a.) plus the historic difference between RPI and CPI inflation (which is approximately 0.9%). We note that our medium-term assumption that RPI inflation approaches 2.9% is broadly in
43 For example, in the February 2009 publication forecasters usually provide forecasts of annual RPI inflation in each of
2009, 2010, 2011, 2012 and 2013. However, some forecasters may not provide estimates for all five years. 44 If a fourth or fifth year ahead inflation forecast is not provided then the forecaster is excluded. 45 For example, if a forecaster had provided forecasts of -1,0,1,2,3 for the five years ahead (including the current year),
then the series of annual RPI forecasts out to a ten year horizon would be -1, 0, 2, 2.5, 2.5, 2.5, 2.5, 2.5, 2.5, 2.5.

Cost of Capital at DPCR5 Appendix C
NERA Economic Consulting
46
line with the CC’s methodology in both the Heathrow/Gatwick (2007) and Stansted (2008) reviews.46
3) Forecasts for the interim third and fourth years-ahead are interpolated between the second and fifth year-ahead forecasts;
4) Forecasts for the sixth, seventh, eighth etc years-ahead are set equal to the fifth-year ahead forecast which we regard as a plausible measure of trend expectations given forecasters typically assume no further shocks to the economy beyond the short-term;
5) To estimate average annual inflation expectations over the required horizon we then average the series of one-year-ahead inflation forecasts (e.g. for a five year forecast horizon we average five annual inflation forecasts) generated in steps 1-4 above.
We believe this methodology has the advantage of incorporating both short and long term inflation expectations, rather than simply relying on one or the other. In particular, the method ensures evidence on the expected trend inflation rate (which should be well proxied by the fifth year ahead rate since by four-years ahead the impact of the current business and interest rate cycles should be minimal) and short-term fluctuations in inflation expectations (as the business cycle unfolds) are both incorporated into our inflation forecast with appropriate weights given the horizon of the forecast used.
46 See CC (2007) “BAA Ltd: A report on the Economic Regulation of the London Airports Companies (Heathrow Airport
Ltd and Gatwick Airport Ltd)”, Appendix F, F10, September and CC (2008) “Stansted Airport Ltd: Q5 Price Control Review”, Appendix L, L8, October.

Cost of Capital at DPCR5 Appendix D
NERA Economic Consulting
47
Appendix D. Macroeconomic Outlook
In this appendix, we review forecasts of GDP growth and inflation, as well as statements regarding the uncertainty around these forecasts.
Uncertainty Regarding Economic Growth
Figure D.1 presents a range of GDP growth forecasts over the medium-term which show that economic growth is expected to be negative in 2009 and close to zero in 2010. Further, economic growth is not expected to return to pre-crisis rates until 2012 or 2013. These forecasts suggest Ofgem should not be overly optimistic about an end to the recession prior to, or even early in, DPCR5.
Figure D.1 UK Real GDP Growth Forecasts (2009-2014)
-5
-4
-3
-2
-1
0
1
2
3
4
5
2006 2007 2008 2009 2010 2011 2012 2013 2014
-5
-4
-3
-2
-1
0
1
2
3
4
5
Actual Forecast (Bank of England) Forecast (IMF)Forecast (NIESR) Forecast (OECD) Forecast (HMT Budget)
Source: IMF, OECD, Bank of England, HMT, NIESR
In addition, we note that all of these forecasts have been revised downward successively over the past year. As an illustration of this point Figure D.2 presents Bank of England GDP growth forecasts from recent publications. The key feature of these forecasts to note is that each successive forecast predicts a deeper recession followed by a slower recovery than the preceding forecast.
Cost of Capital at DPCR5 Appendix D
NERA Economic Consulting
48
Figure D.2 Revisions to Bank of England GDP Growth Forecasts
-5%
-4%
-3%
-2%
-1%
0%
1%
2%
3%
4%
Q3 08 Q1 09 Q3 09 Q1 10 Q3 10 Q1 11 Q3 11 Q1 12
May 2009 Feb 2009 Nov 2008 Aug 2008
Source: NERA analysis of Bank of England data.
These forecasts are surrounded by exceptionally high levels of uncertainty, which has been acknowledged by the forecasters themselves as Table D.1 demonstrates.
Table D.1 Recent Statements Regarding Uncertainty about GDP Forecasts
Institution Statement Bank of England (May 2009)
“The outlook for economic growth is unusually uncertain.” “The timing and strength of … recovery is … highly uncertain.”
HM Treasury (April 2009) “All economic forecasts remain subject to exceptional uncertainties …”
OECD (March 2009) “Substantial risks surround these projections.”
IMF (April 2009)
“The current outlook is exceptionally uncertain, with risks still weighing on the downside. A key concern is that policies may be insufficient to arrest the negative feedback between deteriorating financial conditions and weakening economies in the face of limited public support for policy actions.” “The current distribution of forecasts for GDP growth in key economies, as well as for the identified risk factors, shows much higher dispersion relative to recent years, indicating a larger degree of uncertainty associated with the baseline projection than has historically been the case.”
NIESR (April 2009) “Further shocks to the economy are probable but by definition unpredictable.”
Source: Bank of England Inflation Report, May 2009, p. 7; Budget 2009, HM Treasury, April 2009, p. 18; OECD Economic Outlook, Interim Report for the UK, March 2009, p. 88; World Economic Outlook: Crisis and Recovery, IMF, April 2009; p. viii, 57; Kirby, Barrell and Pillonca (2009) “Prospects for the UK Economy”, National Institute Economic Review (2008), p. 59.

Cost of Capital at DPCR5 Appendix D
NERA Economic Consulting
49
A particularly acute statement on the uncertainty around the outlook was given by the Bank of England’s Governor Mervyn King at the press conference for the most recently quarterly Inflation Report (issued in May 2009), when he stated:
“I think the whole point of the Report today is to say that many things could happen and it would be, I think, extremely unwise for anyone to claim that they know what the future is going to hold. After the last 12 months, anyone who says ‘well, we now know exactly what's going to happen’ I would have thought was rather deluded.” 47
“I think the lesson of the last 12 months is surely that very major changes can occur unexpectedly, nobody can anticipate the future with any close proximity to certainty, it is vastly uncertain. The most important thing about policy is that it remains alert and ready to respond to changes that occur.”48
The uncertainty around the outlook suggests a cautious set of economic projections should be adopted that are not overly focused upon central projections, but which also reflect plausible downside risks.
The Duration of the Recession
The central projections suggest recovery from this recession will be much faster than historic experience suggests. To illustrate this point Figure D.3 shows a profile of monthly GDP (rolling quarterly averages) relative to pre-recession peaks. Although not conclusive, a comparison of the path taken so far with that from past severe recessions suggests that recovery may not be imminent. We acknowledge that there are many factors that make the current downturn unique, not least the sheer scale of government fiscal and monetary stimulus. However, it is not yet clear how precisely such factors will distinguish this recovery from ones that have come before.
47 Bank of England Inflation Report Press Conference Transcript, 13 May 2009, p. 2 48 Bank of England Inflation Report Press Conference Transcript, 13 May 2009, p. 25

Cost of Capital at DPCR5 Appendix D
NERA Economic Consulting
50
Figure D.3 Recession Profiles (Months from GDP Peak)
Source: Kirby, Barrell and Pillonca (2009) “Prospects for the UK Economy”, National Institute Economic Review, vol. 208, p45.
Overall, historic experience reinforces our earlier recommendations that Ofgem should not be overly optimistic about an end to the recession prior to, or even early in, DPCR5.
Uncertainty about Inflation
The uncertainty about the macroeconomic outlook is also born out by data on inflation forecasts. Figure D.4 presents estimates of expected inflation derived from HM Treasury’s monthly publications of City and independent forecasts and market-based measures such as RPI swaps and breakeven inflation.49
49 Both RPI swaps and breakeven inflation (which is based on the difference between conventional and index-linked gilt
yields) measures of inflation expectations are distorted by strong pension fund demand for RPI swaps and index-linked gilts. Pension fund regulations and accounting standards underpin a sizeable inelastic demand which has the well-documented effect of driving up prices for RPI swaps and index-linked gilts; all else equal, this biases RPI swaps and breakeven inflation upwards, especially at long maturities. For example, comparing current forecasts at 10- and 20-year maturities gives us an indication of the average annual inflation rates expected from 2019 to 2029: the HMT figure is 2.9%, compared to an RPI-swap based estimate of 3.5% and a breakeven-inflation-based estimate of 4.3%. The estimates from RPI-swap and breakeven-inflation appear implausibly high and represent an increase from the average inflation rates expected over the preceding 10-year period.
months
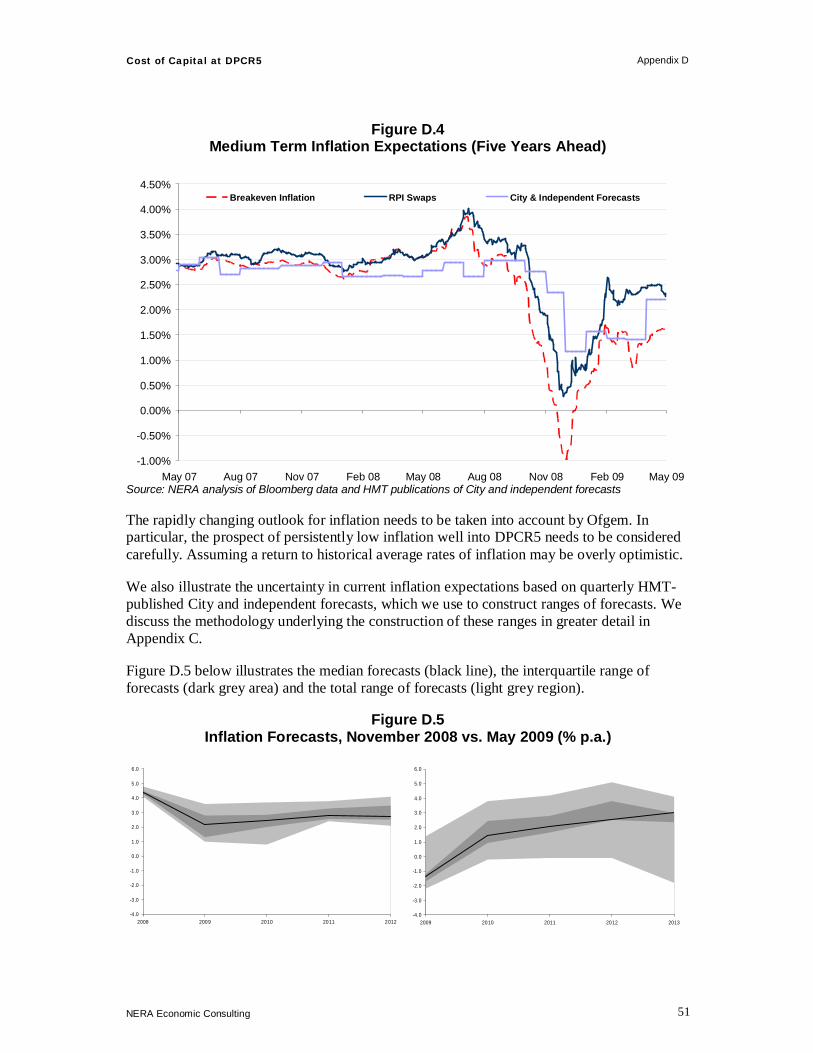
Cost of Capital at DPCR5 Appendix D
NERA Economic Consulting
51
Figure D.4 Medium Term Inflation Expectations (Five Years Ahead)
-1.00%
-0.50%
0.00%
0.50%
1.00%
1.50%
2.00%
2.50%
3.00%
3.50%
4.00%
4.50%
May 07 Aug 07 Nov 07 Feb 08 May 08 Aug 08 Nov 08 Feb 09 May 09
Breakeven Inflation RPI Swaps City & Independent Forecasts
Source: NERA analysis of Bloomberg data and HMT publications of City and independent forecasts
The rapidly changing outlook for inflation needs to be taken into account by Ofgem. In particular, the prospect of persistently low inflation well into DPCR5 needs to be considered carefully. Assuming a return to historical average rates of inflation may be overly optimistic.
We also illustrate the uncertainty in current inflation expectations based on quarterly HMT-published City and independent forecasts, which we use to construct ranges of forecasts. We discuss the methodology underlying the construction of these ranges in greater detail in Appendix C.
Figure D.5 below illustrates the median forecasts (black line), the interquartile range of forecasts (dark grey area) and the total range of forecasts (light grey region).
Figure D.5 Inflation Forecasts, November 2008 vs. May 2009 (% p.a.)
-4 .0
-3 .0
-2 .0
-1 .0
0.0
1.0
2.0
3.0
4.0
5.0
6.0
2008 2009 2010 2011 2012 -4.0
-3.0
-2.0
-1.0
0.0
1.0
2.0
3.0
4.0
5.0
6.0
2009 2010 2011 2012 2013

Cost of Capital at DPCR5 Appendix D
NERA Economic Consulting
52
Source: Independent forecasts published in HM Treasury’s “Forecasts for the UK Economy”, November 2008 and May 2009 Note: Light grey areas denote total range across forecasts. Dark grey areas denote the interquartile range across forecasts. The central line indicates the median forecast.
This figure illustrates a sharp downward shift in short-term inflation levels, with a median forecast for 2009 inflation shifting from 2.2% in November to -1.4% in May. Additionally, the figure shows heightened uncertainty about medium-term inflation. Forecasts for inflation in 2012 ranged from 2.1% to 4.1% in November, but from -0.1% to 5.1% in May.
The considerable fluctuations in all of these measures of expected inflation and the recent increased divergence between them suggest the outlook for inflation has been much less certain than usual in recent months. In addition, Table D.2 presents recent statements by the Bank of England and from HM Treasury that emphasise the uncertainty of the outlook for inflation.
Table D.2 Recent Statements Regarding Uncertainty about Inflation Forecasts
Institution Statement Bank of England (May 2009)
“The outlook for inflation remains extremely uncertain …”
HM Treasury (April 2009)
"There is also considerable uncertainty over the effectiveness of macroeconomic support … It is possible that inflation could react sooner or by more than assumed …" “… the inflation forecast is subject to significant uncertainty”
Source: Bank of England Inflation Report, May 2009, p. 8; Budget 2009, HM Treasury, April 2009, p. 18 and p. 201.
The uncertainty around the outlook suggests a cautious approach to inflation expectations should be adopted which reflects careful consideration of the plausible downside risks.
Conclusion
We examine forecasts for the UK economy over DPCR5 in terms of GDP growth and inflation, finding that:
§ Central projections by independent forecasters like the Bank of England, OECD and IMF show economic growth is expected to be negative in 2009 and close to zero in 2010. Further, economic growth is not expected to return to pre-crisis rates until 2012 or 2013, halfway through DPCR5.
§ These central projections have been revised down considerably over the past year.
§ Past recessions suggest that the current recession could be much longer than forecast;
§ Inflation is expected to be very low if not negative in the short-term;
§ Inflation expectations are highly volatile, and have grown wider in recent months.
In summary, the economic outlook is very uncertain. In particular, there is considerable uncertainty about how deep the recession will be and how long it will last. Current forecasts of GDP growth and inflation are marked by wider confidence intervals than is usual, often

Cost of Capital at DPCR5 Appendix D
NERA Economic Consulting
53
placing greater weight on downside risk. Further, the dispersion of different forecasts is greater than usual.
We therefore conclude that there is a substantial risk that macroeconomic conditions will not normalise over DPCR5. We recommend that Ofgem take into account current evidence when setting the cost of capital for the DNOs, reflecting its judgment on the timing of the recovery and the nature of post-recovery macroeconomic conditions.

Cost of Capital at DPCR5 Appendix E
NERA Economic Consulting
54
Appendix E. The Relationship Between Macroeconomic Factors and Financial Market Volatility
Given the weakness of current macroeconomic conditions and uncertainty about the timing and pace of the recovery, we might expect financial market volatility to increase. A recent working paper from the Bank of International Settlements observes that financial volatility is associated with weak economic conditions through its relationships with GDP volatility, uncertainty over economic conditions and risk aversion (all of which increase during downturns).50
We find support for the countercyclical nature of financial market volatility in the research of numerous academics, both in the US context, inter alia Hamilton and Lin (1996)51 and Campbell et al (2001)52, and in the UK context by Andreou et al (2000).53
Furthermore, there has also been a substantial body of research examining the relationship between the business cycle and the ERP. We summarise briefly the findings of some recent research with this focus:
§ Lettau, Ludvigson and Wachter (2007) found that declining macroeconomic volatility explains a large portion of the fall in US ERP in the 1990s.54
§ Kizys and Spencer (2008) examined long-term evidence from the UK using a GARCH model and find that macroeconomic volatility (primarily in output growth, but also in inflation) is associated with a higher ERP.55
§ Graham and Harvey (2008) analysed CFO survey data and find a positive relationship between risk premia and market volatility.56
As the evidence we have presented on the current weakness of the economy and on the uncertainty about the recovery (see Appendix D) shows, growth is not expected to return to positive levels until 2010 or later and the economy may continue to be anaemic beyond then. We interpret this evidence as suggestive of a higher ERP through the downturn and early stages of the recovery.
50 Bank of International Settlements (2006) “The recent behaviour of financial market volatility”, BIS Paper No. 29, p. 51 Hamilton, J D and G Lin (1996): “Stock market volatility and the business cycle”, Journal of Applied Econometrics, vol
11, pp 573-93. 52 Campbell, J Y, M Lettau, B G Malkiel and Y Xu (2001): “Have individual stocks become more volatile? An empirical
exploration of idiosyncratic risk”, Journal of Finance, 56 (1), pp 1-43. 53 Andreou E, D R Osborn and M Sensier (2000): “A comparison of the statistical properties of financial variables in the
USA, UK and Germany over the business cycle”, The Manchester School, 68 (4), pp 396-418. 54 Lettau, M., Ludvigson S. C., and J. A. Wachter (2007). “The Declining Equity Premium: What Role Does
Macroeconomic Risk Play?” Review of Financial Studies 21(4), pp. 1653-87 55 Kizys, R. and Spencer, P. (2008) “Assessing the Relation between Equity Risk Premium and Macroeconomic
Volatilities in the UK”, Quantitative and Qualitative Analysis in the Social Sciences 2(1), pp. 50-77 56 Graham, J. and Harvey, C.R. (2008) “The Equity Risk Premium in 2008: Evidence from the Global CFO Outlook
Survey”, SSRN Working Paper

Cost of Capital at DPCR5 Appendix E
NERA Economic Consulting
55

NERA Economic Consulting 15 Stratford Place London W1C 1BE United Kingdom Tel: +44 20 7659 8500 Fax: +44 20 7659 8501 www.nera.com
NERA UK Limited, registered in England and Wales, No 3974527 Registered Office: 15 Stratford Place, London W1C 1BE