distribution management : the third “p” (place)campus360.iift.ac.in/secured/resource/157/i/mkt...
TRANSCRIPT
D R . M R I D U L A S . M I S H R A
Distribution Management : The third “P” (Place)

Why Marketing Channels?

Manufacturers
Intermediaries
Retail Formats
I T I S T H E S E T O F I N T E R D E P E N D E N T O R G A N I Z A T I O N S I N V O L V E D I N T H E
P R O C E S S O F M A K I N G A P R O D U C T O R S E R V I C E A V A I L A B L E F O R U S E O R
C O N S U M P T I O N .
What is Marketing Channel?

Marketing Channels –
Bringing Buyers and Sellers Together

1-800-flowers.com
One Marketing Channel for Flower Buyers

Bring the
right products
to the right consumers
At the right price
To the right place

Traditional Representation of Marketing Channel
Manufactures
Wholesalers
Retailers
Consumers
Commercial Structure
Consumption Structure

Range of Channels in Packaged-food Distribution
Farm growers
Chemicals packaging materials
Commodity and
ingredient processors
Food & packaged
goods processor
Grocery Wholesalers
Food Service
Distributors
Food Stores
Eat food at home
Restaurants
Eat or take out
Institutions
Food Growers Processors
Wholesalers /Distributors Retailers and Consumer

Producer Wholesaler Retailer consumerDemand Demand Demand
Producer Wholesaler Retailer consumer
Demand Demand Demand
Promotion Promotion Promotion
Promotion
PUSH
PULL

Functions Performed by Intermediaries
Transactional functions
Logistical functions
Facilitating functions

Marketing Channel Activities
Physical Possession
Ownership
Promotion
Negotiation
Financing/Risking
Ordering
Payment

M
PhysicalPossession
Flow
R
TP
W
C
M
R
AdA
W
C
M
R
W
C
M
R
W
C
M
R
W
C
M
R
FI
W
C
M
R
TP
W
C
M
R
W
C
OwnershipFlow
PromotionFlow
NegotiationFlow
FinancingFlow
RiskingFlow
OrderingFlow
PaymentFlow
FI

Five Marketing Functions in an Automobile ChannelPhysical Function
Suppliers CustomerTransporters
WarehousesManufacturer
Transporters
WarehousesDealers Transporters
Title Function
CustomerSuppliers Manufacturer Dealers
CustomerSuppliers
Payment Function
Banks Manufacturer Banks Dealers Banks
Information Function
CustomerSuppliersTransporters
Warehouses
Banks
Manufacturer
Transporters
Warehouses
Banks
DealersTransporters
Banks
Promotion Function
CustomerAdvertising
AgencySuppliers Manufacturer
Advertising
AgencyDealers
Segmenting for Marketing Channel Design
End user Channel preferences
Service Outputs
Segmenting the Market by Service Output Demands
Meeting Service Output Demands
The role of service output demand analysis in Marketing Channel Design
Using the Service output Demand Template

Customer Analysis
Customer Group
Technology
Customer Need
Institutions
Restaurants
Households
Gas Electricity Charcoal
Baking
Boiling
ReheatingThree dimensional market definition of cooking appliances

Consumers Buying Cycle
ZMOT
FMOT

Three Predictions
ZMOT: The battle will shift to “Between Stimulus & Store”
MOBILE: Will be the key user interface
SHOPPER MARKETING: Will go digital

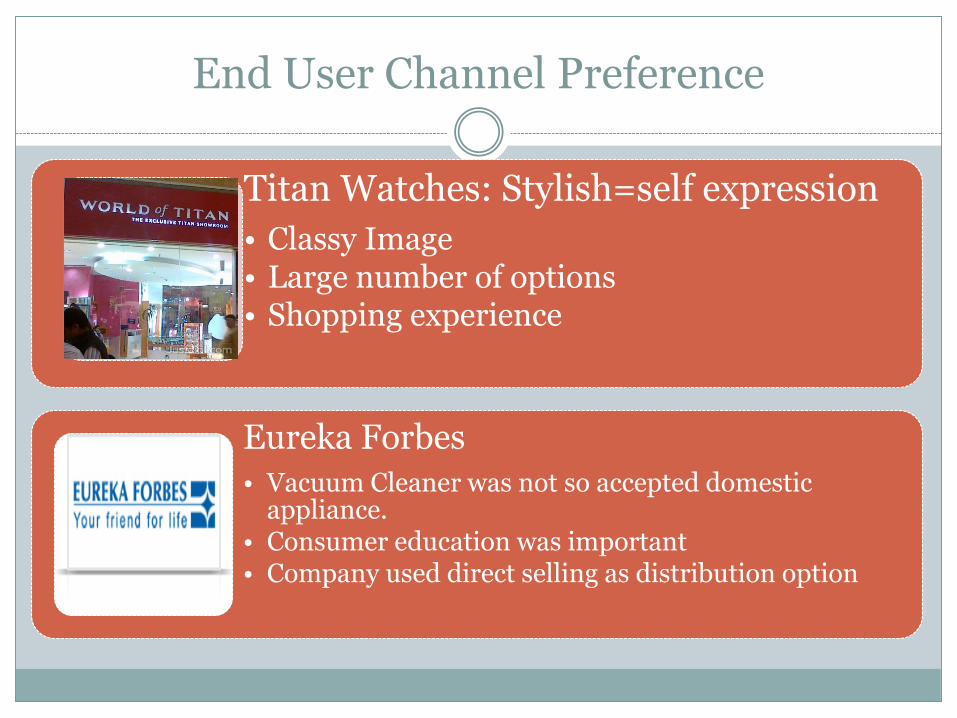
End User Channel Preference
Titan Watches: Stylish=self expression
• Classy Image• Large number of options• Shopping experience
Eureka Forbes
• Vacuum Cleaner was not so accepted domestic appliance.
• Consumer education was important• Company used direct selling as distribution option


Bucklin Framework
This framework proposes that the channel should be designed in such a way that it reduces end users :
1. Search
2. Waiting time
3. Storage
4. Cost
The model works on the assumption that price and physical attributes of directly competing products are same.

Bucklin’s four Generic Service Outputs
Bulk Breaking
Spatial Convenience
Waiting or delivery time
Product Variety
Customer Service
Information provision

CHANNEL SEGMENTS FOR A NEW HIGH-TECHNOLOGY PRODUCT
= Additional Important Attributes
= Greatest Discriminating Attributes
Respondents allocated 100 points among the following supplier-provided service outputs according to their importance to their company:
Possible Service
Output Priorities
Lowest Total Cost/
Pre-Sales Info
Segment
Responsive Support/
Post-Sales Segment
Full-Service Relationship
Segment
References and
Credentials Segment
References and Credentials 5 4 6 25
Financial Stability and Longevity 4 4 5 16
Product Demonstrations & Trials 11 10 8 20
Proactive Advice & Consulting 10 9 8 10
Responsive Assistance During
Decision Process14 9 10 6
One-Stop Solution 4 1 18 3
Lowest Price 32 8 8 6
Installation and Training Support 10 15 12 10
Responsive Problem Solving
After Sale
8 29 10 3
Ongoing Relationship with a
Supplier
1 11 15 1
Total 100 100 100 100
% Respondents 16% 13% 61% 10%

Insights
Marketing Channels serving any of the specific segments will be required to deliver more of some service outputs than others.
Any one channel solutions likely will not be able to satisfy the needs of all the segments.
Lowest price is highly valued only in one segment (the lowest cost segment, representing only 16% of respondents), suggesting that the majority of the market is not driven primarily by price considerations.
All segments value installation and training support at least moderately highly, therefore it must be part of the design for all segments.
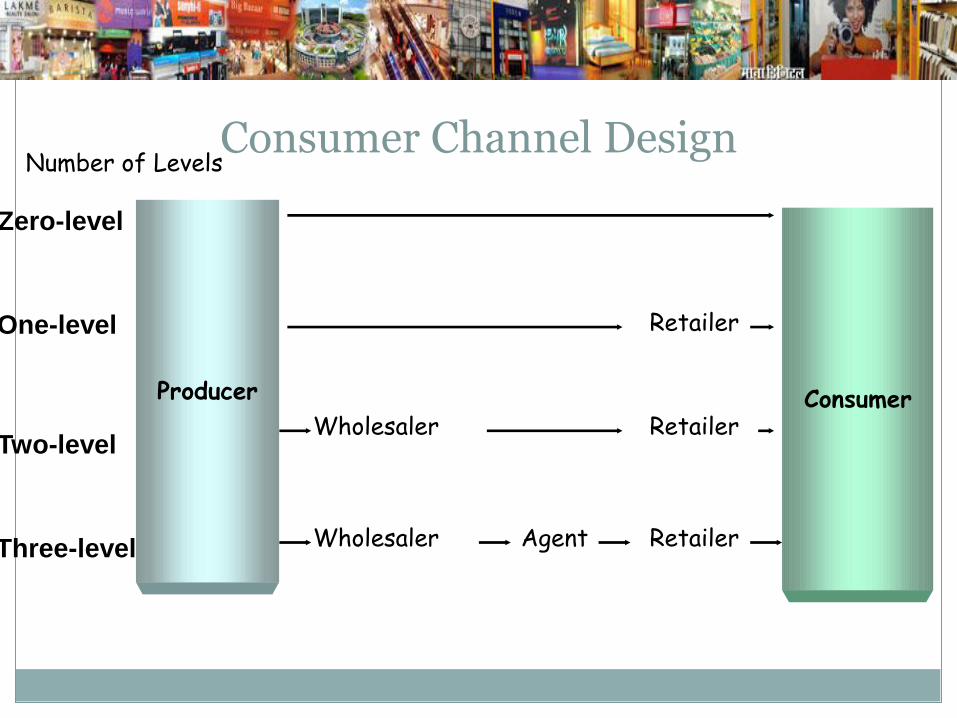
Consumer Channel Design
Producer
Zero-level
Consumer
Number of Levels
One-level Retailer
WholesalerTwo-level
Retailer
Three-level RetailerWholesaler Agent

Industrial Channel Design
Manufacturer
Zero-level
IndustrialUser
Number of Levels
One-levelIndustrial
Distributor
Two-levelManufacturer’s Representative
Industrial
Distributor
Three-levelManufacturer’s Salesforce
Installer
Industrial
Distributor

Common marketing channels for consumer goods and services

Common marketing channels for business goods and services

Representative electronic marketing channels

Representative electronic marketing channels

IDEAL CHANNEL SYSTEM FOR BUSINESS-TO-BUSINESS SEGMENTS BUYING A NEW HIGH-TECHNOLOGY PRODUCT
Manufacturer(New High Technology Product)
Full-ServiceResponsiveSupport
References/Credentials
LowestTotalCost
Pre-Sales
Sales
Post-Sales
VARs
Associations,Events,AwarenessEfforts
Third-Party Supply
Out-source
DealersTeleSales/TeleMktg
Internal Support
- Install, Training & Service Group
Segment

The Role of Service Output Demand Analysis in Marketing
Channel Design
Assess segment attractiveness
Target a subset of the segments identified
Customize the marketing channel
system solution to sell to each target market

King Koil Spring Mattress: Entry to India 2007
Traditionally in India mattress is sold through dealers (retailers).
Market size was estimated as Rs.27.50 billion
73% was organized sector-Kurlon being the market leader
Spring mattress was limited to unorganized sector, and were mostly custom made by high income group.
This segment the company felt would require to see the product features and to feel the benefit.
Service output Demand of the distribution channel
Provide first hand experience of the product quality and explain the product features to the potential
customer They set up eight showrooms in Mumbai, Bangalore, Pune, Nasik, and Delhi and reached breakeven volumes in first two months

Exclusive Distribution
Manufacturer
Wholesaler
Only wholesaler in market area with manufacturer’s goods and services

Selective Distribution
Manufacturer
Wholesaler
Moderate number of wholesalers used in each market area
Wholesaler

Wholesaler
Intensive Distribution
Manufacturer
Wholesaler
Goods and Services offered to all channel members meeting the credit standards
Wholesaler Wholesaler

Type of Distribution?
HUL?
Proctor and Gamble?
Avon?
Tupperware?
Dell?
Harley Davidson?
BMW?
Maruti?
Hyundai?

Sales and Distribution Organizational Structure
S&D Structure
Client
Company Code
Sales Area
Sales Organization
Distribution Channel
Division
Plant
Shipping Point
Loading Point
Internal Sales Structure
Sales Offices
Sales Groups
Salesperson

Structure for Sales Order Processing
Client 410
Company CodeC100
Plant P100 Plant P101
Sales Area
Sales OrgS100
DistributionChannel (RE)
Division(01)

Internal Sales Structure
US Sales OfficeS100
Western SalesOffice
Northwest SalesGroup
Southwest SalesGroup
Salesperson 1
Eastern SalesOffice
Northwest SalesGroup
Southwest SalesGroup
Salesperson 2
Salesperson 3
Salesperson 4
Salesperson 5
Salesperson 6 Salesperson 7
Salesperson 8
Salesperson 9

The Sales Process
Sales OrderEntry
Post GoodsIssue
Invoice Customer
PickMaterials
Receipt ofCustomer Payment
Pack Materials
CheckAvailability
Pre-salesActivities

Return Channel

Cost and Scope of Product Returns
The value of returned goods is close to Rs.60-100 million annually in the country.
Indian companies are estimated to spend from Rs.35 million to more than Rs.40 million per year on reverse logistics.
The average company takes 30-70 days to move a returned product back into the market.
The estimated number of packages returned in 2004 is 500 million.

What happens to the Returned products
Returned goods are send to central processing facility to be repackaged and sold as new products
Remanufacturing or refurbishing them before selling
Selling to a broker
Selling at factory outlet
Dumping them as garbage
Donating them to charity

POSSIBLE PATHWAYS FOR RETURNED PRODUCT
Manufacturer
Retailer
Consumer
Charity
Third-Party Returns/
Reverse Logistics Firm
Manufacturer-run
Return/Sorting
Facility
Repair/
Refurbishment
Facility
Secondary Market,
Broker, Jobber
Poor quality product, ships as spare parts to manufacturer
Return for sale
Inspect, gradeRetu
rn fo
r cre
dit
Retu
rn fo
r refu
nd
Repairable product
Repairable product
High-quality product
Inspect, grade
Inspect, grade
Key: solid lines denote product to be salvaged for subsequent revenue. Dotted lines denote non-revenue-producing product flows.