distribution line protection practices line...transformer protection – when asked to report on the...
TRANSCRIPT

Page 1
DISTRIBUTION LINE PROTECTION PRACTICES
INDUSTRY SURVEY RESULTS
IEEE POWER SYSTEM RELAYING COMMITTEE REPORT December, 2002
Working Group on Distribution Protection: P.T. Carroll, Chairman, C. Fink, Vice Chairman
Contributing Members: J. Appleyard, J. R. Boyle, B. Jackson, J. Johnson, L. Kojovic, E.
Krizauskas, L. P. Lawhead, P. J. Lerley, D. Miller, A. Napikoski, R.D. Pettigrew, W. M. Strang,
C. R. Sufana, R.P. Taylor, J. T. Tengdin, J. T. Uchiyama, R. M. Westfall, J. B. Williams,
P. Winston, J. A. Zipp
Key Words – Distribution Protection, Protective Relaying, Reclosers, Reclosing, Phase
Protection, Ground Protection, High Impedance Ground Fault, Survey, Utility Practices
Abstract – This report presents the results of an extensive survey of utility practices for the
protection of distribution lines at the substation. The survey was issued in 2000 and responses
were received through 2001. Results of similar surveys were published in 1983 (Ref. 1), 1988
(Ref. 2), and in 1995 (Ref.3). In this survey, most of the sections were comparable to the earlier
surveys. In addition, these sections were expanded to collect more data on the reasons behind a
practice and on the methods used. Two new sections were added to address the impact of
organizational considerations on distribution protection, and to summarize emerging
technologies and applications relevant to distribution protection. The responses to this survey
have been compared to the previous surveys in an attempt to detect any trends in the protection
of distribution circuits.
Introduction – The IEEE Power Systems Relaying Committee (PSRC) has the responsibility of
reviewing and reporting on current practices in protective relaying. In the distribution area, the
“Effectiveness of Distribution Protection” Working Group of the Line Protection Subcommittee
has the on-going role to survey the utility industry at periodic intervals. The data collected
through this survey, when compared to the previous surveys, indicates that there are some trends
emerging. The advantages of these changing practices are discussed within this report. Further
surveys will be conducted to determine the extent of these and future trends.
About the Questionnaire – The questionnaire used for this survey was based on the previous
questionnaire with two expansions:
1. added a section to determine the impact of organizational /industry considerations on
distribution protection in the last five years, and,
2. added a section to summarize emerging technologies and applications relevant to distribution
protection
Where appropriate, the data was collected by major voltage class: 5kV, 15kV, 25kV and 35kV.
SECTION 1 – GENERAL

Page 2
The questionnaire was sent to individuals involved in distribution system protection for investor-
owned, cooperative, and municipal utilities and their consultants in the United States and
Canada. Responses were received from 49 organizations.
The respondents were asked to limit their replies to actual present practices. Past practices and
policies for older portions of the system are not of interest because they would not be applied if
that portion were to be installed today. The respondents were requested not to guess at any of the
answers.
If the desired information was not readily available or could not be provided in the form
requested by the survey, respondents were asked not to answer the question.
The respondents were asked to provide a significant amount of description with their answers. It
was feared that this would have a negative impact on the completeness of the returns. This
additional information was used in the analysis of the data and preparation of the presented
results.
Survey Results – The results of the survey are given for each section. The actual survey
questions are not included in this report, as the questionnaire was 19 pages long. In tabulating
the results, the number of “yes” responses and “no” responses are given where appropriate, and
may not total 49 or 100%. Not all respondents answered every question and some questions had
more than one applicable answer.
This section of the survey requested general information about the utility. The respondent was
also asked if the utility name could be used in conjunction with any of the results or specific
questions. In most cases, the answer was “yes.” The predominant distribution voltage class
where the practices identified in this survey are applied is 15kV, but most results are also
relevant to 5kV, 25kV, and 35kV.
System Load – Each utility was asked to state their total distribution load and distribution station
supply transformer size by voltage class, to assure that data was coming from a broad base. 35
utilities reported distribution load ranging from a few MVA to over 20,000 MVA.
TOTAL DISTRIBUTION LOAD UTILITIES
5,000 MVA and above 9
1,000 MVA to 4,999 MVA 14
999 MVA and below 12
No Size Given 14

Page 3
Voltage Class – Most utilities had more than one distribution class, with 15kV still being the
most common when compared to previous surveys. From the reporting the distribution load at
each voltage is:
VOLTAGE CLASS LOAD, MVA % of
TOTAL
NO. of
UTILITIES
5 kV 5,057 4 20
15 kV 77,601 59 32
25 kV 24,750 19 15
35 kV 21,711 17 11
Other 2,205 2 2
TOTAL 131,324 100
Transformer Size – The following table gives a breakdown by the number of utilities of the
typical total transformer capacity and largest total transformer capacity at any one distribution
substation on their system:
TRANSFORMER SIZE TYPICAL LARGEST
10 MVA or below 4 3
10 - 20 MVA 14 3
20 - 50 MVA 16 17
50 – 100 MVA 10 13
> 100 MVA 0 8
Protective Relays Installed – The following table summarizes the responses to a question on
where distribution protective relays are installed:
LOCATION NUMBER of
UTILITIES
Breaker/Recloser location 27
Control House 18
Temperature Controlled 13
Some of each moving to Controlled 11
Some of each, no changes 8
Other 4

Page 4
SECTION 2 – CONSIDERATIONS
This section was added to the survey in order to identify any issues pertaining to personnel and
technological issues in light of the fact that many utilities experienced organizational changes
while new technologies were being introduced in the 1990’s.
When asked to identify who within their organization was responsible for the application and
setting of distribution relays and reclosers the following responses were received:
Distribution Protection Specialists 16%
Distribution Planners 5%
Substation Protection Specialists 32%
Area Engineers/Technicians 12%
Transmission, substation, distribution settings personnel 30%
Other 4%
When asked who within their organization was responsible for the coordination of substation
devices with feeder devices and feeder tap protection the following responses were received:
Same response as above 37%
Distribution Protection Specialists 18%
Distribution Planners 4%
Substation Protection Specialists 14%
Area Engineers/Technicians 11%
Transmission, substation, distribution settings personnel 11%
Other 4%
When asked if recent organizational or technology changes caused a change in the
responsibilities for application and setting of distribution protection within their organization,
33% responded that changes had been made. 41% of the respondents stated that they apply
predominantly standard settings to similar devices (main breakers, feeder breakers, reclosers) in
the field, while 59% applied predominantly customized settings. 36% of the respondents stated
that they had changed setting practices due to organizational or technology changes in the recent
past.
When asked how frequently distribution protection settings are reviewed the following responses
were received:
When changes are known to have occurred 75%
When problems occur 57%
Annually 7%
Periodically (2-10 years) 30%
No policy 11%
SECTION 3 – SYSTEM DATA

Page 5
Substation Transformer Connection – When asked about the predominant distribution
transformer connection applied to their system, the vast majority of utilities reported that Delta –
Wye grounded transformers were utilized. Smaller numbers of Delta – Wye with resistor or
reactor grounding, Wye grounded – Wye grounded, and 3 winding with tertiaries are used.
Transformer High Side Design – A number of questions were asked that related substation
transformer size to protection practices. While 8 of the respondents replied that they had no
change in practices based on transformer size, 35 replied that they did change practices, most in
the 10 – 20 MVA transformer size range. For smaller transformers the vast majority apply fuses
as the high side interrupting device. For larger transformers high side circuit switchers and
breakers tend to be applied most often. When asked if practices varied based on transformer high
side voltage, 29 utilities replied that they did not change practices while 15 replied that they did.
For lower voltage applications most apply high side fuses, with some applying high side circuit
switchers or breakers. For higher voltage applications high side circuit switchers and breakers are
applied the most.
Transformer Low Side Design – When asked to report on transformer low side design practices,
the following responses were received (number of utilities):
DESIGN USED MOST
COMMON
No interrupting device between transformer and feeders 25 17
Main Breaker 27 20
Parallel with other transformer through closed tie
breaker
12 1
Parallel with other transformer through closed switch 5 0
Parallel with other transformer through open tie breaker 20 11
Parallel with other transformer through open switch 11 5
Breaker and a half or ring bus 6 2
Other 4 2
Feeder Breakers – When asked to report on the types of feeder breakers used, the following
responses were received (number of utilities):
Metalclad Switchgear 30
Outdoor Breakers 34
Electronic Reclosers 27
Hydraulic Reclosers 17
Line Devices – When asked what types of line devices were applied in significant numbers on
their distribution feeders, the following responses were received (number of utilities):

Page 6
Main feeder circuit reclosers 39
Branch circuit reclosers 30
Main feeder circuit sectionalizers 7
Branch circuit sectionalizers 9
Branch circuit fuses 37
Unfused single phase taps 7
Other 1
Transformer Protection – When asked to report on the typical transformer protection practice for
large or higher voltage transformers, the following responses were received (number of utilities):
High Side Fuses 5
Differential Relays 38
High Side phase overcurrent relays 34
High Side ground overcurrent relays 13
Low Side neutral overcurrent relays 31
Low Side main breaker overcurrent relays 20
Tertiary overcurrent relays 3
Sudden pressure relays 29
Other 2
For those responses where low side main breaker protection was applicable, most apply phase
overcurrent and ground overcurrent relays as their typical protection. It is of interest to note that 9
utilities (20%) stated that they apply automatic reclosing as part of their low side main breaker
protection scheme.
Low Side Tie Breaker Protection – Most respondents replied that they use phase and ground
overcurrent relays as their typical protection for low side tie breakers, with significant numbers of
directionalized overcurrent relays and automatic tie control schemes also in place.
Feeder Protection – When asked to report on the typical relaying applied to their feeders, the
following responses were received (number of utilities):
Circuit reclosers 31
Phase overcurrent relays 42
Ground overcurrent relays 41
high impedance fault detection devices 1
Distance relaying 2
Negative sequence relaying 4
Directionalized overcurrent relays 1
Automatic tie control schemes 4

Page 7
This implies that while new technologies and functionalities have been introduced to the
distribution protection realm in the last decade, overcurrent relays and reclosers remain the most
used options for feeder protection.
Maximum Fault Current – When asked to report on whether or not they set maximum design
limits for fault current levels on their system, 23 utilities responded that they did set limits, while
20 did not. The vast majority set their phase and ground fault limits at the same value, with
10,000 Amps being the predominant level. A number of utilities set their limits above or below
the 10,000 level, with 23,500 being the highest and 6000 being the lowest.
Those utilities that limit the fault current on their system do so at the substation level. When
asked to report on the methods used to limit fault current on their system, the following
responses were received (number of utilities):
METHOD PHASE
FAULT
GROUND
FAULT
Phase or neutral transformer reactors 5 7
Phase or neutral feeder reactors 6 0
Transformer impedance only 16 17
Source and transformer impedance 13 14
Resonance grounding NA 0
Other 0 3
Load Unbalance – When asked if they had a policy or practice to limit their load unbalance, 30
utilities replied that they did, while 14 did not. The vast majority of load imbalance is measured
and controlled at the feeder breaker level, with some also taking place at the transformer
secondary. In most cases the unbalance currents are obtained by measuring phase currents and
calculating the unbalance. A few respondents use meters or transducers in the feeder residual
circuits or relays with instrumentation capabilities to measure or calculate the actual imbalance.
When asked to define their limit on transformer load unbalance, the majority of respondents
replied that they express the imbalance in terms of the percent of maximum phase current with
20% being a typical value. When asked to define their limit on feeder load imbalance, the
responses were split between expressing the imbalance in terms of maximum phase current with
20% being a typical value, and expressing it in terms of straight amperes in the range of 50 – 240
amps.
Harmonics Monitoring – When asked to report on whether they had equipment to monitor
distribution system harmonics, 21 utilities (49%) stated that they did while 22 utilities (51%) did
not. No utility responded that they were planning to implement harmonic monitoring at this time.
Neutrals – 41 respondents (93%) answered that their distribution circuits have multi-grounded
neutrals, while 3 (7%) do not.

Page 8
It should be noted that as might be expected, when comparing the results of this section to
previous surveys, there are few changes in overall distribution substation and system design.
SECTION 4- PHASE PROTECTION
Instantaneous Trip Function – Fuse Saving – 66% of the respondents apply phase overcurrent
protective devices with instantaneous trips for downstream fuse saving. The two previous
surveys taken in 1995 and 1988 listed responses of 71% and 91% respectively. Only a very small
portion of the survey respondents had available data regarding the effectiveness of their fuse
saving program. Data ranged from 5% effective to 90% effective with an average response of
49%. Only 5% of the respondents indicated a change in protection practice that would promote
fuse saving in the future. Half of the remaining respondents indicated no change in practice, the
other half were moving away from a fuse saving philosophy.
Instantaneous Trip Function – Other Purposes – Utilities responding to the survey indicated that
the instantaneous trip function is also used for other purposes as shown in the following table.
Note that respondents may have selected more that one category.
NO. OF UTILITIES
USING THIS
APPLICATION
Limit duration of fault for personnel safety 14
Limit equipment damage 19
Minimize voltage dip duration 15
Limit outage time 7
Enhance coordination 13
Other 1
Instantaneous Trip Function – Multiple Operations – 63% of the utilities responding use only one
instantaneous or fast trip for phase protection on feeder circuits. In the previous survey 73% had
the same response. Due to the limited response to this survey it is doubtful that this difference is
an indication of a trend occurring in the industry.
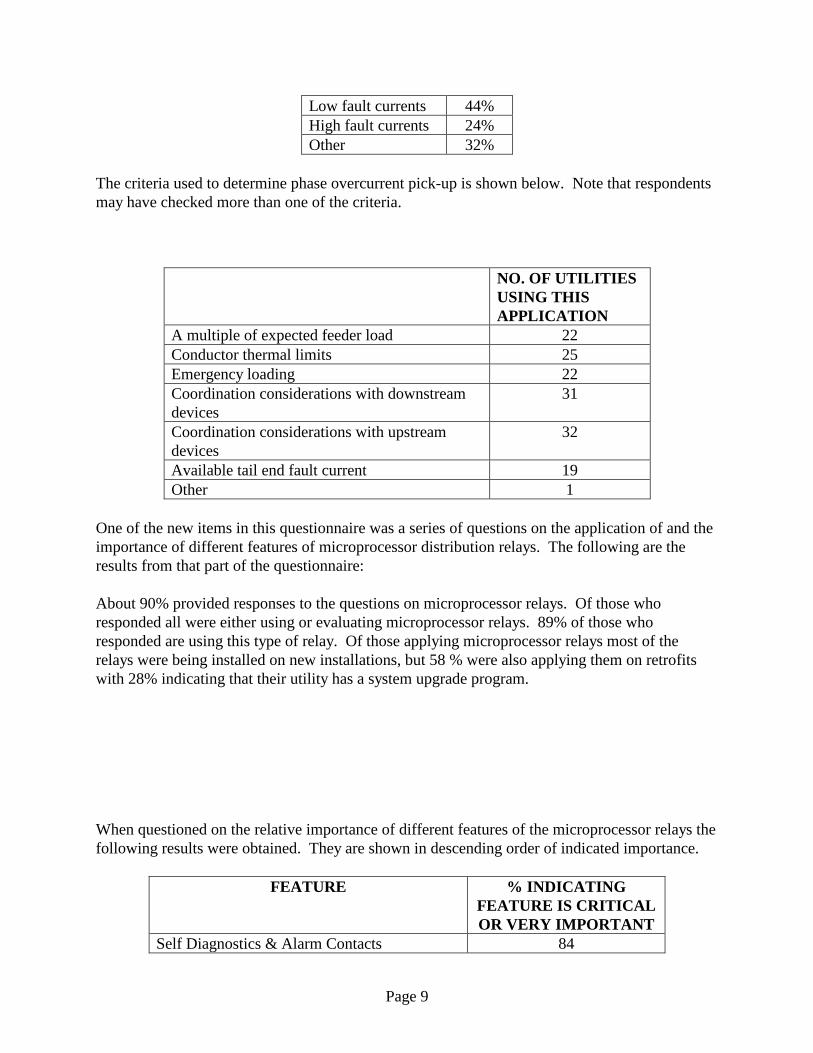
Feeder Coordination – 91% of the utilities responding attempt to achieve complete coordination
of feeder phase time overcurrent protective devices. 80% of the respondents indicate that
complete time overcurrent coordination is maintained during all automatic reclosures of feeder
phase protective devices. Miscoordination, when permitted, is allowed for the following reasons:
Page 9
Low fault currents 44%
High fault currents 24%
Other 32%
The criteria used to determine phase overcurrent pick-up is shown below. Note that respondents
may have checked more than one of the criteria.
NO. OF UTILITIES
USING THIS
APPLICATION
A multiple of expected feeder load 22
Conductor thermal limits 25
Emergency loading 22
Coordination considerations with downstream
devices
31
Coordination considerations with upstream
devices
32
Available tail end fault current 19
Other 1
One of the new items in this questionnaire was a series of questions on the application of and the
importance of different features of microprocessor distribution relays. The following are the
results from that part of the questionnaire:
About 90% provided responses to the questions on microprocessor relays. Of those who
responded all were either using or evaluating microprocessor relays. 89% of those who
responded are using this type of relay. Of those applying microprocessor relays most of the
relays were being installed on new installations, but 58 % were also applying them on retrofits
with 28% indicating that their utility has a system upgrade program.
When questioned on the relative importance of different features of the microprocessor relays the
following results were obtained. They are shown in descending order of indicated importance.
FEATURE % INDICATING
FEATURE IS CRITICAL
OR VERY IMPORTANT
Self Diagnostics & Alarm Contacts 84

Page 10
Reclosing 82
Digital Outputs for Interface with SCADA or
Station Computer
75
Event Recording & Logging 64
Multiple Overcurrent Units (inverse,
instantaneous) In same package
64
Programmable Scheme Logic 64
Communication Networking Capability 61
Local Display of Measured Values 52
Remote Data Access & Retrieval 52
Monitor Trip Coil Continuity 50
Fault Location Calculation 39
Monitor Breaker Close Circuit 36
Analog Outputs of Local or Remote Display 41
Alternate Setting Groups 43
Breaker Failure Protection 30
Negative Sequence Overcurrent Protection 20
Remote Setting Changes 18
More detailed questions were asked about the importance of the microprocessor relays having
particular capabilities in the area of event recording and logging. The results of those questions
are shown in descending order of indicated importance.
CAPABILITY % INDICATING
CAPABILITY IS
CRITICAL OR
VERY IMPORTANT
Fault Phase Indication 73
Fault Magnitude Data (phase & ground) 64
Waveform Data (oscillography) 32
Monitor Breaker Operate Time 32
In the area of local or remote displays of data, more detailed questions were asked about the
importance of recording, storing, and displaying certain quantities. The results of those questions
are listed below in descending order of indicated importance:
QUANTITY % INDICATING
QUANTITY IS
CRITICAL OR VERY
IMPORTANT
Neutral Current 50
Voltage 50

Page 11
Watt, Var, Power factor (3 phase) 50
Under-Frequency 48
Demand and Peak Demand Level 46
Watt, Var, Power factor (single phase) 41
Total Interrupted Current Accumulation & Alarm 25
Frequency 23
Questions were asked if having multiple functions in the same device was a problem for utilities.
On the importance of having “Separate packaging for each phase and for the ground overcurrent
functions” 82% indicated that this was of no importance or very little importance. On the
importance of having “Separate reclosing package” 77% indicated that this was of no importance
or very little importance.
A series of questions probed to see if the application of the microprocessor distribution relays
had caused any changes in protection or relay maintenance practices. 73% indicated that their
company was reviewing or revising distribution phase protection practices due to the new
technologies. 52% also indicated that they were reviewing or revising their ground protection.
Having self diagnostics and alarm contacts in the microprocessor relays was indicated to be the
most important feature, and 66% of those utilities applying these relays had revised their
maintenance practices due to the presence of this feature.
SECTION 5- GROUND PROTECTION
Application of Ground Overcurrent Protection – 70% of the respondents replied that they apply
ground current protection to the transformer low side main interrupting device, while 10% do not
and the issue is not applicable to 20% of the respondents.
Basis for Time Delay Overcurrent Pickup Settings – Utilities indicated the following criteria
were used to establish pickup settings for ground time overcurrent protection located on
transformer low side main interrupting devices:
NO. OF UTILITIES
USING THIS
APPLICATION
Percent of transformer full load current 5
Percent of transformer normal, maximum load 0
Percent of phase trip pickup level 7
Percent or multiple of largest feeder maximum load 2
Multiple of feeder ground device pickup level 11

Page 12
Fixed current level 2
Other 4
Application of Ground Overcurrent Feeder Protection – 98% of the respondents using phase
relay overcurrent protective devices also apply ground protection on feeder interrupting devices.
The percentages are essentially the same as in previous survey results.
Basis for Feeder Time Delay Overcurrent Pickup Settings – Utilities indicated the following
criteria were used to establish pickup settings for ground time overcurrent protection located on
feeder interrupting devices:
NO. OF UTILITIES
USING THIS
APPLICATION
Percentage of feeder maximum capacity 1
Percent of feeder expected maximum load 3
Percent of phase device pickup level 7
Fixed current level 5
Based on maximum downstream fuse size 10
Available tail end fault current 14
Other 3
Feeder Time Overcurrent Characteristics – The majority (98%) of utility respondents use relays
with inverse time characteristics for feeder protection. 65% apply ground instantaneous
functions, and 14% apply devices with definite time delay characteristics.
Feeder Ground Coordination – 81% of the respondents attempt to achieve complete coordination
of ground time overcurrent protective devices. The same percent of respondents maintain
complete coordination during all automatic reclosures of the feeder interrupting devices.
Miscoordination, when permitted, is allowed for the following reasons.
Low fault currents 46%
High fault currents 36%
Other 18%
Ground Instantaneous Devices – 74% of the utilities apply ground overcurrent protective devices
with instantaneous or fast trip devices. The primary reasons for application of the instantaneous
protection is summarized in the following table. Note that respondents may have selected more
that one category.

Page 13
NO. OF UTILITIES
USING THIS
APPLICATION
Limit duration of fault for personnel safety 13
Limit equipment damage 24
Minimize voltage dip duration 17
Limit outage time 7
Enhance coordination 13
Other 4
SECTION 6- RECLOSING
The questions in this section assume a “standard” distribution circuit, with no distributed sources
of generation.
Automatic Reclosing – Virtually all (98%) of the respondents report applying automatic
reclosing of the feeder interrupting device on overhead distribution circuits. Only one respondent
did not report using reclosing. Previous surveys reported 100% use of automatic reclosing.
Number of Reclosing Attempts – Most of the responding utilities used either 2 or 3 reclosing
attempts. No one reported 4 attempts. The utilities responding reported reclosing attempts as
follows:
RECLOSING ATTEMPTS:
1 Attempt 7 responses 16%
2 Attempts 15 responses 35%
3 Attempts 21 responses 49%
4 Attempts 0 responses 0%
There is an apparent trend based on previous survey data. Compared to the previous survey,
Single Shot Reclosing has increased (up to 16% from 8%), and use of 4 reclosing attempts has
declined (down to 0% from 10%). The ratios for 2 and 3 shots are almost identical (35% vs.
35% and 48% vs. 47%). The old survey reported reclosing attempts broken down by voltage
class, which showed minor variations. This comparison is with the totals.
Page 14
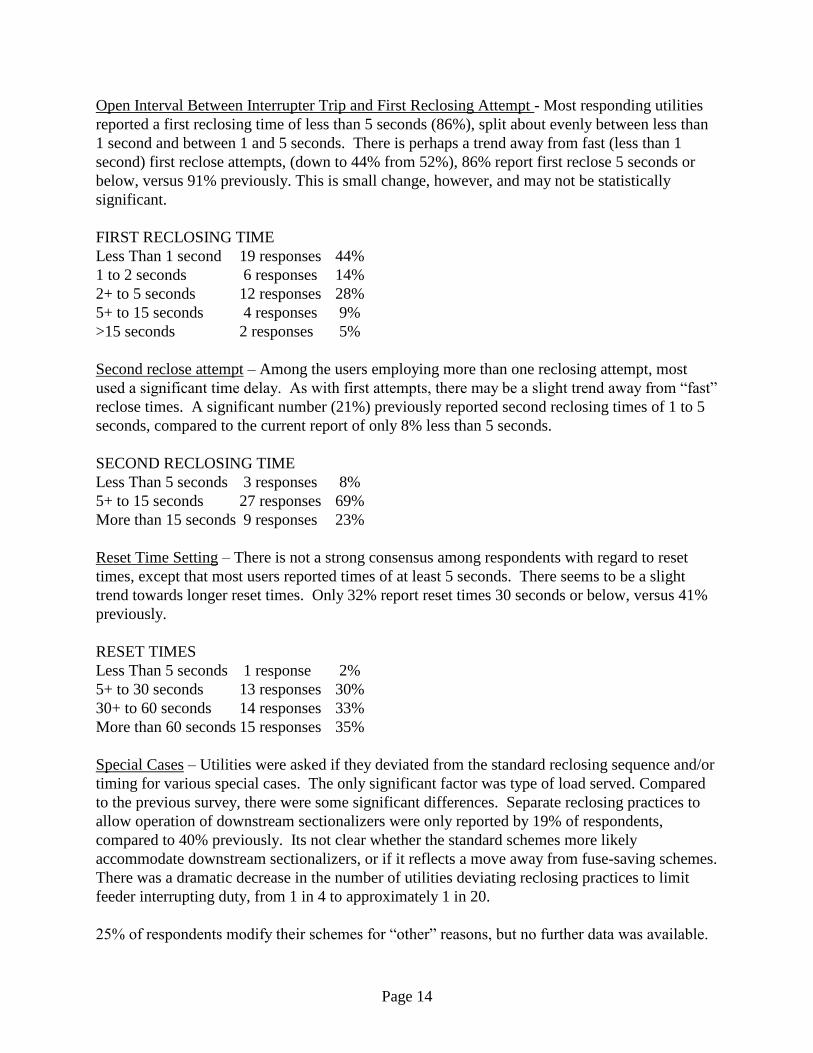
Open Interval Between Interrupter Trip and First Reclosing Attempt - Most responding utilities
reported a first reclosing time of less than 5 seconds (86%), split about evenly between less than
1 second and between 1 and 5 seconds. There is perhaps a trend away from fast (less than 1
second) first reclose attempts, (down to 44% from 52%), 86% report first reclose 5 seconds or
below, versus 91% previously. This is small change, however, and may not be statistically
significant.
FIRST RECLOSING TIME
Less Than 1 second 19 responses 44%
1 to 2 seconds 6 responses 14%
2+ to 5 seconds 12 responses 28%
5+ to 15 seconds 4 responses 9%
>15 seconds 2 responses 5%
Second reclose attempt – Among the users employing more than one reclosing attempt, most
used a significant time delay. As with first attempts, there may be a slight trend away from “fast”
reclose times. A significant number (21%) previously reported second reclosing times of 1 to 5
seconds, compared to the current report of only 8% less than 5 seconds.
SECOND RECLOSING TIME
Less Than 5 seconds 3 responses 8%
5+ to 15 seconds 27 responses 69%
More than 15 seconds 9 responses 23%
Reset Time Setting – There is not a strong consensus among respondents with regard to reset
times, except that most users reported times of at least 5 seconds. There seems to be a slight
trend towards longer reset times. Only 32% report reset times 30 seconds or below, versus 41%
previously.
RESET TIMES
Less Than 5 seconds 1 response 2%
5+ to 30 seconds 13 responses 30%
30+ to 60 seconds 14 responses 33%
More than 60 seconds 15 responses 35%
Special Cases – Utilities were asked if they deviated from the standard reclosing sequence and/or
timing for various special cases. The only significant factor was type of load served. Compared
to the previous survey, there were some significant differences. Separate reclosing practices to
allow operation of downstream sectionalizers were only reported by 19% of respondents,
compared to 40% previously. Its not clear whether the standard schemes more likely
accommodate downstream sectionalizers, or if it reflects a move away from fuse-saving schemes.
There was a dramatic decrease in the number of utilities deviating reclosing practices to limit
feeder interrupting duty, from 1 in 4 to approximately 1 in 20.
25% of respondents modify their schemes for “other” reasons, but no further data was available.

Page 15
Current Data Previous Data
The presence of supervisory control at the substation 14% 16%
To limit transformer through fault duty 14% 18%
To allow downstream sectionalizers to trip 19% 40%
To limit feeder interrupting duty 6% 26%
In substations fed directly from the transmission system 6% 8%
If the feeder has shield wires 0% 2%
Due to type of load served 58% N/A
Other 25% N/A
Reclosing on Feeders with Cable – Just over half of the respondents employ reclosing on feeders
with underground sections. The responses were very similar to the previous survey.
Feeders with less than 25% Underground 17% use reclosing
Feeders with between 25 and 50% Underground 12% use reclosing
Feeders with between 50 and 75% Underground 7% use reclosing
Feeders with greater Than 75% Underground 22% use reclosing
No automatic reclosing on feeders with underground 42%
Adaptive Reclosing – Very few responding utilities use any sort of adaptive reclosing schemes.
Only 4 of 43 respondents (9%) use adaptive reclosing. No trend can be determined, as no similar
question was asked in previous surveys.
No adaptive reclosing now in effect 91%
Reclosing adapts to weather in area 0%
Reclosing adapts to fault current level 7%
Reclosing adapts to type of fault (1 vs. 3) 0%
Other 2%
Reclosing Statistics – Over 80% of respondents do not keep statistics on the effectiveness of
reclosing. This is comparable to previous surveys. Only 2 of the 8 utilities who keep statistics
report that this data indicates a need to modify present reclosing practices.
Changing Practices – Just over a third of the respondents have changed reclosing practices in the
past 5 years. This is increased from about 1 in 4 in the previous survey. The most common
change was to increase the first reclosing interval (53%), followed by decreasing the number of
attempts (47%). Note that this is consistent with previous answers. Details are shown below:
Decrease the number of attempts per fault 47%
Increase the number of attempts per fault 6%
Lengthen the first reclosing interval 53%
Shorten the first interval 6%
Lengthen subsequent intervals or reset time 6%

Page 16
Shorten subsequent intervals or reset time 6%
Add adaptive features 12%
Other 0%
Reclosing Hardware – When asked if their company was using something other than a dedicated
automatic reclosing relay to accomplish reclosing, over 60% reported yes (including 7% trial
installations and 2% planning to change). Of those 93% are using integral reclosing within the
overcurrent relay. Details are shown below:
Integral reclosing within the overcurrent relay 93%
Programmable Logic Controller – dedicated to 1
feeder
10%
Programmable Logic Controller – multiple
feeders
4%
RTU programmable capabilities 4%
Station Computer 0%
Other 4%
Ancillary Functions – Utilities were asked which recloser accessory features were used. The
predominant response was Fuse Saving, with 61% using this function. Other features with
significant use include: Force to Lockout (39%), Sequence Coordination with downstream
reclosers (36%) and reclose fail timing (25%). Specific responses are as follows:
Reclose Fail timer 25%
Maximum Cycle timer 5%
Block Transformer LTC 11%
Sequence Coordination with downstream reclosers 36%
Fuse saving 61%
Wait (suspend reclosing) 2%
Force to Lockout (from input) 39%
Built in performance statistics 0%
None 14%
Other 0%
SECTION 7- SYSTEM FAULTS
Fault Statistics –Fully 93% of the respondents keep statistics on the number of outages on the
distribution system, which is almost universal. This is a substantial increase from the 73% who
reported “yes” in the previous survey. But only 44% keep statistics on the types of faults on the
distribution system, and only 42% keep statistics on the performance of the distribution
protection. When asked about monitoring the accumulated symmetrical interrupted current for
Page 17
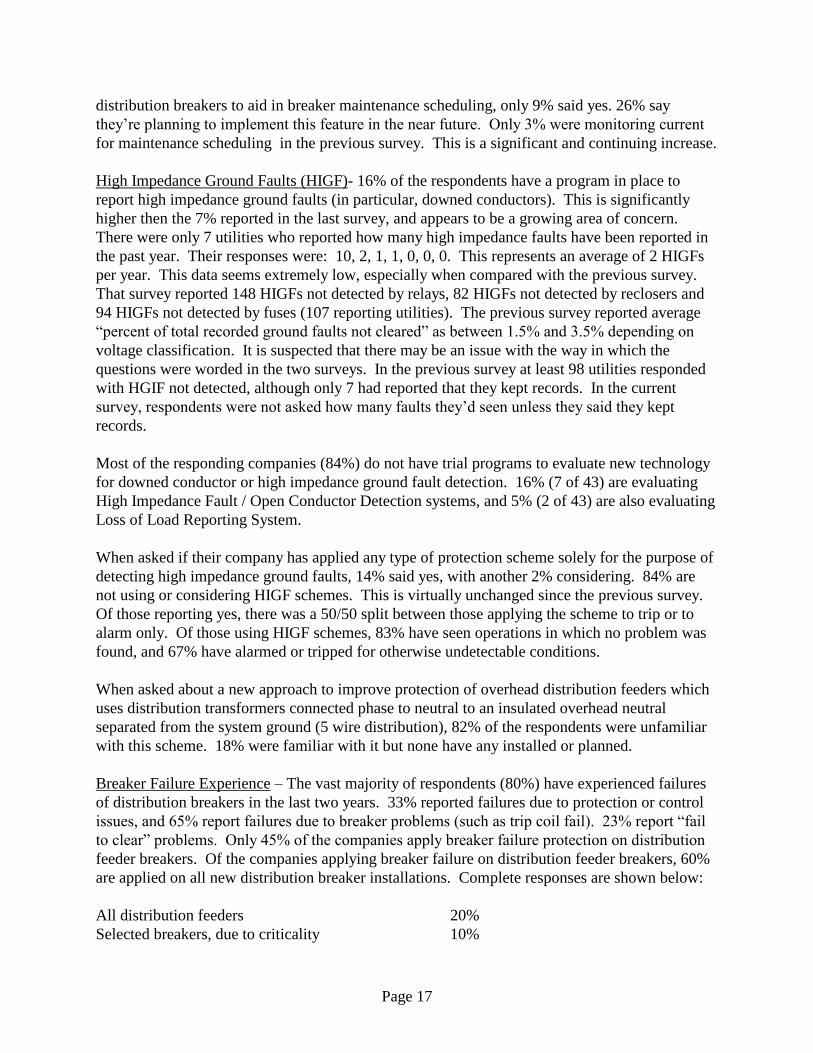
distribution breakers to aid in breaker maintenance scheduling, only 9% said yes. 26% say
they’re planning to implement this feature in the near future. Only 3% were monitoring current
for maintenance scheduling in the previous survey. This is a significant and continuing increase.
High Impedance Ground Faults (HIGF)- 16% of the respondents have a program in place to
report high impedance ground faults (in particular, downed conductors). This is significantly
higher then the 7% reported in the last survey, and appears to be a growing area of concern.
There were only 7 utilities who reported how many high impedance faults have been reported in
the past year. Their responses were: 10, 2, 1, 1, 0, 0, 0. This represents an average of 2 HIGFs
per year. This data seems extremely low, especially when compared with the previous survey.
That survey reported 148 HIGFs not detected by relays, 82 HIGFs not detected by reclosers and
94 HIGFs not detected by fuses (107 reporting utilities). The previous survey reported average
“percent of total recorded ground faults not cleared” as between 1.5% and 3.5% depending on
voltage classification. It is suspected that there may be an issue with the way in which the
questions were worded in the two surveys. In the previous survey at least 98 utilities responded
with HGIF not detected, although only 7 had reported that they kept records. In the current
survey, respondents were not asked how many faults they’d seen unless they said they kept
records.
Most of the responding companies (84%) do not have trial programs to evaluate new technology
for downed conductor or high impedance ground fault detection. 16% (7 of 43) are evaluating
High Impedance Fault / Open Conductor Detection systems, and 5% (2 of 43) are also evaluating
Loss of Load Reporting System.
When asked if their company has applied any type of protection scheme solely for the purpose of
detecting high impedance ground faults, 14% said yes, with another 2% considering. 84% are
not using or considering HIGF schemes. This is virtually unchanged since the previous survey.
Of those reporting yes, there was a 50/50 split between those applying the scheme to trip or to
alarm only. Of those using HIGF schemes, 83% have seen operations in which no problem was
found, and 67% have alarmed or tripped for otherwise undetectable conditions.
When asked about a new approach to improve protection of overhead distribution feeders which
uses distribution transformers connected phase to neutral to an insulated overhead neutral
separated from the system ground (5 wire distribution), 82% of the respondents were unfamiliar
with this scheme. 18% were familiar with it but none have any installed or planned.
Breaker Failure Experience – The vast majority of respondents (80%) have experienced failures
of distribution breakers in the last two years. 33% reported failures due to protection or control
issues, and 65% report failures due to breaker problems (such as trip coil fail). 23% report “fail
to clear” problems. Only 45% of the companies apply breaker failure protection on distribution
feeder breakers. Of the companies applying breaker failure on distribution feeder breakers, 60%
are applied on all new distribution breaker installations. Complete responses are shown below:
All distribution feeders 20%
Selected breakers, due to criticality 10%

Page 18
All new distribution breaker installations 60%
All metalclad switchgear breakers 0%
Selected breakers, due to breaker failure history 5%
Other 10%
Among respondents using distribution breaker failure schemes, 87% have experienced proper
trips, 20% have experiences false trips, and 7% have experienced fail to trip situations.
Conductor Burndowns – 72% of responding utilities have experienced conductor burndowns due
to protection not operating or operating too slowly. The majority (81%, 25 of 31) report these
problems only rarely, with 19% reporting occasionally, and none reporting frequent problems.
Clearing Times – Only 24% of the respondents have defined protective device clearing time
criteria for distribution line protection (considering the last protective device upstream from the
end of a distribution line). Of those with a criteria, there was no consensus for a maximum end-
of-the-line clearing time. The specific responses were as follows:
Less than or equal to 60 cycles 27%
Between 60+ and 90 cycles 18%
Between 90+ and 120 cycles 9%
Between 120+ and 180 cycles 27%
More than 180 cycles 9%
Other 9%
When asked if they still employ time criteria when adding an impedance into fault current
calculations, 45% of the respondents said yes. But there were very few (11) respondents, so this
is not statistically significant. The specific responses were as follows:
Less than or equal to 60 cycles 20%
Between 60+ and 90 cycles 20%
Between 90+ and 120 cycles 40%
Between 120+ and 180 cycles 0%
More than 180 cycles 20%
Other 0%
Percentage of line end fault current was the most common “other” criteria used to select or set
the last upstream device (58% of respondents). About a third of respondents (32%) use multiple
of minimum trip current, 29% use size of trip current to load ratio, and 5% use some other
(unspecified) criteria.
SECTION 8- COLD LOAD PICKUP

Page 19
Cold-Load Pickup (CLPU) – Only 43 utilities responded to this section with only about half that
responding to most questions and less than 10 to some questions. Of those responding to the
survey with knowledge of whether that had or did not experience cold-load pickup 63%(24)
respondents reported problems. This is down somewhat from the last survey. Of the 25
respondents to the types of trips that they received, 18 reported phase overcurrent trips while 16
reported ground overcurrent trips, with 4 respondents reporting other trips or did not know.
Of those 24 responding to experiencing cold-load pickup, 16 experienced CLPU on residential
loads, 9 on commercial loads, 7 on rural loads, 2 on Industrial loads, and 8 did not know.
To reduce or eliminate the CLPU tripping the vast majority reported sectionalizing to pick up
less load as the action that they take (83%). A third of the respondents replied that they have
blocked instantaneous or fast tripping, or increased the phase overcurrent relay pickup. A sixth
of the respondents increased the ground overcurrent pickup and 8 percent of the respondents
increased the phase time overcurrent delay.
Only 4 respondents reported having attempted to measure cold load currents (magnitude and
duration). The trend through the last several surveys is to resolve the CLPU issues with increased
sectionalizing and/or increased relay settings and away from disabling tripping.
Magnetizing Inrush – Of the 34 respondents reporting whether they had magnetizing inrush
events, 2% reported occasional inrush tripping and another 19% reported rare inrush tripping.
The most common solution to these problems is to raise or add time delay to the phase or ground
overcurrent settings. 22% chose to block tripping. In this survey no respondents chose to add
harmonic restrained protection.
SECTION 9- SYSTEM OPERATION
Overvoltage - 5 respondents (12%) reported they had experienced sustained primary overvoltages
due to neutral shift on multi-grounded systems. 26 respondents indicated they did not experience
overvoltage problems and 13 respondents indicated they did not know. Of those who
experienced overvoltages, the overvoltages resulted in surge arrester failures and/or “other”
unidentified failures. There were no transformer fuse operations due to saturation or transformer
failures reported as a result of overvoltage.
Sympathetic Tripping – 12 respondents (28%) reported sympathetic trips of breakers on
unfaulted feeders that were supplied from the same bus as a faulted feeder. 21 respondents
reported no sympathetic trips and 12 respondents indicated that they did not know. Of those
experiencing sympathetic trips all applicable relays causing the sympathetic trip were reported as
follows:
4 responses 33% Phase instantaneous overcurrent relay
3 responses 25% Ground instantaneous overcurrent relay
0 responses 0% Phase time overcurrent relay

Page 20
2 responses 17% Ground time overcurrent relay
5 responses 42% Unknown
0 responses 0% Other
Capacitor Switching – 3 respondents (7%) reported incorrect feeder trips due to switching of
capacitor banks connected to the feeder. 30 respondents indicated they did not experience any
incorrect trips and 10 respondents indicated they did not know.
Coordination Between Bus and Feeder Relays – Survey responses to the minimum coordination
margin between transformer or bus overcurrent relays at the maximum coordinating current level
were as follows:
3 responses 7% No policy
4 responses 9% <0.2 seconds (<12 cycles)
28 responses 64% 0.2 - 0.4 seconds (12 - 24 cycles)
8 responses 18% 0.4+ - 0.6 seconds (24+ - 36 cycles)
1 response 2% >0.6 seconds (>36 cycles)
Survey responses to the type of overcurrent relay reset was as follows:
19 responses 44% Inverse (typical of electromechanical relays)
20 responses 47% Fast reset (typical of circuit reclosers & some newer relays)
4 responses 9% Settable time delay
Only 7 (16%) respondents indicated a requirement for all overcurrent relays to be completely
reset before automatically reclosing.
Coordination Between Feeder Devices and Fuses – Survey recipients were asked to indicate the
minimum coordination time margin between their feeder protective device time current curve
and a downstream fuse total clearing time.
When the feeder protective device is an electromechanical disk overcurrent relay the responses
were as follows:
4 responses 9% No policy
8 responses 19% <0.2 seconds (<12 cycles)
27 responses 63% 0.2 - 0.4 seconds (12-24 cycles)
3 responses 7% 0.4+ - 0.6 seconds (24+-36 cycles)
1 response 2% >0.6 seconds (>36 cycles)

Page 21
When the feeder protective device is an electronic or microprocessor-based relay the responses
were as follows:
4 responses 9% No policy
13 responses 30% <0.2 seconds (<12 cycles)
22 responses 51% 0.2 - 0.4 seconds (12-24 cycles)
2 responses 5% 0.4+ - 0.6 seconds (24+-36 cycles)
2 responses 5% >0.6 seconds (>36 cycles)
When the feeder protective device is a hydraulic recloser (for slow curves) the responses were as
follows:
9 responses 21% No policy
8 responses 19% <0.2 seconds (<12 cycles)
20 responses 46% 0.2 - 0.4 seconds (12-24 cycles)
4 responses 9% 0.4+ - 0.6 seconds (24+-36 cycles)
2 responses 5% >0.6 seconds (>36 cycles)
When the feeder protective device is a electronic recloser (for slow curves) the responses were as
follows:
6 responses 14% No policy
11 responses 25% <0.2 seconds (<12 cycles)
21 responses 49% 0.2 - 0.4 seconds (12-24 cycles)
3 responses 7% 0.4+ - 0.6 seconds (24+-36 cycles)
2 responses 5% >0.6 seconds (>36 cycles)
Current Limiting Fuses (CLFs) – Twenty-nine respondents (66%) indicated they use CLFs.
Eight CLF users reported coordination or application problems with either general purpose or
back up CLFs. All applications for which respondents use CLFs are listed as follows:
10 responses 34% General purpose CLF (or full range)
19 responses 66% Back-up CLF (or non-full range)
5 responses 17% At overhead distribution line laterals (such as tap points)
8 responses 28% At underground distribution line laterals
All reasons when respondents use CLFs are listed as follows:
14 responses 48% High fault currents that exceed expulsion fuse rating
16 responses 55% Limiting I-squared let-through
8 responses 28% Locations that require non-expulsion fuses

Page 22
1 responses 3% Convenience of system standard
19 responses 66% Safety (on transformer or capacitor banks)
1 response 3% Other
When asked if CLFs are applied on the source side and/or load side of Completely Self-
Protecting (CSP) transformers, 14 respondents (50%) indicated they apply CLFs on the source
side only. No one reported using CLFs on the load side of these transformers. The remaining 14
respondents indicated they do not use CLFs on CSP transformers.
Automatic Sectionalizers – 26 respondents (60%) apply sectionalizers on distribution systems.
The survey listed four specific types plus “other”. Of those that use sectionalizers, responses to
all types of sectionalizers applied are as follows:
18 responses 69% Single phase hydraulic
11 responses 42% Three phase hydraulic
18 responses 69% Three phase electronic
9 responses 35% Single phase "dry" type
3 responses 12% Other
No problems were reported due to long reset times of sectionalizers and only 4 respondents
indicated a problem with short reset times.
Distance Relays – 6 respondents (13%) reported it necessary to use distance relays on
distribution circuits. The predominant reason for applying distance relays (5 out of 6
respondents) was to provide better discrimination between load and faults, followed by the need
for faster clearing times and torque control of overcurrent relays. Responses to all types of phase
distance relays used are as follows:
5 responses 83% Phase distance only
2 responses 33% Phase and ground distance
2 responses 33% Single zone
5 responses 83% Multi zone
Transfer Buses – 24 respondents (54%) reported use of a transfer bus arrangement. All
applicable types of protection were reported as follows:
0 responses 0% Fuses
7 responses 29% Independent relayed interrupting devices
16 responses 67% Protection incorporated with another feeder
4 responses 17% Protection dedicated to a specific feeder
2 responses 8% Protection incorporated with the transformer protection
0 responses 0% Other

Page 23
21 respondents (84%) require manual switching of the transfer bus. The remaining respondents
utilize SCADA or some other means of switching.
Differential Relaying – While 42 respondents (95%) utilize transformer differential relaying to
protect transformers, the minimum transformer size criterion for applying differential relaying
varies. Responses to the minimum substation transformer size at which transformer differential
relaying is normally applied is as follows:
1 response 2% <5 MVA
4 responses 9% 5+ - 10 MVA
24 responses 55% 10+ - 20 MVA
13 responses 30% >20 MVA
2 responses 5% Not installed on any size
17 respondents (40%) replied that they include the low voltage bus as part of the transformer
differential protection zone.
26 respondents (59%) indicated the use of high-speed low voltage bus protection at distribution
substations. Of those that use bus protection schemes, responses to all types of applications are
as follows:
5 responses 19% On all distribution buses
2 responses 8% On selected buses due to criticality
10 responses 34% On buses served by transformers above a certain size
8 responses 28% On new installations
7 responses 24% On metalclad switchgear buses
3 responses 10% On outdoor buses
2 responses 8% Other
Backup Relaying – 39 respondents (89%) indicated they normally use an upstream device to
provide backup protection for their distribution feeders. Types of backup protection reported as
being used are as follows:
7 responses 18% Transformer high side overcurrent relays
23 responses 59% Transformer low side or main breaker overcurrent relays
2 responses 5% Transformer neutral overcurrent relays
2 responses 5% Dedicated backup relaying
5 responses 13% Other
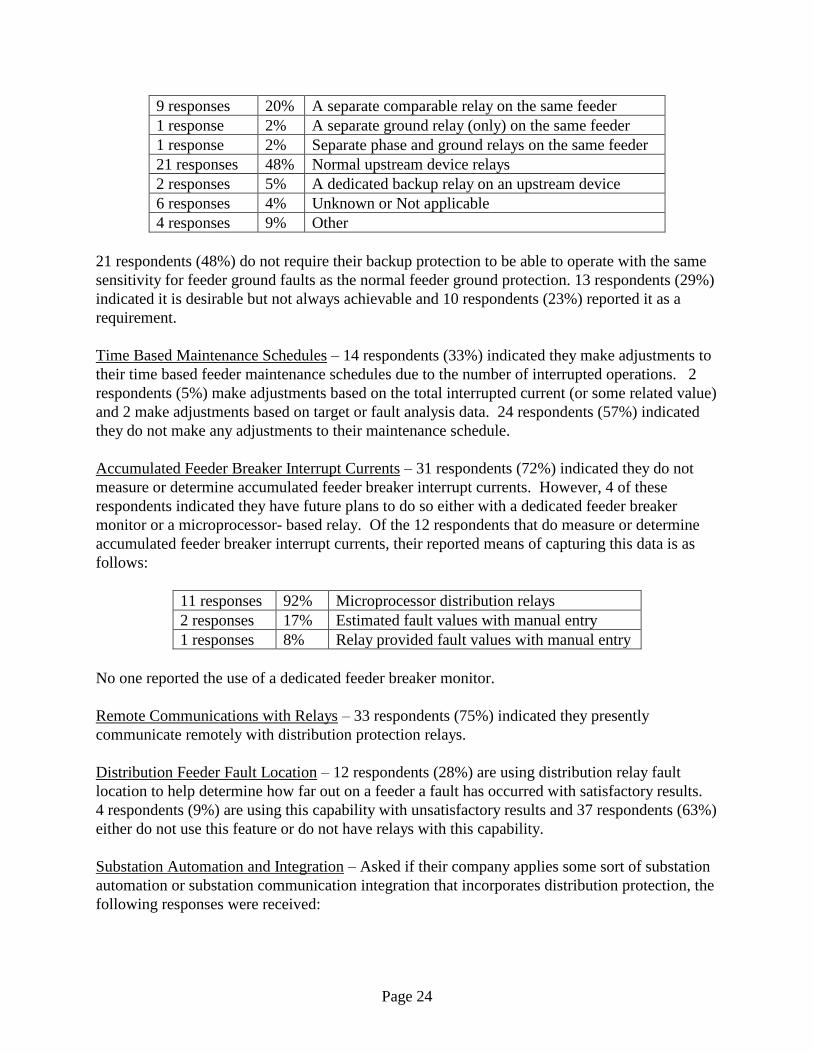
When asked what type of backup protection is provided for failure of a microprocessor
distribution relay with 3 phases and ground protection within the same relay, the following
responses were received:
Page 24
9 responses 20% A separate comparable relay on the same feeder
1 response 2% A separate ground relay (only) on the same feeder
1 response 2% Separate phase and ground relays on the same feeder
21 responses 48% Normal upstream device relays
2 responses 5% A dedicated backup relay on an upstream device
6 responses 4% Unknown or Not applicable
4 responses 9% Other
21 respondents (48%) do not require their backup protection to be able to operate with the same
sensitivity for feeder ground faults as the normal feeder ground protection. 13 respondents (29%)
indicated it is desirable but not always achievable and 10 respondents (23%) reported it as a
requirement.
Time Based Maintenance Schedules – 14 respondents (33%) indicated they make adjustments to
their time based feeder maintenance schedules due to the number of interrupted operations. 2
respondents (5%) make adjustments based on the total interrupted current (or some related value)
and 2 make adjustments based on target or fault analysis data. 24 respondents (57%) indicated
they do not make any adjustments to their maintenance schedule.
Accumulated Feeder Breaker Interrupt Currents – 31 respondents (72%) indicated they do not
measure or determine accumulated feeder breaker interrupt currents. However, 4 of these
respondents indicated they have future plans to do so either with a dedicated feeder breaker
monitor or a microprocessor- based relay. Of the 12 respondents that do measure or determine
accumulated feeder breaker interrupt currents, their reported means of capturing this data is as
follows:
11 responses 92% Microprocessor distribution relays
2 responses 17% Estimated fault values with manual entry
1 responses 8% Relay provided fault values with manual entry
No one reported the use of a dedicated feeder breaker monitor.
Remote Communications with Relays – 33 respondents (75%) indicated they presently
communicate remotely with distribution protection relays.
Distribution Feeder Fault Location – 12 respondents (28%) are using distribution relay fault
location to help determine how far out on a feeder a fault has occurred with satisfactory results.
4 respondents (9%) are using this capability with unsatisfactory results and 37 respondents (63%)
either do not use this feature or do not have relays with this capability.
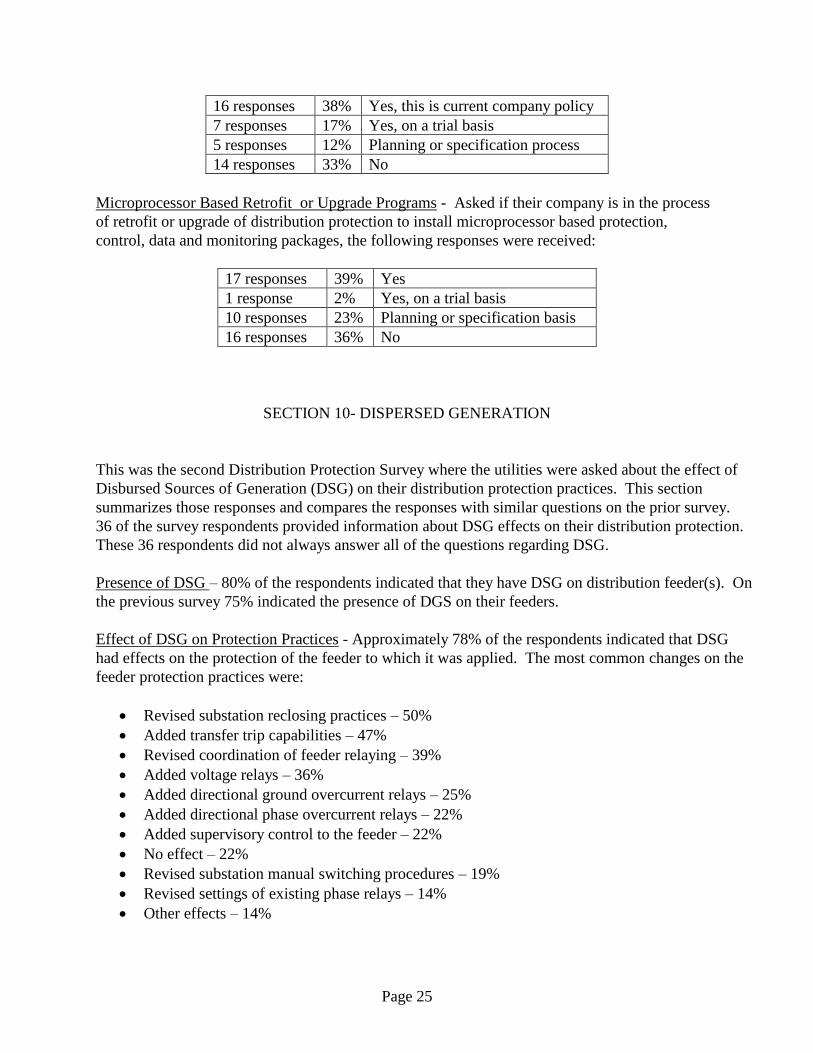
Substation Automation and Integration – Asked if their company applies some sort of substation
automation or substation communication integration that incorporates distribution protection, the
following responses were received:
Page 25
16 responses 38% Yes, this is current company policy
7 responses 17% Yes, on a trial basis
5 responses 12% Planning or specification process
14 responses 33% No
Microprocessor Based Retrofit or Upgrade Programs - Asked if their company is in the process
of retrofit or upgrade of distribution protection to install microprocessor based protection,
control, data and monitoring packages, the following responses were received:
17 responses 39% Yes
1 response 2% Yes, on a trial basis
10 responses 23% Planning or specification basis
16 responses 36% No
SECTION 10- DISPERSED GENERATION
This was the second Distribution Protection Survey where the utilities were asked about the effect of
Disbursed Sources of Generation (DSG) on their distribution protection practices. This section
summarizes those responses and compares the responses with similar questions on the prior survey.
36 of the survey respondents provided information about DSG effects on their distribution protection.
These 36 respondents did not always answer all of the questions regarding DSG.
Presence of DSG – 80% of the respondents indicated that they have DSG on distribution feeder(s). On
the previous survey 75% indicated the presence of DGS on their feeders.
Effect of DSG on Protection Practices - Approximately 78% of the respondents indicated that DSG
had effects on the protection of the feeder to which it was applied. The most common changes on the
feeder protection practices were:
Revised substation reclosing practices – 50%
Added transfer trip capabilities – 47%
Revised coordination of feeder relaying – 39%
Added voltage relays – 36%
Added directional ground overcurrent relays – 25%
Added directional phase overcurrent relays – 22%
Added supervisory control to the feeder – 22%
No effect – 22%
Revised substation manual switching procedures – 19%
Revised settings of existing phase relays – 14%
Other effects – 14%

Page 26
These results were similar to the previous survey but more details were provided.
Effect of DSG on Reclosing Practices - The most common changes made to automatic reclosing
practices due to DSG are:
Added voltage check supervision – 46%
Extended first shot recluse time – 26%
Added communications permission/control – 20%
Eliminated all reclosing on the feeder – 14%
Added synchronism supervision – 14%
Reduced number of reclose attempts – 6%
Added logic supervision – 6%
Other – 6%
Extending reclose time was the predominant change on the previous survey. The results were
generally similar with those of the previous survey. Eliminating reclosing did not appear as a change
on the previous survey.
Fault Current Contribution from the DSG - Again in this survey the phase fault current contribution
from the DSG is primarily determined by the DSG size or type and the transformer impedance. Only
one respondent indicated use of phase reactors.
Ground fault current contribution was determined by DSG size (31%) and Transformer impedance
(23%). 26% indicated there was no limitation on ground fault current. In the prior survey 70% of
respondents indicated that transformer impedance determined ground fault current. Only 8% of
respondents indicated use of neutral resistors or reactors to limit ground fault current. In the prior
survey the transformer impedance was sited by 70% of respondents as the primary determination of
ground fault current.
Fault current contribution from induction generators was considered by 30% of the respondents vs.
16% in the prior survey.
Load Unbalance with DSG - All of the respondents indicated that no difference in load unbalance was
permissible with a DSG on the feeder. This is similar to the previous survey data.
Recommended (Feeder Side) Interface Transformer Connections - No interface transformer was
required by 30% of the respondents. The respondents requiring transformer connections indicated
Grounded Wye either required or recommended by 58% of respondents. Delta connections were
required or recommended by 9% of respondents. This result is markedly changed from the previous
survey where an equal number of respondents indicated Delta and Wye connections used.
Ferroresonance Problems - 97 % of respondents indicated no problems with ferroresonance or they
didn’t know of any problems.
Automatic Throwover Equipment - Automatic throwover equipment was allowed to be used with the
DSG by 59% of respondents.
Page 27
Network Protectors - DSG’s were not allowed to be used with network protectors by 52% of
respondents. 39 % indicated this was not applicable on their systems.
Standard Relay Specification for DSG’s - Standard relay specifications were in place by 69% of the
respondents. The relay standard depends on several factors including:
Generator Size (75%)
Interconnection Type (75%)
Voltage Level (54%)
Existing Line Protection (29%)
Loading on the DSG Line (17%)
Other factors (13%)
SECTION 11- PRESENTATION SUMMARY
Over the course of the time that the “Effectiveness of Distribution Protection” Working Group
worked to prepare, distribute, and summarize the utility practices survey, a number of
presentations and discussions were made to the group that addressed emerging technological
trends in the field of distribution protection. Some of these presentations discussed new
protection technologies or applications, while others addressed issues related to event analysis
now possible through the deployment of digital relays and fault recorders. A brief summary of
these issues follows:
"High Speed Fault Sectionalizing for Underground Distribution Networks" and "International
Drive Distribution Automation and Protection"- These presentations discussed an advanced
technological application for a high reliability portion of one utility's distribution system that
applies transmission protection practices at the distribution level. The goal of this application is
to provide restoration of an underground system failure in 6 cycles and an overhead system
failure in less than 1 minute. This application includes both a Permissive Overreaching Transfer
Trip (POTT) scheme and a Directional Comparison Blocking (DCB) scheme and relies on fiber
optics for inter-relay communications between numerous padmounted pieces of equipment.
Multiple communications paths are used to provide self-healing in case of communications
circuit dig-ins. Each piece of padmount gear is treated as a mini-bus and each section of cable is
treated as a transmission line. Voltage sensing is also used to provide directionality/polarizing

Page 28
quantities. Non-communication based time overcurrent protection is provided at the source
substation as a backup.
"Using Voltage to Enhance Distribution Protection"- This presentation discussed the use of
voltage as an input to microprocessor-based relays, allowing for additional protection
functionality. Examples include the detection of single phasing conditions due to delta-wye
transformer high side open phase conditions, improved discrimination of fault vs. load current
conditions, overcurrent directionality, better supervision of manual and automatic reclosing,
undervoltage/frequency load shedding, enhanced fault analysis, and comprehensive metering.
"Improved Relay Coordination Through Curve Shaping"- This presentation discussed improving
relay coordination for high duty faults by integrating relay functions to reduce operating times.
This was accomplished through coordination of instantaneous elements through curve shaping,
and separate 'zones' of definite time overcurrent protection defined for close-in, midline, and line
end of a distribution circuit. Different curve shapes were utilized to develop a composite
operating curve in a microprocessor-based relay in order to reduce operate times to less than 1
second.
"Distributed Generation Interconnection Issue Overview"- This was a discussion of a Power
Systems Relaying Committee Working Group created to address issues associated with IEEE
Standards Coordinating Committee 21’s development of P1547, the Standard for Distributed
Resources Interconnected with Electric Power Systems.
"Use of LAN's/WAN's to protect Distributed Generation on Utility Feeders"- This presentation
discussed a concept for transfer tripping of merchant generation plants via the internet in 200
milliseconds or less. The concept was developed using the assumption that the utility source
distribution substation is integrated and has a substation Local Area Network (LAN). The
substation LAN could carry a transfer trip signal through a utility Wide Area Network (WAN)
and ultimately to a customer/generator LAN via the internet. Challenges to implementing this
concept may include security issues and internet traffic.
"Event Abnormalities in Distribution Circuits"- This presentation discussed the application of 5
fault recorders to monitor distribution circuits over a 2 year study period. Analysis of events
implies that fuse saving may not work in many cases in the field due to fuse operating times
being faster than typical distribution circuit breaker operating times. Many 1/2-cycle events that
were seen are believed to be arrester operations or insulator flashovers rather than fuse
operations. Other events studied included overexcitation and saturation of distribution
transformers in light load/system overvoltage conditions that resulted in characteristic sawtooth
waveforms.
"Analysis of Distribution Faults Using a Power Quality Monitor and Potential Protection
Modifications"- This presentation discussed the use of permanent power quality monitors as
event recorders. The recordings demonstrated that single phase faults frequently evolved into
multi-phase faults on distribution circuits if not interrupted quickly. Many 1-4 cycle fuse

Page 29
operations with simultaneous recloser trip operations due to instantaneous relay trips were
experienced. The utility that presented this material has considered moving from instantaneous to
.10 second definite time trips and adding reclosing where none exists to reduce fault clearing
times and reduce the number of evolving faults and subsequent damage and restoration times.
"Sympathetic Tripping”- This presentation discussed fault records for system events with
sympathetic trips. These fault records indicate that post-fault three-phase currents of three times
prefault current are sometimes seen on distribution circuits under low voltage conditions. It is
believed that AC motor load inrush, occurring for a number of seconds, is causing this problem.
In some cases where fuse saving is applied 'sympathetic trips' have occurred on distribution
circuits supplied from the same bus as a faulted circuit.
REFERENCES (1) Distribution Line Protection Practices – Industry Survey Analysis, IEEE PSRC Committee Report,
IEEE Transactions on Power Apparatus and Systems, Vol. PAS 102, No. 10, October 1983, pp 3279 -
3287
(2) Distribution Line Protection Practices – Industry Survey Results, IEEE PSRC Committee Report,
IEEE Transactions on Power Delivery, Vol. 3, No. 2, April 1988, pp 514 - 524
(3) Distribution Line Protection Practices – Industry Survey Results, IEEE PSRC Committee Report,
IEEE Transactions on Power Delivery, Vol. 10, No. 1, January 1995, pp 176-180