distribution grid voltage regulation with ders voltage regulation - for...limit, while ansi c84.1...
TRANSCRIPT
Distribution Grid Voltage
Regulation with DERs
Overview
• Introduction – Voltage Regulation Philosophy
• Substation Distribution Bus Voltage Regulation
• Distribution Feeder Voltage Regulation
• Voltage Drop/Rise on Line Transformers, Services and
Secondaries
• Voltage at the Meter and at the Inverter
• Providing Head Room for DERs – Several Alternatives &
Costs
• Summary/Proposal
• Three Critical Components for “Smart Energy”
Introduction
● Utilities have voltage regulation equipment at various points of the distribution system to insure customers receive the proper voltage at their meter during any load level.
● The past and even present voltage regulation philosophy was not developed with widespread Distributed Energy Resources in mind at customer premises.
● At low load, those customers located downstream, but very close to regulation equipment, will have a voltage near the top end of the acceptable voltage bandwidth. If their generation causes export, the voltage at the meter will rise and can exceed the acceptable bandwidth if the export is high enough.
3
Substation Distribution Bus Voltage Regulation ● Distribution Power Transformers are typically equipped with
Under Load Tap Changers (ULTCs). The ULTC can raise or lower the voltage about 10%, typically with 16 small step changes in either direction. When the distribution bus voltage reaches the top or bottom of the set bandwidth for a period of time, it will operate. If the transformer does not have a ULTC, a separate voltage regulator may serve the same purpose.
● Where a substation bus has load feeders and an express feeder to a large (10 MW) PV site, the feeders may have different desired set values for the bus voltage. The express feeder tends to have voltage rise from sub to the large generator and would be better served by a lower bus voltage, while the other feeders have voltage decrease over distance as they serve load and can use a higher bus voltage close to the top of the allowable bandwidth.
4

Substation Bus Voltage Regulation
5
6
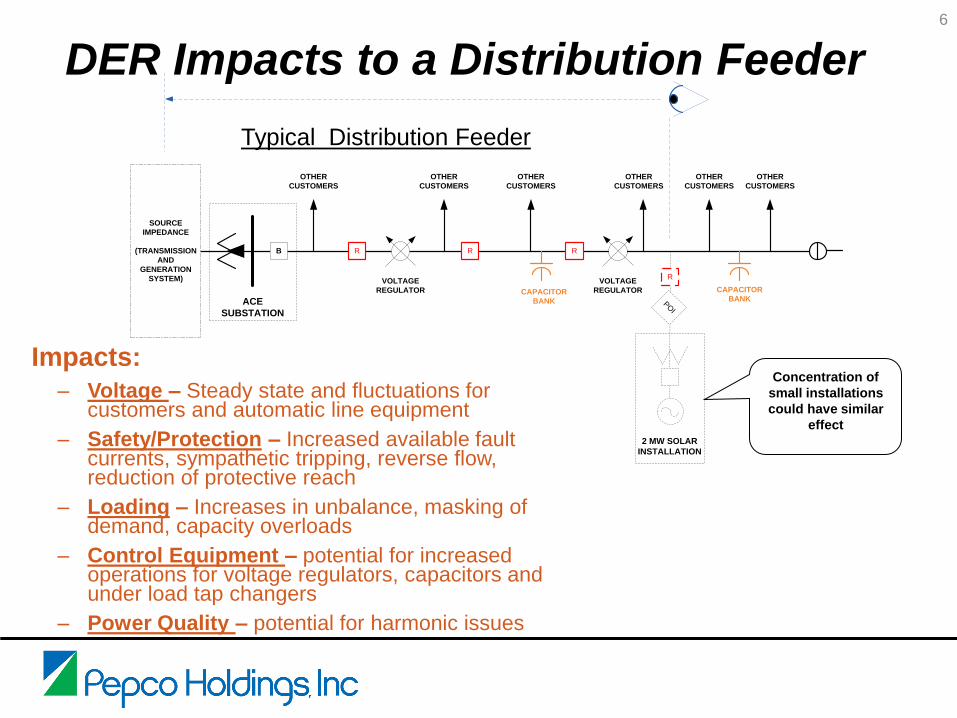
DER Impacts to a Distribution Feeder
B R R R
R
POI
SOURCE
IMPEDANCE
(TRANSMISSION
AND
GENERATION
SYSTEM)
OTHER
CUSTOMERS
OTHER
CUSTOMERS
OTHER
CUSTOMERS
OTHER
CUSTOMERS
OTHER
CUSTOMERS
ACE
SUBSTATION
VOLTAGE
REGULATOR
VOLTAGE
REGULATOR
OTHER
CUSTOMERS
CAPACITOR
BANK
CAPACITOR
BANK
2 MW SOLAR
INSTALLATION
Impacts:
– Voltage – Steady state and fluctuations for customers and automatic line equipment
– Safety/Protection – Increased available fault currents, sympathetic tripping, reverse flow, reduction of protective reach
– Loading – Increases in unbalance, masking of demand, capacity overloads
– Control Equipment – potential for increased operations for voltage regulators, capacitors and under load tap changers
– Power Quality – potential for harmonic issues
Typical Distribution Feeder
Concentration of
small installations
could have similar
effect

Distribution Feeder Voltage Regulation
● Utilities regulate the voltage on the distribution feeders so that the delivery voltage at the customers meter will stay within +/- 5% of nominal (ie. 120 V +/- 5% or 126-114V). The national standard related to this is ANSI C84.1 In some states, rules are slightly more stringent and may allow a smaller bandwidth.
● Voltage regulators raise or lower the voltage in very small steps, typically 5/8% per step for up to 10% raise or lower. (See previous slide titled Impacts to a Distribution Feeder).
Distribution Feeder Voltage Regulation (cont.)
● Utilities also use capacitor banks to support the voltage. As more and more reactive load (motors, compressors, etc.) come on line, capacitors switch on to provide reactive support and in so doing, generally increase the voltage by around 0.5 – 2% in the vicinity of the capacitor bank (see cap banks on previous slide titled DER Impact to a Distribution Feeder).
● The next slide depicts a feeder at peak load with 4 voltage regulation zones – maintained by the ULTC plus 3 sets of voltage regulators. These devices are being simulated in a program to provide 124V output, but in reality, the regulators will typically operate with a 2 volt bandwidth, maintaining voltage between 123 and 125V. Because of phase loading imbalance, phases differ in voltage. The voltage regulators are located to deliver required voltage for all customers.
8

Plot of Feeder Voltage over Distance
9

Voltage Drop on Line Transformers, Services and Secondaries ● The following diagram depicts the distribution bus voltage as
123V (1.025 p.u.) leaving the substation at a peak load scenario.
● Since there is no generation at any premises, the voltage drops on the line, across the line transformer, and on the secondary and service lines.
● In this example there are no voltage regulators or cap banks on the feeder. All voltage drop comes from carrying load over a distance of wire or across the line transformer.
● Note the difference in voltage from the first house (118V) to the last house shown (115V). This is all one voltage regulation zone with customers at differing distances from the voltage regulation device, an LTC (or ULTC) at the substation.
10

11
From: Smart Distribution WIKI

Voltage at the Meter
● ANSI C84.1 Guideline: Maintain the Nominal Voltage +/- 5%
● If the voltage delivered to the meter is 126V, (the maximum allowable):
– As soon as generation output exceeds the load of the premise, the voltage at the meter will begin to rise – and will exceed the ANSI guideline
– Export is almost guaranteed for PV systems because solar has such a low capacity factor, it needs to be sized quite large to net out the annual energy use
– This can be a bigger problem if more than 1 home feeds into the same transformer or for community energy
12

Approximate Voltage Drop/Rise (%) @ Peak, Minimum Load & with PV
13
Approximate at
PEAK LOAD
without PV
Approximate at
MINIMUM LOAD
without PV
With PV Solar
Causing Export
(at minimal load)
Across Line
Transformer
- 0.5 to – 2.0% Negligible + 0.3 to +1.3%
On Secondary - 0.5 to -1.5% Negligible + 0.2 to +1.0%
On Service Drop - 1 to -1.5% Negligible + 0.5 to +1%
TOTAL - 2.0 to - 5.0% Negligible + 1.0 to + 3.3%
Note: Negative shows voltage dropping towards the premise and generation system.
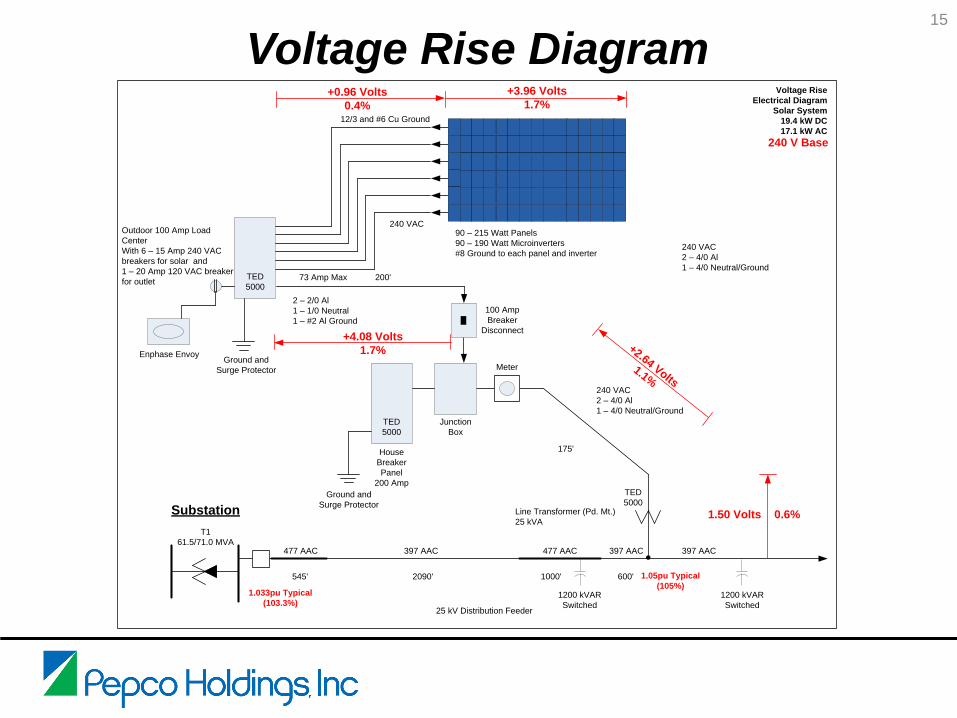
Voltage Rise Example at Premise
● The following Voltage Rise diagram depicts a system that has significant voltage rise during peak output since there is a fair distance to the solar system beyond the customer meter.
● On a 120V base, the voltage could rise about 4.5 volts between the meter and the PV system. If load is minimal at the premise and the PV system is at maximum output, there could potentially be a 2.1 volt rise from the line transformer to the meter due to the export going from premise to grid.
● It is easy to see, that if delivery voltage is at the highest point on the delivery bandwidth, it will make it very difficult to have voltage within the ANSI C84.1 bandwidth at the meter.
● This facility experienced 127.5V at the meter and 131V at the inverters.
14
15
Voltage Rise Diagram
Substation
T1
61.5/71.0 MVA
1200 kVAR
Switched
1200 kVAR
Switched
240 VAC
12/3 and #6 Cu Ground
73 Amp Max
Ground and
Surge Protector
Ground and
Surge Protector
2 – 2/0 Al
1 – 1/0 Neutral
1 – #2 Al Ground
100 Amp
Breaker
Disconnect
Meter
Junction
Box
House
Breaker
Panel
200 Amp
Outdoor 100 Amp Load
Center
With 6 – 15 Amp 240 VAC
breakers for solar and
1 – 20 Amp 120 VAC breaker
for outlet
240 VAC
2 – 4/0 Al
1 – 4/0 Neutral/Ground
Line Transformer (Pd. Mt.)
25 kVA
TED
5000
TED
5000
Voltage Rise
Electrical Diagram
Solar System
19.4 kW DC
17.1 kW AC
90 – 215 Watt Panels
90 – 190 Watt Microinverters
#8 Ground to each panel and inverter
477 AAC 397 AAC 477 AAC 397 AAC 397 AAC
Enphase Envoy
+4.08 Volts
1.7%
+0.96 Volts
0.4%
+3.96 Volts
1.7%
+2.64 Volts1.1%
240 V Base
175'
0.6%
1.033pu Typical
(103.3%)
1.05pu Typical
(105%)
25 kV Distribution Feeder
545' 2090' 1000' 600'
240 VAC
2 – 4/0 Al
1 – 4/0 Neutral/Ground
200'TED
5000
1.50 Volts
Overvoltage at the Inverter
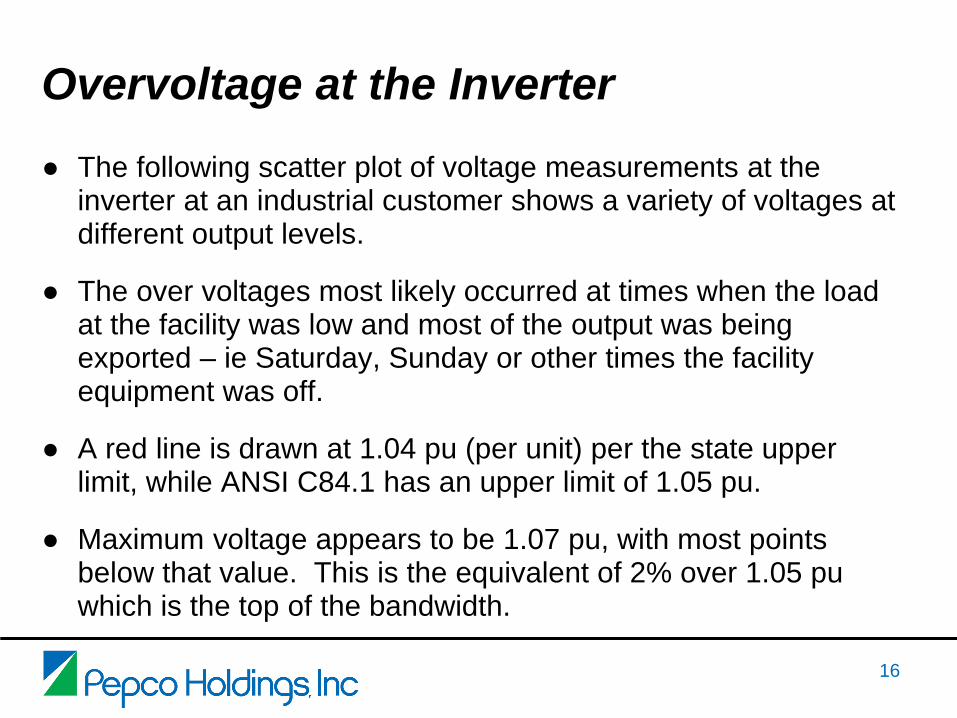
● The following scatter plot of voltage measurements at the inverter at an industrial customer shows a variety of voltages at different output levels.
● The over voltages most likely occurred at times when the load at the facility was low and most of the output was being exported – ie Saturday, Sunday or other times the facility equipment was off.
● A red line is drawn at 1.04 pu (per unit) per the state upper limit, while ANSI C84.1 has an upper limit of 1.05 pu.
● Maximum voltage appears to be 1.07 pu, with most points below that value. This is the equivalent of 2% over 1.05 pu which is the top of the bandwidth.
16

Overvoltage at the Inverter
17
Overvoltage Limit
Source: EPRI Monitoring
Providing Headroom for DERs
● The utility is required to deliver a high enough voltage to insure adequate voltage at the meter during peak load, but yet low enough to be the proper voltage at low load. Now with DERs, the top voltage needs to give head room to PV and other DERs that may cause export at low facility load.
● Proposal: Deliver a target voltage of 123V (1.025 pu) to the meter at all times. An alternate would be to deliver 123V during low load periods and especially during high solar output. This will give 3 volts or 2.5% headroom for PV or other DERs that cause voltage rise during low facility load and high output, or periods of export.
18
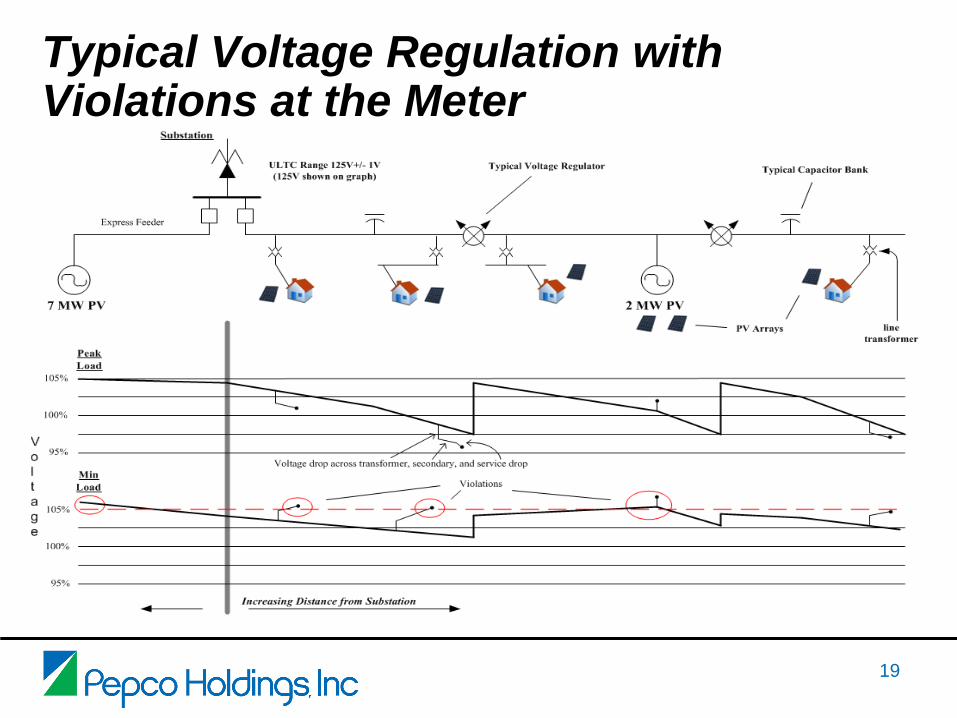
Typical Voltage Regulation with Violations at the Meter
19
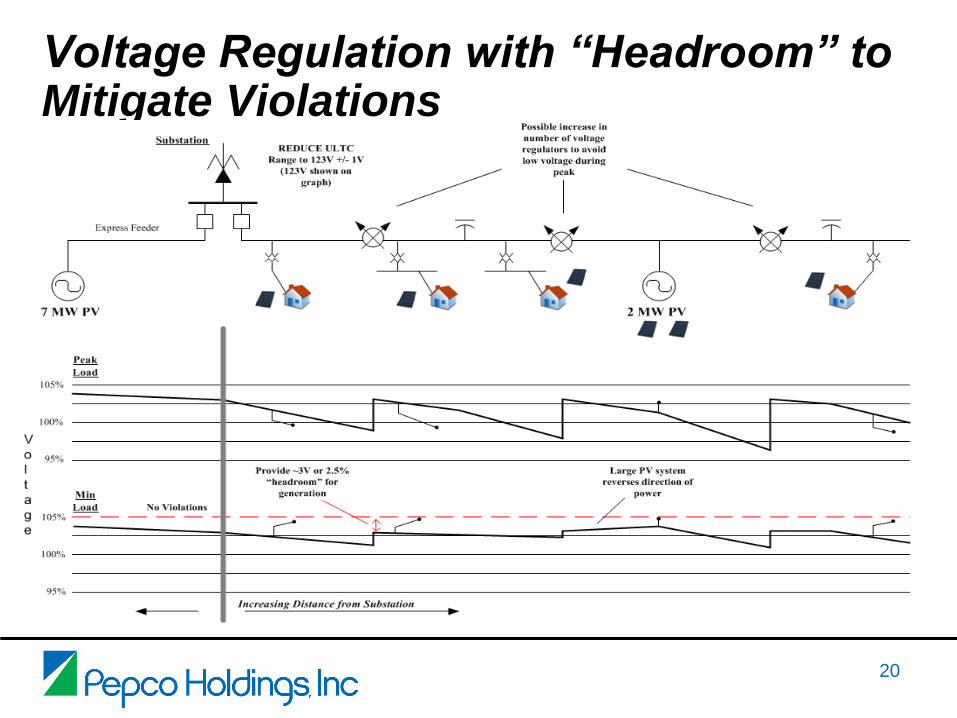
Voltage Regulation with “Headroom” to Mitigate Violations
20

Alternatives for Providing DER Headroom ● Alternative 1 -- Similar to Conservation Voltage Reduction
(CVR), Voltage Regulation Zones can be set to tighter bandwidths with the target voltage reduced to 123V. This type approach may require some new voltage regulators, and other voltage regulators or capacitors to be moved.
● Alternative 2 – With the use of monitoring and active control, such as found in Integrated Volt-VAR Regulation or Control (IVVR or IVVC) the set points for regulation can be changed to insure adequate voltage at customer premises during peak and low load in each voltage regulation zone on feeders. This approach requires communication, monitoring and control but will probably involve fewer new voltage regulators and less moving of existing voltage regulators or capacitors.
21

State Voltage Requirements
● PHI is considering a target operating feeder voltage of 123V or 2-1/2% lower than the maximum (126V) per ANSI C84.1.
● PHI proposes that States allow the bandwidth for customers to extend to the full ANSI 84.1 bandwidth. In this way, it will allow DER systems to have 2-1/2% “headroom” and operate without causing voltage violations at the meter during export and stay within ANSI C84.1.
22
State Acceptable V Range at Meter In terms of 120V
DE Nominal +/- 5% 114 V – 126 V
MD Nominal +/- 5% 114V – 126 V
NJ Nominal +/- 4% 115.2 V – 124.8 V
Maintaining Voltage on High Penetration Feeders or Sections
● Asset Strategy and Planning is deploying the Distributed Engineering Workstation, a time series capable program to study DERs and their impact to the T & D system in aggregate.
● The goal is to allow higher penetration levels but cut off installations before steady state high voltage would occur on a feeder.
● The program will also study voltage fluctuations and the impact of DERs on automatic line equipment and identify potential problems.
23

Voltage Regulation - Summary
● Although utilities are pursuing various volt-var control strategies, what is needed is a strategy and general voltage philosophy that will maintain proper voltages at peak, at low load and now during export from DERs.
● Establishing these guidelines will provide the base for considering what settings smart inverters should use if they will participate in voltage regulation.
● The above effort needs to consider rural long feeders as well as short stiff feeders generally found in urban locations. It also needs to allow for different paths that utilities are taking to upgrade or implement “Smart Grid” solutions. Ideally, voltage feedback will be available from AMI systems to insure that customers voltage remains within acceptable limits.
24

Voltage Regulation - Summary (cont.) ● Germany appears to have a larger allowable bandwidth. The
ANSI C84.1 voltage bandwidth of +/- 5% has served customers well and probably should be maintained. Changing it would require significant discussion and may lead to problems when operating at the extremes.
● Going to a flatter feeder voltage can add some cost because it may add a few more voltage regulation zones to some feeders.
● PHI is considering centralized Volt/VAr control as part of a Distribution Automation strategy. If AMI is installed, it will provide voltage feedback which is important to insure proper customer voltage. It would also enable flexible load control and inverter control to provide some important parts of an integrated Advanced Feeder Management System.
25
Smart Energy ● The following slide outlines three critical components to
providing “Smart Energy” on the distribution system.
● A “Smart Grid” is essential – the ability to operate safely, stay within capacity ratings, maintain proper voltages at all T & D levels during different load and or DER output levels. It envisions communications that allow centralized monitoring and control for utility equipment, signals to premises for flexible load control, voltage feedback from some premises, and signals so generation sources can participate in creating “Smart Energy.”
● A “Smart Inverter” has communication, monitoring and control capabilities to assist in volt-var control autonomously or under central (Utility) direction. It may also participate in ancillary markets and help to provide premium power to the facility owner. Other non-inverter based distributed generators may participate, but may not have the same functionality.
26

Smart Energy (cont.)
● The “Smart Premise” enables the premise owner to control their energy use in such a way that saves them money, helps to support the grid and maintains their desired lifestyle. It keys off of automated control, based on the premise owner’s preferences that control a variety flexible loads. Appliances and/or Home Energy Managers will communicate with the utility through the AMI system or by other means and automatically control equipment at the premise based on the settings selected or over ridden by the owner.
27
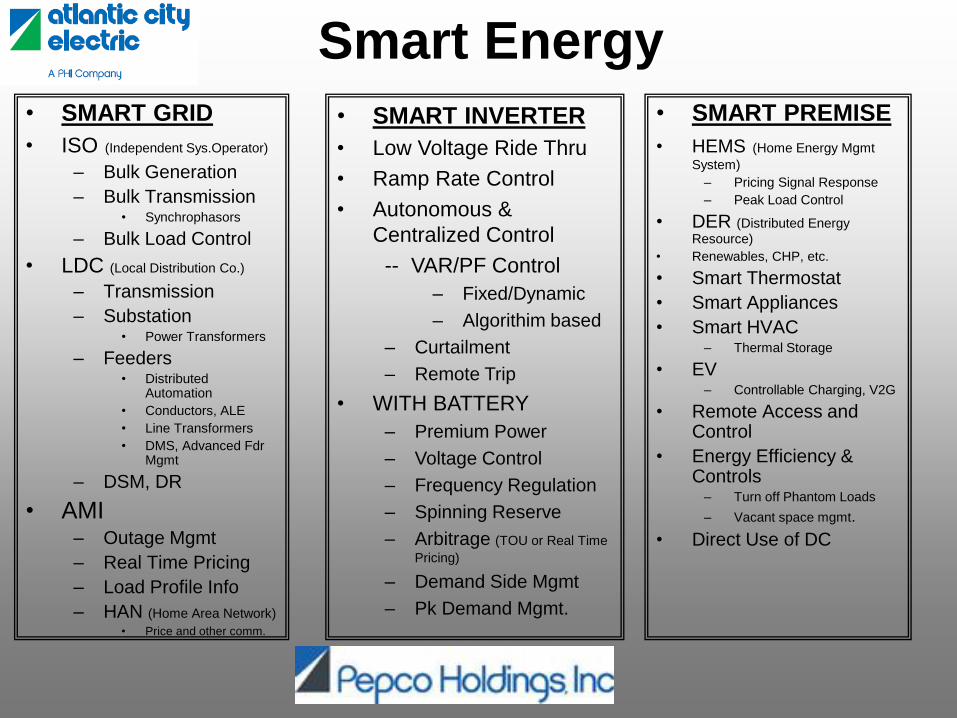
Smart Energy • SMART GRID
• ISO (Independent Sys.Operator)
– Bulk Generation
– Bulk Transmission • Synchrophasors
– Bulk Load Control
• LDC (Local Distribution Co.)
– Transmission
– Substation • Power Transformers
– Feeders • Distributed
Automation
• Conductors, ALE
• Line Transformers
• DMS, Advanced Fdr Mgmt
– DSM, DR
• AMI – Outage Mgmt
– Real Time Pricing
– Load Profile Info
– HAN (Home Area Network)
• Price and other comm.
• SMART PREMISE
• HEMS (Home Energy Mgmt
System)
– Pricing Signal Response
– Peak Load Control
• DER (Distributed Energy
Resource)
• Renewables, CHP, etc.
• Smart Thermostat
• Smart Appliances
• Smart HVAC – Thermal Storage
• EV – Controllable Charging, V2G
• Remote Access and Control
• Energy Efficiency & Controls
– Turn off Phantom Loads
– Vacant space mgmt.
• Direct Use of DC
• SMART INVERTER
• Low Voltage Ride Thru
• Ramp Rate Control
• Autonomous &
Centralized Control
-- VAR/PF Control
– Fixed/Dynamic
– Algorithim based
– Curtailment
– Remote Trip
• WITH BATTERY
– Premium Power
– Voltage Control
– Frequency Regulation
– Spinning Reserve
– Arbitrage (TOU or Real Time
Pricing)
– Demand Side Mgmt
– Pk Demand Mgmt.
Steve Steffel, PE
Mgr, Distributed Energy Resources
Planning and Analytics