distribution and succession of vascular epiphytes in ... · the epiphyte habit is a successful...
TRANSCRIPT

UvA-DARE is a service provided by the library of the University of Amsterdam (http://dare.uva.nl)
UvA-DARE (Digital Academic Repository)
Distribution and succession of vascular epiphytes in Colombian Amazonia
Benavides Duque, A.M.
Link to publication
Citation for published version (APA):Benavides Duque, A. M. (2010). Distribution and succession of vascular epiphytes in Colombian Amazonia.
General rightsIt is not permitted to download or to forward/distribute the text or part of it without the consent of the author(s) and/or copyright holder(s),other than for strictly personal, individual use, unless the work is under an open content license (like Creative Commons).
Disclaimer/Complaints regulationsIf you believe that digital publication of certain material infringes any of your rights or (privacy) interests, please let the Library know, statingyour reasons. In case of a legitimate complaint, the Library will make the material inaccessible and/or remove it from the website. Please Askthe Library: https://uba.uva.nl/en/contact, or a letter to: Library of the University of Amsterdam, Secretariat, Singel 425, 1012 WP Amsterdam,The Netherlands. You will be contacted as soon as possible.
Download date: 02 May 2020

Distribution and succession of vascular epiphytes in Colombian
Amazonia
Benavides, AM 2010. Distribution and succession of vascular epiphytes in
Colombian Amazonia
PhD dissertation, Universiteit van Amsterdam, The Netherlands.
The work presented in this thesis was mainly funded by a grant from the
High Level Scholarship Programme for Latin America (Programme Alban,
grant nr. E07D401309CO). Research was conducted at the Institute for
Biodiversity and Ecosystem Dynamics (IBED), Universiteit van
Amsterdam.
ISBN: 978-90-6464-434-4
Cover design: Danny Zurc - Geo+
Cover photograph: Peperomia serpens in Amacayacu National Park. AM
Benavides
Printed by: GVO printers & designers B.V. Ponsen & Looijen

Distribution and succession of vascular epiphytes in Colombian Amazonia
ACADEMISCH PROEFSCHRIFT
ter verkrijging van de graad van doctor
aan de Universiteit van Amsterdam
op gezag van de Rector Magnificus
prof. dr. D.C. van den Boom
ten overstaan van een door het college voor promoties
ingestelde commissie,
in het openbaar te verdedigen in de Agnietenkapel
op donderdag 25 november 2010, te 10.00 uur
door
Ana María Benavides Duque
geboren te Medellín, Colombia

Promotiecommissie
Promotor: Prof. dr. J.H.D. Wolf
Co-promotor: Dr. J.F. Duivenvoorden
Overige leden: Dr. T. van Andel Prof. dr. A.M. Cleef
Prof. dr. H. Hooghiemstra
Prof. dr. S.B.J. Menken
Prof. dr. P.H. van Tienderen
Prof. dr. G. Zotz
Faculteit der Natuurwetenschappen, Wiskunde en Informatica
CONTENTS
1. General introduction. Vascular epiphytes - salient
features and ecology
7
2. A first quantitative census of vascular epiphytes in rain
forests of Colombian Amazonia
19
3. Association of vascular epiphytes with landscape units
and phorophytes in humid lowland forests of
Colombian Amazonia
41
4. Recovery and succession of epiphytes in upper
Amazonian fallows
69
5. Gap recruitment of hemi -epiphytic aroids in lowland
Amazonian rain forest
93
6. Synthesis 117
Literature cited 125
Summary 153
Resumen 156
Samenvatting 160
Acknowledgements 165
Appendices 167
Curriculum Vitae 195

Introduction
8
GREEN PLANTS HAVE GREATLY DIVERSIFIED SINCE they first
appeared about one billion years ago (Bowman et al. 2007). At present,
green plants are one of the most conspicuous life forms on Earth. Whereas
most plant species have evolved to grow mechanically independent from
other plants, especially in wet tropical areas many vascular plant species
can be found that depend on other plants for support. These mechanically
dependent species belong to climbers, (half-) parasites, and epiphytes
(Schimper 1888; Ruinen 1953; Barkman 1958).
Epiphytes may be divided into holo-epiphytes, primary hemi-epiphytes,
and secondary hemi-epiphytes functional types (Kress 1986). Holo-
epiphytes never have root contact with the soil and hemi-epiphytes are
connected to the soil during part of their life-cycle at which stage they
resemble vines (i.e. herbaceous climbers). Primary hemi-epiphytes
germinate on other plants, usually trees, only to become terrestrially-rooted
through aerial roots. Secondary hemi-epiphytes germinate in the soil to lose
contact later in their life cycle, but some adventitious feeder roots may
maintain contact with the ground.
The epiphyte habit is a successful adaptation to conditions in the tropical
forest, judging from the large number of epiphyte species, the large number
of epiphyte individuals, and the great amount of epiphyte biomass in these
forests (Benzing 1990). In total there are an estimated 25000 species of
vascular epiphytes worldwide (Madison 1977; Kress 1986; Benzing 1990).
Over 70% of all epiphytes are orchids (sensu Madison 1977), followed by
Bromeliaceae, Araceae and Polypodiaceae. Worldwide and at a national
level (Peru, Guianas), epiphytes represent about 10% of the total vascular
plant diversity (Ibisch et al. 1996; Ek 1997). At the landscape level (> 100 ha)
or in small plots (< 1.0 ha) vascular epiphytes often represent up to ca. 30%
or 50% of all plant species, respectively (e.g. Gentry and Dodson 1987ab;

Chapter 1
9
Haber 2001; Schneider 2001). A single tree may support 195 species
(Catchpole 2004). For a more detailed overview of epiphyte inventories, see
Wolf and Flamenco-S. (2003).
Epiphytic biomass is greatest in high elevation mountain cloud forests
where epiphytic vegetation is dominated by bryophytes. Here, green
epiphyte and suspended soil dry weight may total more than a staggering
40 tons/ha (Hofstede et al. 1993). In most mountain forests, epiphyte
biomass is lower, typically not surpassing several tons/ha, and in lowland
rainforest epiphyte biomass is even lower (Edwards and Grubb 1977;
Nadkarni 1984ab; Hofstede et al. 1993; Köhler et al. 2007). For forests with
abundant epiphyte vegetation, the suggestion has been made that
epiphytes contribute significantly to ecosystem functions and to
microhabitat diversity on which a diverse fauna depends (Nadkarni 1984b;
Nadkarni and Matelson 1989; Veneklaas 1990; Nadkarni and Matelson
1992; Richardson 1999; Acebey et al. 2003; Holscher et al. 2004).
Epiphytes are adapted to life in the canopy by means of reproductive and
eco-physiological traits. The overall majority of epiphytic plants have
spores, dust-like or winged seeds, which are most likely dispersed by wind.
While most winged seeds tend to disperse within a few meters from the
parental plant, long-distance dispersal may also occur (Cascante-Marín et
al. 2006a). Distant wind-dispersal is probably most successful on dry windy
days (Horn et al. 2001), prevailing during the dry season in seasonal forests.
In aseasonal wet tropical lowland forests, however, such conditions are
relatively rare. Here many epiphytes have fruits adapted to animal
consumption, dispersed principally by frugivorous birds, bats and
monkeys (Kelly 1985; Barthlott et al. 2001; Vieira and Izar 1999).
Accordingly, Wolf and Flamenco-S. (2003) attribute the dominance of
zoochoric aroids in wet tropical lowland rain forests to continuously
climatic wetness in these forests.

Introduction
10
Besides seed dispersion, many epiphyte species show the ability to
propagate vegetatively. Asexual rhizomes, shoots or adventitious roots
may either develop short internodes that form massive clumps (ramets) or
long internodes. Long internodes allow an individual plant to forage for
essential resources, but also to multiply and disperse meristems into newly
available habitats (Ray 1988, 1990, 1992). Interestingly, hemi-epiphytic
aroid shoots may exhibit an abrupt shift from short to long internodes,
becoming flagellar. Flagellar shoots may have a more rapid growth than
non-flagellar stems. Flagellar shoots are not only formed by terrestrial
creeping stems but can also be produced by adult individuals, which are
already attached to a tree. This mechanism confers hemi-epiphytic aroids
the ability to rapidly become mobile, presumably in response to changes in
the environment (Ray 1992).
The establishment of epiphytes at new sites depends on characteristics
related to architectural traits and physico-chemical properties of the host
tree (phorophyte), among others (Frei and Dodson 1972; Hietz and Briones
1998; Merwin et al. 2003; Aguirre et al. 2010). As a rule, more holo-epiphyte
species, individuals and biomass are found on larger and older trees
(Zimmerman and Olmsted 1992; Hietz-Seifert et al. 1996; Zotz et al. 1999;
Dunn 2000; Hsu et al. 2002; Zotz and Vollrath 2003; Burns and Dawson
2005; Hietz 2005; Werner et al. 2005; Wolf 2005; Flores-Palacios and Garcia-
Franco 2006). The positive correlation with tree size relates to larger
sampling area, higher chances on settlement because of longer time spans,
larger habitat diversity, more surface area for colonization and seed
interception, and higher levels of factors that facilitate germination and
establishment such as organic soil accumulation and moisture (Zotz and
Vollrath 2003; Laube and Zotz 2006a). Nevertheless, tree size does not seem
to affect hemi-epiphyte establishment in the same way, since they are able
to colonize a wide range of phorophyte sizes by means of clasping leaves

Chapter 1
11
closely adpressed to the trunk or adventitious roots (Burns and Dawson
2005; Lozano Orihuela and Waechter 2010).
With respect to the eco-physiological adaptations of epiphytes it has been
noted that water supply is perhaps the most constraining factor for both
holo- and hemi-epiphytes (Andrade and Nobel 1997; Nieder et al. 2000;
Zotz and Hietz 2001). Although many holo-epiphytes exhibit morpho-
ecophysiological adaptations to water shortage, which is common in the
canopy (e.g. pseudobulbs, trichomes, velamen, succulence, phytotelm
morphology, CAM), their distribution is often limited to the more humid
zones within the phorophytes (Arevalo and Betancur 2004; Krömer et al.
2007; Martinez-Melendez et al. 2008; Reyes-García et al. 2008; Higuera and
Wolf 2010; Zhang et al. 2010). Hemi-epiphytes may experience difficulties
to reach the dryer, outer canopy of large trees because feeder roots have
hydraulic limitations to height (Fisher et al. 1997; Zotz et al. 1997; Lopez-
Portillo et al. 2000; Meyer and Zotz 2004).
Holo-epiphytes grow slowly and tend to have a long life span (Nadkarni
2000). For that reason, it is likely that substrate instability, due to tree- or
branch fall or detaching bark, is a major factor of mortality among holo-
epiphytes (Bennett 1986; Ibisch et al. 1996; Laube and Zotz 2006a; Zotz and
Schultz 2008). Other factors, such as herbivory of meristematic tissue can be
important, but have been scarcely studied (Schmidt 2000; Winkler et al.
2005; Cascante-Marín et al. 2009b).
SPATIAL DISTRIBUTION PATTERNS.—The distribution of epiphytes
amongst trees (horizontal) and within trees (vertical) depends on niche
differentiation (competition) and dispersal (Wolf and Zotz 2009). The
relative importance of both processes, known as demand ecology versus
supply ecology (Oksanen 1988) or niche assembly- versus dispersal
assembly perspective (Hubbell 1997), is still debated. For example, see the
Introduction
12
ongoing discussions around McArthur and Wilson‘s Island Biogeography
Theory and Hubbell‘s recent Neutral Theory of Biodiversity and
Biogeography that assume ecological (near-) equivalency and neutrality of
species in a given habitat (MacArthur and Wilson 1967; Hubbell 2001).
There is consensus that for epiphytes both perspectives play a role, but to
what extent remains unclear (Wolf 1994; Wolf 1995; Oliveira et al. 2009).
In the footsteps of the classical study by Pittendrigh (1948), epiphyte
distributional patterns have been explained by emphasizing species
adaptations to environmental gradients (Zotz 1997; Hietz et al. 2003; Zotz
2004; Reyes-García et al. 2008). Niche (vertical) segregation in epiphytes
appeared related to species-specific adaptations to the environmental and
structural conditions along a tree (Wolf 1994; Cardelus and Chazdon 2005;
Krömer et al. 2007). Other studies showed that certain epiphyte species
were more abundant at specific sites inside the forest, for example those of
high humidity (Sanford 1968; Sugden and Robins 1979; Flores-Palacios and
Garcia-Franco 2008). Similarly, certain epiphyte species in subtropical
forests and dry forests showed a non-random distribution over
phorophytes (Callaway et al. 2002; Munoz et al. 2003; Burns and Dawson
2005). On the other hand, ecologists who studied spatial patterns of
offspring and properties of the seed supply of epiphytes suggested that
dispersal assembly largely structured epiphyte communities (Bader et al.
2000; Van Dunné 2002a; Wolf 2005; Cascante-Marín et al. 2006a; Cascante-
Marín et al. 2009a).
One of the reasons for the ongoing discussion about the relative importance
of niche assembly versus dispersal assembly is that both processes lead to
spatial aggregation of species. As long as the ecology of epiphytes,
especially at the seedling stage, is poorly understood and few data are
available on the historical biogeography of sites, spatial aggregation may
therefore not simply be explained as the result of dispersal limitation and

Chapter 1
13
mass effect mechanisms (Schmida and Wilson 1985; Bennett 1986; Bader et
al. 2000; Van Dunné 2002b; Wolf 2005). To elucidate this point further, I
draw attention to one often studied but still elusive aspect of epiphyte
ecology: the preference of certain epiphytes or all epiphytes for certain
species of phorophytes or certain (large) individual trees. Since
phorophytes are not distributed randomly in the forest, such a preference
would lead to spatial aggregation of epiphytes. Presumably because of the
high diversity of trees in the tropical rain forests, few studies have
evaluated the phorophyte-epiphyte relationship in detail (Cardelus et al.
2006). In Panamanian rainforest, the distribution of 69-81% of the epiphyte
species on three abundant host trees was indistinguishable from random
(Laube and Zotz 2006b). These authors suggested that the other species did
have a positive or negative association with their hosts. In case of strong
host-preference or host-avoidance, we expect that in the Amazonian
lowland rain forest epiphyte species are closely associated to landscape
units such as floodplains, swamps and tierra firma, since these units have
characteristic phorophyte assemblages (Duivenvoorden and Lips 1993,
1995; Duivenvoorden and Duque 2010). On the other hand, if the epiphyte
distribution depends mostly on environmental factors such as forest
humidity and light conditions, epiphytes are also expected to be associated
with landscape units (Ter Steege and Cornelissen 1989; Leimbeck and
Balslev 2001). This example shows some of the pitfalls of correlative studies
on epiphyte distribution patterns.
TEMPORAL DISTRIBUTION PATTERNS.—The development of the
epiphyte community on tree- or branch segments over time depends on
species colonization rates, growth, survival and turnover rates. Holo-
epiphyte and primary hemi-epiphyte recruitment in newly available
habitats is characteristically low as it is limited by low and uncertain seed
supply or seedling establishment (Ackerman et al. 1996; Nadkarni 2000;
Introduction
14
Cascante-Marín 2006). In addition, many epiphytes require organic soil
accumulation for establishment, which especially at lower elevations is also
a slow process (Nadkarni 2000; Merwin et al. 2003). Secondary hemi-
epiphytes, however, germinate in the terrestrial soil and the successful
occupation of a host tree is therefore not hampered by slow and uncertain
seed recruitment on bark or on the presence of accumulated canopy soil.
After germination, secondary hemi-epiphytes are capable to colonize trees
by means of vegetative recruitment pathways (Schnitzer et al. 2008), which
can promote rapid tree colonization because of advantages such as higher
survival and growth rates (Lasso et al. 2009). Moreover, in secondary hemi-
epiphytes host tree colonization is not limited to young saplings since adult
plants may descend to the forest floor to forage for host trees as well,
potentially distributing ramets over several host trees.
Whereas the holo-epiphyte and primary hemi-epiphyte recruitment is
slow, the subsequent epiphyte turnover rate at a particular branch- or tree
segment is relatively rapid compared to woody terrestrial plants that have
much longer life cycles. Holo-epiphytic bromeliads in the outer canopy
may reproduce in only a few years, but inner canopy bromeliads tend to
grow slower and may take between 10 to 19 years to produce an
inflorescence (Hietz et al. 2002). Longevity in most species of
monocotyledons such as orchids and bromeliads is, moreover, enhanced
because they form adventitious roots that build long-living clumps of
ramets. The capacity to enhance the life-span of an individual plant
through ramets is also observed in many epiphytic dicotyledons, such as
Cactaceae and Piperaceae and in ferns.
Higher turnover rates of epiphyte species over time is a product of the
combination of niche filling mechanisms related to species-specific
adaptations to the environment and a high mortality, for example in
consequence of substrate instability (Hietz et al. 2002; Laube and Zotz

Chapter 1
15
2006a; Lopez-Villalobos et al. 2008). Studies in montane rain forests have
shown that during forest succession there is a shift from drought tolerant
epiphyte species to species that appear better adapted to a more humid
microclimate, particularly in the understory (Barthlott et al. 2001; Wolf
2005). Colonization patterns between holo- and hemi-epiphytes might
differ substantially, nevertheless. The increasing branch area of expanding
canopies in developing forest yields a continuous supply of newly
available substrate in the outer canopy for holo-epiphytes. Hemi-epiphytes,
however, are more restricted to the lower forest stratum, where over time
the availability of trunk surface area may increasingly limit their
establishment and growth.
AIM AND OUTLINE OF THIS THESIS
The innovation of rope-climbing and other canopy-access techniques such
as walkways, platforms, cranes and hot-air balloons to gain access to the
forest canopy resulted in a burgeoning of interest in canopy research (Perry
1984; Parker et al. 1992; Moffett 1993; Dial and Tobin 1994; Nadkarni and
Parker 1994; Laman 1995; Mitchell et al. 2002). However, epiphyte studies
have been greatly biased for holo-epiphytes, mountain forests, and
undisturbed forests. For example, as far as I know, no data are available on
the life-span or growth rate of hemi-epiphytes under field conditions. This
is surprising since in terms of biomass and number of individuals hemi-
epiphytes are comparable to or surpass holo-epiphytes in American wet
tropical lowland forest, the largest extension of tropical forest in the
Neotropics (Nieder et al. 2000; Leimbeck and Balslev 2001). Overall, there
are few epiphyte studies in the wet tropical lowland forests of Amazonia.
Wolf and Flamenco (2003) list a total of 47 Neotropical vascular epiphyte
inventories, and of those fewer than ten took place in the Amazon area.
Finally, in the tradition of the classical work on vascular epiphytes by
Schimper (1888), tropical epiphyte studies have focused on forests that are

Introduction
16
least disturbed by man (e.g. Went 1940; Johansson 1974; Benzing 1990). So
far, epiphytes in disturbed forests have attracted only limited attention,
with some exceptions (e.g. Turner et al. 1996; Barthlott et al. 2001; Krömer
and Gradstein 2003; Wolf 2005). Compared to trees, epiphytes appear
particularly vulnerable to disturbance of the forest, especially the shade-
epiphytes in the understory and inner canopy (e.g. Barthlott et al. 2001;
Wolf 2005; Cascante-Marín et al. 2006b). In tropical tree plantations and
recovering clear-cut forests, epiphyte immigration is a slow and spatially
heterogeneous process (Madison 1979; Catling et al. 1986; Barthlott et al.
2001; Merwin et al. 2003). More insight in the response of epiphytes to
anthropogenic disturbance is particularly needed to facilitate the
incorporation of the epiphytic component in sustainable forest
management.
The aim of this thesis is to study the distribution patterns of vascular
epiphytes in lowland rain forests of the Colombian Amazon, both in space
and time. Spatial distribution patterns were the subject of the first two
studies and the next two addressed time. These studies provide, for the
first time, quantitative information about the species diversity and
abundance of epiphytes in the lowlands of Colombian Amazonia.
Based on earlier studies about forest-landscape relationships
(Duivenvoorden and Lips 1995; Duque et al. 2001), Chapter 2 focussed on
the question how the epiphyte distribution differed between the main
landscape units (floodplains, swamps, well-drained uplands, and so-called
white sand areas) in the Metá area. Chapter 3 addressed how the epiphyte
distribution relates to the principal landscape units in a different area (the
Chiribiquete area, about 100 km NW of the Metá area). This study allows
an independent check to confirm the conclusions from Chapter 2.
Furthermore, in Chapter 3 holo-epiphytes and hemi-epiphytes are analysed
separately, to better understand the potential role of the soil substrate.

Chapter 1
17
Finally, the study in this chapter adds the phorophyte dimension to the
issue, because the epiphytes were sampled in the same forest plots where
the trees and lianas were sampled. This provided the opportunity to
examine how host-preferences might contribute to between-landscape
epiphyte assemblage building. Four questions were addressed in Chapter
3: (1) is the composition of epiphyte communities related to the
composition of phorophytes, (2) is this relationship perhaps due to the
strong link between tree species composition and landscapes found
previously in this same area (Duivenvoorden and Lips 1995; Duque et al.
2001), (3) do phorophytes still explain epiphyte species composition after
having controlled for the effect of landscape units, and vice versa, and (4) is
it possible to show that individual epiphyte species prefer certain
phorophyte species?
Temporal patterns of epiphyte distribution, studied in regenerating fallows
(2–30 yr old) and mature forest in the Amacayacu National Park and
Ticuna indigenous territory, were the subject of the next two chapters.
Expectedly, epiphyte species may differ in their response to the
environmental change which takes place as a consequence of forest
succession. Also, differential abilities to colonize new habitats in the
growing fallows may yield consistent and non-random patterns of epiphyte
species turnover along the chronosequence of the developing forest matrix.
Chapter 4 addressed the question if holo- and hemi-epiphyte species show
such non-random successional patterns. Chapter 5 is a direct follow-up of
that study. It focused on the question why hemi-epiphytic aroids show
such a quick recovery in young fallows. Fallows can be seen as a model of
tree fall gaps in natural forests. Therefore, Chapter 5 implicitly deals with
the issue of gap recruitment by hemi-epiphytes. Through descriptive and
experimental field studies, and concentrating on the differential role of
recruitment by seeds or clonal mechanisms the following questions were

Introduction
18
addressed: (1) what is the relative contribution of seed and vegetative
recruitment in the recovering aroid assemblages, (2) what is the speed of
stem displacement in the successional habitats, (3) do creeping stems of
aroids have a preferential growth direction, and (4) do early-successional
species show higher stem displacement rates than late-successional
species? Finally, Chapter 6 provides a synthesis highlighting the new
insights obtained from all studies.

A first quantitative census of vascular epiphytes
20
Abstract
Epiphytism in Colombian Amazonia was described by counting vascular
epiphytes in thirty 0.025-ha (5 x 50 m) plots, well-distributed over the main
landscape units in the middle Caquetá area of Colombian Amazonia. Each
plot was directly adjacent to a 0.1-ha plot at which the species composition
of trees and lianas (diameter at breast height (DBH) > 2.5 cm) had been
recorded 3 years earlier. The purpose of the study was to explore
abundance, diversity, and distribution of epiphytes between the principal
landscape units. A total of 6129 individual vascular epiphytes were
recorded belonging to 27 families, 73 genera, and 213 species (which
included 59 morpho-species). Araceae, Orchidaceae, and Bromeliaceae
were the most speciose and abundant families. A total of 2763 phorophytes
were registered, 1701 (62%) of which with DBH > 2.5 cm. About 40–60% of
the woody plants with DBH > 2.5 cm carried epiphytes, which points at
low phorophyte limitation throughout all landscapes. Epiphytism was
concentrated on stem bases. Just as trees, epiphyte species assemblages
were well associated with the main landscapes. Contrary to trees, however,
epiphyte abundance and diversity (species richness, Fisher‘s alpha index)
hardly differed between the landscapes. This calls for caution when
explanations for distribution and dynamics of tree species are extrapolated
to growth forms with a totally different ecology.
Key words: Detrended correspondence analysis, Hemi-epiphytes, Holo-
epiphytes, Landscape, Mantel test, Phorophyte
Chapter 2
21
INTRODUCTION
NORTHWESTERN AMAZONIA HAS BEEN RECOGNIZED as a region
with high tree diversity (Valencia et al. 1994), but also where the epiphyte
communities exhibit high abundance and diversity (Gentry and Dodson
1987b; Nieder et al. 2001). In the past decades, most studies carried out on
vascular plants have focused on the tree component, despite the fact that
the non-tree vegetation is responsible for a high percentage of the total
diversity in the tropical forests (Gentry and Dodson 1987a; Galeano et al.
1998; Schnitzer and Carson 2000).
Epiphytes are plants that inhabit a discontinuous and three-dimensional
landscape, directly in contact with the forest soil or not (Bennett 1986).
Patterns of distribution and floristic composition of epiphytic plants have
been related to factors of dispersal (Benzing 1986; Wolf 1993), humidity and
soils (Gentry and Dodson 1987b; Leimbeck and Balslev 2001), and
variability of structure, superficial area and inclination and size of branches
of host trees (phorophytes) (Nieder et al. 1999; Freiberg 1996, 2001).
Recently, in nearby rain forests of the Yasuní area, Leimbeck and Balslev
(2001) reported substantial differences in aroid epiphytism between
floodplains of the Tiputini River and surrounding uplands, suggesting a
strong role of phorophyte limitation in floodplain forests.
Here we make the first attempt to quantitatively describe vascular
epiphytism in Colombian Amazonia. We counted vascular epiphytes in
thirty 0.025-ha plots, well-distributed over the main landscape units in a
part of the basin of the middle Caquetá river (Fig. 2.1). Each plot was
directly adjacent to a 0.1-ha plot at which the species composition of trees
and lianas (diameter at breast height (DBH) ≥ 2.5 cm) had been recorded
three years earlier (Duque et al. 2001). The purpose of this paper is to
present these species data, while focusing on the question whether or not
A first quantitative census of vascular epiphytes
22
there is any difference in abundance, diversity, or distribution of epiphytes
between the principal landscape units in the Metá area.
STUDY SITE.—The study area comprised about 1000 km2 and was situated
along the middle stretch of the Caquetá river in Colombian Amazonia near
the mouth of the Metá river, roughly between 1°-2° S and 70°-73° W (Fig.
2.1). The principal landscape units found here were well-drained
floodplains, swampy areas (including permanently inundated back
swamps and basins in floodplains), areas covered with white-sand soils
(found on high terraces of the Caquetá river and in less dissected parts of
the Tertiary sedimentary plain), and well-drained uplands or terra firme
(never flooded by river water and including low and high fluvial terraces
of the Caquetá river and a Tertiary sedimentary plain)(Duivenvoorden and
Lips 1993; Lips and Duivenvoorden 2001). Soils were called well-drained
when they showed a FAO drainage class of 2 or higher, and poorly drained
when this class was below 2 (FAO 1977). The height of the studied forests
varied between 10-15 m (white sand areas), 15-25 m (well drained
floodplains and swamps), and 25-35 m (terra firme). Extensive forest
structural information is given in Duque et al. (2001). The area received a
mean annual precipitation of about 3060 mm (1979-1990) with a mean
monthly rainfall always above 100 mm (Duivenvoorden and Lips 1993).
Mean annual temperature was 25.7 °C (1980-1989) (Duivenvoorden and
Lips 1993).

Chapter 2
23
Figure 2.1. Location of the Metá area in Colombian Amazonia.
METHODS
Rectangular plots of 5 x 50 m were established directly contiguous to the
long side of previously established 20 x 50 m plots. These latter plots were
installed in each one of the above-mentioned landscape units, which had
been recognized on aerial photographs (Duivenvoorden 2001). During
walks through the forests, soils and terrain forms were rapidly described,
and the forest was visually examined. In this way, forest stands with more
or less homogeneous soils were identified. In these stands, plots were
located without bias with respect to floristic composition. Recent gaps due

A first quantitative census of vascular epiphytes
24
to fallen canopy trees were avoided. All plots were established in mature
forests that did not show signs of recent human intervention, at a minimum
distance of 500 m between plots (Fig. 2.1). Plots were mapped with GPS. In
1997 and 1998, the density and species composition of lianas and trees with
DBH ≥ 2.5 cm (DBH = diameter at breast height) were recorded in these
0.1-ha plots (Duque et al. 2001, 2002). During a new fieldwork from March
to June 2000, the adjacent 0.025-ha plots were censused for epiphytism. The
5 x 50 m plots were subdivided into subplots of 5 x 10 m, in which all
vascular epiphytes occurring on trees and lianas with a stem basis inside
the plot area were recorded.
Field collection of epiphytes was done with the help of indigenous
climbers. Binoculars were used to examine epiphyte individuals occurring
in distant crowns. With the help of poles, crowns were surveyed and all
observed individual epiphyte plants were collected. For each epiphyte
plant, the position above ground (in the case of hemi-epiphytes the
maximum height was considered), and position on the phorophyte (main
stem or branches) were recorded. Three plant positions were considered:
(1) base: individuals found at or below 3 m above ground level; (2) stem:
individuals found above 3 m and below the first branch; (3) branches or
crowns: individuals found on stems or branches in crowns.
For each phorophyte, the following variables were recorded: (1) DBH (from
phorophytes with height lower than 1.3 m the stem diameter was recorded
at half of the total height). (2) Total height and height of first branch,
measured or estimated by means of poles of 8 meters length. For trees, we
calculated the conical superficial area of the phorophyte stems as 3.14 times
the product of the stem radius and the height of the first branch (if there
were no branches, the total height was employed).

Chapter 2
25
All species in each plot were collected applying vouchers numbered AMB
100-1300. Species identification took place at the Herbario Universidad de
Antioquia (HUA), Herbario Amazónico Colombiano (COAH), and
Herbario Nacional Colombiano (COL), by means of taxonomic keys,
comparison with herbarium collections, and consultations of specialists.
The nomenclature of families follows Cronquist (1988) for angiosperms and
Tryon and Tryon (1982) for pteridophytes. Within families or groups of
closely allied families, specimens that could not be identified as species
because of a lack of sufficient diagnostic characteristics, were clustered into
morpho-species on the basis of simultaneous morphological comparisons
with all other specimens.
In this study, the term epiphyte is used, in a broad sense, for plants that
spend most of their life cycle attached to other plants (Benzing 1987). Only
those epiphyte individuals that were in contact with the forest soil were
recorded as hemi-epiphyte. All other epiphytes individuals were recorded
as holo-epiphyte. Clones from rhizomatous plants were considered as one
individual.
NUMERICAL ANALYSIS.—To calculate the diversity, Fisher‘s alpha index
was employed (Fisher et al. 1943, Condit et al. 1996). Differences of
diversity, species richness, epiphyte abundance, and superficial area of the
phorophytes between the landscapes were analyzed by ANOVA and
subsequent Tukey-Kramer tests. The condition of normal distribution of
residuals was checked by means of Shapiro-Wilk tests. The analyses were
developed using JMP 3.2.2 (SAS 1994).
Patterns of epiphyte species composition were explored by Detrended
Correspondence Analysis (DCA, Hill 1979) in CANOCO version 4 (ter
Braak and Smilauer 1998), applying plot data of abundance and presence-
absence. Correlations between epiphyte species, trees and liana species in

26
the adjacent plots, and the spatial position of the plots, were analyzed by
Mantel and partial Mantel tests (Legendre and Legendre 1998), applying R-
package for Macintosh (Casgrain and Legendre 2002). The floristic
similarity matrices were constructed on the basis of the abundance data
using the Steinhaus index. A Euclidean distance matrix was calculated
using the geographical coordinates of the plots (Legendre and Legendre
1998). The significance of the Mantel r coefficient was tested by means of
10000 permutations.
RESULTS
A total of 6129 individual vascular epiphytes were recorded in the 30 plots
of 0.025 ha each. Precisely 1200 botanical collections were made pertaining
to 27 families, 74 genera, and 213 species (which included 59 morpho-
species). A total of 141 species (66%) were found in more than one plot and
just 17 species (8%) represented 50% of the total number of individuals
registered. Many species (78) were found both as hemi-epiphyte and holo-
epiphyte. Most species (107), however, were strictly holo-epiphytic, while
28 species were always hemi-epiphytic.
Araceae, Orchidaceae, and Bromeliaceae were the most speciose and
abundant families (see Appendix 2.1 and Fig. 2.2A). Of these, Araceae was
the most diverse family in all landscape units. Two genera of Araceae,
Philodendron and Anthurium, had the highest species richness (Fig. 2.2B).
There were 117 monocotyledonous species (5 families, 36 genera), 45
species of pteridophytes (12 families, 20 genera), and 49 dicotyledonous
species (10 families, 18 genera). Five species were found in all landscape
units: Aechmea nivea (Bromeliaceae), Asplenium serratum (Aspleniaceae),
Codonanthe crassifolia (Gesneriaceae), Anthurium ernestii (Araceae), and
Philodendron linnaei (Araceae). Trichomanes ankersii (Hymenophyllaceae)
was the most abundant species, being present mainly in upland forests.
A first quantitative census of vascular epiphytes

27
Figure 2.2. Number of epiphytic species species and individuals belonging to the most speciose families and genera in
30 well distributed 0.025-ha plots, in the principal landscape units of the Metá area in Colombian Amazonia. A. Species
richness and abundance of the most speciose epiphytic families. B. Species richness and abundance of the most
speciose epiphytic genera.

28
A total number of 2763 phorophytes were registered, 1701 (62%) of which
with DBH ≥ 2.5 cm. On average, one phorophyte carried 2.2 (Standard
Deviation = 1.9) epiphyte individuals and 1.8 (SD = 1.2) epiphyte species.
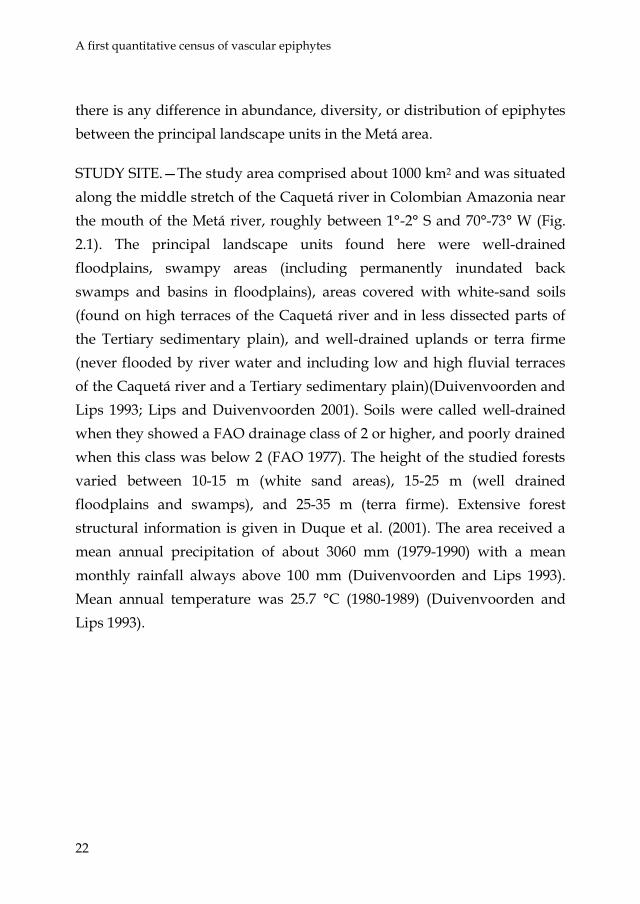
Based on the density of trees and lianas in the adjacent 0.1-ha plots (Duque
et al. 2001) about 40-60% of the woody plants with DBH ≥ 2.5 cm carried
epiphytes, and about 50-85% in case of DBH ≥ 5 cm (Table 2.1).
Many (44-60%) epiphyte individuals were found 0-3 m above the ground,
and far less (4-12%) were in the crowns or on the branches, throughout all
landscape units (Table 2.2). Stem bases also carried the highest number of
epiphyte species, but differences with the upper parts of the phorophytes
were less pronounced (Table 2.2). Thus, on a species-to-individual basis,
epiphyte diversity was highest in the crown/branches, and lowest on the
stem bases.
Epiphyte species richness, abundance of epiphytes, phorophyte density,
and superficial area did not differ between landscapes (Table 2.3). Epiphyte
diversity (Fisher's alpha index) showed a slight difference between
landscapes, mostly due to high values in some plots on the low terrace
compared to those in the white-sand areas and the Tertiary sedimentary
plain.
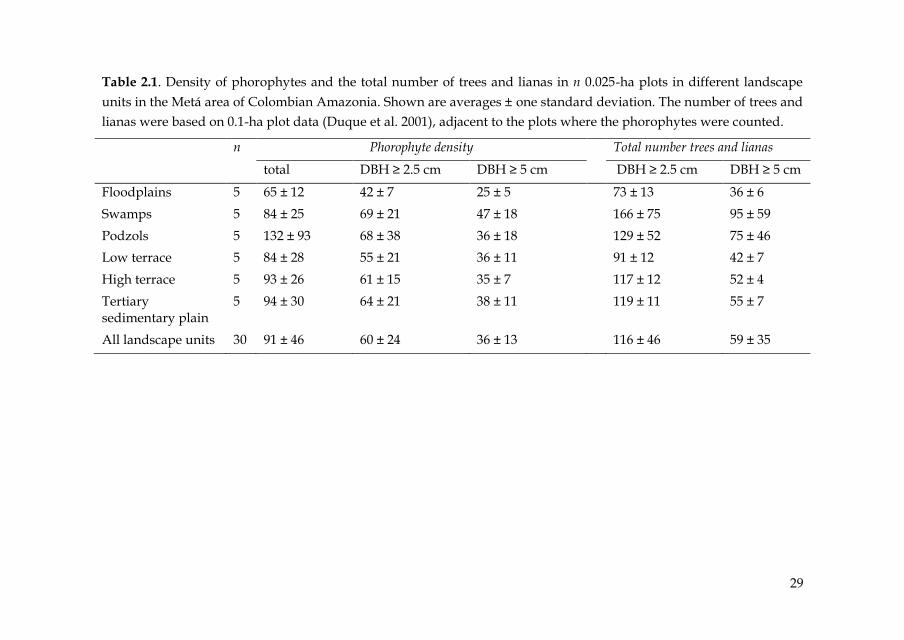
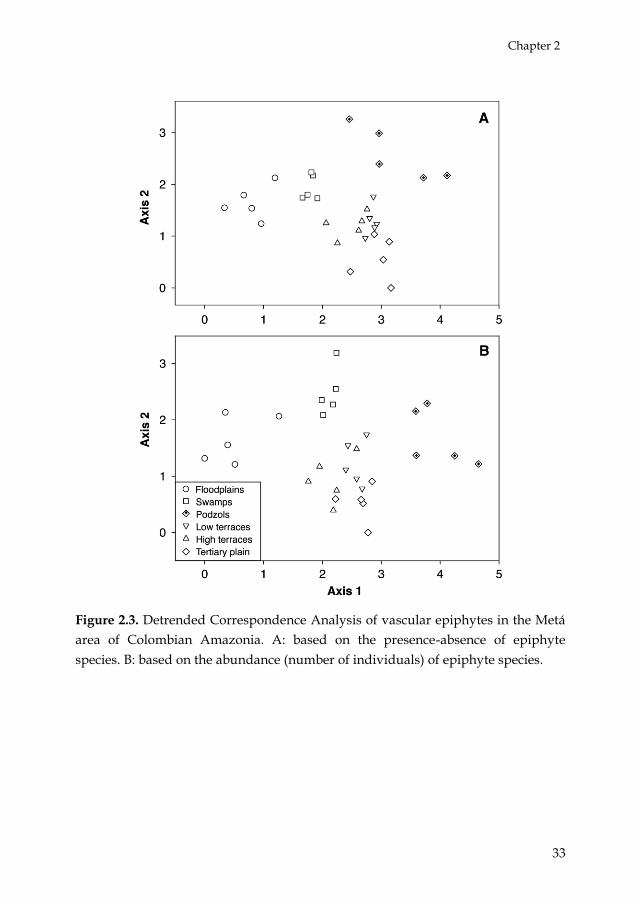
The DCA diagrams showed how the recorded epiphyte species
assemblages tended to be associated with the landscape units (Table 2.4,
Figs 2.3AB). According to the Mantel test, the epiphytic floristic
composition varied independently of the distance between the plots (Table
2.5). On the other hand, the floristic composition of epiphyte species and
that of trees and lianas with DBH ≥ 2.5 cm in the adjacent 0.1-ha plots
(Duque et al. 2001) was strongly correlated (r = 0.7). This high correlation
remained after controlling for the geographic distance between the plots by
means of a partial Mantel test (Table 2.5).
A first quantitative census of vascular epiphytes
29
Table 2.1. Density of phorophytes and the total number of trees and lianas in n 0.025-ha plots in different landscape
units in the Metá area of Colombian Amazonia. Shown are averages ± one standard deviation. The number of trees and
lianas were based on 0.1-ha plot data (Duque et al. 2001), adjacent to the plots where the phorophytes were counted.
n Phorophyte density Total number trees and lianas
total DBH ≥ 2.5 cm DBH ≥ 5 cm DBH ≥ 2.5 cm DBH ≥ 5 cm
Floodplains 5 65 ± 12 42 ± 7 25 ± 5 73 ± 13 36 ± 6
Swamps 5 84 ± 25 69 ± 21 47 ± 18 166 ± 75 95 ± 59
Podzols 5 132 ± 93 68 ± 38 36 ± 18 129 ± 52 75 ± 46
Low terrace 5 84 ± 28 55 ± 21 36 ± 11 91 ± 12 42 ± 7
High terrace 5 93 ± 26 61 ± 15 35 ± 7 117 ± 12 52 ± 4
Tertiary sedimentary plain
5 94 ± 30 64 ± 21 38 ± 11 119 ± 11 55 ± 7
All landscape units 30 91 ± 46 60 ± 24 36 ± 13 116 ± 46 59 ± 35

30
Table 2.2. Abundance (number of individuals) and species richness of epiphytes in three positions in the forest, as
recorded on phorophyte present in five 0.025-ha plots in different landscape units of the Metá area in Colombian
Amazonia. Shown are averages ± one standard deviation.
Floodplains Swamps Podzols Low terrace High terrace Tertiary Total
Abundance
Base 81.8 ± 21.1 127 ± 107.5 281 ± 251.4 108 ± 50.0 103 ± 37.9 103 ± 61.1 123 ±104.2
Stem 42.4 ± 13.8 78 ± 25.9 347 ± 34.0 63.8 ± 42.6 79 ± 43.6 47.6 ± 33.5 59.2 ± 34.8
Crowns/ branches 19.6 ± 6.5 25.4 ± 19.8 12 ± 1.4 25.6 ± 6.0 24.2 ± 11.4 20.2 ± 14.2 22.1 ± 11.7
Species richness
Base 15.6 ± 3.6 20.8 ± 8.8 22.7 ± 7.0 25.4 ± 6.6 20.4 ± 8.7 13.2 ± 5.5 19.4 ± 7.5
Stem 15.2 ± 4.3 19.4 ± 6.4 11 ± 4.4 21.4 ± 6.3 20.4 ± 6.8 14.4 ± 6.3 17.3 ± 6.4
Crowns/ branches 11 ± 2.5 10.4 ± 7.2 7 ± 1.4 14.4 ± 2.3 11.2 ± 1.9 11 ± 4.5 11.2 ± 4.1

31
Table 2.3. Species richness, abundance (number of individuals), and diversity (Fisher‘s Alpha index) of epiphytes
found on phorophytes in n 0.025-ha plots in different landscape units of the Metá area in Colombian Amazonia.
Floodplains
(n = 5)
Swamps
(n = 5)
Podzols
(n = 5)
Low terrace (n = 5)
High terrace
(n = 5)
Tertiary
sedimentary
plain (n = 5)
All
landscapes
(n = 30)
ANOVA F
(df = 4) Species richness 25 ± 7 32 ± 10 29 ± 7 36 ± 7 32 ± 10 23 ± 7 29 ± 9 2.1
Number of individuals
143 ± 33 230 ± 107 278 ± 214 197 ± 96 206 ± 81 170 ± 92 204 ± 115 0.8
Fisher‘s Alpha index
9.3 ± 3.1ab 16.1 ± 13.8ab 9.6 ± 2.7a 13.2 ± 1.1b 10.6 ± 4.3ab 7.6 ± 2.3a 11 ± 6.4 3.4*
Number of phorophytes
65 ± 13 84 ± 28 132 ± 93 84 ± 32 93 ± 29 94 ± 33 92 ± 46 1.2
Superficial area (m2) 59.7 ± 19 71.2 ± 29.3 57 ± 26 68.6 ± 26 76.2 ± 22 89.3 ± 23 70.3 ± 24.1 1.2
Also shown are the number and the superficial area of the phorophytes in these plots. Figures present averages ± one
standard deviation. The right column gives the F values of the ANOVA between landscape units (ns = non significant;
* 0.05 > P > 0.01). The letter codes (a), (ab), (b) indicate the result of the Tukey-Kramer post-hoc test of difference
between landscape units.

32
Table 2.4. Summary information of Detrended Correspondence Analyses (DCA), based on vascular epiphyte species
composition in thirty 0.025-ha plots.
Axis 1 Axis 2 Axis 3 Axis 4 Total inertia
A: Presence-absence data
Eigenvalues 0.45 0.28 0.17 0.12 4.23
Length of gradient (SD units) 4.1 3.3 2.8 2.2
B: Abundance data
Eigenvalues 0.54 0.27 0.16 0.12 4.78
Length of gradient (SD units) 4.7 3.2 2.3 1.9
Chapter 2
33
Figure 2.3. Detrended Correspondence Analysis of vascular epiphytes in the Metá
area of Colombian Amazonia. A: based on the presence-absence of epiphyte
species. B: based on the abundance (number of individuals) of epiphyte species.

A first quantitative census of vascular epiphytes
34
Table 2.5. Mantel and partial Mantel test results of vascular epiphyte species
against species of trees and lianas, and geographic distance (space) in the Metá
area of Colombian Amazonia. Matrix A is composed of Steinhaus similarity
coefficients between epiphytic species data from thirty 0.025-ha plots. Trees is the
matrix composed of Steinhaus similarity coefficients between species data of trees
and lianas (DBH ≥ 2.5 cm) from thirty 0.1-ha plots, each directly adjacent to the
0.025-ha plots where epiphytes were recorded. Space is the matrix composed of
Euclidean distances between plots. Mantel r is the Mantel correlation coefficient
between matrix A and matrix B. Partial Mantel r is the Mantel correlation between
matrix A and matrix B when the effect of matrix C is removed.
Mantel r Partial Mantel r
Probability
Matrix A = All vascular epiphytic species
Matrix B
Trees 0.7 0.0001
Space - 0.05 0.18
Matrix B Matrix C
Trees Space 0.7 0.0001
Space Trees -0.02 0.33
DISCUSSION
THE SPECIES BELONGING TO THE MOST speciose families in this study
were more similar to those reported for wet and moist forests in lowlands
(Gentry and Dodson 1987b; Foster 1990; Balslev et al. 1998), than those
located in drier forests where the aroid component decreased, and
Orchidaceae and Pteridophytes increased (Wolf and Flamenco-S. 2003).
Three of the most speciose families (Araceae, Orchidaceae, and
Bromeliaceae) have been reported within the most abundant and diverse
families in other studies that included epiphytes as well (Gentry and
Dodson 1987b; Balslev et al. 1998; Galeano et al. 1998).
The recorded number of epiphyte species is within the range of other
reports from Neotropical forests (Gentry and Dodson 1987b) and among

Chapter 2
35
the highest for the Amazonian region (Gentry and Dodson 1987b; Prance
1990; Balslev et al. 1998; Carlsen 2000; Nieder et al. 2000). Our total of 213
vascular epiphyte species comprised 14% of the species of trees and lianas
(DBH ≥ 2.5 cm) found in the adjacent plots. In the same area,
Duivenvoorden (1994) found that hemi-epiphytes represented about 5% of
the vascular plant species, but he reported undersampling of the upper
stems and crowns of high trees. All these figures remain well below the
estimates of studies in western Ecuador and Costa Rica where between 25
and 35% of vascular species in small plots pertained to epiphytes
(Whitmore et al. 1985; Gentry and Dodson 1987ab).
Recording epiphytes in forest canopies with binoculars is common practice
(e.g. Leimbeck and Balslev 2001). However, even though much care has
been taken to observe and sample the epiphytes by climbing into tree
crowns, it remains possible that small epiphyte plants have been missed in
our study, especially in high trees of floodplains, swamps and terra firme,
accounting partially for the high density and species richness of epiphytes
at the stem basis. Only by more intensive sampling, for example including
careful destructive felling of all branches, an exhaustive census of epiphyte
diversity in tree crowns can be made. To test if the branches and crowns
might have been undersampled, we cut down 30 trees with a DBH between
20 cm and 30 cm well outside the plot areas but close to each plot. Each of
these trees had a visually defined large epiphyte load along the stem and in
the crown. Contrary to our expectations, the analyses of these data, which
are still in a preliminary stage of species identification and therefore not
shown here, did not reveal significant differences in the number of
epiphyte individuals and epiphyte species in branches and crowns
compared to the phorophytes in similar diameter-class sampled in the
plots.

A first quantitative census of vascular epiphytes
36
About 4 to 6 out of every 10 woody plants (DBH ≥ 2.5 cm) and 5 to 8 out of
every 10 woody plant with DBH ≥ 5 cm carried epiphytes, suggesting that
epiphytes fail to effectively colonize a substantial number of potential
phorophytes in the Metá area. Leimbeck and Balslev (2001), in floodplains
of nearby Yasuní, found that 98% of the trees with DBH ≥ 5 cm carried
aroid epiphytes. These authors hypothesized that aroid epiphytes
experienced limitation for phorophytes in floodplains. Their floodplain
saturation percentage of 98% corresponded to about 25 phorophytes with
aroid epiphytes per 0.025 ha when based on the tree density (DBH ≥ 5 cm)
of 1012/ha reported by these authors. In the five floodplain plots of the
Metá area, the average number of phorophytes with aroid epiphytes was
21/0.025 ha, corresponding to 58% of the trees and lianas with DBH ≥ 5 cm.
So, on a plot area basis, the forests of the floodplain of the Caquetá River
contained 16% less phorophytes covered with aroid epiphytes, and their
phorophyte saturation level for aroids was about 40% lower than in Yasuní.
It seems unlikely, in this light, that the aroid epiphytes in the Metá
experience phorophyte limitation to the same degree as might take place in
Yasuní floodplains. For the transition and upland areas in Yasuní, about 31
and 32 phorophytes with aroids were found in sample areas of 0.025 ha,
which corresponded to 82-86% of the total tree density (DBH ≥ 5 cm). In the
three terra firme units this average number ranged between 14/0.025 ha
and 29/0.025 ha, corresponding to 26-70% of the tree and liana density
(DBH ≥ 5 cm). This comparison suggests that a lower number of trees and
lianas are covered by aroid epiphytes in upland forests of the Metá area
compared to Yasuní, and that the saturation level and phorophyte
limitation is comparatively low too, just as in the floodplains. Overall
climate and humidity levels of the Yasuní area and Metá areas hardly differ
(Lips and Duivenvoorden 2001). Yasuní forests might be subjected to a
greater immigration of aroid epiphytes from the surrounding forests,
Chapter 2
37
especially from the nearby Andes, compared to the Caquetá area. The
Andes have been mentioned as a rich centre of diversity for aroid epiphytes
(Gentry 1982).
In the Metá area, epiphytes showed a more or less similar abundance and
species diversity in all landscapes. This is remarkably different from trees,
which show a well-documented gradient in species diversity from swamps
and podzols to well drained floodplains and well-drained uplands
(Duivenvoorden 1996; Duque et al 2001). Why might landscape factors not
affect epiphyte diversity in the same way as they do for trees? Epiphytes in
upper canopies in all lowland forests are generally subjected to high
temperatures and low levels of air humidity (ter Steege and Cornelissen
1989), leading to energetic losses by tissue respiration and water balance
stress (Andrade and Nobel 1997; Zotz and Andrade 1997). In forest
understories stress factors differ between forest types. In the understory of
tall forests, air humidity tends to be higher and more constant but light
availability and associated rates of carbon fixation lower (Kessler 2002). In
the understory of low forests, light penetration in understory is higher, but
temperature and drought are also higher leading to less favorable growth
conditions for epiphytes. Therefore, the epiphytes in both high and low
forests in the various landscape units might experience a more or less
similar net degree of stress. Secondly, epiphytes are claimed to have a high
dispersal ability (Benzing 1987; Nieder et al. 1999), which would allow a
more rapid colonization reducing possible effects of forest development on
epiphyte species diversity. This explanation, however, seems only valid for
epiphytes occurring in upper canopy crowns, but not for understory
environments where dispersal by wind is less effective. High epiphyte
dispersal ability should lead to a wide distribution of many epiphyte
species in all landscapes, which is not in correspondence to the high
epiphyte-landscape association recorded in the Metá area.

A first quantitative census of vascular epiphytes
38
Epiphyte species compositional patterns were well related to the principal
landscape units (Figs 2.3AB and Table 2.4). In view of the dominance of
epiphytes in the understory this is hardly a surprise. The floodplain and
swamp plots are subjected to an annual inundation by the Caquetá River,
during which water levels may rise several meters above the forest soil.
This, plus the closer proximity of river and swamp water during periods of
low river water levels likely produce a higher humidity (including mist in
early mornings), at annual and daily time-scale, compared to upland
conditions. Yearly sedimentation of silty deposits, which are partially of
Andean origin, makes the rooting environment at the trunk bases more
fertile than in upland forests. Leimbeck and Balslev (2001) further
mentioned enhanced vegetation reproduction due to mechanical damage
or separation of plant parts into ramets when submerged. The lower stand
height and simpler structure of white-sand forests might induce less habitat
diversity, as well as better light penetration and wider daily amplitude in
temperature and humidity in the understory environment, compared to the
generally taller forests in the other landscape units.
Contrary to trees, landscape patterns of species diversity and species
composition for epiphytes are uncoupled. In conclusion, we hypothesize
that some epiphyte species are more favoured by high humidity
(floodplains and swamps), or are better adapted to withstand drought (in
low podzol forests) than others without leading to competitive exclusion as
this latter process is effectively counterbalanced by immigration from
regional pools in situations of low phorophyte limitation. We need more
explorative studies, and additional studies on the dispersal ability and
autobiology of epiphytic taxa and the dynamics of epiphyte populations
(Benzing 1995; Nieder and Zotz 1998). Our results suggest that caution is
needed when knowledge of tree species distribution and dynamics are

Chapter 2
39
extrapolated to growth forms with a totally different ecology and vice
versa.
ACKNOWLEDGEMENTS
The authors are thankful to members of the Miraña community and to the
herbaria of the Missouri Botanical Garden, Herbario Universidad de
Antioquia (HUA), Herbario Amazonico Colombiano (COAH), and the
Herbario Nacional Colombiano (COL). Comments on the manuscript of Jan
Wolf and two anonymous reviewers were gratefully included. This study
was partially financed by the European Commission (ERB IC18 CT960038),
Tropenbos-Colombia, Colciencias, the Schure-Beijerinck-Popping Fonds
(KNAW) and the Netherlands Foundation for the Advancement of Tropical
Research–WOTRO (WB85-335).

40


Association of vascular epiphytes with landscape units and phorophytes
42
Abstract
The species composition of vascular epiphytes and phorophytes (trees and
lianas) was studied in ten 0.1-ha forest plots distributed over three
landscape units (floodplains, swamps and well-drained uplands) in
Colombian Amazonia. The aim was to analyze how host-preferences
contributed to the patterns in epiphyte assemblages among the landscape
units. In the plots 82 species (3310 plants) were holo-epiphytes, 11 species
were primary hemi-epiphytes (179 plants), and 61 were secondary hemi-
epiphytes (2337 plants). A total of 411 species of tree and liana were
recorded as phorophytes. Detrended Correspondence Analysis and Mantel
tests showed that the species composition of holo-epiphytes and secondary
hemi-epiphytes differed among the landscape units. For both groups the
effect of landscape unit on species composition strongly decreased after
controlling for the phorophyte composition in the plots. The phorophyte
composition significantly explained epiphyte composition and this effect
was not removed after accounting for the effect of landscape unit. At the
level of individual species, randomization tests yielded only few significant
epiphyte-phorophyte associations. For 84% of the epiphyte species the
average indicator of patchiness was below 1.5 demonstrating that most
epiphyte individuals occurred scattered over different phorophytes. This
probably hampered the analyses of host preferences for individual
epiphyte species.
Key words: Araceae, Detrended Correspondence Analysis, hemi-epiphyte,
holo-epiphyte, host-preference, Mantel test, randomization

Chapter 3
43
INTRODUCTION
EPIPHYTE ASSEMBLAGE IN TROPICAL FORESTS is driven by dispersal
and colonization processes (Cascante-Marin et al. 2009a; Engwald et al. 2000;
Nieder et al. 2001; Van Dunné 2001; Wolf 1993), and by niche-filling
mechanisms related to species-specific adaptations to the environment
(Griffiths & Smith 1983; Reyes-García et al. 2008). The features of the
phorophytes, i.e. the plants that carry the epiphytes (in tropical forests
mostly trees and lianas) play a crucial role. This includes the age, size,
architecture, bark type, and leaf characteristics of phorophytes (Benzing
1990; Reyes-García et al. 2008). Because of the high tree diversity, few
studies have endeavoured to test how phorophyte species identity in
lowland rain forests might influence epiphyte distribution (Benavides et al.
2005; Cardelus et al. 2006). Laube & Zotz (2006b) reported that the
distribution of 69-81% of the epiphyte species on three abundant host trees
in Panama was indistinguishable from random. The first regional survey of vascular epiphytes in Colombian Amazonia
(Benavides et al. 2005) found a strong association of epiphyte composition
with the principal landscape units (floodplains, swamps, white sands and
three well-drained upland units). These patterns were mainly explained by
differences in humidity and soil nutrient availability related to seasonal
flooding in the floodplains and permanent inundation in swamps. In their
analyses Benavides et al. (2005) did not differentiate between holo-
epiphytes and hemi-epiphytes. Holo-epiphytes fully depend on the
availability of phorophyte surface for establishment and growth, whereas
hemi-epiphytes root in the terrestrial soil at some point in their life cycle
(Benzing 1986, 1987; Kreft et al. 2004). Because terrestrial soils are irrelevant
as rooting substrate for holo-epiphytes, direct effects of flooding or soil
drainage on the distribution or diversity of holo-epiphytes cannot be
expected. Therefore, differences in species composition and diversity

Association of vascular epiphytes with landscape units and phorophytes
44
between landscape units are probably more pronounced for hemi-
epiphytes than for holo-epiphytes. However, in case of strong host-
preferences (Benzing 1990), landscape units and the species composition of
holo-epiphytes might still be correlated as a consequence of the fact that the
distribution of the phorophyte species strongly relates to landscape units
(Duivenvoorden & Duque 2010).
The aim of this study was to examine how host-preferences contribute to
the distribution of epiphyte assemblages over different landscape units in
lowland Amazonia. We hypothesized that epiphyte composition and
landscape units are associated (based on Benavides et al. 2005), but that the
composition and diversity of hemi-epiphyte species differ more strongly
between landscape units than those of holo-epiphytes. Furthermore, we
hypothesized that the epiphyte species composition is related to the
phorophyte species composition, and that this phorophyte effect would
partially explain the differences between the landscape units, especially
regarding holo-epiphytes.
METHODS
STUDY SITE.—Fieldwork was carried out between August and September
2001 in Chiribiquete National Park in the northwestern part of Colombian
Amazonia (Figure 3.1). The area has a yearly precipitation of 3000-3800 mm
(Duivenvoorden & Lips 1995; Peñuela & von Hildebrand 1999). The
principal landscape units found in the forest area are swamps, where soils
are poorly drained; floodplains, where soils are moderately well- to well-
drained and are seasonally flooded by river water; and uplands, where
soils are moderately well- to well-drained and which are situated outside
the floodplains. The composition of the vascular plant species (herbs and
other plants > 1 m height) varied according to landscape unit (Duque et al.
2005).
Chapter 3
45
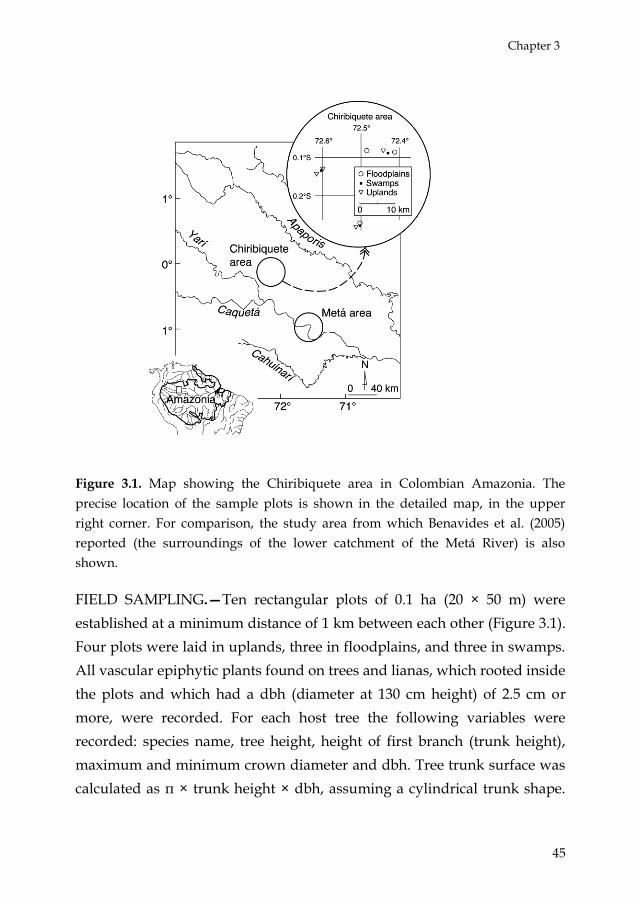
Figure 3.1. Map showing the Chiribiquete area in Colombian Amazonia. The
precise location of the sample plots is shown in the detailed map, in the upper
right corner. For comparison, the study area from which Benavides et al. (2005)
reported (the surroundings of the lower catchment of the Metá River) is also
shown.
FIELD SAMPLING.—Ten rectangular plots of 0.1 ha (20 × 50 m) were
established at a minimum distance of 1 km between each other (Figure 3.1).
Four plots were laid in uplands, three in floodplains, and three in swamps.
All vascular epiphytic plants found on trees and lianas, which rooted inside
the plots and which had a dbh (diameter at 130 cm height) of 2.5 cm or
more, were recorded. For each host tree the following variables were
recorded: species name, tree height, height of first branch (trunk height),
maximum and minimum crown diameter and dbh. Tree trunk surface was
calculated as π × trunk height × dbh, assuming a cylindrical trunk shape.

Association of vascular epiphytes with landscape units and phorophytes
46
Tree crown volume was calculated as π × crown area (the elliptic projection
of the crown on the ground) × crown height (total height minus trunk
height), assuming that crowns had the shape of an elliptic cylinder. For
each epiphyte, growth habit, position above ground (in the case of hemi-
epiphytes the maximum height was considered), and position on the
phorophyte (main trunk or crown) were recorded. The field survey was
done with the help of indigenous climbers. Binoculars were used to detect
epiphyte individuals occurring on distant branches. All observed plants
were dislodged using pole tree pruners. Clonal plants were counted as
single individuals only when there was certainty that these belonged to a
distinct genet, for example by their spatial separation from other epiphyte
stands (Galeano et al. 1998; Sanford 1968). Plant collections were made for
all host and epiphyte species found in each plot. Species identification took
place at the Herbario Amazónico Colombiano (COAH), Herbario Nacional
Colombiano (COL), Herbario Universidad de Antioquia (HUA), and at the
Missouri Botanical Garden (MO). A complete collection of all vouchers was
deposited at HUA, with duplicates at COL, COAH, MO, and NY. In this
study, the term epiphyte is used in a broad sense; epiphyte growth habit is
clarified when necessary. Holo-epiphyte and hemi-epiphyte growth habits
were defined following Moffett (2000), on the basis of field observations
and species descriptions in literature and herbarium collections. Hemi-
epiphytes include primary and secondary hemi-epiphytes. Primary hemi-
epiphytes germinate on phorophytes and become terrestrially rooted
through aerial roots. In contrast, secondary hemi-epiphytes germinate in
the terrestrial soil but lose contact with this soil later in their life cycle.
NUMERICAL ANALYSIS.—ANOVA was carried out to analyze, among
plot means, the differences in species richness, Fisher‘s alpha index (Condit
et al. 1996; Fisher et al. 1943), and number of epiphyte individuals among
landscape units. Species richness, stem density and occupancy of
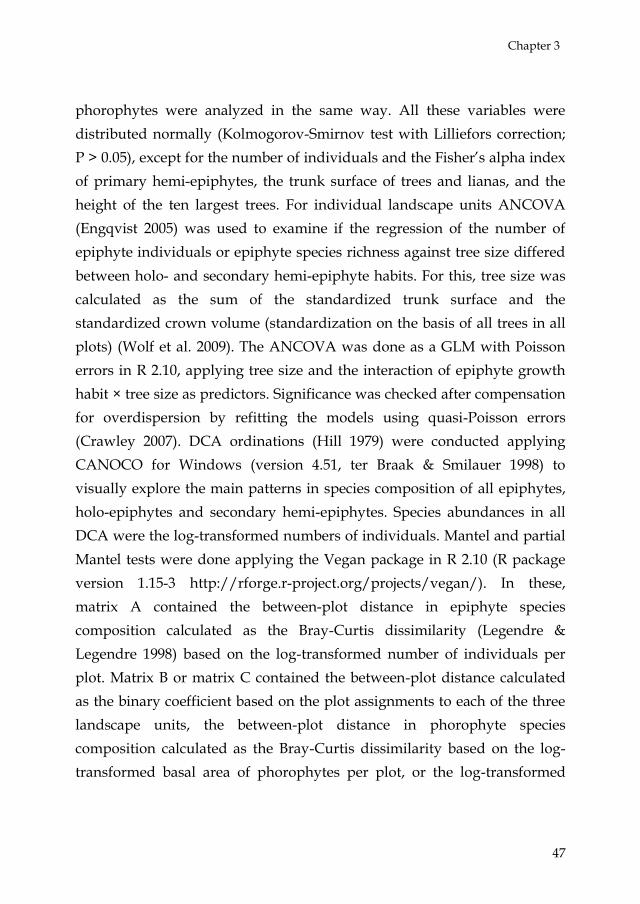
Chapter 3
47
phorophytes were analyzed in the same way. All these variables were
distributed normally (Kolmogorov-Smirnov test with Lilliefors correction;
P > 0.05), except for the number of individuals and the Fisher‘s alpha index
of primary hemi-epiphytes, the trunk surface of trees and lianas, and the
height of the ten largest trees. For individual landscape units ANCOVA
(Engqvist 2005) was used to examine if the regression of the number of
epiphyte individuals or epiphyte species richness against tree size differed
between holo- and secondary hemi-epiphyte habits. For this, tree size was
calculated as the sum of the standardized trunk surface and the
standardized crown volume (standardization on the basis of all trees in all
plots) (Wolf et al. 2009). The ANCOVA was done as a GLM with Poisson
errors in R 2.10, applying tree size and the interaction of epiphyte growth
habit × tree size as predictors. Significance was checked after compensation
for overdispersion by refitting the models using quasi-Poisson errors
(Crawley 2007). DCA ordinations (Hill 1979) were conducted applying
CANOCO for Windows (version 4.51, ter Braak & Smilauer 1998) to
visually explore the main patterns in species composition of all epiphytes,
holo-epiphytes and secondary hemi-epiphytes. Species abundances in all
DCA were the log-transformed numbers of individuals. Mantel and partial
Mantel tests were done applying the Vegan package in R 2.10 (R package
version 1.15-3 http://rforge.r-project.org/projects/vegan/). In these,
matrix A contained the between-plot distance in epiphyte species
composition calculated as the Bray-Curtis dissimilarity (Legendre &
Legendre 1998) based on the log-transformed number of individuals per
plot. Matrix B or matrix C contained the between-plot distance calculated
as the binary coefficient based on the plot assignments to each of the three
landscape units, the between-plot distance in phorophyte species
composition calculated as the Bray-Curtis dissimilarity based on the log-
transformed basal area of phorophytes per plot, or the log-transformed

Association of vascular epiphytes with landscape units and phorophytes
48
Euclidean distance between the plots, calculated on the basis of their
decimal geographic coordinates. To detect possible spurious effects by
scarce species, the DCA ordinations and Mantel tests were repeated with a
subset of abundant species (arbitrarily defined as those species which were
recorded with 60 individuals or more).
Following Laube & Zotz (2006b), epiphyte species preference for
phorophyte species was tested by means of two randomization procedures
using R 2.10. The aim of the first randomization procedure was to test if a
given phorophyte species was occupied by more or fewer individuals of
epiphyte species than expected by chance alone in one single plot. First, we
selected for each plot those phorophyte species (trees only), which occurred
with eight individuals or more and which were covered by more than 59
epiphytes. Then, E was defined as the number of epiphyte individuals on
each selected phorophyte species in the plot. We created a null model of the
epiphyte species composition on the selected phorophyte species by
applying 999 random draws with replacement of E epiphyte individuals
from the pool of all epiphyte individuals in the plot. The original epiphyte
species composition of E individuals on the selected phorophyte was added
as draw 1000 (Hope 1968; Manly 1997). Then, for all epiphyte species we
established the number of individuals in the 2.5 and 97.5 percentiles of the
1000 draws. If the original number of epiphyte individuals was located
outside the interval of the 2.5 percentile and the 97.5 percentile, it was
considered significant. The aim of the second randomization procedure
was to test if a given epiphyte species covered more or fewer individuals of
phorophyte species than expected by chance alone in one single plot. Only
those epiphyte species were tested which covered at least eight
phorophytes (only trees) and which occurred with 60 epiphyte individuals
or more in one single plot. Analogous to the first randomization procedure,
a null model was created of the assemblage of phorophyte species (only

Chapter 3
49
trees) that carried the selected epiphyte species, by applying 999 random
draws with replacement of E phorophyte individuals from the pool of all
phorophyte individuals in the plot. In this case, E was defined as the
number of phorophyte individuals carrying each selected epiphyte species
in the plot. For each phorophyte individual the probability of being
included in the random draws was proportional to its standardized tree
size, defined for the ANCOVA analyses. For this purpose, the standardized
tree size values were shifted to obtain a minimum tree size value of one.
The original phorophyte species composition of E individuals carrying the
selected epiphyte was added as draw 1000 (Hope 1968; Manly 1997). The
significance was defined in the same way as in the first randomization
procedure.
RESULTS
PATTERNS BETWEEN LANDSCAPE UNITS.—Overall we recorded 154
epiphyte species, distributed over 66 genera and 28 families (Appendix 3.1).
Most epiphyte species belonged to the families Araceae (45) and
Orchidaceae (27). Philodendron was the most species-rich genus (26). Eighty-
two species were holo-epiphytes and 72 were hemi-epiphytes (11 primary
and 61 secondary). In total, 3310 holo-epiphyte and 2516 hemi-epiphyte
plants were recorded. Of all hemi-epiphyte plants, 179 were primary hemi-
epiphytes and 2337 secondary hemi-epiphytes. Because of the scarcity in
primary hemi-epiphytes (in both species and individuals) further analyses
of hemi-epiphytes concentrated on patterns of secondary hemi-epiphytes.
Most epiphyte species occurred in low abundances. For instance, 62 holo-
epiphyte species (78%) and 40 (66%) secondary hemi-epiphyte species
contributed with less than 1% of the total amount of individuals. For 84% of
the species the average indicator of patchiness (number of epiphyte
individuals divided by number of phorophyte individuals) was below 1.5,
and for 99% of the species this indicator was below 4.5 (Appendix 3.1).

Association of vascular epiphytes with landscape units and phorophytes
50
These results demonstrate a general tendency for a low aggregation. Holo-
epiphytes showed a low abundance in the uplands, whereas secondary
hemi-epiphytes were most diverse in the uplands (Table 3.1).
A total of 568 species of tree and liana (dbh ≥ 2.5 cm) were recorded, 411 of
which carried epiphytes (phorophyte species). Most forest structural
variables did not differ substantially among the landscape units, apart from
the species richness and the canopy height (Table 3.2). The density of
epiphytes on phorophytes was low: 75% of the phorophytes carried three
or fewer epiphyte plants. In all landscape units holo-epiphytes were found
on about the same number of phorophyte species and on a roughly similar
number of phorophyte individuals (Table 3.3). Also, the occupancy did not
vary between the landscape units: about 20%-40% of the trees and lianas
(dbh ≥ 2.5 cm) carried holo-epiphytes. However, the trunk surface and the
crown volume of the phorophytes that carried holo-epiphytes were
smallest in the upland forests. Contrary to this, the trunk surface of
phorophytes carrying secondary hemi-epiphytes was largest in uplands,
whereas the crown volume did not differ between the landscape units. In
uplands the density and species richness of phorophytes carrying
secondary hemi-epiphytes was larger than in swamps and floodplains. Just
as with holo-epiphytes, the occupancy levels were similar between the
landscape units (25%-50% of the phorophytes were covered with secondary
hemi-epiphytes.
The species richness and abundance of epiphytes increased with tree size in
all landscape units (ANCOVA, tree size factor, P < 0.001). However, the
interaction effect of epiphytic growth habit × tree size was only significant
in swamps (ANCOVA, P < 0.001). In this landscape unit holo-epiphytes
showed the steepest relationship with tree size, for both species richness
(Figure 3.2a) and abundance (Figure 3.2b).

51
Table 3.1. Number of species and individuals, and Fisher‘s alpha index of holo-epiphytes and hemi-epiphytes in three
landscapes units in the Chiribiquete area of Colombian Amazonia. Mean ± one SD is shown for n 0.1-ha plots. In case
of significant differences between landscapes, the small letters denote the results of Tukey-Kramer HSD post-hoc
comparison tests (with a significance level of 0.05). * = 0.01 ≤ P < 0.05; ** = 0.001 ≤ P < 0.01; *** = P < 0.001.
Holo-epiphytes Primary hemi-epiphytes
n Species Individuals Fisher’s Species Individuals Fisher’s
Swamp 3 30.3 ± 4.0 440 ± 113 a 7.5 ± 1.4 3.0 ± 1.0 39.3 ± 29.1 0.8 ± 0.4
Floodplain 3 27.0 ± 3.6 483 ± 92.7 a 6.2 ± 0.8 3.3 ± 0.6 7.3 ± 3.5 3.6 ± 2.1
Upland 4 24.8 ± 3.6 137 ± 59.8 b 9.5 ± 2.1 3.0 ± 1.4 9.8 ± 6.8 1.9 ± 0.9
ANOVA F 1.9 16.7** 3.6 0.9 3.7 3.5
Secondary hemi-epiphytes All epiphytes
Species Individuals Fisher’s Species Individuals Fisher’s
Swamp 10.3 ± 3.1a 175 ± 126 2.7 ± 0.3 a 43.7 ± 2.3 ab 654 ± 151 10.7 ± 1.4 ab
Floodplain 9.3 ± 5.0 a 81.0 ± 32.4 2.8 ± 1.8 a 39.7 ± 5.1a 572 ± 105 9.2 ± 1.4 a
Upland 26.3 ± 3.9b 392 ± 186 6.5 ± 1.1b 54.0 ± 6.7 b 539 ± 160 15.3 ± 3.1b
ANOVA F 19.9** 4.6 11.2** 6.9* 0.5 6.7*

52
Table 3.2. Tree and liana information (DBH ≥ 2.5 cm) from three landscapes units in the Chiribiquete area of
Colombian Amazonia. Mean ± one SD is shown for n 0.1-ha plots (see n in Table 3.1). In case of significant differences
between landscapes, the small letters denote the results of Tukey-Kramer HSD post-hoc comparison tests (with a
significance level of 0.05). * = 0.01 ≤ P < 0.05; ** = 0.001 ≤ P < 0.01; *** = P < 0.001.
Species Individuals Basal area (m2)
Trunk surface
(m2) (trees only)
Crown volume (m3) (trees only)
Individuals with DBH ≥ 30 cm
Tree height (m) of ten largest trees
Swamp 80 ± 27 a 429 ± 67.7 3.6 ± 0.4 748 ± 26 39,400 ± 11,300 10.3 ± 4.5 26.6 ± 0.3 ab
Floodplain 51 ± 6.4a 305 ± 108 3.8 ± 0.9 604 ± 165 30,900 ± 4,700 15.3 ± 3.8 24.0 ± 1.3 a
Upland 143 ± 18b 391 ± 61.5 3.5 ± 0.6 790 ± 58 29,900 ± 3,300 8.8 ± 1.7 28.2 ± 0.4b
ANOVA F 21.7** 1.9 0.2 3.3 1.8 3.5 27.2***

53
Table 3.3. Phorophyte information (DBH ≥ 2.5 cm) from three landscapes units in the Chiribiquete area of Colombian
Amazonia. Number of species, individuals and occupancy is based on trees and lianas; trunk surface and crown
volume is only based on tree phorophytes. Mean ± one SD is shown for n 0.1-ha plots (see n in Table 3.1). In case of
significant differences between landscapes, the small letters denote the results of Tukey-Kramer HSD post-hoc
comparison tests (with a significance level of 0.05). * = 0.01 ≤ P < 0.05; ** = 0.001 ≤ P < 0.01; *** = P < 0.001.
Phorophytes with holo-epiphytes
Species Individuals Occupancy (%) Trunk surface (m2) Crown volume (m3)
Swamp 43 ± 3.8 131 ± 20.0 31 ± 8.2 450 ± 40 a 29,800 ± 10,180 a
Floodplain 31 ± 6.4 116 ± 47.3 38 ± 10.0 340 ± 90 ab 19,000 ± 1,150 ab
Upland 51 ± 12.3 81.5 ± 30.6 21 ± 8.4 290 ± 60 b 13,700 ± 3,130 b
ANOVA F 3.9 2.0 3.3 4.9* 6.6*
Phorophytes with secondary hemi-epiphytes
Swamp
Species Individuals Occupancy (%) Trunk surface (m2) Crown volume (m3)
Floodplain
40 ± 23.8 a 103 ± 68.6 ab 24 ± 15.5 300 ± 170 a 20,000 ± 12,490
Upland
21 ± 5.6 a 51 ± 13.0 a 19 ± 10.4 180 ± 20 a 12,100 ± 2,000
ANOVA F
92 ± 17.0 b 191 ± 59.8 b 50 ± 19.9 560 ± 80 b 23,300 ± 1,850
16.3** 6.0* 3.8 11.0** 2.3

Association of vascular epiphytes with landscape units and phorophytes
54
Figure 3.2. Scatter plots of the number of species richness (a) and epiphyte
individuals (b) against standardized tree size in swamps. The lines connect the
values predicted by the GLM (Poisson errors) analysis. Small dots and the
interrupted line represent holo-epiphytes; open circles and the continuous line
represent secondary hemi-epiphytes.

Chapter 3
55
DID EPIPHYTE ASSEMBLAGES RELATE TO LANDSCAPE UNITS OR
PHOROPHYTES? —Species assemblages of holo-epiphytes and secondary
hemi-epiphytes were clearly related to the landscape units (Figure 3.3,
Table 3.4). Patterns including all epiphyte species (DCA diagrams not
shown) did not differ from those obtained on the basis of only the most
abundant species. However, the epiphyte species composition yielded
consistently higher Mantel correlation coefficients with phorophyte species
composition than with landscape unit. Epiphyte species composition
against landscape unit controlling for phorophyte species composition
yielded lower partial Mantel coefficients than epiphyte species composition
against phorophyte species composition controlling for landscape unit.
Epiphyte composition was not related to space. Using space as a
conditional effect hardly reduced the phorophyte effect on epiphyte
composition. Phorophyte composition was significantly related to the
landscape units (Figure 3.3; Mantel r = 0.65, P = 0.001 for phorophytes
carrying all epiphytes; Mantel r = 0.53, P = 0.004 for phorophytes with holo-
epiphytes; Mantel r = 0.61, P = 0.001 for phorophytes with secondary hemi-
epiphytes).

Association of vascular epiphytes with landscape units and phorophytes
56
Figure 3.3. DCA ordination diagrams to illustrate the association of the species
composition of all epiphyte species (a); only holo-epiphytes (b); only secondary
hemi-epiphytes (c); phorophytes covered by all epiphyte species (d); phorophytes
covered by holo-epiphytes (e); phorophytes covered by secondary hemi-epiphytes
(f) with landscape units. The symbols represent the sample plots.

Chapter 3
57
Table 3.4. Mantel and partial Mantel test results of vascular epiphyte species
against and landscape units, species of trees and lianas (phorophytes), and space,
in the Chiribiquete area of Colombian Amazonia. Mantel r is the Mantel correlation
coefficient between matrix A and matrix B. Partial Mantel r is the Mantel
correlation between matrix A and matrix B when the effect of matrix C is removed.
Mantel r Partial Mantel r Probability
Matrix A = All holo-epiphytes
Matrix B
Phorophytes 0.69 0.004
Landscape 0.47 0.001
Space -0.08 0.71
Matrix B Matrix C
Phorophytes Landscape 0.59 0.004
Landscape Phorophytes 0.16 0.16
Phorophytes Space 0.68 0.003
Matrix A = All secondary hemi-epiphytes
Matrix B
Phorophytes 0.77 0.001
Landscape 0.61 0.001
Space -0.16 0.91
Matrix B Matrix C
Phorophytes Landscape 0.63 0.003
Landscape Phorophytes 0.27 0.06
Phorophytes Space 0.77 0.001

Association of vascular epiphytes with landscape units and phorophytes
58
Table 3.4. Continued
Mantel r Partial Mantel r Probability
Matrix A = Abundant holo-epiphytes
Matrix B
Phorophytes 0.68 0.002
Landscape 0.47 0.001
Space -0.05 0.63
Matrix B Matrix C
Phorophytes Landscape 0.60 0.006
Landscape Phorophytes 0.29 0.05
Phorophytes Space 0.67 0.003
Matrix A = Abundant secondary hemi- epiphytes
Matrix B
Phorophyte 0.79 0.001
Landscape 0.43 0.004
Space -0.08 0.71
Matrix B Matrix C
Phorophytes Landscape 0.73 0.002
Landscape Phorophytes -0.002 0.50
Phorophytes Space 0.79 0.001

Chapter 3
59
WERE INDIVIDUAL EPIPHYTE SPECIES ASSOCIATED TO
INDIVIDUAL PHOROPHYTE SPECIES? —Eight phorophyte species
occurred at densities of eight or more trees in one single plot, and were
covered by 60 or more epiphytes (Table 3.5). On the basis of the
randomization tests applied to these phorophyte species, significant
associations were found with a total of 20 epiphyte species. Fifteen of these
associations were positive (the epiphyte species occurred with more
individuals on the selected phorophyte species than the null model
predicted), and eight were negative. The second randomization test started
with the selection of 14 epiphyte species, which occurred on eight or more
phorophyte trees in densities of 60 individuals or more per plot. In this test
the size of the phorophyte trees influenced their incorporation in the null
model of phorophyte species composition. The selected epiphyte species
showed 17 significant associations with a total of 13 phorophyte species
(Table 3.6). Of these, 11 associations were positive and six negative.
DISCUSSION
WHOLE SPECIES ASSEMBLAGES.—The species composition of both
holo- and secondary hemi-epiphytes differed significantly over the three
landscape units in Chiribiquete, just as in the Metá area, about 100 km
south-east (Figure 1; Benavides et al. 2005). Contrary to our expectation,
holo-epiphytes did not show a substantially lower degree of association
with the landscape units than secondary hemi-epiphytes. Can this habitat
effect be attributed to the combined result of an epiphyte-phorophyte
association and a correlation of phorophyte composition with landscape
units? The species composition of phorophytes for holo-epiphytes and
phorophytes for secondary hemi-epiphytes differed significantly between
the landscape units. This concurs with results from other studies in upper
Amazonia (overview in Duivenvoorden & Duque 2010), which generally

Association of vascular epiphytes with landscape units and phorophytes
60
Table 3.5. Results of the randomization procedure to test the association of selected
phorophyte species with individual epiphyte species. For each phorophyte species
the significantly associated epiphyte species are listed. After each epiphyte species
name are the recorded number of epiphyte individuals on the phorophyte species
in the plot and, in parentheses, the 95% confidence interval as derived from the
randomization tests. Draw size equals the total number of epiphytes recorded on
the selected phorophyte species in the indicated plot.
Selected phorophyte species Plot Draw size
Epiphyte species with significant associations
Clathrotropis macrocarpa Ducke
1 83 Hecistopteris pumila 6 (0-5)
4 92 Codonanthe calcarata 12 (1-9)
Duguetia argentea (R. E. Fr.) R. E. Fr.
3 60 Elaphoglossum luridum 5 (8-20)
Eschweilera coriacea (Ap. DC.) Mart. ex Berg
5 74 Peperomia elongata 32 (16-31)
10 67 Anthurium polydactilum 5 (0-4)
Micropholis guyanensis (A. DC.) Pierre
1 62 -
Mollia lepidota Spr. ex Benth. 6 201 Codonanthe crassifolia 6 (8-22); Pepinia uaupensis 29 (11-27)
9 114 Anthurium gracile 0 (1-9); Anthurium uleanum 4 (15-30); Elaphoglossum luridum 16 (0-8); Guzmania brasiliensis 9 (1-7); Microgramma megalophylla 9 (0-8); Monstera gracilis 5 (10-23); Philodendron insigne 9 (0-6); Sobralia macrophylla 8 (0-4)
Pouteria laevigata (Mart.) Radlk.
9 67 Anthurium uleanum 6 (7-20); Asplenium serratum 26 (5-16); Maxillaria cf. triloris 3 (0-2)
Virola elongata (Benth.) Warb.
9 111 Anthurium uleanum 41 (14-30); Asplenium serratum 0 (9-24); Hillia ulei 8 (0-6); Pepinia uaupensis 0 (2-11)
Zygia cataractae (Kunth) L. Rico.
9 112 Anthurium uleanum 33 (14-30)
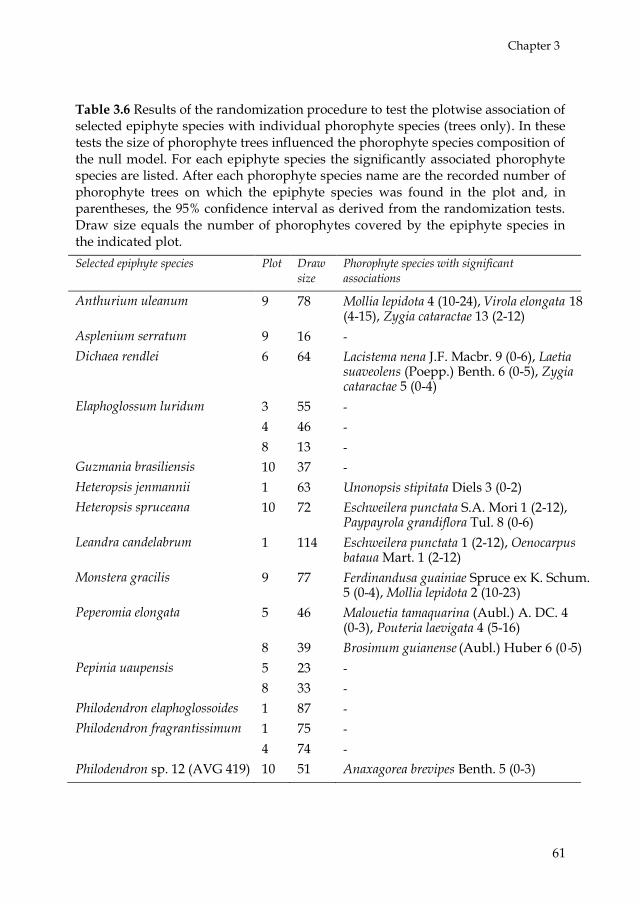
Chapter 3
61
Table 3.6 Results of the randomization procedure to test the plotwise association of selected epiphyte species with individual phorophyte species (trees only). In these tests the size of phorophyte trees influenced the phorophyte species composition of the null model. For each epiphyte species the significantly associated phorophyte species are listed. After each phorophyte species name are the recorded number of phorophyte trees on which the epiphyte species was found in the plot and, in parentheses, the 95% confidence interval as derived from the randomization tests. Draw size equals the number of phorophytes covered by the epiphyte species in the indicated plot.
Selected epiphyte species Plot Draw size
Phorophyte species with significant associations
Anthurium uleanum 9 78 Mollia lepidota 4 (10-24), Virola elongata 18(4-15), Zygia cataractae 13 (2-12)
Asplenium serratum 9 16 -
Dichaea rendlei 6 64 Lacistema nena J.F. Macbr. 9 (0-6), Laetia suaveolens (Poepp.) Benth. 6 (0-5), Zygia cataractae 5 (0-4)
Elaphoglossum luridum 3 55 -
4 46 -
8 13 -
Guzmania brasiliensis 10 37 -
Heteropsis jenmannii 1 63 Unonopsis stipitata Diels 3 (0-2)
Heteropsis spruceana 10 72 Eschweilera punctata S.A. Mori 1 (2-12), Paypayrola grandiflora Tul. 8 (0-6)
Leandra candelabrum 1 114 Eschweilera punctata 1 (2-12), Oenocarpus bataua Mart. 1 (2-12)
Monstera gracilis 9 77 Ferdinandusa guainiae Spruce ex K. Schum.5 (0-4), Mollia lepidota 2 (10-23)
Peperomia elongata 5 46 Malouetia tamaquarina (Aubl.) A. DC. 4(0-3), Pouteria laevigata 4 (5-16)
8 39 Brosimum guianense (Aubl.) Huber 6 (0-5)Pepinia uaupensis 5 23 -
8 33 -
Philodendron elaphoglossoides 1 87 -
Philodendron fragrantissimum 1 75 -
4 74 -
Philodendron sp. 12 (AVG 419) 10 51 Anaxagorea brevipes Benth. 5 (0-3)
Association of vascular epiphytes with landscape units and phorophytes
62
indicate that species composition of trees and lianas differs among the main
landscape units or forest types. The epiphyte-phorophyte association was
also significant for both holo-epiphytes and secondary hemi-epiphytes. For
holo-epiphytes and secondary hemi-epiphytes the effect of landscape unit
on species composition strongly decreased after controlling for the
phorophyte composition in the plots. In contrast, the effect of the
phorophyte composition remained significant after accounting for the effect
of landscape unit. Therefore, our results suggested that the association of
epiphyte species composition with landscape units was largely due the
strong link between epiphytes and phorophytes, for both holo- and
secondary hemi-epiphytes.
Phorophyte composition may be a prevailing factor in epiphyte species
distribution because the phorophyte assemblage as a whole provides a
wide spectrum of epiphyte habitats related to variation in age, phenology,
architectural traits and physico-chemical properties of epiphyte substrates,
among others. All of these create specific micro-habitats (Freiberg 2001) and
substrate conditions exploited by specific sets of epiphytes (Benavides et al.
2005, 2006; Bennett 1986; Benzing 1981; Callaway et al. 2002; Dejean et al.
1995; Frei & Dodson 1972; Hietz & Briones 1998; Johansson 1974; Kernan &
Fowler 1995; Migenis & Ackerman 1993; Talley et al. 1996; Wolf 1994). In
Mexico, Mehltreter et al. (2005) showed that tree ferns hosted a different
epiphyte community compared to angiosperms. In Panama, Zotz & Schultz
(2008) reported that five host tree species significantly explained about 9%
of the epiphyte composition (71 holo-epiphyte species occurring on 91 trees
in 0.4 ha) whereas dbh alone explained only 2%. In contrast to
phorophytes, landscape units influence establishment and population
dynamics of epiphytes in a less direct way, for example via variations in
meso- and microclimate (humidity), soil differentiation (Gentry & Dodson
1987), and forest dynamics (Phillips et al. 2004). Also, in our study, the
Chapter 3
63
effect of landscape unit was estimated by means of the binary distance
between only three landscape units, providing a relatively weak basis to
explain epiphyte composition.
The Mantel tests further suggested that the epiphyte composition (both
holo- and secondary hemi-epiphytes) was not related to the spatial distance
between plots and therefore not restricted by any dispersal limitation at the
between-plot scale (Benavides et al. 2005). This is remarkable because other
studies of epiphyte establishment and epiphyte succession reported
significant spatial effects, presumably related to slow rates of colonization,
leptokurtic seed-dispersal patterns and priority effects (Ackerman et al.
1996; Barkman 1958; Benavides et al. 2006; Wolf 2005). The isolation of
epiphyte populations between regions has been mentioned as a factor
determining epiphyte radiation (Gentry & Dodson 1987). In addition, space
and dispersal limitation is often found as a predominant factor in tree
species and liana composition (Duque et al. 2009). Analogous to the
sampling in only three landscape units, the plots were spatially configured
in only three clumps (Figure 3.1). This low variation in spatial distances
between the plots may have hampered the detection of the spatial effect on
epiphyte composition.
The density and species richness of both holo- and secondary hemi-
epiphytes increased as function of tree size. Generally, more epiphytes and
epiphyte species are expected on larger and older trees because of the
larger sampling area, more surface area for colonization and seed
interception, and better conditions for epiphyte establishment such as
humus accumulation on branches (Flores-Palacios & Garcia-Franco 2006;
Zotz & Vollrath 2003). Over time, the accumulated probability of settlement
and habitat diversity also increase (Laube & Zotz 2006a).
The species richness and abundance of holo-epiphytes showed a steeper
regression with tree size than secondary hemi-epiphytes in swamps. The

Association of vascular epiphytes with landscape units and phorophytes
64
conditions of permanent inundation in these forests probably create a
continuously high atmospheric humidity, which may be beneficial for the
establishment and growth of holo-epiphytes. After successful
establishment, holo-epiphytes may proliferate quickly at plot or tree scales
due to the large production of anemochoric seeds (Cascante-Marin 2006).
This expansion likely depends strongly on time, tree size and favourable
conditions for establishment (Andrade & Nobel 1997; Orihuela & Waechter
2010; Zotz & Hietz 2001). In contrast, secondary hemi-epiphytes produce
fewer seeds than holo-epiphytes (Benzing 1990). The lack of oxygen and
high levels of aluminium and iron toxicity in inundated soils might hamper
the germination of seeds or the growth of seedlings of secondary hemi-
epiphytes. Besides seed dispersal, many hemi-epiphyte species show the
ability to propagate vegetatively, creeping along the forest floor (Ray 1992).
Standing water likely hampers this mechanism of colonization.
About half (20% - 70%) of the trees and lianas (dbh ≥ 2.5 cm) carried
epiphytes, suggesting that epiphyte patterns are not strongly affected by
phorophyte limitation (Leimbeck & Balslev 2001). The total number of
species and the relatively strong contribution of Araceae (mainly
Philodendron) and Orchidaceae to the epiphyte flora were in line with the
two earlier surveys in this part of Colombian Amazonia (Arévalo &
Betancur 2004, 2006; Benavides et al. 2005). Ground-based surveys are
commonly used to record epiphytes with an acceptable sampling accuracy
(Burns & Dawson 2005; Laube & Zotz 2007; Leimbeck & Balslev 2001). We
took special care to train our indigenous field crew to recognize and sample
tiny epiphytes, also by means of pole tree pruners. In the Metá study
(Benavides et al. 2005), our in situ counts of epiphyte species and
individuals in the canopies of large trees (14-28 cm dbh) did not differ from
counts made on branches of large trees, which were cut down just outside
each plot (two-sample pairwise Wilcoxon test, V = 116, P = 0.13 for species;
Chapter 3
65
V = 114, P = 0.08 for individuals; n = 30 plots and 30 large trees). However,
tiny epiphytes, particularly orchids, might still have been missed (Flores-
Palacios & Garcia-Franco 2001), especially in the high tree crowns. Arévalo
& Betancur (2004), who used tree-climbing gear to reach the canopy in the
Chiribiquete area, found 94 species in 0.05 ha, of which 23 were orchids.
Conversely, in the four upland plots (0.4 ha) we recorded 111 species, with
only 15 orchid species.
INDIVIDUAL ASSOCIATIONS OF EPIPHYTE AND PHOROPHYTE
SPECIES.—Because all plots showed a high diversity of epiphytes and
especially phorophyte species, the associations between individual species
of epiphyte species and their hosts were hard to test. The large majority of
epiphytes occurred in low densities on many different phorophyte species.
Pairwise associations of epiphyte and phorophyte species have been
studied in several ways (Burns 2007; Cardelus et al. 2006; Laube & Zotz
2006b; Muñoz et al. 2003). GLM or multiple logistic regression, used to test
abundance or presence-absence of one single epiphyte species against
phorophyte species (as dummy variables) (Hirata et al. 2009), was
ineffective in our study because of the low number of epiphyte hits for
many of the phorophyte taxa. When ANCOVA was used to test if epiphyte
abundance against phorophyte structure varied for different phorophyte
taxa (Callaway et al. 2002), it also failed for the same reason. For pragmatic
reasons we based the threshold levels of eight phorophyte trees and 60
epiphyte individuals in our randomization tests on Laube & Zotz (2006b)
who tested host-preferences among a minimum number of 227 epiphyte
individuals occurring on 31 phorophytes or more in a 0.4-ha plot in
Panama. The randomization procedures we used only make sense if the
draw size (the number of randomly sampled individuals) is high relative to
the total number of individuals in the plot, and if the density of individuals
is approximately evenly distributed over the species. If these conditions are

Association of vascular epiphytes with landscape units and phorophytes
66
not fulfilled many species may never occur in the draws, which would lead
to a failure of the test for negative associations and to an overestimation of
positive associations (Laube & Zotz 2006b). Because both negative and
positive host preferences were found, our draw sizes seemed adequate. In
both randomization tests, remarkably few pairwise associations between
epiphyte species and phorophyte species appeared. Using the first
randomization procedure (sampling epiphytes from the pool of epiphytes
in the plot for selected phorophyte species) Laube & Zotz (2006b) reported
74 significant (P < 0.05) epiphyte-phorophyte associations obtained from a
total of 309 pairwise comparisons (a frequency of 24%) in Panama. In the
seven 0.1-ha plots selected for our randomizations, these frequencies
ranged from 0% to 20% (average 5%). Using the second randomization
procedure (sampling phorophytes weighted by their size from the pool of
phorophytes in the plot for selected epiphyte species), these frequencies
were even lower (0%-12%, average 2%), and also yielded different species
showing pairwise associations compared to the first test. Arguably, the null
model used in the second randomization test was more realistic because it
took into account that larger phorophytes have higher chances on being
covered by epiphytes. Yet, it remained uncertain how the spatial
configuration of the phorophytes in the plot influenced the abundance of
the epiphyte assemblages. Indeed, the null models in both randomizations
assumed that epiphytes had unlimited access to all phorophytes in the plot.
For this reason the testing procedures were applied to single plots. By
pooling plots the randomization may relate certain epiphyte species that
only occurred in one plot to certain phorophyte species that occurred in
another plot. Because our plots were located at least 1 km apart from each
other, pooling would demand an unrealistically strong dispersal process to
shape the epiphyte species assemblage in the null models. Yet, even for one
plot the assumption of unlimited access is improbable because of the

Chapter 3
67
clumped occurrences of many epiphyte species along tree trunks (Arévalo
& Betancur 2006).
ACKNOWLEDGEMENTS
The authors are thankful to the indigeneous people of Araracuara and
Chiribiquete, and to the Fundación Puerto Rastrojo, the Herbario
Amazónico Colombiano (COAH), the Herbario Nacional Colombiano
(COL), the Herbario Universidad de Antioquia (HUA), and the herbarium
of the Missouri Botanical Garden (MO) for providing facilities during the
study. We thank Ricardo Callejas for his support and helpful suggestions.
Comments on the manuscript by Jan Wolf were gratefully included. Anne
Blair Gould corrected the English. This study was partially financed by the
European Commission (ERB IC18 CT960038), Tropenbos-Colombia, the
Netherlands Foundation for the Advancement of Tropical Research -
WOTRO (WB85-335), and ALBAN (E07D401309CO).

68


Recovery and succession
70
Abstract
The species richness, number of plants, biomass, and species composition
of holo- and hemi-epiphytes were recorded in fifty-six 0.04-ha plots,
distributed over forest fallows of 2–30 y old and mature forests in lowland
Amazonia (Amacayacu National Park, Colombia). A total of 9190 epiphytic
plants representing 162 species were recorded on 4277 phorophytes.
Seventy species were classified as holo-epiphyte and 85 as hemi-epiphyte.
Aroids were most diverse (58 species) and represented 76% of the total
recorded biomass. Anemochory was more dominant among holo-epiphytes
and zoochory among hemi-epiphytes. The species richness, density and
biomass of both holo and hemi-epiphytes increased significantly from
young fallows to old fallows and mature forests. Hemi-epiphytes had
greater density and biomass than holo-epiphytes. In canonical ordination,
forest age did not relate to the species composition of holo-epiphytes.
However, for hemi-epiphytes, the age effect was significant, suggesting
that species turnover takes place in the ageing fallows.
Key Words: Araceae, canopy, Colombia, dispersal, diversity, hemi-
epiphytes, holo-epiphytes, tropical rain forest, secondary forest

Chapter 4
71
INTRODUCTION
EPIPHYTIC PLANTS ARE A CONSPICUOUS COMPONENT of mature
tropical rain forest (Gentry and Dodson 1987ab). In Amazonia, epiphytes
seem to contribute more to the total plant diversity than previously thought
(Benavides et al. 2005; Köster et al. 2005). Little is known, however, about
epiphyte proliferation in disturbed forests.
During forest succession, epiphyte species may respond to changes in the
environmental conditions, associated with the changing structure of the
forest (Barthlott et al. 2001; Cascante-Marín 2006; Merwin et al. 2003; Wolf
2005). For example, it has been shown that during forest succession
drought tolerant epiphyte species are replaced by species that appear to be
better adapted to a more humid microclimate (Barthlott et al. 2001; Wolf
and Flamenco 2006).
Slow invasions of epiphytes may also influence the succesional
development of epiphyte communities. In tree plantations fewer epiphytes
were found compared with the surrounding forest (Catling et al. 1986;
Madison 1979; Merwin et al. 2003). Old cyclically clear-cut oak coppices in
southern Mexico supported fewer epiphytes compared with oak forests of
similar structure that were never clear-cut, providing evidence for dispersal
limitation (Wolf 2005). Within forests, the clumped growth of seedlings
around mother plants and field experiments also point at dispersal
limitation, at least for wind-dispersed epiphytes (Ackerman et al. 1996;
Cascante-Marín 2006; Van Dunné 2001). Wind-dispersed orchids,
bromeliads, and ferns may find establishment problematical under
frequent downpours in the perhumid Amazonian forest (Wolf and
Flamenco-S. 2003). Several studies in upper Amazonia report a
preponderance of hemi-epiphytic aroids (Benavides et al. 2005; Leimbeck
and Balslev 2001), which are dispersed by animals.

Recovery and succession
72
This study aimed to explore successional patterns for holo- and hemi-
epiphytes in fallows of 2 to 30 y old and mature forests, in a wet
Amazonian area. Holo-epiphytes by definition (Benzing 1987) do not root
in the soil, and their settlement in the fallows is largely dependent on
dispersal. We assume that the increasing branch area in the expanding
canopies in developing fallows yields a growing supply of fresh substrate
allowing a more or less continuous arrival of new holo-epiphyte species.
We hypothesise that because of this condition the patterns in holo-epiphyte
composition are largely independent of the degree of fallow development.
In contrast, most hemi-epiphytes depend both on the soil for rooting and
trunks for settlement and anchoring. For these epiphytes, therefore, we
hypothesise that the availability of substrate increasingly limits the
establishment and growth in aging fallows, leading to species replacement
as the prevailing successional pattern in the fallows.
METHODS
STUDY AREA.—This study was conducted in the Colombian Amazon
forest in Amacayacu National Park (3º S and 69º-70º W; Fig. 4.1) from
September 2004 to January 2005. The average annual temperature is ca. 26
ºC and relative humidity c. 86%. The area receives an average annual
precipitation of c. 3200 mm, with a less humid period between June and
September (Rudas and Prieto 2005; based on climatological records at
Leticia airport from 1968-1990). The physiography of the area is slightly
undulating corresponding to a dissected sedimentary plain at elevations
between 80 and 200 m above sea level (Rudas and Prieto 2005).

Chapter 4
73
Figure 4.1. The location of the plots in Amacayacu National Park, Colombian
Amazonia. The names refer to the indigenous communities in which territory the
plots were made (sites).
The epiphyte sampling was conducted in secondary forests and mature
forests (which did not show any sign of human intervention) in Tikuna
territory of three indigenous communities: Mocagua, Palmeras and San
Martín de Amacayacu. Current settlements were established approximately
70 years ago. Nowadays they are surrounded by a mosaic of vegetation
patches in different stages of succession as a consequence of the short
rotation cycles of the managed forests (Van der Hammen 1992). In the
secondary forests, we observed selective extraction of plant products,
including rare tree fellings, but no clear-cutting of large areas within the
fallows. We also observed occasional weeding around valuable plant
species in addition to hunting. Secondary vegetation patches had an
Recovery and succession
74
approximate size of 0.5-4 ha and were mostly square in shape. The
vegetation of the old-growth forest in Amacayacu National Park has been
described by Rudas and Prieto (2005).
FLORISTIC SURVEY.—A total of 56 plots was distributed along a
chronosequence of fallows and mature forests. The approximate age of the
fallows was obtained from interviews with local residents and
subsequently corroborated by field observations on the height of Cecropia
trees and forest structure. The fallows were assigned to one of four forest
age categories (2-8, 9-17, 18-22 and 23-30 y after abandonment). Mature
forests were treated as a fifth age category. Plots were square and were 0.04
ha in size, following Gradstein et al. (2003). Plots of the same age category
were located more than 300 m apart. Plot coordinates were obtained using
GPS (Fig. 4.1). In each plot, the structure of the forest was determined in a
10 x 10 m subplot by estimating the height and measuring the DBH
(diameter at 130 cm) of all woody plants. The openness of the canopy was
estimated by means of a densiometer at 130 cm height in the centre of each
plot (Espherical Densiometer type Robert E. Lemmon, Forest Densiometers,
Bartlesville, OK, USA, Model C). Canopy openness was calculated as the
mean of four measures in each cardinal direction. Tree stem volume was
calculated on the basis of tree height and DBH, assuming a cylindrical bole
shape.
Individual vascular epiphytes were recorded when they were attached to
trees (including palms and tree ferns) or lianas that rooted within the 0.04-
ha plots. We defined epiphytes as plants that spend most of their life cycle
attached to other plants. Following Benzing (1987), we defined holo-
epiphytes as those plants that normally spend their entire life cycle perched
on trees or lianas and hemi-epiphytes as those plants that spend only part
of their life cycle perched on trees or lianas. Primary hemi-epiphytes begin
their life cycle as epiphytes and eventually become connected to the

Chapter 4
75
ground. Secondary hemi-epiphytes begin as seedlings rooted in the soil but
subsequently become detached from the ground. In some species, the
boundary between an herbaceous liana and a secondary hemi-epiphyte
was not clear (Moffett 2000). Examples were Manekia sydowii Trel.
(Piperaceae), Dichorisandra hexandra (Aubl.) Standl. (Commelinaceae), and
Salpichlaena cf. hookeriana (Kuntze) Alston (Blechnaceae), which were
included as hemi-epiphytes. Occasionally, when shoots from one or more
individuals from a single species occurred very near to each other, we were
not able to distinguish shoots from individual plants. We counted such
shoot clusters as one individual (Sanford 1968). Individuals occurring in
crowns were examined with the help of binoculars. The DBH of
phorophytes was measured (for phorophyte trees smaller than 1.3 m, the
stem diameter was recorded at half the height of the tree). Vouchers (AMB
1300-2100) of all species were deposited at the herbarium of the
Universidad de Antioquia (HUA).
A non-destructive sampling method was used to estimate epiphyte dry
weight biomass of all epiphyte species (Wolf and Konings 2002). Dry
weight was estimated on the basis of counts of leaves, fronds or rosettes,
depending on the growth form of the species. For hemi-epiphyte species,
stem length was used to estimate weights. At least ten leaves or stem
sections of c. 10 cm in length were sampled and weighted (0.02 g precision),
after having been dried at 65º C until constant weight. Subsequently, dry
weights were calculated from the average of these values for each species.
NUMERICAL ANALYSES.—Linear regression was used to analyse the
response of epiphyte properties to the age of the fallows, excluding the
mature forests for which no age was established. To test for differences in
plot species richness between holo-epiphyes and hemi-epiphytes, we used
analysis of covariance (ANCOVA) with the age of the fallows as covariate.
The relation between both the number of individuals and biomass with the

Recovery and succession
76
age of the fallow was distinctly non-linear for holo- or hemi-epiphytes, the
reason for which here ANCOVA was not attempted.
To test for differences in forest and epiphyte properties between forest age
categories or sites, we used analysis of variance (ANOVA) and subsequent
Tukey-Kramer's Honestly Significance Difference (HSD) post-hoc multiple
comparisons. To improve additivity and homoscedasticity the response
variables were log or square root transformed, if needed. To test the degree
of association between dispersal syndrome and epiphyte type (holo- or
hemi-epiphyte), we used contingency table analysis.
The response of holo- and hemi-epiphytes to environmental variables was
further explored using indirect (Detrended Correspondence Analysis,
DCA) and direct (Canonical Correspondence Analysis, CCA and
Redundancy Analysis, RDA) multivariate gradient analysis. In these,
epiphyte species biomass values were log transformed. In CCA, the
independent variables were site (a nominal variable in four classes
corresponding to each of the three indigenous settlement areas and the area
of mature forest), forest age (an ordinal variable of increasing age ranging
from 1-5, with the ranks corresponding to the forest age categories), four
quantitative variables of forest structure recorded in the 0.01 ha subplot
(log-transformed stem basal area, average tree height, log-transformed
densities of trees with DBH < 10 cm and DBH ≥ 10 cm) and spatial
variables. For the latter we used the nine terms of the third-degree
polynomial of the latitude and longitude coordinates in decimal degrees,
following Borcard et al. (1992) and Legendre and Legendre (1998). In a
preliminary CCA with epiphyte species biomass, significant spatial
variables were detected using forward selection in CANOCO (P < 0.05). In
the final CCA, only these spatial terms were used. The variable inflation
factors of the variables remained below 31. Unless otherwise indicated,
canonical axes together and the first ordination axis of all CCA were

Chapter 4
77
significant in Monte Carlo permutation tests under reduced model (199
permutations). If needed, plot scores along CCA axes were tested for
difference against fallow age categories in ANOVA. For the numerical
analyses we used JMP (version 3.2.2) and CANOCO (version 4.0; ter Braak
and Smilauer 1998).
RESULTS
FOREST STRUCTURE.—Not surprisingly, values for tree height, tree
volume, and tree basal area in young fallows were lower than in old
fallows and mature forest (Table 4.1). There were no significant differences
in tree density and canopy openness between the forest age categories
(Table 4.1). Forest structural variables did not differ significantly between
the sites (ANOVA, P > 0.05; sites defined as in the CCA analysis below).
EPIPHYTE IDENTIFICATIONS AND DISPERSAL SYNDROMES.—In a
total sampling area of 2.32 ha (56 0.04-ha plots), we recorded 9190
individual epiphytic plants in 162 species and morphospecies, occurring on
4277 phorophytes (Appendix 4.1). Of the species and morphospecies, 22%
were not identified beyond genus and 1% not beyond family level. Of the
total, 70 species were classified as holo-epiphyte (26% were not identified
beyond genus and 4% not beyond family level) and 85 species were
classified as hemi-epiphyte (29% were not identified beyond genus and 1%
not beyond family level). Only seven of these were classified as primary
hemi-epiphytes. Seven species occurred as occasional epiphytes and these
were excluded from further analyses. Holo- and hemi-epiphytes together
were distributed in 28 families, 11 of which belonged to pteridophytes.
Araceae was by far the most speciose and abundant (Fig. 4.2; Appendix
4.1).
Aroids represented 76% of the total epiphyte biomass of the 356 kg dry
weight recorded in all plots together, followed by Cyclanthaceae (9%) and
Recovery and succession
78
Dryopteridaceae (8%). The genus Philodendron comprised 57% of the total
epiphyte biomass followed by Polybotrya (8.3%) and Rhodospatha (7.9%).
Five species (Philodendron ernestii Engl., P. fragantissimum (Hook.) G. Don,
P. asplundii Croat, Rhodospatha latifolia Poeppig Endl., and Evodianthus
funifer (Poit.) Lindm.) encompassed together 50% of the total of epiphyte
biomass (Appendix 4.1).
Zoochoric epiphytes (112 species, 7436 individuals) prevailed over
anemochoric species (51 species, 1754 individuals). In terms of number of
species, anemochory was more dominant among holo-epiphytes, and
zoochory among hemi-epiphytes (contingency table analysis, Pearson Chi-
square = 36, P < 0.0001). These same tendencies were found regarding
number of individuals (Pearson Chi-square = 1500, P < 0.0001).
EPIPHYTE PATTERNS IN SPECIES RICHNESS, NUMBER OF
INDIVIDUALS AND BIOMASS.—The species richness, number of
individuals, and biomass of both holo-epiphytes and hemi-epiphytes were
positively correlated with fallow age, and clearly showed highest values in
the mature forest plots (Table 4.2, Fig. 4.3). The fallow and mature forest
plots contained about twice the number of hemi-epiphyte species as holo-
epiphytes. The average species richness of holo-epiphytes increased from 4
species/0.04 ha in fallows of 5 y to 11 species/0.04 ha in fallows of 30 y old
(1.6-fold rise). The relative increment was quite similar in hemi-epiphytes,
with species numbers increasing from 10 to 23 species over the same fallow
sequence (1.3-fold rise). The slopes of the two regressions (Fig. 4.3A and
4.3D) were not significantly different (test of homogeneity of regression
slopes, F ratio of interaction term of AGE x epiphyte type = 3.1, P = 0.08).
Hemi-epiphytes were far more abundant than holo-epiphytes regarding
number of individuals and biomass (Fig. 4.3). On average, five holo-

Chapter 4
79
Figure 4.2. Number of epiphyte species of the most diverse families in fallow and
mature forest in fifty-six 0.04-ha plots in Amacayacu National Park, Colombian
Amazonia. The total number of individuals found in these plots is given in
parentheses.
epiphytes were found in fallow plots of 5 y and 35 individuals in fallow
plots of 30 y, which represented a 4.6-fold increase. The plot densities of
hemi-epiphytes were higher and increased from 60 to 185 over the same
chronosequence. However, this rise represented only a 2.1-fold increment.
For biomass, the same tendencies were found. Absolute biomass values
were low for holo-epiphytes (averaging from 13 to 200 g/0.04 ha in fallows
from 5 to 30 y) compared to 1628 to 8387 g/0.04 ha for hemi-epiphytes), but
in terms of relative increment the holo-epiphyte biomass increased by a
factor of 14.7 in the fallow sequence, while hemi-epiphyte biomass
increased only by a factor of 4.1.
Less than one-third of the large trees and lianas (DBH ≥ 10 cm) supported
holo-epiphytes (Table 4.2). The phorophyte occupancy by holo-epiphytes
increased weakly with fallow age (Pearson correlation coefficient of square

Recovery and succession
80
root transformed occupancy and fallow age was 0.30, P < 0.05). In mature
forests, the phorophyte occupancy by holo-epiphytes rose to 55%.
Contrary, hemi-epiphytes were found on the majority of the trees and
lianas (DBH ≥ 10 cm) in the fallows. Phorophyte occupancy by hemi-
epiphytes did not increase with fallow age (Pearson correlation coefficient
of square root transformed occupancy and fallow age was 0.27, 0.05 < P <
0.10). The occupancy in mature forests did not differ significantly from that
in the fallows (Table 4.2).
Aroids dominated the hemi-epiphytes and were therefore largely
responsible for the high starting biomass in young fallows and the rather
gradual increase in hemi-epiphyte biomass along with fallow age (Fig. 4.4;
the family patterns in numbers of individuals were similar to those in
biomass and are therefore not shown). In the non-aroid families, holo-
epiphytes and hemi-epiphytes hardly differed in the way their biomass
increased from young to older fallows. With the exception of Gesneriaceae,
Polypodiaceae, and the (rarely found) Cecropiaceae and Blechnaceae, all
holo-epiphytic and hemi-epiphytic families were most abundant in the
mature forest plots. Begoniaceae were entirely restricted to mature forests
(Appendix 4.1).
PATTERNS IN EPIPHYTE COMPOSITION.—For the holo-epiphytes the
gradient length along the first two DCA axes in the preliminar DCA
analyses was 3.5 (axis 1) and 3.4 (axis 2), indicating that even the plots with
most divergent species composition still shared species (Ter Braak 1987).
Analysed by CCA, holo-epiphyte species composition was related to sites,
as shown by the high canonical coefficients for Mocagua and Palmeras
(Table 4.3) and the configuration of the plots in the CCA ordination
diagram (Fig. 4.5). On the other hand, holo-epiphyte species composition
was not related to the structure and age of the forest (Table 4.3, Fig. 4.5).
Chapter 4
81
The forest age categories did not differ in plot scores along the first and
second CCA axes (ANOVA F ratio = 1.3, P = 0.28 and F ratio = 0.3, P = 0.90
for axis 1 and 2, respectively). When the mature forest plots were removed
from the CCA analyses, fallow age categories did not show any
relationship with holo-epiphyte species composition.
Hemi-epiphytes species patterns showed shorter gradient lengths than
holo-epiphytes (2.4 for axis 1, and 2.2 for axis 2). Because linear response
patterns prevail in case of gradient lengths below 3 (Ter Braak 1987), the
CCA analyses were also done using RDA. However, all CCA results were
highly similar to those of RDA, and only CCA results were further
presented. Similarly to the holo-epiphytes, hemi-epiphyte species
composition was related to sites but not to forest structure (Table 4. 3, Fig.
4.5). However, the age category did show a significant effect, as shown by
the fairly high canonical coefficients (Table 4.3). Repeating the CCA
analyses after excluding the mature forest plots and subsequent ANOVA
analyses of the fallow plot scores along the first CCA axis against fallow
age categories yielded a significant result (F ratio = 12.9, P < 0.0001). Also,
applying a partial CCA of these fallow data with age category as single
explanatory variable and singling out the effect of all other explanatory
variables by entering them as co-variables, yielded a significant first
canonical axis (F ratio = 1.6, P = 0.01).

82
Figure 4.3. Relationship between forest age and species richness, number of
epiphyte individuals and epiphyte biomass for holo-epiphytes (a–c) and hemi-
epiphytes (d–f) in Amacayacu National Park, Colombian Amazonia.

Chapter 4
83
Figure 4.4. Biomass of the most abundant and diverse epiphyte families in five
forest age classes for holo-epiphytes (left) and hemi-epiphytes (right) in Colombian
Amazonia. Shown are plot averages and one standard error bar above and below.
See Table 4.1 for number of plots.
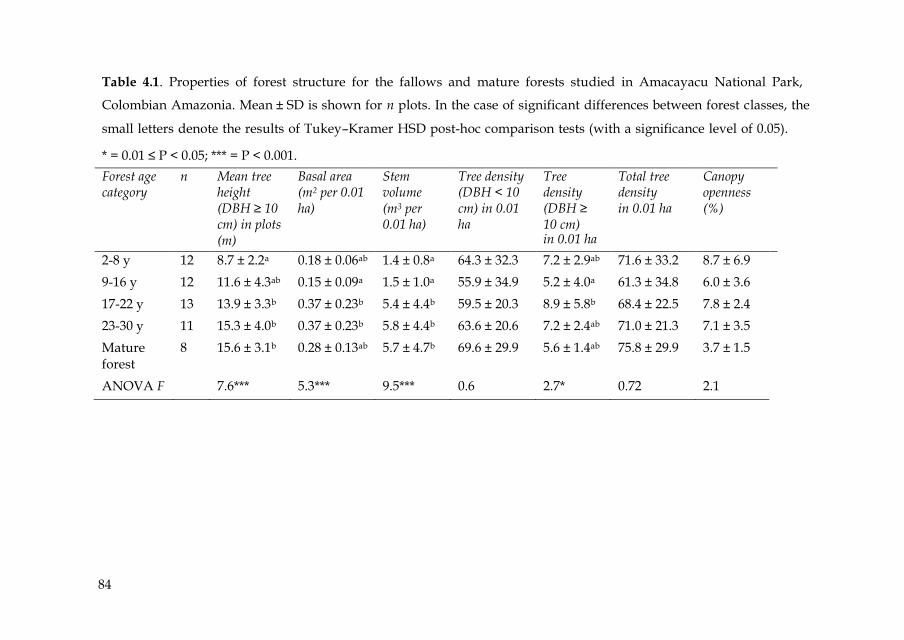
84
Table 4.1. Properties of forest structure for the fallows and mature forests studied in Amacayacu National Park,
Colombian Amazonia. Mean ± SD is shown for n plots. In the case of significant differences between forest classes, the
small letters denote the results of Tukey–Kramer HSD post-hoc comparison tests (with a significance level of 0.05).
* = 0.01 ≤ P < 0.05; *** = P < 0.001.
Forest age category
n Mean tree height (DBH ≥ 10 cm) in plots (m)
Basal area (m2 per 0.01 ha)
Stem volume (m3 per 0.01 ha)
Tree density (DBH < 10 cm) in 0.01 ha
Tree density (DBH ≥ 10 cm) in 0.01 ha
Total tree density in 0.01 ha
Canopy openness (%)
2-8 y 12 8.7 ± 2.2a 0.18 ± 0.06ab 1.4 ± 0.8a 64.3 ± 32.3 7.2 ± 2.9ab 71.6 ± 33.2 8.7 ± 6.9
9-16 y 12 11.6 ± 4.3ab 0.15 ± 0.09a 1.5 ± 1.0a 55.9 ± 34.9 5.2 ± 4.0a 61.3 ± 34.8 6.0 ± 3.6
17-22 y 13 13.9 ± 3.3b 0.37 ± 0.23b 5.4 ± 4.4b 59.5 ± 20.3 8.9 ± 5.8b 68.4 ± 22.5 7.8 ± 2.4
23-30 y 11 15.3 ± 4.0b 0.37 ± 0.23b 5.8 ± 4.4b 63.6 ± 20.6 7.2 ± 2.4ab 71.0 ± 21.3 7.1 ± 3.5
Mature forest
8 15.6 ± 3.1b 0.28 ± 0.13ab 5.7 ± 4.7b 69.6 ± 29.9 5.6 ± 1.4ab 75.8 ± 29.9 3.7 ± 1.5
ANOVA F 7.6*** 5.3*** 9.5*** 0.6 2.7* 0.72 2.1
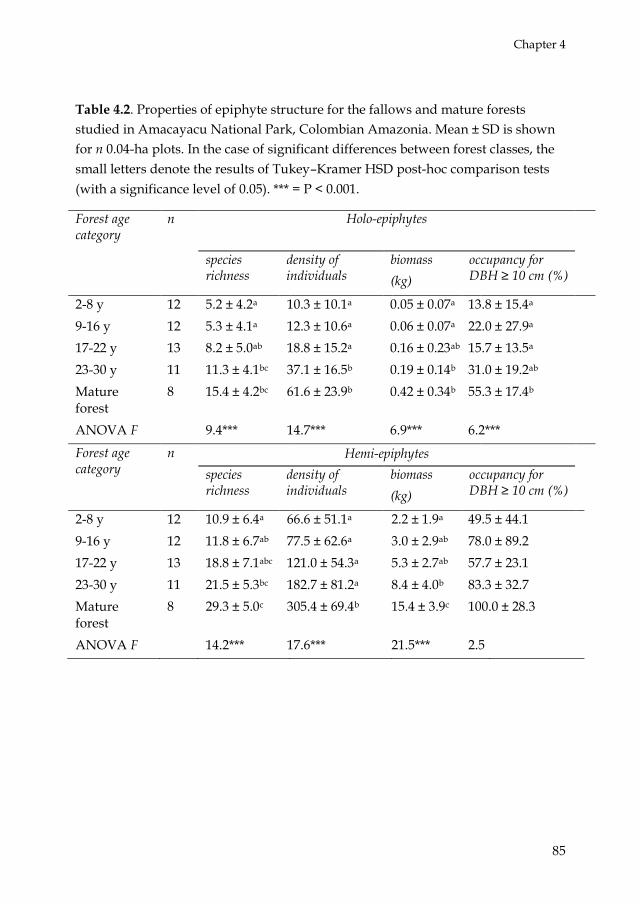
Chapter 4
85
Table 4.2. Properties of epiphyte structure for the fallows and mature forests
studied in Amacayacu National Park, Colombian Amazonia. Mean ± SD is shown
for n 0.04-ha plots. In the case of significant differences between forest classes, the
small letters denote the results of Tukey–Kramer HSD post-hoc comparison tests
(with a significance level of 0.05). *** = P < 0.001.
Forest age category
n Holo-epiphytes
species richness
density of individuals
biomass
(kg)
occupancy for DBH ≥ 10 cm (%)
2-8 y 12 5.2 ± 4.2a 10.3 ± 10.1a 0.05 ± 0.07a 13.8 ± 15.4a
9-16 y 12 5.3 ± 4.1a 12.3 ± 10.6a 0.06 ± 0.07a 22.0 ± 27.9a
17-22 y 13 8.2 ± 5.0ab 18.8 ± 15.2a 0.16 ± 0.23ab 15.7 ± 13.5a
23-30 y 11 11.3 ± 4.1bc 37.1 ± 16.5b 0.19 ± 0.14b 31.0 ± 19.2ab
Mature forest
8 15.4 ± 4.2bc 61.6 ± 23.9b 0.42 ± 0.34b 55.3 ± 17.4b
ANOVA F 9.4*** 14.7*** 6.9*** 6.2***
Hemi-epiphytes
species richness
density of individuals
biomass
(kg)
occupancy for DBH ≥ 10 cm (%)
2-8 y 12 10.9 ± 6.4a 66.6 ± 51.1a 2.2 ± 1.9a 49.5 ± 44.1 9-16 y 12 11.8 ± 6.7ab 77.5 ± 62.6a 3.0 ± 2.9ab 78.0 ± 89.2 17-22 y 13 18.8 ± 7.1abc 121.0 ± 54.3a 5.3 ± 2.7ab 57.7 ± 23.1 23-30 y 11 21.5 ± 5.3bc 182.7 ± 81.2a 8.4 ± 4.0b 83.3 ± 32.7 Mature forest
8 29.3 ± 5.0c 305.4 ± 69.4b 15.4 ± 3.9c 100.0 ± 28.3
ANOVA F 14.2*** 17.6*** 21.5*** 2.5
Forest age category
n

Recovery and succession
86
Table 4.3. Canonical coefficients of the variables used (see text) in the CCA of holo-
epiphytes and hemi-epiphytes, based on fifty-six 0.04-ha plots in Colombian
Amazonia.
Holo-epiphytes Hemi-epiphytes
Axis 1 Axis 2 Axis 1 Axis 2
Mocagua -0.92 -0.10 0.06 -0.03
Palmeras -0.70 -0.49 0.38 -0.14
San Martín -0.19 -0.01 0.21 -0.07
Mature forest - - - -
Age forest -0.02 -0.49 -0.28 -0.09
ln basal area 0.06 -0.01 -0.01 -0.03
Height trees 0.00 0.44 0.13 -0.01
ln small trees 0.03 -0.13 -0.03 0.07
ln large trees -0.21 -0.09 -0.02 0.06
x -0.37 -0.23 0.05 0.32
y -0.17 0.35 0.02 0.14
y2 0.05 0.22 - -
y3 - - -0.01 0.06
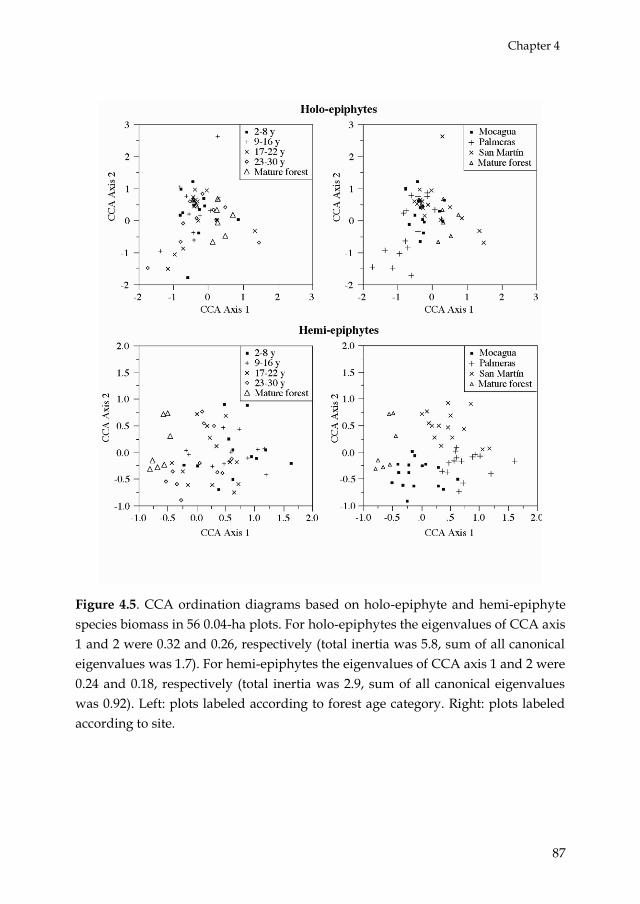
Chapter 4
87
Figure 4.5. CCA ordination diagrams based on holo-epiphyte and hemi-epiphyte
species biomass in 56 0.04-ha plots. For holo-epiphytes the eigenvalues of CCA axis
1 and 2 were 0.32 and 0.26, respectively (total inertia was 5.8, sum of all canonical
eigenvalues was 1.7). For hemi-epiphytes the eigenvalues of CCA axis 1 and 2 were
0.24 and 0.18, respectively (total inertia was 2.9, sum of all canonical eigenvalues
was 0.92). Left: plots labeled according to forest age category. Right: plots labeled
according to site.

Recovery and succession
88
DISCUSSION
EPIPHYTE RECOVERY IN SPECIES RICHNESS, NUMBER OF
INDIVIDUALS, AND BIOMASS.—The species richness, number of
individuals and biomass of both holo- and hemi-epiphytes increased
significantly from young fallows to old fallows and mature forests. These
results correspond to the widely documented dependence of epiphyte
proliferation on tree size (Burns and Dawson 2005; Wolf 2005; Zimmerman
and Olmsted 1992; Zotz and Vollrath 2003). In general, older forests have
larger trunk and branch surface areas that represent more habitat
partitioning and more available space for seed interception, colonisation
and biomass development (Tewari et al. 1985; Zotz and Andrade 2002).
While most epiphyte families showed the highest levels of species richness
and abundance in mature forests, some families, in particular
Polypodiaceae and Gesneriaceae, showed a preference for fallows. Species
of the Gesneriaceae, such as Codonanthe calcarata and C. crassifolia are well-
known for being recorded in association with ant gardens in successional
forests (Kleinfeldt 1978).
Holo-epiphytes were almost absent in the youngest fallows, whereas hemi-
epiphytes, which were mostly represented by aroids, were already
substantially present shortly after abandonment. As holo-epiphytes in
young fallows must enter from outside the fallows, the slow immigration
process often recorded for many epiphytes (Nadkarni 2000; Merwin et al.
2003; Wolf 2005), may largely explain their near-absence in incipient
fallows. In particular shade-tolerant species arrive late in the succession
(Barthlott et al. 2001; Wolf and Flamenco-S. 2006). For hemi-epiphytes, we
suggest that, in addition to immigration, individuals may establish from
viable vegetative fragments, or perhaps even from seeds, that have
survived the slash-and-burn practices of the pre-fallow stage. Most hemi-
epiphytes in the current study begin their life-cycle rooted in the soil and
Chapter 4
89
the relatively fertile condition of the soils in young fallows may have
contributed to their fast initial growth.
Whilst the density and biomass of hemi-epiphytes in incipient fallows were
higher than those of holo-epiphytes, in aging fallows the holo-epiphytes
showed a slightly faster increase in density and biomass. Presumably, the
within-fallow expansion rate of the epiphyte population in terms of
number of individuals and biomass is relatively independent of the influx
of seeds from outside the fallow, a reportedly slow process (see references
above). Once a holo-epiphyte is established in the fallow, its high
production of wind-dispersed seeds may contribute to its rapid expansion
within the fallow. In time, this process may be facilitated by the
exponentially expanding branch surface area in aging fallows. Contrary,
hemi-epiphytes produce relatively few seeds. In addition, most hemi-
epiphytes depend on germination in the soil and bark surface area along
tree trunks or lianas for attachment and support. Soil surface and stem
density hardly increase in aging fallows. Furthermore, stems become
rapidly covered by hemi-epiphytes, as shown by the high occupancy
values (Table 4.2). This may limit the within-fallow expansion of hemi-
epiphytes.
EPIPHYTE SPECIES TURNOVER IN TIME.—The eigenvalues of the
principal CCA axes were rather low. The first CCA axes explained only a
tiny fraction of the variation in the epiphyte species patterns. Congruent
with other epiphyte studies it seems that random processes predominated
the structuring of the epiphyte assemblages (Wolf 1994). Also, the small
plot size probably limited the explanatory power of the CCA.
Fallows are colonized by epiphytes with propagules arriving from nearby
locations, leading to configurations of species assemblages which reflect the
local species pools. The latter is shown by the effect of the spatial
Recovery and succession
90
coordinates and the sites on the holo- en hemi-epiphyte species
composition (Table 4.3; Fig. 4.5).
The lack of an age effect on the patterns of holo-epiphyte species
composition in the fallows corresponded to our expectation that through
time holo-epiphyte species have a more or less equal chance to settle and
grow in the expanding crown areas of the fallows. During the development
of the holo-epiphyte community in any fallow the incoming species would
essentially represent a random draw from the surrounding fallows and
mature forests. Because the species tend to accumulate in aging fallows
(Fig. 4.3), eventually this process should make older fallows more similar to
each other in holo-epiphyte species composition. However, evidence for
this was not found in the CCA, probably because the effect of the randomly
incoming species still prevailed and masked any trend in time (regarding
species composition). Also, the lack of an age effect on holo-epiphyte
species composition might be partially due to the low density of species
and individuals in the plots, prohibiting the detection of changing species
composition in time because of the small sample size.
The age effect was clearer for the hemi-epiphytes, suggesting that species
turnover takes places in the aging fallows. In view of the increasing density
and biomass of hemi-epiphytes in developing fallows (Fig. 4.3), the within-
plot hemi-epiphyte expansion probably becomes more limited by space
(phorophyte density, bark surface area, or soil availability). Monitoring of
colonization and growth of hemi-epiphytes in permanent plots in
combination with experimental studies (e.g. species removal or artificial
elimination of the above-mentioned limitations) is needed to test if the
species turnover in time is due to successive replacement of competitively
inferior species.
Chapter 4
91
ACKNOWLEDGEMENTS
Tropenbos-Colombia, Amacayacu National Park, the Herbarium of the
Universidad de Antioquia (HUA), the Universidad Nacional, sede Leticia,
and the peoples of the communities Mocagua, San Martin de Amacayacu
and Palmeras are gratefully acknowledged for their support. Comments
from four reviewers helped to improve the manuscript. Dan Yeloff kindly
corrected the English.

92


Aroid gap recruitment
94
Abstract
Newly created gaps in tropical forests are rapidly colonized by plants, as
result of seed- and/or vegetative recruitment. Seed recruitment is
characteristically low, as it is limited by low and uncertain seed supply or
seedling establishment. In contrast, vegetative recruitment by lateral
displacement and the sprouting of surviving fragments may be important
recruitment pathways, particularly for monocotyledons. By means of
transects along the gap-forest gradient and field experiments we monitored
during 14 months multiple recruitment pathways for hemi-epiphytic aroids
that are among the first to colonize man-made gaps (chagras) in
Amazonian forest (Amacayacu National Park, Colombia). We found little
evidence of seed recruitment, notwithstanding that some species produced
numerous highly viable seeds. Higher germination rates under shaded
conditions suggest that seed recruitment is largely confined to forest. In
contrast, we detected several traits in hemi-epiphyte aroids that improve
their capacity to colonize gaps rapidly through vegetative recruitment.
Firstly, stem cuttings of five study species experimentally placed in chagras
all showed sprouting capacity, suggesting that aroid fragments may persist
in gaps. Secondly, near the forest edges was found a high abundance of
creeper plants with flagellar shoots which grew rapidly, indicating that
aroids are foraging for essential resources and dispersing meristems
clonally. Finally, hemi-epiphytic aroids in the forest edge up to 30 m from
the gap exhibited habitat selection, growing towards the gap. These traits
help explain why hemi-epiphytic arrival at gap-trees is faster than that of
their holo-epiphyte co-inhabitants, which depend mostly on seed dispersal.
Key words: Amacayacu National Park; directional growth; gap-understory
light gradient; priority principle; vegetative recruitment
Chapter 5
95
INTRODUCTION
IN TROPICAL FORESTS FALLEN TREES and subsistence agriculture
regularly produce small scale gaps that offer plants a new habitat for
colonization and create a gap-understory light gradient (Grubb 1977;
Chazdon 1986; Denslow 1987; Phillips et al. 2009). The ability of plants to
establish in these continuously arising new habitats, the regeneration niche
sensu Grubb (1977), is likely to enhance persistence in the forest (Hubbell et
al. 1999).
Colonization into gaps is the result of seed- or vegetative recruitment
(Schnitzer and Carson 2001). Seed recruitment in tropical forests is
characteristically low as it is limited by low and uncertain seed supply or
seedling establishment (Clark et al. 1999). In apparent agreement, it has
been shown that in the Amazon rain forest wind-dispersed holo-epiphytes
are slow to colonize young fallows (Benavides et al. 2006). In contrast, the
same study suggested that vegetative recruitment into gaps was rapid as
the abundance of herbaceous creeping plants in young gaps was already
high.
Vegetative recruitment may result from sprouting roots, surviving stem
fragments upon gap formation, or from laterally spreading creeping plants
that enter the gap from the adjacent intact forest (Schnitzer et al. 2008). In
lowland tropical rain forest, creeping plants are often the first to colonize
new gaps, leading to canopy closure within a few months (Schnitzer et al.
2000). In lowland Amazonia, many creeping plants are hemi-epiphytes, i.e.
epiphytes that spend part of their life cycle rooted in the soil, which
contribute significantly to the total biomass and species diversity in the
forest (Nieder et al. 2000; Benavides et al. 2006). Most Amazonian hemi-
epiphytes are aroids, after orchids one of the largest herbaceous families in
tropical America (Croat 1992). Not surprisingly, it has been shown that
hemi-epiphytic aroids are amongst the first herbal plants to colonize open

Aroid gap recruitment
96
areas (Dirzo et al. 1992). Even young fallows may already contain a large
number of aroid individuals and species and these early hemi-epiphytic
colonists may hamper the establishment of late arrivals (priority principle)
(Barkman 1958; Benavides et al. 2006).
Hemi-epiphytes may be divided into primary and secondary functional
types. Primary hemi-epiphytes germinate on the tree; secondary hemi-
epiphytes germinate in the soil and ascend a tree later in their life cycle.
Juvenile plants thus creep along the forest floor, foraging for new habitat
space (Andrade and Mayo 2000). In addition, vegetative lateral spread may
occur in already tree-attached hemi-epiphytic individuals that start
producing descending shoots to the ground. In many aroids, descending
shoots exhibit abrupt morphological changes by becoming flagellar (Ray
1992). Flagellar branches may have rapid growth and are not only seen as a
mechanism to forage for essential resources but also to multiply and
disperse meristems clonally to colonize newly available habitats (Andrade
and Mayo 2000). The shift between both types of growth forms, flagellar or
not, appears to be driven by loss of contact with a support-tree and
unknown endogenous factors, perhaps associated with photosynthetic
levels (Ray 1992; Andrade and Mayo 2000).
Rapid colonization into gaps is not only facilitated by the formation of
foraging flagellar shoots, but also by the capacity to make good use of the
higher levels of incident light in gaps, decreasing gradually along the gap-
understory gradient (Chazdon and Fetcher 1984). Early-successional
species are particularly believed to show rapid growth, related to stem
displacement velocity, under gap conditions (Bazzaz and Pickett 1980).
In addition to rapid growth, light signal ‗interpretation‘ would also
enhance vegetative recruitment of gaps if creeping stems, either flagellar or
not, show positive directional growth along the gap-forest understory light
gradient. In contrast, hemi-epiphytic aroids would benefit from negative

Chapter 5
97
directional growth (i.e. towards the shade, skototropism) to facilitate the
encounter with a host tree trunk (Strong and Ray 1975). In general,
epiphytes tend to establish slowly on trees (Nadkarni 2000; Ibisch et al.
1996). Rapid tree colonization may be important since the priority principle
dictates that early arriving species have an advantage over late arrivals
(Barkman 1958). In this study we evaluated this apparent adaptive
contradiction by assessing the directional growth of creeping hemi-
epiphytic aroids along the gap-forest light gradient.
Most studies of gap regeneration studied trees (Schnitzer et al. 2008). Little
is known neither about other growth forms, nor about the contribution of
vegetative recruitment to forest regeneration (Lasso et al. 2009). Here, we
address vegetative gap recruitment of hemi-epiphytic aroids in Amazonian
lowland rainforest. Four questions were addressed: (1) what is the relative
contribution of seed and vegetative recruitment in young chagras and
fallows, forest edges and mature forests, (2) what is the speed of stem
displacement in these habitats, (3) what is the preferred growth direction of
creeping stems? and (4) do early-successional species show higher stem
displacement rates than late-successional species under field conditions? To
complete our assessment of gap regeneration, we also determined seed
germination rates of three aroid species under differing light and soil
conditions and stem-fragment resprout ability for another five aroid
species. Additionally, species distribution and growth rate is discussed in
relation to their successional cohort.
METHODS
STUDY AREA.—Field work was carried out from May 2008 to September
2009 in Amacayacu National Park in the southern part of Colombian
Amazonia and in the adjacent Ticuna territory (3º S, 69º-70º W). The area
has a bimodal annual precipitation of 3200 mm with a dry period between
Aroid gap recruitment
98
June and September when the average monthly precipitation is about 270
mm. The average annual temperature is ca 26 ºC and average relative
humidity ca 86 percent (Rudas and Prieto 2005). In total, 58 species of
epiphytic aroids have been reported from the area (Benavides et al. 2006).
Gaps are often colonized heavily by Philodendron ernestii Engl. (Araceae), a
hemi-epiphyte that produces foraging flagellar shoots. Local communities
use shifting cultivation for subsistence agriculture. Man-made clearings,
―chagras‖, in the forest are 2 to 4-ha in size, generally square or rectangular
in shape, and are used for poli-culture plantations of crops like pineapples,
cassava and bananas. After approximately 6 years, the chagras are
abandoned and the forest regenerates (fallows). Thus, fallows have a
different history than regenerating natural tree-fall gaps in the forest that
are also smaller in size. From here on, the term gap will be used as a
generic term including fallows, chagras, or natural gaps with clarifications
where necessary.
TRANSECT FIELD SAMPLING. —We carried out two transect studies. In
the first, Transect Study I, we quantified hemi-epiphyte plant density,
recruitment rate, and growth along the gap-forest gradient. We laid out 14
belt transects over the centre of recently created chagras (6) and fallows less
than 2 yr old (8). These transect continued 25 m into the forest bordering
chagras or fallows at each side. Eight additional belt transects of 25 m
length were laid out in mature forests. All transects were 2 m wide, and
divided into adjoining plots of 5 m length. In each plot, all epiphytic aroids
were sampled, both those on the ground as those growing attached to trees.
For each individual plant, we recorded the species name, and shoot
morphology, i.e. caulescent (rosettes), climber, or creeper, either flagellar or
not (adapted from Ray 1992). Species were assigned to early-, mid- or late-
successional cohorts (Appendix 5.1), based on a successional study of hemi-

Chapter 5
99
epiphytes in fallows and mature forests, elsewhere in the same area
(Benavides et al. 2006).
Recruitment and its mode (vegetative or seedling) was recorded in each
plot once every two months between July 2008 and September 2009. At
these same intervals, we carefully marked the stems of a randomly selected
subset of approximately 25 individuals per transect, to measure stem length
and stem elongation (vegetative displacement). One transect was burned
after two months and was therefore removed from further measurements.
For each of the selected plants, the light environment was estimated from
hemispherical photographs and expressed as a percentage of diffuse light
(i.e. diffuse site factor; Anderson 1964). For this, photographs were taken
directly above each plant on overcast days, early in the morning or late in
the afternoon, using a Nikon F75 camera (Nikon Corporation, Tokyo,
Japan) equipped with a Sigma 8 mm lens (Sigma Corporation, Kanagawa,
Japan) and were underexposed by one stop (Hale and Edwards 2002).
Image segmentation was performed manually selecting a threshold level of
red that allowed the best separation of the canopy from the sky using
Adobe® Photoshop® CS2 software (version 9; Adobe Systems Inc. 2005).
Images were analyzed using the standard overcast sky model and the
defaults of Gap Light Analyzer software program (Frazer et al. 1999).
For the numerical analyses, the plots from all transects were grouped into
three habitats: open (i.e. fallows and chagras), forest edge (i.e. in forests
bordering chagras or fallows), and forest (i.e. in the mature forest).
Differences in average plot values for stem density, recruitment, stem
length, and stem displacement between habitats were analyzed with
ANOVA and subsequent Tukey-Kramer tests. The association between the
successional cohorts and transect habitats was tested by means of Fourth-
corner analysis (Legendre et al. 1997; Dray and Legendre 2008) as
implemented in the ade4 package (Dray and Dufour 2007) in r 2.11. This
Aroid gap recruitment
100
analysis was done applying 999 permutations under model 1 (i.e. the
number of plants of each species was randomly assigned to the habitats).
Paired samples t-tests were done for climbers and creepers to analyze
transect differences in stem growth and diffuse light percentage between
flagellar and non-flagellar forms, for each habitat. The conditions of normal
distribution of residuals or mean differences were checked by means of
Kolmogorov-Smirnov tests with Lilliefors significance correction. To
improve additivity and homoscedasticity the response variables were log-,
arc-sin or square-root transformed, if needed. The association between stem
growth and diffuse light percentage was examined by means of Spearman
correlation coefficients. All analyses were performed using SPSS, version
11.0 (2001).
In the second transect study, Transect Study II, we studied the growth
direction of hemi-epiphytic aroids. For this, we laid out an additional 21
gap-understory transects, 11 in recently created chagras and 10 in natural
gaps in the forest. Natural gaps were selected along a 5 km path in the
mature forest, typically rectangular in shape and approximately 25 x 10 m in
size. Transects were placed perpendicular to the forest edge and extended
60 m into the forest and 40 m into the chagra or the gap (or until the gap
centre). Along each transect, we randomly selected 10 points and at each
point we selected the nearest individual plant in each of the four quadrants,
independent of species, following the point-centered-quarter (PCQ)
method of vegetation sampling (Cottam and Curtis 1956; Engeman et al.
1994). This method was chosen to obtain a representative sample of the
individuals. In addition, four individuals of Philodendron ernestii were
sampled at each PCQ sampling point, applying the same selection method.
For each selected aroid plant we recorded the growth direction of the
whole plant and that of the youngest internode. For vegetative spreading
individuals, each stem was regarded as a separate individual (ramet). The
Chapter 5
101
growth direction of the whole plant was defined by the line that connected
the oldest internodes and the apex of the plant. The directional growth of
the youngest internodes was defined by the line between the apex and the
last two internodes (Sampaio et al. 2004). Testing for directedness in the
transect intervals in the forest was done by means of a V-test for circular
uniformity (Batschelet 1981), applying as alternative hypothesis a unimodal
distribution with mean direction of 0° (i.e. the direction of each transect
towards the light). Watson‘s two-sample test of homogeneity was used to
evaluate if the growth direction of the entire plant differed from that of the
apical internode. All tests were performed with the Circular Statistics
Package (Lund and Agostinelli 2009) in R program (R Development Core
Team 2008).
The light environment at each 10 m transect interval in the forest and at the
start of each transect (in the open habitat) was estimated from hemi-
photographs taken at 1.3 m height in nine transects, four in recently created
chagras and five in natural gaps. The diffuse light percentage was analyzed
following the method described above. In addition, each photograph taken
in the forest was divided in two halves with the split perpendicular to the
transect direction. With a one-tailed Wilcoxon paired sample test it was
tested if diffuse light percentages in the halves oriented towards the open
habitat were higher than the percentages found in the halves oriented
towards the forest.
FIELD EXPERIMENTS.—We carried out two field experiments. In a first
experiment, we studied seed germination of three species with available
fruits during the fieldwork (Philodendron ernestii Engl., P. wittianum Engl.
and P. fragantissimum (Hook.) G. Don). P. ernestii and P. wittianum were
sown in November 2008 and P. fragrantissimum was sown two months later.
We sowed seeds out of a pooled batch of seeds that were collected from at
least ten mature fruits of eight individual plants per species. Ten seeds

Aroid gap recruitment
102
were sown in every cell of a 32-cell tray. Half of the cells were filled with a
mix of soil samples taken at 0-10 cm depth (after removal the ectorganic
horizons) in four mature forest sites, and the others 16 cells with a mix of
such soil samples from three fallows. Two such trays were placed on a table
in a clearing under each of three light exposure regimes (for P. ernestii only
one tray per light regime was used). Light exposure was varied with shade
cloth that blocked 25, 55 and 85 percent of sunlight. While keeping the light
exposure regime, the position of the trays on the table was changed
randomly each week. Soil samples were analyzed by standard procedures
(analytical methods in IGAC 1990) at the soil laboratory of the Instituto
Geográfico Agustín Codazzi in Bogotá. Differences between forest and
fallow origins were tested by means of Mann-Whitney U tests. The
germination rates of all three species dropped substantially after two
months. The arcsin-transformed (Anscombe 1948; Zar 1984) proportion of
seeds that had germinated at that moment was analyzed as function of the
fixed effects of light and soil using model I two-way factorial ANOVA with
equal replication (Zar 1984). The distribution of the residuals of these
analyses was unimodal and symmetrical, but deviated slightly from
normal.
In a second experiment, we evaluated sprouting capacity of stem fragments
in chagras. In June 2009, we collected stem fragments of five Philodendron
species (species mentioned above plus P. eleniae Croat and P.
elaphoglossoides Schott) from at least ten mature individuals, each found at
distances over 25 m in forests or fallows. Cuttings with three nodes were
taken from the mid portion of stems. In each of four recently created
chagras, 20 fragments per species were randomly placed in 0.5 x 0.5 m cells
of a 5 x 5 m m grid, one fragment per cell. Sprouting ability (green growing
buds) was determined after six weeks.
Chapter 5
103
RESULTS
In Transect study I we recorded a total of 2143 aroid plants, represented by
43 species and 6 genera (Appendix 5.1). Gaps (chagras and fallows)
contained 25 aroid species, about half of the total richness in species
recorded in fallow chronosequences and mature forests elsewhere in the
area (Benavides et al. 2006). Aroid density was lower in gaps than in forest
edges or mature forests (Table 5.1). Climbers and creepers occurred in
about the same densities, and caulescent plants were less abundant. About
half (25) of the species developed flagellar shoots during the field study
(Appendix 5.1). However, in all habitats, flagellar plants clearly showed
lower densities than plants without flagellar shoots (Table 5.1). On average,
16 percent of all aroid plants showed flagellar shoots in gaps, 18 percent in
forest edges, and 13 percent in mature forests.
Mid- and late-successional species were least abundant in the open habitat
(Table 5.2). Plants from both early- and late-successional cohorts
(Benavides et al. 2006) were significantly associated with habitat (Fourth-
Corner Analyses, F = 116.1, P < 0.001 and F = 37.4, P = 0.028, respectively).
Early-successional cohorts were positively associated with the open habitat
(D = 0.26, P = 0.003) and negatively with the forest habitat (D = -0.25, P =
0.003). Late- successional cohorts showed the opposite pattern and were
negatively related with the open habitat (D = -0.16, P < 0.027) and
positively with the forest habitat (D = 0.14, P = 0.46).

104
Table 5.1. Aroid density in gaps (chagras and young fallows), forest edges, and mature forests, arranged over n
transects. F is with flagellar stems, NF is without flagellar stems. ANOVA test results of plot means from n transects
against habitats are in the lowermost row. The superscript letter codes indicate the result of Tukey-Kramer HSD post-
hoc tests. * = 0.01 ≤ P < 0.05; ** = 0.001 ≤ P < 0.01; *** = P < 0.001.
Habitat Total plants
Total plots n All growth forms
number of plants per 10 m2 (mean ± one SD)
Gap 482 176 14 3.1 ± 3.29a
Forest edge 1088 115 14 9.8 ± 4.98b
Forest 573 40 8 14.3 ± 4.76b
ANOVA F 19.9***
Habitat Climber Creeper Caulescent
NF F NF F NF F
number of plants per 10 m2 (mean ± one SD)
Gap 0.8 ± 1.37a 0.1 ± 0.19a 1.5 ± 1.39a 0.4 ± 0.45a 0.3 ± 0.47a 0.0 ± 0.05a
Forest edge 3.3 ± 2.19b 0.5 ± 0.52b 3.4 ± 1.71b 1.1 ± 1.07b 1.4 ± 1.15b 0.1 ± 0.11a
Forest 5.9 ± 2.65b 1.1 ± 0.64b 4.1 ± 1.88b 0.7 ± 0.33ab 2.4 ± 1.17b 0.2 ± 0.21b
ANOVA F 26.8*** 10.2*** 7.3** 4.7* 21.8*** 5.5**

Chapter 5
105
Table 5.2. Aroid density broken down to successional cohort, in gaps (chagras and young fallows), forest edges and
mature forests, arranged over n transects (see total plants and plots in Table 5.1).
Habitat n Early-successional Mid-successional Late-succesional
number of plants per 10 m2 (mean ± one SD)
Gap 14 2.3 ± 2.29 3.0 ± 3.05 1.1 ± 1.17
Forest edge 14 4.7 ± 2.14 8.6 ± 4.64 5.1 ± 3.57
Forest 8 4.1 ± 2.07 12.9 ± 5.24 9.0 ± 3.25
Table 5.3. Aroid recruitment in gaps (chagras and young fallows), forest edges and mature forests, arranged over n
transects. ANOVA test results of plot means from n transects against habitats are in the lowermost row. The
superscript letter codes indicate the result of Tukey-Kramer HSD post-hoc tests. ** = 0.001 ≤ P < 0.01.
Habitat Total plots n Total recruitment Recruitment mode
Seedling Vegetative Unknown
number of plants per 10 m2 (mean ± one SD [number of plants])
Gap 164 13 0.30 ± 0.22 [45] 0.13 ± 0.16 [19] 0.15 ± 0.12ab [23] 0.02 ± 0.04a [3]
Forest edge 111 13 0.51 ± 0.24 [55] 0.19 ± 0.18 [21] 0.31 ± 0.21b [33] 0.01 ± 0.02a [1]
Forest 40 8 0.58 ± 0.57 [23] 0.30 ± 0.32 [12] 0.10 ± 0.15a [4] 0.18 ± 0.23b [7]
ANOVA F 1.6 0.96 6.5** 6.0**
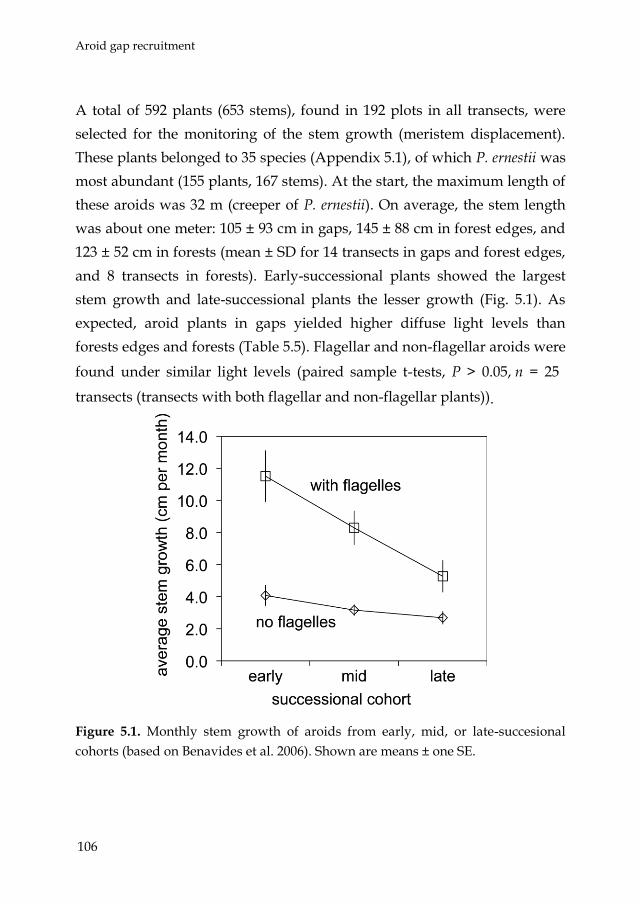
Aroid gap recruitment
106
A total of 592 plants (653 stems), found in 192 plots in all transects, were
selected for the monitoring of the stem growth (meristem displacement).
These plants belonged to 35 species (Appendix 5.1), of which P. ernestii was
most abundant (155 plants, 167 stems). At the start, the maximum length of
these aroids was 32 m (creeper of P. ernestii). On average, the stem length
was about one meter: 105 ± 93 cm in gaps, 145 ± 88 cm in forest edges, and
123 ± 52 cm in forests (mean ± SD for 14 transects in gaps and forest edges,
and 8 transects in forests). Early-successional plants showed the largest
stem growth and late-successional plants the lesser growth (Fig. 5.1). As
expected, aroid plants in gaps yielded higher diffuse light levels than
forests edges and forests (Table 5.5). Flagellar and non-flagellar aroids were
found under similar light levels (paired sample t-tests, P > 0.05, n = 25
transects (transects with both flagellar and non-flagellar plants)).
Figure 5.1. Monthly stem growth of aroids from early, mid, or late-succesional
cohorts (based on Benavides et al. 2006). Shown are means ± one SE.

Chapter 5
107
Over 14 months the largest stem growth rate was 63.4 cm per month. Over
two months the fastest growth was 213 cm (106 cm/mo). These extremes
were recorded for a flagellar climber of P. ernestii. Fifty plants (7.6%) grew
faster than 2 m per year. Thirty-one plants (13 flagellar plants) of these
grew more than 3 m per year. Due to the large variation in stem growth,
especially in gaps, differences between habitats or growth forms were hard
to detect (Table 5.4). Thus, stem growth for both flagellar and non-flagellar
stems tended to show lowest values in the forest transects, but this
difference was only significant for flagellar creepers and non-flagellar
caulescent plants. Likewise, flagellar forms of climbers and creepers tended
to grow faster than non-flagellar plants (up to four times as fast), but only
for flagellar creepers in forest edges this difference was larger than
expected by chance (paired sample t-tests, P < 0.001, n = 13 transects).
FIELD EXPERIMENTS.—Germination rates were higher under more shade
for all three tested aroid species (Table 5.6; light factor effect P < 0.001 for
all species). The soil effect and soil-light interaction effects tended to be
non-significant (P > 0.10). Differences in soil analytical variables between
fallow and forest samples were not detected (P > 0.4; overall levels were as
follows (means ± SD, n = 7), percentage of sand 34 ± 2, silt 38 ± 6 and, clay
29 ± 7; pH (in water) 3.9 ± 0.5; calcium 2.3 ± 2.2 cmol (+) /kg; magnesium
1.0 ± 0.5 cmol (+)/kg; potassium 0.5 ± 0.3 cmol (+)/kg; sodium 0.2 ± 0.1
cmol (+)/kg; base saturation percent 22 ± 14 (%); carbon percent 4 ± 2 (%);
phosphorus 9 ± 9 mg/kg. Only for P. ernestii a significant soil effect was
found (more germination on forest soil, P < 0.001). For P. fragantissimum (P
= 0.07) the soil-light interaction effect was marginally significant (P = 0.07).
In the sprouting trials, thirty fragments (7.5 %) sprouted after six weeks
(seven from P. ernestii, P. fragantissimum, and P. wittianum; six from P.
eleniae, and three from P. elaphoglossoides).

108
Table 5.4. Monthly aroid stem growth in gaps (chagras and young fallows), forest edges and mature forests, arranged
over n transects (see total plots in Table 3). F is with flagellar stems, NF is without flagellar stems. ANOVA test results
of plot means from n transects against habitats are in the lowermost row. The superscript letter codes indicate the
result of Tukey-Kramer HSD post-hoc tests. * = 0.01 ≤ P < 0.05; ** = 0.001 ≤ P < 0.01.
Habitat n All plants Climber Creeper Caulescent
NF F NF F NF F
cm per month (mean ± one SD [number of plants])
Gap 13 8.9 ± 7.9 [113]
12.1 ± 20.5 [23]
17.1 ± 16.1 [8]
7.4 ± 7.5 [54]
14.2 ± 12.1a [23]
1.7 ± 2.2a [5]
[0]
Forest edge
13 4.9 ± 2.8 [275]
5.0 ± 4.0 [92] 10.5 ± 8.9 [30]
2.1 ± 1.4 [72]
9.1 ± 6.3a [45]
1.7 ± 3.4a [35]
2.2
[1]
Forest 8 2.2 ± 1.1 [246]
2.8 ± 2.4 [112] 5.5 ± 5.3 [23] 1.0 ± 0.4 [59]
1.9 ± 2.1b [17]
0.1 ± 0.1b [31]
1.2 ± 1.4 [4]
ANOVA F 1.1 0.5 0.6 1.8 10.4** 3.7* not tested
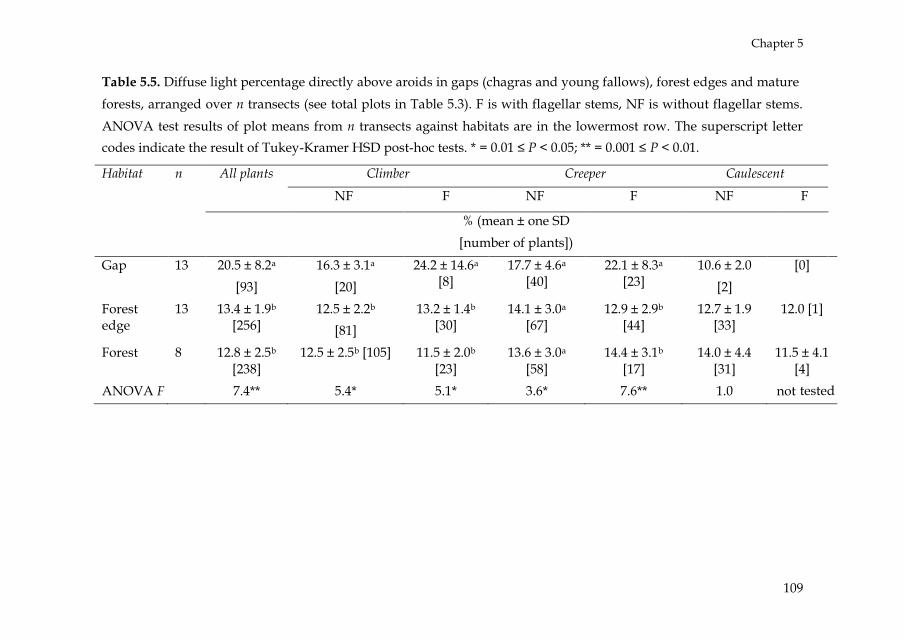
Chapter 5
109
Table 5.5. Diffuse light percentage directly above aroids in gaps (chagras and young fallows), forest edges and mature
forests, arranged over n transects (see total plots in Table 5.3). F is with flagellar stems, NF is without flagellar stems.
ANOVA test results of plot means from n transects against habitats are in the lowermost row. The superscript letter
codes indicate the result of Tukey-Kramer HSD post-hoc tests. * = 0.01 ≤ P < 0.05; ** = 0.001 ≤ P < 0.01.
Habitat n All plants Climber Creeper Caulescent
NF F NF F NF F
% (mean ± one SD
[number of plants])
Gap 13 20.5 ± 8.2a
[93]
16.3 ± 3.1a
[20]
24.2 ± 14.6a [8]
17.7 ± 4.6a [40]
22.1 ± 8.3a [23]
10.6 ± 2.0
[2]
[0]
Forest edge
13 13.4 ± 1.9b [256]
12.5 ± 2.2b
[81]
13.2 ± 1.4b [30]
14.1 ± 3.0a [67]
12.9 ± 2.9b [44]
12.7 ± 1.9 [33]
12.0 [1]
Forest 8 12.8 ± 2.5b [238]
12.5 ± 2.5b [105] 11.5 ± 2.0b [23]
13.6 ± 3.0a [58]
14.4 ± 3.1b [17]
14.0 ± 4.4 [31]
11.5 ± 4.1 [4]
ANOVA F 7.4** 5.4* 5.1* 3.6* 7.6** 1.0 not tested

110
Table 5.6. Seed germination rates after two months for three species of Philodendron, in fallow and mature soils under
three levels of blocked sunlight. Each combination of treatments was replicated 16 times for P. ernestii, and 32 times for
P. fragrantissimum and P. wittianum.
P. ernestii P. fragrantissimum P. wittianum
fallow soil forest soil fallow soil forest soil fallow soil forest soil
% (mean ± one SD)
Shade (85%) 24.4 ± 14.6 39.4 ± 19.1 33.4 ± 18.2 32.5 ± 19.3 49.1 ± 17.8 47.5 ± 28.7
Half (55%) 15.6 ± 12.1 22.5 ± 20.2 27.5 ± 19.7 17.5 ± 13.4 26.6 ± 16.4 39.7 ± 24.3
Sun (25%) 9.4 ± 8.5 13.8 ± 9.6 1.3 ± 3.4 1.9 ± 4.7 9.4 ± 13.2 9.7 ± 9.7
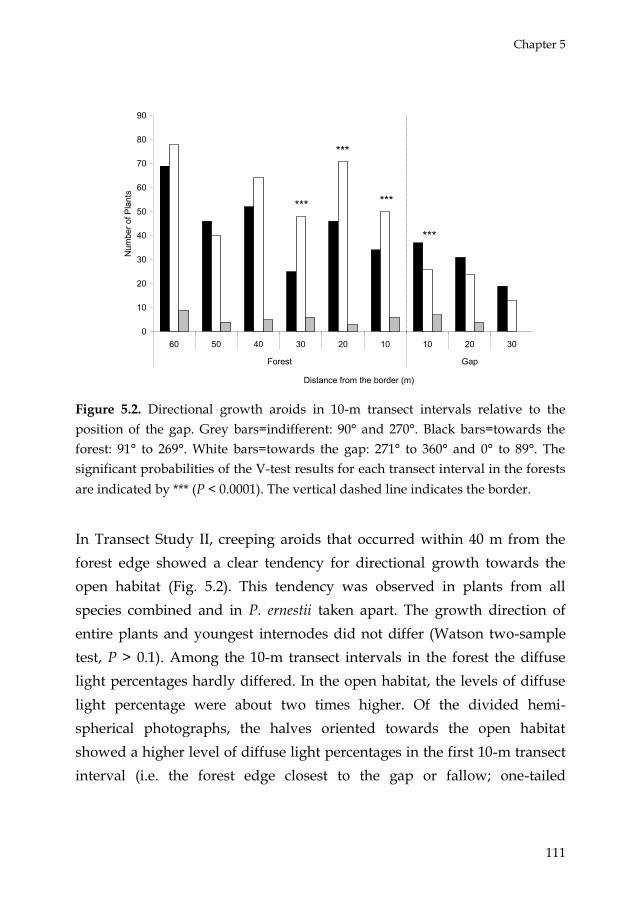
Chapter 5
111
0
10
20
30
40
50
60
70
80
90
60 50 40 30 20 10 10 20 30
Forest Gap
Distance from the border (m)
Num
ber o
f Pla
nts
***
***
***
***
Figure 5.2. Directional growth aroids in 10-m transect intervals relative to the
position of the gap. Grey bars=indifferent: 90° and 270°. Black bars=towards the
forest: 91° to 269°. White bars=towards the gap: 271° to 360° and 0° to 89°. The
significant probabilities of the V-test results for each transect interval in the forests
are indicated by *** (P < 0.0001). The vertical dashed line indicates the border.
In Transect Study II, creeping aroids that occurred within 40 m from the
forest edge showed a clear tendency for directional growth towards the
open habitat (Fig. 5.2). This tendency was observed in plants from all
species combined and in P. ernestii taken apart. The growth direction of
entire plants and youngest internodes did not differ (Watson two-sample
test, P > 0.1). Among the 10-m transect intervals in the forest the diffuse
light percentages hardly differed. In the open habitat, the levels of diffuse
light percentage were about two times higher. Of the divided hemi-
spherical photographs, the halves oriented towards the open habitat
showed a higher level of diffuse light percentages in the first 10-m transect
interval (i.e. the forest edge closest to the gap or fallow; one-tailed

Aroid gap recruitment
112
Wilcoxon paired sample test, P = 0.034). The halves from the other 10-m
transect intervals did not differ.
DISCUSSION
In Amazonian rain forest, aroids are a conspicuous component of the
herbal ground vegetation (Bazzaz and Pickett 1980). Many hemi-epiphytic
aroids produce flagellar shoots, which is seen as an adaptation to forage the
forest floor (Andrade and Mayo 1998, 2000). Hence, it is not surprising that
hemi-epiphytic aroids have been reported to be among the first plants to
colonize man-made gaps (chagras), which they achieve much faster than
holo-epiphytes (Benavides et al. 2006). The results of present study confirm
that hemi-epiphytic aroids are aggressively occupying newly available gap
space. Chagras and young fallows already contained about half of all aroid
species in the area and aroid density in this habitat was already about one
third that of forest edges and mature forests (Table 5.1).
Rapid gap occupation may occur through plants, or fragments thereof, that
somehow survive the process of gap-creation and from new recruitment,
either vegetative or by means of seeds (Schnitzer et al. 2008). During 14
months of gap surveys, we found that new aroid recruitment into gaps was
low (0.30 plants per 10 m2) in comparison with average total aroid density
(3.1 plants per 10 m2) (Tables 5.1 and 5.3). These low recruitment rates are
surprising since some aroids produce numerous highly viable seeds and
many species possess abilities for clonal reproduction via reiteration
(Andrade and Mayo 1998, 2000). Apparently, most gap aroids are already
present in the gaps from early on. Whether these early gap species
originated from seed or from surviving adults remains elusive, since we
were not able to document the creation of chagras in situ. On the basis of
our field observations, however, we suggest that most early aroid gap
occupants originated from surviving stem fragments. Indeed, the stem

Chapter 5
113
cuttings of the five study species experimentally placed in chagras all
showed capacity for new growth. Other studies also showed that fragment
regeneration may prevail over seed recruitment (Lasso et al. 2009) and that
fragments may have similar or higher survival than seedlings and higher
growth rates than saplings (Dietze and Clark 2008; Khan et al. 1986). Our
inventories took place in man-made chagras where agricultural practices
remove many previously established aroid seedlings and adult aroid stems.
In natural gaps, we expect aroid plant and fragment survival to be even
higher.
Having concluded that early seed recruitment and the survival of plants or
their fragments are likely drivers of aroid hemi-epiphyte communities in
young gaps, subsequent recruitment also takes place, even though at
relatively low rates. Seed recruitment tended to be slightly lower in gaps
than in forests, probably because aroids show higher germination rates
under shady conditions, as we documented for several species (Table 5.6).
Vegetative recruitment in gaps was similar to that in mature forests and
about two times lower than in forest edges (Table 5.3). However, because
the overall aroid density in gaps was much lower in gaps than in the other
habitats (Table 5.1), the relative recruitment in gaps was highest. This may
be explained by assuming that aroids are particularly well adapted to
recruit gaps by means of stem displacement. In support of this, we found a
relatively high abundance of flagellar creepers in forest edges (and gaps),
which grew rapidly. In the tropics, although quantitative measurements are
lacking, indications are that lianas rapidly spread laterally, contributing to
the formation of tangles after gap creation (Peñalosa 1984; Putz 1984). The
average displacement of flagellar stems in forest edges (83 cm per year)
would already permit stems to reach a gap within several years. Our data
suggested that about 4.7 percent of the aroids stems might show an annual
growth rate of 3 m per year or faster. In addition, creeper flagellar plants

Aroid gap recruitment
114
showed increased stem growth in forest edges, promoting stem foraging
behavior and dispersing meristems clonally to colonize newly available
habitats under expectably lighter conditions.
Moreover, creeping stems of P. ernestii and other hemi-epiphytic aroids in
the forest edge up to 30 m from the gap showed directional growth
towards the gap (light), which is consistent with most cases of habitat
selection through directional growth that are based on shade avoidance
mechanisms (Sampaio et al. 2004; Camacho-Cruz et al. 2000; Ballare et al.
1990; Novoplansky et al. 1990). Indeed, the availability of light as radiation
scattered or reflected from leaves or trees is a powerful environmental
signal in the lower strata of the forest, triggering a shade avoidance
response and stimulating stem elongation (Shashar et al. 1998; Ballare et al.
1990; Théry 2001). Interestingly, growth in the opposite direction,
skototropism, has been recognized as the mechanism how climber plants
encounter a host (Strong and Ray 1975). In our study, however, we found
no evidence for skototropism and up to 10 m from the gap edge, the gap
side diffuse site factor at individual measurement points was significantly
higher than that of the forest side. Beyond 10 m from the gap edge we
found no differences in light conditions between both sides, which may be
explained by the limitation of hemispherical photograph analysis to detect
scattered light (Roxburgh and Kelly 1995).
Early- and late-successional cohorts were associated with different habitats.
Early successional plants were over-represented in gaps and under-
represented in forest habitats, and late successional plants showed the
opposite patter. Even though many hemi-epiphytes grow under the low
light levels of the forest understory (Zhang et al. 2009), the results suggest
that early- successional plants are light-tolerant and late- successional
plants are shade-tolerant species. Our data may support that idea of light
partitioning between successional cohorts, which is important factor in
Chapter 5
115
shaping light demanding and shade tolerant species distribution (Kitajima
and Poorter 2008). Moreover, this helps explain species turnover in the
ageing fallows reported previously in the same area (Benavides et al. 2006).
This explanation however needs to be tested in futures studies with an
overall performance including survival (Kitajima and Poorter 2008).
Finally, contrary to expectation flagellar shoot were evenly distributed
between habitats and were found under similar light levels than non-
flagellar plants. Since it was not possible distinguish in field when a
flagellar shoot was formed in responses to the lost of contact with the
support tree, the plausible explanation related with photosynthetic level
remain elusive (Ray 1992; Andrade and Mayo 2000). Further research
controlling support-tree contact and plant productivity are necessary to
confirm or rule out the trigger mechanisms of flagellar shoots.
In conclusion, the rapid occupation of newly created gaps in Amzonian
rain forest appears to be driven by high survival of adult plants, or
fragments thereof, after the gap has been formed, possibly in combination
with a spurt in seed germination immediately after gap creation. In
addition, hemi-epiphytic aroid species are particularly well adapted to
occupy new gaps through a high displacement rate and by their directional
growth towards the light (gap).
AKNOWLEDGEMENTS
We thank Amacayacu National Park authorities and people of the
communities of Mocagua and Palmeras. Thanks also to A.C. Kuchta, Y.
Campiño, L.V. Londoño and C. J. Benavides for helping during fieldwork
and J. van Arkel and F. van Dunné for the hemispherical photo processing.
This research was supported by Schure-Beijerinck-Popping fund, Alberta
Mennega fund, and AUV fund. Programme Alban provided doctoral
scholarship to A. M. Benavides.

116


Synthesis
118
THIS THESIS REPORTS THE FIRST quantitative census how epiphytes are
distributed over the main landscapes and along forest chronosequences in
Colombian Amazonia. The sampling resulted in more than 2000 plant
collections (not including trees or lianas) and comprised nearly 340 species,
which belonged to 20 plant families (ferns and allies considered separately).
Araceae, ferns, and Orchidaceae were the most diverse groups. The most
commonly found and species-rich genera were Anthurium and
Philodendron, which together accounted for 21% of the species records.
About half of the epiphyte species were hemi-epiphytes, and most of these
were (142 species) secondary hemi-epiphytes.
FACTORS DEFINING THE SPATIAL DISTRIBUTION OF EPIPHYTES.—
The two independent studies of epiphyte species distribution (Chapters 2
and 3) convincingly showed that epiphyte species composition differed
significantly over the main landscapes (i.e. floodplains, swamps, well-
drained uplands and white sand areas). This landscape effect was found in
both holo-epiphytes and hemi-epiphytes. At first sight this result is not
surprising. In the past two decades several studies in Colombian
Amazonia, and NW Amazonia have found clear landscape effects upon
vascular plant species composition of different growth habits (e.g. trees,
palms and ferns; Duivenvoorden and Duque 2010). The explanation for
these patterns is often given in terms of the niche assembly theory (Grime
1977, Tilman 1980): species are distributed not randomly but as result of
environmental constraints and competitive displacement. The fact that the
landscape effect was well visible among holo-epiphytes suggests that soil
physical and chemical factors may in an indirect way, at least to some
extent, explain epiphyte distribution (Gentry and Dodson 1987b). More
likely, however, atmospheric humidity in the forest, conditions of seasonal
Chapter 6
119
and permanent inundations (especially influencing the lower strata in the
forests), the faunal community (defining pollination, seed dispersal,
herbivory and pathogen attacks), and the distribution of the phorophytes in
combination with host preferences are among the principal variables
defining the composition of epiphyte communities in this part of the
Amazon basin.
In this light, the significant phorophyte effect on epiphyte composition
(both holo-epiphytes and secondary hemi-epiphytes) (Chapter 3), and the
way phorophyte composition remains influential even after cancelling out
the landscape effect is remarkable. These results suggest that species-
specific interactions between epiphytes and phorophytes drive the
epiphyte species assemblage. Several studies outside Amazonia indicated
that certain epiphyte species prefer phorophyte species. For example, in
Chile some film fern species showed a preference for Podocarpus nubigene
(Munoz et al. 2003) and in Puerto Rico, the orchid Lepanthes caritensis was
only found on Micropholis guyanensis (Tremblay et al. 1998). Obtaining
evidence for epiphyte-phorophyte associations at the level of individual
species is difficult, because of the low aggregation levels in highly diverse
NW Amazonian forests. The chances of finding combined occurrences of
epiphyte species and host species are small, which quickly leads to a low
power in statistical tests of association between two species. The
Chiribiquete study in Chapter 3 thus exemplifies a case in which a multiple
response is significantly related to a multiple explanation, whereas the
pairwise associations between each of the individual response variables
and each of the explanatory variables seem almost absent. Indeed, survey
studies of species composition may not be the most suitable way of
analyzing epiphyte-phorophyte interactions in upper Amazonia.
Transplantation experiments and studies in large permanent plots, during
Synthesis
120
which the interactions between a limited numbers of species can be
followed through several years, seem more appropriate.
SUCCESSION OF VASCULAR EPIPHYTE COMMUNITIES.—In Chapter
4, epiphyte succession was studied along a chronosequence of fallows. This
implied that the phorophyte community structure which defines the
substrate and space for settlement and further development of epiphytes,
changed substantially over time. Indeed, from young fallows to fallows of
about 30 yr old, the mean tree height increased from 9 to 15 m, basal area
increased from 0.18 to 0.37 m2, and the tree trunk volume from 1.4 to 5.7 m3
(data from trees of DBH > 10 cm in 0.01 ha).
Along with forest structural changes, the species richness, density and
biomass of both holo-epiphytes and hemi-epiphytes increased significantly
from young fallows to aging fallows and mature forests. In general, this
observation concurs with results from other studies which show that, in
comparison with smaller trees, larger trees (which are often older) offer a
larger sampling area, more habitat heterogeneity, and more prolonged time
spans for colonization and seed interception (Zotz and Vollrath 2003; Laube
and Zotz 2006a). Furthermore, the species composition of both holo- and
hemi-epiphytes was highly explained by the geographic configuration of
the plots. This showed that not only between landscapes, at regional scale
(spanning distances of 10 to > 100 km) but also within one single landscape
(well-drained uplands), at local scale (distances < 10 km), epiphyte species
composition differed substantially.
In three ways the dynamics of the holo-epiphytes differed from that of the
hemi-epiphytes. First, the hemi-epiphytes (which were mostly aroids)
showed a remarkably higher abundance and biomass in the youngest
fallows compared to the holo-epiphytes. We hypothesized that the high
initial biomass and abundance of hemi-epiphytes was due to germination
of seeds in the seed bank, to sprouting of fragments of hemi-epiphytes,

Chapter 6
121
which had fallen out of the trees when the forests was cut down and had
survived the burning, or possibly even from relatively rapid colonization
via clonal growth, entering the young fallows from the surrounding forests.
Secondly, in the course of succession, the relative increase of holo-
epiphytes exceeded that of secondary hemi-epiphytes. This suggested that,
once established, the holo-epiphytes experienced no limits to local
recruitment and growth within the expanding canopy of the developing
fallows. Contrary to this, secondary hemi-epiphytes would hardly
experience an increase in opportunities for continued local recruitment
because the soil surface area available for colonization remains constant (or
even decreases slightly) through time. Finally, the variation in species
composition of holo-epiphyte species could not be related to time, whereas
that from hemi-epiphytes was significantly associated to forest age, even
after cancelling out any effect of the spatial configurations of the sampled
plots. To explain the lack of succession in holo-epiphytes, it was assumed
that the increasing branch area in the expanding canopies in developing
fallows yielded a growing supply of substrate allowing a continuous
arrival of new holo-epiphyte species. In contrast, the hemi-epiphytes,
which occurred predominantly at tree bases, expansion in the developing
fallows might be increasingly limited by trunk space, potentially leading to
species turnover due to competition.
Chapter 5 enlarges on the question why hemi-epiphytes, and especially
aroids, recovered so quickly in chagras and young fallows. Apart from
man-made chagras and fallows, the field studies also included natural
treefall gaps. In field experiments, aroid germination rates under open
conditions were low, implying that seed recruitment would be largely
confined to closed-canopy forests. Therefore, the idea of quick aroid
recovery in gaps through seed recruitment was rejected. Instead, stem
cuttings of five study species experimentally placed in chagras all showed
Synthesis
122
resprouting capacity, indeed suggesting that aroid fragments may persist
in gaps. Secondly, near the forest edges a high abundance of creeper plants
was found with flagellar shoots which grew rapidly, indicating that aroids
are foraging for essential resources and dispersing meristems clonally.
Finally, hemi-epiphytic aroids in the forest edge up to 30 m from the gap
exhibited habitat selection, growing towards the gap. Thus, we concluded
that hemi-epiphyte aroids improved their capacity to colonize gaps rapidly
through vegetative recruitment.
CONCLUSIONS AND RECOMMENDATIONS
The high epiphyte species turnover within and between landscape
demonstrated that the scale at which such studies are conducted has
important implications for the interpretation of results. At between-
landscape scales, the results presented in this dissertation strongly
suggested that niche assembly mechanisms, related to eco-physiological
adaptations to environmental constraints, structure epiphyte communities
(both holo-epiphytes and hemi-epiphytes). At local scales, dispersal
limitation would explain the low abundance of holo-epiphytes in young
fallows, and even plays a certain role in the way hemi-epiphytes colonize
gaps through vegetative recruitment mechanisms. The results reported in
this thesis emphasized that the abundance, diversity, and species
composition of the epiphyte communities depended strongly on the
dynamic environment provided by the forest (assemblage of phorophytes).
As a consequence, compared to trees, the epiphytic life-form would appear
particularly sensitive to disturbance and forest transformation. Further
research is needed to detect the environmental constraints and competitive
mechanisms causing the nonrandom distribution in epiphytes. In view of
the scarcity of epiphytes studies in proportion to the high diversity and
enormous geographical extension of the Amazon basin, it is important to
carry out more epiphyte inventories using standardized methods (e.g. Wolf
Chapter 6
123
et al. 2009), and in different landscapes. In these, it is fundamental to
improve the taxonomic knowledge of the epiphyte community to be able to
determine more precisely their distribution and to extrapolate findings.
Also, long-term epiphyte monitoring studies should be established, which
allow detailed studies of species interactions (host-preferences), as well as
measurements how variation in micro-environmental conditions (light,
nutrient and water flux) influence the performance of epiphytes. For the
future, ecophysiological studies in combination with experimental research
on dispersal, germination, establishment, growth, causes of mortality, and
relocation over different micro-environmental conditions are perhaps most
likely to yield valuable insights in epiphyte community assembly.

124

125
Literature cited
Acebey A, Gradstein SR and Krömer T (2003) Species richness and habitat
diversification of bryophytes in submontane rain forest and fallows
of Bolivia. Journal of Tropical Ecology 19: 9-18.
Ackerman JD, Sabat A and Zimmerman JK (1996) Seedling establishment in
an epiphytic orchid: An experimental study of seed limitation.
Oecologia 106: 192-198.
Aguirre A, Guevara R and López JC (2010) Fate of epiphytes on
phorophytes with different architectural characteristics along the
perturbation gradient of Sabal mexicana forests in Veracruz, Mexico.
Journal of Vegetation Science 21: 6-15.
Anderson M (1964) Studies in the woodland light climate. The
photographic computation of light conditions. Journal of Ecology 52:
27-41.
Andrade I and Mayo S (1998) Dynamic shoot morphology in Monstera
adansonii Schott var. klotzschiana (Schott) Madison (Araceae). Kew
Bulletin 53: 399-417.
Andrade I and Mayo S (2000) Dynamic shoot morphology in root-climbing
Araceae: Philodendron rudgeanum Schott and Ph. fragrantissimum
(Hook.) G.Don. Feddes Repertorium 111: 314.
Andrade JL and Nobel PS (1997) Microhabitats and water relations of
epiphytic cacti and ferns in a lowland neotropical forest. Biotropica
29: 261-270.
Anscombe FJ (1948) The transformation of Poisson, binomial and negative
binomial data. Biometrika 35: 246-254.
Literature cited
126
Arevalo R and Betancur J (2004) Diversidad de epifitas vasculares en cuatro
bosques del sector suroriental de la Serrania de Chiribiquete,
Guayana Colombiana. Caldasia 26: 359-380.
Arévalo R and Betancur J (2006) Vertical distribution of vascular epiphytes
in four forest types of the Serranía de Chiribiquete, Colombian
Guayana. Selbyana 27: 175-185.
Bader M, Van Dunné HJF and Stuiver HJ (2000) Epiphyte distribution in a
secondary cloud forest vegetation: a case study of the application of
GIS in epiphyte ecology. Ecotropica 6: 181-195.
Ballare C, Scopel A and Sanchez R (1990) Far-red radiation reflected from
adjacent leaves - an early signal of competition in plant canopies.
Science 247: 329-332.
Balslev H, Valencia R, Paz and Miño G, Christensen H and Nielsen I (1998)
Species count of vascular plants in one hectare of humid lowland
forest in Amazonian Ecuador. In: Dallmeier F and Comiskey JA (eds)
Forest biodiversity in North, Central and South America, and the
Caribbean, pp. 585-594. UNESCO, Paris.
Barkman JJ (1958) Phytosociology and ecology of cryptogamic epiphytes.
In: Van Gorcum and Comp. N.V., Assen.
Barthlott W, Schmit-Neuerburg, Nieder J and Engwald S (2001) Diversity
and abundance of vascular epiphytes: a comparison of secondary
vegetation and primary montane rain forest in the Venezuelan
Andes. Plant Ecology 152: 145-156.
Batschelet E (1981) Circular statistics in biology. Academic Press, New
York.
Bazzaz FA and Pickett STA (1980) Physiological ecology of tropical
succession: a comparative review. Annual Review of Ecology and
Systematics 11: 287-310.
Literature cited
127
Benavides AM, Duque AJ, Duivenvoorden JF, Vasco A and Callejas R
(2005) A first quantitative census of vascular epiphytes in rain forests
of Colombian Amazonia. Biodiversity and Conservation 14: 739-758.
Benavides AM, Wolf J and Duivenvoorden JF (2006) Recovery and
succession of epiphytes in upper Amazonian fallows. Journal of
Tropical Ecology 22: 705-717.
Bennett BC (1986) Patchiness, diversity, and abundance relationships of
vascular epiphytes. Selbyana 9: 70-75.
Bennett BC (1992) Uses of epiphyte lianas and parasites by the Shuar
people of amazonian Ecuador. Selbyana 13: 99-114.
Benzing DH (1981) Bark surfaces and the origin and maintenance of
diversity among angiosperm epiphytes: a hypothesis. Selbyana 5:
248-255.
Benzing DH (1986) The vegetative basis of vascular epiphytism. Selbyana 9:
23-43.
Benzing DH (1987) Vascular epiphytism: taxonomical participation and
adaptative diversity. Annals of the Missouri Botanical Garden 74:
183-204.
Benzing DH (1990) Vascular epiphytes. Cambridge University Press,
Cambridge.
Benzing DH (1995) Vascular epiphytes. In: Lowman M and Nadkarni N
(eds.) Forest canopies, pp. 225-253. Academic Press, San Diego.
Borcard D, Legendre L and Drapeau P (1992) Partialling out the spatial
component of ecological variation. Ecology 73: 1045-1055.
Bowman JL, Floyd SK and Sakakibara K (2007) Green genes - comparative
genomics of the green branch of life. Cell 129: 229-234.

Literature cited
128
Burns KC (2007) Network properties of an epiphyte metacommunity.
Journal of Ecology 95: 1142-1151.
Burns KC and Dawson J (2005) Patterns in the diversity and distribution of
epiphytes and vines in a New Zealand forest. Austral Ecology 30:
891-899.
Callaway M, Reinhart KO, Moore GW, Moore DJ and Pennings SC (2002)
Epiphyte host preferences and host traits: mechanisms for species-
specific interactions. Oecologia 132: 221-230.
Camacho-Cruz A, Gonzalez-Espinosa M, Wolf J and De Jong B (2000)
Germination and survival of tree species in disturbed forests of the
highlands of Chiapas, Mexico. Canadian Journal of Botany-Revue
Canadienne De Botanique 78: 1309-1318.
Cardelus CL and Chazdon RL (2005) Inner-crown microenvironments of
two emergent tree species in a lowland wet forest. Biotropica 37: 238-
244.
Cardelus CL, Colwell RK and Watkins JE (2006) Vascular epiphyte
distribution patterns: explaining the mid-elevation richness peak.
Journal of Ecology 94: 144-156.
Carlsen M (2000) Structure and diversity of the vascular epiphyte
community in the overstory of a tropical rain forest in Surumoni,
Amazonas state, Venezuela. Selbyana 21: 7-10.
Cascante-Marín A (2006) Establishment, reproduction and genetics of
epiphytic bromeliad communities in successional premontane forests,
Costa Rica. Dissertation, Universiteit van Amsterdam, Amsterdam.
Cascante-Marín A, de Jong M, Borg ED, Oostermeijer JGB, Wolf JHD and
den Nijs JCM (2006a) Reproductive strategies and colonizing ability
of two sympatric epiphytic bromeliads in a tropical premontane area.
International Journal of Plant Sciences 167: 1187-1195.

Literature cited
129
Cascante-Marín A, Wolf JHD, Oostermeijer JGB, den Nijs JCM, Sanahuja O
and Durán-Apuy A (2006b) Epiphytic bromeliad communities in
secondary and mature forest in a tropical premontane area. Basic and
Applied Ecology 7: 520-532.
Cascante-Marín A, von Meijenfeldt N, de Leeuw H, Wolf JHD,
Oostermeijer JGB and den Nijs JCM (2009a) Dispersal limitation in
epiphytic bromeliad communities in a Costa Rican fragmented
montane landscape. Journal of Tropical Ecology 25: 63-73.
Cascante-Marín A, Wolf JHD and Oostermeijer JGB (2009b) Wasp florivory
decreases reproductive success in an epiphytic bromeliad. Plant
Ecology 203: 149-153.
Casgrain P and Legendre P (2002) The R Package for multivariate and
spatial Analysis, Version 4.0d6. Université de Montréal, Montréal .
Catchpole D (2004) The ecology of vascular epiphytes on a Ficus L. host
(Moraceae) in a Peruvian cloud forest. B.Sc. Thesis, School of
Geography and Environmental Studies, University of Tasmania.
Catling PM, Brownell VR and Lefkovitch LP (1986) Epiphytic orchids in a
Belizean grapefruit orchard: distribution, colonization and
association. Lindleyana 1: 194-202.
Chazdon R (1986) Light Variation and Carbon Gain in Rain-Forest
Understorey Palms. Journal of Ecology 74: 995-1012.
Chazdon R and Fetcher N (1984) Light environments of tropical forests.
Tasks for vegetation Science 12: 27-36.
Clark D, Palmer M and Clark D (1999) Edaphic factors and the landscape-
scale distributions of tropical rain forest trees. Ecology 80: 2662-2675.
Condit R, Hubbel SP, Lafrankie JV, Sukumar R, Manokaran N, Foster RB
and Ashton PS (1996) Species-area and species-individual

Literature cited
130
relationships for tropical trees: a comparison of three 50-ha plots.
Journal of Ecology 84: 549-562.
Cottam G and Curtis J (1956) The use of distance measures in
phytosociological sampling. Ecology 37: 451-460.
Croat T (1992) Species diversity of araceae in Colombia: a preliminary
survey. Annals of the Missouri Botanical Garden 79: 17-28.
Cronquist A (1988) The evolution and classification of clowering plants.
The New York Botanical Garden, New York.
Dejean A, Olmsted I and Snelling RR (1995) Tree-epiphyte-ant relationships
in the low inundated forest of Sian Ka'an Biosphere Reserve,
Quintana Roo, Mexico. Biotropica 27: 57-70.
Denslow J (1987) Tropical rainforest gaps and tree species diversity. Annual
Review of Ecology and Systematics 18: 431-451.
Dial R and Tobin S C (1994) Description of arborist methods for forest
canopy access and movement. Selbyana 15: 24-37.
Dietze MC and Clark JS (2008) Changing the gap dynamics paradigm:
vegetative regeneration control on forest response to disturbance.
Ecological Monographs 78: 331-347.
Dirzo R, Horvitz CC, Quevedo H and Lopez MA (1992) The effects of gap
size and age on the understorey herb community of a tropical
mexican rain forest. Journal of Ecology 80: 809-822.
Dray S and Dufour A (2007) The ade4 package: implementing the duality
diagram for ecologists. Journal of Statitical Sofware 22. Available at:
http: //www.jstatsoft.org/v22/i04 [Accessed June 16, 2010].
Dray S and Legendre P (2008) Testing the species traits-environment
relationships: the fourth-corner problem revisited. Ecology 89: 3400-
3412.

Literature cited
131
Duivenvoorden JF (1994) Vascular plant species counts in the rain forests of
the middle caquetá area, Colombian Amazonia. Biodiversity and
Conservation 3: 685-715.
Duivenvoorden JF (1996) Patterns of tree species richness in rain forests of
the middle Caquetá area, Colombia, NW Amazonia. Biotropica 28:
142-158.
Duivenvoorden JF (2001) Mapa de la ecología del paisaje del medio
Caquetá: Plancha Metá. In: Duivenvoorden JF, Baslev H, Cavelier J,
Grandez C, Tuomisto H Valencia R (eds) Evaluación de recursos
vegetales no maderables en la Amazonía noroccidental. Universiteit
van Amsterdam, Amsterdam.
Duivenvoorden JF and Duque AJ (2010) Composition and diversity of
northwestern Amazonian forests in a geoecological context. In:
Hoorn, C. and Wesselingh F. (eds.). Amazonia - Landscape and
species evolution: a look in the past, pp. 360-372 Wiley-Blackwell,
Chichester.
Duivenvoorden JF and Lips JM (1993) Ecología del paisaje del medio
Caquetá: memoria explicativa de los mapas. Tropenbos Colombia,
Santafé de Bogotá.
Duivenvoorden JF and Lips JM (1995) A land-ecological study of soils,
vegetation, and plant diversity in Colombian Amazonia. The
Tropenbos Foundation, Wageningen.
Dunn RR (2000) Bromeliad communities in isolated trees and three
successional stages of an Andean cloud forest in Ecuador. Selbyana
21: 137-143.
Duque A, Sanchez M, Cavelier J, Duivenvoorden JF, Miraña P, Miraña J
and Matapí A (2001) Relación bosque-ambiente en el Medio Caquetá,
Amazonía colombiana. In: Duivenvoorden JF, Baslev H, Cavelier J,
Literature cited
132
Grandez C, Tuomisto H and Valencia R (eds.) Evaluación de recursos
vegetales no maderables en la Amazonía noroccidental, pp.99-130.
Universiteit van Amsterdam, Amsterdam.
Duque A, Sanchez M, Cavelier J and Duivenvoorden JF (2002) Different
floristic patterns of woody understory and canopy plants in
Colombian Amazonia. Journal of Tropical Ecology 18: 499-525.
Duque AJ, Duivenvoorden JF, Cavelier J, Sánchez M, Polanía C and Leon A
(2005) Ferns and Melastomataceae as indicators of vascular plant
composition in rain forests of Colombian Amazonia. Plant Ecology
178: 1-13.
Duque A, Philips JF, Von Hildebrand P, Posada CA, Prieto A, Rudas A,
Suescún M and Stevenson P (2009) Distance decay of tree species
similarity in protected areas on Tierra Firme forests in Colombian
Amazonia. Biotropica 41: 599-607.
Edwards P and Grubb P (1977) Studies of mineral cycling in a montane rain
forest in New Guinea I. The distribution of organic matter in the
vegetation and soil. Journal of Ecology 65: 943-969.
Ek RC (1997) Botanical diversity in the tropical rain forest of Guyana.
Tropenbos- Guyana Programme, Georgetown.
Engeman RM, Sugihara RT, Pank LF and Dusenberry WE (1994) A
comparison of plotless density estimators using Monte Carlo
simulation. Ecology 75: 1769-1779.
Engqvist L (2005) The mistreatment of covariate interaction terms in linear
model analyses of behavioural and evolutionary ecology studies.
Animal Behaviour 70: 967-971.
Engwald S, Schmit-Neuerberg V and Barthlott W (2000) Epiphytes in rain
forests of Venezuela - diversity and dynamics of a biocenosis. In:
Breckle S W, Schweizer B and Arndt U (eds.). Results of worldwide
Literature cited
133
ecological studies. Proceedings of the 1st Symposium by the A.F.W
Schimper-Foundation - from H. and E. Walter - Hoheneim, Oktober
1998, pp. 425-434. Stuttgart-Hohenheim. Günter Heimbach, Stuttgart.
FAO (1977) Guidelines for soil profile description. FAO, Rome.
Fisher JB, Angeles AG, Ewers FW and Lopez-Portillo J (1997) Survey of root
pressure in tropical vines and woody species. International Journal of
Plant Sciences 158: 44-50.
Fisher RA, Corbet AS and Williams CB (1943) The relation between the
number of species and the number of individuals in a random sample
of animal population. Journal of Animal Ecology 7: 42-57.
Flores-Palacios A and Garcia-Franco JG (2001) Sampling methods for
vascular epiphytes: their effectiveness in recording species richness
and frequency. Selbyana 22: 181-191.
Flores-Palacios A and Garcia-Franco JG (2006) The relationship between
tree size and epiphyte species richness: testing four different
hypotheses. Journal of Biogeography 33: 323-330.
Flores-Palacios A and Garcia-Franco JG (2008) Habitat isolation changes the
beta diversity of the vascular epiphyte community in lower montane
forest, Veracruz, Mexico. Biodiversity and Conservation 17: 191-207.
Foster R (1990) The floristic composition of Rio Manu floodplain forest. In:
Gentry A (eds) Four neotropical rainforest, pp. 99-111. Yale
University Press, New Haven.
Frazer G, Canham C and Lertzman K (1999) Gap Light Analyzer (GLA),
Version 2.0: Imaging software to extract canopy structure and gap
light transmission indices from true-colour fisheyephotographs, users
manual and program documentation.

Literature cited
134
Frei JK and Dodson CH (1972) The chemical effect of certain bark substrates
on the germination and early growth of epiphytic orchids. Bulletin of
the Torrey Botanical Club 99: 301-307.
Freiberg M (1996) Spatial distribution of vascular epiphytes on three
emergent canopy trees in French Guiana. Biotropica 283: 345-355.
Freiberg M (2001) The influence of epiphyte cover on branch temperature
in a tropical tree. Plant Ecology 153: 241-250.
Galeano G, Suarez S and Balslev H (1998) Vascular species count in wet
forest in the Chocó area on the Pacific coast of Colombia. Biodiversity
and Conservation 7: 1563-1575.
Gentry AH (1982) Neotropical floristic diversity: phytogeographical
connections between Central and South America. Pleistocene climatic
fluctuations, or an accident of the Andean orogeny? Annals of the
Missouri Botanical Garden 69: 557-593.
Gentry AH and Dodson CH (1987a) Contribution of non-trees to species
richness of a tropical rain forest. Biotropica 19: 149-156.
Gentry AH and Dodson CH (1987b) Diversity and biogeography of
Neotropical vascular epiphytes. Annals of the Missouri Botanical
Garden 74: 205-233.
Gradstein SR, Nadkarni NM, Krömer T, Holz I and Noske N (2003) A
protocol for rapid and representative sampling of vascular and non-
vascular epiphyte diversity of tropical rain forests. Selbyana 24: 105-
111.
Griffiths H and Smith JAC (1983) Photosynthetic pathways in the
Bromeliaceae of Trinidad: Relations between life-forms, habitat
preference and the occurrence of CAM. Oecologia 60: 176-184.

Literature cited
135
Grime JP (1977) Evidence for the existence of three primary strategies in
plants and its relevance to ecological and evolutionary theory. The
American Naturalist 11: 1169-1194.
Grubb P (1977) The maintenance of species-richness in plant communities:
the importance of the regeneration niche. Biological Reviews 52: 107-
145.
Haber WA (2001) Number of species with different plant growth forms. In:
Monteverde: Ecology and conservation of a tropical cloud forest, eds.
NM Nadkarni and NT Wheelwright, pp. 519-522. Oxford University
Press, New York.
Hale SE and Edwards C (2002) Comparison of film and digital
hemispherical photography across a wide range of canopy densities.
Agricultural and Forest Meteorology 112: 51-56.
Hanski I (1999) Metapopulation Ecology. Oxford University Press, New
York.
Hietz P (2005) Conservation of vascular epiphyte diversity in Mexican
coffee plantations. Conservation Biology 19: 391-399.
Hietz P and Hietz-Seifert U (1995) Structure and ecology of epiphyte
communities of a cloud forest in central Veracruz, Mexico. Journal of
Vegetation Science 6: 719-728.
Hietz P and Briones O (1998) Correlation between water relations and
within-canopy distribution of epiphytic ferns in a Mexican cloud
forest. Oecologia 114: 305-316.
Hietz P, Ausserer J and Schindler G (2002) Growth, maturation and
survival of epiphytic bromeliads in a Mexican humid montane forest.
Journal of Tropical Ecology 18: 177-191.

Literature cited
136
Hietz P, Rammler H and Wanek W (2003) Effekt der kronenposition auf
physiologie und ökologie von epiphyten. In: Ergebnisse weltweiter
ökologischer Forschung - Results of worldwide ecological studies,
eds. Breckle SW, Schweizer B ans Fangmeier A, pp. 145-154. Verlag
Günter Heimbach, Stuttgart.
Hietz-Seifert U, Hietz P and Guevara S (1996) Epiphyte vegetation and
diversity on remnant trees after forest clearance in southern Veracruz,
Mexico. Biological Conservation 75: 103-111.
Higuera D and Wolf JHD (2010) Vascular epiphytes in dry oak forests show
resilience to anthropogenic disturbance, Cordillera Oriental,
Colombia. Caldasia 32: 123-136.
Hill MO (1979) DECORANA - a FORTRAN program for detrended
correspondence analysis and reciprocal averaging. Cornell
University, Ithaca.
Hirata A, Kamijo T and Saito S (2009) Host trait preferences and
distribution of vascular epiphytes in a warm-temperate forest. Plant
Ecology 201: 247-254 .
Hofstede RGM, Wolf JHD and Benzing DH (1993) Epiphytic mass and
nutrient status of an Upper Montane Rain Forest. Selbyana 14: 37-45.
Holscher D, Kohler L, van Dijk A and Bruijnzeel LA (2004) The importance
of epiphytes to total rainfall interception by a tropical montane rain
forest in Costa Rica. Journal of Hydrology 292: 308-322.
Hope ACA (1968) A simplified Monte Carlo significance test procedure.
Journal of the Royal Statistical Society B 30: 582-598.
Horn HS, Nathan RAN and Kaplan SR (2001) Long-distance dispersal of
tree seeds by wind. Ecological Research 16: 877-855.
Literature cited
137
Hsu CC, Horng FW and Kuo CM (2002) Epiphyte biomass and nutrient
capital of a moist subtropical forest in north-eastern Taiwan. Journal
of Tropical Ecology 18: 659-670.
Hubbell SP (1997) A unified theory of biogeography and relative species
abundance and its application to tropical rain forests and coral reefs.
Coral Reefs 16: S9-S21.
Hubbell SP (2001) The unified neutral theory of biodiversity and
biogeography. Princeton University Press, Princeton.
Hubbell SP, Foster RB, O'Brien ST, Harms E, Condit R, Wechsler B, Wright
SJ, Loo de Lao S (1999) Light-gap disturbances, recruitment
limitation, and tree diversity in a neotropical Forest. Science 283: 554-
557.
Ibisch PL, Boegner A, Nieder J and Barthlott W (1996) How diverse are
neotropical epiphytes? An analysis based on the 'Catalogue of the
flowering plants and gymnosperms of Peru'. Ecotropica 2: 13-28.
IGAC (1990) Métodos analíticos del laboratorio de suelos. Instituto
Geográfico "Agustín Codazzi", Bogotá.
Johansson D (1974) Ecology of vascular epiphytes in west African rain
forest. Acta Phytogeographica Suecica 59: 1-123.
Kelly D (1985) Epiphytes and climbers of a Jamaican rain forest: vertical
distribution, life forms and life histories. Journal of Biogeography 12:
223-241.
Kernan C and Fowler N (1995) Differential substrate use by epiphytes in
Corcovado National Park, Costa Rica: a source of guild structure.
Journal of Ecology 83: 65-73.
Literature cited
138
Kessler M (2002) Species richness and ecophysiological types among
Bolivian bromeliad communities. Biodiversity and Conservation 11:
987-1010.
Khan M, Rai J and Tripathi R (1986) Regeneration and survival of tree
seedlings and sprouts in tropical deciduous and sub-tropical forests
of Meghalaya, India. Forest Ecology and Management 14: 293-304.
Kitajima K and Poorter L (2008) Functional basis for resource niche
portioning by tropical trees. In: Carson WP and Schnitzer SA (eds.)
Forest Community Ecology, pp. 160-181. Wiley-Blackwell Publishing,
Oxford.
Kleinfeldt SE (1978) Ant-gardens: the interaction of Codonanthe crassifolia
(Gesneriaceae) and Crematogaster longispina (Formicidae). Ecology 59:
449-456.
Köhler L, Tobon C, Frumau KFA and Bruijnzeel LA (2007) Biomass and
water storage dynamics of epiphytes in old-growth and secondary
montane cloud forest stands in Costa Rica. Plant Ecology 193: 171-
184.
Köster N, Kreft H, Kuper W, Nieder J and Barthlott W (2005) Andes versus
Amazon - patterns of vascular epiphyte diversity on different spatial
scales. Abstracts 4th International Canopy Conference "Tropical
versus Temperate Forests" 10 - 17 July 2005 in Leipzig, Germany,
pp.6. University of Leipzig, Leipzig.
Kreft H, Koster N, Kuper W, Nieder J and Barthlott W (2004) Diversity and
biogeography of vascular epiphytes in Western Amazonia, Yasuni,
Ecuador. Journal of Biogeography 31: 1463-1476.
Kress WJ (1986) The systematic distribution of vascular epiphytes: an
update. Selbyana 9: 2-22.
Literature cited
139
Krömer T and Gradstein SR (2003) Species richness of vascular epiphytes in
two primary forests and fallows in the Bolivian Andes. Selbyana 24:
190-195.
Krömer T, Kessler M and Gradstein S (2007) Vertical stratification of
vascular epiphytes in submontane and montane forest of the Bolivian
Andes: the importance of the understory. Plant Ecology 189: 261-278.
Laman TG (1995) Safety recommendations for climbing rain forest trees
with single rope technique. Biotropica 27: 406-409.
Lasso E, Engelbrecht B and Dalling J (2009) When sex is not enough:
ecological correlates of resprouting capacity in congeneric tropical
forest shrubs. Oecologia 161: 43: 56.
Laube S and Zotz G (2006a) Long-term changes of the vascular epiphyte
assemblage on the palm Socratea exorrhiza in a lowlforest in Panama.
Journal of Vegetation Science 17: 307-314.
Laube S and Zotz G (2006b) Neither host-specific nor random: Vascular
epiphytes on three tree species in a Panamanian lowland forest.
Annal of Botany 97: 1103-1114.
Laube S and Zotz G (2007) A metapopulation approach to the analysis of
long-term changes in the epiphyte vegetation on the host tree Annona
glabra. Journal of Vegetation Science 18: 613-624.
Legendre P and Legendre L (1998) Numerical ecology. Elsevier,
Amsterdam.
Legendre P, Galzin R and Harmelin-Vivien ML (1997) Relating behavior to
habitat: solutions to the fourth-corner problem. Ecology 78: 547-562.
Leimbeck RM and Balslev H (2001) Species richness and abundance of
epiphytic Araceae on adjacent floodplain and upland forest in
Amazonian Ecuador. Biodiversity and Conservation 10: 1579-1593.

Literature cited
140
Lips JM and Duivenvoorden JF (2001) Caracterización ambiental. In:
Duivenvoorden JF, Baslev H, Cavelier J, Grandez C, Tuomisto H and
Valencia R (eds.) Evaluación de recursos vegetales no maderables en
la Amazonía noroccidental, pp.19-46. Universiteit van Amsterdam,
Amsterdam.
Lopez-Portillo J, Ewers F W, Angeles G, Fisher J B and Rowe N (2000)
Hydraulic architecture of Monstera acuminata: evolutionary
consequences of the hemiepiphytic growth form. New Phytologist
145: 289-299.
Lopez-Villalobos A, Flores-Palacios A and Ortiz-Pulido R (2008) The
relationship between bark peeling rate and the distribution and
mortality of two epiphyte species. Plant Ecology 198: 265-274.
Lozano Orihuela R and Waechter JL (2010) Host size and abundance of
hemiepiphytes in a subtropical stand of Brazilian Atlantic Forest.
Journal of Tropical Ecology 26: 119-122.
Lund U and Agostinelli C (2009) Circular statistics from "topics in circular
statistics" version: 0.2-4. Available at: S-plus original at http:
//statweb.calpoly.edu/lund/.
MacArthur RH and Wilson EO (1967) The theory of island biogeography.
Princeton University Press, Princeton.
Madison M (1977) Vascular epiphytes: their systematic occurrence and
salient features. Selbyana 2: 1-13.
Madison M (1979) Distribution of epiphytes in a rubber plantation in
Sarawak. Selbyana 5: 107-115.
Manly BFJ (1997) Randomization, bootstrap and Monte Carlo methods in
biology. Chapman and Hall, London.

Literature cited
141
Martinez-Melendez N, Perez-Farrera MA and Flores-Palacios A (2008)
Vertical stratification and host preference by vascular epiphytes in a
Chiapas, Mexico, cloud forest. Revista de Biología Tropical 56: 2069-
2086.
Mehltreter K, Flores-Palacios A and Garcia-Franco JG (2005) Host
preferences of low-trunk vascular epiphytes in a cloud forest of
Veracruz, Mexico. Journal of Tropical Ecology 21: 651-660.
Merwin MC, Rentmeester SA and Nadkarni NM (2003) The influence of
host tree species on the distribution of epiphytic bromeliads in
experimental monospecific plantations, La Selva, Costa Rica.
Biotropica 35: 37-47.
Mesquita RCG, Ickes K, Ganade G and Williamson GB (2001) Alternative
successional pathways following deforestation in the Amazon Basin.
Journal of Ecology 89: 528-537.
Meyer CFJ and Zotz G (2004) Do growth and survival of aerial roots limit
the vertical distribution of hemiepiphytic aroids? Biotropica 36: 483-
491.
Migenis LE and Ackerman JD (1993) Orchid-phorophyte relationships in a
forest watershed in Puerto Rico. Journal of Tropical Ecology 9: 231-
240.
Mitchell AW, Secoy K and Jackson T (2002) The Global Canopy Handbook.
Techniques of access and study in the forest roof. Global Canopy
Programme, Oxford.
Moffett MW (1993) The high frontier: exploring the tropical rain forest
canopy. Cambridge, Massachusetts, USA: Harvard University Press.
Moffett MW (2000) What's "up"? A critical look at the basic terms of canopy
biology. Biotropica 32: 569-596.

Literature cited
142
Muñoz AA, Chacon P, Perez F, Barnert ES and Armesto J J (2003) Diversity
and host tree preferences of vascular epiphytes and vines in a
temperate rainforest in southern Chile. Australian Journal of Botany
51: 381-391.
Nadkarni NM (1984a) Biomass and mineral capital of epiphytes in an Acer
macrophyllum community of a temperate moist coniferous forest,
Olympic Peninsula, Washington State. Canadian Journal of Botany
62: 2223-2228.
Nadkarni NM (1984b) Epiphyte biomass and nutrient capital of a
Neotropical Elfin Forest. Biotropica 16: 249-256.
Nadkarni NM (2000) Colonization of stripped branch surfaces by epiphytes
in a lower montane cloud forest, Monteverde, Costa Rica. Biotropica
32: 358-363.
Nadkarni NM and Matelson TJ (1989) Bird use of epiphyte resources in
neotropical trees. The Condor 91: 891-907.
Nadkarni NM and Matelson TJ (1992) Biomass and nutrient dynamics of
epiphytic litterfall in a neotropical montane forest, Costa Rica.
Biotropica 24: 24-30.
Nadkarni NM and Parker GG (1994) A profile of forest canopy science and
scientists - who we are, what we want to know, and obstacles we
face: results of an international survey. Selbyana 15: 38-50.
Nieder J and Zotz G (1998) Methods of analyzing the structure and
dynamics of vascular epiphyte communities. Ecotropica 6: 33-39.
Nieder J, Engwald S and Barthlott W (1999) Patterns of neotropical
epiphyte diversity. Selbyana 201: 66-75.
Nieder J, Engwald S, Klawun M and Barthlott W (2000) Spatial distribution
of vascular epiphytes (including hemiepiphytes) in a lowland

Literature cited
143
amazonian rain forest (Surumoni crane plot) of southern Venezuela.
Biotropica 32: 385-396.
Nieder J, Prosperi J and Michaloud G (2001) Epiphytes and their
contribution to canopy diversity. Plant Ecology 153: 51-63.
Novoplansky A, Cohen D and Sachs T (1990) How Portulaca seedlings
avoid their neighbours. Oecologia 82: 490-493.
Oksanen J (1988) Impact of habitat, substrate and microsite classes on the
epiphyte vegetation: Interpretation using exploratory and canonical
correspondence analysis. Annales Botanici Fennici 25: 59-71.
Oksanen J, Kindt R, Legendre P, O'hara B, Simpson GL, Stevens HH and
Wagner H (2007). Vegan: community ecology package. R package
version 1.15-3 http: //rforge.r-project.org/projects/vegan/
Oliveira SM, Ter Steege H, Cornelissen JHC and Gradstein SR (2009) Niche
assembly of epiphytic bryophyte communities in the Guianas: a
regional approach. Journal of Biogeography 36: 2076-2084.
Orihuela RLL and Waechter JL (2010) Host size and abundance of
hemiepiphytes in a subtropical stand of Brazilian Atlantic Forest.
Journal of Tropical Ecology 26: 119-122.
Parker GG, Smith AP and Hogan KP (1992) Access to the upper forest
canopy with a large tower crane: sampling the treetops in three
dimensions. BioScience 42: 664-671.
Peñalosa J (1984) Basal branching and vegetative spread in two tropical
rain-forest lianas. Biotropica 16: 1-9.
Peñuela MC and Von Hildebrand P (1999) Parque Nacional Natural
Chiribiquete. Fundación Puerto Rastrojo - Instituto San Pablo
Apóstol, Bogotá.

Literature cited
144
Perry DR (1984) The canopy of the tropical rain forest. Scientific American
251: 114-122.
Phillips O et al. (2009) Drought sensitivity of the amazon rainforest. Science
323: 1344-1347.
Phillips O L, Baker TR, Arroyo L, Higuchi N, Killeen TJ , Laurance W F,
Lewis SL, Lloyd J, Malhi Y, Monteagudo A, Neill DA, Vargas PN,
Silva JNM, Terborgh J, Martinez RV, Alexiades M, Almeida S, Brown
S, Chave J, Comiskey JA, Czimczik CI, Di Fiore A, Erwin T, Kuebler
C, Laurance SG, Nascimento HEM, Olivier J, Palacios W, Patino S,
Pitman NCA, Quesada CA, Salidas M, Lezama AT and Vinceti B
(2004) Pattern and process in Amazon tree turnover, 1976-2001
Philosophical Transactions of the Royal Society of London Series B-
Biological Sciences 359: 381-407.
Pittendrigh CS (1948) The bromeliad-Anopheles-malaria complex in
Trinidad. I. The bromeliad flora. Evolution 2: 58-89.
Plowden C, Uhl C and Oliveira F De A (2003) The ecology and harvest
potential of titica vine roots (Heteropsis flexuosa: Araceae) in the
eastern Brazilian Amazon. Forest Ecology and Management 182: 59-
73.
Prance GT (1990) The floristic composition of the forest of Central
Amazonian Brazil In: Gentry A (ed) Four neotropical rainforests,
pp.112-140. Yale University Press, New Haven.
Putz F (1984) The natural-history of lianas on Barro Colorado Island,
Panama. Ecology 65: 1713-1724.
R Development Core Team (2008) R: a language and environment for
statistical computing. R Foundation for Statistical Computing,
Vienna.

Literature cited
145
Ray TS (1988) Survey of shoot organization in the Araceae. American
Journal of Botany 75: 56-84.
Ray TS (1990) Metamorphosis in the Araceae. American Journal of Botany
77: 1599-1609.
Ray TS (1992) Foraging behavior in tropical herbaceous climbers (Araceae).
Journal of Ecology 80: 189-203.
Reyes-García C, Griffiths H, Rincón E and Huante P (2008) Niche
differentiation in tank and atmospheric epiphytic bromeliads of a
seasonally dry forest. Biotropica 40: 168-175.
Richardson BA (1999) The bromeliad microcosm and the assessment of
faunal diversity in a Neotropical forest. Biotropica 31: 321-336.
Roxburgh JD and Kelly (1995) Uses and limitations of hemispherical
photography for estimating forest light environments. New Zealand
Journal of Ecology 19: 213-217.
Rudas A and Prieto C (2005) Florula del Parque Nacional Amacayacu,
Amazonas Colombia. Missouri Botanical Garden, St. Louis.
Ruinen J (1953) Epiphytosis. Annales Bogorienses 1: 101-170.
Sampaio M, Araujo T, Scarano F and Stuefer J (2004) Directional growth of
a clonal bromeliad species in response to spatial habitat
heterogeneity. Evolutionary Ecology 18: 429-442.
Sanford WW (1968) Distribution of epiphytic orchids in semi-decidous
tropical forest in southern Nigeria. Journal of Ecology 56: 697-705.
SAS Institute (1994) JMP statistic and graphics guide. SAS Institute Inc.,
Cary.
Schimper AFW (1888) Die epiphytische vegetation Amerikas. Botanische
Mittheilungen aus den Tropen, Heft 2. Jena: Gustav Fischer.

Literature cited
146
Schmida A and Wilson MV (1985) Biological determinants of species
diversity. Journal of Biogeography 12: 1-20.
Schmidt G (2000) Herbivory in the epiphyte, Vriesea sanguinolenta Cogn..
Journal of Tropical Ecology 16: 829-839.
Schneider JV (2001) Diversity, structure, and biogeography of a
successional and mature upper montane rain forest of the Venezuelan
Andes. Johann Wolfgang Goethe-Universität, Frankfurt am Main.
Schnitzer S and Carson W (2001) Treefall gaps and the maintenance of
species diversity in a tropical forest. Ecology 82: 913-919.
Schnitzer S and Carson W (2000) Have we forgotten the forest because of
the trees? Trends in Ecology Evolution 15: 375-376.
Schnitzer S, Mascaro J and Carson W (2008) Treefall gaps and the
maintenance of species diversity in tropical forests. In: Carson, W.P.,
and S.A. Schnitzer, (ed.) Forest Community Ecology, pp. 196-209.
Wiley-Blackwell Publishing, Oxford
Schnitzer S, Dalling J and Carson W (2000) The impact of lianas on tree
regeneration in tropical forest canopy gaps: evidence for an
alternative pathway of gap-phase regeneration. Journal of Ecology 88:
655-666.
Shashar N, Cronin TW, Wolff LB and Condon MA (1998) The polarization
of light in a tropical rain forest. Biotropica 30: 275-285.
Strong D and Ray T (1975) Host tree location behavior of a tropical vine
(Monstera gigantea) by skototropism. Science 190: 804-806.
Sugden AM and Robins RJ (1979) Aspects of the ecology of vascular
epiphytes in Colombian cloud forests. I. The distribution of the
epiphytic flora. Biotropica 11: 173-188.

Literature cited
147
Talley S M, Setzer W N and Jackes B R (1996) Host associations of two
adventitious-root-climbing vines in a north Queensland tropical rain
forest. Biotropica 28: 356-366.
Ter Braak CJK (1987) Ordination. In: Jongman, RHG, ter Braak CJF and van
Tongeren OFR (eds.), Data analysis in community and landscape
ecology, pp. 91-173. Pudoc, Wageningen.
Ter Braak CJK and Smilauer P (1998) CANOCO reference manual and
user's guide to CANOCO for windows: software for Canonical
Community Ordination version 4. Microcomputer Power, Ithaca.
Ter Steege H and Cornelissen JHC (1989) Distribution and ecology of
vascular epiphytes in lowland rain forest of Guyana. Biotropica 21:
331-339.
Tewari M, Upreti N, Pandey P and Singh SP (1985) Epiphytic succession on
tree trunks in a mixed oak-cedar forest, Kumaun Himalaya. Vegetatio
63: 105-112.
Théry M (2001) Forest light and its influence on habitat selection. Plant
Ecology 153: 251-261.
Tilman D (1980) Resources: a graphical-mechanistic approach to
competition and predation. The American Naturalist 116: 362-393.
Tremblay RL, Zimmerman JK, Lebron L, Bayman P, Sastre I, Axelrod F and
Alers-Garcia J (1998) Host specificity and low reproductive success in
the rare endemic Puerto Rican orchid Lepanthes caritensis. Biological
Conservation 85: 297-304.
Tryon RM and Tryon AF (1982) Ferns and allied plants, with special
reference to tropical America. Springer, New York.

Literature cited
148
Tuomisto H, Ruokolainen K and Yli-Halla M (2003) Dispersal,
environment, and floristic variation of western amazonian forests.
Science 299: 241-244.
Turner IM, Chua KS, Ong JSY, Soong BC and Tan HTW (1996) A century of
plant species loss from an isolated fragment of lowland tropical rain
forest. Conservation Biology10: 1229-1244.
Valencia R, Balslev H Paz and Miño G (1994) High alpha-diversity in
Amazonian Ecuador. Biodiversity and Conservation 3: 21-28.
Van Der Hammen T (1992) El manejo del mundo: Naturaleza y sociedad
entre los Yukuna de la Amazonia Colombiana. Tropenbos-Colombia,
Santafé de Bogotá.
Van Dunné HJF (2001) Establishment and development of epiphytes in
secondary neotropical forest. Dissertation, Universiteit van
Amsterdam, Amsterdam.
Van Dunné HJF (2002) Effects of the spatial distribution of trees, conspecific
epiphytes and geomorphology on the distribution of epiphytic
bromeliads in a secondary montane forest (Cordillera Central,
Colombia). Journal of Tropical Ecology18: 193-213.
Veneklaas EJ (1990) Nutrient fluxes in bulk precipitation and throughfall in
two montane tropical rain-forests, Colombia. Journal of Ecology 78:
974-992.
Vieira EM and P Izar (1999) Interactions between Aroids and Arboreal
Mammals in the Brazilian Atlantic Rainforest. Plant Ecology 145: 75-
82.
Went FW (1940) Soziologie der Epiphyten eines tropischen Urwaldes.
Annales du Jardin Botanique de Buitenzorg 50: 1-98.

Literature cited
149
Werner FA, Homeier J and Gradstein SR (2005) Diversity of vascular
epiphytes on isolated remnant trees in the montane forest belt of
southern Ecuador. Ecotropica 11: 21-40.
Whitmore TC, Peralta R and Brown K (1985) Total species count in a Costa
Rican tropical rain forest. Journal of Tropical Ecology 1: 375-378.
Winkler M, Hulber K, Mehltreter K, Franco J G and Hietz P (2005)
Herbivory in epiphytic bromeliads, orchids and ferns in a Mexican
montane forest. Journal of Tropical Ecology 21: 147-154.
Wolf JHD (1993) Ecology of epiphytes and epiphyte communities in
montane rain forest, Colombia. Ph.D. Dissertation, University of
Amsterdam, Amsterdam.
Wolf JHD (1994) Factors controlling the distribution of vascular and non-
vascular epiphytes in the northern Andes. Vegetatio 112: 15-28.
Wolf JHD (1995) Habitat heterogeneity in the canopy of the tropical rain
forest. In: Second international ESF-workshop on tropical canopy
research. University of Ulm, Ulm.
Wolf JHD (2005) The response of epiphytes to anthropogenic disturbance of
pine-oak forests in the highlands of Chiapas, Mexico. Forest Ecology
and Management 212: 376-393.
Wolf JHD and Konings CJF (2002) Toward the sustainable harvesting of
epiphytic bromeliads: a pilot study from the highlands of Chiapas,
Mexico. Biological Conservation 101: 23-31.
Wolf JHD and Flamenco-S A (2003) Patterns in species richness and
distribution of vascular epiphytes in Chiapas, Mexico. Journal of
Biogeography 30: 1689-1707.
Wolf JHD and Flamenco-S A (2006) Vascular epiphytes and their potential
as a conservation tool in pine-oak forests of Chiapas, Mexico, pp. 375-
Literature cited
150
391. In: Kappelle M. (ed.) Ecology and conservation of neotropical
montane oak forests. Springer-Verlag. Berlin.
Wolf JHD and Zotz G (2009) Trees as islands - biogeography of epiphytes
on trees. In: Proceedings 5th International Canopy Conference, pp.
102. Bangalore, India.
Wolf JHD, Gradstein SR and Nadkarni NM (2009) A protocol for sampling
of vascular epiphyte richness and abundance. Journal of Tropical
Ecology 25: 107-121.
Zar JH (1984) Biostatistical analysis. Prentice-Hall, Englewood Cliffs..
Zhang LW, Nurvianto S and Harrison S (2010) Factors affecting the
distribution and abundance of Asplenium nidus L. in a tropical
lowland rain forest in Peninsular Malaysia. Biotropica 42: 464-469.
Zhang Quiang, Jun-Wen Chen, Bao-Gui Li and Kun-Fan Cao (2009)
Epiphytes and hemiepiphytes have slower photosynthetic response
to lightflecks than terrestrial plants: evidence from ferns and figs.
Journal of Tropical Ecology 25: 465-472.
Zimmerman JK and Olmsted IC (1992) Host tree utilization by vascular
epiphytes in a seasonally inundated forest (tintal) in Mexico.
Biotropica 24: 402-407.
Zotz G (1997) Substrate use of three epiphytic bromeliads. Ecography 20:
264-270.
Zotz G (2004) Growth and survival of the early stages of the heteroblastic
bromeliad Vriesea sanguinolenta. Ecotropica 10: 51-57.
Zotz G and Andrade JL (1997) Water relations of two co-occurring
epiphytic bromeliads. Journal of Plant Physiology 152: 545-554.

Literature cited
151
Zotz G, Patino S and Tyree MT (1997) Water relations and hydraulic
architecture of woody hemiepiphytes. Journal of Experimental
Botany 48: 1825-1833
Zotz G, Bermejo and P Dietz H (1999) The epiphyte vegetation of Annona
glabra on Barro Colorado Island, Panama. Journal of Biogeography 26:
761-776.
Zotz G and Hietz P (2001) The physiological ecology of vascular epiphytes:
current knowledge, open questions.Journal of Experimental Botany
52: 2067-2078.
Zotz G and Andrade JL (2002) Ecología de epífitas y hemiepífitas. In:
Guariguata, M. and Kattan G. (eds). Ecología de Bosques lluviosos
Neotropicales, pp. 271-296. IICA, San José.
Zotz G and Schultz S (2008) The vascular epiphytes of a lowland forest in
Panama - species composition and spatial structure. Plant Ecology
195: 131-141.
Zotz G and Vollrath B (2003) The epiphytic vegetation of the palm Socratea
exorrhiza - correlations with tree size, tree age and bryophyte cover.
Journal of Tropical Ecology 19: 91-90.

152

153
Summary
EPIPHYTES ARE A CONSPICUOUS COMPONENT OF TROPICAL
ECOSYSTEMS. Compared to trees, the epiphytic life-form appears
particularly vulnerable to disturbance of the forest because their
dependence on host plants. In this thesis, I quantified the species
composition across the main landscapes and along a chronosequence of
fallows in Colombian Amazonia, in order to ask: (1) how epiphyte
diversity, abundance and distribution might differ between the principal
landscapes units (Chapter 2), (2) how host-preferences might contribute to
between-landscape epiphyte assemblages (Chapter 3), (3) if there is
succession in epiphyte communities in fallows of different age (Chapter 4),
and finally, (4) how hemi-epiphytes recruit along the gap-understory
gradient (Chapter 5)?
Spatial patterns in epiphyte assemblages were the subject of the first part of
the thesis. In Chapter 2, epiphyte species composition, which was recorded
in thirty 0.025-m2 plots, was related to the main landscapes units in the
Metá area, situated in central part of the basin of the Caquetá river. This
study comprised the first regional survey of vascular epiphytes in
Colombian Amazonia. It found an unexpectedly strong association of
epiphyte composition with the principal landscape units. In the study area,
phorophyte occupancy levels were around 26-70%, which was substantially
lower than the levels of 98% reported for floodplain forests near the Andes
around Yasuní, Ecuador (Leimbeck and Balslev 2001). This led to the
hypothesis that landscape-related differences in humidity and drought
controlled the distribution of epiphyte species in absence of phorophyte
limitation.
Chapter 3 focussed on the question how the composition of the phorophyte
species might contribute to explaining patterns of epiphyte species
Summary
154
composition, as identified in ten 0.1-ha plots which were distributed over
three main landscapes in Chiribiquete National Park, Colombian
Amazonia. For both holo- and hemi-epiphytes the landscape effect on
species composition strongly decreased when controlled for by the
phorophyte composition in the plots. Phorophyte composition significantly
explained epiphyte composition, and this effect was hardly removed after
accounting for the landscape effect. Randomization tests yielded little
evidence for host preferences.
The second part of the thesis addressed the re-establishment of the
epiphyte community along a successional gradient in upland forests. In
Chapter 4, holo- and hemi-epiphytes were studied in fifty-six 0.04-ha plots
distributed in fallows of 2–30 y old and mature forests in Amacayacu
National Park and Ticuna indigenous territory. The dynamics of the holo-
epiphytes differed from that of the hemi-epiphytes. First, the hemi-
epiphytes (which were mostly aroids) showed a remarkably higher
abundance and biomass in the youngest fallows compared to the holo-
epiphytes. Secondly, in the course of succession, the relative increase of
holo-epiphytes exceeded that from secondary hemi-epiphytes. This
suggested that, once established, the holo-epiphytes experienced no limits
to local recruitment and growth within the expanding canopy of the
developing fallows. Finally, the variation in species composition of holo-
epiphyte species could not be related to time, whereas that from hemi-
epiphytes was significantly associated to forest age, even after cancelling
out any effect of the spatial configurations of the sampled plots. To explain
the lack of succession in holo-epiphytes it was assumed that the increasing
branch area in the expanding canopies in developing fallows yielded a
growing supply of substrate, allowing a continuous arrival of new holo-
epiphyte species. In contrast, the hemi-epiphytes, which occurred
predominantly at tree bases, expansion in the developing fallows might be
Summary
155
increasingly limited by trunk space, potentially leading to species turnover
due to competition.
The substantial densities of hemi-epiphytes in young fallows (Chapter 4)
led to the questions raised in Chapter 5. By means of transect studies and
field experiments we analyzed multiple recruitment pathways for
secondary hemi-epiphytes in Amazonian forests (Amacayacu National
Park). Rapid gap occupation may occur if plants, or fragments of plants,
somehow survive the process of gap-creation and form new recruitments,
either vegetatively or by means of seeds. We found little evidence for
recruitment by seeds, even though some species produced numerous,
highly viable seeds. High germination rates under shaded conditions
suggested that seed recruitment is largely confined to closed-canopy
forests. In contrast, we detected several traits in hemi-epiphyte aroids that
improve their capacity to colonize gaps rapidly through vegetative
recruitment. Firstly, stem cuttings of five species, which were
experimentally placed in chagras, showed a sprouting capability,
suggesting that aroid fragments may persist in gaps. Secondly, near the
forest edges creeper plants with rapidly growing flagellar shoots were
highly abundant, indicating that aroids were foraging for essential
resources and dispersing meristems clonally. Finally, hemi-epiphytic aroids
in the forest edge up to 30 m from the gaps exhibited habitat selection,
growing towards the gap. These traits might help explain why the hemi-
epiphytic arrivals in gaps were faster than holo-epiphytes, which depend
mostly on seed dispersal.

156
Resumen
LAS EPÍFITAS SON UN CONSPICUO COMPONENTE DE LOS BOSQUES
TROPICALES. En comparación con los árboles, las epífitas parecen ser
particularmente vulnerables a la alteración del bosque debido a la estrecha
dependencia con sus hospederos. En esta tesis, cuantifiqué la composición
de epífitas vasculares en las principales unidades del paisaje y a lo largo de
en una cronosecuencia de bosques secundarios en la Amazonia
Colombiana, con el fin de contestar las siguientes preguntas: (1) ¿Cómo
difiere la diversidad, abundancia y distribución de epífitas vasculares entre
las principales unidades del paisaje (Capitulo 2), (2) ¿Cómo la preferencia
por árboles hospederos podrían contribuir al ensamblaje de epífitas entre
las unidades del paisaje? (Capitulo 3), (3) ¿Se presenta sucesión de epífitas
en bosques secundarios de diferentes edades? (Capitulo 4) y finalmente (4)
¿Cómo es el reclutamiento de hemiepífitas entre claros del bosque y el
sotobosque? (Capitulo 5)
El patrón de distribución espacial de las especies epífitas fue el tema de
estudio de la primera parte de esta tesis. En el Capitulo 2, la composición
de epífitas fue registrada en treinta parcelas de 0.025 m2, ubicadas en las
principales unidades del paisaje en el área del Metá, parte central de la
cuenca del rio Caquetá. Ese estudio es el primer muestreo regional de
epífitas vasculares en la Amazonia Colombiana. En él se encontró una
inesperada asociación entre la composición de epífitas y las principales
unidades del paisaje. En el área de estudio, la ocupación de los árboles
hospederos (forofitos) fue alrededor del 26-70%, la cual es substancialmente
mas baja que los niveles del 82-98% reportados para bosques de planos
inundables y tierra firme cerca a los Andes en Yasuní, Ecuador (Leimbeck
and Balslev 2001). Esto condujo a la hipótesis que las diferencias en
humedad y sequia relacionadas con las unidades del paisaje controlan la

Resumen
157
distribución de las especies de epífitas en ausencia de una limitación por
los árboles hospederos.
El Capitulo 3, se enfoca en la pregunta ¿cómo la composición de árboles
hospederos podría contribuir a explicar la composición de especies
epífitas?, se identificaron las especies de árboles y epífitas en diez parcelas
de 0.1 hectáreas ubicadas en tres unidades del paisajes en el Parque
Nacional Chiribiquete, Amazonia Colombiana. Para ambas, holoepífitas
(epífitas verdades como orquídeas y bromelias) y hemiepífitas (epífitas que
desarrollan raíces adventicias o aéreas que entran en contacto con el suelo
en alguna parte de su desarrollo, como muchas especies de aráceas, ficus y
gesneriáceas) el efecto del tipo de paisaje sobre la composición de especies
decreció bastante cuando se controla el efecto de la composición de los
forofitos. La composición de especies de forofitos explicó
significativamente la composición de epífitas y su efecto fue escasamente
removido después de incluir el efecto del tipo de paisaje. Pruebas de
aleatorización mostraron poca evidencia de la preferencia las especie epífita
por una especie de árbol hospedero.
La segunda parte de esta tesis se enfocó en los procesos de restablecimiento
de la comunidad de epífitas a lo largo de un gradiente de sucesión en
bosques de tierra firme. En el Capitulo 4, las holoepífitas y hemiepífitas
fueron estudiadas en cincuenta y cuatro parcelas de 0.04 ha, en barbechos
de 2 a 30 años de edad y en el bosque maduro, que se encontraban en el
Parque Nacional Amacayacú y en territorio indígena perteneciente a las
comunidades Ticunas. La dinámica de sucesión de las holoepífitas y las
hemiepífitas difirió sustancialmente. Primero, las hemiepífitas (que fueron
principalmente aráceas) mostraron una abundancia y biomasa
significativamente mayor en barbechos jóvenes en comparación con las
holoepífitas. Segundo, en el transcurso de la sucesión, el incremento
relativo de las holoepífitas sobrepasó el de las hemiepífitas secundarias

Resumen
158
(hemiepífitas que germinan en el suelo y luego ascienden el árbol). Esto
sugiere que una vez establecidas, las holoepífitas no experimentan límites
de reclutamiento y crecimiento dentro del dosel en expansión de los
barbechos en desarrollo. Finalmente, la variación en la composición de las
especies holoepífitas podría no estar relacionado con el tiempo de
desarrollo del barbecho, mientras las hemiepífitas fueron
significativamente asociadas a la edad del barbecho incluso después de
anular cualquier efecto de la configuración espacial de las parcelas
muestreadas.
Para explicar la falta de sucesión en las especies de holoepífitas asumimos
que el área de las ramas en continua expansión en el dosel de los barbechos
en desarrollo proporciona una creciente oferta de sustrato, lo que permite
una continua llegada de nuevas especies e individuos de holoepífitas. En
cambio, el crecimiento y llegada de nuevos individuos de hemiepífitas, que
ocurren principalmente en las bases de los árboles podría estar cada vez
más limitado por el espacio disponible en la base de los troncos,
ocasionando potencialmente un recambio de especies debido a la
competencia por el espacio.
La alta densidad de hemiepífitas encontrada en los barbechos jóvenes
(Capítulo 4) fue la inspiración para las preguntas planteadas en el Capítulo
5. Por medio de muestreos a lo largo de transectos y experimentos de
campo se analizaron múltiples vías de reclutamiento de hemiepífitas
secundarias en los bosques amazónicos (Parque Nacional Natural
Amacayacú). La rápida ocupación de los claros del bosque puede ocurrir si
las plantas o fragmentos de estas, sobreviven el proceso de creación del
claro y si estos forman así mimo nuevas plantas, ya sea vegetativamente o
por medio de semillas. En este estudio, encontramos poca evidencia de
reclutamiento por semillas, aunque algunas especies hemiepífitas producen
numerosas semillas viables. La alta tasa de germinación de las semillas bajo

Resumen
159
condiciones de sombra encontradas en este estudio sugiere que el
reclutamiento de semillas está concentrado en los bosques de dosel cerrado.
Por el contrario, se han detectado varios rasgos en las aráceas hemiepífitas
que mejoran su capacidad de colonizar rápidamente los claros del bosque
por medio de reclutamiento vegetativo. En primer lugar, estacas de cinco
especies, que fueron colocadas de forma experimental en chagras (áreas
abiertas de cultivo), mostraron capacidad de germinación, lo que sugiere
que los fragmentos de las aráceas pueden persistir en los claros del bosque.
En segundo lugar, cerca del borde del bosque encontramos una alta
abundancia de hemiepífitas reptando sobre el suelo que presentaron tallos
flageliformes de rápido crecimiento, lo cual indica que estas aráceas están
forrajeando por recursos esenciales y potencialmente podrían dispersar sus
meristemas clonalmente. Por último, las aráceas hemiepífitas que se
encontraban en los primeros 30 metros del borde del bosque exhibieron un
crecimiento dirigido hacia los claros evidenciando selección de hábitat.
Estos rasgos ayudan a explicar por qué la colonización de los barbechos es
más rápida por las hemiepífitas que por las holo-epífitas, que dependen
principalmente de la dispersión de semillas.

160
Samenvatting
In tropische bossen vormen de epifyten een opvallende levensvorm welke
in vergelijking tot bomen bijzonder gevoelig is voor verstoring van het bos
vanwege de afhankelijke relatie van epifyten met waardbomen. In deze
dissertatie wordt de samenstelling van de epifytische gemeenschappen
beschreven in de belangrijkste landschapseenheden van het Colombiaanse
Amazonegebied en in een successiereeks van jonge bossen (fallows) die
daar ontstaan op braakliggende kleine akkers, teneinde antwoord te
verkrijgen op de volgende vragen: (1) verschilt de samenstelling van de
epifytische vegetatie in de belangrijkste landschapseenheden (Hoofdstuk
2), (2) worden verschillen in de epifytensamenstelling tussen
landschapseenheden mede bepaald door verschillen in de waardbomen
(Hoofdstuk 3), (3) hoe verloopt de successie van epifytengemeenschappen
in ‗fallows‘ (Hoofdstuk 4), en, tenslotte, (4) hoe verloopt de kolonisatie van
hemi-epifyten op de grens tussen ondergroei en open plekken in het bos?
Het eerste deel van de dissertatie stond in het teken van ruimtelijke
patronen in de samenstelling van epifytenvegetaties. In Hoofdstuk 2 werd
de samenstelling, bepaald in 30 proefvlakjes van 0.025 m2, gekoppeld aan
de belangrijkste landschapseenheden in het Metá-gebied, gelegen centraal
in het stroomgebied van de Caquetá. Dit is de eerste regionale studie van
epifytenvegetaties in het Colombiaanse Amazonegebied en er werd een
onverwacht sterke associatie tussen landschapseenheid en epifyten
gevonden. In het onderzoeksgebied waren ongeveer 26-70% van alle
waardbomen bezet met epifyten, aanzienlijk lager dan de 98%
bezettingsgraad in vloedbossen rond Yasuní in Ecuador aan de voet van
het Andesgebergte (Leimbeck and Balslev 2001). Deze observatie leidde tot
de veronderstelling dat landschapsgerelateerde verschillen in de mate van
Samenvatting
161
vochtigheid en uitdroging bepalend zijn voor de verbreiding van epifyten
indien de eigenschappen van waardbomen niet beperkend zijn.
In Hoofdstuk 3 werd aandacht besteed aan de vraag of de
soortensamenstelling van de waardbomen bijdraagt aan de ruimtelijke
verbreiding van epifyten, zoals waargenomen in tien 0.1 ha proefvlakken in
de drie belangrijkste landschapseenheden van het Chiribiquete Nationale
Park in het Colombiaanse Amazonegebied. Voor zowel holo-epifyten als
hemi-epifyten werd de invloed van het type landschap op de
soortensamenstelling sterk minder indien de invloed van de waardbomen
werd weggenomen. De samenstelling van de waardbomen droeg
significant bij tot de verklaring van de samenstelling van de epifytische
vegetatie en de invloed van de waardbomen werd nauwelijks minder
indien in de analyse de invloed van de landschapseenheid werd
verwijderd. Een statistische analyse (randomisatie) op soortniveau kon
nauwelijks aantonen dat er relaties waren tussen waardbomen en
epipfyten.
In het tweede deel van de dissertatie werd de ontwikkeling van de
epifytische vegetatie in een successiereeks van jonge bossen behorend tot
het hoger gelegen bostype (upland forest) onderzocht. In Hoofdstuk 4
werden de holo- en hemi-epifyten geïnventariseerd in 56 proefvlakken van
0.04 ha verdeeld over regenererende bossen (fallows) van 2-30 jaar oud en
niet-verstoord bos in het Amacayacu National Park en in het gebied van de
Ticuna Indianengemeenschap. De holo- en hemi-epifyten verschilden in
hun dynamiek. Ten eerste was in jongste bossen het aantal hemi-epifyten
en hun biomassa veel hoger vergeleken met holo-epifyten. Daarnaast
namen gedurende het verloop van de successie de holo-epifyten relatief
sneller toe in aantal dan de secundaire hemi-epifyten. Vermoedelijk
ondervinden de eenmaal gevestigde holo-epifyten geen beperkingen om
door te groeien en zich uit te breiden over de uitgroeiende boomkronen

Samenvatting
162
van de zich ontwikkelende jonge bossen. Tenslotte werd er geen verband
gevonden tussen soortsamenstelling van de holo-epifyten en de leeftijd van
de bossen, in tegenstelling tot de hemi-epifyten die significant gecorreleerd
waren met de leeftijd van het bos, zelfs nadat het effect van de ruimtelijke
variatie tussen de proefvlakken in de statistische analyse was verwijderd.
De afwezigheid van duidelijke patronen in de successie van holo-epifyten
is verklaard door aan te nemen dat het toenemende takoppervlak in de
uitgroeiende boomkronen een voortdurende bron van nieuw substraat
vormt waarop nieuwe holo-epifyten zich kunnen vestigen. Daarentegen
wordt er verondersteld dat uitbreiding van de hemi-epifyten, die
voornamelijk voorkomen aan het lager gelegen deel van de boomstam,
beperkt wordt door een toenemend gebrek aan stamoppervlak, hetgeen de
concurrentie tussen soorten en successie bevordert.
Het aanzienlijke aantal hemi-epifyten in jonge bossen (Hoofdstuk 4) lag ten
grondslag aan de vragen in Hoofdstuk 5. Door middel van waarnemingen
in transecten en veldexperimenten werden diverse vestigingsopties
onderzocht voor secundaire hemi-epifyten in het Amazonegebied
(Amacayacu National Park). De snelle kolonisatie van open plekken kan
optreden indien planten, of delen van planten, op de een of andere manier
de totstandkoming van de open plek weten te overleven en zich vervolgens
weten te vestigen, hetzij vegetatief of door middel van zaad. Voor het
laatste, de vestiging uit zaad, werd weinig bewijs gevonden, ook niet voor
soorten die grote aantallen levenskrachtige zaden produceren. Het hoge
percentage zaadkieming in de schaduw veronderstelt dat de vestiging uit
zaad vooral in de ondergroei van het gesloten bos plaatsvindt. Daarentegen
vertonen hemi-epifytische aronskelkachtigen diverse eigenschappen die de
vestiging in open plekken via klonale vermeerdering bevorderen. Ten
eerste vertoonden de stengeldelen van vijf soorten hemi-epifytische
aronskelkachtigen die in akkertjes (chagras) werden geplaatst nieuwe

Samenvatting
163
uitlopers, hetgeen suggereert dat plantfragmenten zich kunnen handhaven
in open plekken. Daarnaast vonden we een hoge concentratie van snel
groeiende, flagelachtige uitlopers van aronskelkachtigen in de bosrand wat
erop wijst dat deze planten zich vegetatief verspreiden in de nabijheid van
een open plek. Tenslotte groeiden hemi-epifyten in het bos tot op 30 m
afstand van de bosrand in de richting van de open plek. Voornoemde
eigenschappen verklaren mogelijk waarom de vestiging van hemi-epifyten
in open plekken veel sneller verloopt dan bij holo-epifyten die vrijwel
volledig afhankelijk zijn van zaadverspreiding.

164
165
Acknowledgements
I would like to thank Jan Wolf and Joost Duivenvoorden for their
dedication and support during these past three years. Jan Wolf, my
promotor, encouraged me to place my results in a larger context. Each day
with Jan was full of learning not only about epiphytes and ecology, but also
about the scientific world. Joost Duivenvoorden my co-promotor provided
insightful comments during all stages of my project. He has drawn my
attention to the smallest details and the importance of being systematic and
consistent. Jan and Joost‘s careful editing of my thesis greatly improved the
writing. Thank you both.
In Amacayacu, where fieldwork took place, I am grateful to Alexander
Alonso director of Amacayacu National Park. Extiendo mi agradecimiento
a los curacas de las comunidades de Palmeras, Mocagua y San Martín por
permitirme desarrollar la fase de campo dentro de sus territorios.
I would like to thank Anna Kuchta, Yessika Campiño, my cousin Laura
Londoño and my father Carlos Benavides for their help during fieldwork.
En Colombia conté con el apoyo en campo de más de 35 guías locales de las
comunidades de Mocagua, Palmeras y San Martin de Amacayacu. Especialmente
quiero agradecer a Jorge Cayetano “Pio”, Matilde Moran, Bartolome Moran y
Mamerto del Aguila por su invaluable ayuda.
En el Parque Amacayacu Diana Patricia Deaza Curico, Alberto Parente, Estela
Chota, Sara Elizabeth Benneth, Maria Carolina Rugeles y Alexander Aguirre me
ofrecieron toda la ayuda logística y su invaluable amistad, gracias! During my
fieldwork in Amacayacu, I received friendship from fellow researchers
Monica Gruzmacher, Nicolas Castaño, Daniel Aristizabal, Miguel Angel
Peña, Samuel Otavo Olarte, Jaime Andrés Cabrera, Hannah Parathian,
Eider Marin, Marcela Restrepo, Carmen Yuliet Escudero and Ronald
Montañez, thanks for the help, support and friendship during this time.

Agradecimientos
166
Particular thanks and gratitude go to Alvaro J. Duque and Ricardo Callejas,
for their support and orientation during my undergraduate study at the
Universidad de Antioquia. Alejandra Vasco and Alvaro Duque, co-authors
of Chapter 3, provided valuable data for that chapter.
In Amsterdam, I would like to thank to Antoine M. Cleef for his permanent
interest and help with my research. I am gratefully to Zaire Gonzales and
Jenny Urbina for her friendships and support. I thank all other fiends and
colleagues at the UvA for all the fun we had, particularly Marian, Ximena,
Jesus, Erik and Geert.
In Medellín, I am thankful to the ―Corporación para Investigaciones
Biologicas‖ (CIB), which supported my candidature for the Alban
programme, especially Juan S. Zuluaga, Angela Restrepo and Diego Miguel
Sierra Botero.
My friends and family provided me invaluable support during this process.
Most importantly my husband, Folkert van Dunné, who was the light of
every day. To his parents Inneke and Hans for making my time in the
Netherlands very special. I thank my father Carlos, my brother and sister,
Juan and Carolina, for encouraging me to continue my research on
epiphytes. I dedicate this dissertation to my mother Diana Lucia Duque
and my grandmother Lucia Isaza because their fascination for plants has
become my passion.
Gracias!

167
Appendices
Appendix 2.1. Species found in thirty widely distributed 0.025-ha plots in the Metá
area of Colombian Amazonia. Voucher codes are added in parentheses.
Also, for each species, the number of plant individuals per habit is given, as well as
the main landscape units where the species were recorded. Habit codes: Ep=Holo-
epiphyte, He=Hemi-epiphyte; Landscape codes: TF = Terra firme, FP = Flood
plains, Sw = Swamps, PZ = Podzol; * = Species only found in one plot.
Species Ep He Landscape
Angiosperms
ARACEAE
Anthurium acrobates Sodiro (AMB 821) 1 TF*
Anthurium atropurpureum Schult. and Maguire (AMB 429)
53 5 TF, SW, PZ
Anthurium clavigerum Poepp. (AMB 177) 1 1 FP*
Anthurium eminens Schott (AMB 142) 10 2 TF, SW, FP
Anthurium ernestii Engl. (AMB 621) 202 15 TF, SW, FP, PZ
Anthurium galactospadix Croat (AMB 245) 6 FP*
Anthurium gracile (Rudge) Schott (AMB 120) 51 4 TF, SW, FP
Anthurium obtusum (Engl.) Grayum (AMB 148) 17 1 TF, SW, FP, PZ
Anthurium pentaphyllum (Aubl.) G. Don (AMB 308) 13 29 TF,FP
Anthurium polydactylum Madison (AMB 141) 2 1 TF, SW
Anthurium sinuatum Benth. ex Schott (AMB 111) 5 24 TF, SW
Anthurium sp. 2 (AMB 175) 21 1 FP, PZ
Anthurium uleanum Engl. (AMB 642) 9 6 FP*
Heteropsis flexuosa (Kunth) Bunting (AMB 208) 58 TF, SW, FP
Heteropsis spruceana Schott (AMB 741) 62 TF, SW, FP
Heteropsis steyermarkii Bunting (AMB 306) 2 49 TF, SW, PZ
Heteropsis sp. 1 (AMB 1173) 2 TF*
Heteropsis sp. 3 (AMB 803) 9 TF*
Monstera gracilis Engl. (AMB 808) 6 TF*
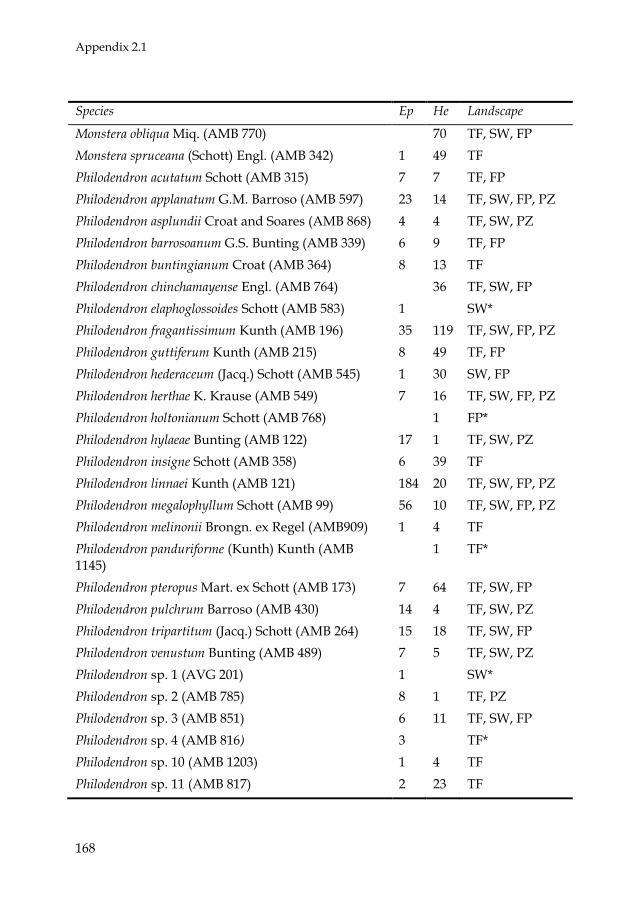
Appendix 2.1
168
Species Ep He Landscape
Monstera obliqua Miq. (AMB 770) 70 TF, SW, FP
Monstera spruceana (Schott) Engl. (AMB 342) 1 49 TF
Philodendron acutatum Schott (AMB 315) 7 7 TF, FP
Philodendron applanatum G.M. Barroso (AMB 597) 23 14 TF, SW, FP, PZ
Philodendron asplundii Croat and Soares (AMB 868) 4 4 TF, SW, PZ
Philodendron barrosoanum G.S. Bunting (AMB 339) 6 9 TF, FP
Philodendron buntingianum Croat (AMB 364) 8 13 TF
Philodendron chinchamayense Engl. (AMB 764) 36 TF, SW, FP
Philodendron elaphoglossoides Schott (AMB 583) 1 SW*
Philodendron fragantissimum Kunth (AMB 196) 35 119 TF, SW, FP, PZ
Philodendron guttiferum Kunth (AMB 215) 8 49 TF, FP
Philodendron hederaceum (Jacq.) Schott (AMB 545) 1 30 SW, FP
Philodendron herthae K. Krause (AMB 549) 7 16 TF, SW, FP, PZ
Philodendron holtonianum Schott (AMB 768) 1 FP*
Philodendron hylaeae Bunting (AMB 122) 17 1 TF, SW, PZ
Philodendron insigne Schott (AMB 358) 6 39 TF
Philodendron linnaei Kunth (AMB 121) 184 20 TF, SW, FP, PZ
Philodendron megalophyllum Schott (AMB 99) 56 10 TF, SW, FP, PZ
Philodendron melinonii Brongn. ex Regel (AMB909) 1 4 TF
Philodendron panduriforme (Kunth) Kunth (AMB 1145)
1 TF*
Philodendron pteropus Mart. ex Schott (AMB 173) 7 64 TF, SW, FP
Philodendron pulchrum Barroso (AMB 430) 14 4 TF, SW, PZ
Philodendron tripartitum (Jacq.) Schott (AMB 264) 15 18 TF, SW, FP
Philodendron venustum Bunting (AMB 489) 7 5 TF, SW, PZ
Philodendron sp. 1 (AVG 201) 1 SW*
Philodendron sp. 2 (AMB 785) 8 1 TF, PZ
Philodendron sp. 3 (AMB 851) 6 11 TF, SW, FP
Philodendron sp. 4 (AMB 816) 3 TF*
Philodendron sp. 10 (AMB 1203) 1 4 TF
Philodendron sp. 11 (AMB 817) 2 23 TF
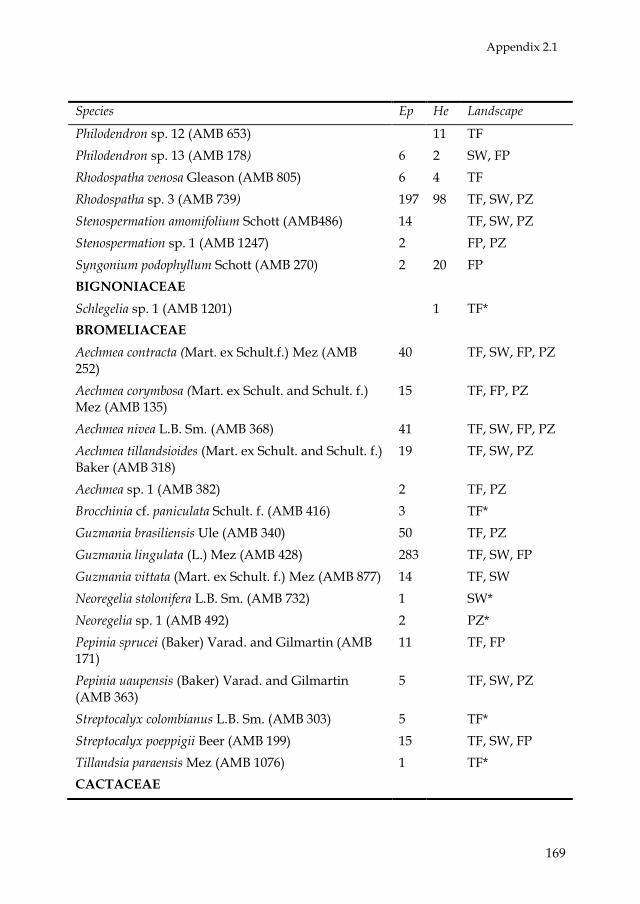
Appendix 2.1
169
Species Ep He Landscape
Philodendron sp. 12 (AMB 653) 11 TF
Philodendron sp. 13 (AMB 178) 6 2 SW, FP
Rhodospatha venosa Gleason (AMB 805) 6 4 TF
Rhodospatha sp. 3 (AMB 739) 197 98 TF, SW, PZ
Stenospermation amomifolium Schott (AMB486) 14 TF, SW, PZ
Stenospermation sp. 1 (AMB 1247) 2 FP, PZ
Syngonium podophyllum Schott (AMB 270) 2 20 FP
BIGNONIACEAE
Schlegelia sp. 1 (AMB 1201) 1 TF*
BROMELIACEAE
Aechmea contracta (Mart. ex Schult.f.) Mez (AMB 252)
40 TF, SW, FP, PZ
Aechmea corymbosa (Mart. ex Schult. and Schult. f.) Mez (AMB 135)
15 TF, FP, PZ
Aechmea nivea L.B. Sm. (AMB 368) 41 TF, SW, FP, PZ
Aechmea tillandsioides (Mart. ex Schult. and Schult. f.) Baker (AMB 318)
19 TF, SW, PZ
Aechmea sp. 1 (AMB 382) 2 TF, PZ
Brocchinia cf. paniculata Schult. f. (AMB 416) 3 TF*
Guzmania brasiliensis Ule (AMB 340) 50 TF, PZ
Guzmania lingulata (L.) Mez (AMB 428) 283 TF, SW, FP
Guzmania vittata (Mart. ex Schult. f.) Mez (AMB 877) 14 TF, SW
Neoregelia stolonifera L.B. Sm. (AMB 732) 1 SW*
Neoregelia sp. 1 (AMB 492) 2 PZ*
Pepinia sprucei (Baker) Varad. and Gilmartin (AMB 171)
11 TF, FP
Pepinia uaupensis (Baker) Varad. and Gilmartin (AMB 363)
5 TF, SW, PZ
Streptocalyx colombianus L.B. Sm. (AMB 303) 5 TF*
Streptocalyx poeppigii Beer (AMB 199) 15 TF, SW, FP
Tillandsia paraensis Mez (AMB 1076) 1 TF*
CACTACEAE

Appendix 2.1
170
Species Ep He Landscape
Disocactus amazonicus (K. Schum.) D.R. Hunt (AMB 1199)
1 TF*
CLUSIACEAE
Clusia cf. amazonica Planch. and Triana (AMB 490) 8 TF, SW, PZ
Clusia caudata (Planch. and Triana) Pipoly (AMB 1073)
1 TF*
Clusia flavida (Benth.) Pipoly (AMB 423) 27 TF, SW, PZ
Clusia grandiflora Splitg. (AMB 892) 6 1 TF*
Clusia hammeliana Pipoly (AMB 898) 4 1 TF
Clusia sp. 1 (AVG 374) 21 5 TF
Clusia sp. 2 (AVG 329) 17 1 TF
Clusia sp. 3 (AMB 624) 17 TF, FP, PZ
Clusia sp. 5 (AMB152) 2 1 SW*
Clusiaceae sp. 1 (AMB 850) 7 SW*
CYCLANTHACEAE
Asplundia vaupesiana Harling (AMB 292) 21 67 TF
Asplundia xiphophylla Harling (AMB 436) 7 24 TF, SW, FP, PZ
Evodianthus funifer (Poit.) Lindm. (AMB 123) 19 35 TF, SW, PZ
Ludovia lancifolia Brongn. (AMB 709) 28 6 TF, FP
Ludovia sp. 1 (AMB 885) 73 4 TF, PZ
ERICACEAE
Psammisia sp. 1 (AMB 443) 11 TF, PZ
Satyria cf. panurensis (Benth. ex Meisn.) Benth. and Hook. f. ex Nied. (AMB 1097)
1 TF*
GESNERIACEAE
Alloplectus sp.1 (AMB 457) 4 6 PZ*
Codonanthe calcarata (Miq.) Hanst (AMB 427) 90 TF, PZ
Codonanthe crassifolia (H. Focke) C.V. Morton (AMB 158)
175 TF, SW, FP, PZ
Codonanthopsis dissimulata (H.E. Moore) Wiehler (AMB 185)
20 TF, SW, FP
Paradrymonia ciliosa (Mart.) Wiehler (AMB 194) 36 16 TF, FP, PZ
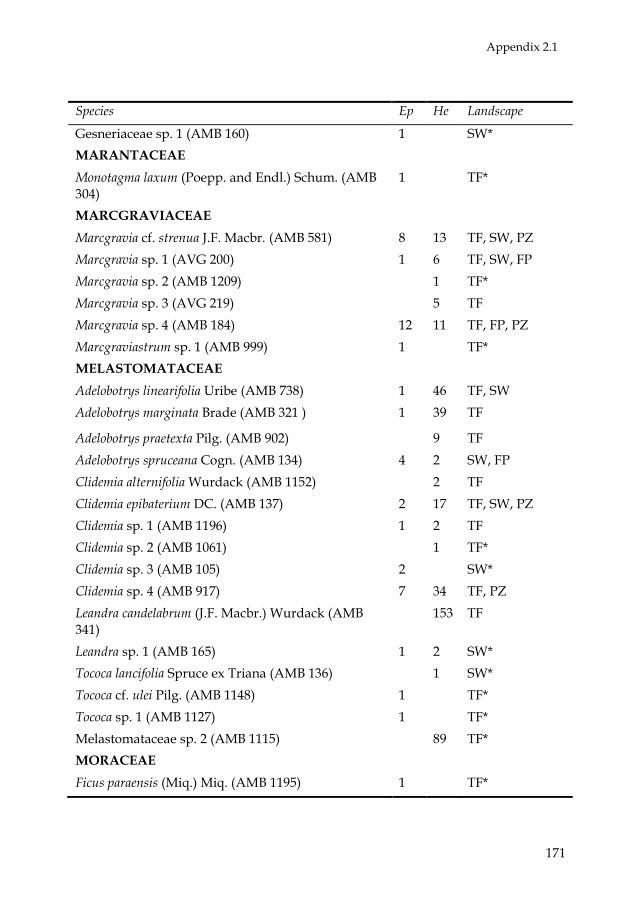
Appendix 2.1
171
Species Ep He Landscape
Gesneriaceae sp. 1 (AMB 160) 1 SW*
MARANTACEAE
Monotagma laxum (Poepp. and Endl.) Schum. (AMB 304)
1 TF*
MARCGRAVIACEAE
Marcgravia cf. strenua J.F. Macbr. (AMB 581) 8 13 TF, SW, PZ
Marcgravia sp. 1 (AVG 200) 1 6 TF, SW, FP
Marcgravia sp. 2 (AMB 1209) 1 TF*
Marcgravia sp. 3 (AVG 219) 5 TF
Marcgravia sp. 4 (AMB 184) 12 11 TF, FP, PZ
Marcgraviastrum sp. 1 (AMB 999) 1 TF*
MELASTOMATACEAE
Adelobotrys linearifolia Uribe (AMB 738) 1 46 TF, SW
Adelobotrys marginata Brade (AMB 321 ) 1 39 TF
Adelobotrys praetexta Pilg. (AMB 902) 9 TF
Adelobotrys spruceana Cogn. (AMB 134) 4 2 SW, FP
Clidemia alternifolia Wurdack (AMB 1152) 2 TF
Clidemia epibaterium DC. (AMB 137) 2 17 TF, SW, PZ
Clidemia sp. 1 (AMB 1196) 1 2 TF
Clidemia sp. 2 (AMB 1061) 1 TF*
Clidemia sp. 3 (AMB 105) 2 SW*
Clidemia sp. 4 (AMB 917) 7 34 TF, PZ
Leandra candelabrum (J.F. Macbr.) Wurdack (AMB 341)
153 TF
Leandra sp. 1 (AMB 165) 1 2 SW*
Tococa lancifolia Spruce ex Triana (AMB 136) 1 SW*
Tococa cf. ulei Pilg. (AMB 1148) 1 TF*
Tococa sp. 1 (AMB 1127) 1 TF*
Melastomataceae sp. 2 (AMB 1115) 89 TF*
MORACEAE
Ficus paraensis (Miq.) Miq. (AMB 1195) 1 TF*

Appendix 2.1
172
Species Ep He Landscape
Ficus sp. 1 (AMB 163) 1 TF*
ORCHIDACEAE
Adipe longicornis (Lindl.) M. Wolfe (AMB 316) 4 TF, PZ
Braemia vittata (Lindl.) Jenny (AMB 110) 23 2 TF, SW, FP
Campylocentrum poeppigii (Rchb. f.) Rolfe (AMB 484) 4 FP*
Catacetum sp. 1 (AVG 288) 10 SW, FP
Dichaea hookeri Garay and Sweet (AMB 613) 9 SW
Dichaea rendlei Gleason (AMB 1092) 10 TF, PZ
Epidendrum cf. nocturnum Jacq. (AMB 1256) 1 PZ*
Epidendrum longicolle Lindl. (AMB 139) 83 SW, PZ
Epidendrum microphyllum Lindl. (AMB 523) 10 SW, PZ
Gongora quinquenervis Ruiz and Pav. (AMB 505) 6 PZ*
Masdevallia aff. trigonopetala Kraenzl. (AMB 223) 3 FP*
Maxillaria cf. parkeri Hook. (AMB 521) 53 TF, PZ
Maxillaria cf. triloris E. Morren (AMB 1056) 18 TF, PZ
Maxillaria sp. 1 (AMB 596) 1 PZ*
Maxillaria sp. 3 (AMB 1232) 1 SW*
Maxillaria sp. 4 (AMB 206) 1 FP*
Maxillaria superflua Rchb. f. (AMB 359) 17 TF, PZ
Maxillaria uncata Lindl. (AMB 716) 1 TF*
Notylia sp. 1 (AMB 465) 5 PZ*
Octomeria brevifolia Cogn. (AMB 371) 5 TF
Octomeria erosilabia C. Schweinf. (AMB 421) 7 TF
Octomeria sp. 1 (AMB 1219) 31 TF
Ornithocephalus cf. cochleariformis C. Schweinf. (AMB 262)
1 FP*
Paphinia cf. seegeri Gerlach (AMB 470) 9 TF, PZ
Pleurothallis aff. aurea Lindl. (AMB 500) 7 PZ
Pleurothallis cf. flexuosa (Poepp. and Endl.) Lindl. (AMB 517)
3 SW, FP, PZ
Pleurothallis grobyi Bateman ex Lindl. (AMB 717) 1 TF*
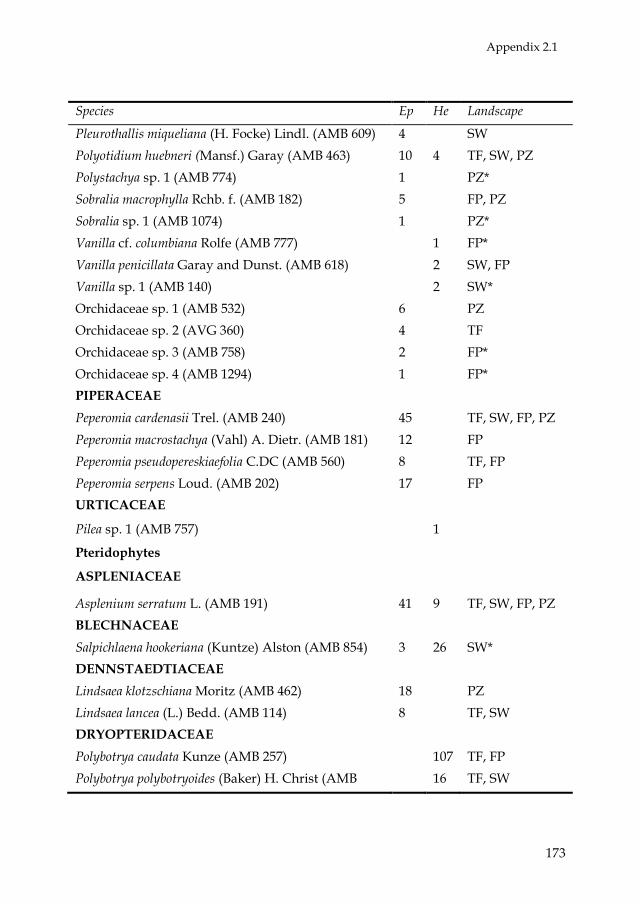
Appendix 2.1
173
Species Ep He Landscape
Pleurothallis miqueliana (H. Focke) Lindl. (AMB 609) 4 SW
Polyotidium huebneri (Mansf.) Garay (AMB 463) 10 4 TF, SW, PZ
Polystachya sp. 1 (AMB 774) 1 PZ*
Sobralia macrophylla Rchb. f. (AMB 182) 5 FP, PZ
Sobralia sp. 1 (AMB 1074) 1 PZ*
Vanilla cf. columbiana Rolfe (AMB 777) 1 FP*
Vanilla penicillata Garay and Dunst. (AMB 618) 2 SW, FP
Vanilla sp. 1 (AMB 140) 2 SW*
Orchidaceae sp. 1 (AMB 532) 6 PZ
Orchidaceae sp. 2 (AVG 360) 4 TF
Orchidaceae sp. 3 (AMB 758) 2 FP*
Orchidaceae sp. 4 (AMB 1294) 1 FP*
PIPERACEAE
Peperomia cardenasii Trel. (AMB 240) 45 TF, SW, FP, PZ
Peperomia macrostachya (Vahl) A. Dietr. (AMB 181) 12 FP
Peperomia pseudopereskiaefolia C.DC (AMB 560) 8 TF, FP
Peperomia serpens Loud. (AMB 202) 17 FP
URTICACEAE
Pilea sp. 1 (AMB 757) 1
Pteridophytes
ASPLENIACEAE
Asplenium serratum L. (AMB 191) 41 9 TF, SW, FP, PZ
BLECHNACEAE
Salpichlaena hookeriana (Kuntze) Alston (AMB 854) 3 26 SW*
DENNSTAEDTIACEAE
Lindsaea klotzschiana Moritz (AMB 462) 18 PZ
Lindsaea lancea (L.) Bedd. (AMB 114) 8 TF, SW
DRYOPTERIDACEAE
Polybotrya caudata Kunze (AMB 257) 107 TF, FP
Polybotrya polybotryoides (Baker) H. Christ (AMB 16 TF, SW

Appendix 2.1
174
Species Ep He Landscape
115)
Polybotrya pubens Mart. (AMB 350) 1 235 TF, SW
Polybotrya sessilisora R. C. Moran (AMB 986) 1 TF*
GRAMMITIDACEAE
Cochlidium furcatum (Hook. and Grev.) C. Chr. (AMB 982)
11 TF, PZ
HYMENOPHYLLACEAE
Hymenophyllum hirsutum (L.) Sw. (AMB 916) 2 TF*
Hymenophyllum sp. 1 (AMB 1254) 5 PZ*
Trichomanes ankersii C. Parker ex Hook. and Grev. (AMB 288)
9 325 TF, SW
Trichomanes arbuscula Desv. (AMB 616) 2 3 SW*
Trichomanes bicorne Hook. (AMB 455) 89 7 PZ
Trichomanes botryoides Kaulf. (AMB 305) 1 TF*
Trichomanes crispum L. (AMB 840) 1 TF*
Trichomanes ekmanii Wess. (AMB 154) 15 2 SW, FP, PZ
Trichomanes elegans Rich. (AMB 1097) 3 TF*
Trichomanes martiusii C. Presl. (AMB 96) 116 30 TF, SW, FP, PZ
Trichomanes tanaicum J.W. Sturm (AMB 107) 5 7 SW, FP
Trichomanes tuerckheimii H. Christ (AMB 1008) 4 TF
Trichomanes sp. 1 (AMB 975) 1 TF*
LOMARIOPSIDACEAE
Elaphoglossum discolor (Kuhn) C. Christ. (AMB 456) 248 PZ
Elaphoglossum flaccidum (Fée) T. Moore (AMB 225) 2 7 FP, TF
Elaphoglossum glabellum J. Sm. (AMB 467) 128 TF, PZ
Elaphoglossum luridum (Fée) H. Christ (AMB 183) 33 1 TF, SW, FP, PZ
Elaphoglossum obovatum Mickel (AMB 302) 15 TF, PZ
Elaphoglossum plumosum (Fée) T. Moore. (AMB 1126) 7 PZ
Lomagramma guianense (Aulb.) Ching (AMB 834) 11 SW*
Lomariopsis japurensis Mart. J. Sm. (AMB 100) 1 109 TF, SW, FP, PZ
POLYPODIACEAE
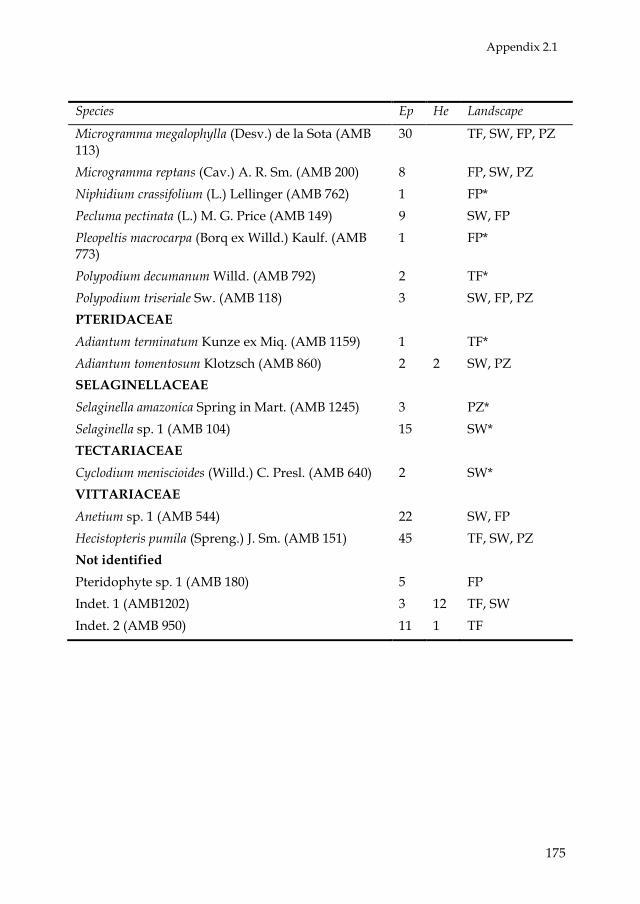
Appendix 2.1
175
Species Ep He Landscape
Microgramma megalophylla (Desv.) de la Sota (AMB 113)
30 TF, SW, FP, PZ
Microgramma reptans (Cav.) A. R. Sm. (AMB 200) 8 FP, SW, PZ
Niphidium crassifolium (L.) Lellinger (AMB 762) 1 FP*
Pecluma pectinata (L.) M. G. Price (AMB 149) 9 SW, FP
Pleopeltis macrocarpa (Borq ex Willd.) Kaulf. (AMB 773)
1 FP*
Polypodium decumanum Willd. (AMB 792) 2 TF*
Polypodium triseriale Sw. (AMB 118) 3 SW, FP, PZ
PTERIDACEAE
Adiantum terminatum Kunze ex Miq. (AMB 1159) 1 TF*
Adiantum tomentosum Klotzsch (AMB 860) 2 2 SW, PZ
SELAGINELLACEAE
Selaginella amazonica Spring in Mart. (AMB 1245) 3 PZ*
Selaginella sp. 1 (AMB 104) 15 SW*
TECTARIACEAE
Cyclodium meniscioides (Willd.) C. Presl. (AMB 640) 2 SW*
VITTARIACEAE
Anetium sp. 1 (AMB 544) 22 SW, FP
Hecistopteris pumila (Spreng.) J. Sm. (AMB 151) 45 TF, SW, PZ
Not identified
Pteridophyte sp. 1 (AMB 180) 5 FP
Indet. 1 (AMB1202) 3 12 TF, SW
Indet. 2 (AMB 950) 11 1 TF

176
Appendix 3.1 List of epiphyte species recorded in 10 0.1-ha plots in the
Chiribiquete area in Colombian Amazonia. h = holo-epiphyte; p = primary hemi-
epiphyte; s = secondary hemi-epiphyte. Mean patchiness is the number of epiphyte
individuals divided by the number of phorophyte individuals in a plot, averaged
over plots with > 0 individuals.
Habit Number of individuals
Number of phorophytes
Mean Patchiness
Araceae
Anthurium clavigerum Poepp. s 3 3 1.0
Anthurium ernestii Engl. h 42 33 1.2
Anthurium gracile (Rudge) Schott h 38 21 1.3
Anthurium obtusum (Engl.) Grayum h 28 24 1.1
Anthurium pentaphyllum (Aubl.) G. Don
s 54 51 1.0
Anthurium polydactylum Madison h 19 18 1.1
Anthurium uleanum Engl. h 318 204 1.3
Heteropsis jenmanii Oliv. s 167 157 1.1
Heteropsis oblongifolia Kunth s 42 40 1.1
Heteropsis sp. 2 (Vasco 214) s 1 1 1.0
Heteropsis spruceana Schott s 175 161 1.0
Heteropsis steyermarkii G.S. Bunting s 24 23 1.0
Monstera cf. adansonii Schott s 1 1 1.0
Monstera gracilis Engl. s 234 167 1.3
Monstera obliqua Miq. s 6 6 1.0
Monstera sp. 1 (Vasco 246) s 10 9 1.1
Philodendron acutatum Schott s 1 1 1.0
Philodendron applanatum G.M. Barroso
s 3 3 1.0
Philodendron asplundii Croat & M.L.C. Soares
s 20 18 1.1
Philodendron barrosoanum G.S. Bunting
s 16 16 1.0
Philodendron buntingianum Croat s 68 54 1.1
Philodendron chinchamayense Engl. s 10 8 1.3
Philodendron elaphoglossoides Schott s 133 104 1.3

Appendix 3.1
177
Habit
Number of individuals
Number of phorophytes
Mean Patchiness
Philodendron fragrantissimum (Hook.) G. Don
s 260 208 1.2
Philodendron herthae K. Krause s 10 10 1.0
Philodendron hylaeae G.S. Bunting s 19 19 1.0
Philodendron insigne Schott s 81 50 1.7
Philodendron linnaei Kunth s 113 66 1.6
Philodendron megalophyllum Schott p 39 36 1.0
Philodendron panduriforme (Kunth) Kunth
s 4 4 1.0
Philodendron pedatum (Hook.) Kunth s 5 4 1.3
Philodendron pulchrum G.M. Barroso s 34 32 1.0
Philodendron rudgeanum Schott s 4 1 4.0
Philodendron sp. 1 (Vasco 201) s 2 2 1.0
Philodendron sp. 11 (Vasco 215) s 3 3 1.0
Philodendron sp. 12 (Vasco 419) s 69 58 1.1
Philodendron sp. 7(Vasco 207) s 20 17 1.1
Philodendron sp. 8 (Vasco 328) s 115 90 1.3
Philodendron sp. 9 (Vasco 365) s 1 1 1.0
Philodendron spruceanum G.S. Bunting s 13 13 1.0
Philodendron tripartitum (Jacq.) Schott s 1 1 1.0
Philodendron venustum Bunting s 162 136 1.1
Rhodospatha venosa Gleason s 26 23 1.1
Stenospermatium amomifolium Schott h 18 12 1.4
Syngonium podophyllum Schott s 4 3 1.3
Bromeliaceae
Aechmea corymbosa (Mart. ex Schult. & Schult. f.) Mez
h 3 3 1.0
Aechmea nallyi L.B. Sm. h 15 15 1.0
Aechmea nivea L.B. Sm. h 13 11 1.2
Aechmea sp. 1 (Vasco 300) h 4 4 1.0
Aechmea tillandsioides (Mart. ex Schult. & Schult. f.) Baker
h 6 5 1.1
Araeococcus flagellifolius Harms h 8 7 1.1

Appendix 3.1
178
Habit
Number of individuals
Number of phorophytes
Mean Patchiness
Guzmania brasiliensis Ule h 144 91 1.4
Pepinia uaupensis (Baker) G.S. Varad. & Gilmartin
h 321 109 2.6
Streptocalyx longifolius (Rudge) Baker h 80 41 1.5
Streptocalyx poeppigii Beer h 22 13 1.3
Cactaceae
Epiphyllum sp. 1 (Vasco 272) h 10 10 1.0
Cecropiaceae
Coussapoa orthoneura Standl. p 4 4 1.0
Clusiaceae
Clusia amazonica Planch. & Triana p 57 52 1.0
Clusia hammeliana Pipoly p 45 35 1.1
Clusia opaca Maguire p 2 2 1.0
Clusia sp. 1 (Vasco 374) p 6 6 1.0
Clusia sp. 2 (Vasco 329) p 13 8 1.6
Clusia sp. 3 (Benavides 624) p 7 7 1.0
Cyclanthaceae
Asplundia sp. 1 (Vasco 233) s 2 2 1.0
Asplundia vaupesiana Harling s 32 24 1.1
Asplundia xiphophylla Harling s 10 10 1.0
Ludovia lancifolia Brongn. h 71 60 1.1
Cyperaceae sp. 1 (Vasco 261) h 13 9 2.6
Hypolytrum sp. 1 (Vasco 369) h 27 16 1.9
Gesneriaceae
Codonanthe calcarata (Miq.) Hanst h 51 35 1.2
Codonanthe crassifolia (H. Focke) C.V. Morton
h 69 53 1.2
Codonanthe sp. 1 (Vasco 359) h 1 1 1.0
Codonanthopsis dissimulata (H.E. Moore) Wiehler
h 20 15 1.2
Drymonia coccinea (Aubl.) Wiehler s 1 1 1.0
Paradrymonia ciliosa (Mart.) Wiehler h 6 5 1.2
Marcgraviaceae
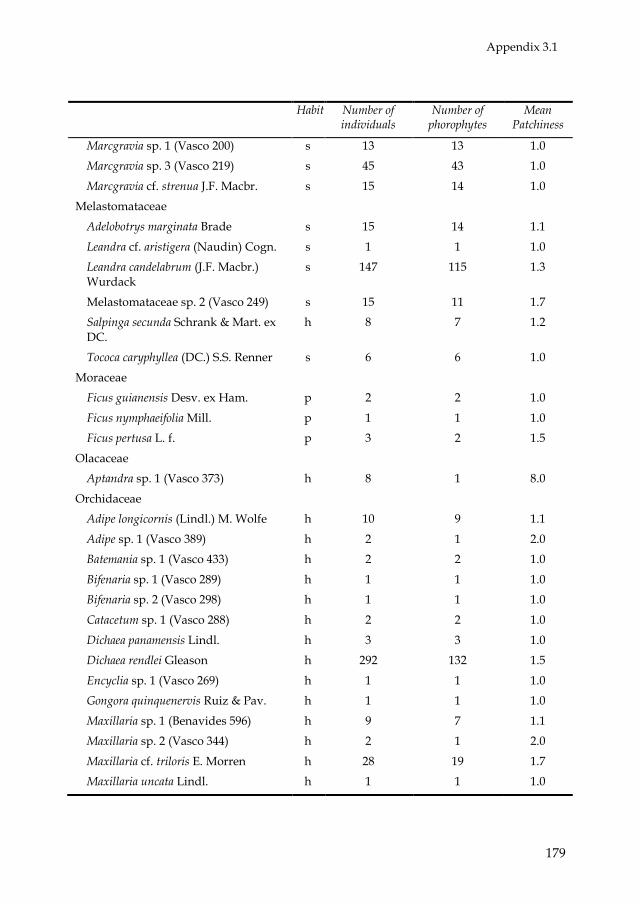
Appendix 3.1
179
Habit
Number of individuals
Number of phorophytes
Mean Patchiness
Marcgravia sp. 1 (Vasco 200) s 13 13 1.0
Marcgravia sp. 3 (Vasco 219) s 45 43 1.0
Marcgravia cf. strenua J.F. Macbr. s 15 14 1.0
Melastomataceae
Adelobotrys marginata Brade s 15 14 1.1
Leandra cf. aristigera (Naudin) Cogn. s 1 1 1.0
Leandra candelabrum (J.F. Macbr.) Wurdack
s 147 115 1.3
Melastomataceae sp. 2 (Vasco 249) s 15 11 1.7
Salpinga secunda Schrank & Mart. ex DC.
h 8 7 1.2
Tococa caryphyllea (DC.) S.S. Renner s 6 6 1.0
Moraceae
Ficus guianensis Desv. ex Ham. p 2 2 1.0
Ficus nymphaeifolia Mill. p 1 1 1.0
Ficus pertusa L. f. p 3 2 1.5
Olacaceae
Aptandra sp. 1 (Vasco 373) h 8 1 8.0
Orchidaceae
Adipe longicornis (Lindl.) M. Wolfe h 10 9 1.1
Adipe sp. 1 (Vasco 389) h 2 1 2.0
Batemania sp. 1 (Vasco 433) h 2 2 1.0
Bifenaria sp. 1 (Vasco 289) h 1 1 1.0
Bifenaria sp. 2 (Vasco 298) h 1 1 1.0
Catacetum sp. 1 (Vasco 288) h 2 2 1.0
Dichaea panamensis Lindl. h 3 3 1.0
Dichaea rendlei Gleason h 292 132 1.5
Encyclia sp. 1 (Vasco 269) h 1 1 1.0
Gongora quinquenervis Ruiz & Pav. h 1 1 1.0
Maxillaria sp. 1 (Benavides 596) h 9 7 1.1
Maxillaria sp. 2 (Vasco 344) h 2 1 2.0
Maxillaria cf. triloris E. Morren h 28 19 1.7
Maxillaria uncata Lindl. h 1 1 1.0
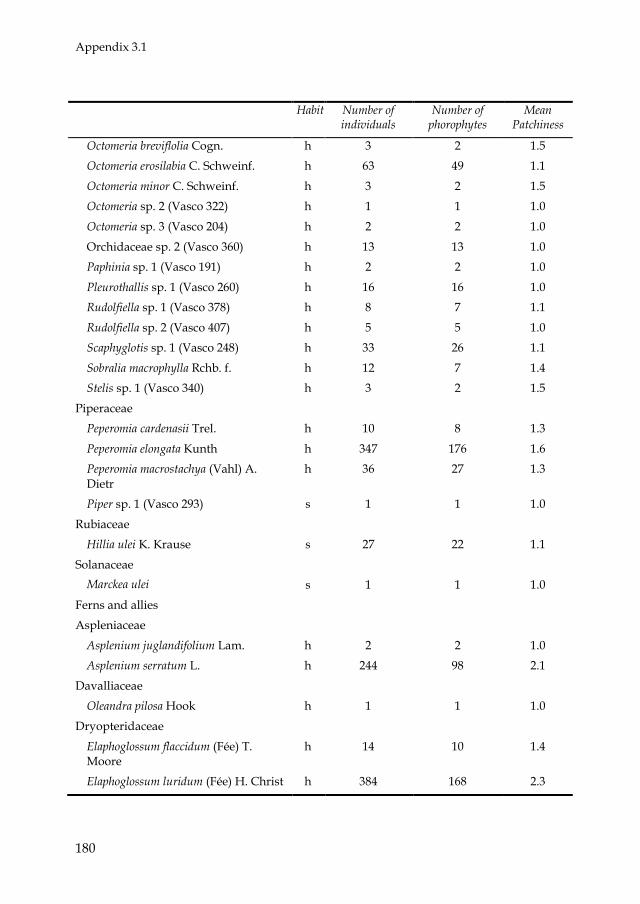
Appendix 3.1
180
Habit
Number of individuals
Number of phorophytes
Mean Patchiness
Octomeria breviflolia Cogn. h 3 2 1.5
Octomeria erosilabia C. Schweinf. h 63 49 1.1
Octomeria minor C. Schweinf. h 3 2 1.5
Octomeria sp. 2 (Vasco 322) h 1 1 1.0
Octomeria sp. 3 (Vasco 204) h 2 2 1.0
Orchidaceae sp. 2 (Vasco 360) h 13 13 1.0
Paphinia sp. 1 (Vasco 191) h 2 2 1.0
Pleurothallis sp. 1 (Vasco 260) h 16 16 1.0
Rudolfiella sp. 1 (Vasco 378) h 8 7 1.1
Rudolfiella sp. 2 (Vasco 407) h 5 5 1.0
Scaphyglotis sp. 1 (Vasco 248) h 33 26 1.1
Sobralia macrophylla Rchb. f. h 12 7 1.4
Stelis sp. 1 (Vasco 340) h 3 2 1.5
Piperaceae
Peperomia cardenasii Trel. h 10 8 1.3
Peperomia elongata Kunth h 347 176 1.6
Peperomia macrostachya (Vahl) A. Dietr
h 36 27 1.3
Piper sp. 1 (Vasco 293) s 1 1 1.0
Rubiaceae
Hillia ulei K. Krause s 27 22 1.1
Solanaceae
Marckea ulei s 1 1 1.0
Ferns and allies
Aspleniaceae
Asplenium juglandifolium Lam. h 2 2 1.0
Asplenium serratum L. h 244 98 2.1
Davalliaceae
Oleandra pilosa Hook h 1 1 1.0
Dryopteridaceae
Elaphoglossum flaccidum (Fée) T. Moore
h 14 10 1.4
Elaphoglossum luridum (Fée) H. Christ h 384 168 2.3
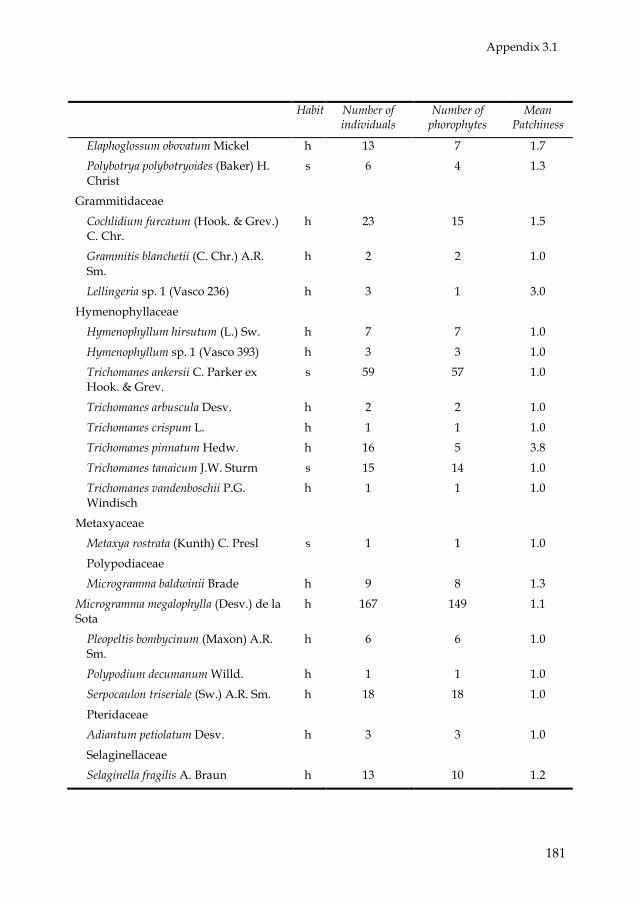
Appendix 3.1
181
Habit
Number of individuals
Number of phorophytes
Mean Patchiness
Elaphoglossum obovatum Mickel h 13 7 1.7
Polybotrya polybotryoides (Baker) H. Christ
s 6 4 1.3
Grammitidaceae
Cochlidium furcatum (Hook. & Grev.) C. Chr.
h 23 15 1.5
Grammitis blanchetii (C. Chr.) A.R. Sm.
h 2 2 1.0
Lellingeria sp. 1 (Vasco 236) h 3 1 3.0
Hymenophyllaceae
Hymenophyllum hirsutum (L.) Sw. h 7 7 1.0
Hymenophyllum sp. 1 (Vasco 393) h 3 3 1.0
Trichomanes ankersii C. Parker ex Hook. & Grev.
s 59 57 1.0
Trichomanes arbuscula Desv. h 2 2 1.0
Trichomanes crispum L. h 1 1 1.0
Trichomanes pinnatum Hedw. h 16 5 3.8
Trichomanes tanaicum J.W. Sturm s 15 14 1.0
Trichomanes vandenboschii P.G. Windisch
h 1 1 1.0
Metaxyaceae
Metaxya rostrata (Kunth) C. Presl s 1 1 1.0
Polypodiaceae
Microgramma baldwinii Brade h 9 8 1.3
Microgramma megalophylla (Desv.) de la Sota
h 167 149 1.1
Pleopeltis bombycinum (Maxon) A.R. Sm.
h 6 6 1.0
Polypodium decumanum Willd. h 1 1 1.0
Serpocaulon triseriale (Sw.) A.R. Sm. h 18 18 1.0
Pteridaceae
Adiantum petiolatum Desv. h 3 3 1.0
Selaginellaceae
Selaginella fragilis A. Braun h 13 10 1.2

Appendix 3.1
182
Habit
Number of individuals
Number of phorophytes
Mean Patchiness
Tectariaceae
Triplophyllum funestum (Kunze) Holttum
s 1 1 1.0
Vittariaceae
Hecistopteris pumila (Spreng.) J. Sm. h 99 94 1.0
Polytaenium cajenense (Desv.) Benedict h 8 6 1.3
Vittaria lineata (L.) Sm. h 3 3 1.0
Unidentified species
Unidentified 1 (Benavides 1202) s 8 8 1.0
Unidentified 3 (Vasco 323) s 1 1 1.0
Unidentified 4 (Vasco 327) s 1 1 1.0

183
Appendix 4.1. Epiphyte species found in 56 0.04-ha plots in fallows and mature
upland forests in Amacayacu National Park, Colombian Amazonia. For each
species, the average dry weight biomass (g/0.04 ha). Dispersal (z = zoochoric; a =
anemochoric), and habit (h = hemi-epiphyte, e = holo-epiphyte, o = occasional
epiphyte) is given. For species marked with * biomass estimates were not possible
because of the small plant size.
Species 2 -8 y
9-16 y
17-22 y
23-30 y
Mature forest
Dispersal, habit
Monocotyledons
ARACEAE
Anthurium breviscapum Poepp. 1 1 0 13 z/e
A. clavigerum Poepp. 1 13 13 32 z/h
A. decurrens Poepp. 2 1 3 z/h
A. digitatum (Jacq.) Schott 24 53 43 52 4 z/h
A. eminens Schott 8 17 116 132 289 z/h
A. gracile (Rudge) Schott 9 1 3 3 5 z/e
A. kunthii Poepp. 0 1 z/h
A. loretense Croat 4 1 16 57 51 z/e
A. obtusum (Engl.) Grayum 0 4 z/e
A. oxycarpum Poepp. 5 z/h
A. pendulifolium N.E. Br. 5 3 6 z/e
A. penthaphyllum (Aubl.) G. Don
4 25 10 7 z/h
A. polyschistum R.E. Schlt. & Idobro
12 23 8 28 z/h
A. uleanum Engl. 6 2 1 z/e
A. sp. z/h
Heteropsis oblongifolia Kunth 7 2 9 16 65 z/h
H. tenuispadix G.S. Bunting 18 z/h
H. sp. (AMB 1610) 5 z/h
Mostera adansonii Schott 4 13 65 292 12 z/h
M. dilacerata (K. Koch & Sellow) K. Koch
25 8 23 16 z/h

Appendix 4.1
184
Species 2 -8 y
9-16 y
17-22 y
23-30 y
Mature forest
Dispersal, habit
M. gracilis Engl. 1 2 3 9 69 z/h
M. obliqua Miq. 4 14 6 34 z/h
M. spruceana (Schott) Engl. 93 49 115 227 1072 z/h
Philodendron asplundii Croat 184 398 150 299 694 z/h
P. cataniaponense Bunting 5 117 180 44 z/h
P. chinchamayense Engl. 2 36 166 49 85 z/h
P. aff. elaphoglosoides Schott 1 8 z/h
P. ernestii Engl. 948 1198
1497 1621 322 z/h
P. exile Bunting 157 z/h
P. aff. exile Bunting 3 39 z/h
P. fragantissimum (Hook.) G. Don
120 381 534 1552 2280 z/h
P. guttiferum Kunth 11 546 z/h
P. hederaceum (Jacq.) Schott 104 z/h
P. linnaei Kunth 5 0 67 55 49 z/h
P. mawarinumae Bunting 2 z/h
P. megalophyllum Schott 43 87 33 161 397 z/h
P. micranthum Poepp. ex Schott 9 22 46 330 z/h
P. ornatum Schott 1 2 6 z/h
P. panduriforme (Kunth) Kunth 21 2 0 1 1 z/h
P. pulchrum G.M. Barroso 270 z/h
P. rudgeanum Schott 17 70 427 192 239 z/h
P. sphalerum Schott 1 1 2 1 z/h
P. aff. sucrense (Miq.) Bunting 1 27 3 z/h
P. aff. tripartitum (AMB 2021) 1 1 10 12 14 z/h
P. uleanum Engl. 2 9 19 3 126 z/h
P. venustum Bunting 18 260 z/h
P. wittianum Engl. 38 106 9 150 694 z/h

Appendix 4.1
185
Species 2 -8 y
9-16 y
17-22 y
23-30 y
Mature forest
Dispersal, habit
P. wurdackii Bunting 65 48 229 269 133 z/h
P. aff. wurdackii Bunting 1 z/h
P. sp. 1 (AMB 2075) 5 z/h
P. sp. 2 (AMB 1572) 47 3 143 584 362 z/h
P. sp. 3 (AMB 1775) 0 z/h
Rhodospatha cf. brachyopoda Bunting
175 z/h
R. latifolia Poeppig Endl. 143 215 357 427 1495 z/h
R. sp. 1 (AMB 1430) 28 16 z/h
Stenospermatium amomifolium (Poepp.) Schott
0 1 z/e
S. sp. (AMB 2014) 1 8 z/e
Syngonium sp. (AMB 1583) 65 67 90 148 147 z/h
BROMELIACEAE
Aechmea angustifolia Poepp. & Endl.
3 2 11 z/e
A. corymbosa (Mart. Ex Schult. & Schult. F.)
6 z/e
A. aff. corymbosa (Mart. Ex Schult. F.)
11 16 4 27 14 z/e
A. sp. (AMB 1746) 1 1 10 z/e
Billbergia sp. (AMB 1442) 10 z/e
Guzmania brasiliensis Ule 0 2 0 0 3 z/e
G. sp. 1 (AMB 1961) 61 z/e
G. sp. 2 (AMB 1543) 0 0 z/e
Neoregelia eleutheropetala (Ule) L.M. Sm.
2 z/e
Streptocalyx longifolius (Rudge) Baker
1 0 1 0 z/e
Bromeliaceae sp. z/e
COMMELINACEAE
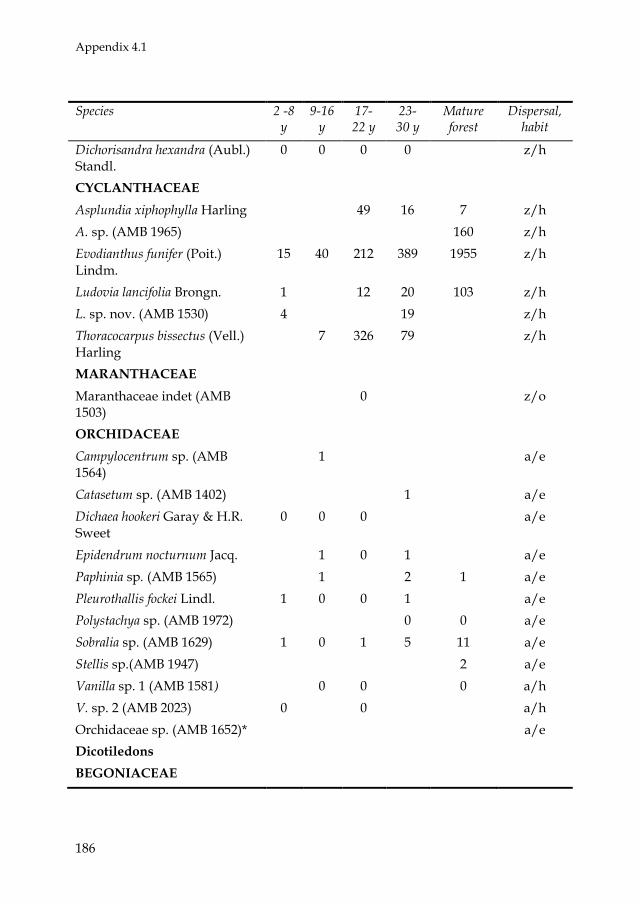
Appendix 4.1
186
Species 2 -8 y
9-16 y
17-22 y
23-30 y
Mature forest
Dispersal, habit
Dichorisandra hexandra (Aubl.) Standl.
0 0 0 0 z/h
CYCLANTHACEAE
Asplundia xiphophylla Harling 49 16 7 z/h
A. sp. (AMB 1965) 160 z/h
Evodianthus funifer (Poit.) Lindm.
15 40 212 389 1955 z/h
Ludovia lancifolia Brongn. 1 12 20 103 z/h
L. sp. nov. (AMB 1530) 4 19 z/h
Thoracocarpus bissectus (Vell.) Harling
7 326 79 z/h
MARANTHACEAE
Maranthaceae indet (AMB 1503)
0 z/o
ORCHIDACEAE
Campylocentrum sp. (AMB 1564)
1 a/e
Catasetum sp. (AMB 1402) 1 a/e
Dichaea hookeri Garay & H.R. Sweet
0 0 0 a/e
Epidendrum nocturnum Jacq. 1 0 1 a/e
Paphinia sp. (AMB 1565) 1 2 1 a/e
Pleurothallis fockei Lindl. 1 0 0 1 a/e
Polystachya sp. (AMB 1972) 0 0 a/e
Sobralia sp. (AMB 1629) 1 0 1 5 11 a/e
Stellis sp.(AMB 1947) 2 a/e
Vanilla sp. 1 (AMB 1581) 0 0 0 a/h
V. sp. 2 (AMB 2023) 0 0 a/h
Orchidaceae sp. (AMB 1652)* a/e
Dicotiledons
BEGONIACEAE

Appendix 4.1
187
Species 2 -8 y
9-16 y
17-22 y
23-30 y
Mature forest
Dispersal, habit
Begonia sp. (AMB 1417) 1 z/e
CACTACEAE
Disocactus amazonicus (K. Schum.) D.R. Hunt
2 0 1 z/e
CECROPIACEAE
Pourouma sp. (AMB 1725) 0 z/h
CLUSIACEAE
Clusia sp. 1 (AMB 1594) 0 0 0 0 0 z/h
Clusia sp. 2 (AMB 1428) 2 1 2 z/h
ERICACEAE
Ericaceae indet (AMB 1624)* z/e
GESNERIACEAE
Codonanthe calcarata (Miq.) Hanst.
0 0 0 z/e
C. crassifolia (H. Focke) C.V. Morton
0 0 0 0 0 z/e
Codonanthopsis dissimulata (H.E. Moore) Wiehler
1 1 2 0 z/e
Columnea sp. 1 (AMB 1406) 7 4 7 8 z/h
Drymonia anisophylla L.E. Skog & L.P. Kvist
0 11 21 9 10 z/h
Drymonia coccinea (Aubl.) Wiehler
3 11 z/h
D. sp. 2 (AMB 1650) 4 4 31 13 2 z/h
MARCGRAVIACEAE
Marcgravia sp. 1 (AMB 1644) 6 6 7 27 80 z/h
M. sp. 2 (AMB 1983) 120 z/h
M. sp. 3 (AMB 1664) 0 0 0 z/h
MELASTOMATACEAE
Adelobotrys sp. (AMB 2086) 3 0 3 z/h
Clidemia epibaterium DC. 0 1 21 10 z/h

Appendix 4.1
188
Species 2 -8 y
9-16 y
17-22 y
23-30 y
Mature forest
Dispersal, habit
Melastomataceae sp. (AMB 1750)
0 0 0 z/h
MORACEAE
Ficus sp. 1 (AMB 2046) 0 z/h
F. sp. 2 (AMB 1506) 0 0 0 0 0 z/h
F. sp. 3 (AMB 1642) 0 0 0 z/h
PIPERACEAE
Manekia sydowii Trel. 4 z/h
Peperomia glabella (Sw.) A. Dietr.
0 z/e
P. macrostachya (Vahl) A. Dietr. 1 6 3 4 21 z/e
P. radicosa Yunck. 0 1 0 1 z/e
P. serpens (Sw.) Loudon 0 0 2 3 4 z/e
P. trichopus Trel. 0 0 z/e
Piper nematanthera C. DC. 0 z/e
P. sp. (AMB 1795) 0 0 1 z/e
RUBIACEAE
Sabicea amazonensis Wernham 0 z/h
S. sp. (AMB 1918) 1 0 0 z/h
Rubiaceae sp. (AMB 2052) 0 z/o
SOLANACEAE
Markea sp. (AMB 2044) 0 1 z/h
Pteridophytes
ASPLENIACEAE
Asplenium angustatum Kunze 0 1 0 a/e
A. auritum Sw. 0 a/e
A. cirrhatum Rich. ex Willd. 1 0 a/e
A. salicifolium L. 0 a/e
A. serratum L. 3 3 5 18 73 a/e
BLECHNACEAE

Appendix 4.1
189
Species 2 -8 y
9-16 y
17-22 y
23-30 y
Mature forest
Dispersal, habit
Salpichlaena cf. hookeriana (Kuntze) Alston
21 0 a/h
DRYOPTERIDACEAE
Polybotrya caudata Kunze 7 22 101 170 865 a/h
P. osmundacea Humb. & Bonpl. ex Willd.
20 31 32 34 226 a/h
P. polybotryoides (Baker) H. Christ
147 31 92 585 793 a/h
HYMENOPHYLLACEAE
Trichomanes ankersii C. Parker ex Hook. & Grev.
0 4 a/e
T. ekmani Wess. Boer* a/e
LOMARIOPSIDACEAE
Elaphoglossum luridum (Fée) H. Christ
0 1 a/e
E. plumosum (Fée) T. Moore 1 15 a/e
Lomariopsis japurensis (Mart.) J. Sm.
20 12 85 112 678 a/h
L. sp. (AMB 1490) 1 3 84 a/h
POLYPODIACEAE
Campyloneurum phyllitidis (L.) C. Presl
2 13 21 a/e
C. cf. phyllitidis (L.) C. Presl 0 3 1 0 a/e
C. cf. repens (Aubl.) C. Presl 1 17 a/e
Dicranoglossum desvauxii (Klotzsch) Proctor
0 1 a/e
Microgramma lycopodioides (L.) Copel.
2 3 1 36 a/e
M. percussa (Cav.) de la Sota 9 75 a/e
M. persicariifolia (Schrad.) C. Presl
0 a/e
M. repens (Cav.) A.R. Sm. 3 4 6 15 7 a/e

Appendix 4.1
190
Species 2 -8 y
9-16 y
17-22 y
23-30 y
Mature forest
Dispersal, habit
Pecluma cf. camptophyllaria (Fée) M.G. Price
1 1 a/e
Pleopeltis macrocarpa (Bory ex Willd.) Kaulf.
0 a/e
Polypodium caceresii Sodiro 1 1 a/e
P. decumanum Willd. 1 0 1 3 1 a/e
P. loriceum L. 0 a/e
P. sp. (AMB 1910) 0 a/e
PTERIDACEAE
Adiantum cf. amazonicum A.R. Sm.
0 0 a/o
SELAGINELLACEAE
Sellaginella sp. 1 (AMB 1599) 0 0 a/o
THELYPTERIDACEAE
Thelypteris opulenta (Kaulf.) 1 2 a/h
VITTARIACEAE
Anetium sp. (AMB 1709) 1 7 6 13 a/e
Antrophyllum sp. (AMB 1499) 0 1 2 a/e
Hecistopteris pumila (Spreng.) J. Sm.*
a/e
Vittaria costata Kunze 0 0 0 a/e
V. sp. (AMB 1598) 0 0 a/e
UNIDENTIFIED SPECIES
Pteridophyte sp. 1 (AMB 1919) 1 1 10 a/e
Pteridophyte indet 0 z/e

191
Appendix 5.1. Aroid species found in chagra-forest ecotones, fallow-forest ecotones, and mature upland forests in
Amacayacu National Park, Colombian Amazonia. The values represent numbers of individuals. The classification into
successional position is based on Benavides et al. (2006).
Species
chagra-forest
fallow-forest mature forest
flagellar plants
recruit-ments
successional position selected for monitoring
chagra edge fallow edge
early mid late stems
plants
Anthurium breviscapum Poepp. 2 1 x 1 1
A. clavigerum Poepp. 3 1 x x 1 1
A. digitatum (Jacq.) Schott 26 57 51 82 36 6 14 x x 60 56
A. eminens Schott 4 11 1 x x 4 4
A. loretense Croat 1 4 1 x x 1 1
A. oxycarpum Poepp. 1 1 x 1 1
A. pendulifolium N.E. Br. 1 x
A. pentaphyllum (Aubl.) G. Don 1 1 1 2 1 x 2 2
A. polyschistum R.E. Schultes & Idrobo
2 14 x x 3 3
Heteropsis tenuispadix G.S.
Bunting
1 1 x x 1 1
Monstera aff. obliqua Miq 5 2 x x
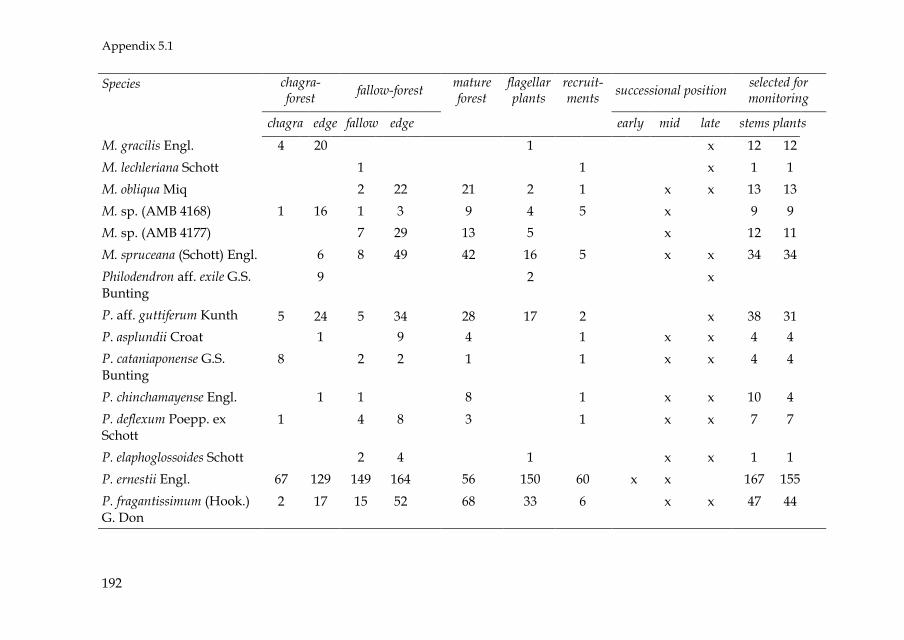
Appendix 5.1
192
Species chagra-forest
fallow-forest mature forest
flagellar plants
recruit-ments
successional position selected for monitoring
chagra edge fallow edge
early mid late stems
plants
M. gracilis Engl. 4 20 1 x 12 12
M. lechleriana Schott 1 1 x 1 1
M. obliqua Miq 2 22 21 2 1 x x 13 13
M. sp. (AMB 4168) 1 16 1 3 9 4 5 x 9 9
M. sp. (AMB 4177) 7 29 13 5 x 12 11
M. spruceana (Schott) Engl. 6 8 49 42 16 5 x x 34 34
Philodendron aff. exile G.S. Bunting
9 2 x
P. aff. guttiferum Kunth 5 24 5 34 28 17 2 x 38 31
P. asplundii Croat 1 9 4 1 x x 4 4
P. cataniaponense G.S. Bunting
8 2 2 1 1 x x 4 4
P. chinchamayense Engl. 1 1 8 1 x x 10 4
P. deflexum Poepp. ex Schott
1 4 8 3 1 x x 7 7
P. elaphoglossoides Schott 2 4 1 x x 1 1
P. ernestii Engl. 67 129 149 164 56 150 60 x x 167 155
P. fragantissimum (Hook.) G. Don
2 17 15 52 68 33 6 x x 47 44

Appendix 5.1
193
Species chagra-forest
fallow-forest mature forest
flagellar plants
recruit-ments
successional position selected for monitoring
chagra edge fallow edge
early mid late stems
plants
P. grandifolium (Jacq.) Schott
4 6 8 4 2 x 5 4
P. hederaceum (Jacq.) Schott
5 2 2 1 x x 5 5
P. heleniae Croat 1 x x
P. hylaeae G.S. Bunting 1 x
P. sp. 3 1 1
P. insigne Schott 1 x 1 1
P. linnaei Kunth 4 15 1 5 1 x x 2 2
P. mawarinumae G.S. Bunting
16 6 76 20 2 x 42 28
P. micranthum Poepp. ex Schott
2 x 2 2
P. ornatum Schott 4 2 x x
P. panduriforme (Kunth) Kunth
1 x x
P. sp. (AMB 1572) 33 73 8 55 54 32 6 x x 63 55
P. sp. (AMB 2075) 2 3 18 2 1 x x 8 8
P. uleanum Engl. 1 2 1 x x
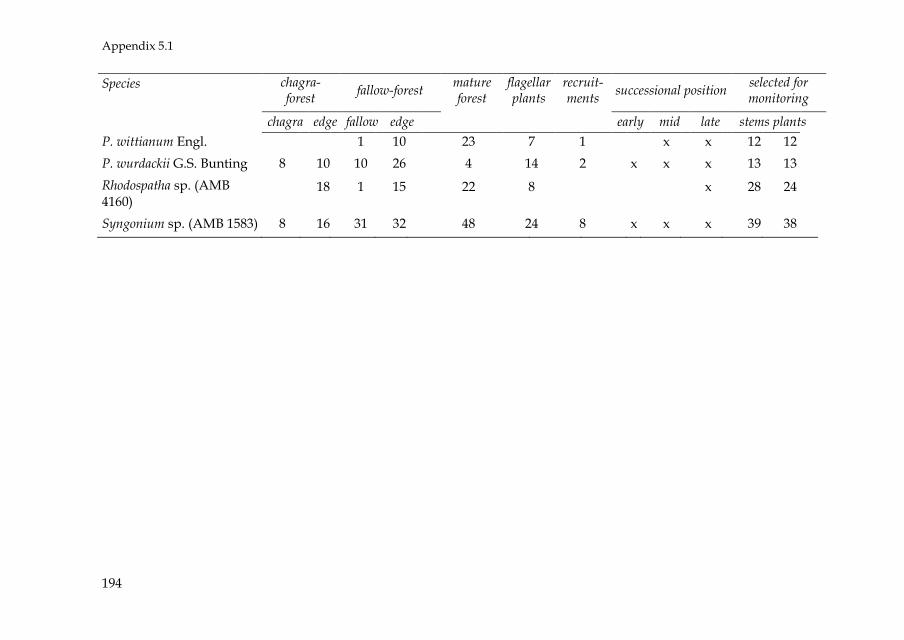
Appendix 5.1
194
Species chagra-forest
fallow-forest mature forest
flagellar plants
recruit-ments
successional position selected for monitoring
chagra edge fallow edge early mid late stems plants
P. wittianum Engl. 1 10 23 7 1 x x 12 12
P. wurdackii G.S. Bunting 8 10 10 26 4 14 2 x x x 13 13
Rhodospatha sp. (AMB 4160)
18 1 15 22 8 x 28 24
Syngonium sp. (AMB 1583) 8 16 31 32 48 24 8 x x x 39 38

195
Curriculum Vitae
Ana María Benavides Duque was born on November 6, 1977 in Medellín,
Colombia. In 2002, she obtained her bachelor degree in Biology at the
Universidad de Antioquia in Medellin. For her undergraduate graduation
thesis, she assisted in the PhD project ―Plant diversity scaled by growth
forms along spatial and environmental gradients‖, conducted by Alvaro
Duque, where she studied epiphytes for the first time. During her bachelor
studies she participated in several botanical projects at the Herbarium of
the University (HUA). After the completion of her studies she worked as a
researcher at the HUA. At the end of 2002, she was awarded a scholarship
to participate in the course ―Ecologia da Floresta Amazônica‖ in Manaus,
Brazil. A year later, in 2003, she started her master studies in Tropical
Ecology at The Universiteit van Amsterdam (UvA). She graduated from the
UvA in September 2005 with a project on the recovery and succession of
epiphytes. Back in Colombia she worked as researcher at The Corporación
para Investigaciones Biologica (CIB) and started preparing her PhD project.
At the beginning of 2007, she formulated and executed a research project
on the distribution of orchids in Andean cloud forests with the financial aid
of Orchid Conservation International. At the end of the same year she
received a scholarship from The Programme Alban and additional financial
aid from several Dutch research funds to accomplish the present doctoral
thesis.

196
Ana María Benavides at the Amacayacu Amazon river port. Photography by Folkert van
Dunné