distribution and primary source analysis of per- and poly-fluoroalkyl substances with different...
TRANSCRIPT
Distribution and primary source analysis of per- and poly-fluoroalkylsubstances with different chain lengths in surface and groundwaterin two cities, North China
Yiming Yao a, Hongkai Zhu a, Bing Li a, Hongwei Hu a, Tao Zhang a, Eriko Yamazaki b,Sachi Taniyasu b, Nobuyoshi Yamashita b, Hongwen Sun a,n
a MOE Key Laboratory of Pollution Processes and Environmental Criteria, College of Environmental Science and Engineering,Nankai University, Tianjin 300071, Chinab National Institute of Advanced Industrial Science and Technology (AIST), 16-1 Onogawa, Tsukuba, Ibaraki 305-8569, Japan
a r t i c l e i n f o
Article history:Received 21 April 2014Received in revised form20 July 2014Accepted 21 July 2014
Keywords:Perfluoroalkyl substancesRiver waterGroundwaterSource analysisPrecipitationDistribution
a b s t r a c t
Per- and poly-fluoroalkyl substances (PFASs) have been widely detected in the hydrosphere. Theknowledge on the distribution and composition patterns of PFAS analogues with different chain lengthsignificantly contribute to their source analysis. In the present study, a regional scale investigation ofPFASs in surface river waters and adjacent ground waters was carried out in two cities of China withpotential contamination, Tianjin and Weifang. A total of 31 water samples were collected, and 20 PFASstherein were measured by a high-performance liquid chromatograph–tandem mass spectrometer(HPLC–MS/MS). The possible sources of PFASs in the aquatic environment were assessed primarily byconcentration patterns as well as hierarchical cluster analysis. In all 4 rivers investigated in the twocities, perfluoroalkyl carboxylic acids (PFCAs) were the dominant compounds contributing over 70% ofthe PFASs detected. Perfluorooctanoic acid (PFOA) was the dominant PFCA with a concentration range of8.58–20.3 ng/L in Tianjin and 6.37–25.9 ng/L in Weifang, respectively. On the average, the highestconcentration was observed in samples from Dagu Drainage Canal (Dagu) in Tianjin and those short-chain PFASs (C4–C6) was detected with a comparable level of the longer-chain PFASs (4C6). Specifically,perfluorobutanoic acid (PFBA) was dominant in the short-chain analogues. This indicates that aremarkably increasing input of short-chain PFASs might be related to wastewater treatment planteffluent or industrial discharges, which could be possibly due to the switch of manufacturing to short-chain products. In Weifang, precipitation and subsequent surface runoff as non-point sources could besignificant inputs of PFASs into surface water while groundwater was possibly subjected to severe pointsources with ∑PFASs concentration up to �100 ng/L. The inconsistent distribution patterns in ground-water suggest complicated pathways of contamination.
& 2014 Elsevier Inc. All rights reserved.
1. Introduction
Due to their unique stability, surfactivity, hydrophobicity andlipophobicity derived from a perfluoroalkyl tail (Kissa, 2001), inthe past 50 years per- and poly-fluoroalkyl substances (PFASs)have been widely applied to numerous industrial and commercialproducts that require surface protection, such as textile coatings,paper treatment, pesticides and fire-fighting foams. PFASs arerecognized as environmentally persistent contaminants, whichare ubiquitously detected, not only in the remote arctic area
(Butt et al., 2010) but also in open oceans (Yamashita et al.,2005, 2008) far from urbanized and industrialized areas.
Among all the PFASs, longer-chain analogues (4C6), such asperfluorooctanoic acid (PFOA) and perfluorooctane sulfonic acid(PFOS) have been most frequently reported in the environments asa result of the historical trend of manufacture (3M-company,2000). In U.S., accompanied by the phase-out of perfluorooctanesulfonyl fluoride (POSF)-based material in 2000�2002, fluorote-lomer production increases continually, which is also a possibleindirect source of PFOA (D'Eon and Mabury, 2011). On the contrary,short-chain PFASs (C4–C6) introduced as substitutes of theirlonger-chain analogues have aroused increasing concerns with arising dominance in PFAS composition profiles (Moller et al., 2010;Eschauzier et al., 2013, Kirchgeorg et al., 2013). However, the story
Contents lists available at ScienceDirect
journal homepage: www.elsevier.com/locate/ecoenv
Ecotoxicology and Environmental Safety
http://dx.doi.org/10.1016/j.ecoenv.2014.07.0210147-6513/& 2014 Elsevier Inc. All rights reserved.
n Corresponding author.E-mail address: [email protected] (H. Sun).
Ecotoxicology and Environmental Safety 108 (2014) 318–328

in China is far more complicated. The POSF-based productionnever stops but has ever increased, which is estimated as 200 tonper year (Wang et al., 2009).
In addition to the direct sources through manufacturing andconsumer products, PFASs in the environment can also come fromthe degradation of precursor compounds or impurities in products(Prevedouros et al., 2006). As specifically to aquatic environments,they are susceptible to direct inputs of PFASs such as municipallandfill leachates (Eggen et al., 2010) and wastewater treatmentplants (WWTPs) effluents (Huset et al., 2008; Sun et al., 2011a).Microbial transformation of precursors could also take place inthese waters to function as an indirect source (Rhoads et al., 2008;Zhao et al., 2013a). Neutral volatile or semi-volatile precursors mayalso undergo atmospheric degradation, to form more persistentwater-soluble acids (Ellis et al., 2004; Martin et al., 2006). Forexample, it was suggested that perfluoroalkyl carboxylic acids(PFCAs) could be derived from fluorotelomer alcohols (FTOHs)degradation (Ellis et al., 2004). Apart from this, biological trans-formation in vivo of precursor compounds is also considered to beanother indirect source of PFASs (Dinglasan et al., 2004). Forinstance, conversion of N-ethyl perfluorooctane sulfonamidoethanol(N-EtFOSE) and N-ethyl perfluorooctane sulfonamide (N-EtFOSA)to PFOS was observed in rainbow trout (Tomy et al., 2004).All considered, the intentional and unintentional discharge, andsubsequent transformations, could probably explain the occur-rence of various PFASs in river water (Sun et al., 2011b); ground-water (Schultz et al., 2004); coastal surface water (Cai et al., 2012);as well as open ocean waters (Yamashita et al., 2005). Recently,similar to the situation in other countries elevated levels of short-chain PFASs (C4–C6) were detected with increasing frequency inthe effluent of WWTPs (Sun et al., 2012; Xiao et al., 2012a; Zhanget al., 2013a). This might be due to the shift of PFAS production inthe world and the demand in China to import short-chainfluorotelomer to support its textile industry. Thus, the compositionprofiles of PFASs may shift and differ from other countries, andboth short and longer-chain PFAS contaminations should be givenconcern in China.
To compare the distribution patterns and to reveal potentialsources, a regional scale investigation of PFASs in surface riverwaters and adjacent ground waters in two cities of China withpotential contamination, Tianjin and Weifang was carried out inthe present study. Situated around the Bohai Bay, two cities bothhave intensive industrial activities but distinct industrial struc-tures. Tianjin is one of the 4 municipalities in China, highlyindustrialized and populated (ca. 14 millions). In the city, HaiheRiver (HR) and Dagu Drainage Canal (Dagu) flow from the westtowards the east into Bohai Bay, and the detail information wasgiven in a previous study (Li et al., 2011). As a follow-up study,
since high ∑PFASs concentration in precipitation was observed(Zhao et al., 2013b), a new potential contaminated area, Weifangwas explored and compared for its PFAS concentrations in theaquatic environment. Weifang is fast industrialized with a popula-tion of over 1 million. Two rivers, Bailanghe River (BR) and YuheRiver (YR), flow in parallel from the south to the north passingthrough the urban area, industrial area and agricultural area,successively. Acknowledged as a leading light industrial entity intextile and paper packaging, a great chance exists that the aquaticenvironment in Weifang may be potentially susceptible to PFAScontamination from various sources. Given the fact that Weifang isalso a developed agricultural area, which requires a good deal ofgroundwater for irrigation, an investigation of PFASs towards itssurface and ground water is quite necessary to clarify the dis-tribution map, to reveal possible sources and to evaluate thehuman risks via food chains.
2. Materials and methods
2.1. Chemicals and reagents
Purities of all analytical standards were higher than 95%. N-EtFOSA andN-EtFOSAA were donated from the 3M Company (St. Paul, MN, U.S.). FOSA, PFNA,PFOA, 13C4-PFOS, 13C2-PFDA, 13C5-PFNA, 13C4-PFOA, 13C4-PFBA, and potassium saltsof PFDS, PFOS and PFHxS were from Wellington Laboratories (Guelph ON, Canada).PFBS was from Chiron AS (Trondheim, Norway). 6:2 FTS, PFOcDA, PFHxDA andPFTeDA were from SynQuest Lab Inc. (Alachua, FL). PFDoDA, PFUnDA, PFDA, PFHpA,and PFPeA were from Fluorochem. (Derbyshire, UK). PFHxA was from Wako PureChemical Industries (Osaka, Japan). PFBA was from Avocado Research Chemicals(Lancashire, UK).
OasissWax (6 cc, 150 mg, 30 μm; weak anion exchange) SPE cartridges werepurchased from Waters (Milford, MA). Ammonia solution (25%), ammoniumacetate (97%), acetic acid (99.9%) and methanol (99.8% purity) were from WakoPure Chemical Industries (Tokyo, Japan). Milli-Q water was used for methoddevelopment and sample pretreatment all through the study.
2.2. Sample collection and extractions
Sampling campaigns were carried out in October, 2012. In Tianjin, river watersamples from the Haihe River (n¼6) and Dagu Drainage Canal (n¼4) werecollected (Fig. 1a). In Weifang, river water samples from Bailanghe River (n¼7)and Yuhe River (n¼5) as well as a possible background site sample from anupstream reservoir of Bailanghe River were collected (Fig. 1b). Additionally, at thesame time groundwater samples were also collected from Tianjin and Weifang.Groundwater samples (n¼2) in Tianjin were from deep aquifers and meant fordomestic use after simple treatment, while those collected in Weifang(n¼6) wereall from shallow aquifers and used for agricultural irrigation. Duplicate watersamples were collected for both river water samples (0.5 L for each) and ground-water samples (1 L for each), with a stainless steel bucket that was pre-cleanedwith methanol, Milli-Q water and water from the specific location. All watersamples were transferred to polypropylene (PP) bottles and stored at 472 1C
Fig. 1. Sampling locations in Tianjin (a) and Weifang (b).
Y. Yao et al. / Ecotoxicology and Environmental Safety 108 (2014) 318–328 319

before extraction. Teflons-free laboratory materials were used during experimentaland sampling procedures to avoid possible PFAS contamination of samples.
Solid phase extraction was conducted for all the water samples. WAX SPEcartridges were used for extraction of water samples. After preconditioning thecartridges with 4 mL of 0.1% NH4OH/methanol, 4 mL methanol and 4 mL Milli-Qwater in a sequence, water samples were loaded. The cartridges were then washedwith 4 mL of 25 mM ammonium acetate buffer (pH 4) and the target analytes wereeluted with 4 mL methanol and 4 mL 0.1% NH4OH/MeOH solution in a sequence,thus two fractions of eluate for each sample. Both fractions were furtherconcentrated to 1 mL by moderate flow of high purity nitrogen and then 200 μlof each fraction were transferred into autosampler vials waiting for instrumentalanalysis. Before extraction, one nanogram of mass-labeled standards including13C4-PFBA, 13C4-PFOA, 13C5-PFNA,13C2-PFDA, and 13C4-PFOS were spiked into thesamples intended for inspection of overall recoveries of the analytical procedures.Details were given elsewhere (Taniyasu et al., 2008).
2.3. Instrumental analysis
Twenty PFASs were analyzed including 4 perfluoroalkyl sulfonic acids (PFSAs),perfluorobutane sulfonic acid (PFBS), perfluorohexane sulfonic acid (PFHxS), PFOSand perfluorodecane sulfonic acid (PFDS); 12 PFCAs, perfluorobutanoic acid (PFBA),perfluoropentanoic acid (PFPeA), perfluorohexanoic acid (PFHxA), perfluorohepta-noic acid (PFHpA), PFOA, perfluorononanoic acid (PFNA), perfluorodecanoic acid(PFDA), perfluoroundecanoic acid (PFUnDA), perfluorododecanoic acid (PFDoDA),perfluorotetradecanoic acid (PFTeDA), perfluorohexadecanoic acid (PFHxDA) andperfluorooctadecanoic acid (PFOcDA); 4 sulfonyl precursors, perfluorooctane sulfona-mide (FOSA), N-EtFOSA, N-ethyl perfluorooctane sulfonamidoacetic acid (N-EtFOSAA)and 6:2 fluorotelomer sulfonic acid (6:2 FTS). Analysis of PFASs was performedwith a high-performance liquid chromatograph–tandem mass spectrometer(HPLC–MS/MS). The instruments were a linkage of a HP1100 liquid chromatograph(Agilent Technologies, Palo Alto, CA) and a Micromasss (Beverly, MA) QuattroUltima Pt mass spectrometer operated in the electrospray negative ionization modewith an injection of 10-μL aliquot of the extract. For two HPLC columns, Betasil C18(2.1 mm i.d.�50 mm length, 5 μm; Thermo Hypersil-Keystone, Bellefonte, PA) anda mixed mode ion-exchange column, RSpak JJ-50 2D (2.0 mm i.d.�150 mm length,5 μm; Shodex, Showa Denko K.K., Kawasaki, Japan) were used for analysis of allPFASs, simultaneously. For the final presentation, as a combination, the results ofPFBA and PFBS were from ion-exchange column while other PFASs from C18column. Detail information for LC procedures and MS optimizations were givenelsewhere (Taniyasu et al., 2008).
2.4. Quality assurance and control
Concentrations of the target analytes were quantified using an externalcalibration curve without corrections for the recovery of the internal standards,which was prepared from external standards of sequential concentrations (0, 2, 10,50, 200, 1000, 5000 and 20,000 ng/L), and the standard deviations from thetheoretical values were less than 20%. The linearity and repeatability of thesecalibration curves were confirmed prior to each set of determinations. The sampleswith concentrations exceeding the highest point of the calibration curve weresupposed to be reanalyzed after dilution. Procedure blanks and recoveries wereinspected in each batch of extraction following the same procedure as for the realsamples using Milli-Q water. Concentrations below the limit of quantifications(LOQs) were achieved for all procedure blanks and travel blanks (Table 1). Meanprocedure recoveries ranged from 72% to 115%. Corrections for the correspondingrecoveries were not applied to the concentrations of PFASs in the samples. As areference, the recoveries of the surrogate standards ranged from 81% to 103% forgroundwaters and 76% to 130% for surface waters. The samples observed withsignificant loss of recoveries, matrix effects or other abnormalities were to bereanalyzed.
2.5. Statistical analysis
The hierarchical cluster analysis was conducted using IBMs SPSSs Statistics 20.The Ward's method (squared Euclidean distance) was used as an agglomerationtechnique, the results from which was considered the most reasonable in aprevious study that for the first time applied cluster analysis in source apportion-ment of PFASs (Xiao et al., 2012a). Before the analysis, concentrations higher thanor equal to limit of detection (LOD) but less than limit of quantification (LOQ) wereassigned with a concentration twice that of the LOD, and those at or below the LODwere assigned with a value of zero. The concentration of each of the 16perfluoroalkyl acids (PFAAs) was normalized by the total concentration of PFAAsin order to avoid misclassifications arising from the different orders of magnitudeof PFAA concentrations. Mann–Whitney rank test and correlation analysis werealso performed by SPSS. All the plots were created by OriginLabs OriginPro 8.5.
3. Results and discussion
3.1. PFAS concentrations and composition profiles in surface waters
In Tianjin, among the displayed PFASs, 3 PFSAs (C4, C6, C8),8 PFCAs (C4–C11) and 2 intermediates, i.e. FOSA and N-EtFOSAA,were detected in all river water samples, while other 7 PFASs weredetected with a frequency of 33.3–90.0% (Fig. 2a). On average, the∑PFASs concentrations of Dagu Drainage Canal were approxi-mately 50% higher than those of Haihe River. This may be due tothe different schemed functions applied to the two rivers. HaiheRiver mainly receives surface runoff as a flood buffering system,whereas Dagu Drainage Canal is primarily designed to receive bothtreated (partly untreated) municipal and industrial discharges inaddition to some limited flood water. Compared to downstreamDagu3, higher ∑PFASs concentrations were found upstream(Dagu1 and 2) and the increase at Dagu4 indicates possible inputsexisting between Dagu3 and 4. In general, PFOA was the dominantanalogue in all the surface water samples, with an averageconcentrations of 13.4 and 18.8 ng/L for the Haihe River and DaguDrainage Canal, respectively. Among the short-chain analogues(C4–C6), PFBA was detected as ave. 7.59 ng/L (Haihe River) and18.1 ng/L (Dagu Drainage Canal), which were dominant in both ofthe rivers. As for the longer-chain PFASs, both PFNA and PFHpAwere one order of magnitude lower than PFOA in both rivers. Themean concentration of PFOA in Dagu Drainage Canal was foundgenerally higher as compared to Haihe River. This may be reason-able since the Dagu Drainage Canal received effluents from severalWWTPs with PFOA concentrations ranging from 100 to 145 ng/L(Sun et al., 2012). Whereas the mean concentration of PFOS inDagu Drainage Canal (7.17 ng/L) was comparatively lower thanPFOA, which was consistent with the profiles in local WWTPeffluents and could probably be explained by the sorption to thesolid phase, as a high distribution coefficient (Kd) of PFOS betweensludge and water was reported (Sun et al., 2012). In Haihe River,however, the concentration of PFOS was higher than that in DaguDrainage Canal and no significant difference was found betweenthe concentrations of PFOA and PFOS (p¼0.52240.05, Mann–Whitney rank test), which suggests Haihe River being subjected toPFAS sources that are different from the Dagu Drainage Canal.
PFOA to PFOS ratio has been used to facilitate source identifica-tion of contamination. This ratio value was reported to be 2.5 forurban lakes, 9 for precipitation and 4.4 for surface runoff (Kim andKannan, 2007). In WWTP effluents, the ratio was found to be7–166 (median 52) in New York (Sinclair and Kannan, 2006).Recently, a similar level of PFOA to PFOS ratio (�30) was found inWWTP effluents in Tianjin (Sun et al., 2012), which was generallyhigher than those of WWTP effluents in a national wide investiga-tion (mean 15) (Zhang et al., 2013a). PFOA to PFOS ratios werecalculated for Haihe River (mean 1.11) and on average they weremuch smaller than the ratio in precipitation reported before in thesame region(4.1–33.3, mean 15.4) (Zhao et al., 2013b). Thisprobably suggests an additional source of PFOS other than pre-cipitation. The PFOA to PFOS ratio in local WWTP effluentsmentioned above was much higher than the values of Haihe River.As a result, the WWTP effluents may not be a significant source ofPFOS in Haihe River. This inference is consistent with the fact thatHaihe River is not supposed to receive effluents from WWTPs.Therefore, sources other than both precipitation and WWTPsmight account for the low value of PFOA to PFOS ratio found inHaihe River. Besides the possibility of direct PFOS discharge,N-EtFOSAA was reported as an intermediate of N-EtFOSE degrada-tion (Rhoads et al., 2008) and could be further transformed intoPFOS (Tomy et al., 2004; Boulanger et al., 2005). At the upstreamsampling sites (HR1 and HR2) of Haihe River, which were either inor closed to the urban area, the concentrations of N-EtFOSAA were
Y. Yao et al. / Ecotoxicology and Environmental Safety 108 (2014) 318–328320

found almost one order of magnitude higher than those of thedownstream sites. Meanwhile, a decrease of N-EtFOSAA down-stream was accompanied with an increase of PFOS (Fig. 2a),whichin this manner was probably due to a transformation in between.
Odd-chain length PFCAs can be technically produced byemploying odd C number telogens in telomerization processes,but not necessarily meaning a commercial employment, to whichthe extent also remains unclear (Buck et al., 2011). On the otherhand, odd-chain length PFCAs are readily produced by atmo-spheric oxidation of precursors such as FTOHs (Ellis et al., 2004).In this case, the ratio of PFHpA to PFOA was proposed as a tracer ofatmospheric deposition that a greater ratio suggests a largercontribution of atmospheric sources to the surface water (Simcikand Dorweiler, 2005). In Tianjin, a typical site for urban area,PFHpA to PFOA ratios were all less than 1.0, being 0.12–0.21(median 0.13) for Haihe River and 0.18–0.27 (median 0.21) forDagu Drainage Canal, which are on the same level as in surfacewaters reported in the coastal area of Tianjin (Wang et al., 2011).However, to belittle atmospheric sources is not so plausible sincesimilar level of PFHpA to PFOA ratios were also reported in localprecipitations of different events from a previous study (Zhaoet al., 2013b). PFNA to PFOA ratio has also been substantially usedto identify atmospheric sources, especially in some remote regionswhere a ratio around 1.0 was found in snow or ice cores (Younget al., 2007; Kwok et al., 2013), in accordance with a laboratory resultof gas-phase FTOH degradation (Ellis et al., 2004). Similar ratioswere also detected in precipitation samples over North Americaand Japan (Scott et al., 2006; Kwok et al., 2010), but generallymuch lower PFNA to PFOA ratios were found in precipitation overeastern and central China (Zhao et al., 2013b). This variation was inagreement with the ratios in Haihe River and Dagu Drainage Canalin the present study, which was calculated as 0.07–0.11 (median0.09). From a previous study, ratios of PFNA to PFOA in effluents
from 6 WWTPs of Tianjin can be calculated as 0.02–0.24 (median0.04) (Sun et al., 2012), in which except the extremely high valueof 0.24 in a WWTP, the ratios of other 5 WWTPs are all statisticallylower than the ratios in rivers from the present study(p¼0.014o0.05, Mann–Whitney rank test). Nevertheless, no sig-nificant difference was found between two rivers (p¼0.67040.05,Mann–Whitney rank test) and a positive correlation formedbetween PFNA and PFOA in surface waters altogether (r¼0.790,po0.01). This indicates a common source of PFNA and PFOA forboth rivers in spite of known inputs of WWTP or indutrialeffluents to Dagu Drainage Canal. In addition, for urban areas, amuch lower ratio of PFNA to PFOA in surface water might notnecessarily rule out the significance of atmospheric sources.On the contrary, the degradation of precursors such FTOHs mightcontribute in another way, as a heterogeneous photooxidation ofFTOHs was recently proposed to effectively produce PFCAs in aparticulate phase, where a preferential production of even chainover odd chain PFCAs (i.e. PFHxA against PFHpA) was observed(Styler et al., 2013). Unlike gas-phase reactions, the heterogeneousproduction of PFCAs also appears to be NOx recalcitrant (Styleret al., 2013). Therefore, in an urban atmosphere rich in particulatematters like China, this process probably favors an extra contribu-tion of PFCAs from volatile precursors.
In the composition profile (Fig. 2c), PFCAs made remarkablecontributions up to 70.8% on the average in both rivers ascompared to PFSAs and other precursors. PFOA turned out domi-nant in both rivers in Tianjin occupying up to 25.2–33.1%. In termof chain length, the contributions of short-chain PFASs (C4–C6)ranged from 22.9% to 53.6% in Tianjin. It was higher in DaguDrainage Canal (mean 50.4%) than in Haihe River (mean 30.2%).PFBA was found as the dominant short-chain PFAS in both rivers(12.7–30.6%), followed by PFHxA in Haihe River (mean 5.20%) andby PFBS in Dagu Drainage Canal (mean 9.3%). Specifically in Dagu
Table 1Procedural blank values (ng/L) and procedural recoveries (%) for individual PFASs in water samples.
LOQ Instrumental Cartridge Procedural blank Procedural recovery%(n¼5) (n¼7)
Sample Blank Blank Milli-Q water Milli-Q waterSample volume 0.5 L 0.5 LNative std spike 0 ng 1 ng
Chain length Parent ion Daughter ion Mean (ng/L) Mean (ng/L) Mean (ng/L) Mean (ng/L) Mean S.D
PFDS 10 598.8 79.8 10 o10 o10 o10 95 7PFOS 8 498.8 79.8 2 o2 o2 o2 99 7PFHxS 6 398.8 79.9 2 o2 o2 o2 97 4PFBS 4 298.7 79.7 50 o50 o50 o50 86 19FOSA 8 497.8 77.8 2 o2 o2 o2 88 16N-EtFOSA 8 525.8 168.8 2 o2 o2 o2 72 10N-EtFOSAA 8 583.9 418.7 10 o10 o10 o10 101 76:2 FTS 8 426.8 406.9 10 o10 o10 o10 107 12PFOcDA 18 912.8 868.8 10 o10 o10 o10 98 9PFHxDA 16 812.8 768.8 10 o10 o10 o10 98 13PFTeDA 14 712.8 668.8 10 o10 o10 o10 98 9PFDoDA 12 612.8 568.8 10 o10 o10 o10 103 13PFUnDA 11 562.8 518.9 10 o10 o10 o10 108 10PFDA 10 512.8 468.8 10 o10 o10 o10 104 7PFNA 9 462.8 418.9 2 o2 o2 o2 115 12PFOA 8 412.8 368.9 2 o2 o2 o2 99 7PFHpA 7 362.9 318.9 2 o2 o2 o2 104 9PFHxA 6 312.8 268.9 2 o2 o2 o2 105 7PFPeA 5 262.8 218.9 10 o10 o10 o10 99 6PFBA 4 213 168.9 10 o10 o10 o10 97 28Surrogates13C4-PFOS 8 502.7 79.8 10 o10 o10 o10 98 813C2-PFDA 10 514.9 469.9 10 o10 o10 o10 99 1113C5-PFNA 9 467.8 422.9 10 o10 o10 o10 110 1113C4-PFOA 8 416.9 371.8 10 o10 o10 o10 99 513C4-PFBA 4 216.8 171.8 10 o10 o10 o10 94 14
Y. Yao et al. / Ecotoxicology and Environmental Safety 108 (2014) 318–328 321

Drainage Canal, a comparable level of the short-chain PFASs (C4–C6) and the longer-chain PFASs (4C6) indicates that a remarkablyincreasing input of short-chain PFASs might be derived from theWWTP effluent or industrial discharges, which could be possiblydue to the switch of manufacturing to short-chain products. Onthe contrary, the contribution of short-chain PFASs was lesspronounced in Haihe River (mean 30.2%). Instead, longer-chainPFASs took up ave. 66.5%, suggesting a different pattern ofcontamination.
Weifang is a potentially contaminated area in China. Thesampling campaign is for the first time carried out to investigatethe PFAS contamination in the surface water of the two rivers, i.e.Bailanghe River and Yuhe River. They both flow from the south tothe north right passing through the city center. Among the listedPFASs (Fig. 2b), 5 PFCAs (C4, C6–C9) and PFBS were detected in allthe surface water samples, while other 14 PFASs were detectedwith a frequency of 7.70–92.3% and only FOSA undetected. Despitesimilar geographical features, Bailaunghe River differs distinctlyfrom Yuhe River in a practical situation. Bailanghe River is aseasonal river mainly recharged by the upstream reservoir andprecipitation and reported to receive municipal and industrialwastewater (Weifang Development and Reform Commission,2006). Functionalized as flood buffer systems, it is almost 4 timeslarger than Yuhe River in designed maximum quantity of flow.Yuhe River was once a drainage river before ComprehensivePollution Control Project (2006) and hence its upstream reachhas become a landscape river in attempt to avoid further con-tamination. In the sampling river reach, with the catchmentprimarily covering urban and suburban areas, Yuhe River was
dammed in sections and hardly mobile during sampling cam-paign; while Bailanghe River flowed with noticeable mobilityindicating the presence of continual inputs of water.
The ∑PFASs concentrations in Bailanghe River were generallyhigher than those in Yuhe River (p¼0.003o0.05, Mann–Whitneyrank test) (Fig. 2b) probably indicating a relative larger input ofcontaminants given the difference in the quantity of flow. Bai-langhe Reservoir is situated at far upstream catchment and usuallyseparated from the river system except for necessary downstreamrecharge and flood control. The reservoir was detected with asimilar or slightly higher ∑PFASs concentration (mean 23.9 ng/L)as compared to downstream sampling sites, thus it probably actsas a significant source of PFASs to Bailanghe River when water isreleased. The highest concentration (52.8 ng/L) was detected atBR5, which is adjacent to an industrial area. The lowest concen-tration was 13.0 ng/L at YR5, where the water was sampleddirectly from a likely drain outlet of domestic sewage pipeadjacent to a living quarter of an industrial campus, which wasnot shown in the map. With possible industrial activities nearby,the ∑PFASs concentration was detected the highest at YR4 as29.2 ng/L in Yuhe River. At all sampling sites, PFOA was thedominant analogue with a concentration range of 6.37–25.9 ng/L,the highest being at the sampling site BR5 and the lowest at YR5.This indicates that wastewater from the domestic sewage pipe atYR5 investigated in the present study may not be a significantsource of PFOA contamination at least not a constant source.Among short-chain PFASs (C4–C6), PFBA was dominant on theaverage in Bailanghe River (mean 5.55 ng/L); while PFBS domi-nated at most sampling sites in Yuhe River with a slim advantage
Fig. 2. Spatial distribution of total ∑PFASs concentration (a and b) and composition profile of individual PFASs (c and d) in the surface water samples from Haihe River (HR)and Dagu Drainage Canal (Dagu), Tianjin; and Bailanghe River (BR), its upper stream reservoir (BR-R) and Yuhe River (YR), Weifang.
Y. Yao et al. / Ecotoxicology and Environmental Safety 108 (2014) 318–328322

(mean 2.85 ng/L). For those longer-chain PFASs, unlike PFOA, PFOSwas detected at a much lower level (mean 1.02 ng/L) even withsite YR3 non-detectable. As a result, PFOA to PFOS ratio in Weifangwas calculated much higher than in Tianjin, 8.41–20.5 (median16.8) for Bailanghe River and 4.60–125 (median 30.7) for YuheRiver. The median values were on the similar level of the PFOA toPFOS ratio calculated for local precipitation (26.1) reported beforewith PFOA up to 88 ng/L (Zhao et al., 2013b), indicating thatprecipitation and subsequent surface runoff could possibly act asa significant source of PFASs to local aquatic environment besidespotential direct discharge (Murakami et al., 2009b; Xiao et al.,2012b).
In terms of PFHpA to PFOA ratios, Bailanghe River was 0.07–0.3(median 0.09) and Yuhe River was 0.11–0.81 (0.32). the range ofratios from Weifang was similar with those from Tianjin and alsoconsistent with the ratio in local precipitation reported as approxi-mately 0.20 in a single event (Zhao et al., 2013b). However, thedifference in the ratios between Bailanghe River and Yuhe Riverwas statistically significant (p¼0.008o0.05, Mann–Whitney ranktest) though all less than 1.0. Given that a statistical differenceoccurred in two rivers so close to each other geographically(Fig. 1b), Bailanghe River was possibly subjected to more non-atmospheric sources as indicated by a lower PFHpA to PFOA ratiocompared to Yuhe River. Furthermore, a strong positive correlationbetween PFNA and PFOAwas observed in surface water of Weifangregardless of all the potential differences between the two rivers(r¼0.917, po0.01), even when removing the highest point BR5(r¼0.879, po0.01). No such indiscriminate correlation wasobserved for any other pairs of PFAAs. This indicates a commonsource of PFNA and PFOA in spite of very small ratios of PFNA toPFOA (0.02–0.07, median 0.05). Furthermore, considering thesimilarity of PFAS profiles between local surface water andprecipitation (Zhao et al., 2013b), it might not be so arbitrary toemphasize on atmospheric sources in Weifang.
From the composition profile, PFCAs were dominant analoguescontributing up to 91.9% in Bailanghe River including the samplingsite at its reservoir and 78.2% in Yuhe River (Fig. 2d). Similar to thesituation in Tianjin, PFOA was the major PFAS detected in Weifangwith a contribution of 38.2–61.7%. Although less pronounced, it is
worth mention that among PFSAs the contribution of PFBS on theaverage was second to PFOS in Bailanghe River and higher thanPFOS in Yuhe River. In term of chain length, the longer-chain PFASs(4C6) evidently outweighed the short-chain PFASs (C4–C6) inboth river systems with a similar ratio of 7:3. Despite thedominance of PFOA in longer-chain PFASs, the short-chain PFASsdisplayed a different trend between rivers. PFBA and PFBS domi-nated in Bailanghe River and Yuhe River (except YR4), respectively.Accordingly, the two river systems may be susceptible to differentsources, which could be due to the different land use. Samples ofYuhe River mainly came from urban and suburban residentialareas while those of Bailanghe River were collected from suburbanand rural areas with frequent industrial and agricultural activities.Furthermore, the relatively low level of PFOS detected in surfacewater of Weifang also suggests that sources of PFASs unlike thosein Tianjin might exist.
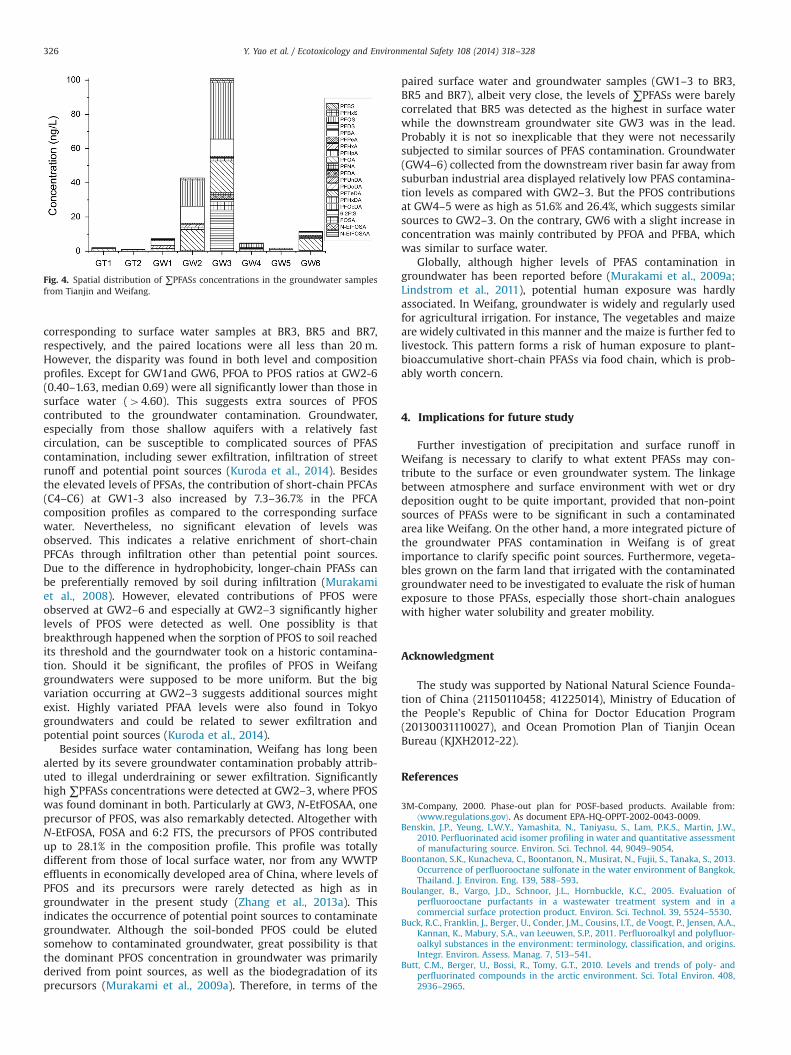
Despite that Tianjin and Weifang were both deemed as inten-sely industrialized regions with PFAS contamination, varioussources and pathways of PFASs may lead to regionally differentpatterns of distribution. Cluster analysis has long been used insource apportionment of organic pollutants as a multivariatestatistical method, which in recent studies effectively served toanalyze PFAS patterns in WWTP samples (Xiao et al., 2012a; Zhanget al., 2013a). According to the occurrence of 16 PFAAs, allsampling sites in the 4 rivers were almost well classified intotwo cities in the hierarchical cluster analysis (Fig. 3). Samplingsites along Dagu Drainage Canal were classified into Cluster 4 witha high hierarchy, suggesting a unique contamination form. Thiscan be expected since it is designed to mainly receive both treated(partly untreated) municipal and industrial discharges. Interest-ingly, BR5 alone was clustered with Dagu Drainage Canal, thoughfrom different city, likely due to a similar source or pattern ofcontamination. Given that BR5 is the first rural sampling sitereceiving water from upstream suburban area with potentialindustrial activities (WDRC 2006) and WWTPs nearby (Fig. 1b), itmay be subjected to additional sources of contamination, whichmainly contributed to the elevated levels of PFBA and PFOA(Fig. 2b). Although sampling sites from Haihe River were wellgrouped in Cluster 3, as the only sampling site situated within city
Fig. 3. Dendrogram obtained in a hierarchical cluster analysis of all sampling sites in four river systems in Tianjin and Weifang, China with 16 detected PFAAs.
Y. Yao et al. / Ecotoxicology and Environmental Safety 108 (2014) 318–328 323

center in Tianjin, HR1 was classified into a subcluster (not shownin Fig. 3) separated from others while HR2-6 were clusteredtogether. This suggests that HR1 may have a different pattern ofcontamination from those downstream sites. In Weifang, YR4, YR5and BR3 were classified in Cluster 2, indicating that possibleindustrial activities at the suburban area may contribute to theelevated PFAS contamination level. For Bailanghe River, exceptBR3and BR5, all sampling sites were classified in Cluster 1 togetherwith dammed sites YR1-3 from city center, even including BR-Rfrom the far upstream reservoir, indicating they may receivecommon sources. Considering that the reservoir may rechargedownstream river catchment on occasion together with thesimilar PFAS levels in the reservoir and river waters, the reservoiritself could probably become a source of PFAS contamination todownstream catchments. Accordingly, the contamination ofupstream reservoirs in a river system may contribute to contam-inations of downstream catchment, especially significant whenatmospheric sources are considered. Reservoirs are usually lessmobile and with large surface area subjected to receiving andaccumulating contaminants by wet or dry precipitation andinterphase exchange(Kim and Kannan, 2007).
The occurrence of PFASs in the precipitations has been globallyreported, thus precipitation and subsequent surface runoff are deemedas a significant nonpoint source contributing to the contamination ofsurface aquatic environment (Scott et al., 2006; Kwok et al., 2010;Zhao et al., 2013b). As specific to Weifang, high ∑PFASs concentrationin precipitation was detected previously, therefore surface aquaticenvironment in Weifang can be susceptible to both point and non-point sources of PFAS contamination. Although the general ∑PFASsconcentrations in surface waters in Weifang were lower than those inTianjin, the situation could be worse if taking into account the scaleand population between the two cities.
In the literature, PFOA and PFOS were always detected as thetypical or even dominant PFAS analogues in surface water, thus beingregarded representative enough to be compared nationally andglobally (So et al., 2007; Wang et al., 2012; Naile et al., 2013). To becomparable, a more recent study profiles of natural surface water issummarized in Table 2. In China, PFOA concentrations in rivers fromTianjin and Weifang, referred in the present study, are comparable orlower than those from rivers in Liaoning (Wang et al., 2012), HuaiRiver and Tai Lake (Yu et al., 2013), and Dianchi Lake (Zhang et al.,2012) in China. Whereas the highest concentration of PFOA wasrecently detected in Tangxun Lake, which was reported to receivemunicipal and industrial wastewater (Zhou et al., 2013). The concen-trations in rivers are generally higher than those detected in coastalwater (Chen et al., 2012) and marine water (Cai et al., 2012), thoughone higher concentration of 95.7 ng/L was reported in coastal water,Dalian, which may be attributed to the effluent discharged fromWWTP (Chen et al., 2012).
Similarly, elevated concentrations of PFOS also occurred inrivers and lakes as compared to coastal water and marine water(Table 2). The highest PFOS concentration was also recentlydetected in Tangxun Lake (Zhou et al., 2013). Albeit less remark-able, another high PFOS concentration of 40.9 ng/L was detected inDianchi Lake (Zhang et al., 2012). However, a recent study towardsPearl River sampled in 2012 showed that a decrease of ∑PFAAshappened over time as compared to the previous investigation (Soet al., 2007). Wherein PFOS exhibited a significant reduction in theindustrial area but remained similar in less developed regions.Interestingly an increase of PFBS (0.42–23 ng/L, mean 5.4 ng/L) isattention drawing, which as the author assumed indicates achange in source profiles of PFAAs indeed happened after thephase-out of PFOS-related products and the production of theirsubstitutes (Zhang et al., 2013b).
In contrast, the PFOA levels in rivers of Tianjin and Weifangwere either comparable or higher than in Pearl River (sampled in
2012). Similar levels of PFBS (2.09–9.55 ng/L, mean 6.27 ng/L) weredetected in Dagu Drainage Canal and generally elevated levels ofPFOS were detected in Haihe River, suggesting a probably severerongoing PFAS contamination up north. Globally, PFOA concentra-tions in Tianjin and Weifang were comparable or higher thanthose detected in river systems of Thailand (Boontanon et al.,2013), South Korea (Hong et al., 2013), India (Yeung et al., 2009),Singapore (Nguyen et al., 2011), Germany (Llorca et al., 2012) andUnited States (Benskin et al., 2010), but much lower than somesites in Japan(Zushi et al., 2011; Takemine et al., 2014) and UnitedStates (Nakayama et al., 2010). As for median value, the levels ofPFOA in the present study were comparable to those reported inJapan, where however PFNA were detected generally higher oreven dominant in some cases (Zushi et al., 2011). PFOS concentra-tions in Tianjin were comparable to those in ChaoPhraya River,Thailand (Boontanon et al., 2013), rivers and west coastal water,South Korea (Hong et al., 2013; Naile et al., 2013), L'AlbuferaNatural Park, Spain (Pico et al., 2011), and Mississippi River, UnitedStates (Benskin et al., 2010) while PFOS concentrations in Weifangwere lower and comparable to Bang Pakong River, Thailand(Boontanon et al., 2013), Ganges River, India (Yeung et al., 2009)and Main River, Germany (Llorca et al., 2012). As a whole, PFOSconcentrations reported in the present study were less variedcompared to other studies. The highest concentrations of bothPFOA and PFOS were recently detected in Langat River, Malaysia(Zainuddin et al., 2012), even higher than a directly dischargedwastewater from a 3M plant (Oliaei et al., 2012). Langat River wasrecognized as the most polluted river locally but the concentra-tions were still much lower than those in Etobicoke creek, Canada(Moody et al., 2002) and groundwater in Tyndall Air Force Baseand Naval Air Station Fallon as previously reported to receivedirect discharge (Moody et al., 2002; Schultz et al., 2004).
Although longer-chain PFASs (4C6) remain under continuousresearch towards human exposure and environmental persistence,it cannot be avoided that short-chain PFASs (C4–C6) are gainingbroader concern due to widespread use of short-chain productscontributing to the increase in environmental occurrence. Efflu-ents from WWTPs have been reported to be a major source ofPFHxA (Schultz et al., 2006; Huset et al., 2008). For recent years,PFHxA was even identified to be dominant in wastewater in Taipei(Lin et al., 2010). Statistically significant increase in PFHxA con-centration in effluents was as well detected in most WWTPs acrossmore than 40 cities in the state of Minnesota, USA (Schultz et al.,2004). Previous investigations pointed out that PFHxA prevailinglyoccurred in Hun River (Sun et al., 2011b) and Haihe River (Li et al.,2011). Extremely high levels of PFHxA was reported recently inJapan as 160,000 ng/L in river water and 510 ng/L in sea water(Takemine et al., 2014). In the present study, PFHxA was found0.02–5.63 ng/L (mean 2.80 ng/L) in Tianjin and 0.33–2.10 ng/L(mean 0.93 ng/L) in Weifang, which was far lower than in TaihuLake (15–31 ng/L) but slightly higher or comparable to Huai River(o0.10–1.5 ng/L) (Yu et al., 2012). Specifically in Tianjin, in thepresent study, PFHxA in rivers was detected a magnitude lower ascompared with previous data (4.4–42 ng/L, mean 15 ng/L) (Li et al.,2011), but comparable to those in precipitation in the correspond-ing period (Zhao et al., 2013b). This change over time thereforecould probably be ascribed to the variation in precipitationamount, which was remarkably abundant in year 2012.
On the other hand, the rise of PFBA in the present study waspronounced, probably due to the production and consumption ofshort-chain PFASs or the degradation of the corresponding pre-cursors in a biological or atmospheric way. A recent investigationof PFASs in WWTPs in economically developed areas of Chinareported that short-chain PFCAs (C4, C6) outweighed longer-chainPFCAs (C9–C13) in the composition profiles, wherein PFBA ineffluents were on the same level as PFHxA or even higher in some
Y. Yao et al. / Ecotoxicology and Environmental Safety 108 (2014) 318–328324
cases (Zhang et al., 2013a), indicating effluents from WWTPs werelikely to be an important source of PFBA in natural aquaticenvironment. In contrast, the corresponding PFCAs (C4, C6) inHaihe River and Dagu Drainage Canal were either comparable orhigher than those in effluents from most WWTPs in Chinamentioned above. Therefore in this way as well a reasonableinference that additional sources of short-chain PFASs may existother than effluents from WWTPs and should be further clarified.
3.2. PFAS concentrations and composition profiles in groundwater
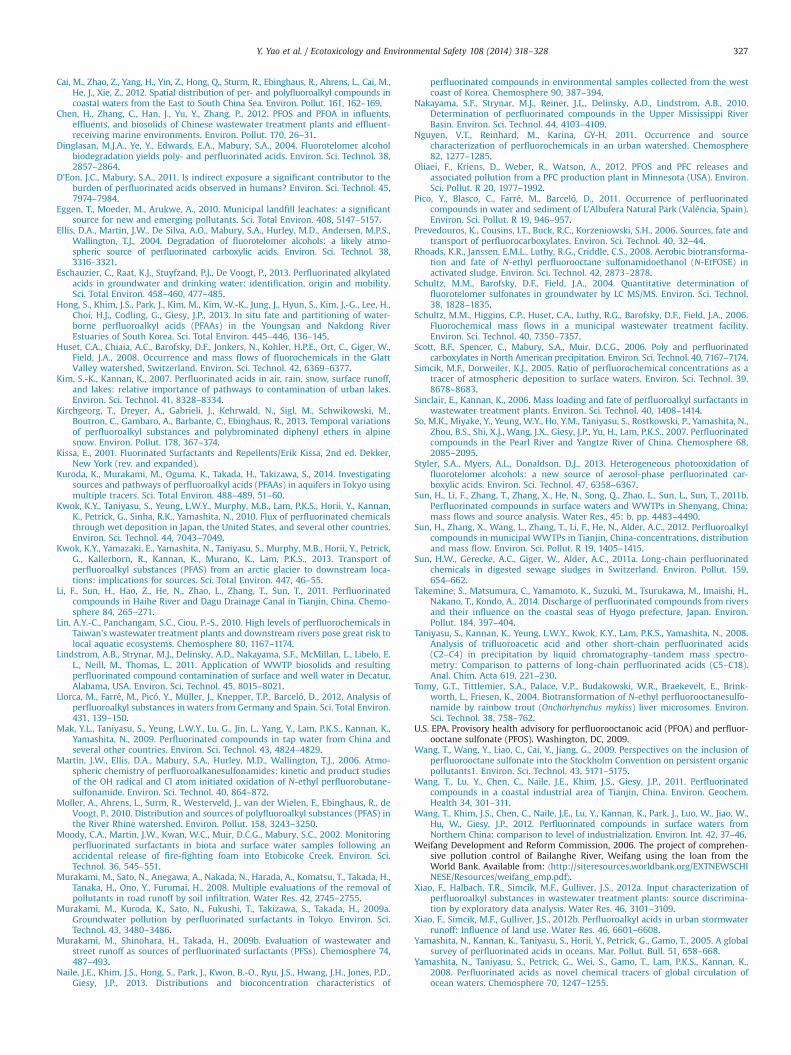
Groundwater samples were collected both in Tianjin andWeifang and analyzed for the same PFAS analogues as those insurface waters. Groundwater in Tianjin (GT) was collected adjacentto Haihe River from deep aquifers, which was meant for drinkingand domestic use after simple treatment. In Weifang (GW), rawgroundwater was collected from shallow aquifers under agricul-tural lands wherein GW1-3 were collected adjacent to BailangheRiver within or closed to suburban industrial area and GW4-6were farther but still within the river basin in rural area. All thegroundwaters in Weifang were practically in use for agricultural
irrigation. Although the ∑PFASs concentrations of GT1 and GT2were much lower than some of the GW sites (Fig. 4), it may notreveal the real situation of groundwater contamination in Tianjin,given that the water in fact underwent treatment and householdstorage and information on shallow aquifers remain scarce. Fromthe view of human exposure, it is still noteworthy that PFOA wasdetected dominant at GT1 and GT2 as 1.46 and 0.76 ng/L, respec-tively, followed by PFHpA and PFHxA. However, considering thatthe Provisional Health Advisory for PFOA and PFHxA (not availablefor PFHpA) in drink water are 400 ng/L and 1000 ng/L, respectively(U.S. EPA, 2009), the detected levels of PFOA and PFHxA may notpose an immediate health risk due to domestic use. But the riskquotient was still calculated higher than that of some tap watersworldwide investigated before (Mak et al., 2009), thus long-termeffects should not be easily ruled out by drinking the groundwaterin Tianjin.
As a whole, unlike those in surface water, no consistent patternof PFAS distribution was observed in groundwater in Weifang.Admittedly, the limited sample size may only partially reflectthe real situation of PFAS contamination in groundwater. Thegroundwater samples at GW1-3 were collected at the place
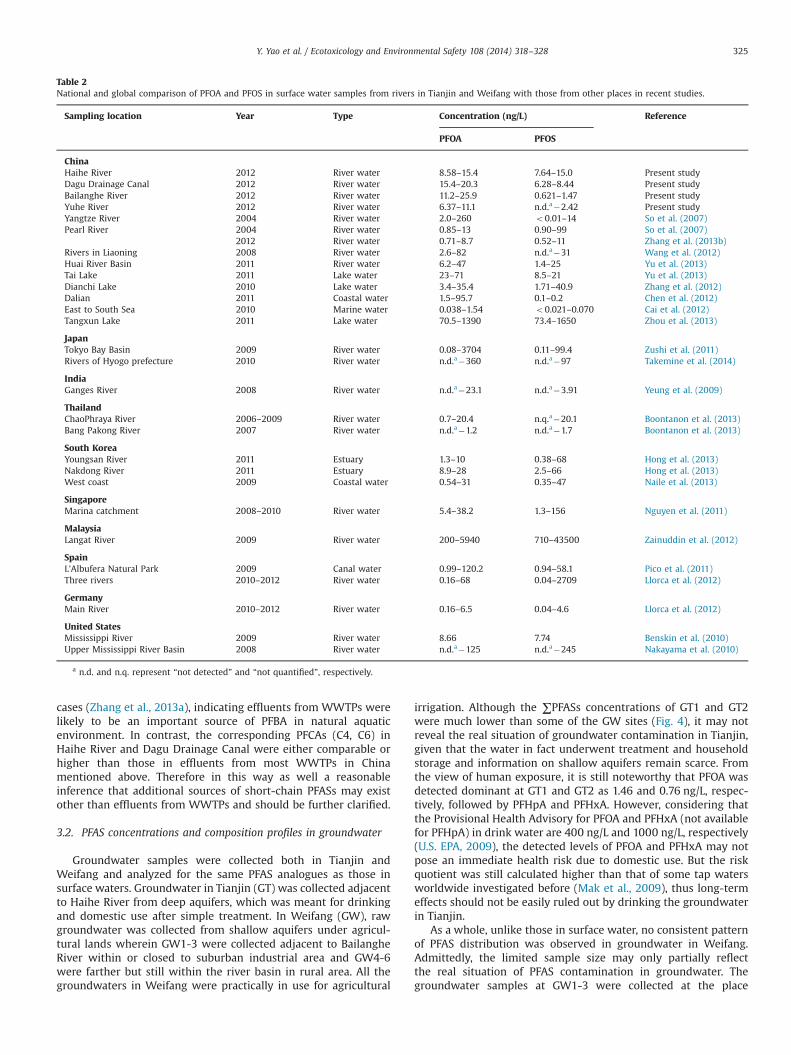
Table 2National and global comparison of PFOA and PFOS in surface water samples from rivers in Tianjin and Weifang with those from other places in recent studies.
Sampling location Year Type Concentration (ng/L) Reference
PFOA PFOS
ChinaHaihe River 2012 River water 8.58–15.4 7.64–15.0 Present studyDagu Drainage Canal 2012 River water 15.4–20.3 6.28–8.44 Present studyBailanghe River 2012 River water 11.2–25.9 0.621–1.47 Present studyYuhe River 2012 River water 6.37–11.1 n.d.a�2.42 Present studyYangtze River 2004 River water 2.0–260 o0.01–14 So et al. (2007)Pearl River 2004 River water 0.85–13 0.90–99 So et al. (2007)
2012 River water 0.71–8.7 0.52–11 Zhang et al. (2013b)Rivers in Liaoning 2008 River water 2.6–82 n.d.a�31 Wang et al. (2012)Huai River Basin 2011 River water 6.2–47 1.4–25 Yu et al. (2013)Tai Lake 2011 Lake water 23–71 8.5–21 Yu et al. (2013)Dianchi Lake 2010 Lake water 3.4–35.4 1.71–40.9 Zhang et al. (2012)Dalian 2011 Coastal water 1.5–95.7 0.1–0.2 Chen et al. (2012)East to South Sea 2010 Marine water 0.038–1.54 o0.021–0.070 Cai et al. (2012)Tangxun Lake 2011 Lake water 70.5–1390 73.4–1650 Zhou et al. (2013)
JapanTokyo Bay Basin 2009 River water 0.08–3704 0.11–99.4 Zushi et al. (2011)Rivers of Hyogo prefecture 2010 River water n.d.a�360 n.d.a�97 Takemine et al. (2014)
IndiaGanges River 2008 River water n.d.a�23.1 n.d.a�3.91 Yeung et al. (2009)
ThailandChaoPhraya River 2006–2009 River water 0.7–20.4 n.q.a�20.1 Boontanon et al. (2013)Bang Pakong River 2007 River water n.d.a�1.2 n.d.a�1.7 Boontanon et al. (2013)
South KoreaYoungsan River 2011 Estuary 1.3–10 0.38–68 Hong et al. (2013)Nakdong River 2011 Estuary 8.9–28 2.5–66 Hong et al. (2013)West coast 2009 Coastal water 0.54–31 0.35–47 Naile et al. (2013)
SingaporeMarina catchment 2008–2010 River water 5.4–38.2 1.3–156 Nguyen et al. (2011)
MalaysiaLangat River 2009 River water 200–5940 710–43500 Zainuddin et al. (2012)
SpainL'Albufera Natural Park 2009 Canal water 0.99–120.2 0.94–58.1 Pico et al. (2011)Three rivers 2010–2012 River water 0.16–68 0.04–2709 Llorca et al. (2012)
GermanyMain River 2010–2012 River water 0.16–6.5 0.04–4.6 Llorca et al. (2012)
United StatesMississippi River 2009 River water 8.66 7.74 Benskin et al. (2010)Upper Mississippi River Basin 2008 River water n.d.a�125 n.d.a�245 Nakayama et al. (2010)
a n.d. and n.q. represent “not detected” and “not quantified”, respectively.
Y. Yao et al. / Ecotoxicology and Environmental Safety 108 (2014) 318–328 325
corresponding to surface water samples at BR3, BR5 and BR7,respectively, and the paired locations were all less than 20 m.However, the disparity was found in both level and compositionprofiles. Except for GW1and GW6, PFOA to PFOS ratios at GW2-6(0.40–1.63, median 0.69) were all significantly lower than those insurface water (44.60). This suggests extra sources of PFOScontributed to the groundwater contamination. Groundwater,especially from those shallow aquifers with a relatively fastcirculation, can be susceptible to complicated sources of PFAScontamination, including sewer exfiltration, infiltration of streetrunoff and potential point sources (Kuroda et al., 2014). Besidesthe elevated levels of PFSAs, the contribution of short-chain PFCAs(C4–C6) at GW1-3 also increased by 7.3–36.7% in the PFCAcomposition profiles as compared to the corresponding surfacewater. Nevertheless, no significant elevation of levels wasobserved. This indicates a relative enrichment of short-chainPFCAs through infiltration other than petential point sources.Due to the difference in hydrophobicity, longer-chain PFASs canbe preferentially removed by soil during infiltration (Murakamiet al., 2008). However, elevated contributions of PFOS wereobserved at GW2–6 and especially at GW2–3 significantly higherlevels of PFOS were detected as well. One possiblity is thatbreakthrough happened when the sorption of PFOS to soil reachedits threshold and the gourndwater took on a historic contamina-tion. Should it be significant, the profiles of PFOS in Weifanggroundwaters were supposed to be more uniform. But the bigvariation occurring at GW2–3 suggests additional sources mightexist. Highly variated PFAA levels were also found in Tokyogroundwaters and could be related to sewer exfiltration andpotential point sources (Kuroda et al., 2014).
Besides surface water contamination, Weifang has long beenalerted by its severe groundwater contamination probably attrib-uted to illegal underdraining or sewer exfiltration. Significantlyhigh ∑PFASs concentrations were detected at GW2–3, where PFOSwas found dominant in both. Particularly at GW3, N-EtFOSAA, oneprecursor of PFOS, was also remarkably detected. Altogether withN-EtFOSA, FOSA and 6:2 FTS, the precursors of PFOS contributedup to 28.1% in the composition profile. This profile was totallydifferent from those of local surface water, nor from any WWTPeffluents in economically developed area of China, where levels ofPFOS and its precursors were rarely detected as high as ingroundwater in the present study (Zhang et al., 2013a). Thisindicates the occurrence of potential point sources to contaminategroundwater. Although the soil-bonded PFOS could be elutedsomehow to contaminated groundwater, great possibility is thatthe dominant PFOS concentration in groundwater was primarilyderived from point sources, as well as the biodegradation of itsprecursors (Murakami et al., 2009a). Therefore, in terms of the
paired surface water and groundwater samples (GW1–3 to BR3,BR5 and BR7), albeit very close, the levels of ∑PFASs were barelycorrelated that BR5 was detected as the highest in surface waterwhile the downstream groundwater site GW3 was in the lead.Probably it is not so inexplicable that they were not necessarilysubjected to similar sources of PFAS contamination. Groundwater(GW4–6) collected from the downstream river basin far away fromsuburban industrial area displayed relatively low PFAS contamina-tion levels as compared with GW2–3. But the PFOS contributionsat GW4–5 were as high as 51.6% and 26.4%, which suggests similarsources to GW2–3. On the contrary, GW6 with a slight increase inconcentration was mainly contributed by PFOA and PFBA, whichwas similar to surface water.
Globally, although higher levels of PFAS contamination ingroundwater has been reported before (Murakami et al., 2009a;Lindstrom et al., 2011), potential human exposure was hardlyassociated. In Weifang, groundwater is widely and regularly usedfor agricultural irrigation. For instance, The vegetables and maizeare widely cultivated in this manner and the maize is further fed tolivestock. This pattern forms a risk of human exposure to plant-bioaccumulative short-chain PFASs via food chain, which is prob-ably worth concern.
4. Implications for future study
Further investigation of precipitation and surface runoff inWeifang is necessary to clarify to what extent PFASs may con-tribute to the surface or even groundwater system. The linkagebetween atmosphere and surface environment with wet or drydeposition ought to be quite important, provided that non-pointsources of PFASs were to be significant in such a contaminatedarea like Weifang. On the other hand, a more integrated picture ofthe groundwater PFAS contamination in Weifang is of greatimportance to clarify specific point sources. Furthermore, vegeta-bles grown on the farm land that irrigated with the contaminatedgroundwater need to be investigated to evaluate the risk of humanexposure to those PFASs, especially those short-chain analogueswith higher water solubility and greater mobility.
Acknowledgment
The study was supported by National Natural Science Founda-tion of China (21150110458; 41225014), Ministry of Education ofthe People's Republic of China for Doctor Education Program(20130031110027), and Ocean Promotion Plan of Tianjin OceanBureau (KJXH2012-22).
References
3M-Company, 2000. Phase-out plan for POSF-based products. Available from:⟨www.regulations.gov⟩. As document EPA-HQ-OPPT-2002-0043-0009.
Benskin, J.P., Yeung, L.W.Y., Yamashita, N., Taniyasu, S., Lam, P.K.S., Martin, J.W.,2010. Perfluorinated acid isomer profiling in water and quantitative assessmentof manufacturing source. Environ. Sci. Technol. 44, 9049–9054.
Boontanon, S.K., Kunacheva, C., Boontanon, N., Musirat, N., Fujii, S., Tanaka, S., 2013.Occurrence of perfluorooctane sulfonate in the water environment of Bangkok,Thailand. J. Environ. Eng. 139, 588–593.
Boulanger, B., Vargo, J.D., Schnoor, J.L., Hornbuckle, K.C., 2005. Evaluation ofperfluorooctane purfactants in a wastewater treatment system and in acommercial surface protection product. Environ. Sci. Technol. 39, 5524–5530.
Buck, R.C., Franklin, J., Berger, U., Conder, J.M., Cousins, I.T., de Voogt, P., Jensen, A.A.,Kannan, K., Mabury, S.A., van Leeuwen, S.P., 2011. Perfluoroalkyl and polyfluor-oalkyl substances in the environment: terminology, classification, and origins.Integr. Environ. Assess. Manag. 7, 513–541.
Butt, C.M., Berger, U., Bossi, R., Tomy, G.T., 2010. Levels and trends of poly- andperfluorinated compounds in the arctic environment. Sci. Total Environ. 408,2936–2965.
Fig. 4. Spatial distribution of ∑PFASs concentrations in the groundwater samplesfrom Tianjin and Weifang.
Y. Yao et al. / Ecotoxicology and Environmental Safety 108 (2014) 318–328326
Cai, M., Zhao, Z., Yang, H., Yin, Z., Hong, Q., Sturm, R., Ebinghaus, R., Ahrens, L., Cai, M.,He, J., Xie, Z., 2012. Spatial distribution of per- and polyfluoroalkyl compounds incoastal waters from the East to South China Sea. Environ. Pollut. 161, 162–169.
Chen, H., Zhang, C., Han, J., Yu, Y., Zhang, P., 2012. PFOS and PFOA in influents,effluents, and biosolids of Chinese wastewater treatment plants and effluent-receiving marine environments. Environ. Pollut. 170, 26–31.
Dinglasan, M.J.A., Ye, Y., Edwards, E.A., Mabury, S.A., 2004. Fluorotelomer alcoholbiodegradation yields poly- and perfluorinated acids. Environ. Sci. Technol. 38,2857–2864.
D'Eon, J.C., Mabury, S.A., 2011. Is indirect exposure a significant contributor to theburden of perfluorinated acids observed in humans? Environ. Sci. Technol. 45,7974–7984.
Eggen, T., Moeder, M., Arukwe, A., 2010. Municipal landfill leachates: a significantsource for new and emerging pollutants. Sci. Total Environ. 408, 5147–5157.
Ellis, D.A., Martin, J.W., De Silva, A.O., Mabury, S.A., Hurley, M.D., Andersen, M.P.S.,Wallington, T.J., 2004. Degradation of fluorotelomer alcohols: a likely atmo-spheric source of perfluorinated carboxylic acids. Environ. Sci. Technol. 38,3316–3321.
Eschauzier, C., Raat, K.J., Stuyfzand, P.J., De Voogt, P., 2013. Perfluorinated alkylatedacids in groundwater and drinking water: identification, origin and mobility.Sci. Total Environ. 458–460, 477–485.
Hong, S., Khim, J.S., Park, J., Kim, M., Kim, W.-K., Jung, J., Hyun, S., Kim, J.-G., Lee, H.,Choi, H.J., Codling, G., Giesy, J.P., 2013. In situ fate and partitioning of water-borne perfluoroalkyl acids (PFAAs) in the Youngsan and Nakdong RiverEstuaries of South Korea. Sci. Total Environ. 445–446, 136–145.
Huset, C.A., Chiaia, A.C., Barofsky, D.F., Jonkers, N., Kohler, H.P.E., Ort, C., Giger, W.,Field, J.A., 2008. Occurrence and mass flows of fluorochemicals in the GlattValley watershed, Switzerland. Environ. Sci. Technol. 42, 6369–6377.
Kim, S.-K., Kannan, K., 2007. Perfluorinated acids in air, rain, snow, surface runoff,and lakes: relative importance of pathways to contamination of urban lakes.Environ. Sci. Technol. 41, 8328–8334.
Kirchgeorg, T., Dreyer, A., Gabrieli, J., Kehrwald, N., Sigl, M., Schwikowski, M.,Boutron, C., Gambaro, A., Barbante, C., Ebinghaus, R., 2013. Temporal variationsof perfluoroalkyl substances and polybrominated diphenyl ethers in alpinesnow. Environ. Pollut. 178, 367–374.
Kissa, E., 2001. Fluorinated Surfactants and Repellents/Erik Kissa, 2nd ed. Dekker,New York (rev. and expanded).
Kuroda, K., Murakami, M., Oguma, K., Takada, H., Takizawa, S., 2014. Investigatingsources and pathways of perfluoroalkyl acids (PFAAs) in aquifers in Tokyo usingmultiple tracers. Sci. Total Environ. 488–489, 51–60.
Kwok, K.Y., Taniyasu, S., Yeung, L.W.Y., Murphy, M.B., Lam, P.K.S., Horii, Y., Kannan,K., Petrick, G., Sinha, R.K., Yamashita, N., 2010. Flux of perfluorinated chemicalsthrough wet deposition in Japan, the United States, and several other countries.Environ. Sci. Technol. 44, 7043–7049.
Kwok, K.Y., Yamazaki, E., Yamashita, N., Taniyasu, S., Murphy, M.B., Horii, Y., Petrick,G., Kallerborn, R., Kannan, K., Murano, K., Lam, P.K.S., 2013. Transport ofperfluoroalkyl substances (PFAS) from an arctic glacier to downstream loca-tions: implications for sources. Sci. Total Environ. 447, 46–55.
Li, F., Sun, H., Hao, Z., He, N., Zhao, L., Zhang, T., Sun, T., 2011. Perfluorinatedcompounds in Haihe River and Dagu Drainage Canal in Tianjin, China. Chemo-sphere 84, 265–271.
Lin, A.Y.-C., Panchangam, S.C., Ciou, P.-S., 2010. High levels of perfluorochemicals inTaiwan's wastewater treatment plants and downstream rivers pose great risk tolocal aquatic ecosystems. Chemosphere 80, 1167–1174.
Lindstrom, A.B., Strynar, M.J., Delinsky, A.D., Nakayama, S.F., McMillan, L., Libelo, E.L., Neill, M., Thomas, L., 2011. Application of WWTP biosolids and resultingperfluorinated compound contamination of surface and well water in Decatur,Alabama, USA. Environ. Sci. Technol. 45, 8015–8021.
Llorca, M., Farré, M., Picó, Y., Müller, J., Knepper, T.P., Barceló, D., 2012. Analysis ofperfluoroalkyl substances in waters from Germany and Spain. Sci. Total Environ.431, 139–150.
Mak, Y.L., Taniyasu, S., Yeung, L.W.Y., Lu, G., Jin, L., Yang, Y., Lam, P.K.S., Kannan, K.,Yamashita, N., 2009. Perfluorinated compounds in tap water from China andseveral other countries. Environ. Sci. Technol. 43, 4824–4829.
Martin, J.W., Ellis, D.A., Mabury, S.A., Hurley, M.D., Wallington, T.J., 2006. Atmo-spheric chemistry of perfluoroalkanesulfonamides: kinetic and product studiesof the OH radical and Cl atom initiated oxidation of N-ethyl perfluorobutane-sulfonamide. Environ. Sci. Technol. 40, 864–872.
Moller, A., Ahrens, L., Surm, R., Westerveld, J., van der Wielen, F., Ebinghaus, R., deVoogt, P., 2010. Distribution and sources of polyfluoroalkyl substances (PFAS) inthe River Rhine watershed. Environ. Pollut. 158, 3243–3250.
Moody, C.A., Martin, J.W., Kwan, W.C., Muir, D.C.G., Mabury, S.C., 2002. Monitoringperfluorinated surfactants in biota and surface water samples following anaccidental release of fire-fighting foam into Etobicoke Creek. Environ. Sci.Technol. 36, 545–551.
Murakami, M., Sato, N., Anegawa, A., Nakada, N., Harada, A., Komatsu, T., Takada, H.,Tanaka, H., Ono, Y., Furumai, H., 2008. Multiple evaluations of the removal ofpollutants in road runoff by soil infiltration. Water Res. 42, 2745–2755.
Murakami, M., Kuroda, K., Sato, N., Fukushi, T., Takizawa, S., Takada, H., 2009a.Groundwater pollution by perfluorinated surfactants in Tokyo. Environ. Sci.Technol. 43, 3480–3486.
Murakami, M., Shinohara, H., Takada, H., 2009b. Evaluation of wastewater andstreet runoff as sources of perfluorinated surfactants (PFSs). Chemosphere 74,487–493.
Naile, J.E., Khim, J.S., Hong, S., Park, J., Kwon, B.-O., Ryu, J.S., Hwang, J.H., Jones, P.D.,Giesy, J.P., 2013. Distributions and bioconcentration characteristics of
perfluorinated compounds in environmental samples collected from the westcoast of Korea. Chemosphere 90, 387–394.
Nakayama, S.F., Strynar, M.J., Reiner, J.L., Delinsky, A.D., Lindstrom, A.B., 2010.Determination of perfluorinated compounds in the Upper Mississippi RiverBasin. Environ. Sci. Technol. 44, 4103–4109.
Nguyen, V.T., Reinhard, M., Karina, GY-H, 2011. Occurrence and sourcecharacterization of perfluorochemicals in an urban watershed. Chemosphere82, 1277–1285.
Oliaei, F., Kriens, D., Weber, R., Watson, A., 2012. PFOS and PFC releases andassociated pollution from a PFC production plant in Minnesota (USA). Environ.Sci. Pollut. R 20, 1977–1992.
Pico, Y., Blasco, C., Farré, M., Barceló, D., 2011. Occurrence of perfluorinatedcompounds in water and sediment of L'Albufera Natural Park (València, Spain).Environ. Sci. Pollut. R 19, 946–957.
Prevedouros, K., Cousins, I.T., Buck, R.C., Korzeniowski, S.H., 2006. Sources, fate andtransport of perfluorocarboxylates. Environ. Sci. Technol. 40, 32–44.
Rhoads, K.R., Janssen, E.M.L., Luthy, R.G., Criddle, C.S., 2008. Aerobic biotransforma-tion and fate of N-ethyl perfluorooctane sulfonamidoethanol (N-EtFOSE) inactivated sludge. Environ. Sci. Technol. 42, 2873–2878.
Schultz, M.M., Barofsky, D.F., Field, J.A., 2004. Quantitative determination offluorotelomer sulfonates in groundwater by LC MS/MS. Environ. Sci. Technol.38, 1828–1835.
Schultz, M.M., Higgins, C.P., Huset, C.A., Luthy, R.G., Barofsky, D.F., Field, J.A., 2006.Fluorochemical mass flows in a municipal wastewater treatment facility.Environ. Sci. Technol. 40, 7350–7357.
Scott, B.F., Spencer, C., Mabury, S.A., Muir, D.C.G., 2006. Poly and perfluorinatedcarboxylates in North American precipitation. Environ. Sci. Technol. 40, 7167–7174.
Simcik, M.F., Dorweiler, K.J., 2005. Ratio of perfluorochemical concentrations as atracer of atmospheric deposition to surface waters. Environ. Sci. Technol. 39,8678–8683.
Sinclair, E., Kannan, K., 2006. Mass loading and fate of perfluoroalkyl surfactants inwastewater treatment plants. Environ. Sci. Technol. 40, 1408–1414.
So, M.K., Miyake, Y., Yeung, W.Y., Ho, Y.M., Taniyasu, S., Rostkowski, P., Yamashita, N.,Zhou, B.S., Shi, X.J., Wang, J.X., Giesy, J.P., Yu, H., Lam, P.K.S., 2007. Perfluorinatedcompounds in the Pearl River and Yangtze River of China. Chemosphere 68,2085–2095.
Styler, S.A., Myers, A.L., Donaldson, D.J., 2013. Heterogeneous photooxidation offluorotelomer alcohols: a new source of aerosol-phase perfluorinated car-boxylic acids. Environ. Sci. Technol. 47, 6358–6367.
Sun, H., Li, F., Zhang, T., Zhang, X., He, N., Song, Q., Zhao, L., Sun, L., Sun, T., 2011b.Perfluorinated compounds in surface waters and WWTPs in Shenyang, China:mass flows and source analysis. Water Res., 45; b, pp. 4483–4490.
Sun, H., Zhang, X., Wang, L., Zhang, T., Li, F., He, N., Alder, A.C., 2012. Perfluoroalkylcompounds in municipal WWTPs in Tianjin, China-concentrations, distributionand mass flow. Environ. Sci. Pollut. R 19, 1405–1415.
Sun, H.W., Gerecke, A.C., Giger, W., Alder, A.C., 2011a. Long-chain perfluorinatedchemicals in digested sewage sludges in Switzerland. Environ. Pollut. 159,654–662.
Takemine, S., Matsumura, C., Yamamoto, K., Suzuki, M., Tsurukawa, M., Imaishi, H.,Nakano, T., Kondo, A., 2014. Discharge of perfluorinated compounds from riversand their influence on the coastal seas of Hyogo prefecture, Japan. Environ.Pollut. 184, 397–404.
Taniyasu, S., Kannan, K., Yeung, L.W.Y., Kwok, K.Y., Lam, P.K.S., Yamashita, N., 2008.Analysis of trifluoroacetic acid and other short-chain perfluorinated acids(C2–C4) in precipitation by liquid chromatography–tandem mass spectro-metry: Comparison to patterns of long-chain perfluorinated acids (C5–C18).Anal. Chim. Acta 619, 221–230.
Tomy, G.T., Tittlemier, S.A., Palace, V.P., Budakowski, W.R., Braekevelt, E., Brink-worth, L., Friesen, K., 2004. Biotransformation of N-ethyl perfluorooctanesulfo-namide by rainbow trout (Onchorhynchus mykiss) liver microsomes. Environ.Sci. Technol. 38, 758–762.
U.S. EPA, Provisory health advisory for perfluorooctanoic acid (PFOA) and perfluor-ooctane sulfonate (PFOS). Washington, DC, 2009.
Wang, T., Wang, Y., Liao, C., Cai, Y., Jiang, G., 2009. Perspectives on the inclusion ofperfluorooctane sulfonate into the Stockholm Convention on persistent organicpollutants1. Environ. Sci. Technol. 43, 5171–5175.
Wang, T., Lu, Y., Chen, C., Naile, J.E., Khim, J.S., Giesy, J.P., 2011. Perfluorinatedcompounds in a coastal industrial area of Tianjin, China. Environ. Geochem.Health 34, 301–311.
Wang, T., Khim, J.S., Chen, C., Naile, J.E., Lu, Y., Kannan, K., Park, J., Luo, W., Jiao, W.,Hu, W., Giesy, J.P., 2012. Perfluorinated compounds in surface waters fromNorthern China: comparison to level of industrialization. Environ. Int. 42, 37–46.
Weifang Development and Reform Commission, 2006. The project of comprehen-sive pollution control of Bailanghe River, Weifang using the loan from theWorld Bank. Available from: ⟨http://siteresources.worldbank.org/EXTNEWSCHINESE/Resources/weifang_emp.pdf⟩.
Xiao, F., Halbach, T.R., Simcik, M.F., Gulliver, J.S., 2012a. Input characterization ofperfluoroalkyl substances in wastewater treatment plants: source discrimina-tion by exploratory data analysis. Water Res. 46, 3101–3109.
Xiao, F., Simcik, M.F., Gulliver, J.S., 2012b. Perfluoroalkyl acids in urban stormwaterrunoff: Influence of land use. Water Res. 46, 6601–6608.
Yamashita, N., Kannan, K., Taniyasu, S., Horii, Y., Petrick, G., Gamo, T., 2005. A globalsurvey of perfluorinated acids in oceans. Mar. Pollut. Bull. 51, 658–668.
Yamashita, N., Taniyasu, S., Petrick, G., Wei, S., Gamo, T., Lam, P.K.S., Kannan, K.,2008. Perfluorinated acids as novel chemical tracers of global circulation ofocean waters. Chemosphere 70, 1247–1255.
Y. Yao et al. / Ecotoxicology and Environmental Safety 108 (2014) 318–328 327

Yeung, L.W.Y., Yamashita, N., Taniyasu, S., Lam, P.K.S., Sinha, R.K., Borole, D.V.,Kannan, K., 2009. A survey of perfluorinated compounds in surface water andbiota including dolphins from the Ganges River and in other waterbodies inIndia. Chemosphere 76, 55–62.
Young, C.J., Furdui, V.I., Koerner, R.M., Muir, D.C.G., Mabury, S.A., 2007. Perfluori-nated acids in Arctic snow: a new evidence for atmospheric formation. Environ.Sci. Technol. 41, 3455.
Yu, N., Shi, W., Zhang, B., Su, G., Feng, J., Zhang, X., Wei, S., Yu, H., 2012. Occurrenceof perfluoroalkyl acids including perfluorooctane sulfonate isomers in HuaiRiver Basin and Taihu Lake in Jiangsu Province, China. Environ. Sci. Technol. 47,710–717.
Yu, N., Shi, W., Zhang, B., Su, G., Feng, J., Zhang, X., Wei, S., Yu, H., 2013. Occurrenceof perfluoroalkyl acids including perfluorooctane sulfonate isomers in HuaiRiver Basin and Taihu Lake in Jiangsu Province, China. Environ. Sci. Technol. 47,710–717.
Zainuddin, K., Zakaria, M.P., Al-Odaini, N.A., Bakhtiari, A.R., Latif, P.A., 2012.Perfluorooctanoic acid (PFOA) and perfluorooctane sulfonate (PFOS) in surfacewater from the Langat River, Peninsular Malaysia. Environ. Forensics 13, 82–92.
Zhang, W., Zhang, Y., Taniyasu, S., Yeung, L.W., Lam, P.K., Wang, J., Li, X., Yamashita, N.,Dai, J., 2013a. Distribution and fate of perfluoroalkyl substances in municipalwastewater treatment plants in economically developed areas of China. Environ.Pollut. 176C, 10–17.
Zhang, Y., Meng, W., Guo, C., Xu, J., Yu, T., Fan, W., Li, L., 2012. Determination andpartitioning behavior of perfluoroalkyl carboxylic acids and perfluorooctane-sulfonate in water and sediment from Dianchi Lake, China. Chemosphere 88,1292–1299.
Zhang, Y., Lai, S., Zhao, Z., Liu, F., Chen, H., Zou, S., Xie, Z., Ebinghaus, R., 2013b.Spatial distribution of perfluoroalkyl acids in the Pearl River of southern China.Chemosphere 93, 1519–1525.
Zhao, L., McCausland, P.K., Folsom, P.W., Wolstenholme, B.W., Sun, H., Wang, N.,Buck, R.C., 2013a. 6:2 Fluorotelomer alcohol aerobic biotransformation inactivated sludge from two domestic wastewater treatment plants. Chemo-sphere 92, 464–470.
Zhao, L., Zhou, M., Zhang, T., Sun, H., 2013b. Polyfluorinated and perfluorinatedchemicals in precipitation and runoff from cities across eastern and centralchina. Arch. Environ. Contam. Toxicol. 64, 198–207.
Zhou, Z., Liang, Y., Shi, Y., Xu, L., Cai, Y., 2013. Occurrence and transport ofperfluoroalkyl acids (PFAAs), including short-chain PFAAs in Tangxun Lake,China. Environ. Sci. Technol. 47, 9249–9257.
Zushi, Y., Ye, F., Motegi, M., Nojiri, K., Hosono, S., Suzuki, T., Kosugi, Y., Yaguchi, K.,Masunaga, S., 2011. Spatially detailed survey on pollution by multiple per-fluorinated compounds in the Tokyo Bay Basin of Japan. Environ. Sci. Technol.45, 2887–2893.
Y. Yao et al. / Ecotoxicology and Environmental Safety 108 (2014) 318–328328