distribution and dynamics of a tropical waterfalls ecosystem · properties mots-clés :...
TRANSCRIPT

Knowledge and Management of Aquatic Ecosystems (2012) 404, 10© ONEMA, 2012 http://www.kmae-journal.orgDOI: 10.1051/kmae/2012004
Distribution and dynamics of a tropical waterfalls ecosystem
B.O. Offem(1)*, G.U. Ikpi(1)
Received December 22, 2011Revised February 25, 2012Accepted March 4, 2012
ABSTRACT
Waterfalls gives the impression of a lifeless zone because researchers havehistorically focused on the hydrology, ecotourism and geological features.Effective management will require an understanding of changes in speciescomposition and distribution of macro-biota. Monthly samples were takenin wet and dry seasons, over two year period in three regions along the6817.7 m length of the Agbokum waterfalls. Macro-biota exhibited distinctpattern in respect of seasonal and spatial changes. Trachelomonas volzii,the most abundant phytoplankton species reduced from 686 in the dry sea-son to 143 in the wet, and from 455 downstream to 91, midstream (waterfallsregion). Zooplankton species Calanus finmarchicus decreased from 511during dry season to 36 in the wet and from 334 downstream to 7,midstream. 71.7 percent of the total macro-invertebrates were recordedfrom downstream reaches while only 6.3 percent were contributed bymidstream. Percentage cover of marginal vegetation by Bambusasp, Sym-phonia and Elaeis guineesis displayed progressive increase from upstreamreaching a maximum of 38.5 mean percent cover in the relatively undistur-bed downstream. In contrast, Raphia vinifera, Havea brasiliensis, Grewiasp. and Cocos nucifera shrank in size from 34% to 8% at the midstreamstretches of the river while only nymphia- rich vegetation becomes morefrequent in the middle reaches. The disturbance regimes of the midstreamreaches of Agbokum waterfalls combined with its very low faunal and floraldiversity has made the environment unstable therefore susceptible to theinvasion of disturbance tolerant biota.
RÉSUMÉ
Distribution et dynamique d'un écosystème tropical de cascades
Les cascades donnent l'impression d'une zone morte parce que les chercheursont toujours mis l'accent sur l'hydrologie, l'écotourisme et les caractéristiquesgéologiques. Une gestion efficace nécessite la compréhension des changementsdans la composition des espèces et la distribution des macro-organismes. Deséchantillons mensuels ont été pris au cours des saisons humides et sèches, pen-dant plus de deux ans dans trois régions le long des 6817,7 m des cascadesAgbokum. Les macrobiotes présentent des patterns différents selon les change-ments saisonniers et spatiaux. Trachelomonas volzii, l'espèce de phytoplancton laplus abondante, passe de 686 en saison sèche à 143 en saison humide, et de455 en aval à 91 en zone médiane (région des cascades). L'espèce de zooplancton
(1) Department of Fisheries and Aquatic Science, Faculty of Agriculture and Forestry, Cross River Universityof Technology, pmb 102 Obubra, Nigeria* Corresponding author: [email protected]
Key-words:waterfalls,macro-invertebrates,phytoplankton,zooplankton,vegetation, fishspecies, physic-chemicalproperties
Mots-clés :cascades, macro-invertébrés,phytoplancton,zooplancton,végétation,espècespiscicoles,propriétésphysico-chimiques
Article publié par EDP Sciences

B.O. Offem and G.U. Ikpi: Knowl. Managt. Aquatic Ecosyst. (2012) 404, 10
Calanus finmarchicus passe de 511 pendant la saison sèche à 36 en saison hu-mide et de 334 en aval à 7, en zone médiane. 71,7 % du total des macro-invertébrés ont été rencontrés dans les tronçons situés en aval, tandis que seule-ment 6,3 % sont trouvés dans les tronçons médians. Parmi les trois espèces depoissons dominantes Tilapia zillii, Clarias gariepinus et Labeo coubie, constituant45,5 % des captures totales, deux poissons benthiques (L. coubie et C. gariepinus)présentent des schémas de distribution inverses. Les Clariidés (C. gariepinus) setrouvent les plus abondantes en aval et les moins représentées en amont. Les Cy-prinidés (L. coubie), d'autre part, dominent les tronçons en amont et sont rares enaval. Le pourcentage de couverture de la végétation rivulaire par Sambusasp,Symphonia et Elaeis guineesis présente une augmentation progressive depuisl'amont pour atteindre un maximum de 38,5 % de couverture moyenne en aval re-lativement bien préservé. En revanche, Raphia vinifera, Havea brasiliensis, Grewiasp. et Cocos nucifera diminuent de 34 % à 8 % sur les tronçons médians dufleuve. Nymphia est devenue envahissante et présente toute une gamme d'im-pacts dans un tronçon médian perturbé. Les régimes de perturbation du tronçonmédian des cascades Agbokum combinés avec sa très faible diversité faunistiqueet floristique rend l'environnement instable donc sensible à l'invasion d'espècestolérantes aux perturbations.
INTRODUCTION
Waterfalls, most of which are formed from stream or river which cascade from a high elevationover a cliff or rock, had very little attention from researchers the world over. In Africa, the reasonbeing that, waterfalls were named after deities and were used as places of traditional andancestral worships. In other places, the intensity of waterfalls and pressure generated from itdue to gravity has given the impression of a lifeless zone (Chernicoff et al., 1997). Knowledgeof waterfalls systems in Africa are therefore limited to hydrology and geological features(Chester et al., 1999; Fischer and Harris, 2003), as natural monuments for revenue generation,because of their ecotourism potentials and as source for drinking, irrigation and other domesticpurposes. Studies on the fisheries and aquaculture potentials, biodiversity conservation andaquatic ecology of waterfalls are scarce due to traditional and ancestral worship of neighboringcommunities that had earlier prevented all forms of activities in the study area.Knowledge of status of the fauna and flora of Agbokum waterfall is important in the developmentof tourism potentials, management and conservation of the resources. It is also possible thatthe biodiversity of Cross river fishes is much higher than reported (Teugels et al., 1992; Offemet al., 2008) and could yield records of undiscovered and un-described species if the AgbokimWaterfalls and other water bodies such as Crater lakes, flood plains, lakes and mountainstreams which link up with the Cross River, are investigated. The fundamental attributes of anaquatic ecosystem are the number of species present and their abundance (Krinitskii, 1972).Both attribute are dynamic and related (Tokeshi and Schmid, 2002). In aquatic ecosystemsinteraction between the environment and population processes affects the distribution andabundance patterns of species (Brown, 1984; Schlosser, 1987). The resources of the length ofthe waterfalls are yet to be tapped, more so due to the total neglect by stakeholders. This studypresents an analysis of the occurrence, distribution and dynamics in the fauna and floraresources of Agbokim waterfalls to reduce our over- dependence on estuarine and open waterbody systems.
METHODS
> STUDY AREA
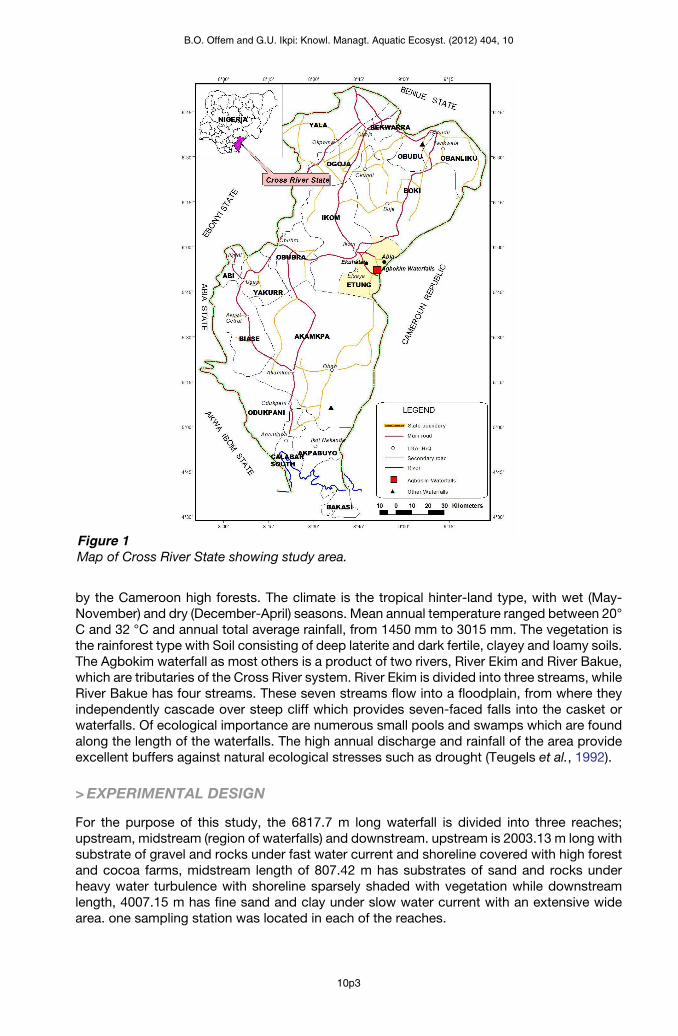
The study area is Agbokim Waterfalls in Cross River State, Nigeria, latitude 5° 59’ North andlongitude 8° 45’ East (Figure 1). It is bounded in the West by the Cross River and in the North
10p2Article publié par EDP Sciences
B.O. Offem and G.U. Ikpi: Knowl. Managt. Aquatic Ecosyst. (2012) 404, 10
by the Cameroon high forests. The climate is the tropical hinter-land type, with wet (May-November) and dry (December-April) seasons. Mean annual temperature ranged between 20°C and 32 °C and annual total average rainfall, from 1450 mm to 3015 mm. The vegetation isthe rainforest type with Soil consisting of deep laterite and dark fertile, clayey and loamy soils.The Agbokim waterfall as most others is a product of two rivers, River Ekim and River Bakue,which are tributaries of the Cross River system. River Ekim is divided into three streams, whileRiver Bakue has four streams. These seven streams flow into a floodplain, from where theyindependently cascade over steep cliff which provides seven-faced falls into the casket orwaterfalls. Of ecological importance are numerous small pools and swamps which are foundalong the length of the waterfalls. The high annual discharge and rainfall of the area provideexcellent buffers against natural ecological stresses such as drought (Teugels et al., 1992).
> EXPERIMENTAL DESIGN
For the purpose of this study, the 6817.7 m long waterfall is divided into three reaches;upstream, midstream (region of waterfalls) and downstream. upstream is 2003.13 m long withsubstrate of gravel and rocks under fast water current and shoreline covered with high forestand cocoa farms, midstream length of 807.42 m has substrates of sand and rocks underheavy water turbulence with shoreline sparsely shaded with vegetation while downstreamlength, 4007.15 m has fine sand and clay under slow water current with an extensive widearea. one sampling station was located in each of the reaches.
Figure 1Map of Cross River State showing study area.
10p3
B.O. Offem and G.U. Ikpi: Knowl. Managt. Aquatic Ecosyst. (2012) 404, 10
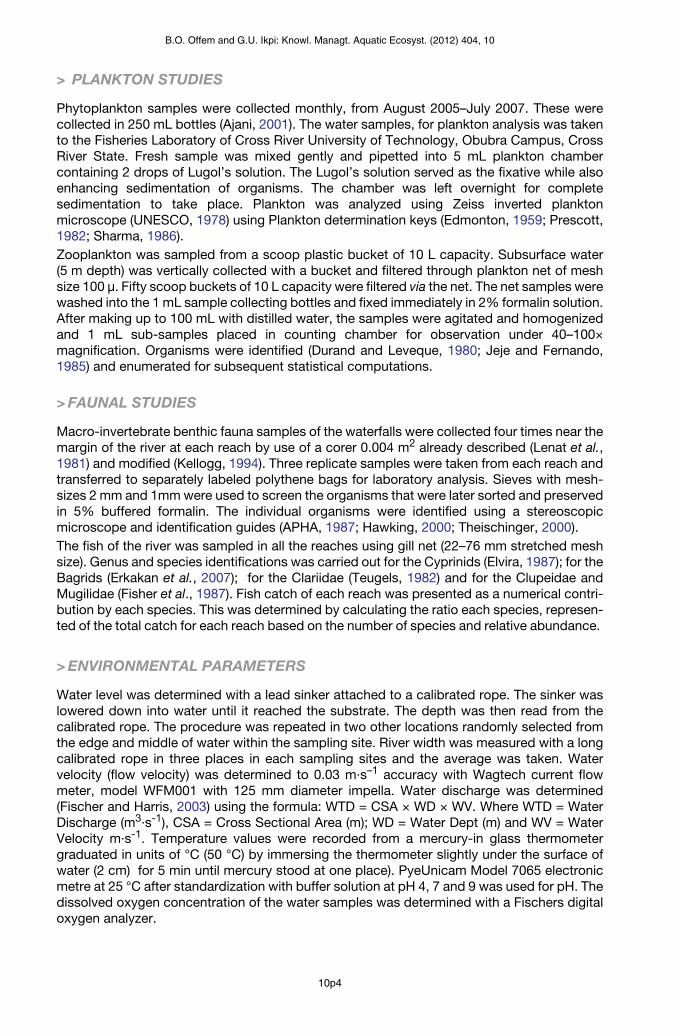
> PLANKTON STUDIES
Phytoplankton samples were collected monthly, from August 2005–July 2007. These werecollected in 250 mL bottles (Ajani, 2001). The water samples, for plankton analysis was takento the Fisheries Laboratory of Cross River University of Technology, Obubra Campus, CrossRiver State. Fresh sample was mixed gently and pipetted into 5 mL plankton chambercontaining 2 drops of Lugol’s solution. The Lugol’s solution served as the fixative while alsoenhancing sedimentation of organisms. The chamber was left overnight for completesedimentation to take place. Plankton was analyzed using Zeiss inverted planktonmicroscope (UNESCO, 1978) using Plankton determination keys (Edmonton, 1959; Prescott,1982; Sharma, 1986).Zooplankton was sampled from a scoop plastic bucket of 10 L capacity. Subsurface water(5 m depth) was vertically collected with a bucket and filtered through plankton net of meshsize 100 µ. Fifty scoop buckets of 10 L capacity were filtered via the net. The net samples werewashed into the 1 mL sample collecting bottles and fixed immediately in 2% formalin solution.After making up to 100 mL with distilled water, the samples were agitated and homogenizedand 1 mL sub-samples placed in counting chamber for observation under 40–100×magnification. Organisms were identified (Durand and Leveque, 1980; Jeje and Fernando,1985) and enumerated for subsequent statistical computations.
> FAUNAL STUDIES
Macro-invertebrate benthic fauna samples of the waterfalls were collected four times near themargin of the river at each reach by use of a corer 0.004 m2 already described (Lenat et al.,1981) and modified (Kellogg, 1994). Three replicate samples were taken from each reach andtransferred to separately labeled polythene bags for laboratory analysis. Sieves with mesh-sizes 2 mm and 1mm were used to screen the organisms that were later sorted and preservedin 5% buffered formalin. The individual organisms were identified using a stereoscopicmicroscope and identification guides (APHA, 1987; Hawking, 2000; Theischinger, 2000).The fish of the river was sampled in all the reaches using gill net (22–76 mm stretched meshsize). Genus and species identifications was carried out for the Cyprinids (Elvira, 1987); for theBagrids (Erkakan et al., 2007); for the Clariidae (Teugels, 1982) and for the Clupeidae andMugilidae (Fisher et al., 1987). Fish catch of each reach was presented as a numerical contri-bution by each species. This was determined by calculating the ratio each species, represen-ted of the total catch for each reach based on the number of species and relative abundance.
> ENVIRONMENTAL PARAMETERS
Water level was determined with a lead sinker attached to a calibrated rope. The sinker waslowered down into water until it reached the substrate. The depth was then read from thecalibrated rope. The procedure was repeated in two other locations randomly selected fromthe edge and middle of water within the sampling site. River width was measured with a longcalibrated rope in three places in each sampling sites and the average was taken. Watervelocity (flow velocity) was determined to 0.03 m·s–1 accuracy with Wagtech current flowmeter, model WFM001 with 125 mm diameter impella. Water discharge was determined(Fischer and Harris, 2003) using the formula: WTD = CSA × WD × WV. Where WTD = WaterDischarge (m3·s-1), CSA = Cross Sectional Area (m); WD = Water Dept (m) and WV = WaterVelocity m·s-1. Temperature values were recorded from a mercury-in glass thermometergraduated in units of °C (50 °C) by immersing the thermometer slightly under the surface ofwater (2 cm) for 5 min until mercury stood at one place). PyeUnicam Model 7065 electronicmetre at 25 °C after standardization with buffer solution at pH 4, 7 and 9 was used for pH. Thedissolved oxygen concentration of the water samples was determined with a Fischers digitaloxygen analyzer.
10p4

B.O. Offem and G.U. Ikpi: Knowl. Managt. Aquatic Ecosyst. (2012) 404, 10
> VEGETATION
Study of the vegetation was carried out by selecting three populations from the three reachesto represent different degrees of disturbances. All populations were vigorous and healthy in allsampling sites, when the study began in 2007. In each reach, random stations, 20 × 20 in eachwere mapped out and labeled markers placed within each quadrat and mapped with theplants. At intervals of 4–6 months, all plants, within a quadrat, were mapped and the followingfigures recorded for each seedling or established shoot status number damaged, presence orabsence of individuals and their zonation patterns were also noted.
> DATA TREATMENT AND ANALYSIS
The mean and standard deviation of each of the physico-chemical parameters werecalculated. Statistical comparision of data between and within zones were carried out usinganalysis of variance (anova) and line graphs using excel statistical package (2007). Tocalculate mean abundance, numbers in different samples were summed for each species andaveraged across all sampling sites. Physico-chemical parameters were correlated with theabundances of most common species using Pearson product moment correlation coefficientanalysis. Shannon-Wiener diversity function (H) was used to calculate heterogeneity for eachsite. Richness index was expressed using Margalef’s richness index.
d = (S – 1) / logN (Clarke and Warwick, 1994)
H´ = – (Krebs, 1978)
E = d/S (Zar, 1996).
E = equitability;d = Margalef’s richness index and H´ = Shannon-Wiener diversity function;S = total species number;Pi = proportion of each species in each sample;Relative abundance % = (n/N) × 100;n refers to the number of individuals of the species in the samples and N to the total numberof individuals of SPECIES.
RESULTS
> PLANKTON
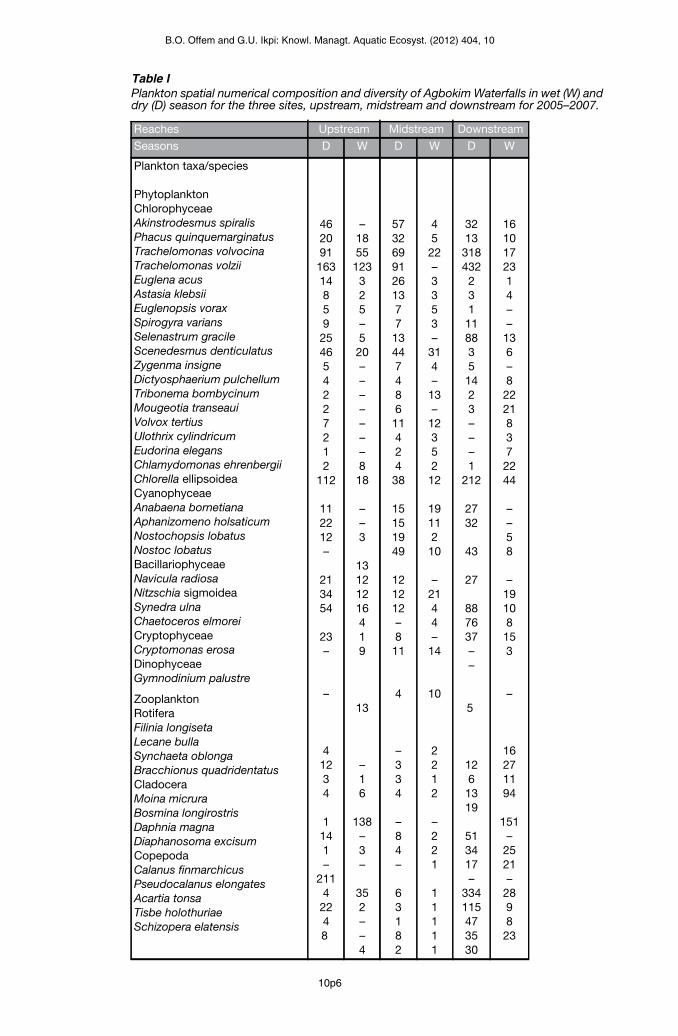
A total of 29 phytoplankton species sampled from five taxonomic groups; Chlorophyceae,Cyanophyceae, Bacillariophyceae, Cryptophyceae and Dinophyceae, representedphytoplankton community of the Agbokum waterfalls (Table I). Chlorophyceae was thedominant group and Trachelomonas volzii most abundant species within the group. The dryseason samples recorded higher values (718) of individual Trachelomonas volzii than the wet.Three major taxonomic forms of zooplankton; rotifer, cladocera and copepod, consisting of13 species were recorded. Copepoda (51) was dominant zooplankton with Calanusfinmarchicus as most abundant species in the dry season while dominant wet seasonzooplankton Moina micrura (256) represent 65% of total zooplankton. About 78.6% of totalphytoplankton and zooplankton was contributed from downstream populations while only10% from midstream.
> MACRO-FAUNAL COMPOSITION AND DISTRIBUTION
Macro-invertebrates communities collected from the waterfalls consist of nine major taxa and1878 individuals. Spatial distribution of the taxa and individuals recorded upstream,
Pi Ln Pii 1=
S
∑
10p5
B.O. Offem and G.U. Ikpi: Knowl. Managt. Aquatic Ecosyst. (2012) 404, 10
Table IPlankton spatial numerical composition and diversity of Agbokim Waterfalls in wet (W) anddry (D) season for the three sites, upstream, midstream and downstream for 2005–2007.
Reaches Upstream Midstream Downstream
Seasons D W D W D W
Plankton taxa/species
PhytoplanktonChlorophyceaeAkinstrodesmus spiralisPhacus quinquemarginatusTrachelomonas volvocinaTrachelomonas volziiEuglena acusAstasia klebsiiEuglenopsis voraxSpirogyra variansSelenastrum gracileScenedesmus denticulatusZygenma insigneDictyosphaerium pulchellumTribonema bombycinumMougeotia transeauiVolvox tertiusUlothrix cylindricumEudorina elegansChlamydomonas ehrenbergiiChlorella ellipsoideaCyanophyceaeAnabaena bornetianaAphanizomeno holsaticumNostochopsis lobatusNostoc lobatusBacillariophyceaeNavicula radiosaNitzschia sigmoideaSynedra ulnaChaetoceros elmoreiCryptophyceaeCryptomonas erosaDinophyceaeGymnodinium palustre
ZooplanktonRotiferaFilinia longisetaLecane bullaSynchaeta oblongaBracchionus quadridentatusCladoceraMoina micruraBosmina longirostrisDaphnia magnaDiaphanosoma excisumCopepodaCalanus finmarchicusPseudocalanus elongatesAcartia tonsaTisbe holothuriaeSchizopera elatensis
462091
16314859
254654227212
112
112212–
213454
23–
–
41234
1141–
2114
2248
–1855
123325–520–––––––818
––3
13121216419
13
–16
138–3–
352––4
57326991261377
13447486
11424
38
15151949
121212–8
11
4
–334
–84–
63182
45
22–3353–
314–
13–
12352
12
19112
10
–2144–
14
10
2212
–221
11111
3213
3184322311188351423–––1
212
2732
43
27
887637––
5
1261319
513417–
334115473530
1610172314––
136–8
2221837
2244
––58
–19108
153
–
16271194
151–
2521–
2898
23
10p6

B.O. Offem and G.U. Ikpi: Knowl. Managt. Aquatic Ecosyst. (2012) 404, 10
midstream and downstream reaches were 9 (413), 9 (113) and 9 (1346) respectively (Figure 2).Dipterans and nematodes were dominant groups representing 15.4 and 15.2 percentrespectively; decapods and annelids represent 14.7 and 13.5 percent respectively.Coleoptera was the least group (6.5%). About 71.7 percent of the total macro-invertebrateswere recorded from downstream reaches while only 6.3 percent were contributed bymidstream. Seasonal variation of the invertebrates in the different reaches showed that thedry season samples were significantly higher (1416) (p < 0.05) than the wet (462) (Figure 3).
> FISH FAUNA
A total of 548 fish representing 13 species from 5 families were sampled during the dry andwet seasons, with only one family being restricted to the wet season, which was of very raretaxa (Figure 4). The number of taxa, and relative proportion of each species present,upstream, midstream and downstream reaches are shown in Table II. Cichlidae, Clariidae andCyprinidae were the most abundant families accounting for 56.7% of the total catch. Tilapiazillii, Clarias gariepinus and Labeo coubie dominated overall catch constituting 45.5%. Amongthe three dominant species, two benthic fishes (L. coubie and C. gariepinus) showed inversedistributional patterns. Clariid fish (C. gariepinus) was most abundant downstream and leastrepresented, upstream. Cyprinid (L. coubie), on the other hand, dominated the upstreamreaches and scarce downstream. Five species were site specific because of the association
Figure 2Spatial changes in the total abundance (No.) of the dominant macro-fauna invertebrates.
Figure 3Seasonal changes in the total abundance (No.) of macro-fauna invetebrates.
10p7

B.O. Offem and G.U. Ikpi: Knowl. Managt. Aquatic Ecosyst. (2012) 404, 10
with the midstream portion of the river (L. senegalensis) and downstream reaches(A. occidentalis, H. longifilis, H. fasciatus and C. nigrodigitatus).
> VEGETATION
The dominant vegetation at the bank are of freshwater swamp type; Azolla africana, Nymphialotus, Commelina sp., Bambusa vulgaris, Dryopteris sp. and Salvia nymphellula. The fringingtrees are principally Raphia vinifera, Symphonia sp., Elaeis guinneesis, Havea brasiliensis,Bambusasp, Grewiasp and Cocos nucifera. The vegetation showed a distinct pattern inrespect of percentage cover of species present. Total numbers of species varied significantlybetween reaches, but all reaches displayed similar change. Bambusa sp., Symphonia andElaeis guineesis displayed progressive increase from upstream reaching a maximum of
Table IIRelative proportions of fish species for the three reaches (January 2006 to December, 2007).
Reaches Up-river Mid-river Down-river
Family/species Pi Pi Pi
CichlidaeOreochromis niloticus 0.042 0.038 0.004Tilapia zilli 0.110 0.238 0.098Hemichromis fasciatus 0.000 0.000 0.011Pelmatochromis guntheri 0.010 0.006 0.024
ClariidaeClarias anguillaris 0.031 0.005 0.057Clarias gariepinus 0.023 0.014 0.315Heterobranchus longifilis 0.000 0.000 0.111
BagridaeChrysichthys nigrodigitatus 0.000 0.000 0.013Auchenoglanis occidentalis 0.000 0.000 0.003Mochokidae:Synodontis clarias 0.015 0.004 0.018
CyprinidaeLabeo coubie 0.388 0.121 0.003Labeo senegalensis 0.000 0.044 0.000Barbus occidentalis 0.034 0.003 0.001
Figure 4Seasonal changes in the percentage fish catch.
10p8

B.O. Offem and G.U. Ikpi: Knowl. Managt. Aquatic Ecosyst. (2012) 404, 10
38.5 mean percent cover over the other species in the relatively undisturbed downstream. Incontrast, the population in the highly disturbed midstream showed much smaller percentagecover values (Figure 5).
> RICHNESS AND DIVERSITY INDICES
Changes in the plankton, flora and fauna assemblages of the Agbokum waterfalls ecosystemswere reflected in species richness and diversity. The Shannon-Weiner diversity index for thebiodata investigated showed significant difference between reaches, with downstreamreaches having highest values while midstream were least (Table III). Seasonal differentiation
Table IIIDiversity of macro and micro fauna and flora of Agbokum waterfalls during dry (D) and wet(W) seasons in the three sampling sites. r = richness index, d = Shannon weaner diversityindex.
Reaches Upstream Midstream Downstream
Seasons D W D W D W
Items Diversityindices
Phytoplankton r 52 12 12 9 153 17
d 0.55 0.28 0.03 0.03 0.69 0.28
Zooplankton r 29 16 7 12 79 49
d 0.12 0.28 0.16 0.05 0.63 0.16
Macro-invertebrates r 33 12 18 10 89 45
d 0.34 0.12 0.08 0.02 1.56 0.89
Fish species r 14 28 7 7 11 38
d 0.23 0.42 0.02 0.06 0.34 1.76
Vegetation r 26 49 8 12 45 78
d 0.12 0.42 0.02 0.04 0.54 1.55
Figure 5Percentage cover of the most common vegetation types in the three reaches of Agbokumwater falls.
10p9

B.O. Offem and G.U. Ikpi: Knowl. Managt. Aquatic Ecosyst. (2012) 404, 10
in the diversity indices and species richness revealed higher values for the wet seasonsamples of plankton, fish and vegetation than dry. On the other hand, dry season invertebratesamples showed higher richness index and diversity values. Throughout the year, samplesfrom the waterfalls region of the stream (midstream) exhibited very diversity and richnessvalues.
> PHYSICO-CHEMICAL CHARACTERISTICS
Water depth, water discharge, water velocity and dissolved oxygen vary significantly betweenreaches (p > 0.05) (Table IV). All biological species studied correlated negatively with waterdischarge and water velocity except the Cyprinids (Table V). On the other hand, all the speciescorrelated positively with dissolved oxygen apart from annelids and the marginal vegetation.
Table IVMean variation and F-values of the analysis of variance (ANOVA) of physico-chemicalparameters of water measured at three sampling sites. I: Upriver, II: Mid-river, III: Downriver.
Properties Upriver Midriver Downriver F-value ANOVA
Physicalconductivity (uS·cm–1) 36.6 ± 11.0 38.1 ± 11.5 25.3–58.2 0.77 p > 0.05
Water temperature (ºC) 28.0 ± 1.1 26.6 ± 1.2 27.2 ± 0.8 3.36 p > 0.05
Water depth (m) 1.4 ± 0.7 2.2 ± 0.5 4.8 ± 0.6 4.32 p > 0.05
Water discharge (m3·s–1) 156.71 ± 12 1496.46 ± 82 189.8 ± 13 5.8 p > 0.05
Water velocity (m·s–1) 1.94 ± 0.25 1.01 ± 0.3 0.5 ± 0.14 4.32 p > 0.05
Transparency (cm) 26.6 ± 13.9 29.5 ± 14 28.8 ± 13.4 1.56 p > 0.05
Chemical
Dissolved oxygen(mg·L–1)
6.6 ± 0.3 9.61 ± 0.2 4.34 ± 0.5 3.98 p > 0.05
pH 7.0 ± 0.2 7.0 ± 0.2 7.1 ± 0.2 1.43 p > 0.05
Table VResults of Pearson correlation analysis using physico-chemcal and biological parametersfrom Agbokum waterfalls.
Item Water depth Water discharge Water velocity Dissolved O2
ChlorophytesCyanophyceaeRotifersCladoceransCichlidsClariidsCyprinidsDecapodsAnnelidsAzollaNymphaCommelina
–0.675–0.766–0.492–0.5660.5860.8970.6750.4560.654–0.564–0.4440.398
–0.564–0.843–0.477–0.777–0.345–0.6570.768–0.543–0.254–0.671–0.876–0.432
–0.654–0.321–0.765–0.465–0.234–0.6540.876–0.287–0.432–0.654–0.324–0.487
0.6540.4350.7550.6650.7880.2340.8880.654–0.765–0.234–0.564–0.675
10p10

B.O. Offem and G.U. Ikpi: Knowl. Managt. Aquatic Ecosyst. (2012) 404, 10
DISCUSSION
> PHYTOPLANKTON
The phytoplankton composition in this study agreed with reports of Adebisi (1981) andAyodele and Ajani (1999) that blue-green algae and green algae dominate most tropicalAfrican waters. The dominance of Chlorophyceae in respect of species number andpopulation density in this study had also been observed elsewhere (Tressler et al., 1940;Willen, 1959; Vyverman, 1996, Silva, 2005) and the overwhelming presence in the dry season,attributed to the presence of bright sunshine and extensive catchment area, draining calciumrich agriculture land (Pennack, 1949; Kurasawa and Shiraishi, 1954; Lewis, 1996).Physiological and behavioural flexibility of Chlorophyceae can accommodate environmentalstresses better than most fast growing species (Silva, 2004). Second in prominence wasCyanophyceae, which had also been found to be prominent in Bulgaria (Stoyneva, 2003),Hungary (Padisak and Reynolds, 1998) and Sanabria Lake (Spain) (Hoyos and Comin, 1999).Cyanophyta dominance, and sometimes bloom are amongst the most visible symptoms ofORGANIC pollution (Moss et al., 1997), Toxic to living organisms and accelerated naturaleuthrophication (Stoyneva, 2003; Silva, 2005). The observation in the waterfalls is similar tofindings by Adeniyi (1978) that the abundance of phytoplankton increases with increase intransparency, which normally associated with black flood (dry season), while the high turbidityassociated with the white flood (wet season) results in a decrease in its abundance. Thewaterfalls region of the study area recorded least density of phytoplankton due to high level ofdisturbance caused by the impact of high water discharge on the environment. Re-suspension of particles often observed in this region leads to high water turbidity andtherefore low light penetration, low degree of algal sedimentation, and therefore reducedphytoplankton production. Benthic algal production is also hampered by the turbulence effectof water in this region constantly bringing to the top all materials at the bottom (Ewa-Obohoand Oladimeji, 2004). Planktons were moved swiftly from upstream with high flow velocity andwater turbulence to downstream with stable ecology, resulting in higher plankton diversity andabundance downstream.
> ZOOPLANKTON
The zooplankton population dominated by copepods and cladocerans had also beendocumented (Egborge, 1981). There may be alternation in abundance between crustaceansand rotifers as reflected in the distribution and abundance of zooplankton in the sampledparts of the river and seasons. The zooplankton forms respond similarly to disturbance inwater environment as phytoplankton. Low densities of all zooplankton species observed inthe middle reaches (waterfalls) could be due to high water discharge. Discharge rate isimportant both directly or indirectly, as it influence the environment by creating turbulence andhigh turbidity in this region (Nelson and Lieberman, 2002). Suspended particles have beenfound to hinder metabolism in copepods (Sharp et al., 1979) and turbulence prevent larvalforms from settling and developing to adult stages and hence die shortly beforemetamorphosis (Edung, 2001).This study showed that the seasonal variation in zooplankton concentration could largely bedue to the rotifers which normally constitute major diet items of larger zooplankton during thedry season (Ewa-Oboho and Oladimeji, 2004). Species of rotifers and crustaceans consideredgood indicators of the trophic state of the water bodies were identified in the zooplanktoncommunity. Dominant rotifers species of Filinia longiseta, Bracchionus quadridentatus andSynchaeta oblonga and crustacean zooplankton community populated mainly by copepodsand cladocerans, as a result of increase in cyclopoid copepodids and mesocyclops, areindicative of good water quality (Sendacz et al., 1985). This showed that the organic pollutionin the waterfalls, as reflected in cynophyceae dominance, had not reached toxic level.Temperature and the availability of food are about the most important factors controlling the
10p11
B.O. Offem and G.U. Ikpi: Knowl. Managt. Aquatic Ecosyst. (2012) 404, 10
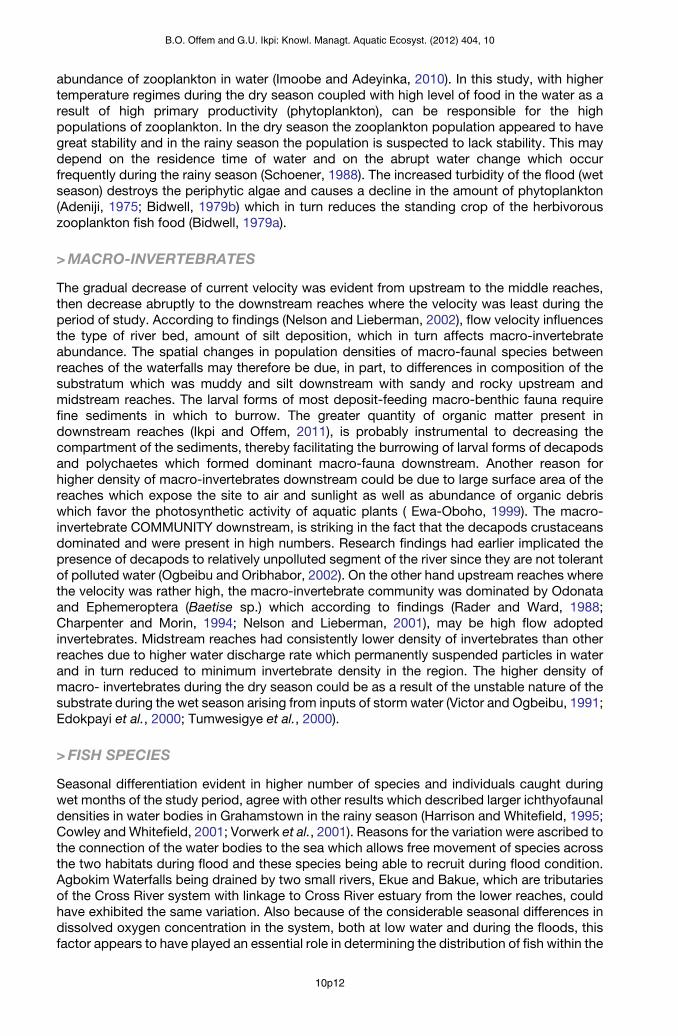
abundance of zooplankton in water (Imoobe and Adeyinka, 2010). In this study, with highertemperature regimes during the dry season coupled with high level of food in the water as aresult of high primary productivity (phytoplankton), can be responsible for the highpopulations of zooplankton. In the dry season the zooplankton population appeared to havegreat stability and in the rainy season the population is suspected to lack stability. This maydepend on the residence time of water and on the abrupt water change which occurfrequently during the rainy season (Schoener, 1988). The increased turbidity of the flood (wetseason) destroys the periphytic algae and causes a decline in the amount of phytoplankton(Adeniji, 1975; Bidwell, 1979b) which in turn reduces the standing crop of the herbivorouszooplankton fish food (Bidwell, 1979a).
> MACRO-INVERTEBRATES
The gradual decrease of current velocity was evident from upstream to the middle reaches,then decrease abruptly to the downstream reaches where the velocity was least during theperiod of study. According to findings (Nelson and Lieberman, 2002), flow velocity influencesthe type of river bed, amount of silt deposition, which in turn affects macro-invertebrateabundance. The spatial changes in population densities of macro-faunal species betweenreaches of the waterfalls may therefore be due, in part, to differences in composition of thesubstratum which was muddy and silt downstream with sandy and rocky upstream andmidstream reaches. The larval forms of most deposit-feeding macro-benthic fauna requirefine sediments in which to burrow. The greater quantity of organic matter present indownstream reaches (Ikpi and Offem, 2011), is probably instrumental to decreasing thecompartment of the sediments, thereby facilitating the burrowing of larval forms of decapodsand polychaetes which formed dominant macro-fauna downstream. Another reason forhigher density of macro-invertebrates downstream could be due to large surface area of thereaches which expose the site to air and sunlight as well as abundance of organic debriswhich favor the photosynthetic activity of aquatic plants ( Ewa-Oboho, 1999). The macro-invertebrate COMMUNITY downstream, is striking in the fact that the decapods crustaceansdominated and were present in high numbers. Research findings had earlier implicated thepresence of decapods to relatively unpolluted segment of the river since they are not tolerantof polluted water (Ogbeibu and Oribhabor, 2002). On the other hand upstream reaches wherethe velocity was rather high, the macro-invertebrate community was dominated by Odonataand Ephemeroptera (Baetise sp.) which according to findings (Rader and Ward, 1988;Charpenter and Morin, 1994; Nelson and Lieberman, 2001), may be high flow adoptedinvertebrates. Midstream reaches had consistently lower density of invertebrates than otherreaches due to higher water discharge rate which permanently suspended particles in waterand in turn reduced to minimum invertebrate density in the region. The higher density ofmacro- invertebrates during the dry season could be as a result of the unstable nature of thesubstrate during the wet season arising from inputs of storm water (Victor and Ogbeibu, 1991;Edokpayi et al., 2000; Tumwesigye et al., 2000).
> FISH SPECIES
Seasonal differentiation evident in higher number of species and individuals caught duringwet months of the study period, agree with other results which described larger ichthyofaunaldensities in water bodies in Grahamstown in the rainy season (Harrison and Whitefield, 1995;Cowley and Whitefield, 2001; Vorwerk et al., 2001). Reasons for the variation were ascribed tothe connection of the water bodies to the sea which allows free movement of species acrossthe two habitats during flood and these species being able to recruit during flood condition.Agbokim Waterfalls being drained by two small rivers, Ekue and Bakue, which are tributariesof the Cross River system with linkage to Cross River estuary from the lower reaches, couldhave exhibited the same variation. Also because of the considerable seasonal differences indissolved oxygen concentration in the system, both at low water and during the floods, thisfactor appears to have played an essential role in determining the distribution of fish within the
10p12

B.O. Offem and G.U. Ikpi: Knowl. Managt. Aquatic Ecosyst. (2012) 404, 10
system. In general the more active the species the more it tends to avoid de-oxygenated areas(Welcome, 2003). Most species encountered downstream during dry season have adaptationfor survival in low dissolved oxygen conditions like presence of external gills (Clarias,Heterobranchus). These species form a group that is well adapted to swamps life and tend toconcentrate in the more de-oxygenated small pools and swamps of the floodplain during lowwater, when other more active species like Tilapia and carp are to be found in the mid-stream(WATERFALL) and upstream respectively.Although on a community basis the three reaches did not separate out, some species whenanalysed individually revealed specific range preferences. Two heterologous species betweentwo genera, C. gariepinus and L. coubie, the two most common and economically viablebenthic fishes found in this study, demonstrated opposite habitat preference, withC. gariepinus dominating the lower reach and L. coubie more abundant in the upper reach.This opposing habitat preference and the attendant ecological and trophic heterogeneityreduce competition, and may be responsible for the overwhelming success of the two speciesin the Agbokum waterfalls. The relatively higher number of C. gariepinus in the lower reachduring this study may be due to the fact that being mud-dwelling species, most individualsfound their natural habitat downstream. The common carp, L. coubie adapted to live inshallow rocky bottom, assemble in the rocky upstream. Another dominant freshwater species(T. zilli) demonstrated great preference to the turbulent well aerated midstream reaches. Thisdistributional trend, in a similar study (Whitfield and Blaber, 1979) was attributed to severalfactors including fast water current, suitable breeding area, marginal vegetation and theabsence of competitors and piscivorous predators.
> VEGETATION
Quantitative difference in numerical abundance of vegetation types between reaches, in thisstudy, implies variation in control on a very local scale (Faroque, 1989). In the present study,experimental field study had been used to assess the impact of waterfall disturbance onmarginal vegetation population in the different reaches of the waterfalls. The assessment ofthe plant size was difficult because individuals vary greatly in the proportion of their stem.Although there was general deterioration in the numerical abundance in the middle reaches ofthe waterfalls, Azolla africana, and probably Nymphia lotus and Commelina sp. were endemicforming permanent marginal vegetation along all stretches of the midstream. The distributionpattern and composition of the vegetation change in a non-random way during the studyperiod with Raphia vinifera, Havea brasiliensis, Grewia sp. and Cocos nucifera shrinking in sizefrom 34% to 8% at the midstream stretches of the river while the nymphia- rich vegetationbecomes more frequent than expected. Nymphia has become a biological invader and hasexhibited a full range of impact and abundance in this disturbed midstream reaches.
> DIVERSITY
Shannon Weaner diversity function for samples of phytoplankton, zooplankton and macro-invertebrates studied, reveal that dry season samples of these species were more diversifiedand stable. On the other hand fish and vegetation appear to be more stable during the wetseason considering the higher richness and diversity during this period. However,communities in the waterfall region (midstream) of the river may be unstable throughout theyear as reflected in their low values of richness and diversity during both seasons. If theintegrity of such waterfalls in the tropics are protected, they will support growth and survivalof organisms, throughout the year.
> PHYSICO-CHEMICAL PROPERTIES
The distribution and abundance of macro-invertebrates, as the results show, were affected bythe physico-chemistry of the waterfalls, such as dissolved oxygen, water velocity, waterdischarge and water depth. Pearson’s correlation analysis showed that some of these
10p13

B.O. Offem and G.U. Ikpi: Knowl. Managt. Aquatic Ecosyst. (2012) 404, 10
parameters correlated positively with species of Chlorophytes, Cyanophyceae, rotifers,cladocerans, cichlids, clariids, cyprinids, decapods and negatively with annelids, azolla,Nympha and Commelina. The high correlation that occurred between these groups oforganisms and dissolved oxygen suggest that oxygen is the most influencial factor thatcontrols the distribution and abundance of organisms as reported by Barnett (1983) and Oke(1990).
CONCLUSION
The watfalls reaches are not completely lifeless as assumed by many researchers in Africa,but harbor some turbulent tolerant macro-biota. Among the plankton community, waterfallscontributed significant percentage of Trachelomonas sp., Scenedesmus denticulatus,Chlorella ellipsoidea and Nostoc lobatus. Labeo coubie and Tilapia zilli were the fish speciesthat were most abundant in the waterfall region. Nymphia vegetation has become a biologicalinvader and has exhibited a full range of impact and abundance in this disturbed midstreamreaches. Waterfalls can also be important for fisheries and biodiversity conservation, as richbiome for indigenous and exotic species which are swept upstream and over the waterfalls,settle downstream in a more stable environment. The disturbance regimes of the midstreamreaches of Agbokum waterfalls combined with its very low faunal and floral diversity has madethe environment unstable therefore susceptible to the invasion of disturbance tolerant biota.
ACKNOWLEDGEMENT
The authors wish to thank the Management of Cross River University of Technology for thefinancial support and the use of the laboratory facilities. We also thank the ViceChancellorProf. Enebong E. Enebong and management of the University for the encouragement.
REFERENCES
Adebisi A.A., 1981. The physico-chemical hydrology of tropical seasonal river-Upper Ogun River.Hydrobiologia, 79,157–168.
Adeniji H.A.,1975. Limnology and biological production in the pelagic zone of Jebba Lake, Nigeria, Ph.D.thesis, Univ. of Ibadan, 234 p.
Adeniji H.A., 1979. Seasonal variation in the pelagic primary productivity of the Kainji Lake and the RiverNiger below the Dam, Kainji Lake Annual Report, 79, 23–34.
Adeniyi H.A., 1978. Preliminary studies of fisheries limnology of Bakolori Lake, Nigeria, Report presentedto Sokoto Rima River Basin Development Authority, 19 p.
Ajani E.K., 2001. Effects of biotic and abiotic components of the habitat on fish productivity in LagosLagoon, Nigeria. Ph.D. thesis, University of Ibadan, 277 p.
APHA, 1987. American Public Health Association: Standard methods for the examination of water andwaste water Washington DC, 1076 p.
Ayodele I.A. and Ajani E.K., 1999. Essentials of fish farming (aquaculture), Odufuwa Publishers, Ibadan.Barnett B.E.,1983. Oligochaetes as indicators of pollution in the Humber with special reference to
Turbicoides. Int. J. Environ., 34, 12–45.Bidwell A., 1979a. The effect of water level fluctuation on the biology of Lake Kainji, Nigeria. The Nigerian
Field, 41, 156–165.Bidwell A., 1979b. Observation on the biology of the nymphs of Povilla adusta (Ephemeroptera) in Lake
Kainji. Hydrobiologia, 67, 1022–1085.Brown J.H., 1984. On the relationship between abundance and distribution of species. Am. Nat., 124,
225–279.Charpenter B. and Morin A., 1994. Effect of current velocity on the ingestion rate of blackfly. Can. J. Fish.
Aquat. Sci., 51, 1615–1618.
10p14

B.O. Offem and G.U. Ikpi: Knowl. Managt. Aquatic Ecosyst. (2012) 404, 10
Chernicoff S., Fox H. and Venkatakrishnan R., 1997. Essentials of Geology, Worth Publishers, New York,21–217.
Chester T., Strong J. and Ayers P., 1999. SGM: The Waterfalls, Assessed fromhttp.//tchester.org/sgm/lists/waterfalls.html on the 22nd of February, 2006.
Clarke K.R. and Warwick R.M., 1994. Change in Marine communities: An Approach to Statisticalanalysis and interpretation, Natural Environmental Reseach Council, Bournemouth, 231–235.
Cowley P.D. and Whitefield A.K., 2001. Ichthyofaunal characteristics of a typical temporarilyopen/closed estuary in the south-east coast of South Africa. Ichthyology, 71, 1–19.
Durand J.R. and Leveque C., 1980. Flora et Fauna aquatiques de L. Afrique, SaleloSoundanienne,Tomes I and ORSTROM.
Edmonton W.T., 1959. Freshwater biology, 2nd edition, John Wiley and Sons, New York, 1248 p.Edokpayi C.A., Okenyi J.C., Ogbeigu A.E. and Osemen E.C., 2000. The effects of human activities on
the macrobenthic invertebrates of Ibekuma stream, Ekpoma. Nigeria. Biosci. Res., 12, 79–83.Edung S., 2001. Dynamics in the epibenthic larvae in relation to minor petroleum spill in the Cross River
Estuary, M. Sci. thesis, Universty of Calabar, Nigeria, 45 p.Egborge A.B., 1981. Biodiversity and chemistry of Warri River, Ben Miller, Warri, Nigeria, 23–45.Elvira M., 1987. Taxonomic revision of the Genus Chondrostoma (Agassi, 1835) (Pisces: Cyprinidae).
Cybium, 11, 111–198.Erkakan F., Nalbant T.T. and Ozeren S.C., 2007. Seven new species of Barbatula three new species of
Schistura and a new species of Seminemacheilus (Ortariophysi: Balitoridae: Nemachellinae) fromTurkey. Journal of Fisheries International, 2, 69–85.
Ewa-Oboho I.O., 1999. Seasonal variation and community structure of epibenthic algae on the roots ofmangrove Rhizophora mangle at a shallow tropical estuary. J. Trop. Ecol., 34, 160–167.
Ewa-Oboho I.O. and Oladimeji S., 2004. Benthic – pelagic production in the mouth Cross River Estuary.Tropical J. Appl. Ecol., 41, 162–176.
Faroque S., 1989. Riverine angiosperm of West Africa. J. Trop. Ecol., 32, 167–171.Fischer G. and Harris M., 2003. Waterfalls of Ontario. Waterfallogy 101, retrieved from
http.//www.startica/user/mharris/waterfallogy.htm/ on the 17/01/06.Fischer W., Schneider M. and Bauchot M.L., 1987. MediterraneeetMer Noire Zone De Peche 37 Revision
Volumn II Vertebrates FAO Rome, 763–1578.Harrison T.D. and Whitefield A.K., 1995. Fish community structure in three temporarily open/closed
estuaries of the Natal coast. Ichthyology, 64, 1–58.Hawking J.H., 2000. A prelimnary guide to keys and zoological information to identify invertebrates from
Australian inland waters, In: Darling M. (ed.), Freshwater Research Australia, 2 p.Hoyos C. and Comin F.A., 1999. The importance of inter-annual variability for management.
Hydrobiologia, 395/396, 281–291.Ikpi G.U. and Offem B.O., 2011. Fish fauna of Agbokum waterfalls in South-eastern Nigeria. Journal of
Asian Scientific Research, 1, 299–307.Imoobe T.O.T. and Adeyinka T.O., 2010. Crustaceans of Jamieson River, Nigeria. Ph.D. thesis of the
University of Benin, Benin, Nigeria.Jeje C.Y. and Fernando C.H., 1985. A practical guide to the identification of Nigerian zooplankton, Kainji
Lake Research Institute, New Bussa, 1–73.Karlman S.G., 1982. The annual flood regime as a regulatory mechanism for phytoplankton
production in Kainji Lake, Nigeria. Hydrobiologia, 86, 93–98.Kellog L.L., 1994. Save our streams. Monitor’s guide to aquatic macroinvertebrates, Izaac Walton
League of America Gaithersburg Maryland, 60 p.Krebs C.J., 1978. Ecology: The experimental analysis of distribution and abundance, Harper intellectual
edition, New York, 12–35.Krinitskii L., 1972. Protected Areas in the worlds industrially advanced regions: importance, progress
and problems, Second World Conference on National Parks, 5–18.Kurasawa H. and Shiraishi Y., 1954. Studies on the biological production of Lake Suwa, Research
Institute of Natural Resources, 22–57.Lewis W.M., 1996. Tropical lakes, How attitude makes a difference. In: Schiemer F. and Boland K.T.
(eds.), Perspective in Tropical Limnology, SPB Academic Publishing, Amsterdam.Lenat D.R., Penrose D.L. and Eaglesor A.W., 1981. Variable effects of sediment addition on stream
benthos. Hydrobiologia, 79, 187–197.Nelson S.M. and Lieberman D.M., 2002. The influence of flow and other environmental factors on
benthic invertebrates in the Sacramento River, USA. Hydrobiologia, 489, 117–120.
10p15

B.O. Offem and G.U. Ikpi: Knowl. Managt. Aquatic Ecosyst. (2012) 404, 10
Offem B.O., Akegbejo-Samsons Y., OmoniyiI T. and Ikpi G.U., 2008. Dynamics of the limnologicalfeatures and diversity of zooplankton populations of the Cross River System SE Nigeria.Knowl. Managt. Aquatic Ecosyst., 393, 2–19.
Ogbeibu A.E. and Oribhabor B.J., 2002. Ecological impact of River impoundment, using macro-invertebrates as indicators. Water Res., 36, 2427–2434.
Oke O.O., 1990. Limnology and macrobenthos of Owena reservoir, Ph.D. Thesis, University ofIbadan, Ibadan, Nigeria, 23 p.
Padisak J. and Reynolds C.S., 1998. Selection of phytoplankton associations in Lake Balaton,Hungary in response to eutrophication and restoration measures, with special reference to theCyanoprokaryotes. Hydrobiologia, 384, 46–56.
Pennack R.W., 1949. The dynamics of fresh-water populations. Ecol. Monogr., 16, 342–366.Prescott G.W., 1982. Algae of the West Great Lakes Area, W.M.C. Brown Company Publishers,
Dubugue Press, Towa, 200–300.Rader R.B. and Ward J.B., 1988. Influence on regulation of environmental condition and the
macroinvertebrate communities in the Upper Colorado River. Regul. Rivers Res. Manage., 2,597–599.
Schlosser I.J., 1987. A conceptual framework for fish communities in small warmwater streams. Incommunity and evolutionary ecology of North American stream fishes. In: Mathews W.J., HeinsD.C. (eds.), University of Oklahoma Press, Norman, Oklahoma, 17–28.
Schoener T.W., 1988. Ecologicalinteractions. In: Myer R.R. and Giller P.S. (eds.), Chapman and Hall,London, 255– 299.
Sendacz S., Kubo E. and Cestarolli M.A., 1985. Limnologia de reservatios do estado do Sao Paulo,Brasil. VIII zooplankton, 145–176.
Sharma O.P., 1986. Text book of algae, TATA McGrawhill Publishing Comp. Ltd., New Delhi, 396 p.Silva E.I.L., 2004. Phytoplankton Characteristics, Trophic Evolution and Nutrient Dynamics inan Urban
Eutrophic Lake: Kandy Lake in Sri Lanka. In: Reddy M.V. (ed.), Restoration and Management ofTropical Eutrophic Lakes, Oxford and IBH Publishing, New Delhi, 123 p.
Silva E.I.L., 2005. Ecology of phytoplankton in tropical waters: introduction to the topic andecosystem changes from Sri Lanka. Pollution, 4, 25–35.
Stoyneva M.P., 2003. Steady-state phytoplankton assemblage in shallow Bulgarian wetlands.Hydrobiologia, 502, 169–177.
Sugunan V.V., 2000. Ecology and fishery management of reservoirs in India. Hydrobiologia, 430,121–147.
Teugels G.G., 1982. Prelimnary results of morphological study of five African species of the subgenusClarias ( Pisces: Clariidae). J. Nat. Hist., 16, 439– 553.
Teugels G.G., Reid M. and King R.P., 1992 Fishes of the Cross River Basin. Taxonomy, Zoogeography,ecology and conservation. Annales Musée Royal d’Afrique Centrale, 266, 1–32.
Tokeshi M. and Schmid P.E., 2002. Niche division and abundance: an evolutionary perspective. Popul.Ecol., 44, 189–200.
Tressler W.L., Tiffany L.H. and Spencer W.P., 1940. Limnological studies of Buckeye Lake Ohio. J. Sci.,40, 261–266.
Tumwesigwe C., Yusuf S.K. and Makanga B., 2000. Structure and composition of macro-invertebratesof a tropical forest stream. Western Uganda African Journal of Ecology, 38, 72–76.
Turner J.L., 1970. The fish population of impounded Kainji Lake, FAO Technical Report, No. 1, 1–59.UNESCO, 1978. Phytoplankton Mannual, UNESCO, Paris, 337 p.Victor R. and Ogbeibu A.E., 1991. Macro-invertebrates communities in the erosional biotope of an urban
stream in Nigeria. Tropical Zoology, 4, 1–12.Vorwerk P.D., Whitefield A.K., Cowley P.D. and Paterson A.W., 2001. A survey of Eastern Cape
estuaries with particular reference to the ichthyofuana. Ichthyology, 72, 1–18.Vyverman W., 1996. The Indo-Malaysian North-Australian phycogeographical region revised.
Hydrobiologia, 118, 107–120.Welcome R.L., 2003. River fisheries in Africa. The relationship to flow regimes. NAGA, 26, 23–25.Whitfield A.K. and Blaber S.J.M., 1979. The distribution of freshwater cichlids Sarotherodon
massambicus in estuarine systems. Environ Biol. Fishes, 4, 77– 81.Willen T., 1959. The phytoplankton Gordon, A bay of Lake Maleren. OIKOS, 10, 241–274.Zar J.H., 1996. Biostatistical Analysis, Pretice-Hall International, London, 45–48.
10p16