distributed water technologies countries
TRANSCRIPT

09‐Oct‐21
1
LDK Consultants Global EEIG
This Project is funded
by the European Union
Distributed water technologies in arid countries: options for decentralised water re‐use and
groundwater recharge
WES Regional Workshop
11th October 2021, Athens, Greece
Presented by: Prof. Christos Makropoulos,
National Technical University of Athens (NTUA)
What are the main pressures resulting in water scarcity?
Population growthRapid urbanizationFinancial crisisClimate variability
Water scarcityWater availability decreaseWater quality degradationDemand‐Supply imbalance
2
1
2
09‐Oct‐21
2
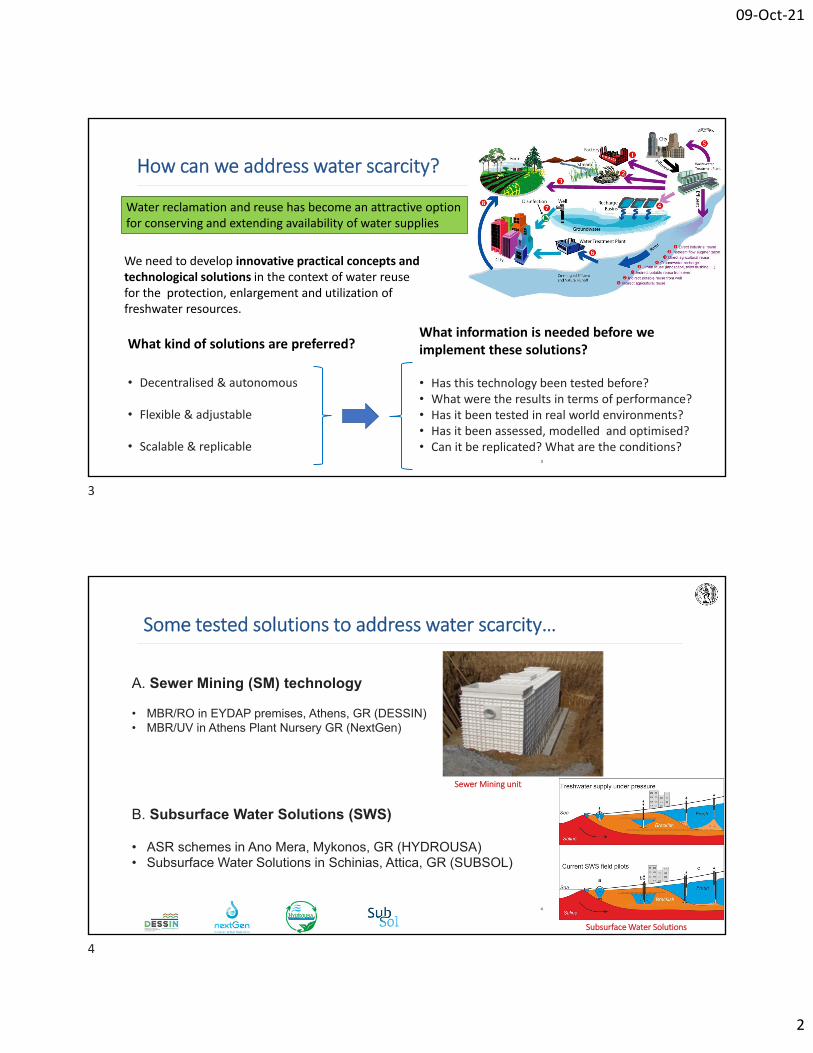
How can we address water scarcity?
Water reclamation and reuse has become an attractive option for conserving and extending availability of water supplies
We need to develop innovative practical concepts and technological solutions in the context of water reuse for the protection, enlargement and utilization of freshwater resources.
What kind of solutions are preferred?
• Decentralised & autonomous
• Flexible & adjustable
• Scalable & replicable
• Has this technology been tested before?• What were the results in terms of performance?• Has it been tested in real world environments?• Has it been assessed, modelled and optimised?• Can it be replicated? What are the conditions?
3
What information is needed before we implement these solutions?
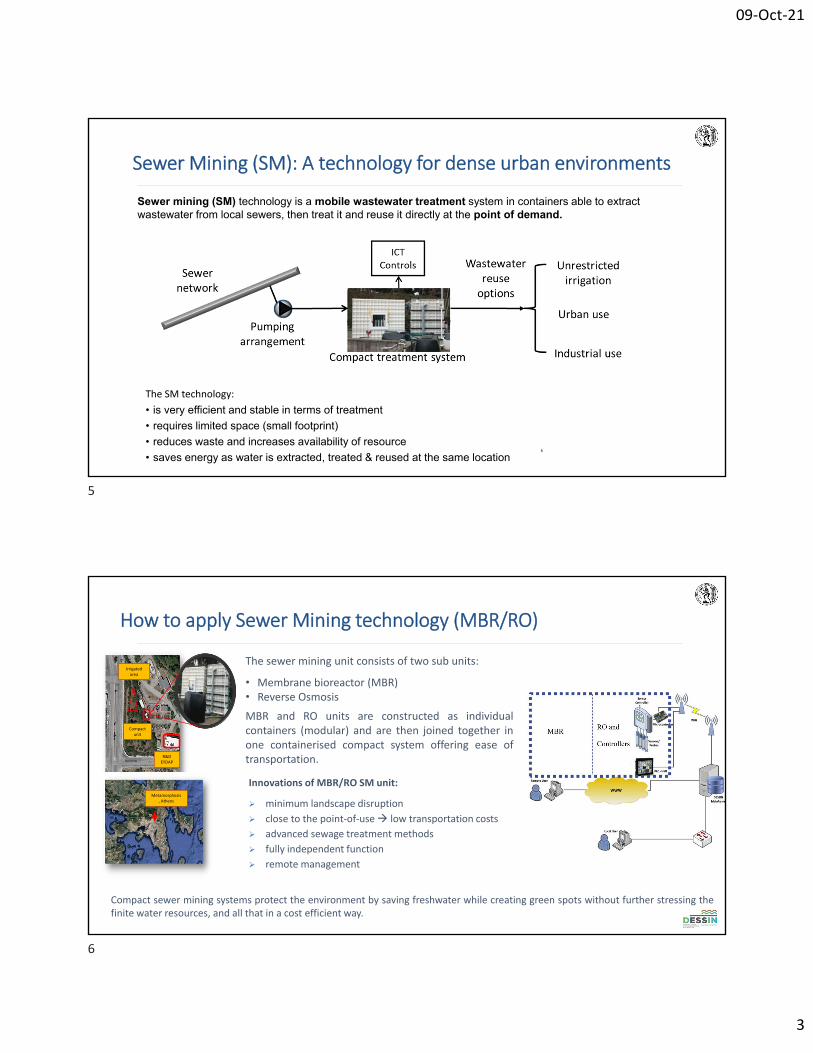
Some tested solutions to address water scarcity…
B. Subsurface Water Solutions (SWS)
• ASR schemes in Ano Mera, Mykonos, GR (HYDROUSA)• Subsurface Water Solutions in Schinias, Attica, GR (SUBSOL)
Α. Sewer Mining (SM) technology
• MBR/RO in EYDAP premises, Athens, GR (DESSIN) • MBR/UV in Athens Plant Nursery GR (NextGen)
4
Sewer Mining unit
Subsurface Water Solutions
3
4
09‐Oct‐21
3
Sewer Mining (SM): A technology for dense urban environments
Sewer mining (SM) technology is a mobile wastewater treatment system in containers able to extract wastewater from local sewers, then treat it and reuse it directly at the point of demand.
The SM technology:
• is very efficient and stable in terms of treatment
• requires limited space (small footprint)
• reduces waste and increases availability of resource
• saves energy as water is extracted, treated & reused at the same location5
Innovations of MBR/RO SM unit:
minimum landscape disruption
close to the point‐of‐use low transportation costs
advanced sewage treatment methods
fully independent function
remote management
Compact unit
R&D EYDAP
Irrigated area
Metamorphosis , Athens
Compact sewer mining systems protect the environment by saving freshwater while creating green spots without further stressing thefinite water resources, and all that in a cost efficient way.
How to apply Sewer Mining technology (MBR/RO)
The sewer mining unit consists of two sub units:
• Membrane bioreactor (ΜΒR)• Reverse Osmosis
MBR and RO units are constructed as individualcontainers (modular) and are then joined together inone containerised compact system offering ease oftransportation.
5
6
09‐Oct‐21
4
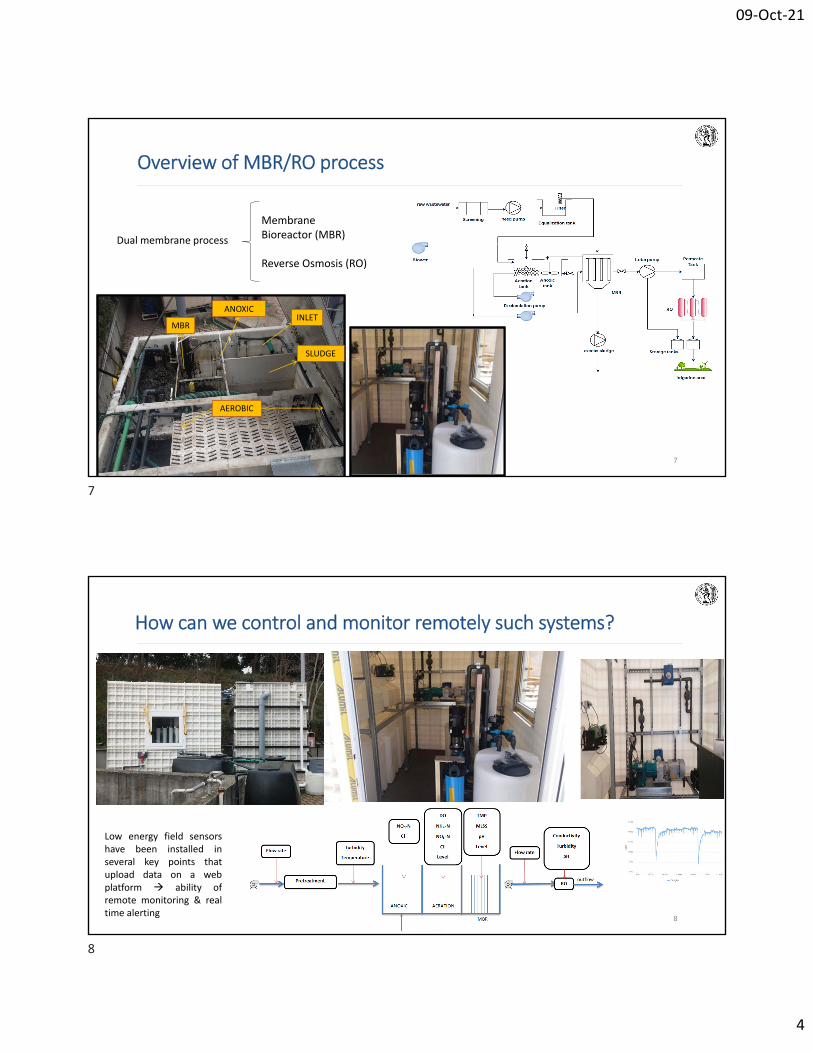
Dual membrane process
7
Membrane Bioreactor (MBR)
Reverse Osmosis (RO)
INLETMBR
ANOXIC
SLUDGE
AEROBIC
Overview of MBR/RO process
How can we control and monitor remotely such systems?
Low energy field sensorshave been installed inseveral key points thatupload data on a webplatform ability ofremote monitoring & realtime alerting
8
7
8
09‐Oct‐21
5
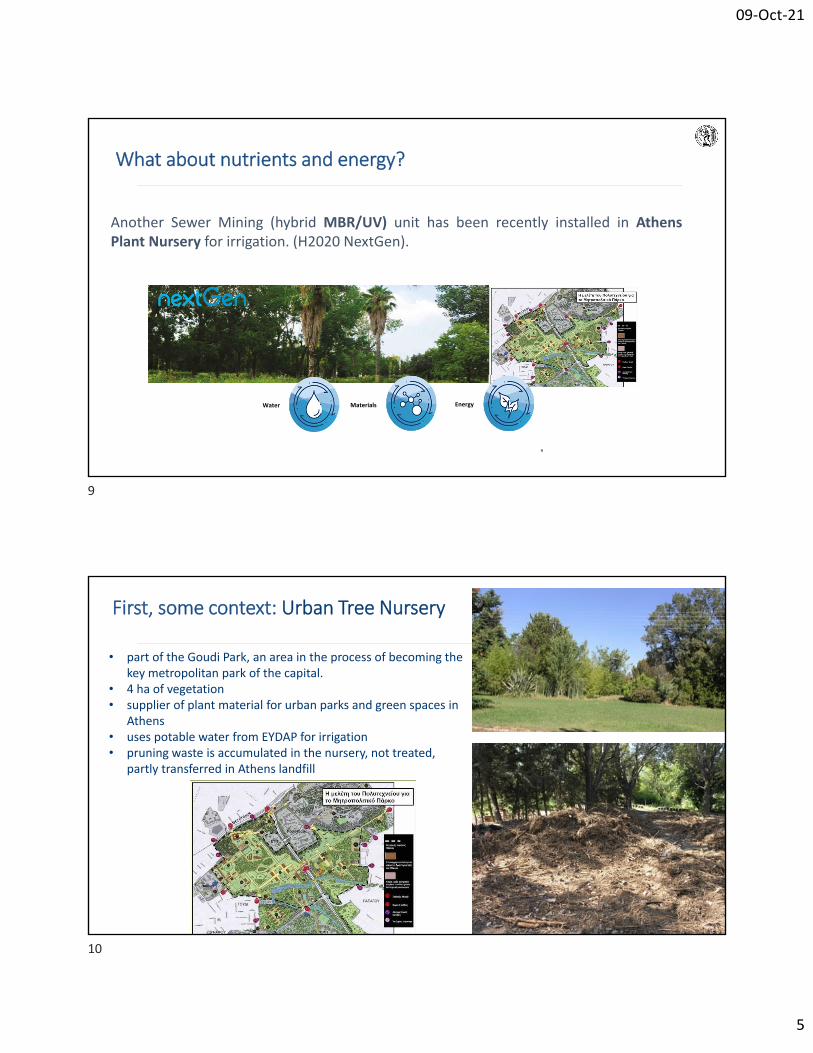
Water Materials Energy
What about nutrients and energy?
9
Another Sewer Mining (hybrid MBR/UV) unit has been recently installed in AthensPlant Nursery for irrigation. (H2020 NextGen).
• part of the Goudi Park, an area in the process of becoming the key metropolitan park of the capital.
• 4 ha of vegetation• supplier of plant material for urban parks and green spaces in
Athens • uses potable water from EYDAP for irrigation • pruning waste is accumulated in the nursery, not treated,
partly transferred in Athens landfill
First, some context: Urban Tree Nursery
9
10

09‐Oct‐21
6
Before we started resource consumption on site was linear
Solving 3 problems, or one?
11
12
09‐Oct‐21
7
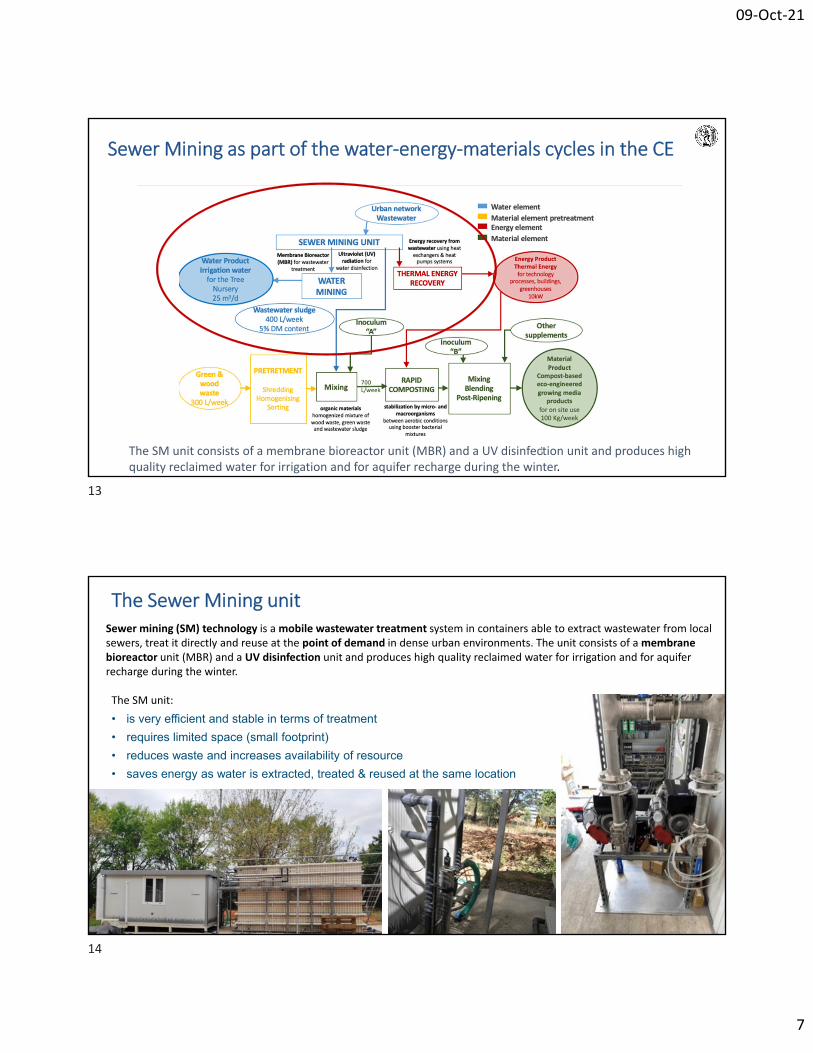
Sewer Mining as part of the water‐energy‐materials cycles in the CE
13The SM unit consists of a membrane bioreactor unit (MBR) and a UV disinfection unit and produces high
quality reclaimed water for irrigation and for aquifer recharge during the winter.
The Sewer Mining unit
The SM unit:
• is very efficient and stable in terms of treatment
• requires limited space (small footprint)
• reduces waste and increases availability of resource
• saves energy as water is extracted, treated & reused at the same location
Sewer mining (SM) technology is a mobile wastewater treatment system in containers able to extract wastewater from local sewers, treat it directly and reuse at the point of demand in dense urban environments. The unit consists of a membrane bioreactor unit (MBR) and a UV disinfection unit and produces high quality reclaimed water for irrigation and for aquifer recharge during the winter.
13
14
09‐Oct‐21
8
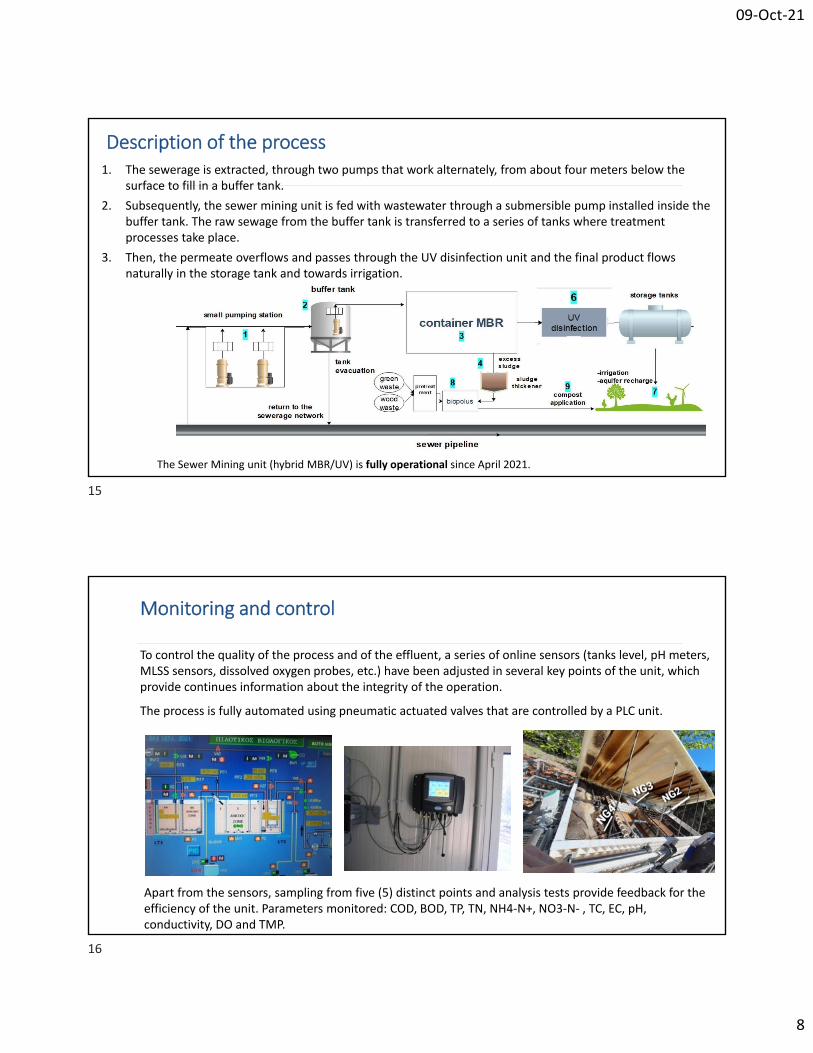
Description of the process
The Sewer Mining unit (hybrid MBR/UV) is fully operational since April 2021.
1. The sewerage is extracted, through two pumps that work alternately, from about four meters below the surface to fill in a buffer tank.
2. Subsequently, the sewer mining unit is fed with wastewater through a submersible pump installed inside the buffer tank. The raw sewage from the buffer tank is transferred to a series of tanks where treatment processes take place.
3. Then, the permeate overflows and passes through the UV disinfection unit and the final product flows naturally in the storage tank and towards irrigation.
Monitoring and control
To control the quality of the process and of the effluent, a series of online sensors (tanks level, pH meters, MLSS sensors, dissolved oxygen probes, etc.) have been adjusted in several key points of the unit, which provide continues information about the integrity of the operation.
The process is fully automated using pneumatic actuated valves that are controlled by a PLC unit.
Apart from the sensors, sampling from five (5) distinct points and analysis tests provide feedback for the efficiency of the unit. Parameters monitored: COD, BOD, TP, TN, NH4‐N+, NO3‐N‐ , TC, EC, pH, conductivity, DO and TMP.
15
16
09‐Oct‐21
9
15
Pumping station
Το extract the wastewater from the sewer a custom pumping station has been
constructed and installed in the site. Initial tests with clean water have taken place
to test
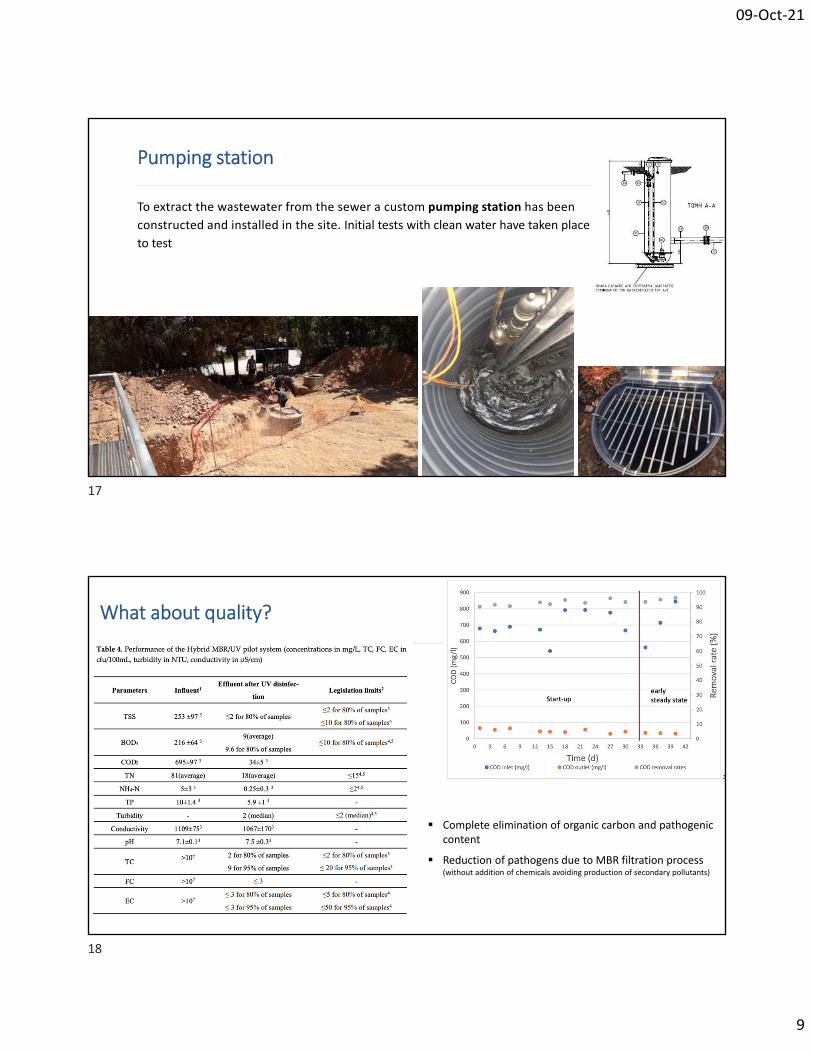
What about quality?
Complete elimination of organic carbon and pathogenic content
Reduction of pathogens due to MBR filtration process (without addition of chemicals avoiding production of secondary pollutants)
17
18

09‐Oct‐21
10
In total the system presented very satisfactory operational stability and great performance.
What about disinfection?
UV disinfection unit showed great performance
17
Rapid Composting
The rapid composting technology uses excess sludge produced from the SM unit and green/wood waste from the pruning to produce an on‐site fertilizer to be applied on the place of demand (Nursery).
• the excess sludge produced from the SM unit is dewatered through filter bags to a dry solids content of approximately 5%.
• the wood and green waste is shredded, homogenised and sorted through specific sieve to a fraction of about 2-5 mm.
19
20
09‐Oct‐21
11
17
Monitoring, Control & other elements
Optimum oxygen concentration, temperature, humidity and mixing intensity are monitored by sensors and microprocessor.
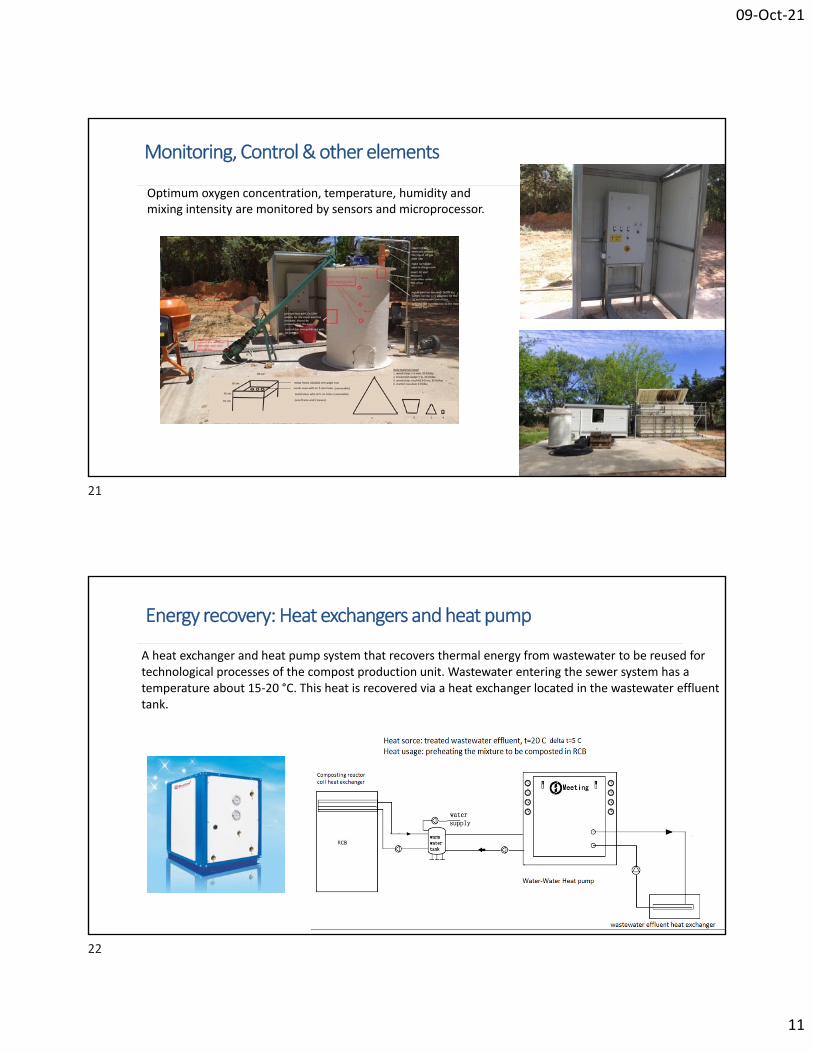
Energy recovery: Heat exchangers and heat pump
A heat exchanger and heat pump system that recovers thermal energy from wastewater to be reused for technological processes of the compost production unit. Wastewater entering the sewer system has a temperature about 15‐20 °C. This heat is recovered via a heat exchanger located in the wastewater effluent tank.
21
22
09‐Oct‐21
12
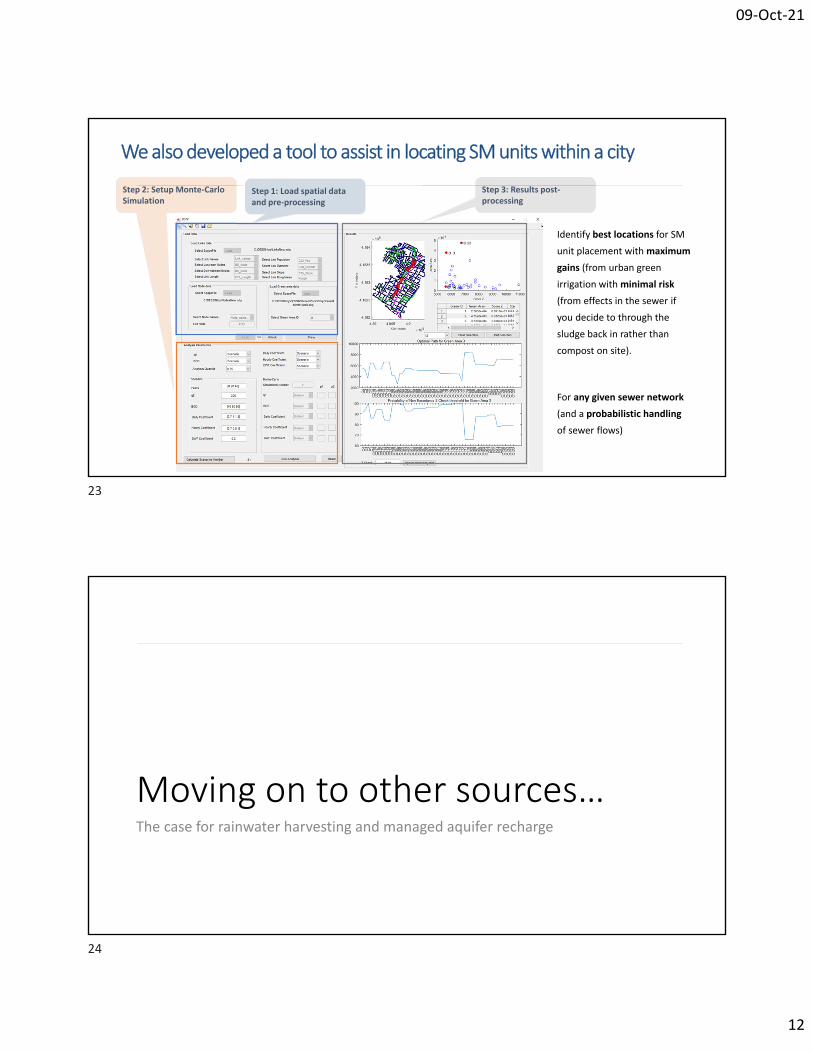
We also developed a tool to assist in locating SM units within a city
Step 1: Load spatial data and pre‐processing
Step 2: Setup Monte‐Carlo Simulation
Step 3: Results post‐processing
Identify best locations for SM
unit placement with maximum
gains (from urban green
irrigation with minimal risk
(from effects in the sewer if
you decide to through the
sludge back in rather than
compost on site).
For any given sewer network
(and a probabilistic handling
of sewer flows)
Moving on to other sources…The case for rainwater harvesting and managed aquifer recharge
23
24
09‐Oct‐21
13
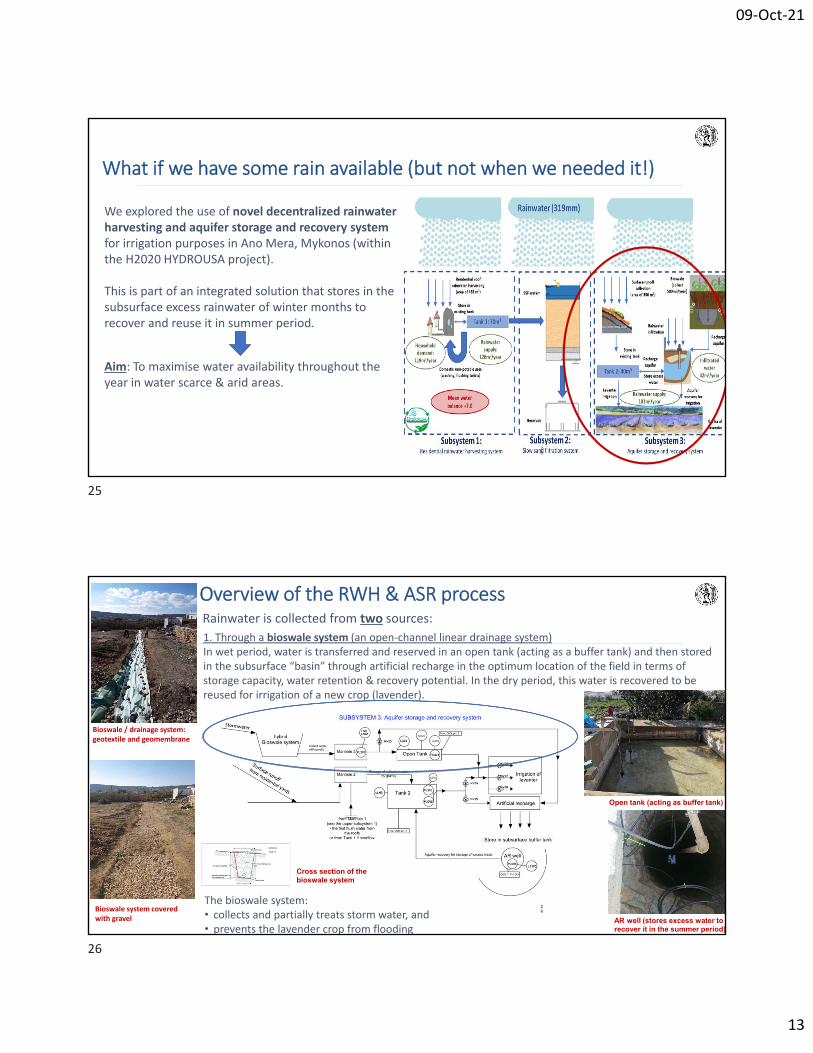
We explored the use of novel decentralized rainwater harvesting and aquifer storage and recovery system for irrigation purposes in Ano Mera, Mykonos (within the H2020 HYDROUSA project).
This is part of an integrated solution that stores in the subsurface excess rainwater of winter months to recover and reuse it in summer period.
Aim: To maximise water availability throughout the year in water scarce & arid areas.
What if we have some rain available (but not when we needed it!)
25
Rainwater is collected from two sources:
1. Through a bioswale system (an open‐channel linear drainage system)In wet period, water is transferred and reserved in an open tank (acting as a buffer tank) and then stored in the subsurface “basin” through artificial recharge in the optimum location of the field in terms of storage capacity, water retention & recovery potential. In the dry period, this water is recovered to be reused for irrigation of a new crop (lavender).
Overview of the RWH & ASR process
The bioswale system: • collects and partially treats storm water, and• prevents the lavender crop from flooding
Bioswale system covered with gravel
Bioswale / drainage system: geotextile and geomembrane
Cross section of the bioswale system
Open tank (acting as buffer tank)
AR well (stores excess water to recover it in the summer period)
26
25
26

09‐Oct‐21
14
In the wet period, the surface runoff of the impermeable surfaces of the site is collected, stored in an existing tank and also transferred to recharge the aquifer (subsurface “basin”) in the location of the artificial recharge (AR) well.In the dry period, water from the tank and from the (AR) well is used to irrigate the lavender.
2. Through surface runoff
Tank 2 for surface runoff collection Artificial recharge (AR) well
27
Overview of the RWH & ASR process
How can we control & monitor RWH / ASR configuration
The control of the configuration is fully automated through a PLC system.
Monitoring of the site is performed both in terms of water and quantity (water levels) quality (analysis tests).
Simulation of the aquifer to assess the system behavior is performed, in order to assess the performance of the systems & make necessary adjustments to optimise the operation, in terms of water and energy efficiency.
The system is decentralized, flexible, transferable and scalable with a high replication potential
28
27
28
09‐Oct‐21
15
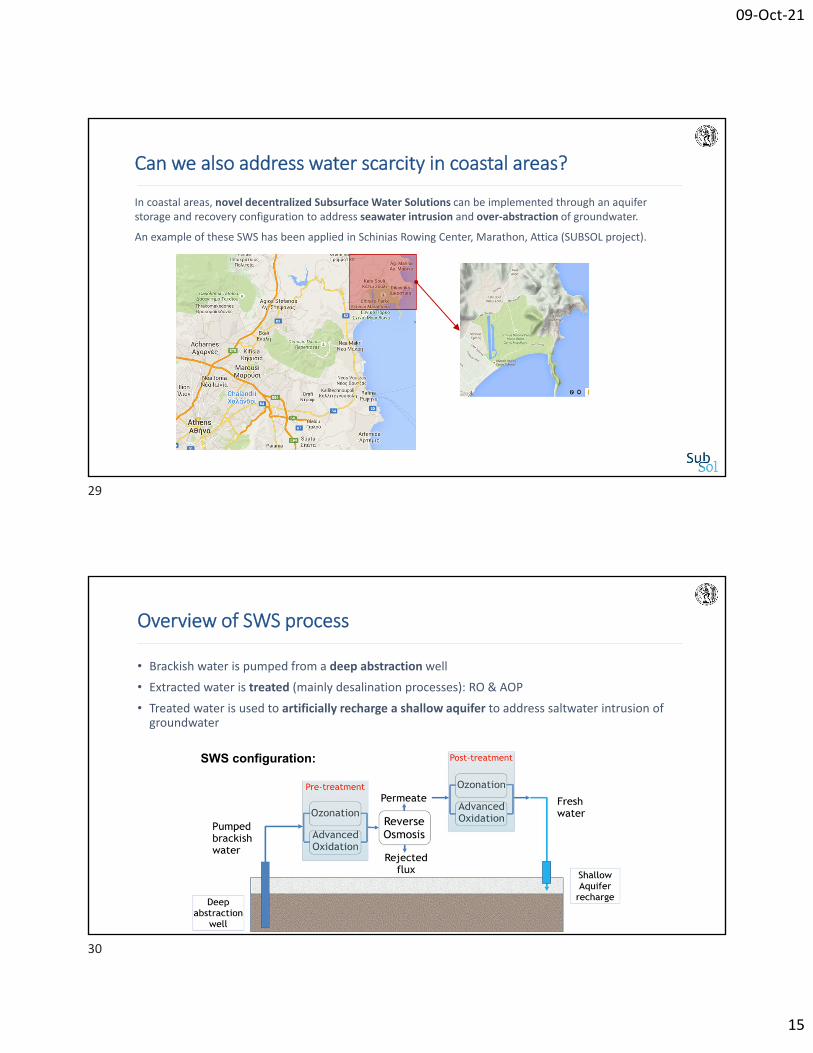
Can we also address water scarcity in coastal areas?
In coastal areas, novel decentralized Subsurface Water Solutions can be implemented through an aquifer storage and recovery configuration to address seawater intrusion and over‐abstraction of groundwater.
An example of these SWS has been applied in Schinias Rowing Center, Marathon, Attica (SUBSOL project).
SWS configuration:
• Brackish water is pumped from a deep abstraction well
• Extracted water is treated (mainly desalination processes): RO & AOP
• Treated water is used to artificially recharge a shallow aquifer to address saltwater intrusion of groundwater
Overview of SWS process
29
30
09‐Oct‐21
16
Water pipeline
SWS configuration parts:
Part 1. Water supply installations that abstract and transfer the water from Makaria springs to the treatment unit, about 1700m (point A).
Part 2. AOP‐RO hybrid water treatment unit, to produce water for the artificial recharge site (point B).
Part 3. Artificial recharge site, implementing a hybrid system of ASR‐Coastal & Freshmaker technologies, consisting of four wells, three vertical and one horizontal (area C).Point B Area C
Configuration parts of SWS schemes
31
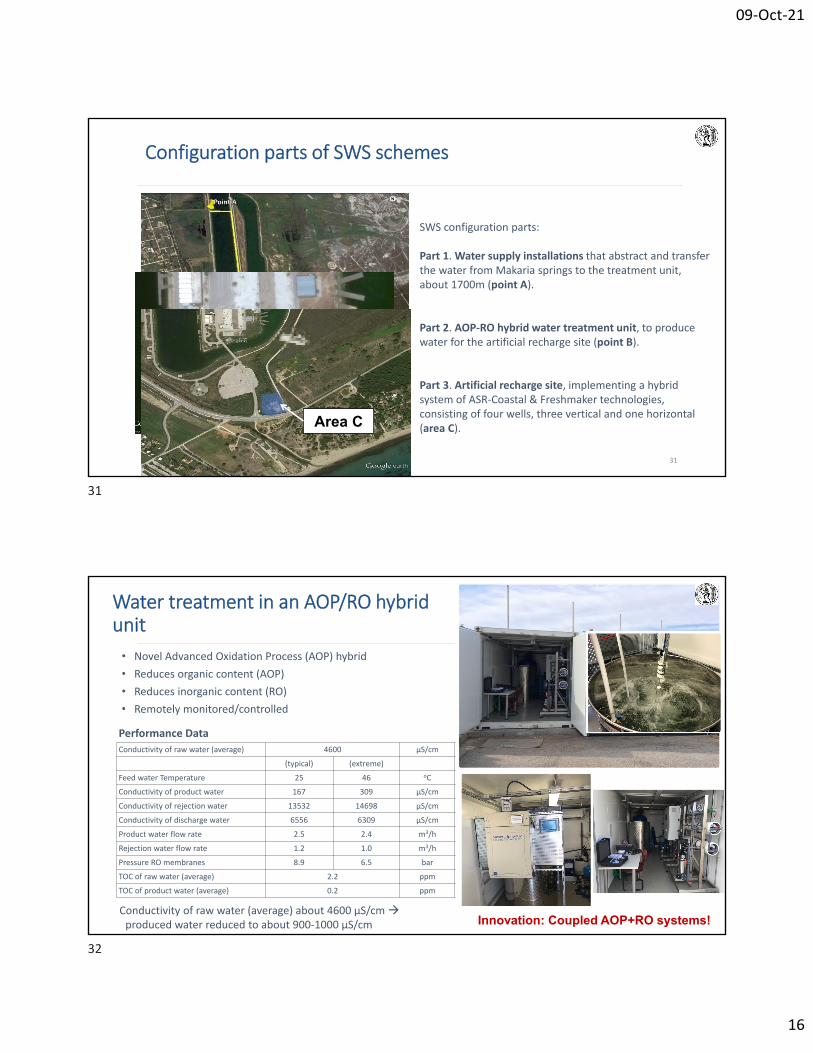
• Novel Advanced Oxidation Process (AOP) hybrid
• Reduces organic content (AOP)
• Reduces inorganic content (RO)
• Remotely monitored/controlled
Performance Data
Conductivity of raw water (average) 4600 μS/cm
(typical) (extreme)
Feed water Temperature 25 46 oC
Conductivity of product water 167 309 μS/cm
Conductivity of rejection water 13532 14698 μS/cm
Conductivity of discharge water 6556 6309 μS/cm
Product water flow rate 2.5 2.4 m3/h
Rejection water flow rate 1.2 1.0 m3/h
Pressure RO membranes 8.9 6.5 bar
TOC of raw water (average) 2.2 ppm
TOC of product water (average) 0.2 ppm
Innovation: Coupled AOP+RO systems!Conductivity of raw water (average) about 4600 μS/cmproduced water reduced to about 900‐1000 μS/cm
Water treatment in an AOP/RO hybrid unit
31
32

09‐Oct‐21
17
6-23 m: fine sand
Thin clay intercalations
0-1.6 m: artificial fill1.6 to 3.5 m: fine sand
3.5-6 m: fine gravel
Central AR wellSide well
16 m
3.2 m: Static WLVL
AR WELL
50 m
4.1 m Sea LVL
Screened section
Artificial recharge system
An area of 6500m2 was selected to construct the artificial recharge (AR) system, consisting of:
• One central Artificial Recharge (AR) well in a depth of 23m with 3 piezometer monitoring nests
• Two side monitoring vertical wells (North and West) in a depth of 12m, at a distance of 16m from the central AR well screened with microfissured pipes.
• One Horizontal Directional Drilling (HDD) well at a length of 50m and maximum depth of 4.1m passing below the AR well, screened with PVC pipe.
33
Conclusions & lessons learned from working with distributed water technologies
Water reuse and GW recharge solutions (SM units, RWH systems, GW recharge & recovery schemes, SWS) are very promising for arid and semi‐arid environments:
• produce water of quality to be reused in water scarce areassupporting protection, environmental regeneration and financial sustainability.
• proven to be autonomous, flexible and decentrilised resource recovery systems
• tested to have a satisfactory operational stability and performance• proven to be implemented either alone or combined according to
the availability of resources• tested to be suitable in real world environments • potentially be upscaled and replicated in similar water scarce
environments • provide ‘climate‐proofed’ non‐potable water• be part of the reuse/circular economy portfolio
33
34

09‐Oct‐21
18
LDK Consultants Global EEIG
This Project is funded
by the European Union
Now for some interaction!
Quiz time!
Go to: pollev.com/christosmakropoulos886
LDK Consultants Global EEIG
This Project is funded
by the European Union
11th October 2021, Athens, Greece
Presented by: Prof. Christos Makropoulos, NTUA
Distributed water technologies in arid countries: options for decentralised water re‐use and
groundwater recharge
Monitoring, Data and Analytics
35
36
09‐Oct‐21
19
Big data and all that…
37
• We have mentioned remote control a few time already in the first part of this lecture.
• Remote monitoring of multiple distributed water technologies generates (a lot of) data.
• How can we manage this ‘big data’ problem?
• And make some sense of the data we collect!?
NESSIE: an intelligent, flexible dashboard
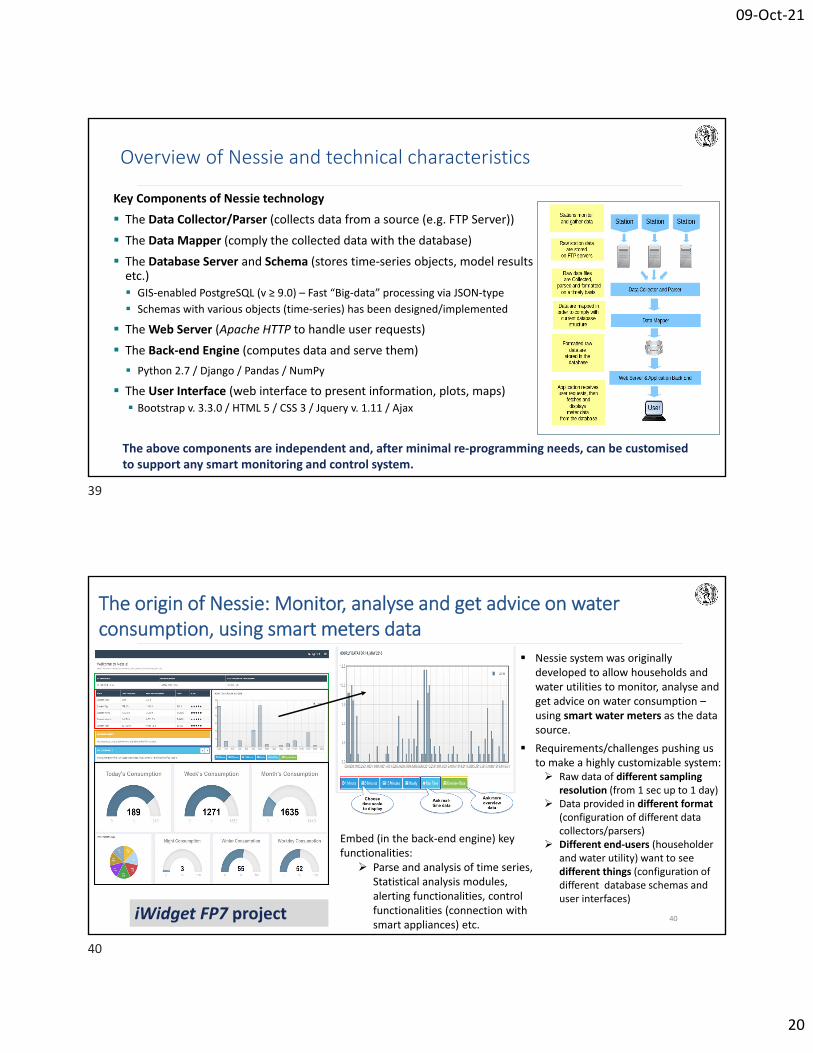
• Remote/distributed systems mean remote monitoring and control (by a dedicated team back in HQ)
• NESSIE is a visualisation and analytics platform able to acquire, process and store high‐resolution data from IoT (incl. sensors and smart meters)
• Not a fully fledged DT (yet) but close enough…
38
37
38
09‐Oct‐21
20
39
39
Key Components of Nessie technology
The Data Collector/Parser (collects data from a source (e.g. FTP Server))
The Data Mapper (comply the collected data with the database)
The Database Server and Schema (stores time‐series objects, model results etc.) GIS‐enabled PostgreSQL (v ≥ 9.0) – Fast “Big‐data” processing via JSON‐type
Schemas with various objects (time‐series) has been designed/implemented
The Web Server (Apache HTTP to handle user requests)
The Back‐end Engine (computes data and serve them)
Python 2.7 / Django / Pandas / NumPy
The User Interface (web interface to present information, plots, maps) Bootstrap v. 3.3.0 / HTML 5 / CSS 3 / Jquery v. 1.11 / Ajax
Overview of Nessie and technical characteristics
The above components are independent and, after minimal re‐programming needs, can be customised to support any smart monitoring and control system.
40
The origin of Nessie: Monitor, analyse and get advice on water consumption, using smart meters data
Nessie system was originally developed to allow households and water utilities to monitor, analyse and get advice on water consumption –using smart water meters as the data source.
Requirements/challenges pushing us to make a highly customizable system: Raw data of different sampling
resolution (from 1 sec up to 1 day) Data provided in different format
(configuration of different data collectors/parsers)
Different end‐users (householder and water utility) want to see different things (configuration of different database schemas and user interfaces)
Embed (in the back‐end engine) key functionalities: Parse and analysis of time series,
Statistical analysis modules, alerting functionalities, control functionalities (connection with smart appliances) etc.
iWidget FP7 project
39
40
09‐Oct‐21
21
41
41
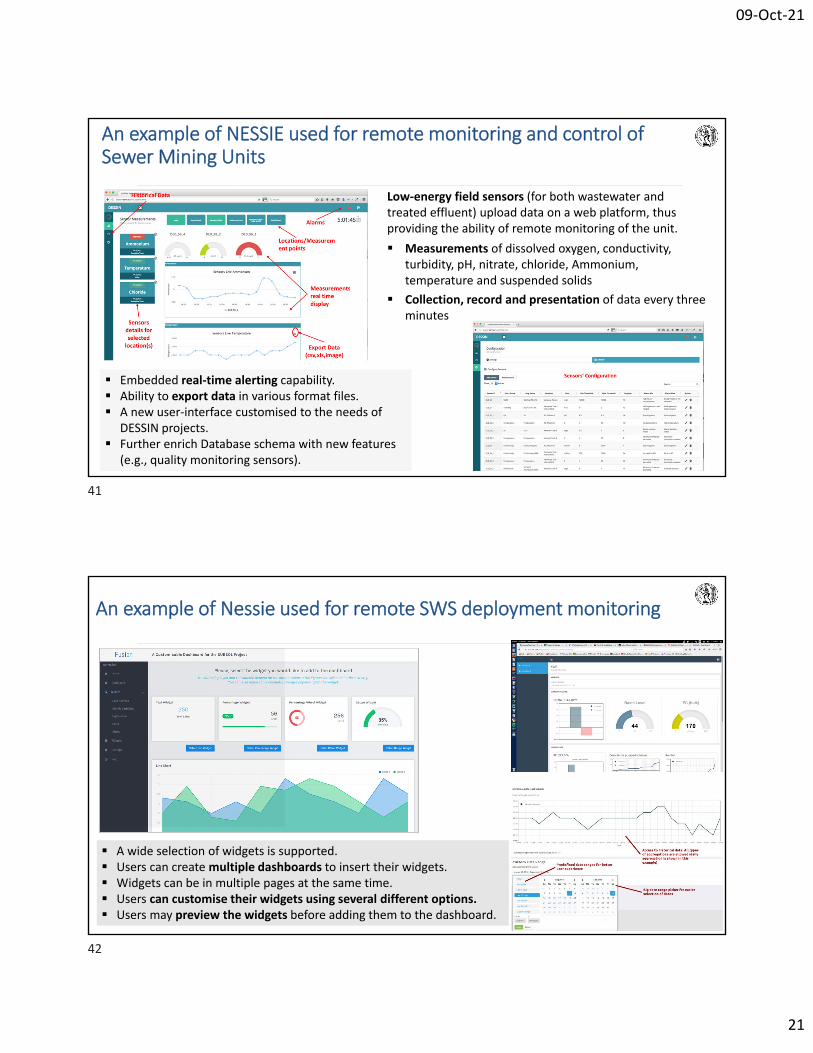
An example of NESSIE used for remote monitoring and control of Sewer Mining Units
Low‐energy field sensors (for both wastewater and treated effluent) upload data on a web platform, thus providing the ability of remote monitoring of the unit.
Measurements of dissolved oxygen, conductivity, turbidity, pH, nitrate, chloride, Ammonium, temperature and suspended solids
Collection, record and presentation of data every three minutes
Embedded real‐time alerting capability. Ability to export data in various format files. A new user‐interface customised to the needs of
DESSIN projects. Further enrich Database schema with new features
(e.g., quality monitoring sensors).
42
42
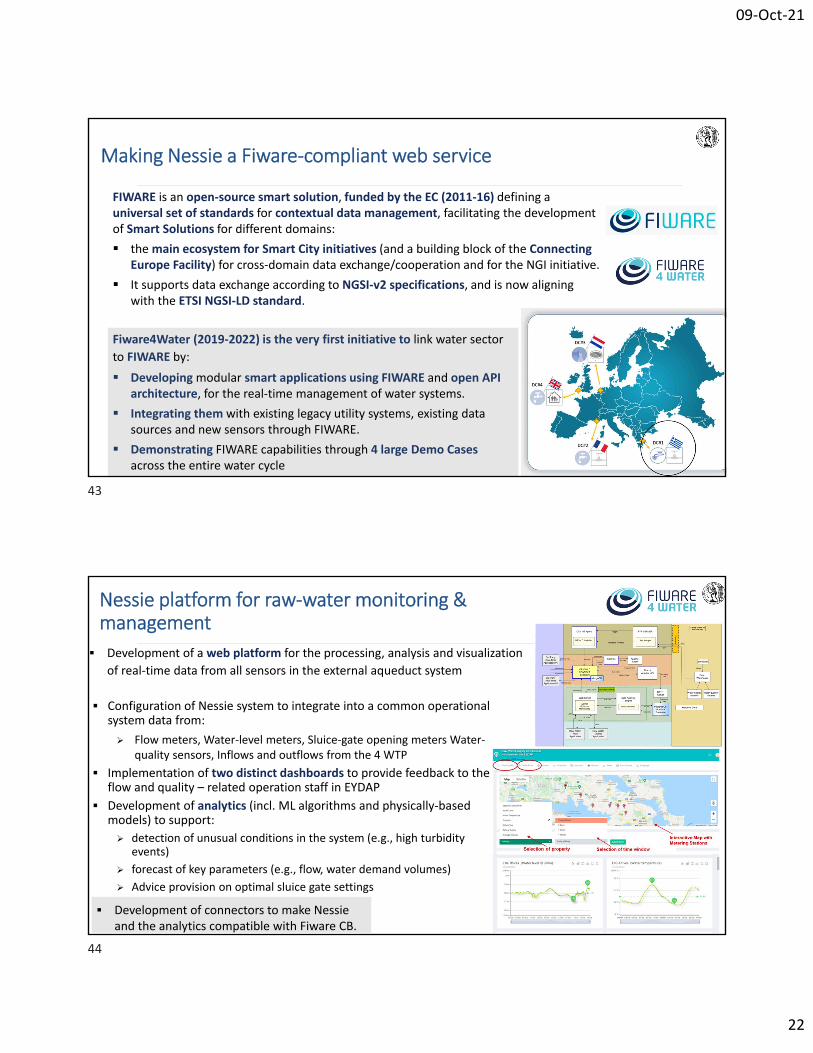
An example of Nessie used for remote SWS deployment monitoring
A wide selection of widgets is supported. Users can create multiple dashboards to insert their widgets. Widgets can be in multiple pages at the same time. Users can customise their widgets using several different options. Users may preview the widgets before adding them to the dashboard.
41
42
09‐Oct‐21
22
43
Making Nessie a Fiware‐compliant web service
FIWARE is an open‐source smart solution, funded by the EC (2011‐16) defining a universal set of standards for contextual data management, facilitating the development of Smart Solutions for different domains:
the main ecosystem for Smart City initiatives (and a building block of the Connecting Europe Facility) for cross‐domain data exchange/cooperation and for the NGI initiative.
It supports data exchange according to NGSI‐v2 specifications, and is now aligning with the ETSI NGSI‐LD standard.
Fiware4Water (2019‐2022) is the very first initiative to link water sector
to FIWARE by:
Developingmodular smart applications using FIWARE and open API architecture, for the real‐time management of water systems.
Integrating them with existing legacy utility systems, existing data sources and new sensors through FIWARE.
Demonstrating FIWARE capabilities through 4 large Demo Cases across the entire water cycle
44
Nessie platform for raw‐water monitoring & management
Development of a web platform for the processing, analysis and visualization
of real‐time data from all sensors in the external aqueduct system
Configuration of Nessie system to integrate into a common operational system data from:
Flow meters, Water‐level meters, Sluice‐gate opening meters Water‐quality sensors, Inflows and outflows from the 4 WTP
Implementation of two distinct dashboards to provide feedback to the flow and quality – related operation staff in EYDAP
Development of analytics (incl. ML algorithms and physically‐based models) to support:
detection of unusual conditions in the system (e.g., high turbidity events)
forecast of key parameters (e.g., flow, water demand volumes)
Advice provision on optimal sluice gate settings
Development of connectors to make Nessie and the analytics compatible with Fiware CB.
43
44
09‐Oct‐21
23
45
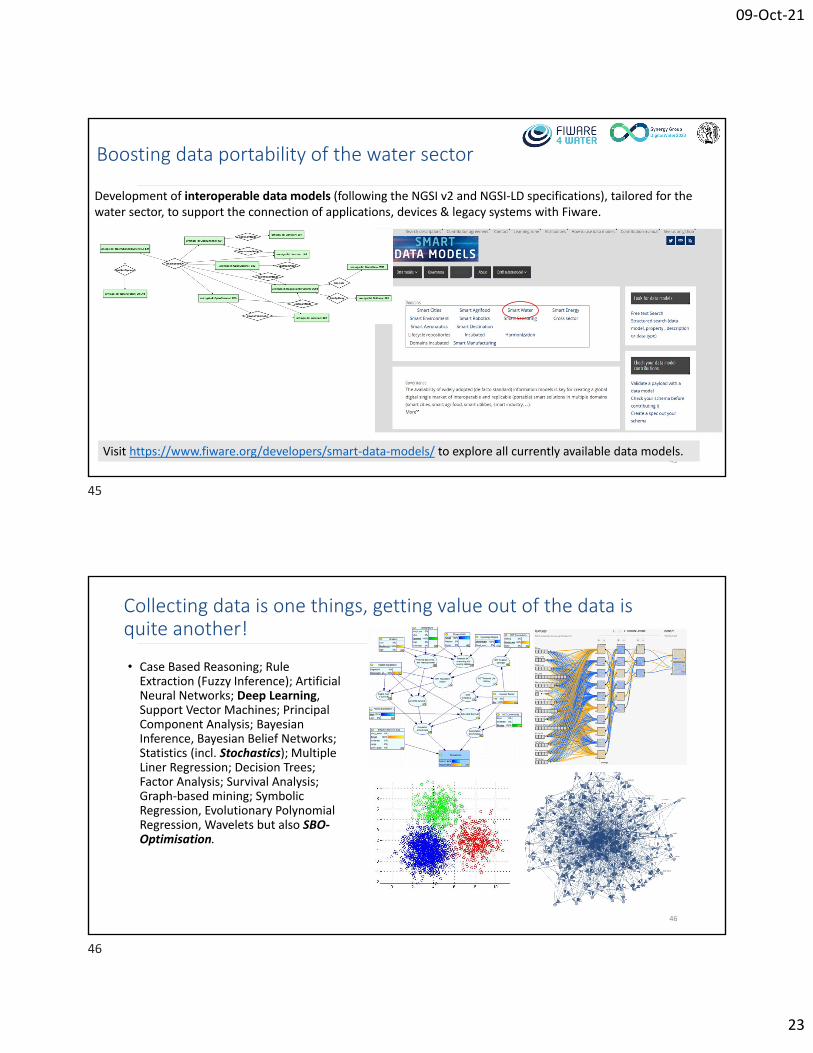
Boosting data portability of the water sector
Development of interoperable data models (following the NGSI v2 and NGSI‐LD specifications), tailored for the water sector, to support the connection of applications, devices & legacy systems with Fiware.
Visit https://www.fiware.org/developers/smart‐data‐models/ to explore all currently available data models.
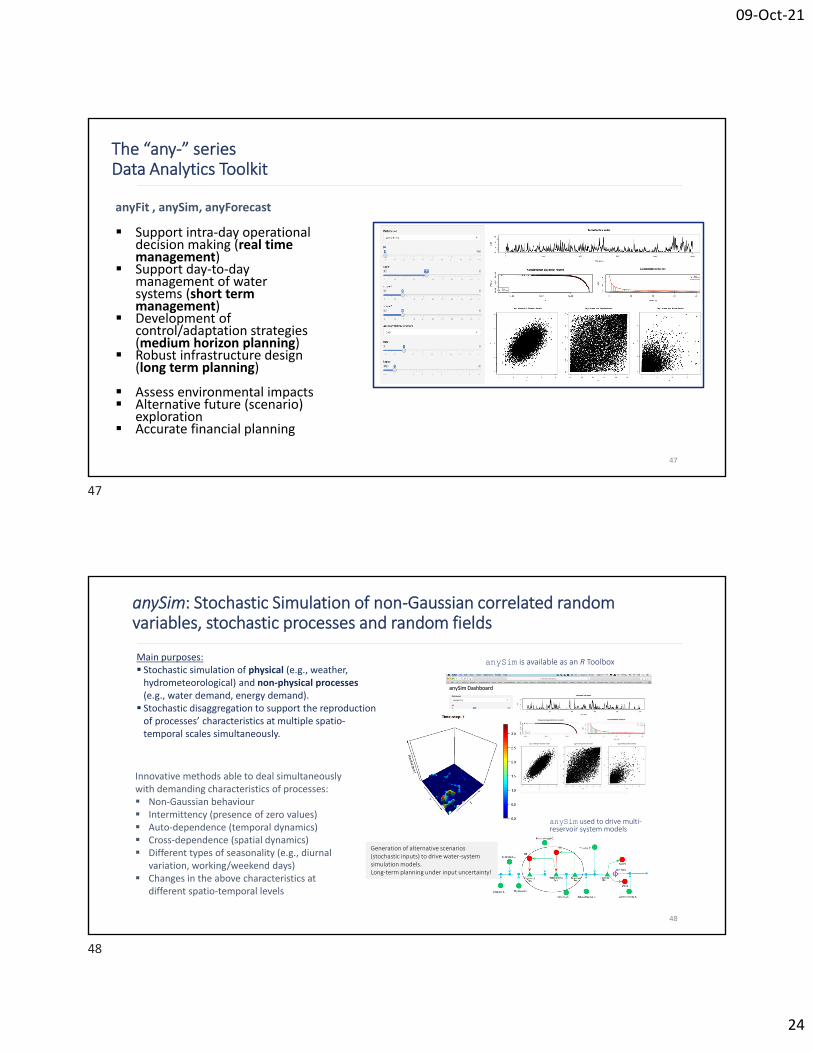
Collecting data is one things, getting value out of the data is quite another!
46
• Case Based Reasoning; Rule Extraction (Fuzzy Inference); Artificial Neural Networks; Deep Learning, Support Vector Machines; Principal Component Analysis; Bayesian Inference, Bayesian Belief Networks; Statistics (incl. Stochastics); Multiple Liner Regression; Decision Trees; Factor Analysis; Survival Analysis; Graph‐based mining; Symbolic Regression, Evolutionary Polynomial Regression, Wavelets but also SBO‐Optimisation.
45
46
09‐Oct‐21
24
The “any‐” series Data Analytics Toolkit
47
Support intra‐day operational decision making (real time management)
Support day‐to‐day management of water systems (short term management)
Development of control/adaptation strategies (medium horizon planning)
Robust infrastructure design (long term planning)
Assess environmental impacts Alternative future (scenario)
exploration Accurate financial planning
anyFit , anySim, anyForecast
48
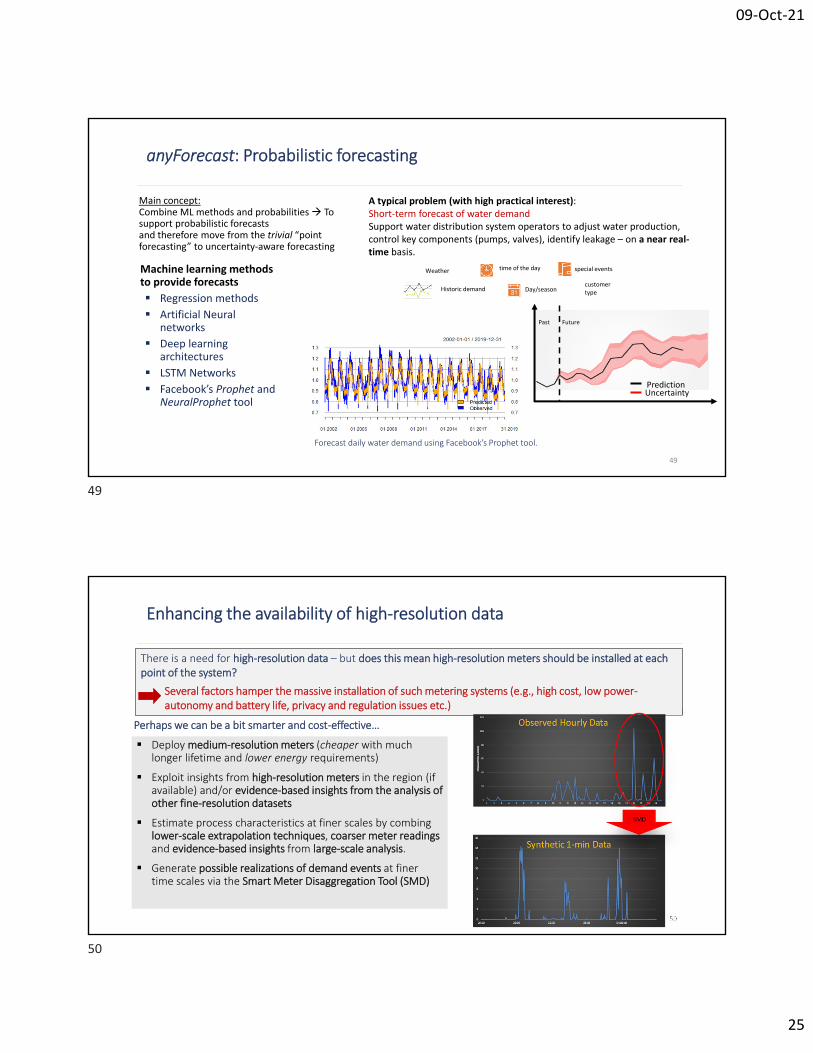
anySim: Stochastic Simulation of non‐Gaussian correlated random variables, stochastic processes and random fields
anySim: Spatiotemporal simulation of rainfall field
anySim is available as an R Toolbox
anySim used to drive multi‐reservoir system models
anySimDashboard
Innovative methods able to deal simultaneously with demanding characteristics of processes: Non‐Gaussian behaviour Intermittency (presence of zero values) Auto‐dependence (temporal dynamics) Cross‐dependence (spatial dynamics) Different types of seasonality (e.g., diurnal
variation, working/weekend days) Changes in the above characteristics at
different spatio‐temporal levels
Main purposes: Stochastic simulation of physical (e.g., weather, hydrometeorological) and non‐physical processes (e.g., water demand, energy demand). Stochastic disaggregation to support the reproduction of processes’ characteristics at multiple spatio‐temporal scales simultaneously.
Generation of alternative scenarios (stochastic inputs) to drive water‐system simulation models.Long‐term planning under input uncertainty!
47
48
09‐Oct‐21
25
49
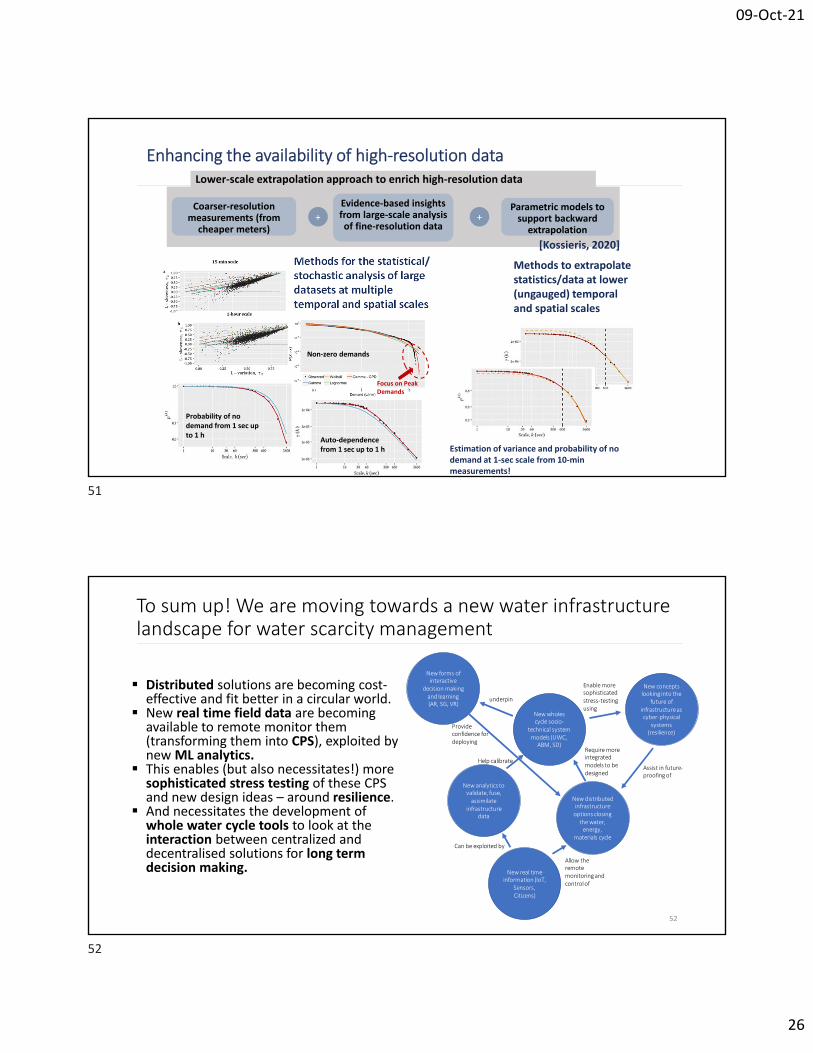
anyForecast: Probabilistic forecasting
Main concept:Combine ML methods and probabilities To support probabilistic forecastsand therefore move from the trivial “point forecasting” to uncertainty‐aware forecasting
A typical problem (with high practical interest): Short‐term forecast of water demandSupport water distribution system operators to adjust water production, control key components (pumps, valves), identify leakage – on a near real‐time basis.
Weather
Historic demand
time of the day
Day/seasoncustomer type
special events
PredictionUncertainty
FuturePast
Machine learning methods to provide forecasts
Regression methods
Artificial Neural networks
Deep learning architectures
LSTM Networks
Facebook’s Prophet and NeuralProphet tool
Forecast daily water demand using Facebook’s Prophet tool.
50
Enhancing the availability of high‐resolution data
There is a need for high‐resolution data – but does this mean high‐resolution meters should be installed at each point of the system?
Several factors hamper the massive installation of such metering systems (e.g., high cost, low power‐autonomy and battery life, privacy and regulation issues etc.)
Perhaps we can be a bit smarter and cost‐effective…
Deploy medium‐resolution meters (cheaper with much longer lifetime and lower energy requirements)
Exploit insights from high‐resolution meters in the region (if available) and/or evidence‐based insights from the analysis of other fine‐resolution datasets
Estimate process characteristics at finer scales by combing lower‐scale extrapolation techniques, coarser meter readings and evidence‐based insights from large‐scale analysis.
Generate possible realizations of demand events at finer time scales via the Smart Meter Disaggregation Tool (SMD)
49
50
09‐Oct‐21
26
Enhancing the availability of high‐resolution data
Coarser‐resolution measurements (from cheaper meters)
Evidence‐based insights from large‐scale analysis of fine‐resolution data
Parametric models to support backward extrapolation
+ +
Estimation of variance and probability of no demand at 1‐sec scale from 10‐min measurements!
Methods to extrapolate statistics/data at lower (ungauged) temporal and spatial scales
Lower‐scale extrapolation approach to enrich high‐resolution data
Methods for the statistical/ stochastic analysis of large datasets at multiple temporal and spatial scales
Focus on Peak Demands
Non‐zero demands
Probability of no demand from 1 sec up to 1 h
Auto‐dependence from 1 sec up to 1 h
[Kossieris, 2020]
To sum up! We are moving towards a new water infrastructure landscape for water scarcity management
Distributed solutions are becoming cost‐effective and fit better in a circular world.
New real time field data are becoming available to remote monitor them (transforming them into CPS), exploited by new ML analytics.
This enables (but also necessitates!) more sophisticated stress testing of these CPS and new design ideas – around resilience.
And necessitates the development of whole water cycle tools to look at the interaction between centralized and decentralised solutions for long term decision making.
52
New real time information (IoT,
Sensors, Citizens)
New forms of interactive
decision making and learning (AR, SG, VR)
New wholes cycle socio‐
technical system models (UWC, ABM, SD)
New distributed infrastructure options closing the water, energy,
materials cycle
New analytics to validate, fuse, assimilate
infrastructure data
New concepts looking into the
future of infrastructure as cyber‐physical
systems (resilience)
Can be exploited by
Allow the remote monitoring and control of
Require more integrated models to be designed
Enable more sophisticated stress‐testing using
Assist in future‐proofing of
Help calibrate
Provide confidence for deploying
underpin
51
52
09‐Oct‐21
27
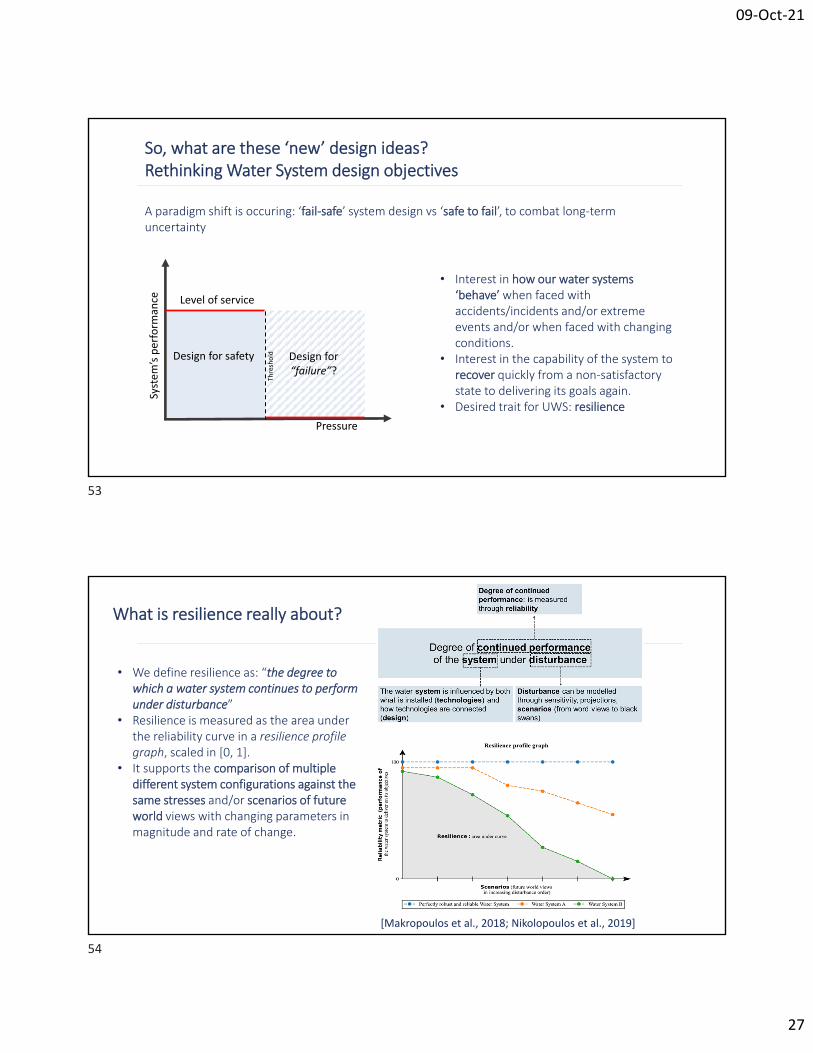
So, what are these ‘new’ design ideas? Rethinking Water System design objectives
A paradigm shift is occuring: ‘fail‐safe’ system design vs ‘safe to fail’, to combat long‐term uncertainty
Level of service
Design for safety
Threshold Design for
“failure”?
System’s perform
ance
Pressure
• Interest in how our water systems ‘behave’ when faced with accidents/incidents and/or extreme events and/or when faced with changing conditions.
• Interest in the capability of the system to recover quickly from a non‐satisfactory state to delivering its goals again.
• Desired trait for UWS: resilience
What is resilience really about?
• We define resilience as: “the degree to which a water system continues to perform under disturbance”
• Resilience is measured as the area under the reliability curve in a resilience profile graph, scaled in [0, 1].
• It supports the comparison of multiple different system configurations against the same stresses and/or scenarios of future world views with changing parameters in magnitude and rate of change.
[Makropoulos et al., 2018; Nikolopoulos et al., 2019]
53
54
09‐Oct‐21
28
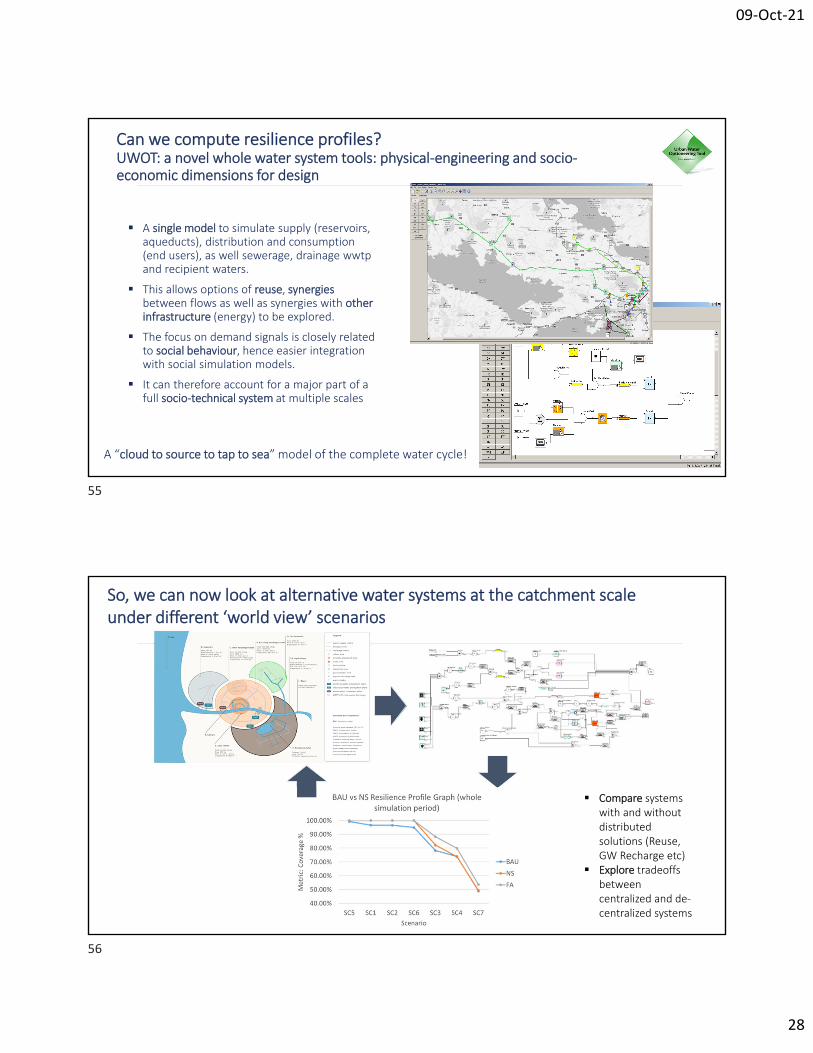
Can we compute resilience profiles? UWOT: a novel whole water system tools: physical‐engineering and socio‐economic dimensions for design
A “cloud to source to tap to sea” model of the complete water cycle!
A single model to simulate supply (reservoirs, aqueducts), distribution and consumption (end users), as well sewerage, drainage wwtpand recipient waters.
This allows options of reuse, synergiesbetween flows as well as synergies with other infrastructure (energy) to be explored.
The focus on demand signals is closely related to social behaviour, hence easier integration with social simulation models.
It can therefore account for a major part of a full socio‐technical system at multiple scales
So, we can now look at alternative water systems at the catchment scale under different ‘world view’ scenarios
Compare systems with and without distributed solutions (Reuse, GW Recharge etc)
Explore tradeoffs between centralized and de‐centralized systems
55
56
09‐Oct‐21
29
LDK Consultants Global EEIG
This Project is funded
by the European Union
Now for some interaction!
Quiz time!
Go to: pollev.com/christosmakropoulos886
LDK Consultants Global EEIG
This Project is funded
by the European Union
Thank you for your attention!
58
Prof. Christos Makropoulos, NTUA
57
58