distributed antenna system for mitigating shadowing effect
TRANSCRIPT

Distributed Antenna System for Mitigating Shadowing Effect in60 GHz WLANCitation for published version (APA):Wang, Q., Debbarma, D., Lo, A., Cao, Z., Niemegeers, I., & Heemstra, S. (2015). Distributed Antenna Systemfor Mitigating Shadowing Effect in 60 GHz WLAN. Wireless Personal Communications, 82(2), 811-832.https://doi.org/10.1007/s11277-014-2254-5
DOI:10.1007/s11277-014-2254-5
Document status and date:Published: 01/05/2015
Document Version:Publisher’s PDF, also known as Version of Record (includes final page, issue and volume numbers)
Please check the document version of this publication:
• A submitted manuscript is the version of the article upon submission and before peer-review. There can beimportant differences between the submitted version and the official published version of record. Peopleinterested in the research are advised to contact the author for the final version of the publication, or visit theDOI to the publisher's website.• The final author version and the galley proof are versions of the publication after peer review.• The final published version features the final layout of the paper including the volume, issue and pagenumbers.Link to publication
General rightsCopyright and moral rights for the publications made accessible in the public portal are retained by the authors and/or other copyright ownersand it is a condition of accessing publications that users recognise and abide by the legal requirements associated with these rights.
• Users may download and print one copy of any publication from the public portal for the purpose of private study or research. • You may not further distribute the material or use it for any profit-making activity or commercial gain • You may freely distribute the URL identifying the publication in the public portal.
If the publication is distributed under the terms of Article 25fa of the Dutch Copyright Act, indicated by the “Taverne” license above, pleasefollow below link for the End User Agreement:www.tue.nl/taverne
Take down policyIf you believe that this document breaches copyright please contact us at:[email protected] details and we will investigate your claim.
Download date: 11. Dec. 2021
Wireless Pers Commun (2015) 82:811–832DOI 10.1007/s11277-014-2254-5
Distributed Antenna System for Mitigating ShadowingEffect in 60GHz WLAN
Qing Wang · Diptanil Debbarma · Anthony Lo ·Zizheng Cao · Ignas Niemegeers · Sonia Heemstra de Groot
Published online: 27 December 2014© Springer Science+Business Media New York 2014
Abstract The 60GHz unlicensed frequency band has been adopted to support high data rateWLAN applications. The problem of this frequency band is that the wireless signal is vul-nerable to the shadowing of objects. Especially in indoor scenarios, humans may frequentlyblock the signal paths that cause disconnections of devices. This problem can be mitigatedby using multiple antennas that can create rich signal paths between the devices. The ideapresented in this paper is to employ a distributed antenna system (DAS) architecture enabledby radio-over-fiber technology to alleviate the shadowing problem. In the DAS architecture,multiple remote antenna units (RAUs), each of them equipped with an antenna array, areconnected with the sameWLAN access points via optical fibers. But there are questions thatneed to be answered, including the beamforming strategy with multiple RAUs, and the place-ment and the required number of the RAUs. These questions are related to factors like roomsize, population density, etc.We discuss these questions in this paper and present our findings
Anthony Lo is currently with Huawei Technologies. The work was done while he was with Delft Universityof Technology.
Q. Wang (B) · D. Debbarma · Z. Cao · I. Niemegeers · S. Heemstra de GrootCOBRA Research Institute, Eindhoven University of Technology, Den Dolech 2,5612 AZ Eindhoven, The Netherlandse-mail: [email protected]
D. Debbarmae-mail: [email protected]
Z. Caoe-mail: [email protected]
I. Niemegeerse-mail: [email protected]
S. Heemstra de Groote-mail: [email protected]
A. LoDelft University of Technology, Delft, The Netherlandse-mail: [email protected]
123

812 Q. Wang et al.
through theoretical models and extensive simulations, which can be referred to for practicalimplementations. We find that the proposed 60GHz DAS can significantly improve the linkconnectivity. Even when only two RAUs are used, the signal coverage can be improved toan acceptable percentage in heavy shadowing scenarios.
Keywords 60GHz · Beamforming · Radio-over-fiber · Shadowing · WLAN
1 Introduction
Recently, the 60GHz unlicensed band has been adopted to support emerging short-range andhigh data rate WLAN applications like uncompressed video streaming, high-speed file trans-fer, high-definition wireless display, etc. These applications produce data traffic in the orderof multi-gigabits per second, which is difficult to achieve in the congested low WLAN fre-quency bands like 2.4 or 5GHz. On the contrary, there is a 5GHz continuous spectrum blockglobally available in the 60GHz band [1]. This suggests that gigabits per second communi-cation can be achieved even when simple modulation schemes are applied. The signals in thishigh frequency band experience strong path loss which limits the communication distanceto a few meters [2]. This characteristic makes the 60GHz band suitable for indoor networkswhere most of the high data rate applications are presumed to be located. An important issueof 60GHz communication is that the signal is susceptible to the blockage of obstacles likehumans and walls due to its short wavelength [3]. Therefore, 60GHz communication is usu-ally constrained to line-of-sight (LOS) condition. Especially in indoor scenarios, walkinghumans may frequently block the wireless links, which generates more problems than stableobjects. It is reported that the human body can attenuate the signal by more than 20dB [4],which is hard to overcome by using only beamforming techniques, particularly when consid-ering power regulations and potential health consequences. For instance, it has been shownin [4] that the channel is thus unavailable for about 1–2% of the time in the presence of oneto five persons in a room.
Several approaches have been reported in the literature for alleviating the shadowing effectof humans. One practical solution is to transport the signals through reflective paths inducedby large surfaces like walls. Although the reflective paths will introduce more attenuation,typically 15–20dB [5] or even lower for some reflective materials [6], beamforming may beused to compensate this loss. But there is also the possibility that no reflective paths can befound since the reflections strongly depend on the physical environment, like the reflectivityof the walls and furniture. So, [7] proposes to place artificial metal reflectors on the wallsto create more reflections. It is claimed that the connectivity can be significantly boosted byplacing a few reflectors at optimized positions. Another promising approach is to use relaysto forward the signals of the blocked devices to the destination which is reported in, e.g. [8].For WLAN, multiple access points (APs) can be used to cover the same area, such that themobile stations (STAs) can find alternative APs when experiencing a blockage [9] proposesto place a few synchronized APs to serve the same room and shows that the visibility can beimproved sufficiently with two APs. A similar method was recently presented in [10], butalternatively it uses a central controller to select the best visible AP to continue the blockedtransmissions. Due to the lack of channel information at the controller, the selection has tobe done based on packet transmission failure reports from the APs. As stated in the paper,this may cause additional delay to the packet delivery.
Besides these techniques, a new promising approach that we propose in this paper is toexploit spatial diversity. Spatial diversity can increase the robustness of the wireless link
123

Distributed Antenna System 813
by taking advantage of the spatial separation of multiple antennas, which is also applicablefor 60GHz communication. 60GHz link mandates LOS paths, as opposed to the lower fre-quencies that can also count on non-line-of-sight (NLOS) paths. So, the antennas need to beseparated by an adequate distance which should be much larger than the carrier wavelength,such that the multiple transmitters can have different shadowing properties. As pointed out in[9] which addresses multi-AP diversity, this distance needs to be as large as several meters.A similar requirement holds for the spacing of antennas for spatial diversity against shad-owing effect. This requirement makes the spatial diversity approach less feasible for devicesthat are constrained in size like cell phones, than for large devices like TV sets. However,for WLAN access network design, this limitation is less important. Particularly, distributedantenna systems (DASs) are already employed for the lower frequency WLANs [11,12],where the antennas of an AP are placed far apart. The same architecture can be employedfor 60GHz WLAN. The difference would be the high frequency and large bandwidth of the60GHz signal. So optical fiber is more suitable than other wired mediums like coax cable,for connecting the remote antenna units (RAUs) with an AP, thanks to its huge bandwidthand low loss [13]. The way of transporting radio signals via optical fiber is termed radio-over-fiber (RoF) [14]. In comparison with other anti-blockage approaches, DAS architecturehas the advantages of:
– No coordination cost for controlling the additional antennas while this is usually necessaryfor relaying schemes and multi-AP diversity
– More LOS paths can be provided instead of NLOS paths that have larger power loss
The contribution of this paper is to examine the DAS concept in 60GHz WLAN formitigating the shadowing problem. This involves building theoretical models and conductingextensive simulations to investigate the beamforming approaches with multiple RAUs, andthe placement and the necessary number of RAUs. The rest of the article is organized asfollows: Section 2 introduces the RoF based DAS system for 60GHzWLAN communicationand derives the mathematical beamforming model. Section 3 describes the 60GHz physicalchannel model and its simulation. Section 4 presents the setup of our simulations. The resultsand discussions are given in Sect. 5. Section 6 concludes the paper.
2 System Model
In this section, we will describe the RoF network and derive the mathematical beamformingmodel of the 60GHzDAS. The concept of RoF for indoor networking has been demonstratedin, e.g. [12,15]. Due to the small scale of indoor scenarios, the required fiber lengths areusually in the order of hundreds of meters. Therefore, the signal quality loss, like the SNRdrop of the radio signal is marginal in comparison with the wireless channel. Thus, it isignored in this paper. One can consider the RoF link between the RAUs and the AP as anideal wired connection.
2.1 RoF System for 60GHz WLAN
The RoF system for 60GHz WLAN communication is depicted in Fig. 1. It is intendedto provide wireless access for the whole indoor area. As mentioned previously, 60GHzcommunication is isolated by the walls, which makes it necessary to deploy at least one RAUin each room. Multiple WLAN APs are are co-located in the Central Station (CS). The APsare connected with the RAUs through the radio-optical interface and the optical network. The
123

814 Q. Wang et al.
External network
AP 1
Radi
o-O
ptic
al
Inte
rfac
e
Optical Network
RAU
RAU
RAU
RAU
Central Station
AP 2
AP X
AP 3
Room 1
Optical link
Fig. 1 An radio-over-fiber based distributed antenna system for 60GHz WLAN
RAU 1
STA Channel
RAU K
1,1
1,2
1,
,1
,2
,
1
2
AP
Fig. 2 Beamforming model of distributed antenna system
function of the radio-optical interface is to convert the signals between electrical and opticaldomains such that the radio signals can be transported between the APs and RAUs throughthe optical network (e.g. with a star topology [15]). As proposed in this paper, multiple RAUsare connected with the same AP for a single room to mitigate the human shadowing effect.E.g. two RAUs are deployed in Room 1 in Fig. 1. This results in the aforementioned DASarchitecture [16]. Since beamforming is needed to enhance the signal strength for extendingthe signal transmission range, each RAU is equipped with multiple antennas, i.e. an antennaarray. These RAUs can be utilized in different ways. In this paper, we consider two strategies:blanket transmission and selective transmission. In blanket transmission, all the RAUs areused for transmitting signals; while only the RAU that gives the best signal quality is usedin selective transmission.
2.2 Beamforming Model of Distributed Antenna System
Wederive the beamformingmodels by focusing on theDASof a singleAPwhich is illustratedin Fig. 2 in the form of a MIMO system. Assume that there are K RAUs deployed in aroom. Each RAU has a planar antenna array with a total of M antenna elements arrangedon a rectangular grid with equal spacing along both x and y dimensions. We assume halfwavelength spacing in both dimensions. Denote the number of antenna elements in the twodimensions with Mx and My , respectively, and M = Mx × My . The mobile stations areassumed to have the same configuration with N antenna elements in a single antenna array.The wireless signal uses OFDM modulation with L subcarriers and a total bandwidth of B.
2.2.1 Blanket Transmission
For blanket transmission, all theRAUs are used in beamforming. The sum transmission powerof all RAUs is fixed and is equally allocated to all subcarriers. The following derivations are
123

Distributed Antenna System 815
given with unit sum transmission power. The complete channel matrix of the lth subcarrierbetween the K RAUs and the STA is expressed as
Hl =[H(0)
l ,H(1)l , . . . ,H(K−1)
l
](1)
which is a N × KM matrix. And each element H (k)l is the channel matrix of the kth RAU
and the STA of size N × M . So, the received signal of the lth subcarrier at the STA is
yl = Hlwxl√KM
+ nl (2)
where xl is the symbol transmitted on the lth subcarrier with unit power, i.e. E(|xl |2) = 1.nl is the N × 1 Gaussian noise vector with zero mean and E(nlnH
l ) = δ2I. w is the transmitbeam steering vector for all the antenna elements at the K RAUs, which satisfies
wHw = KM (3)
such that the total transmission power is normalized to 1, i.e. E(|w xl√
KM|2
)= 1. Each
component of w is a complex number that modifies both the amplitude and phase of thesignal. The transmission power of the RAUs is therefore controlled according to the channelstates. The decision variable after receive beamforming is then given by
rl = cHyl = cHHlwxl√KM
+ cHnl = Hc,w[l] xl√KM
+ cHnl (4)
where c is the beamforming vector at the receiver side and cH c = N ; Hc,w[l] = cHHlw isthe effective channel gain after beamforming. Then, we can obtain the noise power of the lthsubcarrier as
E
(∣∣∣cHnl∣∣∣2)
= Nδ2 (5)
The SNR of this subcarrier is
SNRl,blanket(c,w) =E
(∣∣∣Hc,w[l] xl√KM
∣∣∣2)
Nδ2= |Hc,w[l]|2
KMNδ2(6)
To achieve the highest SNR, we need to find the beamforming vectors,w and c, to maximizethe effective channel gain Hc,w[l]. Ideally, the beamforming vectors can be optimized foreach subcarrier. Assuming perfect channel knowledge, these vectors can be found throughsingular value decomposition (SVD) of the channel matrix Hl [16]. That is, the channelmatrix of the lth subcarrier is first decomposed into
Hl = UlDlVHl (7)
whereUl andVl are unitary matrices of size N ×N and KM×KM , respectively, andDl is aN × KM matrix with the ( j, j)th element, denoted by λl, j for j = 1, 2, . . . ,min(N , KM),being the singular values and the other elements are zero, and λl, j = λl,k for j > k. Then,the optimum beamforming vectors are derived as
c = √Nul,1, w = √
KMvl,1 (8)
where ul,1 and vl,1 are the first column of Ul and Vl . Finally, the maximum SNR can beobtained as
γl = maxc,w
|cHHlw|2MNδ2
= |λl,max|2δ2
(9)
123

816 Q. Wang et al.
Since each subcarrier may have a different SNR, the average SNR should be taken as thelink performance. We employ in this paper the exponential effective SNR mapping (EESM)scheme which is widely adopted, like in [16,17], to characterize the OFDM signal quality.The relation between the effective SNR and the SNR of the subcarriers is expressed as [18]
γeff = −β ln
(1
L
L−1∑l=0
exp
(−γl
β
))(10)
where β is a parameter depending on the modulation and coding scheme (MCS). The valuesof β can be found in [18] and it is set to two in this paper, which is a typical value for QPSKsignaling.
2.2.2 Selective Transmission
In selective transmission, the RAUwith the best channel condition is used to transmit signalswith full power. For example, if the kth RAU is chosen, the received symbol of the lthsubcarrier after beamforming is given by
r (k)l = cHH(k)
l wxl√M
+ cHnl = H (k)c,w[l] xl√
M+ cHnl (11)
So the SNR of the received signal is
SNR(k)l = |H (k)
c,w[l]|2MNδ2
(12)
The optimum beamforming is performed by using the following beamforming vectors
c = √Nu(k)
l,1 , w = √Mv(k)
l,1 (13)
where u(k)l,1 and v(k)
l,1 are the first columns of U(k)l and V(k)
l , which are derived from the SVD
of H(k)l , i.e. H(k)
l = U(k)l D(k)
l V(k)l . Then, the maximum SNR of the lth subcarrier using the
kth RAU is derived as
γ(k)l =
∣∣∣λ(k)l,max
∣∣∣2
δ2(14)
And the effective SNR is thus expressed as
γ(k)eff = −β ln
(1
L
L−1∑l=0
exp
(−γ
(k)l
β
))(15)
Then, the RAU with the highest effective SNR is selected, i.e. the effective SNR of selectivetransmission is given by
γeff,selective = maxk
γ(k)eff, k = 0, . . . K − 1 (16)
The above derivations of beamforming are based on the assumption that the wirelesschannel is known at both the transmitter and the receiver side. Normally, the transmitter cansend probing signals to the channel and then the receiver calculates the channel informationand feeds it back to the transmitter. Due to the large overhead of the feedback procedure,perfect channel knowledge is usually not available in practice. However, we would like toelucidate the potential of 60GHz DAS, so full channel knowledge is assumed for the analysis
123

Distributed Antenna System 817
to get more general results. For a practical beamforming approach, one can refer to otherstudies like [17,19], which use limited channel information feedback or codebook basedbeamforming.
3 60GHz Channel Model and Simulation Method
The beamforming models introduced in the last section require the channel information ofall antenna pairs at arbitrary positions. It is necessary to simulate 60GHz channels in a 3Dspace so as to incorporate factors like the physical position of the RAUs and the shadowingeffect of humans, which have significant impact on the wireless channel. Because of thephysical characteristics of 60GHz signal, the wireless channel simulation is different fromthe lower frequencies. This section will describe the 60GHz mathematical channel modeland our simulation method based on 3D ray tracing, which should give acceptable accuracy.
3.1 60GHz Channel Model
In the lower WLAN frequency bands like 2.4 and 5GHz, the wireless channel models areusually separated into large scale and small scale fading models. However, this approachis not applicable for 60GHz due to the application of high directional steerable antennas orbeamforming algorithms, which leads to the filtering out of a single cluster of the propagationchannel [20]. The path loss and channel impulse response (CIR) significantly depend on thecharacteristics of this cluster, which in general does not allow developing independentmodelsfor them. In this paper, we use a general discrete-path channel model, which characterizesthe signal paths or rays with parameters including the path gain, the time delay, the angle ofarrival (AoA), and the angle of departure (AoD). This allows us to examine the performanceof beamforming at both the transmitter and the receiver sides. The 3-dimensional CIR modelis given as follows and is also depicted in Fig. 3.
h(t, ϕt , θt , ϕr , θr ) =L−1∑l=0
αlδ(t − τl)δ(ϕt − ϕt,l)δ(θt − θt,l)δ(ϕr − ϕr,l)δ(θr − θr,l) (17)
where αl is the complex gain (including amplitude and phase) of the lth path with AoD[ϕt,l , θt,l ], AoA [ϕr,l , θr,l ], and time of arrival (ToA) τl . The term δ(·) represents the Diracdelta function. ϕ represents the elevation angle which is in the range of [−π/2, π/2]; θ isthe azimuth angle in the range of [0, 2π ]; L is the number of multipath components. Notice
Fig. 3 Illustration of channelimpulse response model
( 1, 1, ,1, ,1, ,1, ,1)
( 0, 0, ,0, ,0, ,0, ,0)
( 2, 2, ,2, ,2, ,2, ,2)Tx Rx
Reflector 1
Reflector 2
123

818 Q. Wang et al.
that we misuse L to represent both the number of subcarriers and signal paths, which shouldbe identifiable in accordance with the context.
For an OFDM system, the channel gain of each subcarrier between the mth Tx antennaand the nth Rx antenna, is denoted as Hn,m[l], where l = 0, . . . , L − 1 represent the indicesof subcarriers. It is formally obtained through the following steps [16]. First, the CIR betweenthe two antennas, hn,m(t), is convolved with the pulse shaping filer c(t), which is typicallya raised cosine filter; and then sampled at the symbol rate, which results in the discrete-timeCIR (DT-CIR), hn,m[n]. Then, Hn,m[l] is derived from the L-point DFT of hn,m[n]. TheN × M channels between the kth RAU and the STA are grouped as H(k)
l with the (n,m)th
element given byH(k)n,m[l]. This channel matrix can then be used in the beamforming process
presented in Sect. 2.
3.2 60GHz Channel Simulation with 3D Ray Tracing
Because of the millimeter-wave characteristics of 60GHz signal, ray tracing is accepted as amore accurate way to simulate the physical channel in comparison with the empirical models[8,21]. So, we use a 3D ray tracing software called Radiowave Propagation Simulator (RPS)[5,22] to obtain the CIRs. RPS can predict, with verified accuracy, the paths between arbitrarytransmitter and receiver positions and antenna patterns. The information of all the possiblemultipath components, including path gain, time delay, AoD and AoA can be recorded andexported into text files. This allows us to re-construct the CIRs in the exact form of Eq. (17).
For a single antenna simulation, the channels can be directly simulated by RPS. However,the RAUs and STAs all have multiple antennas that results in a large number of channelsfrom the combination of them, which makes it too time-consuming to obtain all the CIRsby RPS. Alternatively, we obtain the CIRs through the following method. First, we use RPSto simulate the CIRs by using isotropic antennas at both the transmitter and receiver sidesfor all predefined positions. Then, calculate the CIRs of the channels of all antenna elementsby adding the phase shifts caused by the geometric position of the antenna elements. Thephase shifts are calculated for each multipath component. So finally, from a single simulatedchannel between isotropic antennas, we can construct the multiple channels between allantenna elements mathematically. This approach is based on the fact that the antennas arecollocated with small spacing (half carrier wavelength) in between, so the reflectors canbe assumed to be in the far field. The path difference of different antenna elements can besimplified into the phase difference induced by their relative distance. The mathematicaldescription for obtaining the spatial CIRs can be found in [23]. We formulate this theory inthe following in combination with the channel model provided previously.
Given the CIR between the first antenna element pair of the transmitter and receiver, say
hnx=0,ny=0,mx=0,my=0(t) =L−1∑l=0
αlδ(t − τl)δ(ϕt − ϕt,l)δ(θt − θt,l)δ(ϕr − ϕr,l)δ(θr − θr,l)
(18)
The coordinate of the (mx ,my)-th Tx antenna element is ((mx − 1)λ/2, (my − 1)λ/2, 0).Its relative distance to the first element (0, 0) in the direction of (ϕt , θt ) is
�dmx ,my (ϕt , θt ) = (mx − 1)λ
2sin θt sin ϕt + (my − 1)
λ
2sin θt cosϕt (19)
123

Distributed Antenna System 819
which introduces a phase shift of
�φt (ϕt , θt ) = �dmx ,my (ϕt , θt )
λ· 2π (20)
where λ is the wavelength of the carrier frequency. The phase shift at the receiver can also bederived similarly, which is denoted as �φr (ϕr , θr ). The phase shifts are then added to all thepaths of the first antenna element pair and then derive the channel between the (mx ,my)thand the (nx , ny)th element pair as
hnx ,ny ,mx ,my (t) =L−1∑l=0
αl exp ( j�φt (ϕt,l , θt,l) exp ( j�φr (ϕr,l , θr,l)
× δ(t − τl)δ(ϕt − ϕt,l)δ(θt − θt,l)δ(ϕr − ϕr,l)δ(θr − θr,l) (21)
These calculated CIRs are then used in the simulations in the next section.
4 Simulation Setup
Intuitively, the performance of the DAS beamforming system is related to several factorsincluding room size, population, the number of RAUs that can be used, the position ofthe RAUs, and the transmission strategy adopted. We then set up a number of scenarios todiscover their impacts. We define three realistic indoor scenarios, living room, office roomand conference room, to represent different room sizes. The lengths, widths and heights ofthe rooms are given below:
– Living room: 6m × 6m × 3m– Office room: 10m × 6m × 3m– Conference room: 10m × 10m × 4m
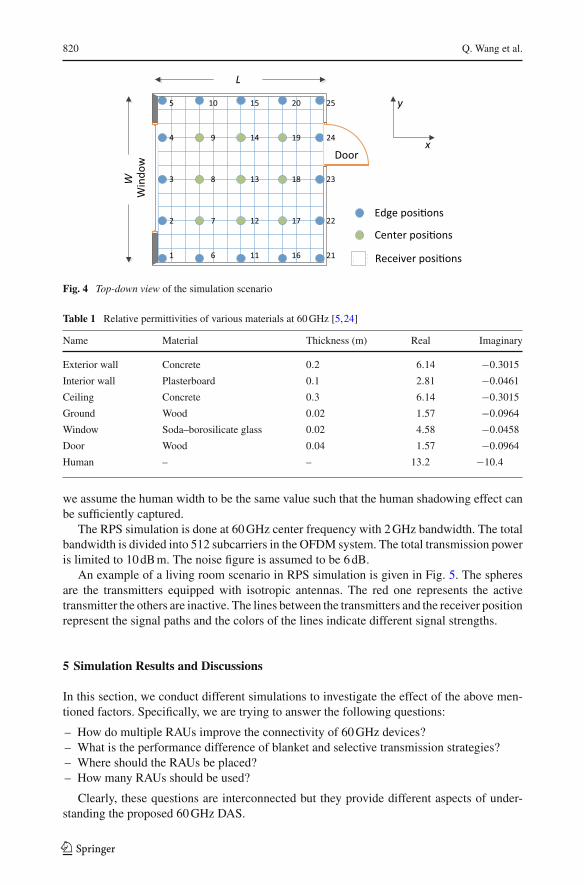
For all the rooms, one side of the walls is made of concrete with a window of 4m×1msize in the center, which represents the exterior wall. The other three sides are interior wallscovered with plasterboard. A door is located on the opposite side of the exterior wall with thesize of 1.5m (width)×2m(height) (closed in simulation). An example is shown in Fig. 4,showing the top-down view of the living room setup.
Humans are modeled as absorptive rectangular prisms with the same height (1.75m)and width (0.5m), random facing direction, and random positions. In each snapshot, whichrepresent an independent RPS simulation, the humans are randomly placed with uniformdistribution in a room. For each simulation scenario, we take 20 snapshots and then averagethe collected results. The EMproperties of the different materials used in the RPS simulationsare listed in Table 1.
All the RAUs are placed on the ceiling which we think is a suitable place for practicalinstallations. Moreover, higher heights can provide better visibility to the stations [8]. TheRAU positions are divided into two groups, i.e. edge positions and center positions. Thecoordinates of the positions are the geometrical center and edge of the ceiling plane with0.2m resolution. The exact position of them will be scaled with respect to the room size.These positions are defined in this way also because they are easy to locate in reality. Thenumbers in Fig. 4 represents the indices of the RAU positions. The receivers are placed onthe horizontal planes of three different heights: 0, 0.5 and 1m, with a grid spacing of 0.5m, torepresent the possible receiver positions inside a room. This grid spacing is chosen because
123
820 Q. Wang et al.
Edge posi�ons
Center posi�ons
Receiver posi�ons
W
L
Doorx
y
Win
dow
1
2
3
4
5
6
7
8
9
10
11
12
13
14
15
16
17
18
19
20
21
22
23
24
25
Fig. 4 Top-down view of the simulation scenario
Table 1 Relative permittivities of various materials at 60GHz [5,24]
Name Material Thickness (m) Real Imaginary
Exterior wall Concrete 0.2 6.14 −0.3015
Interior wall Plasterboard 0.1 2.81 −0.0461
Ceiling Concrete 0.3 6.14 −0.3015
Ground Wood 0.02 1.57 −0.0964
Window Soda–borosilicate glass 0.02 4.58 −0.0458
Door Wood 0.04 1.57 −0.0964
Human – – 13.2 −10.4
we assume the human width to be the same value such that the human shadowing effect canbe sufficiently captured.
The RPS simulation is done at 60GHz center frequency with 2GHz bandwidth. The totalbandwidth is divided into 512 subcarriers in the OFDM system. The total transmission poweris limited to 10dBm. The noise figure is assumed to be 6dB.
An example of a living room scenario in RPS simulation is given in Fig. 5. The spheresare the transmitters equipped with isotropic antennas. The red one represents the activetransmitter the others are inactive. The lines between the transmitters and the receiver positionrepresent the signal paths and the colors of the lines indicate different signal strengths.
5 Simulation Results and Discussions
In this section, we conduct different simulations to investigate the effect of the above men-tioned factors. Specifically, we are trying to answer the following questions:
– How do multiple RAUs improve the connectivity of 60GHz devices?– What is the performance difference of blanket and selective transmission strategies?– Where should the RAUs be placed?– How many RAUs should be used?
Clearly, these questions are interconnected but they provide different aspects of under-standing the proposed 60GHz DAS.
123

Distributed Antenna System 821
Rx
Tx
Human
-110 dBm
-102 dBm
-94 dBm
-86 dBm
-78 dBm
-70 dBm
Fig. 5 RPS simulation model of living room
5.1 Coverage Improvement with Multiple RAUs
This subsection simulates the coverage improvement with multiple RAUs. The simulationsare conducted in the living room scenario with 1–4 RAUs. Each RAU and STA is equippedwith an isotropic antenna. The total transmission power is set to 10dBmfor all simulations andis equally allocated to the RAUs. All RAUs are used for transmitting signals simultaneously.The position of the RAUs are configured as: 1 RAU—13; 2 RAUs—(11, 15); 3 RAUs—(11,13, 15); 4 RAUs—(3, 11, 15, 23), which are indicated by the position indices shown in Fig. 4.The received power across the 1m-height receiver plane (with 0.2m resolution) is given inFig. 6. It can be observed that the shadowed receiver positions have more than 10dB lowerpower than the visible positions. These shadowing positions are eliminated whenmore RAUsare used. The improvement is a result of the RAU diversity that offers richer signal paths,especially the LOS paths that take the major portion of the received signal power. Thus, whensome RAUs are obstructed by objects, the other RAUs may still be reachable such that theconnectivity can be sustained. With beamforming, the signal strength of the visible positionscan be enhanced to achieve higher data rates. However, the shadowed positions that havemuch lower signal power, may require other approaches to reach the desired power level.
5.2 Blanket and Selective Transmission Strategies
As stated in Sect. 2, there are two strategies to use the RAUs in aDAS.Different beamformingstrategies use different antennas which implies that the requirement of channel informationand beamforming complexity are different. The selective transmission strategy has lowerbeamforming complexity due to its simplicity in calculating the beamforming vectors. Thisleads us to compare their performance under different conditions so as to understand thedifferences.
Since it is a necessity for 60GHz devices to use directional antennas to reach longerdistances to cover the entire room,we assume a planar antenna arraywith 4 isotropic elementsat each RAU and each STA. The locations of the RAUs are arranged as follows (simplifiedin consideration of the geometrical symmetry of the rooms):
– 1 RAU: located at the center of the ceiling– 2 RAUs: located at the symmetric center or edge positions of the ceiling
123

822 Q. Wang et al.
Fig. 6 Power distribution with respect to different number of RAUs with equal power allocation. The whitepixels are the positions occupied by humans. Red dots represent the position of the RAUs a 1 RAU, b 2 RAUs,c 3 RAUs, d 4 RAUs
– 3 RAUs: one located at the center of the ceiling and the other two at the symmetric centerand edge positions of the ceiling
– 4 RAUs: all RAUs located at the symmetric center or edge positions of the room
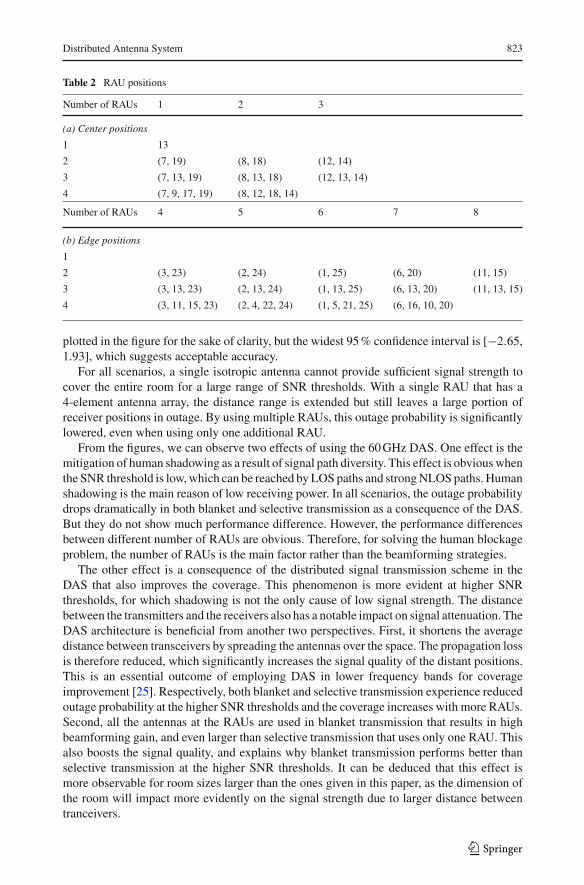
So, there are several candidate positions for a specific number of RAUs. All the possiblepositions are listed in Table 2 while the symmetric positions are omitted.
For each scenario with various number of RAUs, all the possible RAU locations aresimulated. In each simulation, ten humans are randomly placed in a room. Then, the receivedSNR of each STA position is calculatedwith different beamforming approaches. This processis repeated for 20 times. In the end, the RAU positions that give the highest average SNRof the 20 simulations are selected, to remove the effect of the RAUs’ position. The averagedoutage probability curves of different scenarios with different number of RAUs and SNRthresholds are plotted in Fig. 7. The outage probability is defined as the percentage of areawithin a room that is lower than the SNR threshold. Due to the discretized receiver positions,there are several receiver positions occupied by humans that cannot be covered, so the lowerbound of outage probability is not equal to zero. The confidence intervals of the data are not
123
Distributed Antenna System 823
Table 2 RAU positions
Number of RAUs 1 2 3
(a) Center positions
1 13
2 (7, 19) (8, 18) (12, 14)
3 (7, 13, 19) (8, 13, 18) (12, 13, 14)
4 (7, 9, 17, 19) (8, 12, 18, 14)
Number of RAUs 4 5 6 7 8
(b) Edge positions
1
2 (3, 23) (2, 24) (1, 25) (6, 20) (11, 15)
3 (3, 13, 23) (2, 13, 24) (1, 13, 25) (6, 13, 20) (11, 13, 15)
4 (3, 11, 15, 23) (2, 4, 22, 24) (1, 5, 21, 25) (6, 16, 10, 20)
plotted in the figure for the sake of clarity, but the widest 95% confidence interval is [−2.65,1.93], which suggests acceptable accuracy.
For all scenarios, a single isotropic antenna cannot provide sufficient signal strength tocover the entire room for a large range of SNR thresholds. With a single RAU that has a4-element antenna array, the distance range is extended but still leaves a large portion ofreceiver positions in outage. By using multiple RAUs, this outage probability is significantlylowered, even when using only one additional RAU.
From the figures, we can observe two effects of using the 60GHz DAS. One effect is themitigation of human shadowing as a result of signal path diversity. This effect is obviouswhenthe SNR threshold is low,which can be reached byLOSpaths and strongNLOSpaths. Humanshadowing is the main reason of low receiving power. In all scenarios, the outage probabilitydrops dramatically in both blanket and selective transmission as a consequence of the DAS.But they do not show much performance difference. However, the performance differencesbetween different number of RAUs are obvious. Therefore, for solving the human blockageproblem, the number of RAUs is the main factor rather than the beamforming strategies.
The other effect is a consequence of the distributed signal transmission scheme in theDAS that also improves the coverage. This phenomenon is more evident at higher SNRthresholds, for which shadowing is not the only cause of low signal strength. The distancebetween the transmitters and the receivers also has a notable impact on signal attenuation. TheDAS architecture is beneficial from another two perspectives. First, it shortens the averagedistance between transceivers by spreading the antennas over the space. The propagation lossis therefore reduced, which significantly increases the signal quality of the distant positions.This is an essential outcome of employing DAS in lower frequency bands for coverageimprovement [25]. Respectively, both blanket and selective transmission experience reducedoutage probability at the higher SNR thresholds and the coverage increases with more RAUs.Second, all the antennas at the RAUs are used in blanket transmission that results in highbeamforming gain, and even larger than selective transmission that uses only one RAU. Thisalso boosts the signal quality, and explains why blanket transmission performs better thanselective transmission at the higher SNR thresholds. It can be deduced that this effect ismore observable for room sizes larger than the ones given in this paper, as the dimension ofthe room will impact more evidently on the signal strength due to larger distance betweentranceivers.
123

824 Q. Wang et al.
Fig. 7 Outage probability ofdifferent transmission strategies.a Living room, b office room,c conference room
0 5 10 15 20 25 300
10
20
30
40
50
60
70
80
90
100
SNR thresholds (dB)
Out
age
prob
abili
ty (%
)
Omni1RAU2RAUs−Blanket2RAUs−Selective3RAUs−Blanket3RAUs−Selective4RAUs−Blanket4RAUs−Selective
(a)
0 5 10 15 20 25 300
10
20
30
40
50
60
70
80
90
100
SNR thresholds (dB)
Out
age
prob
abili
ty (%
)
Omni1RAU2RAUs−Blanket2RAUs−Selective3RAUs−Blanket3RAUs−Selective4RAUs−Blanket4RAUs−Selective
(b)
0 5 10 15 20 25 300
10
20
30
40
50
60
70
80
90
100
SNR thresholds (dB)
Out
age
prob
abili
ty (%
)
Omni1RAU2RAUs−Blanket2RAUs−Selective3RAUs−Blanket3RAUs−Selective4RAUs−Blanket4RAUs−Selective
(c)
123

Distributed Antenna System 825
Table 3 Outage probability with 6dB SNR threshold
Number of RAUs 2 3 4
Center (%) Edge (%) Center (%) Edge (%) Center (%) Edge (%)
(a) Blanket transmission
Living room 7.75 7.04 5.76 3.57 3.53 1.89
Office room 5.08 4.18 3.68 1.76 2.20 0.90
Conference room 3.28 2.35 2.34 1.07 1.43 0.72
(b) Selective transmission
Living room 7.85 6.57 6.02 3.39 3.91 1.87
Office room 5.23 4.44 3.98 1.83 2.54 0.82
Conference room 3.28 2.55 2.31 1.31 1.42 0.68
5.3 Position of the RAUs
The positions of the RAUs are of great importance since they not only impact the availabil-ity of LOS paths but also the propagation loss between the STAs and RAUs. The optimumposition of the RAUs should be related to the room size and the transmission strategies.These relationships are elucidated through the following simulations. We divide the previ-ously defined RAU positions into two groups, i.e. center positions and edge positions. Thesimulation parameters are the same as in the last subsection. We then collect the outageprobabilities of the best RAU positions in each group, for blanket and selective transmis-sion strategy, respectively. Notice that, the following discussion is under the assumption ofa specific human density. We also investigate at both low and high SNR thresholds.
We first set the SNR threshold to 6dB as it can be achieved in all scenarios under LOScondition but not under all NLOS conditions (observed from Fig. 7) when using a singleRAU, so that we can evaluate the performance of human shadowing alleviation. The resultsare shown in Table 3. The data shows that, the best edge positions perform better than thebest center positions in most simulation setups. This implies that larger RAU separation canprovide better LOS visibility against human blockage. Furthermore, the outage probabilitiesof the best center positions are 1.1–3.1 times higher than the best edge positions, which maysuggest that optimizing the positions of the RAUs can improve the performance to someextent.
Above that, there is also a notable performance difference for the RAU positions inside thecenter and the edge groups.We find that the largest outage probabilities are [1, 58%] and [27,128%] higher than the lowest ones in the two groups, respectively. We understand that, in theedge groups, the performance has stronger dependence on the location of the RAUs. Centerpositions have lower variations due to smaller position difference.We then give the indices ofthe best RAU positions in Table 4, indicated by the position indices of Table 2. Interestingly,we find that diagonal center positions seem to be the most optimum center position in allconfigurations. The optimum edge positions, however, change in different scenarios and fordifferent transmission strategies. Hence, if we want to place the RAUs at edge positions, it isnecessary to choose the positions according to the environment, particularly the room size,in order to have optimum performance. This requirement is relaxed if we choose the centerpositions, which can reduce the installation complexity. For this reason, we might suggest toplace the RAUs at the diagonal center positions in practice, although the performance maynot be the optimal.
123

826 Q. Wang et al.
Table 4 Best RAU positions of different transmission strategies
Number of RAUs 2 3 4
Center Edge Center Edge Center Edge
(a) Blanket transmission
Living room 1 5 1 5 1 4
Office room 1 7 1 6 1 6
Conference room 1 4 1 6 1 4
(b) Selective transmission
Living room 1 7 1 5 1 4
Office room 1 7 1 6 1 6
Conference room 1 4 1 7 1 4
Table 5 Outage probability with 13dB SNR threshold
Number of RAUs 2 3 4
Center (%) Edge (%) Center (%) Edge (%) Center (%) Edge (%)
(a) Blanket transmission
Living room 17.20 20.55 9.98 7.85 4.80 3.43
Office room 17.03 32.58 9.95 9.85 5.26 3.50
Conference room 41.01 62.08 14.91 21.11 6.08 6.15
(b) Selective transmission
Living room 21.44 26.61 15.92 11.56 6.84 6.57
Office room 23.81 45.57 17.91 18.47 5.82 11.49
Conference room 63.30 70.58 54.24 55.36 31.51 46.74
Another case is the performance at higher SNR thresholds. We then increase the thresholdto 13dB and collect the outage probabilities in Table 5. As mentioned previously, the signalpropagation loss dominates the reasons of outage at higher SNR thresholds. The RAUs’positions become a more important factor of performance. Except that the center positionsseem superior when using two RAUs, we do not see a regular pattern for 3 and 4 RAUs inthe two tables. This suggests that it is crucial to optimize the position of the RAUs at higherSNR thresholds, which is understandable since we need to optimize the distances betweenthe RAUs and the STAs in the room. In addition, when using more RAUs, the probabilityof outage drops significantly for all cases because the propagation loss is compensated bybeamforming. However, for overcoming path loss, the easier and more cost-effective way isto increase the antenna array size instead of deploying more RAUs.
A practical 60GHz system may cover a large range of SNR thresholds for different mod-ulation and coding schemes (MCSs). So, the cases of low and high SNRs may both exist.A balance is required for placing the RAUs to compromise most applications. Since mostrooms have similar sizes as the ones given in this paper, we believe that the lack of LOS linkavailability is the main problem. So, more attention should be paid to improving LOS linkvisibility, which is equivalently the lower-SNR case discussed here.
123

Distributed Antenna System 827
5 10 15 20 25 300
10
20
30
40
Out
age
prob
abili
ty (%
)
Number of humans
Center positions
1 RAU2 RAUs3 RAUs4 RAUs
5 10 15 20 25 300
10
20
30
40
Out
age
prob
abili
ty (%
)Number of humans
Edge positions
1 RAU2 RAUs3 RAUs4 RAUs
(a)
5 10 15 20 25 300
10
20
30
40
Out
age
prob
abili
ty (%
)
Number of humans
Center positions
1 RAU2 RAUs3 RAUs4 RAUs
5 10 15 20 25 300
10
20
30
40
Out
age
prob
abili
ty (%
)
Number of humans
Edge positions
1 RAU2 RAUs3 RAUs4 RAUs
(b)
Fig. 8 Outage probability versus the number of humans. a Blanket transmission, b selective transmission
5.4 The Number of RAUs
As mentioned earlier, the number of RAUs has a significant role in solving the blockageproblem. It is reported in [6] that the visibility probability can be significantly improvedby only two APs. A similar result is also found in our analysis of DAS systems with asmall number of RAUs. We simulate a conference room scenario with different numbersof humans (5–30) and different RAU configurations. The RAUs are placed at the optimumpositions given in Table 4. For simplifying the simulation, we only simulate the receiver layerat 1m height. For each case, we take ten snapshots. The outage probability curves of 6dB SNRthreshold for different setups are plotted in Fig. 8. The error bars indicate the 95% confidenceintervals of the averaged data. Notice that the 1-RAU case is the same in all figures.
123
828 Q. Wang et al.
With larger population, the frequency of human blockage should be heavier. From the fig-ures, we see that the outage probability increases almost linearly with the number of humans.However, when the population increases, we observe that the transmission strategies andRAU positions do not affect the performance much since the outage probability differencesare relatively small. On the contrary, the number of RAUs plays the main role with respectto population. There is a clear improvement when more RAUs are involved. With more thanthree RAUs, the outage probability is reduced close to the lower bound (close to the value ofthe factor of population and the number of receiver positions in the simulations), especiallyfor the cases of using four RAUs. The largest outage probability drop happens when twoRAUs are used. By using three or four RAUs, only a few percentages of outage probabil-ity are decreased, even when the population grows to 30. Therefore, two RAUs could be apractical choice in the sense cost-effectiveness for a moderate population.
6 Conclusions
The paper has proposed to improve 60GHz communication performance by employing aDAS architecture. Particularly, 60GHz DAS employing multiple RAUs can significantlymitigate the shadowing effect of obstacles. We have validated this idea by means of buildingmathematical models and conducting extensive simulations. The questions of how to utilizethemultiple RAUs for beamforming,where to place them and howmany should be employed,have been answered in the paper. We found that, for alleviating the shadowing effect, thenumber of RAUs plays a very important role. For a reasonable human density, two RAUscould be a practical solution that dramatically increases the 60GHz link connectivity. Theyshould be placed sufficiently far apart from each other. For a coarse installation, they can beplaced at the diagonal centers of the ceiling,which is applicable tomost practical roomshapes.And higher performance can be achieved by optimizing the RAUs’ positions according tothe layout of a room. However, blanket and selective transmission do not exhibit significantdifference between each other, in terms of solving shadowing problem. This may suggestthat selective transmission is more preferable due to its lower complexity.
The studies in this paper assumed that the beamformingmethods are optimal, but this is notfeasible in practice. So, further investigations, like considering codebook based beamformingthat is currently employed by 60GHz WLAN/WPAN standards, are of great importance.However, the results presented in this paper should give meaningful insights for these futureworks.
Acknowledgments The work in this paper is supported by Dutch IOP Gencom MEANS project.
References
1. Smulders, P. (2002). Exploiting the 60 GHz band for local wireless multimedia access: Prospects andfuture directions. IEEE Communication Magazine, 40(1), 140–147.
2. Rappaport, T. S., Murdock, J. N., & Gutierrez, F. (2011). State of the art in 60-GHz integrated circuitsand systems for wireless communications. Proceedings of the IEEE, , 99(8), 1390–1436.
3. Zhou, L., & Ohashi, Y. (2012). Efficient codebook-based MIMO beamforming for millimeter-waveWLANs. In Proceedings of the 2012 international symposium on personal indoor and moobile radiocommunications (PIMRC 2012) (pp. 1885–1889).
4. Collonge, S., Zaharia, G., & Zein, G. E. (2004). Influence of the human activity on wide-band char-acteristics of the 60 GHz indoor radio channel. IEEE Transactions on Wireless Communications, 3(6),2396–2406.
123

Distributed Antenna System 829
5. Genc, Z., Rizvi,U.H.,Onur, E.,&Niemegeers, I. (2010). Robust 60GHz indoor connectivity: Is it possiblewith reflections? In Proceedings of 2010 IEEE 71st vehicular technology conference (VTC 2010- Spring)(pp. 1–5).
6. Sato, K., Manabe, T., Ihara, T., Saito, H., Ito, S., Tanaka, T., et al. (1997). Measurements of reflection andtransmission characteristics of interior structures of office building in the 60-GHzband. IEEETransactionson Antennas and Propagation, 45(12), 1783–1792.
7. Sawada, H., Takahashi, S., & Kato, S. (2012). Disconnection probability improvement by using artificialmulti reflectors for millimeter-wave indoor wireless communications. In Proceedings of 2012 IEEE 75thvehicular technology conference (VTC 2012-Spring) (Vol. 61, pp. 1868–1875).
8. Genc, Z., Olcer, G. M., Onur, E., & Niemegeers, I. (2010). Improving 60 GHz indoor connectivity withrelaying. In Proceedings of 2010 IEEE international conference on communications (ICC 2010) (pp.1–6).
9. Sato, K., &Manabe, T. (1998). Estimation of propagation-path visibility for indoor wireless LAN systemsunder shadowing condition by human bodies. In Proceedings of the 1998 48th IEEE vehicular technologyconference (VTC 1998) (Vol. 3, pp. 2109–2113).
10. Zhang, X., Zhou, S., Wang, X., Niu, Z., Lin, X., Zhu, D. & Lei, M. (2012). Improving network throughputin 60GHz WLANs via multi-AP diversity. In Proceedings of 2012 IEEE international conference oncommunications (pp. 4803–4807).
11. Crisp, M. J., Li, S., Watts, A., Penty, R. V., & White, I. H. (2007). Uplink and downlink coverageimprovements of 802.11 g signals using a distributed antenna network. Journal of Lightwave Technology,25(11), 3388–3395.
12. Sauer, M., Kobyakov, A., & George, J. (2007). Radio over fiber for picocellular network architectures.Journal of Lightwave Technology, 25(11), 3301–3320.
13. Guillory, J., Meyer, S., Sianud, I., Ulmer-moll, A. M., Charbonnier, B., Pizzinat, A., et al. (2010). Radio-over-fiber architectures. IEEE Vehicular Technology Magazine, 5(3), 30–38.
14. Heath, R., Peters, S., Wang, Y., & Zhang, J. (2013). A current perspective on distributed antenna systemsfor the downlink of cellular systems. IEEE Communications Magazine, 51(4), 161–67.
15. Beas, J., Castanón, G., &Aldaya, I. (2013).Millimeter-wave frequency radio over fiber systems: A survey.IEEE Communications Surveys and Tutorials, 15(4), 1593–1619.
16. Yoon, S., Jeon, T., &Lee,W. (2009). Hybrid beam-forming and beam-switching forOFDMbasedwirelesspersonal area networks. IEEE Journal on Selected Areas in Communications, 27(8), 1425–1432.
17. Lee, H.-H., & Ko, Y.-C. (2011). Low complexity codebook-based beamforming for MIMO-OFDM sys-tems in millimeter-wave WPAN. IEEE Transactions on Wireless Communications, 10(11), 3607–3612.
18. Blankenship, Y., & Sartori, P. (2004). Link error prediction methods for multicarrier systems. In: Pro-ceedings of 2004 IEEE 60th vehicular technology conference (VTC 2004-Fall) (Vol. 6, pp. 4175–4179).
19. Ramachandran, K., Prasad, N., Hosoya, K., Maruhashi, K., & Rangarajan, S. (2010). Adaptivebeamforming for 60 GHz radios: Challenges and preliminary solutions. In Proceedings of the 2010ACM international workshop on mmWave communications: From circuits to networks (mmCom’10)(pp. 33–38).
20. Akeyama, A. (2004). Channel models for 60 GHz WLAN systems. IEEE 802.11-09/0334r8.21. Smulders, P. (2004). 60GHz indoor radio propagation comparison of simulation andmeasurement results.
In Proceedings of the 2004 IEEE 11th symposium on communications and vehicular technology (SCVT2004) (pp. 2–5).
22. Deiner, J., Hbner, J., Hunold, D., & Voigt, J. (2008). RPS radiowave propagation simulator user manualversion 5.4. Actix GmbH.
23. Ertel, R. B., Cardieri, P., Sowerby, K. W., Rappaport, T. S., & Reed, J. H. (1998). Overview of spatialchannel models for antenna array communication systems. IEEE Personal Communications, 5(1), 10–22.
24. Langen, B., Lober, G., & Herzig, W. (1994). Reflection and transmission behaviour of building materialsat 60 GHz. In Proceedings of 1994 IEEE 5th international symposium on personal, indoor and mobileradio communications (PIMRC 1994) (pp. 505–509).
25. Winters, J., Kobyakov, A., & Sauer, M. (2011). Picocells withMIMO and cell bonding forWLANs. IEEEJournal on Selected Areas in Communications, 29(6), 1164–1171.
123

830 Q. Wang et al.
Qing Wang received his B.Eng. degree in Telecommunication Engi-neering from Xidian University, China, in 2009. In 2011, he obtainedhis M.E. degree in Information and Communication Engineering fromNational University of Defense Technology, China. He is currentlyworking towards his Ph.D. degree in COBRA Research Institute atEindhoven University of Technology, The Netherlands. His researchinterests include wireless and mobile communications, wireless indoornetworks, WLAN and radio-overfiber technologies.
Diptanil Debbarma was born in Agartala, India in 1986. He receivedhis B.E from Sathyabama University, India in Electronics and Telecom-munication in 2004 and graduated as one of the University Topper.He obtained his Masters (M.E) from the prestigious Indian Institute ofScience (IISc), India in Telecommunication, 2010, and was the recip-ient of the Ministry of Human Resource and Development (MHRD)scholarship. Currently he is pursuing his PhD at Eindhoven Univer-sity of Technology (ECO group) working for the Dutch IOP-GenComproject MEANS. His research interest includes Wireless Communica-tion, Wireless Network, Stochastic Network Control, Network Codingimplementation in wireless MAC, Information Theory, MU-MIMO,Cooperative and Distributed MIMO.
Anthony Lo [SM] ([email protected]) received combined B.S.and B.E., and Ph.D. degrees in 1992 and 1996 from La Trobe Univer-sity, Australia. He is currently a Principal Scientist at Huawei Tech-nologies R & D Sweden. He was an assistant professor at Delft Uni-versity of Technology and, prior to the academic appointment, he wasa research engineer at Ericsson EuroLab working on UMTS/HSPA andLTE. His research interests include M2MMassive MIMO, communica-tions, intelligent transportation systems, smart grids, and the wirelessnetwork cloud.
123

Distributed Antenna System 831
Zizheng Cao received his Bachelor of Science degree on electronicinformation science and technology (awarded “Outstanding Graduate”of Hunan Province, 2007) from Hunan Normal University, Chang-sha, China. And he obtained his Master of Engineering on telecomengineering (awarded “Outstanding thesis of master degree” of HunanProvince, 2010) from Hunan University, Changsha, China. He is cur-rently working towards the Ph.D. degree at Eindhoven Universityof Technology, Eindhoven, The Netherlands supervised by Prof. TonKoonen. Funded by NWO project “SOWICI”, he started to work onenergy efficient access/in-home optical networks empowered by inte-grated optics, low-complexity digital signal processing, and flexibleoptical network design. In SOWICI, the broadband optical mm-wavebeam steering system based on integrated optical circuit was built fora hybrid optical-wireless network. Further, the energy efficient andbroadband operation in such network were optimized by the dedicatedphysical optical layer design and the implementation of advanced DSP.
These research activities produce a series of interesting scientific results. Zizheng Cao has published 15 first-author peer-reviewed IEEE/OSA journal articles, including an invited paper in JLT. He also has an invitedtalk about the integrated optical radio beam steering system in PIERS 2014. His research articles have beencited for 448 times, with a H-index of 12 and a ‘i10’ factor of 14 (google scholar). His research interestsinclude modeling and design of integrated optical circuit, microwave photonics, advanced DSP, and phys-ical layer design of optical network. He is a student member of the IEEE Photonics Society. He serves asan active reviewer for many journals, including Journal of Lightwave Technology, Photonics TechnologyLetters, Photonics Journal, Journal of Optical Communications and Networking, Optics Communications,Opitcs Express, and Optics Letters.
Ignas Niemegeers got an MSc degree in Electrical Engineering fromthe University of Gent, Belgium in 1970, an MSc in 1972 and a PhDdegree in 1978 in Computer Engineering from Purdue University, USA.From 1978 to 1981 he was a system designer at Bell Telephone Mfg.Cy, Antwerp, Belgium. From 1981 to 2002 he was professor at theUniversity of Twente, The Netherlands. From 1995 to 2002 he wasScientific Director of the Centre for Telematics and Information Tech-nology (CTIT) of the University of Twente. From 2002 until 2012 hewas chairman of the Telecommunications Department and professor inWireless and Mobile Communications at Delft University of Technol-ogy. Since August 2012 he is emeritus professor at Delft University ofTechnology and advisor to the Centre for Wireless Technology at Eind-hoven University of Technology, The Netherlands. He was involved inmany European research projects and reviewer for many projects. Hispresent research interests are 5G, Radio-over-fiber networks, 60 GHznetworking, energy-harvesting networks.
Sonia Heemstra de Groot holds M.Sc. degrees in Electrical Engi-neering from Universidad Nacional de Mar del Plata, Argentina andPhilips International Institute/NUFFIC, The Netherlands. She obtainedthe Ph.D. degree in Electrical Engineering at the University of Twente,The Netherlands, in 1990. Since 2012 she is a full professor at Eind-hoven University of Technology where she holds the parttime chairin Heterogeneous Network Architectures. Before she has had assistantand associate professor positions at the University of Twente and a full-professor position at the Delft University of Technology in Personaland Ambient Networking. After having worked some years as a seniorresearcher at Ericsson EuroLab, The Netherlands, she cofounded theTwente Institute for Wireless and Mobile where she has been Chief Sci-entist from 2003 to 2014. Her expertise and interests are in the areasof wireless and mobile communications, wireless networks, Internet ofThings, wireless security, personal and ambient networks (co-inventor
123

832 Q. Wang et al.
of the concept of personal networks and federations concept), vehicular networks, wireless indoor communi-cations, and radio-based positioning techniques. She has coordinated and participated in many national andinternational research projects and has authored or co-authored more than 150 papers published in interna-tional journals or presented at international conferences.
123