distortions to agricultural incentives in western europe
TRANSCRIPT

Distortions to Agricultural Incentives
in Western Europe
Tim Josling
Freeman Spogli Institute for International Studies, Stanford University
Agricultural Distortions Working Paper 61, September 2008 This is a product of a research project on Distortions to Agricultural Incentives, under the leadership of Kym Anderson of the World Bank’s Development Research Group. The author is grateful for invaluable research support that was provided by Uli Kleinwechter and Teresa Rojas Lara of Humboldt University, for invaluable help with data compilation by Johanna Croser, Esteban Jara, Marianne Kurzweil, Signe Nelgen, Francesca de Nicola, Damiano Sandri and Ernesto Valenzuela, for helpful comments from workshop participants and from Stefan Tangermann, and for funding from World Bank Trust Funds provided by the governments of the Netherlands (BNPP) and the United Kingdom DfID) as well as the Rockefeller Foundation for use of the Bellagio Conference Center. A revised version of this paper without the Appendix will appear in Distortions to Agricultural Incentives: A Global Perspective, 1955 to 2007, edited by K. Anderson, London: Palgrave Macmillan and Washington DC: World Bank (forthcoming 2009). This is part of a Working Paper series (see www.worldbank.org/agdistortions) that is designed to promptly disseminate the findings of work in progress for comment before they are finalized. The views expressed are the authors’ alone and not necessarily those of the institutions with which the authors are employed, the World Bank and its Executive Directors, nor the countries they represent, nor of the countries providing the trust funds for this research project.

Distortions to Agricultural Incentives
in Western Europe
Tim Josling
European agricultural policy, in particular the Common Agricultural Policy (CAP) of the
European Union, has long been a matter of international interest. Overseas producers have
viewed agricultural policy in Europe as being a major impediment to the opening up of
international trade in farm products. Internally, the policy has been no less controversial, with
several member states seeking to “reform” the CAP and others regarding it as a foundation
for economic integration. The overall perception, both within and outside the EU, is of a
highly protective policy that shelters a high-cost agricultural sector from the winds of
competition blowing from the Americas, Australasia and North Africa. Supporters claim
social and political benefits from such protection, arguing that reduction of border protection
and cutting of domestic support would lead to the depopulation of rural Europe and the
destruction of the bedrock of social stability. Detractors see a policy that encourages
overproduction, with surpluses dumped on world markets, and a misallocation of scarce
resources from more profitable uses. In short, they view the CAP as a “poster child” for
agricultural distortions.
Some facts are un-controversial. The continent of Western Europe made a remarkable
recovery from the devastation of its infrastructure and productive capacity in the Second
World War to the highly sophisticated economies of the present day. Economic integration,
the development of a “single market” within the EU and the common approach taken towards
external trade, are widely agreed to have been a part of that success.1 The agricultural sector
has also gone through a dramatic transformation, from isolated national markets and
traditional production methods to an integrated EU-wide market and modern farms
employing sophisticated technology. To transform agriculture in this way within two
generations has been a remarkable feat. Agricultural policy has influenced that role in both
positive and negative directions. It has given shelter from foreign competition and 1 In a recent survey of European economic growth since 1950, Crafts and Toniolo (2008) conclude that incentive structures are a crucial explanator of comparative growth rates of the economies of Europe (east as well as west).

2
encouraged investment. But it has also encouraged high-cost production of commodities that
have shrinking markets. So the story of the policy developments and the distortions that these
policies maintain is valuable as a way of explaining some of the links between policy and
performance.
This chapter focuses on the developments in agricultural policy, and on the
consequent distortions to the economies of the Western European countries. It attempts to
answer four related questions.
• Has the level of protection, and the consequent distortion in resource use and consumer
purchases, been increasing or decreasing over the five decades from 1955-2007?
• How have the formation and subsequent enlargements of the European Union
influenced the patterns of and trends in agricultural protection?
• What have been the main drivers of agricultural policy and to what extent have external
influences impacted those forces?
• What can one say about the future trends and protection levels in Western Europe?
The chapter differs in some respects from the others in this volume. Three such
differences are worth noting here. Firstly, Western Europe contains a large number of
countries, with different agricultural capacity, climatic conditions, structures and political
views. The differences among these countries are often as important as the similarities, and
therefore generalizations are difficult to make. Inevitably, much of the focus is on the EU as
an aggregate unit, rather than on each individual member country, though this misses some of
the richness of the diversity of conditions. But from the viewpoint of the rest of the world, it
is of interest to see the aggregate impact of the variety of policies implemented in the EU and
more broadly in Western Europe.
Secondly, the process of economic integration has been more intensive and
comprehensive than in any other region, developed or developing. Agriculture has been
incorporated into that process of integration more fully than in most other regions, although
even within Western Europe there are differences in this regard. This means that the process
of integration plays a much greater role in Western Europe than in other regions in explaining
the pattern and trends in distortions. And as the membership in the European Community
(later the European Union) grew, countries that had previously autonomous policies adopted
the Common Agricultural Policy (CAP). So the number of agricultural policies in Western
Europe has in effect declined over the period considered by this study. The countries of

3
Western Europe have been converging over a fifty-year period towards a unified policy
towards agriculture.
And thirdly, the external aspects of agricultural policy have played a more significant
role in developing domestic policy in Western Europe than in most other regions. This is in
spite of the fact that the Common Agricultural Policy (CAP) has often appeared resistant to
pressures from abroad. The narrative of the last fifty years of agricultural policy in Western
Europe is closely linked to the development of trade rules for agricultural products in the
General Agreement on Tariffs and Trade (GATT) and the subsequent obligations undertaken
as a result of the Uruguay Round and the resulting transformation of the GATT Secretariat
into the World Trade Organization (WTO). And other trade agreements, notably the
obligations to former colonies through successive Lomé Agreements, have played a
significant role in driving some commodity programs within the CAP. In the EU, the
separation between domestic and foreign policy in the area of agriculture has always been
blurred. The Western European countries that are not members of the EU have been
influenced by many of the same influences.
Agriculture in Western Europe, 1955 to 2007: an overview
Agriculture in Western Europe enjoys a degree of diversity that reflects a wide variety of
soils and climatic conditions ranging from the arid Mediterranean regions to the Arctic
Circle. Superimposed on this natural diversity is the complexity of different social, economic
and political conditions in the eighteen countries that are the subject of this chapter.2 History
has played a major part in creating this patchwork, particularly the different paths that
countries took from feudalism to independent farming units and the inheritance laws that
influenced the extent to which land ownership was transmitted from generation to generation.
Average farm size varies considerably in the countries of Western Europe, in turn reflecting 2 The countries of Western Europe, for the purposes of this chapter, include the fifteen countries that were members of the EU (the EU-15) in early 2004 along with Norway, Iceland and Switzerland. In terms of policy developments we consider each country to have abandoned its autonomous domestic farm policy when it joined the EU. Thus eighteen countries had independent policies at the start of the period, in 1955, but by 2004 the number of independent policies had dropped to four – the EU, Norway, Iceland and Switzerland. The EU then expanded eastward to embrace eight Central European countries (plus Cyprus and Malta) in May 2004 and also Bulgaria and Romania in January 2007. Most of this chapter thus focuses on the period prior to the EU’s expansion eastward, while the chapter by Anderson and Swinnen (2008) focuses on eastern Europe and the former Soviet Union..

4
the relative political and social importance of landowners and small farmers. By the late
nineteenth century, these various factors had determined a structure of farming in the Western
European region that is still visible today.
The total utilized farm area in the fifteen countries of Western Europe that are
members of the EU was 129 million hectares in 2004, distributed over 6.3 million holdings
with an average size of 20.2 hectares.3 The sector gave employment to 6.2 million persons,
representing 3.8 percent of civilian employment in the EU (EUROSTAT 2006, Table
2.0.1.2). Including those three countries not in the EU in 2004, agriculture represented 4.9
percent of the labor force, down from 30.0 percent in 1950. The value of output from these
farms was 300 billion euro and gross value added was 155 billion euro (at distorted prices),
or 1.6 percent of total GDP for those countries.4
The total output from Western European farms has increased over the past fifty years
by about 2.2 percent each year. However, this growth rate has lagged behind that of other
sectors of the economy.5 As a result, the share of agriculture in GDP has declined from 13.6
percent in 1955 to 2.9 percent in 2004 Only in Iceland and Greece is the share of output in
GDP above 5 percent: Spain, Portugal and Finland have agricultural sectors that contribute
between 3 and 4 percent of GDP. In Germany and the UK the share of agriculture in GDP is
now below one percent. Participation of agricultural workers in the labor force is highest in
Greece and Portugal, with shares in excess of 12 percent of the active population. Finland,
Ireland and Spain each has above five percent of the labor force in agriculture. By contrast,
the UK has only about one percent of its labor force in agricultural persuits (Appendix Figure
1).
Productivity growth in Western Europe’s agricultural sector compared favorably with
that in the manufacturing sector in the immediate post-war period. Over the period 1949 to
1959, by which time the economy had largely recovered from the war-time disruptions,
output per person in agriculture had increased by more than that in manufacturing in most of
the countries in Western Europe (Appendix Figure 2). The productivity growth was a
combination of output increases as a result of mechanization and modernization, and the
outflow of labor as other sectors absorbed rural workers.
3 Comparable figures for the US show a utilized agricultural area of 379 million hectares and 2.1 million farms, with an average size of 180 hectares. 4 The agricultural sector in the US employs 0.7 percent of the civilian labor force and contributes 0.9 percent of GDP. 5 The economy of Western Europe as a whole expanded by 2.7 percent over the period 1955 to 2004.

5
This productivity increase slowed somewhat in later decades, but remained a key
component of the development of the sector and its role in post-war reconstruction. The
strong farm productivity increase and accompanying farm labor force decrease is striking.
(Appendix Figure 3 shows the period 1955 to 1970.) The decline in the share of agricultural
workers in the labor force has continued to the present day. The number of full-time
equivalent “annual work units” employed in agriculture in the EU-15, as calculated by
EUROSTAT, fell from 8.6 million to 5.9 million beteween 1991 and 2004 alone
(EUROSTAT 2006, Table 3.1.13).
Structural change has also been rapid in European agriculture. The rate of
consolidation of farms has risen over the past five decades, but the average size of farm still
varies widely among countries, with the UK and Denmark having the largest farms (57 and
55 hectares per farm, respectively) and Italy and Greece having the smallest farms (7 and 5
hectares respectively) (EUROSTAT 2006, Table 2.0.1.2).
The countries of Western Europe differ more in the importance of agriculture to
international trade. In 2004, agricultural exports accounted for more than ten percent of total
merchandise exports in three countries: Denmark (18.7 percent), Greece (19.9 percent) and
Ireland (11.6 percent). By contrast, such exports only accounted for 2.5 percent of German
exports, 3.0 percent of Swedish exports, 2.8 percent of Finnish exports and 4 percent of
exports from the UK. Agricultural products traded by the EU-15 with other countries
accounted for 6.1 percent of all imports and 6.0 percent of all exports. The EU-15 region ran
a net deficit with respect to the rest of the world in foodstuffs and other agricultural products
of 3.4 billion euro in 2004.
In Europe as elsewhere, agriculture has had to compete with non-farm sectors for
labor and capital. The growth rates of the manufacturing and service sectors have therefore
been major influences on the economic health of the farming sector. Agriculture has in
general provided an outflow of labor, both directly as farmers and farmworkers become a part
of the industrial workforce (either by migration or by devoting more of their time each year to
non-agricultural employment) or indirectly, by offering a less attractive alternative to young
people in rural areas. Though this process has been going on for decades, the post-war period
has been remarkable in the magnitude of this exodus. Capital has proved somewhat less of a
problem, as farmers have usually been able to raise capital in the financial markets,
particularly through dedicated rural lenders, and through retained earnings. Though rates of

6
return have not been high, non-pecuniary satisfaction and a lingering feeling of security has
kept up levels of rural investment.
The result has been a significant transformation and modernization throughout the
continent in the sixty years since World War II. Agriculture in Western Europe still has
pockets of traditional farming, particularly in the south, that have yet to be transformed. But
in general the continent has a high level of technical expertise and a moderate farm size,
giving it more of a chance to be internationally competitive in the second half than in the first
half of the post-war period.
One major link between the agricultural and non-farm sectors has been through
currencies. Strong export performance by the industrial sector tends to appreciate the
exchange rate and reduces the domestic cost of commodities whose prices are set in
international markets. So agriculture in the strong currency countries has tended to be under
pressure from reduced price levels as a result of export success in the non-farm sector. For
countries with weak currencies, exchange rate developments will tend to raise the price levels
for imports and exports, so the agricultural sector faces less competition from abroad --
although governments may take action to lower domestic food prices. Thus the developments
in foreign exchange markets are crucial factors in looking at the competitiveness of the
agricultural sector in particular countries, and have played a significant role in policy
developments in the EU.
Agricultural policy prior to the mid-1950s
Western European agricultural policy reflects the economic and social conditions of rural
areas as well as the political realities of the day. But many of these factors are deeply rooted
in experience and history. Some of this experience is shared among the countries of Western
Europe, but much is peculiar to the ways in which the countries concerned reacted to
historical trends and events. Many of these events were a product of the broad economic and
political developments in the nineteenth century, as the pattern of land ownership became
established and transportation and education systems extended into rural areas. But policy
influenced the reaction to these developments and led to significant disparities among
neighboring countries.

7
In addition to these social and political conditions that governed such policy, two
other factors recur as being pervasive in Western Europe: the colonial experience of the
countries concerned, and the reaction of those countries to the industrial revolution.6 The
United Kingdom, with its extensive Empire from which it could import both tropical and
temperate agricultural products, was in a good position to take advantage of the benefits of
trade. As the leader in both the technological revolution in agriculture and the
industrialization of manufacturing processes, a policy of low-priced food played to the
strengths of the economy. By contrast, Germany (and the numerous small states that preceded
the creation of the Federal state) had few overseas territories and lagged the UK in
manufacturing technology. As a result, German agriculture remained a protected sector.
Political ideas reinforced these differences. In the UK the “free trade” movement had won
widespread following by promising better living conditions for the urban workforce.
Landowners resisted but were losing ground to manufacturing interests. German intellectuals
pushed for a different strategy, based on protection of “infant industries,” and large
landowners found such a policy of developing behind tariff walls to be in line with their own
interests. So, by the end of the nineteenth century, significant differences between the UK
and Germany had emerged in the prevailing economic paradigm and the agricultural policies
that supported it.
All of European agriculture was impacted by the growth of trade in temperate
agricultural products from the New World in the 1870s, made possible by the opening up of
new territory and by lower rail and ocean transport costs. The introduction of refrigeration
began to make livestock products as well as grains profitable to transport from the Americas
and Australasia. In the case of the UK, the high tariffs that had been embodied in the Corn
Laws had already been repealed, in 1846. As a result, the political climate was such that
manufacturing interests prevailed over agrarian pressures, and agriculture shrank in the face
of overseas competition. But much of the cereals and meat came from colonies, and could be
paid for in pounds sterling, so import substitution did not become a priority. In addition, the
structure of farming in the UK was generally more able to withstand the low prices.7 As a
result, pressures for protection were perhaps less than in many other European countries.
6 For a discussion of the different reactions of the Western European countries to the mid-nineteenth century period of relatively free trade, see Kindleberger (1975). 7 The eighteenth century Enclosure Acts had given UK agriculture a farm structure that had allowed it to take advantage of the emerging technologies (mechanization) and farming practices of the period (Orwin 1949).

8
Other countries followed the lead of the UK and more or less reluctantly accepted the
benefits of cheap grain from the New World. Denmark stands out as the country that
embraced the new relative price structure most completely, and the Netherlands reacted in a
similar way. Livestock farming received a boost from the lower feed costs, in particular the
rearing of cereal-fed livestock such as pigs and chickens. In addition, Denmark had inherited
an efficient farm structure from the early nineteenth century, and developed a cooperative
system that fitted well into the livestock economy that flourished on the cheap grain of the
1890s.8
French agricultural markets had also been relatively open to trade in the middle of the
nineteenth century, but protection increased sharply with the tariff of 1881 which imposed
high duties on livestock imports (Tracy 1989, p. 20). The level of protection peaked with the
Meline tariff of 1892, and remained high until the First World War. However, industrial
tariffs were also increased over that time, modifying the distortive impact of agricultural
protection.
German farming benefited significantly from higher protection in the last quarter of
the nineteenth century. As livestock from America and grain from Russia threatened to
depress domestic prices, tariffs were introduced in 1879, initially at a moderate level but they
were increased over the next decade. Bismark himself was adamant that farm imports be
controlled, and presided over a bitter trade dispute with America over the sanitary conditions
under which US pork was produced for export to Germany (Snyder 1945). On his ouster in
1890, Germany briefly returned to more open agricultural trade, against the opposition of the
Prussian landowners (Tracy 1989, p. 20). For the next twenty years liberal and protectionist
economic paradigms clashed and different views on the desirability of industrialization kept
the issue of agricultural polices to the political forefront.
These nineteenth century differences between the “adjusters” and the “protectors”
remained through the first half of the twentieth century. The prime factors that played a role
in the development of agriculture in that period included the economic impact of the First
World War and the Great Depression.
The UK attempted to expand production after the First World War by granting
farmers subsidies to supplement their market earnings. These deficiency payments,
introduced in 1917, were accompanied by a liberal import regime for farm products (except
8 Output per hectare in Denmark more than doubled between 1880 and 1930, whereas the same measure stayed steady in the UK (Ingersent and Rayner 1999, p. 10). Agriculture accounted for 45 percent of Danish GDP in 1880.

9
sugar). An attempt to introduce price guarantees in 1920 was repealed the next year (Tracy
1964, p. 149). Protection did emerge in the 1930s, as a result of depressed world prices, but
the effect was mitigated by Imperial Preferences that allowed agricultural products in from
the Dominions (Australia, Canada, New Zealand and South Africa) and the colonies.
Domestic marketing became the focus of farm policy, and was institutionalized through the
introduction of Marketing Boards in 1931, several of which remained in place until the
1970s.
French agriculture had been badly damaged by the First World War, with both
infrastructure and productive capacity destroyed (Tracy 1964, p.273). It did not get much
assistance from trade protection in the 1920s, as protection in the non-farm sector was higher
than that in agriculture (Tracy 1964, p. 171). However, the reaction to the Depression was to
introduce quotas on imports and to intervene in the domestic market. State marketing became
established through such institutions as Office National Interprofessional du Blé, founded in
1936.
Germany instituted a Ministry of Agriculture in the wake of the war, and the Weimar
Republic attempted to take over responsibility for agricultural policy from the states. Rapid
industrialization, however, reduced the significance of the farming sector, and low prices in
the Depression took their toll on farm incomes (Roesener 2000, p. 13).9 The Third Reich
attempted to capitalize on the decline of agriculture by promising state protection and higher
social standing for the rural population. They introduced policies designed to promote self-
sufficiency and to increase the control of the state over marketing and trade. Production,
however, did not reach planned targets, and at the outbreak of war in 1939 the level of farm
output was no higher than in 1935. Labor shortages and the need to keep urban prices down
had undermined the National Socialist Party’s attempt to return Germany to its rural past.
Denmark remained neutral in the First World War, and expanded its sales to both the
UK and to Germany in the post-war period (Tracy 1989, p. 205), despite the increase in
German tariffs in 1925. The Depression, however, hit Danish livestock production by 1931.
Efforts to improve trade relations with the UK (so as to offset the preferences granted to
competitors such as New Zealand) and with Germany were partly successful, but Denmark
eventually had to compromise on its traditional liberal trade policy and introduce tariffs on
grain. Later in the decade it began subsidizing producers of livestock products and restricting
production by means of marketing quotas. Eventually, in 1938, grain imports were
9 Rural incomes in Germany declined by almost 40 percent between 1929 and 1932.

10
discouraged by compulsory mixing requirements for millers. Along with the Netherlands, the
Danish agricultural experiment of trading at world prices appeared to be at an end.
The influence of these political and economic trends in the early twentieth century
were disrupted by the impact of the Second World War on Western European agriculture. To
an extent probably not experienced in any other region, the Second World War had a
significant impact on the agricultural sector. Not only did the war itself cause havoc with
infrastructure and destroy productive land, but the sector was drawn in to the war effort to
provide food and industrial raw materials.
The UK, with its vulnerability to blockades of imports, began to mobilize the civilian
population to grow more food. In the post-war period, production rebounded rapidly to its
pre-Depression levels, assisted by the introduction of guaranteed prices in the 1947
Agriculture Act. The need for additional domestic production was premised in part on the
chronic shortage of foreign exchange in the early post-war period, as exports failed to finance
the imports needed for reconstruction and to service the debt that had been accumulated in
the war. Devaluation of the Pound Sterling, being a global currency, was rejected as an
option. So successive governments pursued a policy of high domestic prices as a way of
saving on imports.
Occupied France, under the Vichy Regime, attempted to restore the country’s
agricultural destiny.10 However, the devastation of the infrastructure delayed the restoration
of the sector in the immediate post war period. France began a period of national planning,
which included goals for the agricultural sector. The first Agricultural Plan (1948-52) called
for an expansion of exports, the Second Plan (1954-57) established a fund for market
intervention. As economic integration became a reality, the opening up of markets in Europe
to French farm products became an important goal. The salvation of rural France was to be in
exporting products to the industrial heartland of Europe, assisted by some protection against
overseas suppliers.
German agriculture maintained production levels through most of the war but food
shortages emerged in 1944. By the end of the war, nutritional deprivation was an acute
problem and the relief of hunger became an international issue. Wartime controls over trade
were maintained and the new government in West Germany (established in 1949) encouraged
domestic production by price incentives linked to their production costs, with little regard to
competitiveness. By the time that the agricultural sector had to face the prospects of opening 10 Marshall Petain in particular had a vision of the agricultural destiny of France, reviving the notion of agricultural protection that had been promoted by Meline in the nineteenth century.

11
their markets to French and Dutch farm products, the predominance of inefficient small-scale
German farms became a major political “hot potato”.
Policy distortions 1955 to 2004: a chronology
The current map of agricultural protection was drawn in the early post-war period, as the
countries of Western Europe struggled to rebuild their economies and restore commercial and
political relationships. The defining moment in the development of Western European
agricultural policy was undoubtedly the formation of the European Economic Community
(EEC) in 1957. No discussion or analysis of the distortions caused by agricultural policy in
Western Europe can avoid a detailed examination of the development of the Common
Agricultural Policy and of the process of enlargement of the EEC from the original six
countries (Belgium, France, West Germany, Italy, Luxembourg and the Netherlands) to the
fifteen that were members of the European Union (EU) in 2004.11 The stages in the
enlargement of the EEC/EU provide the backdrop to any timeline of the description and
tabulation of the changing pattern of direct and indirect distortions to farm incentives. Not
only did each enlargement cause an examination of the EEC/EU policy towards agriculture,
but it changed the reach of that policy by including more farms under its umbrella. Thus the
nature and magnitude of the incentives faced by domestic producers and consumers of
primary agricultural and processed food products in Western Europe changed as much by the
wider adoption of the CAP as through more traditional agricultural policy processes.
The other side of this coin is that the number of countries that remained outside the
EU has steadily declined.12 Three of these Western European countries, Norway, Iceland and
Switzerland, have stayed outside the EU and their agricultural policy choices are still
autonomous despite them being members since 1960 of the European Free Trade Association
(EFTA). So even though EFTA members have a declining share of total agriculture in
Western Europe, their decisions on policy are of particular interest. It would be too simplistic
to say that they represent the “control group” in the experiment of designing and
11 The enlargement to include ten new members in May 2004 is discussed in the context of its influence on policy later in this chapter, and the implications for the new members themselves are dealt with in detail in Anderson and Swinnen (2008). 12 The abreviation EU will sometimes be used even for the period before the transformation of the European Economic Community into the European Community and later into the European Union.

12
implementing a common policy for agriculture, but some lessons can still be learned from
those that remain outside the EU.
In this section, the distortions from 1955 to 2004 are discussed in the context of each
of the five decades, to make easier comparisons with other regions and events. The discussion
relates this timeline to the evolution of the EU as it expanded membership and of the CAP as
the dominant vehicle of support for Western European agriculture. Emphasis is placed on the
levels of support and key policy prices in the prospective members relative to that of the EU
as a whole. As each new group of countries gained access to the EU, so the geographical
reach of the CAP changed. In turn, the CAP became the focus of much of the external
pressure that faced the EU as it grew in significance in world trade. But the macroeconomic
conditions, including inflation, exchange rate changes and non-farm growth in Western
Europe were a vital backdrop to the agricultural policy decisions, and need to be considered
in parallel with the more specifically agricultural aspects of the development of the CAP.13
1955 to 1964: agriculture in a period of rapid economic growth
The period of post-war reconstruction was followed by a rapid expansion of economic
activity throughout the 1950s and into the 1960s. This was the period of the German and
Italian “miracles”, as both these economies grew at rates far above those of the UK and
France. In turn, this growth provided the demand for consumer goods that allowed
neighboring countries to expand their own economies. Trade within the newly-created
European Economic Community expanded rapidly as trade barriers in manufactured goods
were removed over the period 1957-64.
The formation of the EEC in 1957 set the scene for the integration of Western
European agricultural markets.14 For this to happen, agricultural trade had to be included in
the move toward the free flow of goods among the original six countries.15 This was finally
agreed, but such an agreement on free internal trade was only possible by erecting a
protective border around the EEC to shelter agriculture from foreign competition. The
development of a Common Agricultural Policy (CAP) was therefore the result of a
13 See Josling (2007) for a fuller discussion on “external” influences on CAP reform. 14 The original six countries were Belgium, France, Germany, Italy, Luxembourg and the Netherlands. In economic terms, Belgium, Luxembourg and the Netherlands had already agreed to an economic union (the BENELUX Union) in 1948, and so were on the road to becoming a single unit. 15 The inclusion of agriculture in the free movement of goods within the EEC was at the insistence of the Dutch, who had struggled with the same issue in the formation of the BENELUX Union.

13
compromise between those who wanted to see agriculture a full part of the free internal
market and those that preferred a more interventionist system. A common market
organization (CMO) was developed for each of the main commodities. Administered prices
were related to a “target” price level for each commodity. Imports were only allowed in at
“threshold” price, calculated on the basis of the target price and transport costs. A “variable
levy” was charged on the basis of the gap between offer prices on the world prices and the
threshold price. Excess production could be taken off the market by national agencies at
“intervention” prices, again fixed relative to the target price.16 Prices were to be set each year
by the Council of Ministers on the proposal from the European Commission.
The period 1955-64 was one of policy initiatives for agricultural integration as well as
the restoration of trade flows across the Continent. National farm prices differed considerably
across the six countries of the EEC and between those countries and those that had chosen not
to join in the integration experiment. Hence the path toward more integrated internal markets
for agricultural goods proved rocky. Different farm structures, commodity balances and
historical protection levels provided a minefield for those advocating a free internal
agricultural market and common prices. But eventually, in 1962, common rules for
agricultural markets were agreed. A transition period was instituted ending in 1967, when all
prices were supposed to have been harmonized.
A look at selected Western European countries will illustrate the wide differences in
circumstance over this period, and illustrate the difficulties of achieving a common policy.
West Germany, at its creation in 1949, found itself with a structure of small farms because
the most productive and largest farms were now in East Germany. Meanwhile German
industry was being encouraged to expand into other markets in the region and overseas, and
its success added to the strains on agriculture. Tight controls over imports of cereals and the
use of marketing boards to regulate the domestic market kept agricultural prices high and
production was encouraged from every small farm. The choice of a common price for wheat
(and other grains) in 1961 was a major political issue in Germany: soft wheat prices were
about $110 per ton at that time, a level only matched by Italy of the six EEC members.17 In
the end the German government resisted calls for the common price to be set at a lower level,
and thus set the stage for the development of surplus production in the EEC within the
decade.
16 This terminology is the one that was used for the cereal market regime: some differences in instruments and nomenclature were introduced in the other commodity market organizations. 17 The world price over this period was about $60 per ton.

14
France had a better farm size in the Paris Basin, but was hampered by the remnants of
feudal strip farming in Normandy and Brittany and low productivity in the Massif Central
and the Midi. Cereal farming in particular had recovered from the wartime disruption and by
the 1960s had surpluses to send to the deficit areas of Europe such as Germany. Soft wheat
prices averaged only $81 per ton at the start of the transition period, and thus had to move
sharply up to reach the agreed price levels in the young CAP.
The Netherlands shared with Denmark an efficient farming structure based on milk
and poultry and eggs. It had already made roads into the German market, and looked for
continued market access. The fact that Denmark stayed out of the EEC, preferring to hang on
to the British market, gave Dutch farmers a welcome degree of preference. The Netherlands
(and Belgium) had a soft wheat price level in the early 1960s somewhat between the high
German price and the low French price, and so experienced some significant increases in the
cost of animal feed in the movement to common prices.
Italy shared with Germany some significant structural problems, with small farms
dominating the southern part of the country and relatively high cost cereal production in the
center and the north of Italy. However, expansion of the livestock sector in the north, based
on imported grains, linked its interests with that of the Netherlands. In fact, in the move to
common prices, Italy was allowed to maintain imports of feedstuffs at a lower tariff than the
northerly countries.
The Western Europe agricultural market was in effect split by the decision to push for
a Common Agricultural Policy (CAP) for the six members of the EEC. The UK chose to stay
outside the EEC, concerned about the element of “supra-nationality” introduced in the Treaty
of Rome. The CAP was therefore negotiated in a setting without the major Western European
food import market. In any case, the EEC was not entirely agreed over the prospect of the UK
joining.18 The UK had its own troubles, with macroeconomic imbalances proving difficult to
control. The balance of payments was chronically in deficit, and remained a problem until the
devaluation of 1967. The 1957 Agriculture Act had introduced deficiency payments as a way
of maintaining high producer prices whilst keeping consumer prices close to world market
levels. As much of the imported food came from former colonies, this trade was an important
aspect of foreign policy. The significance of this influenced the attitude towards the
18 The “Non” from de Gaulle in 1963 that ended the first set of talks about UK accession reflected a fear that the nature of the EEC, and in particular the CAP, would be compromised by the admission of a country that boasted of its “special relationship” with Washington. The UK was widely seen as a “Trojan Horse” for US policy interests, and accession a sure recipe for continued pressure on the CAP.

15
formation of the EEC, and was one of the reasons that the UK chose not to join. But, in an
attempt to show leadership among the countries that chose not to participate in the EEC, the
UK sponsored the European Free Trade Association (EFTA) in 1960. Seven countries signed
up to this “integration-lite” experiment, which differed from the EEC both in terms of its lack
of a common tariff and supranational institutions and because it excluded agricultural (and
fisheries) trade from its provisions.
The concerns of the UK with the prospect of having to phase out preferential access
from Dominions and former colonies, as well as the recurrent balance of payments problems
and the fear of food price led inflation, led to significant debate on the costs of agricultural
protection. Sparked off by a paper by Nash (1955), there were several attempts to calculate
the value of British farm output at “world” prices and compare the result with actual farm
values. Nash and Attwood (1961) repeated the same calculation later using Danish prices,
where distortions were noticeably less, to value British production. McCrone (1962)
elaborated these studies into a comparison of 13 countries in 1955-56. Howarth (1971)
followed the same method and added an estimate for 1966. According to Howarth’s
estimates, agricultural protection levels increased markedly from 1956 to 1966, at a time
when trade in non-agricultural goods was being liberalized.19
More evidence of the increase in protection was found in a study by Anderson and
Hayami (1986). The level of protection (as measured by the Nominal Protection Coefficient)
was calculated for eight Western European countries in the period 1955-1980. Switzerland
stood out as having the highest level of protection, though this did not increase over the first
decade of the period, 1955 to 1965. By contrast, estimated protection did increase in Italy,
Sweden, Germany, and the Netherlands over this decade. In France and the UK, protection
actually decreased in the decade up to 1965.
The estimates made for the present study broadly confirm the conclusions of the
Howarth and the Anderson/Hayami studies.20 Figure 1(a) shows the Nominal Rate of
Assistance (NRA, the percentage by which a product’s domestic price exceeds the price at a
country’s border), including non-product-specific support and aggregated over all
commodities, for four of the original six members of the EEC.21 At the time when the Treaty
19 The UK appeared to be an exception to this trend, though Howarth’s price support measures did not reflect the full range of input subsidies that were introduced over those years. 20 The present study has a broader product coverage than the earlier attempts to measure protection. 21 Independent data for the other two much-smaller members, Belgium and Luxembourg, are not included in this study. It is likely that the distortions are similar in those two countries, as they have been in an economic union since 1922 (to which Luxembourg contributes just 4 percent of the union’s population of less than 11 million).
16
of Rome was being discussed, assistance levels were modest (by later standards) and not too
widely dispersed.22 The CAP was “launched” in 1962, with prices that reflected political
compromise rather than economic foresight, and by the time the common price regime was in
place European agriculture was operating on a price plateau for the major products that was
well above world market levels.
The corresponding calculations of the Nominal Rate of Assistance for the EFTA
countries (those that chose the path of less institutional integration and no free trade in
agriculture) are shown in Figure 1(b). Austria, Denmark and the UK had NRA levels in the
same range as in the EEC. Portugal was in effect taxing its agricultural sector by holding
down prices below their full market value - a stance that reflected both its own political
structure and its level of development.23 Sweden increased its assistance to agriculture over
the decade, and gave incentives to its agricultural sector to an even greater extent than the
countries that formed the EEC. But the countries with the highest level of support by far were
Norway and Switzerland, where domestic prices were around twice as high as in other EFTA
countries.24
The pattern for these countries is what one would expect from their experience in the
pre-war period. The UK, the Netherlands and Denmark had lower levels of protection,
reflecting their history of imports of grains, and France emerges in that decade as an
exporting country that has lower production costs and less opportunities for protection at the
border. Indeed, one of the main attractions for France of the EU was to be able to sell French
products abroad without having to bear the costs of subsidies. Switzerland, Norway, Sweden
and Germany have higher levels of protection, as one might expect from predominantly
importing countries attempting to generate acceptable incomes for farmers. The countries that
made up the EEC increased their protection on average over the decade from 1956-64,
explaining in large part the chorus of complaints from overseas suppliers about the
protectionist nature of the emerging CAP.25
22 Italy, however, had low rates of assistance through the 1950s. 23 Portugal was one of the countries studied in the study led by Kreuger, Schiff and Valdes (1988). Its income level was below that of Brazil at the time, and the country had many of the features common to developing countries. 24 Price data for Switzerland and Norway for some products were not available prior to the latter 1970s so the NRAs for them were assumed to be similar to the earliest years for which data are available. Hence the lesser degree of fluctuation in their lines in Figures 2(b) and 3(b). 25 The Kennedy Round of GATT talks (1963-68) took place over this time, and the main focus of the exporting countries was to constrain the protectionist tendencies of the CAP. In this they were largely unsuccessful.

17
If the UK stayed out of the EEC in part because agricultural protection was higher in
the Six, the same could not be said of all the other EFTA members.26 Protection levels in
Norway and Sweden were high, as they were in Finland, which joined EFTA in 1965
(Gulbrandsen and Lindbeck 1973). In fact, in these countries the prospect of joining the EEC
was seen as a threat to their agricultural sectors as they would have had to reduce prices and
face competition from the grains of France and the livestock products of the Netherlands.
Only Denmark looked favorably on the prospect of expanding its sales to the EEC countries,
but chose to stay with the UK as its traditional market for farm products.
One other country that was among the “charter members” of EFTA, reflecting its
historic trade ties (with the UK) was Portugal. The country had been under a dictatorship
since 1928, when the military suspended democratic processes. The economy had been run
on a corporatist model with strong central control. The African colonies had provided an
income and Brazil had remained a source of capital and a link with Latin America. But
Portugal was outside the mainstream of Western Europe and remained a relative backwater
until the return of democracy in 1974 (Avillez, Finan and Josling 1988, Corkhill 1995).
Spain also had been shunned by many European governments and was also hampered
by a rigid corporatist economic policy. Innovation and social mobility were discouraged and
central and southern landed interests dominated political life well into the 1960s. The Franco
regime controlled wages, prices, and trade, and large state corporations were prefered over
smaller urban enterprises. Spain had been excluded from the Marshall Plan in 1948, and it
was not until 1958 that agricultural output regained the level of 1929, before the Civil War.
But farm structure was better in that country than in many parts of Western Europe, and by
the 1970s investment in fruit and vegetable production had begun to increase production. The
transition to democracy in 1975 gave hope that accession to the EU was possible, though
economic growth stalled for much of the period from the death of Franco to the accession to
the EU (Lieberman 1995). For both Spain and Portugal, the oil price increases of 1973 and
1975 were a major shock to their economies.
Iceland in the period up to 1965 was predominantly an agricultural and fisheries
economy, with meagre amouts of arable land and extensive imports of cereals. Dairy and 26 The major political reason for the decision of Sweden and Norway not to join the EEC was the requirement for neutrality that each had enshrined in their constitution. Finland was even more constrained, as it bordered on the Soviet Union, and was accordingly inhibited in foreign policy initiatives. Likewise, Austria was also constrained by the post-war treaties, and Switzerland by its determination not to join alliances or even multilateral organizations. Ireland stayed out both to keep in step with the UK, its major market, but also to retain its neutrality. Ireland did not join EFTA in spite of the links with the UK, but it did retain some preferences into that market.

18
sheep production was able to supply domestic needs and provide exports of wool and meat.
An Agricultural Development Plan for 1951-60 had tried to increase farm size (to ensure that
every farm had at least ten hectares) but had not had complete success (OECD 1966). A 1960
Law instituted fixed wholesale and retail prices for major food items and offered export
subsidies to dispose of surpluses. Consumer subsidies were also used in this period. However,
public investment in agriculture decreased under the 1963-66 Plan as the burden of
supporting high cost production became apparent.
Greece in the 1950s was still a largely agricultural country, with important exports of
cotton and tobacco. Most temperate zone foods were imported, and domestic production was
hampered by low productivity and a fragmented farm structure, in part as a result of pre-war
land reform. Association with the EEC in 1961 promised to expand exports, and the
government began to increase incentives for producers and to fix minimum prices for
domestic output (OECD 1966, p. 283). But this program was carried out in the context of an
economic strategy that gave predominance to the manufacturing sector as the engine of
growth (Pepelasis et al. 1980, p. 53).
1965 to 1974: agriculture in a period of macroeconomic instability
The price levels that had been set under the CAP were at the high end of the range of existing
prices in the members states, and strong upward convergence was evident over the period
from 1962 to 1967. Price differences within the EEC reflected the gradient of prices from
surplus to deficit areas, though this was modified by setting intervention prices in the surplus
areas that did not always reflect transport costs. Achievement of a single support price in
1967, set in “units of account” with a value equal to the US dollar, was a major political
success, but the uniformity of the Common Agricultural Policy was short-lived. Currency
instability was to undermine the realization of an open internal market for agricultural
products and a common price support scheme.
The devaluation of the Pound Sterling in 1967 heralded a period of financial
instability in Europe. The revaluation of the German DMark in 1968 and the devaluation of
the French Franc the same year caused havoc in the operation of the CAP, and led to the
introduction of artificial “green” exchange rates for the conversion of administered prices
decided in Brussels by the Council of Ministers into local currencies (Josling 1970, Josling
and Harris 1976). The currency changes in 1968 also exposed the problems of administering

19
regional price differentials. Grain from France had flooded Germany earlier in the year to be
taken into intervention, as a form of arbitrage (the relative intervention prices were different
from the relative values of the DMark and the Franc on money markets), causing serious
storage problems. When the currency changes took place, compensation for what would have
been price declines in Germany was granted by some ad hoc tax relief for German farmers,
and a system of border taxes and subsidies was introduced to offset the exchange rate
changes. This was generalized to other members by the device of converting common prices
through “green rates” which lagged the developments in the market rates. The border
tax/subsidy regime was known as Monetary Compensatory Amounts (MCAs) and were
charged or paid at the internal borders and on international trade. The effect was to
undermine the central concept of free trade within the EEC, to challenge the notion of
common price levels, and in essence give some control over price policy back to the member
states (Heidhues et al. 1978).
The level of protection in the UK had remained low over the last half of the 1960s,
relative to that of the major European countries (FAO 1973). Nevertheless the debate heated
up over the desirability of expansion of UK agriculture to help with the balance of payments.
The 1967 devaluation had helped to correct a misalignment of the exchange rate, but inflation
reduced the competitive advantage of British exports. Agriculture was caught up in a wave of
“Buy British” sentiment in the late 1960s, and price supports were increased in the Annual
Price Reviews. The debate on “import saving” exposed the economic costs of agricultural
protection and led to a re-evaluation of the role of the relatively small agricultural sector in
the UK economy. The government moved to stabilize the costs of the “deficiency payment”
program employed since 1947 by negotiating “minimum import prices” for cereals with
exporting countries. Later, the policy of allowing relatively free import access was replaced
by a system of variable levies, to generate some revenue from imports. But it was the
prospect of entry into the EEC that dominated the agricultural policy debate in the UK in the
late 1960s.
The first enlargement of the EU took place in 1973, when the UK, Denmark and
Ireland joined the Community. The CAP had proved a major problem for the negotiations.
On the one hand the UK was under pressure to accept the CAP as part of the “acquis
communautaire”, the accumulated regulations and directives of the existing Community, and
the enlargement process was supposed to focus merely on changing the language of
regulations so as to reflect the new membership. Any change in the policy itself would have

20
to be deferred until the newcomers were inside the tent. But at the political level, the UK was
determined to protect as far as possible the preferential access of its former Dominions and
colonies, though this clearly was unacceptable to the European suppliers for whom the
prospect of free access to the UK, a large importer, was attractive. The compromise was to
negotiate some assurances for traditional suppliers (New Zealand for specific quantities of
meat and dairy goods, for example) and to incorporate the UK ex-colonies into the
arrangements that had already been set up for those of France, Holland and Belgium.
The negotiations with Ireland and Denmark were of a different nature. For those two
countries, traditional exporters of livestock products to the UK, diversifying to the
Continental market, was a welcome prospect. The higher farm support prices in the EEC
were not a major hurdle, and tilted the balance of economic advantage in favor of accession.
Norway also participated in the negotiations, and an agreement was reached among the
governments. But the question of Norwegian accession was put to a popular vote, and the
referendum allowed the concerns of Norwegian farmers and fishermen to be fully vented.
The vote went against membership, and the government withdrew from the tentative
accession agreement.
The internal debates about accession to the EU have often been focused on the impact
of price changes, particularly for farmers and consumers. (Appendix Figure 4 shows the
relative prices for wheat and for beef, in the three new members and the EEC, over the period
from 1956-1972.) EU prices for most farm products had been considerably higher during the
1960s than in the applicant countries (except Norway). But the aspiring members had
agricultural support systems that were more in touch with the conditions on world markets.
So the high world prices in 1973-75 for many commodities masked the full impact of the
price increases expected from accession. As a result, the additional distortions due to the CAP
were relatively small over the first two years of the EC-9.
The countries that remained in EFTA made hurried arrangements to preserve at least
some of their access into the UK and Denmark. A series of bilaterals was implemented
shortly after the enlargement. However, these agreements did not cover agricultural products
(as they had been excluded from EFTA trade liberalization). In the case of Portugal, some
concessions were agreed: in 1972, a trade agreement was signed between the EC and
Portugal to allow for continued access into the EC for Portuguese exports. But the domestic
farm policies of Sweden, Switzerland and Norway, along with Finland and Austria, continued
to be determined largely on a national basis.

21
These developments in rates of assistance are shown in Figure 2. The NRA for the
EU-6 (and the Western Europe average, heavily weighted by the EU countries) hovered a
little below 80 percent over the decade 1965-1974, plunging at the end of that period as world
prices rose in 1973-74.27 The entry of the three new members did not cause this drop, even
though it brough some new constraints to the development of the CAP. Meanwhile the EFTA
countries that chose to stay outside continued with their own policy trajectories (Figure 2(b)).
Switzerland and Norway kept domestic prices at more than twice the level of those on world
markets, while Portugal continued to tax its farmers whatever the price levels on world
markets. Rates of assistance to farmers in Sweden, Finland and Austria were reduced
somewhat in the early years of the 1970s as the high world prices substituted for some of the
protection given by policy interventions.
1975 to 1984: agriculture out of control
The macroeconomic instability that followed the first “oil shock” of October 1973 had a
significant impact on the level of policy prices set under the CAP. Farm input costs rose
sharply and the real value of price supports declined. Politicians responded by increasing
prices sharply to keep up with costs. In addition, the fear of worldwide food shortages made
price restraint less attractive as a political argument. As a result, those that had been arguing
for moderation in price increases had a harder row to hoe. When commodity prices declined,
the EU was left seriously un-competitive in many temperate zone products.
The UK was now a member of the EU and was expected to assert a moderating
influence on agricultural policy. Indeed much of the opposition to UK accession from
countries such as France was that the UK would come in with its tradition of low market
prices and high payments from the exchequer and demand the same approach in the CAP.
But these fears proved unfounded. The UK found a convenient way of keeping its own prices
down through the medium of the “green money” system mentioned above, and turned its
attention to limiting the budget cost of membership through a budget “rebate”.
The impact on agricultural distortions of the first enlargement was therefore
somewhat mixed. Protection levels went up in the UK and in Denmark and Ireland. But as a
result of the transition arrangements, the UK was able for a time to avoid the impact of high
27 It may seem that the measure of assistence used in this study is unduly influenced by world price movements. But the NRA indicates the distortions at any particular level of world prices: if world prices change then so do the distortions caused by policy. This phenomenon appeared again during the work food price hike of 2005-08.

22
EU prices. The accession period negiotiated for the UK (seven years) called for import
subsidies paid by the EC on farm products entering the UK. Coupled with the subsidies to
offset the depreciation of the pound in the mid-1970s, the price of food rose by less that had
been feared at the time of the Entry Debate. Denmark and Ireland made good use of their
expanded opportunities for livestock exports, selling to the Continent as well as to the UK.
The green money system continued to add to the level of internal distortion in the late
1970s. In February 1979 a “common price” of 100 ECU by the Council of Ministers would
have translated into the equivalent of 110.8 ECU in Germany and 71.8 ECU in the UK. Thus
support prices were maintained in Germany at a level of 54 percent higher than that in the
UK. Only Denmark eschewed the political convenience of masking exchange rates by the use
of fictional green rates. The system was to linger on for another decade until modified by the
single market of 1992 and then eliminated by the single currency from 1999.
The “outsiders” had the liberty of being able to run their agricultural policy without
the need to comply with the CAP. EFTA had no direct impact on agriculture over this period.
Switzerland maintained high prices in the late 1970s, with a support price for wheat of $398
per tonne, compared to $200 in Germany and $190 in the UK (Hallett 1981, p. 343, based on
numbers from the International Wheat Council). So any form of opening up of trade in grains
between the EEC and Switzerland would have been difficult to envisage.
Norway, having chosen not to join the EEC in 1973, was able to pursue an
autonomous policy, based on the perceived need to keep population in the northern areas of
the country. Protection levels were almost as high as Switzerland, though Sweden resisted the
temptation to farm the cold northern regions as a matter of national security. Finnish
experience fell somewhere in between that of its Scandinavian neighbors. Though it had an
extensive area of high cost agriculture in the northern parts of the country, rural interests were
not able to maintain such high levels of protection against imports as were granted in
Norway.
The EC did welcome one new member over this period. Greece, for long an Associate
member, was welcomed into full membership in 1981, after political freedoms were
reestablished. In agricultural terms, Greece posed no problems with respect to the temperate
zone products, as it was likely to increase its imports of them from the EU as its own
protection was withdrawn. But exports of Greek fruits and olives posed a problem for the EU,
and southern members argued (successfully) for extensive transition periods before opening

23
up to Greek competition. This set up the scene for similar arrangements when Spain and
Portugal followed Greece in to the EU five years later.
The situation was somewhat different in Spain and Portugal, as neither had negotiated
associate membership status in the 1960s. Both countries had moved from dictatorships to
democracy in the mid-1970s, but their agricultural policy was still focused on domestic
concerns, including structural issues. In Portugal, following the 1974 Revolution, land reform
became a major preoccupation. The breakup of the large farms caused a significant drop in
output of grains, and a succession of droughts made matters worse. Prices were increased in
an attempt to generate adequate income for the new class of small farmers generated by land
reform and rose above those in Spain and the EU (Appendix Figure 5). Dairy production was
encouraged in the north and in the Azores. Processing tomatoes had become a significant
export industry in the 1960s, but other Mediterranean products were less advanced (Avillez,
Finan and Josling 1991). By the mid-1980s, Portugal was not in a position to compete in
Europe, or in its own market with European produce, and needed a significant transition
period to develop the institutional capacity to administer the CAP.
In Spain, the period before accession also was one of economic stress and relative
stagnation. Cereal and livestock production lagged behind that of the rest of the continent,
and marketing systems reqired modernization. Imports of feed grains and oilseeds, mostly
from the US, faced little in the way of trade barriers. Prices for other commodities did not
differ greatly from those in the rest of Europe: wheat prices in Spain had been similar to those
in the EU since the early 1970s (Appendix Figure 5). But investment in the fruit and
vegetable sector had accelerated and both wine and olive production was undergoing
structural change. As a result, the prospect of substantial exports of these products loomed
over the accession negotiations. The issue of the entry of Spanish farm products into the EC
took on a political significance particularly in Italy and France, as well as in North Africa.
The changes in the level of assistance in Western Europe over the period 1975-84
reflects these developments (Figure 3). The EU-9 had NRA levels that increased steadily over
the decade, as a result of cost-based price decisions in a situation of inflation and lack of
effective budget constraints. From a level of about 40 percent in 1975 the NRA increased to
above 80 percent by 1983. Overall support levels were very low for the applicant countries of
Southern Europe, leading to political tensions over the adoption of the CAP by these
countries. A transition period was needed both to cushion domestic consumers and to grant
the producers in the EU-9 time to gear up for competition from Spain and Portugal. Of the

24
EFTA countries, Switzerland, Norway and Iceland continued to give high support to farmers,
while Sweden, Finland and Austria assisted their farmers at similar rates to those in the EU.
1985 to 1994: agriculture as an international concern
By the mid-1980s, the issue of domestic agricultural policy in Western Europe had become a
central topic of concern in the multilateral trade system. The twin reasons were the high
levels of border protection that had been retained to give a broad umbrella of protection
against overseas competition under which the market orders could continue, and the
increasing surpluses of cereals, meat, dairy products and sugar, all of which other OECD
countries produced for export. As a result the CAP came under criticism abroad as a major
cause of low world prices and at home for high support costs and (at least in the UK) for high
consumer prices (Tyers and Anderson 1992).
In 1984 the GATT began to discuss and the OECD to measure the extent of the
distortions generated by domestic policy and by border instruments. The consensus was that
for several markets the impact of domestic policies spilled over to the world market in a way
that caused a reaction by other countries, either to subsidize exports or to add protection
against imports. So a common solution seemed to be the answer. If all domestic policies
could be brought under control, and if the nature of border measures could be disciplined,
then the situation would be ameliorated. But the CAP was singled out as the policy that
needed to change the most, and so the policy was firmly on the international agenda.
Attempts to argue that US support per farmer was significantly greater than in the EU (as a
result of larger farm size) garnered little sympathy. So long as the focus was on the impact on
world markets, rather than the impact on domestic incomes, then the CAP was on the hot
seat. Hence, the attitude of the EU in the Uruguay Round was largely defensive, and the CAP
was eventually forced to adjust its own policies in 1992, with the adoption of the MacSharry
reforms. This allowed the EU to agree to the negotiated strictures of the Uruguay Round
Agreement on Agriculture on export subsidies and domestic support payments.
The 1992 CAP reforms marked a change in instrumentalities as well as price levels.
In compensation for a price drop, farmers received a direct payment based on their historical
hectareage under cereals and oilseeds and a regional yield. Headage payments were also
introduced for beef and sheep. The milk and sugar regimes were not included in this reform.
The lower price for cereal-based animal feed led to an increase in the use of barley, wheat

25
and corn, and helped to reduce cereal stocks. The incentive to produce was also reduced, as
marginal output increases were effectively sold at lower prices.28
The adoption of the CAP by the Southern countries (Portugal and Spain joined in
1986) posed few problems for the major crops and livestock product markets, and did not
raise the level of distortion overall. The main impact was on the Mediterranean products,
particularly olive oil, wine, citrus and tobacco. Here the stimulus was in the direction of
increasing the pressure on markets and hence the need to review policy.
The period up to 1994 saw some changes with respect to the position of the EFTA
countries. They had been offered, and negotiated, an industrial free trade area (the European
Economic Area, or EEA) with the EU. The EEA allowed free trade in manufactured goods
and cooperation in regulatory issues: in effect it extended the previous bilaterals to include
several aspects of trade that had been incorporated in the EU’s 1992 Single Market. Though
some quotas on agricultural goods were expanded, there was no progress toward the
incorporation of the rural sector in economic integration such as would be stimulated by EU
enlargement. The EFTA countries still did not have a say in EU decisions, and thus were
unable to influence regulations that would apply to them. The political stance of neutrality
that had prevented several EFTA countries from having too close a tie with the EU countries
became of less importance with the end of the Cold War. So, before the ink was dry on the
EEA, Sweden made the decision to apply for full membership, and three other EFTA
countries followed suit.
The path toward EU accession was attractive to many countries of Western Europe,
but some had more difficulty making the journey. Norway, once again, chose to stay out.
Switzerland also found that membership was problematic, and even membership of the EEA
was rejected in a referendum, particularly by the rural German-speaking Swiss cantons. The
problems of farming in Finland in remote areas, and that of preserving the Austrian
countryside, made the negotiations more complex. A subsidy system, in part paid by the new
entrants themselves, was implemented to allow marginal farms in disadvantaged areas to
continue in business.
Sweden faced a different dilemma: that it would have to reverse an agricultural policy
reform that was generally in the direction that the EU wished to go. Sweden had maintained a
policy much like the other Nordic countries until the late 1980s. Suffering from
overproduction, Sweden tried voluntary milk quotas and cereal set-asides to no avail. In June 28 Livestock protection was changed only incidentally, as tariffs and levies on pigs, poultry and eggs had been tied to the levies on cereals.

26
1990 the Parliament passed a bill that dramatically altered Swedish farm and food policy,
abolishing agricultural support and export refunds. Direct payments in compensation were
paid, and an early retirement scheme for farmers was introduced. The export subsidies were
reinstated when Sweden joined the EU, and prices rose somewhat as a result.
One impact of accession can be guaged by comparing the cereal prices in the acceding
countries and the EU (see Appendix Figure 6 for the period 1986-1994). Finland in particular
had to reduce price levels, and had to set the burden on the farm sector against the apparent
benefits that the Finnish manufacturing sector would receive from better access to the rest of
Europe. Nevertheless the accession of Austria, Finland and Sweden went smoothly, and the
fact that the Alpine and Nordic countries were able to pay for schemes that sheltered
temporarily the northern farmers helped to make this a success. These countries have not
used their membership to press for higher agricultural prices at the EU level.
The pattern is illustrated in the calculated NRA for the EU and EFTA. Figure 4 shows
the level of NRA for the EU-12 peaking at close to 100 percent in 1986, when world prices
were at historical lows, and generally declining thereafter. By 1994 the NRA for the EU was
down to 40 percent, a major decline over the decade. Finland had the highest assistance
among the next three accedants in the 1985-94 pperiod, and so had the most adjustments to
make on EU accession. In the case of Austria, protection levels increased in the five years up
to membership, causing some concern that Austrian agriculture would be adversely effected
after joining the EU. But the new EU members were not among the highest supporters of
agriculture in the EFTA countries, and so the tensions were controllable by means of
transitional arrangements. As a result, there was very little impact on the EU from the
enlargement from 12 to 15 members, in terms of either reducing or increasing the level of
protection.29
The EFTA members that chose not to join the EU maintained their high protection
levels for agriculture. Levels of NRA in Switzerland fell a little in 1989 but rebounded by
1990. Some slight downward trend is apparent for Iceland and Norway over the period 1985-
1994, but the rate of assistance was still far above the average for Western Europe.30 The
bipolar nature of support in the region was by that time firmly established.
29 Another member of EFTA, Iceland, did not participate in the talks about possible enlargement. The concern that that country would have to adhere to the Common Fisheries Poilcy has always been a major political hurdle. Lichtenstein, an independent country in a customs union with Switzerland, joined the EFTA-EU accord even though Switzerland did not. 30 Estimates for Iceland are included only from 1979, when comparable data became available from the OECD.
27
1995 to 2007: agriculture restrained
The coming into force of the Uruguay Round Agreement on Agriculture (URAA) in 1995
brought with it significant changes to the instrumentalities of the CAP. First, it obliged the
EU to remove the variable levy and convert it into a fixed tariff. Thus the threshold price,
from which the variable levy was calculated, ceased to be the central determinant of
protection levels. The URAA obliged the EU to reduce tariffs. However, as a result of the
careful choice of reference prices to calculate the tariff equivalent (known as “dirty
tariffication”) and the convenience of using an unweighted average for tariff reductions, the
impact on the price levels of sensitive goods, such as sugar, beef and dairy products, was not
great. For cereals, the creation of a special category of domestic support that was associated
with output controls (the Blue Box) and hence deemed to be less distorting to trade meant
that the new MacSharry payments were not required to be reduced. Moreover, a remnant of
the “variable levy” was retained (at the insistence of the United States) as the tariff-inclusive
import price was not allowed to rise above 150 percent of the intervention price.
The time horizon of the URAA tariff and support reductions was from 1995 through
2000, and that of the application of the MacSharry CAP reforms was from 1994-1996. So it
became clear that though the 1992 CAP reform may have allowed the EU to have agreed to
the URAA, the process would need to be continued if the WTO constraints were to be
respected over the decade. Even more significant was the prospect of enlargement to the East,
with ten countries already having an explicit promise of membership. These countries, though
not large agricultural exporters, did have significant farming populations. Farmers in the EU
focussed on additional competition in some commodities, but the Commission was concerned
about the potential burden of paying subsidies to farmers in the prospective entrant countries.
It was clear that the enlargement would have significant effects on the viability of the CAP.
In 1995 Franz Fischler took over as Commisioneer for Agriculture and articulated a
vision of an agriculture that was competitive and market-oriented, while at the same time
being environmentally sustainable and socially acceptable. The chosen route was to continue
down the path of the MacSharry reforms, by reducing support prices and substituting direct
payments tied by “cross-compliance” obligations to environmental goals. The Commission’s
proposals for agricultural reform were included in the Agenda 2000 document, that also dealt
with the budget and regional policy challenges facing the EU (Moyer and Josling 2002). The
primary focus of Agenda 2000 was on the enlargement of the EU to include the Central and

28
Eastern European countries. Ten of these countries had already negotiated “Europe”
agreements that were to lead to bilateral free trade (including most of agriculture) over a
period of ten years. The pressure was mounting to fulfill the political pledge to allow for the
reuniting of East and West Europe, but concern with the impact on both agricultural markets
in the EU and the financial cost of extending the CAP to the new members was also rising.
Agenda 2000 was the Commission’s suggestion as to how the budget and agricultural
challenges could be met.
The agricultural reform component of Agenda 2000 was presented to the Council of
(Agriculture) Ministers in 1997, and eventually endorsed with much of the Commission’s
ideas intact in 1999. Though the Agriculture Ministers’ plan was modified by the European
Council (a regular meeting of Heads of State or Government), the agreement that emerged
was a major step in the evolution of the CAP.
One important concession was won by those that favored even more reform of the
CAP: there would be a “mid-term review” of the effectiveness of the Agenda 2000 reforms in
2003 (at the half-way stage of the 2000-2006 fiscal horizon). Fischler was able to convert
what could have been a routine review of progress into a further step along the path set by the
MacSharry and Agenda 2000 reforms, by shepherding through the Council of Ministers a
proposal for consolidating the direct payments associated with the compensation for price
decreases in particular crops into a “Single Farm Payment” that was even more remote from
farmers’ production decisions and market prices. This 2003 reform package also began to
tackle the difficult issue of reform of the dairy sector.
Following on the heels of the 2003 reform the Commission proposed changes in the
regimes for the Mediterranean crops, specifically for cotton, tobacco, rice and hops. The
thrust of the reforms in these products was to blend them with the Single Farm Payment
system, while reducing distortions in the market. New proposals for fruits and vegetables
were adopted in 2004, with subsidies for processing being converted into producer payments
and those for the withdrawal of fresh produce from the market being chaneled through
producer organizations. Wine and sugar reform proposals were introduced in 2005 and the
sugar reform was agreed in 2006. This new regime aimed to eliminate the production quota
system, paying compensation to those adversely impacted – producers, crushers and refiners,
and overseas producers that rely on sales to the EU market – and cutting support prices. The
wine reforms were still under discussion as of early 2008.

29
The aggregated impact of these various policy changes is shown in Figure 5. The EU-
15 exhibits an NRA of around 40 percent following its absorbtion of three new members (and
the introduction of the disciplines of the URAA) in 1995. By 2004 this had declined to
around 30 percent. The reforms combined with higher world prices to lower the distortion to
about 13 percent by 2007. The same trend is seen in the calculation of NRAs for the EFTA
countries that have retained their agricultural policy autonomy. Norway and Switzerland have
reduced the distortions as measured by the NRA to about one-half of the levels seen in the
late 1990s. Iceland seems to be the one country where the tendency toward more moderate
levels of assistance has been resisted most.
Detailed estimates of nominal assistance, 1955 to 2007
Having calculated the NRAs to inform the above description of the evolution of agricultural
policies in Western Europe, it is now possible to make more use of that database to illustrate
several additional points.
First, the NRA calculations need to be qualified by the change in the nature of the
policy instruments adopted.31 In the latter 1980s, direct payments were limited to such
products as olive oil and durum wheat, with market price support making up the bulk of
assistance given to agriculture. From 1992 the total support (including direct payments and
non-product-specific support) and the market price support (limited to price support for
individual commodities) began to diverge. By 2004 almost one-half of the 100 billion euro in
assistance to agriculture came in the form of income payments and provision of services on a
non-product-specific nature (OECD 2006, see Appendix Figure 7). There is no doubt that
such payments benefit agriculture and keep resources in the sector that might otherwise leave,
but the direct distorting impact on commodity output, consumption and trade is less, and
arguably a much smaller source of the programs’ economic cost.32 If the assistance from
31 The NRA was calculated with non-product-specific payments and direct ‘decoupled’ payments both included and excluded to help identify the importance of these policy changes. 32 The extent to which a payment is production-neutral (the degree of decoupling) differs depending on the way it is administered and the expectations of the recipient, so the categorization of policies by the degree of production-neutrality is a hazardous endevor. No attempt is made here to evaluate the extent of the distortion that might still be present from policies defined as decoupled from output price and quantity produced. Rather, we include as ‘decoupled’ the value the OECD estimates under certain categories of support. For the years 1979-85 there was just one category, called ‘direct payments’; from 1986, those payments are specified to

30
these somewhat decoupled measures had been included in the calculation of support for
Western European farmers, their NRA would have declined much less after 1992 (see Figure
6).
Second, when products are classified as exportables, importables and nontradables
(see the Appendix for the precise classifications for each non-EU country and for the EU
bloc), it becomes clear that exportables are assisted far less than import-competing farm
industries in the case of the EU – but exporters are assisted only slightly less in the case of
non-EU countries of the region (Figure 7).
Third, the rate of assistance to Western Europe’s farmers dwarfs the small and
declining NRAs for producers of non-agricultural tradable products, and so the Relative Rate
of Assistance (RRA) is almost the same as the NRA for agriculture (Table 1).
Fourth, the NRA varies greatly across the range of covered farm commodities (which
account for more than 75 percent of the region’s agricultural production when valued at
undistorted prices). The extent of that dispersion in NRAs for the EU increased up to the
1980s before decreasing, but it has continued to increase in non-EU countries (see second to
last row of Tables 2 and 3). This suggests there is great scope to improve the efficiency of
resource use within each country’s farm sector.
Fifth, leaving aside non-product-specific and decoupled support, most of that
assistance to farmers for covered products has come from border measures rather than
domestic price supports (see near bottom of Tables 2 and 3). This aspect of European policies
is in sharp contrast to the situations in the United States where domerstic support plays a
major role (c.f. Gardner 2008).
Sixth, the average rate of assistance to farmers varies by country even among the EU
members (Table 4). This is because the commodity composition of farm output varies across
countries and over time, and hence so do the weights (based on value of production at
undistorted prices) used to calculate the average.
Sixth, the gross subsidy equivalent of the support provided to Western Europe’s
farmers varies hugely across countries (Table 5(a)) and across commodities (Table 5(c)). The
comprise the OECD’s items C (payments based on area planted/animal numbers), D (payments based on historical entitlements), F (payments based on input constraints) and G (payments based on overall farming income); and for 2005-07, those items replaced by similar but newly defined items C to E. While the administration of the EU’s direct payments policies varies among the member countries, we have insufficient data to do more than assume the percentage points of NRA from decoupled payments is the same for all EU members. This categorization for economic purposes (and that for ‘non-product-specific’ assistance) should not be confused with the legal allocation of domestic support measures into the WTO colored “boxes” in the context of international commitments.
31
biggest recipients among the commodities are milk, beef and wheat. When expressed per
person engaged in farming, it is highest in Norway and Switzerland but, within the EU, it is
almost as high in Denmark, the Netherlands and France (Table 5(b)). Note that the subsidy
equivalent per EU farmer drops by two-thirds in 2005-07. This is much bigger than the 45
percent drop in the aggregate value compared with 2000-04, because the number of EU
farmers has expanded hugely with eastern enlargement (even though strictly speaking they
are not in Western Europe). These are not actual cash transfers from the EU’s budget in
Brussels, but simply the value equivalent of the price support provided primarily via
protection from non-EU imports.
And finally, since most of the assistance to farmers comes from border measures,
those same measures also raise consumer prices of farm products. The extent of the consumer
tax equivalent is similar to that of the NRA for covered products in percentage terms
(although less so the further a country is from self sufficiency), but vary considerably across
countries when expressed on a per capita basis: after Iceland, Norway and Switzerland, it is
Ireland, Denmark and the Netherlands where consumers are most harmed (Table 6). Notive
that the value of the implicit transfer from consumers is very small on a per capita basis, at
about $100 for EU countries and $300 for EFTA countrie in 2000-04 (valued at 2000 US
dolllars). Since this is less than 0.5 percent of per capita income, it is not surprising that
consumers see little benefit in getting together to lobby collectively against agricultural
supports.
Policy trends and turning points since 1955
This section attempts an analytical explanation of the reasons behind the evolution of policy
and policy-related distortions since the mid-1950s. It complements the historical/institutional
narrative and NRA estimares of the two previous sections by emphasizing the political
economy forces behind the long-run trends and turning points. It focuses on the CAP as the
main policy for an increasing number of Western European countries, but the policy
developments in the countries that opted to stay outside the EU show some similarity.
Emphasizing the trends in policy allows for a consideration of the changes in policy
instruments over time and the role of instrument change in improving efficiency in meeting

32
the various objectives of policy. Discontinuities in the trends can also come from the impact
of changes in ideas among the domestic political forces that impact on farm policy in
Western Europe and of the introduction of international rules and institutions and the impact
of bilateral and other trade agreements.
Long-run trends
Several important trends can be identified as have shaped Western European agricultural
policy in the post-war period: the production increases in European agriculture that have
transformed the sector from a significant importer of temperate zone agricultural products to
a major exporter; the changing emphasis over time away from the production of
undifferentiated farm commodities towards quality and other attributes that allow for
product-differentiation; the increasingly globalized market that both provides raw materials
and intermediate inputs for the European food system and offers expanding access to
consumers in other countries; and the increasing concern with environmental and other
objectives that are constantly changing the nature of the coalition of interests necessary for
the support of agricultural policy. The reinstrumentation of agricultural policy has been a
consequence of these trends away from import protection that allowed the sector to have a
sheltered environment for growth and towards direct payments that are supported as rewards
for socially-responsible farming practices. Intervention in the market and the dumping of
surpluses abroad has largely given way to a regulatory approach that is encouraging quality
foods that have a ready market and protecting locational and other indicators that are
associated with such quality attributes. The reinstrumentation itself has largely been
responsible for the moderation of the levels of protection relative to non-agricultural sectors
and for less consumer taxation mentioned above.
Production increases
Somewhat ironically, it has been the strong growth of agricultural production in Western
Europe that has brought about the most intractable policy problems. The policies introduced
in the EEC were premised on the fact that agriculture needed support because it could not
compete with domestic industry for labor and capital or with production from overseas farms
that were larger and perhaps less constrained by social and environmental factors. The
instruments used were designed to insulate domestic producers from developments on world
33
markets. World prices were seen as too volatile to act as a basis for stable domestic markets.
When prices were held up by imports entering over the protective wall, this system was at
least manageable, if not efficient. But when production outstripped demand, surpluses began
to accumulate. New instruments had to be developed and those that had been intended as
occasional market supports undertook new functions.
These pressures arising from production increases were noticed first in the cereals
market. As a result of the initial decision on cereal prices, production of wheat, barley and
maize (corn) increased sharply. Use of grains for animal feed dropped rapidly, and the search
for alternative feeds began in earnest. One external factor played a significant role in the
development of such alternatives: the level of protection of several non-grain feedstuffs had
been fixed at zero or low levels in the Dillon Round of the GATT (1962). Feed compounders
in Europe found that soybean meal (from imported soybeans) and cassava chips (from
Thailand and Indonesia) made a cheaper feed for livestock than (domestic) corn and barley.
The expanded imports that followed exacerbated the domestic supply imbalances, adding to
the growing stocks of cereals.33
Dairy prices had also been set high in the EEC, encouraging production and
discouraging consumption. Structural change in the dairy sector added to the increase in
production.34 Surpluses showed up early, and various mechanisms were suggested to get rid
of the “butter mountains” that had resulted from intervention buying. Taxes on the use of
non-dairy products were suggested but not approved. Subsidies for the use of skimmed milk
powder in animal feed were effective but did not discourage production. Modest price cuts
(through co-responsibilitiy levies) also were too small to curb production. Finally, in 1981,
quotas on milk production were introduced. These have been in place ever since, and have
been effective if inefficient as a way to restrain production.
Beef production also expanded rapidly in the EU, in part as a reflection of the increase
in dairy production (most beef in Europe comes from the dairy herd) and in part a reaction to
hill farming and other livestock subsidies. But in the 1970s consumption of veal slumped as a
result of health concerns related to the use of growth hormones, and in the 1990s beef
consumption plummeted following the discovery of a probable link between Bovine
Spongiform Encephalopathy (BSE) in cattle and a new variant of Creutzfeldt-Jakob disease
33 In addition, the soybean oil produced along with the soybean meal was a major competitor for butter and for olive oil, increasing the surpluses of these crops. 34 Trade issues also played a role here, as the UK insisted on continued preferential access for New Zealand for butter as part of its accession arrangements.

34
(nvCJD) disease in humans. So the policy response had to focus on reassuring consumers
rather than discouraging producers from overproduction.
Another product where surpluses appeared was sugar, where beet had been grown for
150 years as a rotation crop for Northern Europe and a valuable calorie source in times of
interuption in trade.35 But both France and the UK had former colonies that depended on the
European market to sell their sugar cane. When the UK acceeded to the EEC in 1973, a
guaranteed market was conceded for its overseas suppliers. So the EU has struggled with an
import commitment alongside a growing export surplus. When other exporters challenged the
legality of the EU’s policy of re-exporting the imported sugar, a panel found that the EU had
exceeded its export subsidy commitment under the WTO. The sugar policy has now been
reformed, by reducing support prices and paying compensation to growers and beet crushers,
so that it is less obtrusive on world markets.
In each of these cases, the main problem was that prices were rigid downwards,
largely as a result of the decision making system. Farm ministers were reluctant to return
from the annual price negotiations in Brussels having agreed to price cuts. And finacial
control was also lacking, largely because the impact of price decisions on spending were not
apparent to those (the farm ministers) making the decisions. As the budget cost of export
subsidies was shared among all members (and the import levies pooled) the true (foreign
exchange) cost to each country was the internal price. Under these circumstances, it was not
surprising that price cuts were rare. Productivity growth put pressure on the costs of the
policy and on the external impact, but the lack of financial accountability and the difficulty of
getting the political support needed for a major policy change led to a continual air of crisis
and controversy.
Comparisons with other high-income countries
The predominant feature of agricultural policy in Western Europe over the past fifty years has
been the relatively high levels of support given to most sectors of agriculture. Support has
been high relative to other temperate zone producers of agricultural goods. Though
agricultural protection in East Asia rose from low levels in the 1950s to be well above those
in Western Europe (Honma and Hayami 2007), protection in Australia, Canada, New Zealand
and the United States was generally at a much lower level (Gardner 2008, Anderson et al.
2008).
35 Sugar beet production was developed and encouraged in the Napoleonic era as a food security strategy.

35
Including agriculture in the experiment of economic integration was a bold leap into
the dark for the EEC. The economic rationale was similar to that in other sectors: the
agricultural sector would gain from rationalization on a continent-wide basis and would lower
costs. This in turn held out the hope that an integrated European agriculture could compete
with the Americas and the temperate zone producers of the Southern Pacific. But this would
have required real competition among EEC farmers, with the less efficient leaving the sector.
The main explanatory factor for the level of protection in the fifty years of Western European
agricultural policy under discussion has been the reluctance of politicians (and to a large
extent, of society in general) to expose the sector to this degree of competition. Integration of
agricultural markets has indeed taken place, but in an environment where inefficiencies were
able to survive and production decisions did not reflect the realities of the market. In short,
the distortions that have continued in European agriculture have been as a result of the
political reluctance to encourage the needed adjustments in the sector. The social costs of
such adjustments played a dominant role in shaping the crucial decisions. But as a result,
fresh resources have been attracted into the industry that could have had greater benefits to
society elsewhere. The process of outmigration from agriculture has undoubtedly been
slowed by the incentive structure of the CAP. Thus the policy has been successful in its own
terms, by mitigating the adjustment cost, but expensive in societal terms by delaying changes
that would have been beneficial.
The unwillingness of governments to subject their agricultural sectors to the rigors of
the market was also evident in the decisions of those countries that chose not to join the EU.
The need to lower support prices in Norway and Switzerland in the event of membership was
a major factor in generating opposition to EU accession in rural communities. These high-
cost countries have been reluctant to expose their farmers to competition from the EU and to
induce the structural changes and entrepreneural initiatives that offer the chance for
competitiveness. Each has protected its agriculture behind high tariffs, thus blunting market
signals and burdening the downstream sectors with higher costs.
Environmental and quality objectives
The five decades discussed above cover a period of a major transformation of agricultural
policies not just in terms of the instruments used but in the objectives that lie behind
government intervention in the agricultural sector. The focus of agricultural policy has over
the period swung away from a narrow focus on the income level of farmers toward a raft of

36
policy objectives ranging from the preservation of the coutryside and the provision of healthy
food to rural development and animal welfare. Farm incomes have over time become more of
a constraint on policy change than a rationale for the existence of policy. Those who benefit
financially from the policy have been able to slow down the shift in emphasis (and budget
allocation) but not stop it altogether.
The need to include incentives for the improvement of farm structures was recognized
in the 1960s, when the Mansholt Report emphasized the dangers of persuing all objectives
through price support. The introduction of a structural program proved slow, as it was in
competition with funds for market management. Similarly the need was realized for funds for
rural development in part as a way of helping agriculture adjust. Eventually, the “Second
Pillar” of the CAP was constructed and supplied with enough funds to make it a significant
aspect of policy. National funds are also now authorized, subject to constraints, to be shifted
from price and income support to rural development programs (modulation) that meet other
objectives.
Environmental objectives have also become important in shaping the CAP (and
policies in the EFTA countries). Originally the thrust was to prevent the negative impacts of
intensive farming on the countryside (and adjacent urban areas) and on soil, air and water
pollution. Over time this has changed into an emphasis on the positive contribution of
agriculture as the dominant activity in much of the Europe’s more scenic rural areas. In the
1990s this became associated with the term “multifunctionality,” reflecting appropriately the
range of public goods provided by rural businesses. But other exporters pointed to the risk
that this could become an excuse for a blank cheque to policy-makers who were looking for
reasons to continue income support in a more acceptable guise – thus perpetuating the
distortions to resource allocation.
The first evidence of major changes to the politics and political economy of the CAP
that came as a result of public concerns over food safety. Building on public reactions to
some reported instances of human exposure to hormones used in livestock production, the EU
banned to use of such substances in animal production. Apart from the international
ramifications of this decision (US and Canadian beef and beef products were banned) the
impact on domestic policy was noticable. It ushered in perhaps the most significant change in
the perception of the CAP, its link with food quality and the production practices employed
by farmers. The advocates of more emphasis on local foods and on more animal-friendly
livestock practices joined up with those that opposed the use of transgenic technology in

37
foodstuffs to form a formidable new voice in agricultural policy. The CAP has become
complemented with increasingly centralized food safety and quality policies and regulations
on animal welfare. The policy has itself been redefined as one that emphasizes quality (over
quantity) and the promotion of foods that reflect the cultural richness of rural Europe.
Farmers spotting this trend have shifted their own production and marketing practices toward
these new demands. It could be argued that this market orientation reduces distortions,
though others might regard the policy-supported changes in demand as themselves
“distortions” for the consumers that cannot or do not wish to shift their eating habits in this
way.
Reinstrumentation
The original policy instruments chosen by the EEC were intended to provide a stable price
environment for the agricultural sector. The variable levy smoothed out the fluctations that
would have otherwise been transmitted to the domestic market. The export subsidies
(restitutions) allowed goods to be withdrawn from the domestic market and sold at lower
world prices. Only dairy (after 1981) and sugar (strictly speaking a “temporary” market
order) were subject to supply controls. Some producer subsidies existed, including those for
durum wheat and for olive oil, but these were also backed up by tariff protection. Wine was
regularly taken off the internal market for distillation, and producer groups could withdraw
fruits and vegetables with assistance from the Commission if prices fell to “crisis” levels. The
changes that have come about in the instruments used in the CAP are as important in their
impacts as the levels of protection themselves. These changes have not come easily, but they
have had a lasting impact on the shape of the CAP.
The most significant modification of policy instruments came in 1992, with the
MacSharry reforms.36 Direct payments in compensation for price declines added flexibility to
the policy, as described above. But this transition also followed a pattern observed in other
countries. The US began to move from price supports to direct payments, and to decouple
those payments from production and prices during the 1980s (Moyer and Josling 1990). And
at the time of the Uruguay Round it became apparent that one way to reduce overseas threats
to the CAP was to make the instrumantalities more similar to those of trading partners.
36 A change in the oilseeds policy preceeded that in the cereals market, as a GATT panel ruled that payments to processors tied to the use domestic raw material were inconsistent with GATT obligations. This change allowed the EU to gain experience with a direct payment program

38
Since the mid-1980s the gap between total producer support and that derived from
market price support has widened, particularly after the 1992 reforms. Currently, market
price support accounts for just over one-half of total CAP support, compared to 90 percent
twenty years ago. To the extent that the new instruments are significantly less trade
distorting, they also are less distorting for the domestic economy. A similar trend is noticable
for Switzerland: the “decoupling” of payments from output and price has been introduced
even though the absolute level of support is still greater in that country than in the EU.
Norwayhas not increased its degree of decoupling, but the absolute level was in any case
lower as a result of subsidies that were aimed at keeping population in the North of the
country regardless of their levels of output (Appendix Figure 8). The decoupling of support
from price and output has also allowed for a trend to attach payments to other policy
objectives in these EFTA countries as it has in the EU.
Turning points
Though these trends have continued over the five decades, several turning points have also
been crucial in influencing the CAP and the level of distortions that have been a feature of
agricultural policies in Western Europe over the period since 1955. These include the
increase in the price of oil in 1973 that changed not only the macroeconomic picture in
Western Europe but also the perception about commodity markets and food prices.
The oil price increase impacted the CAP in two respects. It increased costs to farmers
in a way that was readily apparent and led to compensating price increases. Coming not long
after the end of the transition period (1967), at a time when policy-makers were attempting to
reduce price incentives, and the exchange rate changes of 1968, when prices diverged again
within the EU, the pressures for price adjustments was difficut to resist. Moreover, the oil
price increasses coincided with the sharp rise in cereal and sugar prices on world markets,
thus fuelling fears of longer term shortages and masking the level of underlying distortions
that were present in the system. The opportunity to make use of the high price period to
reduce the support prices was lost. Instead, support prices followed the world market upward,
to be left isolated when world prices declined again.
The oil price hike also coincided with the accession of the UK to the EEC. The UK
was expected to bring a new look at farm policy based on its history of international openess.
Some countries welcomed this (such as the Netherlands) while others were prepared to resist

39
(notably France but also Germany). However, the period of inflation and currency
movements that followed in the 1970s overwhelmed the possibility of policy improvements
and left the UK reluctantly accepting the CAP so long as the budget cost to the UK was
constrained and so long as it controlled the pace of adjustment of the “green” rate of
exchange. This compromise lasted through the run up to monetary union, when policy prices
in the EU became “common” again.
Political changes also have had an impact on the CAP and hence on the level of
distortion in Western European agriculture. The fall of the Berlin Wall in 1989 and the
subsequent unification of Germany offered an opportunity for the return of the countries of
Central and Eastern Europe (CEECs) to the mainstream of economic and political life. This
has governed the basic approach to agricultural policy since that date. Europe Agreements
were negotiated with those CEECs that were deemed to be ready for accession, and
agricultural products were included, albeit with some restrictions of a quantitative nature. All
agricultural policy decisions since that time have had to be taken in the light if their
implications for the larger European market. This has acted as a disincentive to increase
support levels in the existing EU.
To an extent unmatched in most other developed regions, the CAP has been
influenced by external pressures as well as by those of a more domestic nature. A major
turning point came in the mid-1980s as a direct result of this external pressure. The decision
making of the CAP always took place within the context of the state of world markets, which
effected budget costs in particular. But the Uruguay Round introduced, in the Agreement on
Agriculture (URAA), a legal framework that restricted the scope for domestic action. It also
gave domestic policy makers a lever on the policies of other countries, through the
negotiation and enforcement of tariff reductions and scheduled cuts in subsidies. Thus the
CAP, along with the policies of other countries, was subject after 1995 to challenge, and
policy changes that would have been of mainly internal interest became of international
significance.
Prospects for future reform of Western European policy
The essential nature of the CAP is that it represents a bargain among member countries. Each
country in the EU has its own agricultural policy objectives even if it has ceded the ability to

40
use many instruments to acheive those objectives. The CAP is a reflection of the bargaining
process within the EU as much as a coordinated and consistent European view of appropriate
role for government in agriculture. Reform can come about as a result of changes in the terms
of the bargain just as much as a shift in the model of agriculture that underlies policy or the
reactions to exogenous events. However, it is still possible to speculate on the change in
underlying attitudes to agriculture in the development of the CAP, and hence hazard a guess
as to where those trends might be leading. In the light of the political economy constraints
and incentives mentioned above, this section attempts to draw out the prospects for further
policy reform in Western Europe.
One issue is whether the consolidation of Western Europe in the EU, and by
implication the extension of the CAP to all Western European agriculture, will in the
foreseeable future be completed. This implies the entry of Norway and Switzerland to the
EU. Norway has resisted so far in part because its position as an exporter of oil and gas has
enabled it to have a high level of income as an “adjunct” to the EU market. Investment could
be stimulated by accession, but that is not enough to convince the electorate to “share” its fish
resources, subject its farmers to price decreases and possibly have to modify its control and
use of its energy supplies. But the possible end to the oil reserves and an autonomous reform
of its agriculture (and a more acceptable fisheries policy in the EU) could change the
situation. The level of protection is still considerably higher in Norway than in the EU.
Significant policy adjustments would be needed before Norwegian agriculture could be
assimilated into the CAP.37
Switzerland has been steadily converging with the EU in most aspects of policy, both
industrial and agricultural. As a result, one would expect the economic aspects of accession to
be less significant than its political aspects. Not only does Switzerland have a strong history
of avoiding foreign entanglements but its constitution (as a participatory democracy) poses
some problems for the transfer of some sovereignty to the EU level. If a time comes when
major sectors of the Swiss economy are harmed by exclusion from the EU, one might expect
to see an application to join. However, as in the case of Norway, the level of farm protection
is still considerably higher than in the EU.38
37 Much the same could be said for Iceland. 38 However, due to the smaller size of these two non-members, Norway and Switzerland, the absolute value of the subsidies is much smaller than that of the EU (see Appendix Figure 8(b)). As a result the international implications of such protection are less immediate.

41
An enlargement issue of a different kind is the prospect of the accession of Turkey to
the EU. The impact on the level of distortion in Western Europe may well be significant.
Turkey poses an economic and political dilemma for the EU. On the one hand, the
geopolitical argument point to the benefits of offering membership to a strategically
important country. On the other hand, Turkey has an income level of about one-third of the
level of the EU, and would add some 20 percent to the population. So the impact on the EU
economy could be considerable (in a positive as well as a negative direction), with the
challenge to agriculture being a major consideration. For these reasons, one might expect a
long period of transition before Turkey were to be fully incorporated into the single EU
market (see also Anderson and Swinnen 2008).
More trade agreements are on the cards for the EU, as it consolidates its relations with
its neighbors in North Africa and the Middle East and extends its “neighborhood policy” to
include Central Asia and the Caucasus. The current wave of trade agreements under
negotiation also include arrangements between the EU and the countries of Latin America,
through an EU-MERCOSUR trade pact. The trade policy plans of the Commission include
agreements with major Asian countries, to avoid getting left behind relative to competitors in
North America and East Asia. All these agreements will tend to put a downward pressure on
agricultural distortions where they include improved market access for farm products. The
extent to which this pressure is reflected in real changes will depend on the political
significance attributed to the FTAs themselves. Domestic agricultural policy has proved
resistant to many such trade policy developments, but not all. The Everything But Arms
agreement that gave the Least Developed Countries tariff- and quota-free access to the EU
market included agricultural products, and led in turn to the reform of the politically-sensitive
sugar policy in 2006.
The CAP has always absorbed a major share of the EU budget, though that share,
once above 75 percent, has now been reduced to about 55 percent. More countries are being
included in the activities funded from the budget, without corresponding increases in the level
of funding. The prospect of substantially increased funds available for agricultural policy is
slim. But this in turn means that shifts in instruments toward the less distorting direct
(decoupled) payments is increasingly difficult. More likely is the addition of funds for such
projects as the development of biofuels which could benefit agriculture in a more acceptable
way, depending on how the perception of the environmental effects of such interventions
evolve.

42
The impact of the Uruguay Round on the CAP has been emphasized above.
Negotiations have been underway for seven years in the Doha Round, the WTO’s follow-up
to the UR. The Doha Round would cut tariffs, eliminate export subsidies and reduce the
scope for trade-distorting domestic support. Though the talks are presently on hold, there is
still the possibility that they may be concluded by the end of 2009. If an agreement is
eventually reached within the range of options on the table, the EU would phase out its export
subsidies altogether by 2013 and significantly cut its ability to support prices. Though much
of the domestic policy is now sheltered in the Green Box (and not subject to reductions), the
Doha Round would “lock in” those aspects of reform. Tariffs would be cut by about 60
percent, with some exceptions for the most sensitive products (such as dairy and beef). WTO
dispute settlement panels have already found that the sugar and banana regimes were
inconsistent with WTO obligations: other countries will no doubt explore further challenges
where they consider the CAP too distortive in world markets.
One vital question with respect to the future of the CAP is whether the trend is toward
a renationalization of the policy. There has been some small move in this direction, with
flexibility built in to the direct payments. The degree of decoupling, for some commodities, is
at the discretion of the member countries. How far this trend will go is a matter of political
decisions well above that of the agricultural policy. But there is a logic to the
renationalization of payments that are not related to farm output so long as they do not
influence competition. So there is the possibility of an eventual division between the market
mechanisms that would be controlled at the EU level and the payments for public goods that
may revert to the national level.
There could therefore be a convergence of the likely and the desirable policy
directions in the period up to 2020. A continuation of decoupling of support from price and
output should over time significantly reduce distortions, though if such payments are
“recoupled” to other objectives there could be some economic cost. Trade agreements will
reinforce this trend, as access to the EU market will be an important inducement for other
countries to conclude such agreements.
What, if any, are the policy lessons for developed, developing and transition
economies of the trends and turning points in Western Europe’s agricultural policies? In
many ways the EU is unique in having agreed at its founding on a system of internal free
trade and a common policy for market management and external protection. In that regard the
lessons are less likely to be directly applicable. But the development of the CAP does offer

43
some generalizable lessons. Among the most important of these has to do with the pitfalls of
attempting to manage markets in such a way as to give farmers adequate incomes. Technical
advances, demand shifts and the natural responses by private actors to incentives offered by
policy will undermine the ability of policy administrators to achieve the required outcome.
The CAP was too inflexible to adapt to changes in the internal or external market: Ministers
of agriculture meeting periodically are unlikely to be able to adjust policy instruments and
price levels in the face of such changes. So the policy is always a step behind the market. And
the income streams generated by the policy ensure that there are always interests lined up
against change. The combination of inflexible decision making and a bias toward the status
quo made it impossible for the CAP to keep its relevance over the decades. But external
pressure through the GATT talks and the WTO, as well as a feeling that the CAP was no
longer viable in its original form, have induced a series of changes that have shifted the
nature of agricultural policy in Europe. The policy is still somewhat inflexible, and changes
may be even harder now with twenty-seven members, but the reduction of prices of most of
the main products to near world market levels has given much more scope for creative policy
making. The flexibility of direct payments, though it can be overused, gives the hope of a
policy for agriculture that is less distortive of world markets and less obtrusive of economic
adjustments on the domestic front. The way in which this was accomplished should indeed be
of interest to other countries.
Conclusions
Three main conclusions emerge from this chapter. First, the level of distortions to the
Western European economies resulting from direct and indirect policy interventions in
agriculture has been declining in recent years. Protection of agriculture was highest in the
1960s but fell in the 1970s as world markets became tight and European agriculture appeared,
temporarily, to be more competitive. But reaction to the period of high world prices and
inflation at home led to a rapid increase in distortion from the mid-1970s to the early 1980s.
That the level of distortion remained high for several years attracted criticism from at home
and abroad. These levels have been steadily declining in the EU since the mid-1980s and
become much more stable. In the countries that decided to stay outside the EU, distortions

44
remain high and more variable, although in the last few years there have been signs of
convergence with the EU.
Secondly, the act of joining the EU has had a mixed impact on country levels of
distortion, and hence on the total level of distortion in the region. In some cases the accession
of new members has raised the protection level and in others it has decreased it. Protection
levels in Western Europe increased as a result of the 1973 accession of the UK, Denmark and
Ireland. Agriculture in each of these countries expanded and their competitiveness with
respect to world markets was eroded. The entry of Southern European countries in the 1980s
also increased the overall level of protection by including in the CAP countries such as Spain
and Portugal that had relatively low levels of assistance. But, many of the countries that
chose to stay outside the EEC in the 1960s were also those countries with high-cost farming
sectors. The high levels of protection were not “imported”into the EU from countries such as
Finland and Austria. Hence, the overall result of the incorporation of the many of the Nordic
and Alpine countries has been to reduce overall protection in Western Europe somewhat
when they eventually joined the EU. This is confirmed by the nature of the two major
countries in Western Europe that have remained outside the EU (Switzerland and Norway)
both of which have far higher levels of distortion than the EU itself. This suggests that their
eventual accession could play some role in reducing distortions in these countries, even if not
in the current EU countries.
The accession of the ten new members from Central and Eastern Europe posed a
challenge for the CAP and the process of reform. Though producers in the EU expressed the
fear that the competition from those countries would oversupply markets in the EU,
particularly for products such as pigmeat, the European Commission was more concerned
with the implied commitment to pay direct payments to the large number of farmers that were
about to join the EU and come under the political umbrella of the CAP. As it happened,
prices rose steadily in the new entrants, but surplus production has not been a problem.
Market disruption has been limited to isolated cases, and the eastern half of the Continent is
rapidly becoming integrated with Western markets. The prospect of additional costs under the
CAP proved a real stimulas for reform: it had already been decided to spread funds allocated
for a EU of 15 over all 27 countries. So one can reasonable conclude that the latest
enlargement has tightened the constraints already limting the CAP, even though it has raised
farm protection in the CEECs (Anderson and Swinnen 2008).

45
The third conclusion is that domestic policy operates in an international environment,
even as domestic politicians proclaim their autonomy. The development of policy in Western
Europe has become in itself an international issue, and external pressures could not be
ignored. This posed a major challenge for policy-makers, who could have used the external
pressure as a reason for positive change or as a negative force that call for defenses that
deflect its impact. The EU for many years attempted the latter strategy, but since 1990 has
made significant use of bilateral and multilateral agreements to guide agriculture in a
direction that makes it compatible with a more open trade system. So economic distortions
have been reduced as compatibility issues with the international economic system have been
resolved. The pace of such developments has been dictated by those who were gaining most
from the unreformed policy, but in the end the political benefits that flowed from reforming
the policy came to outweigh the costs of change. Though considerable distortion in Western
European agriculture still exists, the path to reducing that distortion is opening up. Allowing
farmers to respond to consumer demands, where not artificially stimulated by government
regulations, is the most desirable way to point agricultural policy. The rhetoric of the CAP
has adopted this approach for the past five years, and the policy is slowly moving in that
direction.
References
Anderson, K. (ed.) (2009), Distortions to Agricultural Incentives: A Global Perspective, 1955
to 2007, London: Palgrave Macmillan and Washington DC: World Bank.
Anderson, K. and Y. Hayami (1986), The Political Economy of Agricultural Protection,
London and Sydney: Allen and Unwin.
Anderson, K., M. Kurzweil, W. Martin, D. Sandri and E. Valenzuela (2008), “Methodology
for Measuring Distortions to Agricultural Incentives”, Agricultural Distortions
Working Paper 02, World Bank, Washington DC, revised January. Posted at
www.worldbank.org/agdistortions and reproduced as the Appendix in Anderson
(2009).
Anderson, K., R. Lattimore, P. Lloyd and D. MacLaren (2008), “Distortions to Agricultural
Incentives in Australia and New Zealand”, Agricultural Distortions Working Paper

46
09, www.worldbank.org/agdistortions, revised August (condensed to Ch. 5 in
Anderson 2009).
Anderson, K. and J. Swinnen (2008), “Distortions to Agricultural Incentives in Eastern
Europe and Central Asia”, Agricultural Distortions Working Paper 63,
www.worldbank.org/agdistortions, August (condensed to Ch. 6 in Anderson 2009).
Anderson, K. and E. Valenzuela (2008), Global Estimates of Distortions to Agricultural
Incentives, 1955 to 2007, database available from October at
www.worldbank.org/agdistortions.
Avillez, F., T. Finan and T. Josling (1988), Trade, Exchange Rates, and Agricultural Pricing
Policy in Portugal: The Political Economy of Agricultural Pricing Policy, World
Bank Comparative Studies, Washington DC: World Bank.
Avillez, F., T. Finan and T. Josling (1991), “Portugal”, Ch. 5 in A. Krueger, M. Schiff and A.
Valdes (eds.), The Political Economy of Agricultural Pricing Policy: Volume 3 Africa
and the Mediterranean, Baltimore: Johns Hopkins University Press for the World
Bank.
Corkhill, D. (1995), The Portuguese Economy Since 1974, Edinburgh: Edinburgh University
Press.
Crafts, N. and G. Toniolo (2008), “European Economic Growth, 1950-2005: An Overview”,
CEPR Discussion Paper No. 6863, London, June.
EUROSTAT (2006), Online Database accessed June 2006.
FAO (1973), “Agricultural Protection: Domestic Policy and International Trade”, FAO
Conference Document C 73/LIM/9, Rome: Food and Agriculture Organization,
November.
Gardner, B. (2008), “Distortions to Agricultural Incentives in the United States and Canada”,
Agricultural Distortions Working Paper 62, www.worldbank.org/agdistortions,
August (condensed to Ch. 4 in Anderson 2009).
Gulbrandsen, O. and A. Lindbeck (1973), The Economics of the Agricultural Sector,
Uppsala: Almquist and Wicksell.
Hallett, G. (1981), The Economics of Agricultural Policy, 2nd edition, Oxford: Blackwell
Press.
Heidhues, T. et al. (1978), Common Prices and Europe's Farm Policy, Thames Essay No. 14,
London: Trade Policy Research Centre.

47
Honma, M. and Y. Hayami (2007), “Distortions to Agricultural Incentives in Japan, Korea
and Taiwan”, Agricultural Distortions Working Paper 35,
www.worldbank.org/agdistortions, December (revised as Ch. 2 in Anderson 2009).
Howarth, R.W. (1971), Agricultural Support in Western Europe, Institute of Economic
Affairs, Research Monograph No. 25, London.
Ingersent, K. and A.J. Rayner (1999), Agricultural Policy in Western Europe and the United
States, Cheltenham: Edward Elgar.
Josling, T. (1970), “Exchange Rate Flexibility and the Common Agricultural Policy of the
EEC”, Weltwirtschafliches Archiv 104(1).
Josling, T. (2007), “External Influences on CAP Reform: An Historical Perspective,”
Workshop on The Political Economy of the Fischler Reforms, CEPS, Brussels, 15
February.
Josling, T. and S. Harris (1976), “Europe's Green Money”, The Three Banks Review 109:
57-72, March.
Kindleberger, C.P. (1975), “The Rise of Free Trade in Western Europe, 1820-1875”, Journal
of Economic History 35(1): 20-55.
Krueger, A.O., M. Schiff and A. Valdés (1988), 'Agricultural Incentives in Developing
Countries: Measuring the Effect of Sectoral and Economy-wide Policies', World Bank
Economic Review 2(3): 255-72, September.
Lieberman, S. (1995), Growth and Crisis in the Spanish Economy, 1940-93, London:
Routledge
McCrone, G. (1962), The Economics of Subsidizing Agriculture, London: Allen and Unwin.
Moyer, W. and T. Josling (1990), Agricultural Policy Reform: Politics and Processes in the
EC and USA, Hemel Hempstead UK: Harvester-Wheatsheaf Publishers.
Moyer, W. and T. Josling (2002), Agricultural Policy Reform: Politics and Process in the EU
and the US in the 1990s, Aldershot UK: Ashgate.
Nash, E.F. (1955), “The Competitive Position of British Agriculture,” Journal of Agricultural
Economics 11(3): 222-41.
Nash, E.F. and E.A. Attwood (1961), The Agricultural Policies of Britain and Denmark: A
Study in Reciprocal Trade, London: Land Books.
OECD (1967), Agricultural Policies in 1966, Paris: Organisation for Economic Co-operation
and Development.

48
OECD (2005), Agricultural Statistics (online database accessed at www.oecd.org in April
2007).
OECD (2008), Producer and Consumer Support Estimates (online database accessed at
www.oecd.org for 1986-2007 estimates; and OECD files for estimates using an earlier
methodology for 1979-85).
Orwin, C.S. (1949), A History of English Farming, London: Thomas Nelson and Sons.
Pepelasis, A. et al. (1980), ‘The Tenth Member – Economic Analysis” Sussex European
Papers No. 7, University of Sussex.
Roesener, W. (2000), “The History of German Agriculture”, in S. Tangermann (ed.),
Agriculture in Germany, Frankfurt: Verlag.
Sandri, D., E. Valenzuela and K. Anderson (2007), “Economic and Trade Indicators for
Asia” Agricultural Distortions Working Paper 20, World Bank, Washington DC,
December. Posted at www.worldbank.org/agdistortions
Snyder, L.L. (1945), “The American-German Pork Dispute, 1879-1891,” Journal of Modern
History 17(1): 16-28, March. (Reproduced in K. Anderson and T. Josling (eds.), The
WTO and Agriculture, Volume II, Cheltenham: Edward Elgar.)
Tracy, M. (1964), Agriculture in Western Europe, New York: Praeger.
Tracy, M. (1989), Government and Agriculture in Western Europe, 1880-1988, Hemel
Hempstead: Harvester Wheatsheaf.
Tyers, R. and K. Anderson (1992), Disarray in World Food Markets: A Quantitative
Assessment, Cambridge and New York: Cambridge University Press.
World Bank (2007), World Development Report 2008: Agriculture for Development,
Washington DC: World Bank.

Figure 1: NRAs to agriculture, EU-6 and Western European average, 1956 to 1964 (percent)
(a) EU-6 members
-20
0
20
40
60
80
100
120
140
1956 1957 1958 1959 1960 1961 1962 1963 1964
France Germany
Italy Netherlands
WE Average
(b) Other European Countries
-50
0
50
100
150
200
250
300
1956 1957 1958 1959 1960 1961 1962 1963 1964
Austria Denmark Norway PortugalSweden Switzerland UK
Source: Anderson and Valenzuela (2008), based on author’s spreadsheet which draws heavily on OECD (2008) for calculations from 1979

2
Figure 2: NRAs to agriculture, EU-9 and Western European average, 1965 to 1974 (percent)
(a) EU-9 members
010
2030
4050
6070
8090
100
1965 1966 1967 1968 1969 1970 1971 1972 1973 1974
Denmark Ireland UK WE Average EU-6
(b) Other Western European countries
-50
0
50
100
150
200
250
300
1965 1966 1967 1968 1969 1970 1971 1972 1973 1974
Austria Finland NorwayPortugal Sweden Switzerland
Source: Anderson and Valenzuela (2008), based on author’s spreadsheet which draws heavily on OECD (2008) for calculations from 1979
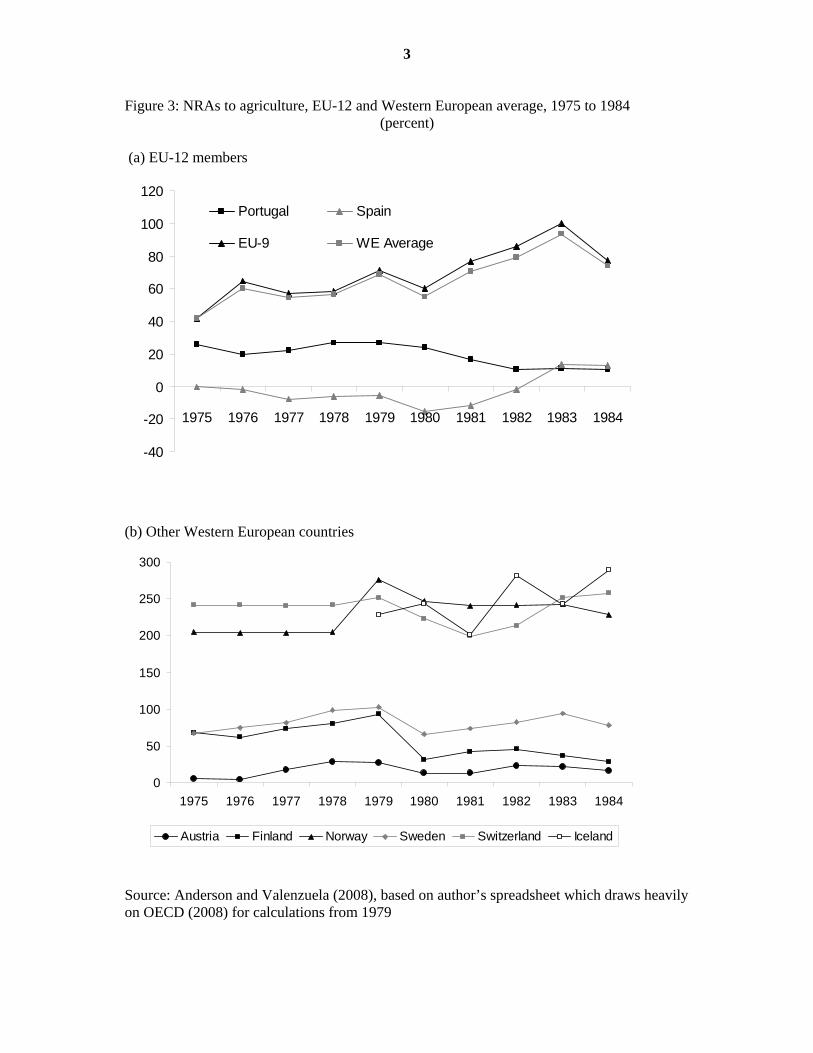
3
Figure 3: NRAs to agriculture, EU-12 and Western European average, 1975 to 1984 (percent)
(a) EU-12 members
-40
-20
0
20
40
60
80
100
120
1975 1976 1977 1978 1979 1980 1981 1982 1983 1984
Portugal Spain
EU-9 WE Average
(b) Other Western European countries
0
50
100
150
200
250
300
1975 1976 1977 1978 1979 1980 1981 1982 1983 1984
Austria Finland Norway Sweden Switzerland Iceland
Source: Anderson and Valenzuela (2008), based on author’s spreadsheet which draws heavily on OECD (2008) for calculations from 1979

4
Figure 4: NRAs to agriculture, EU-15 and Western European average, 1985 to 1994 (a) EU-15 members
0
20
40
60
80
100
120
140
160
180
1985 1986 1987 1988 1989 1990 1991 1992 1993 1994
Austria Finland Sweden EU-12 WE Average
(b) Other Western European countries
0
50
100
150
200
250300
350
400
450
500
1985 1986 1987 1988 1989 1990 1991 1992 1993 1994
IcelandNorwaySwitzerland
Source: Anderson and Valenzuela (2008), based on author’s spreadsheet which draws heavily on OECD (2008) for calculations from 1979

5
Figure 5: NRAs to agriculture, EU-15/25/27 and Western European average, 1995 to 2007 (percent)
(a) EU-15 to 2004, then EU25 for 2005-06 and EU27 for 2007, then EU27 for 2007
0
10
20
30
40
50
60
1995 1996 1997 1998 1999 2000 2001 2002 2003 2004 2005 2006 2007
EU-15/25/27
WE Average
(b) Other Western European countries
0
50
100
150
200
250
1995 1996 1997 1998 1999 2000 2001 2002 2003 2004 2005 2006 2007
IcelandNorwaySwitzerlandEU-15
Source: Anderson and Valenzuela (2008), based on author’s spreadsheet which draws heavily on OECD (2008) for calculations from 1979
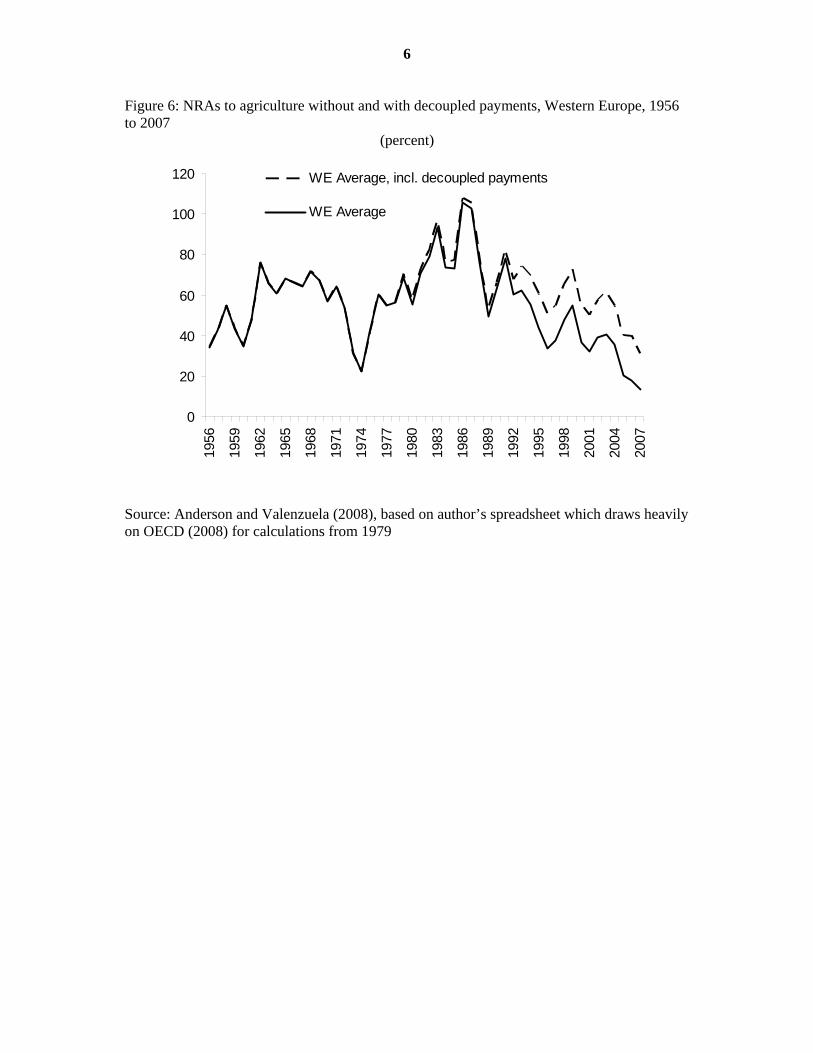
6
Figure 6: NRAs to agriculture without and with decoupled payments, Western Europe, 1956 to 2007
(percent)
0
20
40
60
80
100
120
1956
1959
1962
1965
1968
1971
1974
1977
1980
1983
1986
1989
1992
1995
1998
2001
2004
2007
WE Average, incl. decoupled payments
WE Average
Source: Anderson and Valenzuela (2008), based on author’s spreadsheet which draws heavily on OECD (2008) for calculations from 1979

7
Figure 7: Nominal rates of assistance to exportable, import-competing and alla agricultural industries, EU and other Western European countries,a 1956 to 2007 (percent) (a) European Union
-60
-40
-20
0
20
40
60
80
100
120
14019
56
1959
1962
1965
1968
1971
1974
1977
1980
1983
1986
1989
1992
1995
1998
2001
2004
2007
Total Exportables Import-competing
(b) Other Western European countries
0
50
100
150
200
250
300
1956
1959
1962
1965
1968
1971
1974
1977
1980
1983
1986
1989
1992
1995
1998
2001
2004
2007
Total Exportables Import-competing
a All non-product-specific assistance is apportioned to tradables. The EU is the original six countries to 1972, then 9 to 1985, then 12 to 1994, then 15 to 2004, then 25 to 2006, then 27 thereafter. The other Western European countries in our study comprise the original 7 EFTA members (Austria, Denmark, Norway, Portugal, Sweden, Switzerland and the UK) plus Finland, Iceland, Ireland and Spain to 1970, then without Denmark, Ireland and the UK from 1973 when they joined the EEC6, then without Portugal and Spain from 1986 when they joined the EC, then without Austria, Finland and Sweden from 1995 when they joined the EU. Source: Anderson and Valenzuela (2008), based on author’s spreadsheet which draws heavily on OECD (2008) for calculations from 1979

Table 1: Nominal rates of assistance to agricultural relative to non-agricultural industries, EU-15 and EFTA-3, 1956 to 2007 (percent)
(a) EU-15 member countries (weighted average)
1956-59 1960-64 1965-69 1970-74 1975-79 1980-84 1985-89 1990-94 1995-99 2000-04 2005-07
Covered products 49.0 61.9 72.4 47.3 56.3 69.9 79.8 60.8 39.8 32.9 14.7 Non-covered products 14.1 28.2 38.4 26.0 33.3 39.1 45.8 32.7 23.3 19.3 na All agriculture (excl NPS) 39.8 53.6 64.4 42.5 51.3 62.7 72.6 54.6 36.2 30.0 11.2 All importables 56.0 74.3 80.2 52.9 58.8 76.5 84.0 63.8 50.4 48.2 28.6 All exportables 3.9 13.0 27.4 18.5 30.0 27.3 44.5 33.3 12.0 6.0 0.5 All agriculture (incl NPS) 39.8 53.6 64.4 42.5 53.3 71.0 76.8 59.2 40.4 34.2 15.4 Decoupled payments 0.0 0.0 0.0 0.0 0.2 1.7 2.3 8.1 16.7 17.9 19.5 All agric (incl NPS & dec) 39.8 53.6 64.4 42.5 53.5 72.6 79.1 67.3 57.0 52.1 35.0 All ag tradables (inc NPS) 39.8 53.6 64.4 42.5 53.3 71.0 76.8 59.1 40.4 34.2 15.4 All nonag tradables 8.2 7.4 5.7 3.8 2.5 1.4 1.7 1.3 1.4 1.4 1.1 RRAa 29.2 43.1 55.5 37.3 49.7 68.5 73.9 57.1 38.4 32.4 14.1

2
Table 1 (continued): Nominal rates of assistance to agricultural relative to non-agricultural industries, EU-15 and EFTA-3, 1956 to 2007 (percent)
(b) Iceland, Norway and Switzerland (weighted average) 1956-59 1960-64 1965-69 1970-74 1975-79 1980-84 1985-89 1990-94 1995-99 2000-04 2005-07
Covered products 256 257 255 252 256 232 339 295 204 171 99 Non-covered products 169 172 173 179 166 169 150 111 78 64 141 All agriculture (excl NPS) 228 230 230 230 230 218 282 236 165 137 79 All importables 220 221 221 220 227 211 262 234 169 149 114 All exportables 247 249 249 255 239 240 334 242 159 119 70 All agriculture (incl NPS) 228 230 230 230 233 233 313 266 197 164 90 Decoupled payments 0 0 0 0 11 56 31 32 48 68 68 All agric (incl NPS & dec) 228 230 230 230 244 289 344 298 245 233 158 All ag tradables (incl NPS) 228 230 230 230 233 233 313 266 197 164 90 All nonag tradables 4.0 4.3 4.2 3.0 2.5 2.1 1.8 1.9 2.1 2.1 1.6 RRAa 216 216 217 220 225 226 306 259 191 159 87
a The relative Rate of Assistance (RRA) is defined as 100*[(100+NRAagt)/(100+NRAnonagt)-1], where NRAagt and NRAnonagt are the percentage NRAs for the tradables parts of the agricultural and non-agricultural sectors, respectively. Source: Anderson and Valenzuela (2008), drawing on authors’ spreadsheet.
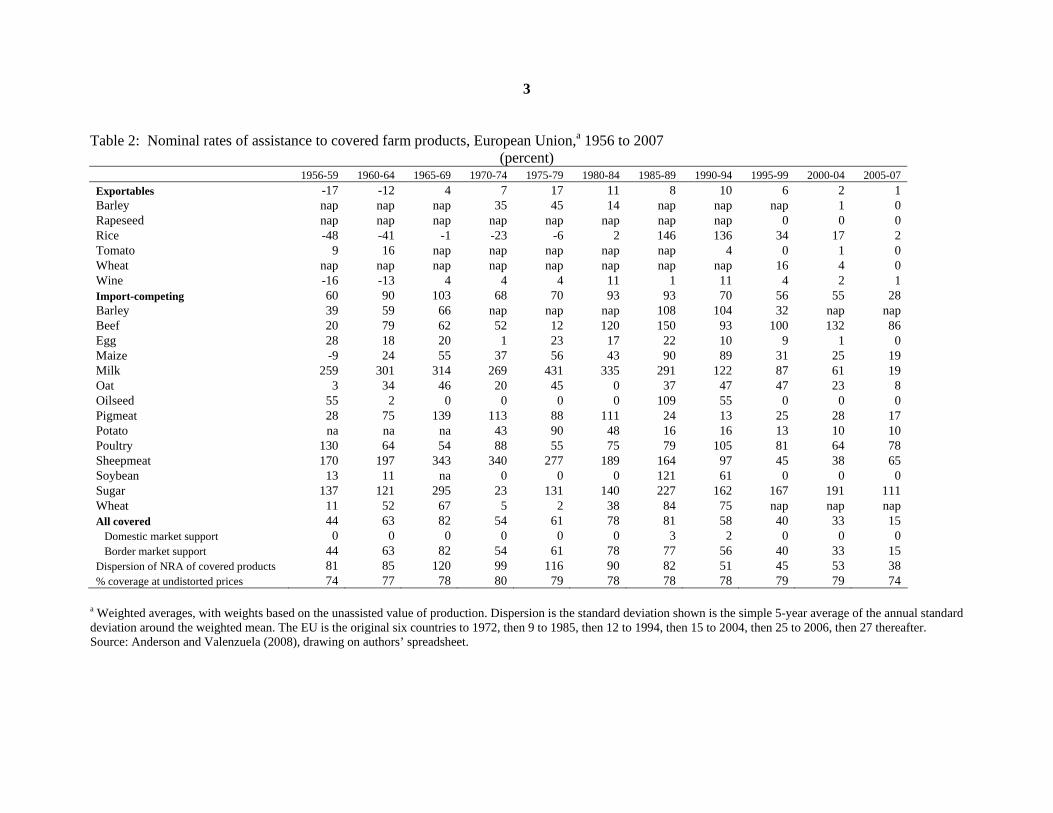
3
Table 2: Nominal rates of assistance to covered farm products, European Union,a 1956 to 2007 (percent)
1956-59 1960-64 1965-69 1970-74 1975-79 1980-84 1985-89 1990-94 1995-99 2000-04 2005-07 Exportables -17 -12 4 7 17 11 8 10 6 2 1 Barley nap nap nap 35 45 14 nap nap nap 1 0 Rapeseed nap nap nap nap nap nap nap nap 0 0 0 Rice -48 -41 -1 -23 -6 2 146 136 34 17 2 Tomato 9 16 nap nap nap nap nap 4 0 1 0 Wheat nap nap nap nap nap nap nap nap 16 4 0 Wine -16 -13 4 4 4 11 1 11 4 2 1 Import-competing 60 90 103 68 70 93 93 70 56 55 28 Barley 39 59 66 nap nap nap 108 104 32 nap nap Beef 20 79 62 52 12 120 150 93 100 132 86 Egg 28 18 20 1 23 17 22 10 9 1 0 Maize -9 24 55 37 56 43 90 89 31 25 19 Milk 259 301 314 269 431 335 291 122 87 61 19 Oat 3 34 46 20 45 0 37 47 47 23 8 Oilseed 55 2 0 0 0 0 109 55 0 0 0 Pigmeat 28 75 139 113 88 111 24 13 25 28 17 Potato na na na 43 90 48 16 16 13 10 10 Poultry 130 64 54 88 55 75 79 105 81 64 78 Sheepmeat 170 197 343 340 277 189 164 97 45 38 65 Soybean 13 11 na 0 0 0 121 61 0 0 0 Sugar 137 121 295 23 131 140 227 162 167 191 111 Wheat 11 52 67 5 2 38 84 75 nap nap nap All covered 44 63 82 54 61 78 81 58 40 33 15 Domestic market support 0 0 0 0 0 0 3 2 0 0 0 Border market support 44 63 82 54 61 78 77 56 40 33 15 Dispersion of NRA of covered products 81 85 120 99 116 90 82 51 45 53 38 % coverage at undistorted prices 74 77 78 80 79 78 78 78 79 79 74
a Weighted averages, with weights based on the unassisted value of production. Dispersion is the standard deviation shown is the simple 5-year average of the annual standard deviation around the weighted mean. The EU is the original six countries to 1972, then 9 to 1985, then 12 to 1994, then 15 to 2004, then 25 to 2006, then 27 thereafter. Source: Anderson and Valenzuela (2008), drawing on authors’ spreadsheet.

4
Table 3: Nominal rates of assistance to covered farm products, non-EU Western European countries,a 1956 to 2007 (percent)
1956-59 1960-64 1965-69 1970-74 1975-79 1980-84 1985-89 1990-94 1995-99 2000-04 2005-07 Barley 36 39 29 18 34 5 223 219 186 105 76 Beef 65 81 29 59 130 186 161 166 174 225 149 Egg -64 -69 -71 80 321 328 145 148 296 161 186 Maize 91 53 47 34 48 34 51 89 124 89 64 Milk 259 275 251 262 301 223 227 240 242 181 73 Oat 23 48 71 58 132 34 103 115 154 113 83 Oilseed 28 18 14 8 7 14 58 126 334 260 287 Pigmeat 51 63 74 38 12 45 71 82 180 172 116 Potato 130 144 167 59 63 63 38 35 na na na Poultry 56 52 25 101 188 207 104 74 370 437 383 Rice -18 -25 -14 -29 -21 -12 52 na na na na Sheepmeat 110 81 78 64 75 80 168 170 101 68 51 Soybean na na na -28 25 30 13 na na na na Sugar 265 253 446 47 126 121 250 198 233 255 173 Tomato 0 0 0 5 4 4 4 na na na na Wheat 29 42 43 7 14 46 126 170 195 91 61 Wine 0 0 0 0 0 0 0 0 na na na Wool na na na na 124 36 78 207 187 167 207 Exportables 37 43 55 37 35 30 98 133 236 172 70 Import-competing 82 81 66 43 57 61 169 191 194 171 114 All covered 68 69 63 41 50 51 119 152 204 171 99 Domestic market support 0 0 0 0 2 12 -20 -17 7 12 11 Border market support 68 69 63 41 46 33 138 169 198 159 88 Dispersion of NRA of covered products 90 91 125 67 109 103 81 73 84 105 112 % coverage at undistorted prices 73 73 74 75 74 75 86 75 69 69 80
a Weighted averages, with weights based on the unassisted value of production. Dispersion is the standard deviation shown is the simple 5-year average of the annual standard deviation around the weighted mean. The other Western European countries in our study comprise the original 7 EFTA members (Austria, Denmark, Norway, Portugal, Sweden, Switzerland and the UK) plus Finland, Iceland, Ireland and Spain to 1970, then without Denmark, Ireland and the UK from 1973 when they joined the EEC6, then without Portugal and Spain from 1986 when they joined the EC, then without Austria, Finland and Sweden from 1995 when they joined the EU. Source: Anderson and Valenzuela (2008), drawing on author’s spreadsheet.

5
Table 4: Nominal rates of assistance to all agriculture,a individual Western European countries,a 1956 to 2007 (percent)
1956-59 1960-64 1965-69 1970-74 1975-79 1980-84 1985-89 1990-94 1995-99 2000-04 2005-07 Austria 25 33 36 12 17 17 49 71 45 41 19Denmark 29 33 37 37 78 86 81 54 41 34 15Finland 81 93 101 73 75 37 136 134 52 41 17France 41 49 70 43 50 74 82 64 40 33 15Germany 52 83 99 63 68 89 83 62 46 38 16Iceland na na na na 229 252 346 289 173 144 153Ireland 20 41 49 43 84 117 132 83 67 62 34Italy 5 30 48 32 37 61 60 46 32 27 11Netherlands 43 78 104 80 89 107 80 53 48 42 21Norway 188 193 196 201 219 240 259 235 191 165 98Portugal -6 4 7 9 24 15 41 37 28 26 15Spain 13 14 12 -2 -4 -1 53 44 31 26 14Sweden 87 113 120 77 85 79 90 88 48 41 18Switzerland 253 251 249 244 243 229 349 285 201 165 83UK 65 60 43 32 68 83 95 70 47 40 20Total Western Europe, wted av 44 57 68 46 56 74 82 64 44 37 17 EU countriesc 40 54 64 43 53 71 77 59 40 34 15 Other Western Europec 228 230 230 230 233 233 313 266 197 164 90a Weighted averages, with weights based on the unassisted value of production. Dispersion is the standard deviation shown is the simple 5-year average of the annual standard deviation around the weighted mean. The other Western European countries in our study comprise the original 7 EFTA members (Austria, Denmark, Norway, Portugal, Sweden, Switzerland and the UK) plus Finland, Iceland, Ireland and Spain to 1970, then without Denmark, Ireland and the UK from 1973 when they joined the EEC6, then without Portugal and Spain from 1986 when they joined the EC, then without Austria, Finland and Sweden from 1995 when they joined the EU. For 2005-07, the ‘EU members’ and ‘Total Western Europe’ aggregates also include the most recent 12 that joined the EU in May 2004 and January 2007. Source: Anderson and Valenzuela (2008) based on author’s spreadsheet.

6
Table 5: Gross subsidy equivalents of assistance to farmers, total, per farm worker and by product, Western European countries,a 1956 to 2007
(a) Total (constant 2000 US$ million)
1956-59 1960-64 1965-69 1970-74 1975-79 1980-84 1985-89 1990-94 1995-99 2000-04 2005-07 Austria 422 566 651 192 462 440 8184 3108 1715 1338 541
Denmark 1439 1667 1983 2403 5719 5660 4133 3804 2565 1920 888 Finland 1219 1416 1820 1733 2185 932 3644 3685 1000 730 287 France 9866 14437 22418 17393 26423 31314 26608 25399 15707 11012 5225
Germany 8735 18158 25895 21893 32312 33297 24905 21113 13869 10125 3975 Iceland na na na na 314 246 245 177 113 96 123 Ireland 254 572 710 1235 3744 4026 3553 3421 2646 2035 837
Italy 651 6596 11772 8903 13826 17067 13585 13061 8728 6257 2646 Netherlands 1812 3778 5634 6153 9735 10432 7083 6695 5228 3593 1483
Norway 1432 1497 1710 1924 2898 2876 3061 3437 2566 1836 1208 Portugal -58 70 170 295 858 416 1218 1579 1194 924 509
Spain 841 911 919 -816 -741 -604 8792 9431 6446 5440 3372 Sweden 2573 3323 3832 3050 4229 3363 3180 3096 1499 1047 413
Switzerland 3148 3486 3981 5130 5599 5817 6491 6541 4438 3014 1945 UK 8937 9177 7181 6915 16530 17597 14013 12752 8138 5498 2411
Total, Western Europe 41271 65653 88676 76403 124095 132880 128695 117300 75850 54866 31173 EU membersa 21065 42969 65718 54342 108415 119393 103890 97256 68734 49920 27618 Other Western Europea 20206 22685 22957 22061 15680 13487 24805 20044 7116 4946 3555

7
Table 5 (continued): Gross subsidy equivalents of assistance to farmers, total, per farm worker and by product, Western European countries,a 1956 to 2007
(b) Per person engaged in agriculture (constant 2000 US$) 1961-64 1965-69 1970-74 1975-79 1980-84 1985-89 1990-94 1995-99 2000-04 2005-07
Austria 805 1161 409 1257 1361 28429 12023 7947 7661 3468 Denmark 5240 6627 10339 26813 30680 24401 25217 20676 18950 9865 Finland 2820 3853 4267 6547 3340 15411 18224 6160 5659 2540 France 4285 6571 6223 11736 16887 17304 20111 15437 13678 7412 Germany 4303 6894 7235 11707 13875 13252 14324 11891 11069 4938 Iceland na na na 24186 19696 17016 11597 8195 7529 10223 Ireland 1752 2169 5026 14801 17647 17261 18759 15662 12680 5363 Italy 1445 2514 2350 4373 6288 5825 6731 5632 5176 2524 Netherlands 10230 15336 18827 30384 33320 22665 22195 19561 15434 6928 Norway 5992 7945 10489 17122 18461 21634 26848 22641 18274 12988 Portugal 39 143 276 765 357 839 1925 1668 1492 891 Spain 182 230 -255 -259 -218 2973 5303 4364 4418 3024 Sweden 8365 10773 10105 15409 13520 14501 15848 8999 7422 3200 Switzerland 13128 16193 23432 27951 30661 33093 34182 25954 19938 13796 UK 10358 8954 10507 23461 25825 22013 21525 14852 10863 4971 Total, Western Europe 2957 4258 4433 8164 10089 11392 12425 9612 8369 2471 EU membersa 3323 5348 5501 11090 14295 10193 11504 9051 7935 2256 Other Western Europea 2395 2689 2999 2908 2799 22448 20325 23927 18664 13316

8
Table 5 (continued): Gross subsidy equivalents of assistance to farmers, total, per farm worker and by product, Western European countries,a 1956 to 2007
(c) by product (constant 2000 $US millions)
1956-59 1960-64 1965-69 1970-74 1975-79 1980-84 1985-89 1990-94 1995-99 2000-04 2005-07
Barley 1649 2866 3627 2072 5456 1707 6532 6361 1621 120 50 Beef 2529 7192 7950 7914 6252 13145 19075 16169 12144 9877 6177 Egg -604 -817 -534 -893 1808 1436 1673 1037 571 130 123 Maize 57 557 1323 1396 2715 2204 3589 3297 1394 1036 1020 Milk 20793 23917 28101 31074 45150 41790 37896 32811 22919 15418 2822 Oat 405 1229 1611 1081 2027 229 812 849 335 144 70 Oilseed 83 23 27 29 84 66 2833 1899 44 32 41 Pigmeat 3936 8899 14823 14400 15941 15699 7011 4732 5175 5401 4051 Potato 2653 2804 2841 2518 5846 2802 1127 1221 912 465 735 Poultry 1863 1973 1987 3229 3717 4060 4337 5687 4492 3424 4042 Rice -246 -267 -62 -578 -126 -104 529 598 220 84 12 Sheepmeat 1194 1562 1997 3195 5274 4064 3163 2581 1432 1087 1458 Soybean 0 0 na -2 2 1 571 337 0 0 0 Sugar 2354 2433 4151 -518 4772 4087 5091 4807 4229 3232 1351 Tomato 44 387 710 1046 1539 1345 887 356 44 75 0 Wheat 1706 4943 6559 -1229 304 6465 9849 9114 2039 546 126 Wine -1630 -998 568 681 664 847 399 1707 721 240 267 Wool na na na na 26 2 18 16 11 8 9 Total, Western Europe 36784 56703 75678 65415 101451 99844 105391 93581 58303 41319 21916 EU membersa 19158 36948 55749 47291 88543 88805 84016 77079 53218 37773 19033 Other Western Europea 17626 19755 19929 18124 12908 11038 21375 16502 5086 3546 2883 Source: Anderson and Valenzuela (2008) based on author’s spreadsheet. aThe EU is the original six countries to 1972, then 9 to 1985, then 12 to 1994, then 15 to 2004, then 27 thereafter. The EFTA countries are the original 7 to 1970, then 8 with Iceland to 1972, then 6 from 1973 (when the UK and Denmark joined the EEC) to 1985, then 5 from 1986 (when Portugal joined the EC) to 1994, then 3 after Austria, Finland and Sweden joined the EU in 1995. For 2005-07, the ‘EU members’ and ‘Total Western Europe’ aggregates also include the most recent 12 that joined the EU in May 2004 and January 2007.

9
Table 6: Consumer tax equivalents of policies assisting farmers, covered products, total and per capita and by product, Western European countries,a 1956 to 2007
(a) Aggregate CTE by country (percent)
1956-59 1960-64 1965-69 1970-74 1975-79 1980-84 1985-89 1990-94 1995-99 2000-04 2005-07 Austria 74 88 77 22 24 22 63 88 39 35 17 Denmark 42 44 39 41 95 79 70 48 38 32 12 Finland 113 123 132 91 93 45 202 201 46 40 17 France 49 52 75 50 54 76 61 45 34 30 15 Germany 65 95 107 67 67 82 59 41 35 30 13 Iceland na na na na 42 72 272 210 117 95 104 Ireland 25 38 45 43 125 126 115 73 56 46 20 Italy 5 33 52 35 37 58 46 35 29 26 10 Netherlands 52 89 118 82 96 111 83 56 47 38 18 Norway 272 282 285 276 230 70 93 116 114 111 85 Portugal -1 11 18 11 34 21 37 33 25 24 16 Spain 19 20 19 -4 0 5 36 30 24 21 13 Sweden 104 106 134 76 108 90 124 109 46 44 23 Switzerland 275 271 261 253 223 97 245 215 143 144 83 UK 69 65 46 34 71 89 77 54 44 40 22 Total, Western Europe 53 65 74 49 59 70 65 49 37 33 17 EU membersa 42 62 80 54 60 78 59 42 34 30 15 Other Western Europea 72 70 62 39 51 37 119 141 133 131 84

10
Table 6 (continued): Consumer tax equivalents of policies assisting farmers, covered products, total and per capita and by product, Western European countries,a 1956 to 2007
(b) Total CTE per capita (constant 2000 US$) 1960-64 1965-69 1970-74 1975-79 1980-84 1985-89 1990-94 1995-99 2000-04 2005-07
Austria 95 95 26 54 44 1026 354 145 108 46 Denmark 220 211 276 624 498 343 299 221 165 55 Finland 291 353 327 413 181 699 665 717 525 207 France 246 353 283 380 367 259 229 159 115 55 Germany 235 311 261 362 330 211 157 110 82 33 Iceland na na na 1070 969 937 465 310 277 379 Ireland 94 114 252 792 696 495 435 299 221 65 Italy 125 218 165 226 243 178 162 117 87 33 Netherlands 228 322 290 439 408 271 245 188 129 48 Norway 319 367 446 593 333 374 447 326 241 226 Portugal 19 41 29 121 58 107 134 105 84 48 Spain 32 34 -29 0 6 146 150 108 89 56 Sweden 256 346 254 457 311 303 284 138 119 52 Switzerland 708 704 843 790 627 820 792 486 354 266 UK 185 135 136 302 272 188 157 111 86 41 Total, Western Europe 162 205 198 306 276 226 207 138 103 46 EU membersa 161 232 240 339 319 209 178 128 96 41 Other Western Europea 165 156 119 193 128 293 488 422 310 254 Source: Anderson and Valenzuela (2008) based on author’s spreadsheet. aThe EU is the original six countries to 1972, then 9 to 1985, then 12 to 1994, then 15 to 2004, then 27 thereafter. The EFTA countries are the original 7 to 1970, then 8 with Iceland to 1972, then 6 from 1973 (when the UK and Denmark joined the EEC) to 1985, then 5 from 1986 (when Portugal joined the EC) to 1994, then 3 after Austria, Finland and Sweden joined the EU in 1995. For 2005-07, the ‘EU members’ and ‘Total Western Europe’ aggregates also include the most recent 12 that joined the EU in May 2004 and January 2007.

11
Appendix:
Annual estimates of rates of assistance, Western European countries, 1956 to 2007
Compiled with the assistance of Uli Kleinwechter and Teresa Rojas Lara of Humboldt University and, at the University of Adelaide, Kym Anderson,
Johanna Croser, Esteban Jara, Signe Nelgen and Ernesto Valenzuela

12
Appendix Figure 1: Agriculture's shares of national GDP and employment, Western European countries, 2003-05
(percent)
0 5 10 15
United KingdomLuxembourg
BelgiumGermanySweden
NetherlandsDenmark
SwitzerlandFrance
NorwayItaly
AustriaSpain
FinlandIrelandIceland
PortugalGreece
Agriculture as share of GVA Agriculture as share of Labor Force
Source: World Bank (2007)

13
Appendix Figure 2: Increase in farm and non-farm output per person, Western European countries, 1949 to 1959
020406080
100120140160180
1949=100
Denmark
German
yIta
ly
France
Austria
Belgium UK
Netherla
nds
Norway
Ireland
agriculture all sectors
Source: Ingersent and Rayner (1999)

14
Appendix Figure 3: Agricultural productivity growth and farm employment decline, Western European countries, 1955 to 1970 (a) Agricultural productivity growth (1952-56 = 100)
02040
6080
100120
140160
180
Bel/Lux France Germany Italy Netherlands UK
1952
-56=
100 1955
196019651970
(b) Farm employment (1955 = 100)
Labor Force in Agriculture
020406080
100120
Bel/Lu
x
France
German
yIta
ly
Netherl
ands UK
1955
=100
1955196019651970
Source: OECD (2005)

15
Appendix Figure 4: Producer prices of wheat and beef , EU-9 members, 1956 to 1972 (ECU per ton)
(a) Wheat
0
20
40
60
80
100
120
1956
1958
1960
1962
1964
1966
1968
1970
1972
ECU
per
ton UK
DenmarkIrelandEEC
(b) Beef
0
200
400
600
800
1000
1200
1400
1600
1956
1958
1960
1962
1964
1966
1968
1970
1972
ECU
per
ton
UKDenmarkEEC
Source: EUROSTAT (2006)

16
Appendix Figure 5: Producer prices of wheat, Portugal, Spain and EU-9, 1956 to 1985 (ECU per ton)
0
50
100
150
200
250
300
350
1956
1958
1960
1962
1964
1966
1968
1970
1972
1974
1976
1978
1980
1982
1984
ECU
per
ton
SpainPortugalEEC
Source: EUROSTAT (2006)

17
Appendix Figure 6: Producer prices of wheat, Austria, Finland, Sweden and EU-12, 1956 to 1993
(ECU per ton)
0
100
200
300
400
500
600
1956
1958
1960
1962
1964
1966
1968
1970
1972
1974
1976
1978
1980
1982
1984
1986
1988
1990
1992
ECU
per
ton Austria
FinlandSwedenEU
Source: EUROSTAT (2006)
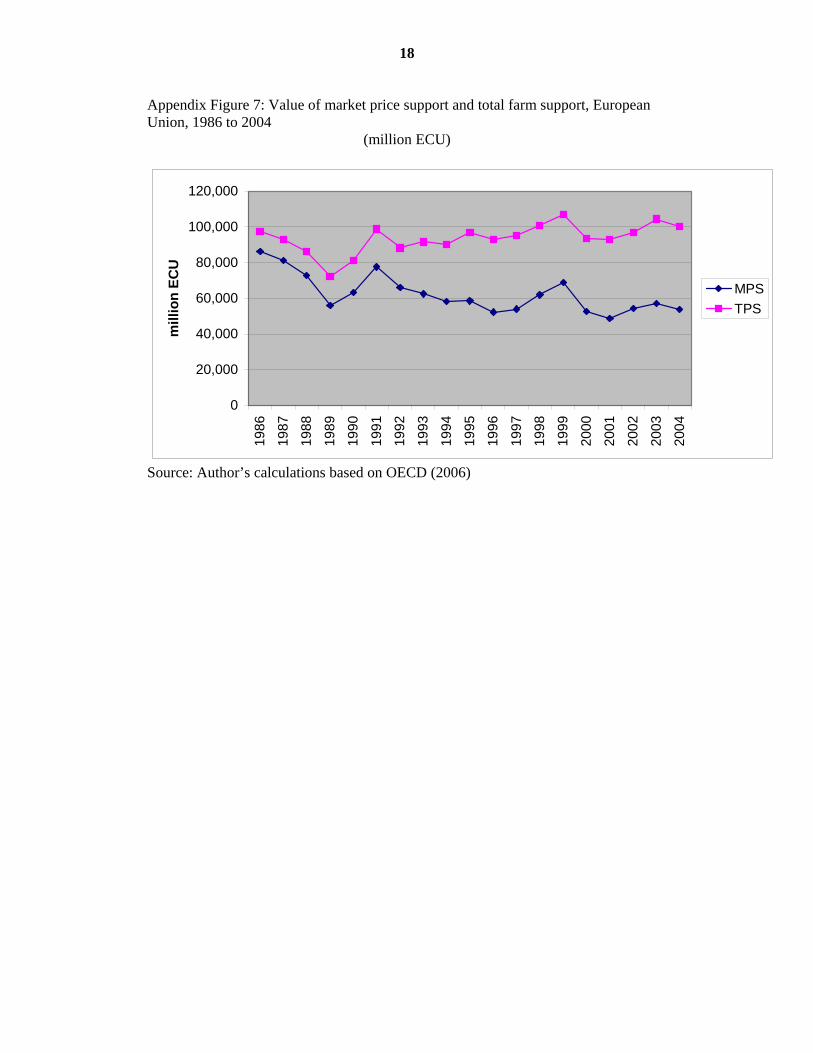
18
Appendix Figure 7: Value of market price support and total farm support, European Union, 1986 to 2004
(million ECU)
0
20,000
40,000
60,000
80,000
100,000
120,000
1986
1987
1988
1989
1990
1991
1992
1993
1994
1995
1996
1997
1998
1999
2000
2001
2002
2003
2004
mill
ion
ECU
MPSTPS
Source: Author’s calculations based on OECD (2006)

19
Appendix Figure 8: Share of market price support in total farm support, European Union, 1986 to 2004
(percent)
0.010.020.030.040.050.060.070.080.090.0
100.0
1986
1988
1990
1992
1994
1996
1998
2000
2002
2004
EUNorwaySwitzerland
Source: Author’s calculations based on OECD (2006)

20
Appendix Table 1: Annual distortion estimates, Austria, 1956 to 2007 (a) Nominal rates of assistance to covered products
(percent)
Barl
ey Bee
f Egg Mai
ze Mil
k Oat
Pigmea
t Pota
to Poultry
Rapesee
d
Sheepm
eat Sug
ar
Sunflo
wer Wheat
Wine
All cov
ered 1956 48 na na 110 na 47 na 0 na 53 na 179 53 44 0 31 1957 81 na na 170 na 65 na 0 na 55 na 98 55 59 0 33 1958 97 na na 211 na 68 na 0 na 55 na 177 55 59 0 39 1959 88 na na 184 na 81 na 0 na 47 na 220 47 58 0 44 1960 87 na na 179 na 66 na 0 na 45 na 220 45 62 0 47 1961 122 na na 256 na 108 na 0 na 41 na 248 41 64 0 55 1962 101 na na 116 na 97 na 0 na 40 na 240 40 109 0 57 1963 99 na na 95 na 94 na 0 na 38 na 24 38 102 0 44 1964 98 na na 106 na 119 na 0 na 37 na 92 37 103 0 51 1965 98 na na 113 na 121 na 0 na 34 na 432 49 120 0 68 1966 82 na na 92 na 98 na 0 na 32 na 471 47 87 0 60 1967 91 na na 93 na 94 na 0 na 33 na 325 48 77 0 52 1968 104 na na 96 na 87 na 0 na 34 na 200 50 73 0 48 1969 66 na na 87 na 80 na 0 na 32 na 162 47 74 0 47 1970 70 na na 66 na 83 na 0 na 31 na 97 46 37 0 35 1971 93 na na 68 na 61 na 0 na 29 na 58 43 59 0 43 1972 42 na na 103 na 54 na 0 na 27 na 40 39 9 0 26 1973 6 na na 27 na 14 na 0 na 19 na -14 28 -28 0 -3 1974 4 na na -2 na 12 na 0 na 15 na -52 23 -23 0 -13 1975 25 na na 17 na 33 na 0 na 18 na 12 24 -9 0 8 1976 17 na na 25 na 9 na 0 na 19 na 81 25 -19 0 6 1977 67 na na 66 na 38 na 0 na 16 na 205 27 -22 0 26 1978 66 na na 79 na 89 na 0 na 19 na 212 30 21 0 42 1979 83 na na 62 na 99 na 0 na 19 na 50 28 41 0 41 1980 21 na na 54 na -23 na 0 na 19 na -10 31 49 0 19 1981 7 na na 30 na 0 na 0 na 16 na 47 23 44 0 20 1982 8 na na 56 na 30 na 0 na 16 na 124 22 60 0 32 1983 36 na na 25 na 8 na 0 na 16 na 182 21 44 0 31 1984 10 na na 7 na 5 na 0 na 10 na 230 14 48 0 22 1985 31 na na 25 na 15 na 0 na 12 na 251 16 72 0 40 1986 203 70 12 32 128 134 23 0 5 23 0 332 24 70 0 62 1987 323 51 3 75 91 109 41 0 -1 34 0 302 28 136 0 66 1988 137 78 58 41 78 40 28 0 58 25 10 275 21 115 0 64 1989 82 85 76 24 71 49 8 0 97 47 23 206 47 29 0 47 1990 153 94 56 67 129 108 19 0 79 94 19 143 62 109 0 70 1991 179 93 61 61 129 96 33 0 67 85 15 191 49 201 0 79 1992 166 105 68 113 144 104 27 0 77 82 14 219 58 171 0 85 1993 206 113 79 33 151 96 75 0 65 50 14 208 32 114 0 96 1994 176 124 104 103 157 101 53 0 71 78 16 194 50 170 0 98 1995 41 69 12 53 79 40 16 15 129 0 77 119 0 16 4 43 1996 2 68 5 14 70 34 16 14 77 0 45 140 0 0 4 35 1997 7 117 1 19 78 25 13 12 55 0 27 147 0 0 5 38 1998 64 121 11 32 100 50 22 11 51 0 38 186 0 26 3 53 1999 44 125 16 39 106 84 57 11 90 0 37 245 0 37 2 66 2000 3 113 3 27 57 59 32 10 57 1 26 176 0 11 2 43 2001 0 140 0 14 40 29 24 10 52 0 48 138 0 4 2 34 2002 0 157 0 9 75 0 24 10 56 0 35 161 0 0 2 44 2003 1 157 0 34 70 1 33 10 54 0 46 240 0 2 2 48 2004 1 92 0 39 62 23 27 10 101 0 33 238 0 2 1 40 2005 0 109 0 19 33 24 19 10 69 0 54 168 0 0 2 24 2006 0 81 0 19 25 0 14 10 69 0 74 66 0 0 1 20 2007 0 71 0 23 0 0 18 10 100 0 68 99 0 0 1 15

21
Appendix Table 1 (continued): Annual distortion estimates, Austria, 1956 to 2007 (b) Nominal and relative rates of assistance to alla agricultural products, to exportableb and import-competing b agricultural industries, and relativec to non-agricultural industries (percent)
NRA, all agric products,a by component NRA, agric tradables
NRA, covere
d produc
ts (1)
NRA, non-
covered
products
(2)
NRA, non-
product-specific support
(3)
NRA, all ag
products (incl NPS)
(4)=1+2+3
NRA, all ag products (incl NPS
and decoupled)
(5)
NRA, ag export- ables (6)
NRA, ag import- competi
ng (7)
NRA, all agric
tradable goods c (8)=6+7
NRA, all non-ag tradable goods
(9) RRAb
(10) 1956 31 4 na 21 21 0 26 21 3 171957 33 5 na 23 23 0 30 23 3 201958 39 5 na 26 26 0 34 26 3 221959 44 6 na 29 29 0 40 29 4 241960 47 6 na 31 31 0 40 31 4 261961 55 6 na 35 35 0 47 35 4 291962 57 7 na 37 37 0 49 37 4 321963 44 6 na 29 29 0 39 29 4 241964 51 7 na 33 33 0 49 33 4 281965 68 8 na 42 42 0 60 42 4 371966 60 8 na 39 39 0 54 39 4 341967 52 8 na 35 35 0 50 35 4 301968 48 7 na 32 32 0 47 32 4 271969 47 7 na 31 31 0 45 31 3 271970 35 5 na 24 24 0 35 24 3 201971 43 6 na 29 29 0 40 29 3 251972 26 4 na 18 18 0 25 18 3 151973 -3 0 na -2 -2 0 -3 -2 3 -41974 -13 -2 na -10 -10 0 -12 -10 2 -111975 8 1 na 6 6 0 8 6 2 41976 6 1 na 4 4 0 6 4 1 31977 26 4 na 18 18 0 24 18 1 171978 42 7 na 28 28 0 40 28 1 271979 41 6 na 27 27 0 38 27 1 261980 19 3 na 13 13 0 17 13 1 121981 20 3 na 13 13 0 18 13 1 131982 32 5 na 23 23 0 32 23 1 221983 31 5 na 22 22 0 30 22 1 211984 22 4 na 16 16 0 21 16 1 151985 40 5 na 27 27 0 35 27 1 261986 62 14 1 55 55 56 50 55 1 551987 66 17 1 59 59 69 42 59 1 581988 64 11 1 64 64 61 78 64 1 631989 47 6 1 40 40 39 39 40 1 391990 70 9 2 57 57 56 56 57 1 571991 79 11 2 67 67 68 52 67 1 661992 85 9 4 71 71 46 92 71 1 701993 96 10 3 81 81 67 94 81 1 801994 98 0 4 80 80 76 124 80 1 791995 43 0 5 38 55 4 46 38 1 371996 35 16 4 34 50 10 38 34 1 331997 38 21 4 39 55 13 42 39 1 381998 53 30 4 52 68 21 57 52 1 511999 66 37 4 63 81 24 72 63 1 622000 43 23 3 42 59 11 50 42 1 412001 34 18 4 34 51 8 39 34 1 332002 44 23 5 44 61 10 51 44 1 432003 48 25 5 47 67 10 56 47 1 462004 40 21 4 40 58 7 49 40 1 392005 24 11 4 22 41 1 34 22 1 212006 20 10 4 19 40 1 28 19 1 182007 15 7 4 16 34 0 22 16 1 15

22
a. NRAs including assistance to nontradables and via inputs and other forms of non-product-specific (NPS) assistance without and (in column (5)) with decoupled support. b. The Relative Rate of Assistance (RRA) is defined as 100*[(100+NRAagt)/ (100+NRAnonagt)-1], where NRAagt and NRAnonagt are the percentage NRAs for the tradables parts of the agricultural and non-agricultural sectors (columns 8 and 9), respectively, so it excludes decoupled payments but includes all NPS support. c. Including NPS but excluding decoupled payments, so more than the weighted average of columns (6) and (7).

23
Appendix Table 1 (continued): Annual distortion estimates, Austria, 1956 to 2007 (c) Value shares of primary production of covereda and non-covered products (percent)
Barl
ey Bee
f Egg Mai
ze Mil
k Oat
Pigmea
t Pota
to Poul
try
Rapesee
d
Sheepm
eat Sug
ar
Sunflow
er Wheat
Wine
Non-
covered
1956 8 na na 2 na 8 na 29 na 0 na 2 0 12 1 38 1957 6 na na 2 na 6 na 31 na 0 na 4 0 10 5 36 1958 6 na na 1 na 6 na 30 na 0 na 3 0 11 5 38 1959 5 na na 2 na 6 na 25 na 0 na 3 0 11 8 40 1960 8 na na 2 na 6 na 27 na 0 na 3 0 12 3 39 1961 7 na na 2 na 5 na 24 na 0 na 2 0 14 5 41 1962 8 na na 3 na 5 na 26 na 0 na 2 0 11 4 40 1963 8 na na 3 na 5 na 21 na 0 na 8 0 9 7 39 1964 8 na na 3 na 4 na 18 na 0 na 5 0 10 12 40 1965 9 na na 5 na 4 na 19 na 1 na 2 0 11 8 43 1966 10 na na 4 na 4 na 19 na 1 na 2 0 13 7 41 1967 9 na na 4 na 4 na 17 na 1 na 2 0 14 12 39 1968 8 na na 4 na 4 na 18 na 0 na 2 0 13 12 39 1969 11 na na 8 na 3 na 15 na 0 na 3 0 11 11 38 1970 10 na na 7 na 3 na 14 na 0 na 3 0 12 14 37 1971 10 na na 8 na 3 na 15 na 0 na 4 0 12 9 38 1972 12 na na 6 na 3 na 12 na 0 na 5 0 14 11 36 1973 12 na na 10 na 3 na 10 na 0 na 7 0 16 7 34 1974 13 na na 10 na 3 na 9 na 0 na 12 0 16 5 32 1975 10 na na 11 na 3 na 9 na 0 na 8 0 14 8 37 1976 13 na na 9 na 3 na 8 na 0 na 4 0 20 8 34 1977 10 na na 10 na 3 na 8 na 0 na 3 0 20 8 38 1978 12 na na 10 na 2 na 9 na 0 na 2 0 14 10 40 1979 9 na na 13 na 2 na 11 na 0 na 5 0 10 9 41 1980 15 na na 10 na 5 na 7 na 0 na 8 0 10 8 37 1981 15 na na 14 na 4 na 7 na 0 na 6 0 10 6 38 1982 16 na na 13 na 3 na 5 na 0 na 4 0 10 12 36 1983 14 na na 16 na 4 na 6 na 0 na 3 0 14 9 34 1984 16 na na 17 na 3 na 7 na 0 na 2 0 14 6 34 1985 14 na na 18 na 3 na 6 na 0 na 2 0 13 4 38 1986 3 16 4 9 16 1 20 3 4 0 0 1 0 7 3 15 1987 2 17 4 7 19 1 19 2 4 0 0 1 0 5 3 16 1988 0 18 3 11 25 0 25 0 3 0 1 1 0 8 1 2 1989 4 12 2 7 17 1 20 2 2 1 0 1 0 7 4 19 1990 4 12 2 6 13 1 19 3 2 1 0 1 0 5 7 24 1991 3 14 3 6 15 1 20 3 3 1 1 1 0 3 6 21 1992 3 12 2 3 15 1 22 2 3 1 1 1 0 4 5 24 1993 2 14 3 8 17 1 17 2 4 1 1 2 1 4 3 21 1994 3 12 2 3 17 1 19 3 3 2 1 1 1 4 6 22 1995 3 10 2 5 17 0 20 4 1 2 0 2 0 5 6 22 1996 4 9 3 6 16 0 22 2 2 1 0 2 0 5 5 22 1997 4 7 3 5 16 1 25 2 2 1 1 2 0 5 5 23 1998 3 8 2 5 17 0 20 3 2 1 1 2 1 4 8 23 1999 3 8 2 5 18 0 16 4 2 1 1 2 1 4 9 23 2000 3 8 2 5 21 0 19 2 2 1 1 1 0 4 8 22 2001 3 6 2 5 21 0 22 2 2 1 1 2 0 5 6 22 2002 3 6 3 6 18 0 21 2 2 1 1 2 1 5 6 23 2003 3 6 3 5 19 0 20 2 2 1 1 1 1 5 7 24 2004 3 7 2 4 19 0 19 3 2 1 1 1 1 6 7 23 2005 4 6 4 6 7 0 21 3 2 1 1 1 1 7 12 24 2006 4 8 3 6 8 1 20 4 1 1 1 2 1 7 10 24 2007 5 7 2 7 15 1 15 3 1 1 1 1 1 9 9 24
Source: Anderson and Valenzuela (2008), based on author’s spreadsheet a. At undistorted prices

24
Appendix Table 1 (continued): Annual distortion estimates, Austria, 1956 to 2007 (d) Trade status of of covered productsa Barley Beef Egg Maize Milk Oat Pigmeat Potato Poultry Rapeseed
1956 M na na M na M na M na M1957 M na na M na M na M na M1958 M na na M na M na M na M1959 M na na M na M na M na M1960 M na na M na M na M na M1961 M na na M na M na M na M1962 M na na M na M na M na M1963 M na na M na M na M na M1964 M na na M na M na M na M1965 M na na M na M na M na M1966 M na na M na M na M na M1967 M na na M na M na M na M1968 M na na M na M na M na M1969 M na na M na M na M na M1970 M na na M na M na M na M1971 M na na M na M na M na M1972 M na na M na M na M na M1973 M na na M na M na M na M1974 M na na M na M na M na M1975 M na na M na M na M na M1976 M na na M na M na M na M1977 M na na M na M na M na M1978 M na na M na M na M na M1979 M na na M na M na M na M1980 M na na M na M na M na M1981 M na na M na M na M na M1982 M na na M na M na M na M1983 M na na M na M na M na M1984 M na na M na M na M na M1985 M na na M na M na M na M1986 M X M X X M X M M M1987 M X M X X M M M M M1988 M X M X X M X M M M1989 M X M X X M X M M M1990 M X M X X M X M M M1991 M X M X X M X M M M1992 M X M M M M X M M M1993 M X M X M M X M M M1994 M X M M M M X M M M1995 M M M M M M M M M M1996 X M M M M M M M M X1997 X M M M M M M M M X1998 M M M M M M M M M X1999 M M M M M M M M M X2000 X M X M M M M M M X2001 X M X M M M M M M M2002 X M X M M M M M M X2003 X M X M M M M M M X2004 X M X M M M M M M X2005 X M M M M M M M M X2006 X M M M M M M M M X2007 X M M M M M M M M X

25
Sheepmeat Sugar
Sunflower
Wheat Wine Wool
1956 na M X M X na1957 na M X M X na1958 na M X M X na1959 na M X M X na1960 na M X M X na1961 na M X M X na1962 na M X M X na1963 na M X M X na1964 na M X M X na1965 na M X M X na1966 na M X M X na1967 na M X M X na1968 na M X M X na1969 na M X M X na1970 na M X M X na1971 na M X M X na1972 na M X M X na1973 na M X M X na1974 na M X M X na1975 na M X M X na1976 na M X M X na1977 na M X M X na1978 na M X M X na1979 na M X M X na1980 na M X M X na1981 na M X M X na1982 na M X M X na1983 na M X M X na1984 na M X M X na1985 na M X M X na1986 M M X X X M1987 M X X X X M1988 M M X X X M1989 M X X X X M1990 M M X X X M1991 M X X X X M1992 M M X X X M1993 M X X X X M1994 M M X X X M1995 M M M M X na1996 M M M X X na1997 M M M X X na1998 M M M X X na1999 M M M X X na2000 M M M X X na2001 M M M X X na2002 M M M X X na2003 M M M X X na2004 M M M X X na2005 M M M X X na2006 M M M X X na2007 M M M X X na
a. Exportables (X), import-competing products (M) and nontradables (H). Source: Anderson and Valenzuela (2008), based on author’s spreadsheet

26
Appendix Table 2: Annual distortion estimates, Denmark, 1956 to 2007 (a) Nominal rates of assistance to covered products
(percent)
Barle
y Beef Egg Milk Oat Pigm
eat Potat
o Poult
ry Rapeseed
Sheepmea
t Suga
r Tom
ato Whe
at
All cove
red 1956 -4 -3 -8 157 -12 39 -24 8 5 na 135 na -3 30 1957 7 -9 -4 174 -13 23 -6 6 5 na 43 na 1 29 1958 38 -13 8 96 6 22 52 11 5 na 102 na 3 34 1959 26 -9 -19 199 -32 22 88 -4 5 na 138 na 0 42 1960 9 2 -15 127 -12 15 -32 -5 5 na 120 na -1 22 1961 49 -9 -15 202 17 22 47 -13 4 na 150 na -1 41 1962 -1 1 -9 240 -8 68 124 -29 4 na 184 na 25 52 1963 5 -6 -6 210 -3 57 40 -17 4 na -3 na 19 42 1964 -1 -27 5 146 4 53 30 -26 4 na 42 na 13 34 1965 -2 -39 6 173 3 73 86 -25 3 na 301 na 14 40 1966 1 -39 -1 162 4 90 49 -23 3 na 388 na 6 43 1967 5 -38 1 175 2 88 67 -43 3 na 249 na 6 44 1968 19 -35 7 177 3 84 43 -39 3 na 177 na 12 46 1969 17 -32 -9 163 19 88 167 -36 3 na 161 na 7 45 1970 6 -30 -6 257 9 28 94 -21 3 na 99 na 6 37 1971 26 -32 -10 263 0 37 20 15 3 na 50 na 29 46 1972 12 -14 -8 232 -3 27 43 -15 3 na 37 na 0 37 1973 -7 34 -17 208 0 106 57 74 0 322 -30 22 -30 49 1974 3 -4 30 210 7 69 18 54 0 255 -51 22 -23 33 1975 23 11 16 264 23 65 49 60 0 267 28 22 -9 58 1976 20 26 5 366 10 122 327 69 0 342 99 22 -16 85 1977 56 11 41 598 35 65 71 61 0 281 230 22 -21 83 1978 49 11 13 488 74 78 -15 49 0 263 230 22 23 84 1979 75 0 41 440 80 109 17 38 0 230 70 22 35 91 1980 17 -1 22 434 -27 71 7 37 0 207 13 22 45 58 1981 7 23 2 330 -2 148 73 72 0 183 74 11 44 80 1982 8 49 18 313 22 125 95 99 0 181 152 31 51 81 1983 32 264 40 287 -1 129 87 73 0 203 196 19 28 116 1984 6 265 3 311 8 81 -24 95 0 172 268 26 20 74 1985 18 293 8 282 -6 22 11 91 0 95 297 26 31 65 1986 157 188 31 361 83 40 17 79 153 134 247 17 119 120 1987 233 107 21 533 77 11 17 90 145 211 301 15 143 106 1988 85 80 21 192 14 34 17 69 112 215 201 15 94 82 1989 45 79 29 84 15 14 17 66 140 167 90 0 31 45 1990 94 98 12 125 48 7 16 100 200 154 109 2 57 58 1991 119 157 13 128 39 20 16 83 97 128 191 0 146 73 1992 103 93 15 118 63 0 17 118 0 112 212 0 65 42 1993 105 63 10 123 44 18 17 110 0 38 169 8 58 54 1994 100 53 0 117 43 18 16 114 0 55 129 11 48 49 1995 41 69 12 79 40 16 15 129 0 77 119 0 16 37 1996 2 68 5 70 34 16 14 77 0 45 140 2 0 27 1997 7 117 1 78 25 13 12 55 0 27 147 0 0 29 1998 64 121 11 100 50 22 11 51 0 38 186 0 26 48 1999 44 125 16 106 84 57 11 90 0 37 245 0 37 66 2000 3 113 3 57 59 32 10 57 1 26 176 0 11 37 2001 0 140 0 40 29 24 10 52 0 48 138 0 4 28 2002 0 157 0 75 0 24 10 56 0 35 161 0 0 35 2003 1 157 0 70 1 33 10 54 0 46 240 2 2 37 2004 1 92 0 62 23 27 10 101 0 33 238 2 2 33 2005 0 109 0 33 24 19 10 69 0 54 168 0 0 18 2006 0 86 0 24 0 15 10 69 0 74 62 0 0 14 2007 0 66 0 0 0 17 10 100 0 68 99 0 0 11

27
Appendix Table 2 (continued): Annual distortion estimates, Denmark, 1956 to 2007 (b) Nominal and relative rates of assistance to alla agricultural products, to exportableb and import-competing b agricultural industries, and relativec to non-agricultural industries (percent)
NRA, all agric products,a by component NRA, agric tradables
NRA, covere
d produc
ts (1)
NRA, non-
covered
products
(2)
NRA, non-
product-specific support
(3)
NRA, all ag
products (incl NPS)
(4)=1+2+3
NRA, all ag products (incl NPS
and decoupled)
(5)
NRA, ag export- ables (6)
NRA, ag import- competi
ng (7)
NRA, all agric
tradable goods c (8)=6+7
NRA, all non-ag tradable goods
(9) RRAb
(10) 1956 30 10 na 26 26 41 -5 26 1 241957 29 10 na 25 25 36 1 25 1 231958 34 16 na 30 30 34 22 30 2 281959 42 16 na 36 36 46 10 36 2 331960 22 8 na 19 19 25 3 19 2 171961 41 20 na 36 36 40 29 36 2 341962 52 19 na 44 44 67 1 44 2 411963 42 15 na 36 36 51 4 36 2 331964 34 12 na 29 29 43 1 29 2 271965 40 15 na 34 34 54 0 34 1 321966 43 16 na 37 37 57 2 37 1 351967 44 17 na 37 37 56 4 37 1 361968 46 19 na 40 40 55 13 40 1 381969 45 20 na 39 39 56 14 39 1 381970 37 15 na 32 32 48 5 32 1 301971 46 20 na 40 40 53 19 40 1 391972 37 16 na 32 32 50 8 32 1 311973 49 33 na 46 46 10 66 46 1 451974 33 30 na 33 33 17 41 33 1 321975 58 45 na 55 55 40 62 55 1 541976 85 60 na 79 79 93 77 79 1 781977 83 65 na 79 79 73 82 79 1 781978 84 64 na 80 80 67 86 80 0 791979 91 68 12 98 99 86 86 98 0 971980 58 57 12 70 72 42 66 70 0 691981 80 58 10 85 86 32 100 85 0 841982 81 58 9 85 88 31 104 85 0 851983 116 63 9 112 115 49 128 112 0 1111984 74 44 8 76 78 24 91 76 0 751985 65 44 10 70 73 37 70 70 0 691986 120 70 3 112 114 97 110 112 0 1111987 106 75 3 102 105 120 96 102 0 1011988 82 47 3 77 80 64 75 77 0 761989 45 22 3 43 46 29 42 43 0 421990 58 29 4 55 58 40 52 55 0 541991 73 38 5 70 74 51 66 70 1 691992 42 27 5 43 51 38 39 43 0 421993 54 31 5 54 66 37 51 54 0 531994 49 28 4 49 63 39 45 49 0 481995 37 19 5 37 54 25 34 37 0 371996 27 14 4 28 44 7 33 28 0 271997 29 16 4 30 46 9 33 30 0 291998 48 25 4 46 63 26 47 46 0 451999 66 33 4 62 79 32 66 62 0 612000 37 18 3 36 54 11 43 36 0 352001 28 14 4 28 45 7 31 28 0 282002 35 18 5 36 53 9 41 36 0 352003 37 19 5 38 57 8 45 38 0 372004 33 16 4 33 51 7 39 33 0 322005 18 9 4 18 37 0 25 18 0 172006 14 7 4 15 37 0 20 15 0 152007 11 6 4 13 31 0 18 13 0 12

28
a. NRAs including assistance to nontradables and via inputs and other forms of non-product-specific (NPS) assistance without and (in column (5)) with decoupled support. b. The Relative Rate of Assistance (RRA) is defined as 100*[(100+NRAagt)/ (100+NRAnonagt)-1], where NRAagt and NRAnonagt are the percentage NRAs for the tradables parts of the agricultural and non-agricultural sectors (columns 8 and 9), respectively, so it excludes decoupled payments but includes all NPS support. c. Including NPS but excluding decoupled payments, so more than the weighted average of columns (6) and (7).

29
Appendix Table 2 (continued): Annual distortion estimates, Denmark, 1956 to 2007 (c) Value shares of primary production of covereda and non-covered products,
(percent)
Barle
y Beef Egg Milk Oat Pigm
eat Potat
o Poult
ry Rapeseed
Sheepmea
t Suga
r Tom
ato Whe
at
Non-cover
ed 1956 15 6 8 11 6 21 6 1 0 na 1 na 2 23 1957 14 7 7 10 5 23 5 1 0 na 3 na 2 23 1958 13 7 6 12 4 25 4 2 0 na 2 na 2 22 1959 12 7 7 11 3 27 4 2 0 na 1 na 2 23 1960 13 7 6 11 4 27 6 2 0 na 1 na 2 22 1961 12 8 7 9 3 28 3 3 0 na 1 na 3 23 1962 17 9 5 8 3 22 3 3 1 na 1 na 3 24 1963 15 10 5 9 3 23 3 3 0 na 3 na 2 24 1964 17 9 3 10 3 24 2 3 1 na 2 na 2 23 1965 19 11 4 9 3 22 2 3 1 na 1 na 3 23 1966 19 12 4 10 4 21 2 3 0 na 1 na 2 24 1967 18 12 4 9 4 21 2 3 1 na 1 na 2 24 1968 19 12 4 9 4 21 2 3 0 na 1 na 2 23 1969 23 12 4 9 3 19 1 3 0 na 1 na 2 23 1970 22 11 4 8 3 20 2 3 0 na 1 na 3 23 1971 21 11 3 9 3 21 2 2 1 na 2 na 3 23 1972 26 8 3 9 3 19 1 2 1 na 2 na 4 23 1973 25 9 3 8 2 19 2 2 1 0 3 0 4 22 1974 25 13 1 8 2 16 2 2 1 0 5 0 4 20 1975 20 14 2 9 1 21 2 2 2 0 3 0 3 21 1976 23 15 2 8 1 18 1 2 1 0 2 0 4 22 1977 20 16 2 5 1 22 2 3 1 0 1 0 4 22 1978 22 16 2 6 1 21 2 3 1 0 1 0 3 22 1979 20 18 2 7 0 19 2 3 1 0 3 0 3 22 1980 23 16 2 6 1 21 2 2 1 0 4 0 2 20 1981 26 13 2 8 1 17 2 2 2 0 2 0 3 22 1982 28 10 2 8 1 16 2 2 3 0 2 0 4 22 1983 19 5 2 11 0 21 2 3 3 0 1 0 7 25 1984 24 4 2 8 1 19 3 2 5 0 1 0 9 23 1985 18 4 2 8 1 29 2 2 5 0 1 0 6 22 1986 10 6 2 9 0 32 3 2 4 0 1 0 6 24 1987 7 9 2 6 0 38 3 2 3 0 1 0 6 23 1988 12 8 1 12 1 27 3 2 3 0 1 0 5 24 1989 10 6 1 15 0 29 3 2 3 0 2 0 8 22 1990 8 5 1 12 0 32 3 2 3 0 2 0 8 23 1991 8 4 1 13 0 33 4 2 3 0 1 0 6 25 1992 4 5 1 12 0 41 3 2 1 0 1 0 7 23 1993 5 7 1 13 0 34 2 2 2 0 1 0 9 23 1994 5 6 2 13 0 34 4 2 2 0 2 0 7 23 1995 7 5 1 14 0 31 5 1 1 0 1 0 10 23 1996 8 4 1 14 0 32 2 2 1 0 1 0 12 22 1997 7 3 1 13 0 35 2 2 1 0 1 0 11 23 1998 5 4 1 15 0 31 4 3 2 0 1 0 10 24 1999 7 4 1 16 0 26 5 2 2 0 1 0 9 26 2000 8 3 1 17 0 30 2 2 1 0 1 0 9 23 2001 7 2 1 16 0 34 3 2 1 0 1 0 8 23 2002 8 3 1 15 1 33 3 3 1 0 1 0 8 24 2003 7 3 2 15 0 30 3 2 2 0 1 0 10 25 2004 6 3 1 16 0 31 4 2 2 0 1 0 10 24 2005 9 2 2 3 0 41 3 2 2 0 0 0 11 24 2006 7 2 1 3 1 40 4 2 2 0 1 0 12 24 2007 10 2 1 10 1 29 4 2 3 0 0 0 14 24 a. At farmgate undistorted prices

30
Appendix Table 2 (continued): Annual distortion estimates, Denmark, 1956 to 2007 (d) Trade status of of covered productsa
Barle
y Beef Egg Milk Oat Pigm
eat Potat
o Poult
ry Rapeseed
Sheepmea
t Sugar Toma
to Whea
t 1956 M X X X M X X X X na X na M1957 M X X X M X X X X na X na M1958 M X X X M X X X X na X na M1959 M X X X M X X X X na X na M1960 M X X X M X X X X na X na M1961 M X X X M X X X X na X na M1962 M X X X M X X X X na X na M1963 M X X X M X X X X na X na M1964 M X X X M X X X X na X na M1965 M X X X M X X X X na X na M1966 M X X X M X X X X na X na M1967 M X X X M X X X X na X na M1968 M X X X M X X X X na X na M1969 M X X X M X X X X na X na M1970 M X X X M X X X X na X na M1971 M X X X M X X X X na X na M1972 M X X X M X X X X na X na M1973 X M M M M M M M M M M M M1974 X M M M M M M M M M M M M1975 X M M M M M M M M M M M M1976 M M M M M M M M M M M M M1977 X M M M M M M M M M M M M1978 X M M M M M M M M M M M M1979 X M M M M M M M M M M M M1980 X M M M M M M M M M M M M1981 X M M M M M M M M M M M M1982 X M M M M M M M M M M M M1983 X M M M M M M M M M M M M1984 X M M M M M M M M M M M M1985 X M M M M M M M M M M M M1986 M M M M M M M M M M M M M1987 M M M M M M M M M M M M M1988 M M M M M M M M M M M M M1989 M M M M M M M M M M M X M1990 M M M M M M M M M M M X M1991 M M M M M M M M M M M X M1992 M M M M M M M M X M M X M1993 M M M M M M M M X M M X M1994 M M M M M M M M M M M X M1995 M M M M M M M M M M M X M1996 X M M M M M M M X M M X X1997 X M M M M M M M X M M X X1998 M M M M M M M M X M M X X1999 M M M M M M M M X M M X X2000 X M X M M M M M X M M X X2001 X M X M M M M M M M M X X2002 X M X M M M M M X M M X X2003 X M X M M M M M X M M X X2004 X M X M M M M M X M M X X2005 X M M M M M M M X M M X X2006 X M M M M M M M X M M X X2007 X M M M M M M M X M M X Xa. Exportables (X), import-competing products (M) and nontradables (H). Source: Anderson and Valenzuela (2008), based on author’s spreadsheet

31
Appendix Table 3: Annual distortion estimates, Finland, 1956 to 2007 (a) Nominal rates of assistance to covered products
(percent)
Barle
y Beef Egg Milk Oat Pigm
eat Potat
o Poult
ry
Sheepmea
t Sugar Whea
t
All cover
ed 1956 77 109 na 163 62 57 15 na na 194 20 83 1957 103 109 na 213 75 57 15 na na 129 28 103 1958 126 109 na 138 93 57 15 na na 184 38 94 1959 108 109 na 178 113 57 15 na na 207 40 107 1960 102 109 na 127 96 57 15 na na 201 44 89 1961 135 109 na 213 138 57 15 na na 215 42 121 1962 111 109 na 251 128 57 15 na na 208 83 131 1963 107 109 na 174 135 57 15 na na 75 86 113 1964 94 109 na 117 174 57 15 na na 110 92 106 1965 82 109 na 143 183 57 15 na na 284 113 116 1966 82 109 na 125 180 57 15 na na 331 100 109 1967 100 109 na 131 202 57 15 na na 260 109 118 1968 132 109 na 140 257 57 15 na na 199 151 139 1969 81 109 na 123 242 57 15 na na 166 150 126 1970 74 109 na 115 234 57 15 na na 118 88 116 1971 107 109 na 99 219 57 15 na na 84 123 120 1972 38 109 na 73 204 57 15 na na 68 34 89 1973 3 109 na 31 155 57 15 na na 35 6 61 1974 -8 109 na 18 144 57 15 na na 20 11 58 1975 8 109 na 20 232 57 15 na na 45 48 82 1976 -10 109 na 39 189 57 15 na na 68 37 75 1977 16 109 na 92 240 57 15 na na 95 27 90 1978 10 109 na 55 370 57 15 na na 84 98 98 1979 19 109 na 55 430 57 15 na na 40 131 113 1980 -24 109 na 55 17 57 15 na na 24 39 40 1981 -37 109 na 55 72 57 15 na na 42 50 54 1982 -42 109 na 55 149 57 15 na na 57 82 58 1983 -31 109 na 55 97 57 15 na na 53 52 46 1984 -44 109 na 55 77 57 15 na na 69 59 36 1985 135 109 na 55 84 57 15 na na 70 242 93 1986 414 109 68 195 258 57 15 62 233 325 224 153 1987 581 131 42 230 215 70 15 82 355 489 403 163 1988 302 202 60 227 125 95 15 104 425 204 297 173 1989 242 147 69 200 168 88 15 59 335 124 239 152 1990 345 173 105 213 251 86 15 64 381 103 198 172 1991 339 167 73 226 193 75 15 27 346 216 267 166 1992 277 164 74 207 165 51 15 7 271 372 208 142 1993 258 130 52 182 113 90 15 6 126 243 145 137 1994 305 151 73 194 181 98 15 23 155 208 272 156 1995 41 69 12 79 40 16 15 129 77 119 16 51 1996 2 68 5 70 34 16 14 77 45 140 0 39 1997 7 117 1 78 25 13 12 55 27 147 0 45 1998 64 121 11 100 50 22 11 51 38 186 26 69 1999 44 125 16 106 84 57 11 90 37 245 37 78 2000 3 113 3 57 59 32 10 57 26 176 11 45 2001 0 140 0 40 29 24 10 52 48 138 4 35 2002 0 157 0 75 0 24 10 56 35 161 0 43 2003 1 157 0 70 1 33 10 54 46 240 2 45 2004 1 92 0 62 23 27 10 101 33 238 2 43 2005 0 109 0 33 24 19 10 69 54 168 0 25 2006 0 81 0 24 0 14 10 42 74 66 0 17 2007 0 66 0 0 0 18 10 99 68 99 0 8

32
Appendix Table 3 (continued): Annual distortion estimates, Finland, 1956 to 2007 (b) Nominal and relative rates of assistance to alla agricultural products, to exportableb and import-competing b agricultural industries, and relativec to non-agricultural industries (percent)
NRA, all agric products,a by component NRA, agric tradables
NRA, covere
d produc
ts (1)
NRA, non-
covered
products
(2)
NRA, non-
product-specific support
(3)
NRA, all ag
products (incl NPS)
(4)=1+2+3
NRA, all ag products (incl NPS
and decoupled)
(5)
NRA, ag export- ables (6)
NRA, ag import- competi
ng (7)
NRA, all agric
tradable goods c (8)=6+7
NRA, all non-ag tradable goods
(9) RRAb
(10) 1956 83 29 na 69 69 50 82 69 10 541957 103 38 na 86 86 61 105 86 9 711958 94 35 na 78 78 70 84 78 8 641959 107 41 na 90 90 77 100 90 8 761960 89 31 na 74 74 67 79 74 7 631961 121 46 na 101 101 89 109 101 6 891962 131 46 na 108 108 76 128 108 6 971963 113 41 na 94 94 83 101 94 4 871964 106 38 na 88 88 88 88 88 4 811965 116 42 na 97 97 100 94 97 5 881966 109 38 na 91 91 94 88 91 5 821967 118 42 na 98 98 105 93 98 4 901968 139 53 na 116 116 137 101 116 7 1031969 126 46 na 105 105 119 94 105 3 991970 116 41 na 96 96 116 79 96 2 921971 120 41 na 99 99 122 79 99 2 961972 89 29 na 74 74 90 59 74 2 701973 61 16 na 50 50 64 39 50 2 481974 58 14 na 48 48 57 42 48 1 461975 82 24 na 68 68 92 48 68 1 661976 75 21 na 62 62 75 48 62 1 601977 90 22 na 73 73 83 64 73 1 721978 98 26 na 80 80 98 64 80 1 791979 113 32 na 93 93 127 65 93 1 921980 40 1 na 32 32 9 57 32 1 311981 54 2 na 42 42 22 61 42 1 411982 58 6 na 46 46 34 58 46 1 451983 46 3 na 37 37 32 42 37 1 361984 36 -1 na 28 28 17 43 28 1 271985 93 21 na 75 75 83 63 75 0 741986 153 49 10 148 148 152 45 148 1 1471987 163 37 15 161 161 155 86 161 1 1591988 173 27 10 157 157 140 156 157 1 1551989 152 23 9 137 137 148 56 137 1 1351990 172 34 8 154 154 174 24 154 1 1521991 166 27 9 149 149 161 22 149 1 1471992 142 13 9 126 126 139 35 126 1 1241993 137 17 6 118 118 134 34 118 1 1161994 156 0 6 125 125 172 78 125 1 1231995 51 0 5 43 60 na 51 43 1 421996 39 19 4 38 54 12 43 38 1 371997 45 22 4 43 60 16 48 43 1 421998 69 33 4 63 80 35 64 63 1 621999 78 38 4 72 89 38 72 72 1 702000 45 22 3 43 60 11 52 43 1 422001 35 17 4 34 51 8 39 34 1 332002 43 20 5 42 59 12 48 42 1 412003 45 22 5 44 63 11 52 44 1 422004 43 19 4 41 59 9 49 41 1 402005 25 12 4 23 42 0 35 23 1 222006 17 8 4 17 39 0 23 17 1 162007 8 4 4 10 29 0 13 10 1 9

33
a. NRAs including assistance to nontradables and via inputs and other forms of non-product-specific (NPS) assistance without and (in column (5)) with decoupled support. b. The Relative Rate of Assistance (RRA) is defined as 100*[(100+NRAagt)/ (100+NRAnonagt)-1], where NRAagt and NRAnonagt are the percentage NRAs for the tradables parts of the agricultural and non-agricultural sectors (columns 8 and 9), respectively, so it excludes decoupled payments but includes all NPS support. c. Including NPS but excluding decoupled payments, so more than the weighted average of columns (6) and (7).

34
Appendix Table 3 (continued): Annual distortion estimates, Finland, 1956 to 2007 (c) Value shares of primary production of covereda and non-covered products,
(percent)
Barle
y Beef Egg Milk Oat Pigm
eat Potat
o Poult
ry
Sheepmea
t Suga
r Whe
at
Non-cover
ed 1956 6 6 na 21 14 7 16 na na 0 4 25 1957 7 6 na 20 16 8 13 na na 1 4 26 1958 6 6 na 24 14 8 11 na na 0 5 26 1959 7 6 na 22 15 8 10 na na 0 4 27 1960 6 5 na 26 14 8 11 na na 0 5 26 1961 5 7 na 19 15 9 8 na na 1 9 27 1962 5 10 na 20 12 8 9 na na 1 8 27 1963 7 10 na 21 13 7 8 na na 2 6 27 1964 5 13 na 25 10 8 5 na na 1 7 26 1965 7 14 na 19 13 6 8 na na 0 7 26 1966 8 14 na 21 12 6 7 na na 0 5 26 1967 8 14 na 19 12 8 5 na na 0 7 26 1968 8 13 na 19 13 7 5 na na 0 7 27 1969 10 15 na 18 13 7 4 na na 0 6 26 1970 11 13 na 15 15 7 6 na na 1 6 26 1971 10 14 na 16 16 8 4 na na 1 5 26 1972 13 12 na 15 14 8 4 na na 2 7 25 1973 12 13 na 15 14 8 4 na na 2 9 24 1974 11 18 na 14 12 7 3 na na 3 10 22 1975 11 16 na 13 13 9 4 na na 1 9 24 1976 15 14 na 10 16 7 4 na na 1 10 24 1977 13 19 na 9 11 12 5 na na 1 6 24 1978 15 20 na 11 9 11 5 na na 1 3 25 1979 14 22 na 12 10 10 5 na na 2 2 24 1980 14 18 na 9 19 9 4 na na 3 3 21 1981 14 19 na 15 14 9 3 na na 1 2 22 1982 19 15 na 14 13 8 3 na na 1 4 22 1983 18 6 na 15 18 9 5 na na 1 6 22 1984 20 6 na 14 17 10 5 na na 1 5 22 1985 18 6 na 14 14 13 4 na na 1 4 25 1986 5 16 5 26 5 19 3 2 0 1 4 14 1987 3 17 6 27 4 21 3 2 0 0 1 14 1988 8 11 5 25 7 17 4 2 0 2 2 18 1989 8 12 4 22 9 15 5 2 0 2 3 18 1990 6 11 3 23 7 16 5 2 0 2 5 19 1991 7 12 4 23 6 17 4 4 0 1 3 19 1992 6 11 4 23 6 19 4 4 0 1 2 20 1993 7 10 4 24 8 14 3 4 0 1 3 20 1994 7 10 3 23 6 13 6 4 0 1 2 24 1995 9 9 3 24 6 11 9 1 0 1 3 24 1996 13 8 4 24 7 12 4 2 0 1 4 24 1997 12 6 3 23 7 14 3 2 0 2 3 24 1998 6 8 3 27 5 12 6 3 0 1 3 26 1999 9 8 3 26 4 9 9 2 0 1 2 27 2000 12 6 3 27 6 10 4 2 0 1 3 24 2001 10 4 3 30 6 12 4 3 0 1 3 24 2002 10 5 3 25 10 11 5 3 0 1 3 25 2003 10 5 4 25 7 10 4 3 0 1 5 26 2004 10 6 3 28 4 11 5 2 0 1 5 25 2005 17 6 4 13 5 15 5 3 0 1 6 24 2006 14 5 3 24 8 9 5 2 0 1 5 24 2007 21 3 2 17 10 7 5 2 0 0 8 24
a. At farmgate undistorted prices

35
Appendix Table 3 (continued): Annual distortion estimates, Finland, 1956 to 2007 (d) Trade status of of covered productsa
Barle
y Beef Egg Milk Oat Pigm
eat Potat
o Poult
ry
Sheepmea
t Sugar Whea
t 1956 X M na M X X M na na M M 1957 X M na M X X M na na M M 1958 X M na M X X M na na M M 1959 X M na M X X M na na M M 1960 X M na M X X M na na M M 1961 X M na M X X M na na M M 1962 X M na M X X M na na M M 1963 X M na M X X M na na M M 1964 X M na M X X M na na M M 1965 X M na M X X M na na M M 1966 X M na M X X M na na M M 1967 X M na M X X M na na M M 1968 X M na M X X M na na M M 1969 X M na M X X M na na M M 1970 X M na M X X M na na M M 1971 X M na M X X M na na M M 1972 X M na M X X M na na M M 1973 X M na M X X M na na M M 1974 X M na M X X M na na M M 1975 X M na M X X M na na M M 1976 X M na M X X M na na M M 1977 X M na M X X M na na M M 1978 X M na M X X M na na M M 1979 X M na M X X M na na M M 1980 X M na M X X M na na M M 1981 X M na M X X M na na M M 1982 X M na M X X M na na M M 1983 X M na M X X M na na M M 1984 X M na M X X M na na M M 1985 X M na M X X M na na M M 1986 X X X X X X M H H M X 1987 X X X X X X M H M M M 1988 X X X M X X M M M M M 1989 X X X X X X M M M M M 1990 X X X X X X M M M M X 1991 X X X X X X M X M M X 1992 X X X X X X M M M M M 1993 X X X X X X M M M M M 1994 X X X X X X M M M M M 1995 M M M M M M M M M M M 1996 X M M M M M M M M M X 1997 X M M M M M M M M M X 1998 M M M M M M M M M M X 1999 M M M M M M M M M M X 2000 X M X M M M M M M M X 2001 X M X M M M M M M M X 2002 X M X M M M M M M M X 2003 X M X M M M M M M M X 2004 X M X M M M M M M M X 2005 X M M M M M M M M M X 2006 X M M M M M M M M M X 2007 X M M M M M M M M M X a. Exportables (X), import-competing products (M) and nontradables (H). Source: Anderson and Valenzuela (2008), based on author’s spreadsheet

36
Appendix Table 4: Annual distortion estimates, France, 1956 to 2007 (a) Nominal rates of assistance to covered products
(percent)
Barley Beef Egg Maize Milk Oat Pigmea
t Potato Poultry Rapese
ed 1956 8 -13 18 -22 196 -24 19 na 190 73 1957 21 -3 38 1 245 6 45 na 198 71 1958 74 17 89 43 154 22 36 na 178 64 1959 30 -5 50 20 187 -7 8 na 124 32 1960 20 9 29 8 91 -22 5 na 61 -46 1961 40 3 26 -9 201 36 25 na 91 21 1962 75 127 22 47 421 49 120 na 80 0 1963 69 103 11 44 339 51 117 na 73 0 1964 60 86 25 41 277 41 87 na 57 0 1965 52 62 32 45 320 48 133 na 61 0 1966 54 51 16 36 296 42 149 na 59 0 1967 69 53 15 49 310 43 129 na 51 0 1968 99 73 20 77 337 54 132 na 51 0 1969 54 73 16 66 307 41 152 na 48 0 1970 54 71 -4 41 308 48 142 na 43 0 1971 89 69 3 48 317 31 136 na 162 0 1972 37 89 -5 73 300 14 114 54 106 0 1973 -7 34 -17 19 208 0 106 57 74 0 1974 3 -4 30 2 210 7 69 18 54 0 1975 23 11 16 22 264 23 65 49 60 0 1976 20 26 5 39 366 10 122 327 69 0 1977 56 11 41 72 598 35 65 71 61 0 1978 49 11 13 81 488 74 78 -15 49 0 1979 75 0 41 67 440 80 109 17 38 0 1980 17 -1 22 62 434 -27 71 7 37 0 1981 7 23 2 43 330 -2 148 73 72 0 1982 8 49 18 66 313 22 125 95 99 0 1983 32 264 40 29 287 -1 129 87 73 0 1984 6 265 3 15 311 8 81 -24 95 0 1985 18 293 8 28 282 -6 22 11 91 0 1986 157 188 31 110 361 83 40 17 79 153 1987 233 107 21 170 533 77 11 17 90 145 1988 85 80 21 79 192 14 34 17 69 112 1989 45 79 29 62 84 15 14 17 66 140 1990 94 98 12 108 125 48 7 16 100 200 1991 119 157 13 120 128 39 20 16 83 97 1992 103 93 15 103 118 63 0 17 118 0 1993 105 63 10 69 123 44 18 17 110 0 1994 100 53 0 45 117 43 18 16 114 0 1995 41 69 12 53 79 40 16 15 129 0 1996 2 68 5 14 70 34 16 14 77 0 1997 7 117 1 19 78 25 13 12 55 0 1998 64 121 11 32 100 50 22 11 51 0 1999 44 125 16 39 106 84 57 11 90 0 2000 3 113 3 27 57 59 32 10 57 1 2001 0 140 0 14 40 29 24 10 52 0 2002 0 157 0 9 75 0 24 10 56 0 2003 1 157 0 34 70 1 33 10 54 0 2004 1 92 0 39 62 23 27 10 101 0 2005 0 109 0 19 33 24 19 10 69 0 2006 0 86 0 19 24 0 15 10 69 02007 0 71 0 21 0 0 18 10 100 0

37
Rice Sheep
meat Soybea
n Sugar Sunflo
wer Tomato Wheat Wine
All covere
d 1956 57 222 na 118 5 na 51 -31 32 1957 42 261 na 66 15 na 15 -16 47 1958 25 219 na 153 20 na 33 78 73 1959 9 180 na 205 9 na 23 -6 40 1960 8 118 na 125 9 na 18 -42 16 1961 -9 176 na 160 3 -17 23 -39 32 1962 -15 279 na 185 0 22 78 4 79 1963 -20 231 na 13 0 22 86 4 71 1964 -19 226 na 63 0 22 70 4 67 1965 8 203 na 330 0 22 74 4 72 1966 -12 372 na 410 0 22 63 4 71 1967 -24 373 na 319 0 22 64 4 73 1968 -2 382 na 232 0 22 73 4 82 1969 25 386 na 183 0 22 62 4 77 1970 43 372 na 100 0 22 24 4 60 1971 -12 367 na 47 0 22 55 4 73 1972 -31 385 na 46 0 22 -2 4 59 1973 -61 322 0 -30 0 22 -30 4 24 1974 -55 255 0 -51 0 22 -23 4 16 1975 -19 267 0 28 0 22 -9 4 37 1976 0 342 0 99 0 22 -16 4 52 1977 -10 281 0 230 0 22 -21 4 52 1978 16 263 0 230 0 22 23 4 59 1979 -15 230 0 70 0 22 35 4 57 1980 -38 207 0 13 0 22 45 4 50 1981 1 183 0 74 0 11 44 17 68 1982 17 181 0 152 0 31 51 15 78 1983 -10 203 0 196 0 19 28 10 89 1984 41 172 0 268 0 26 20 7 69 1985 105 95 0 297 0 26 31 -25 61 1986 127 134 211 247 144 17 119 9 114 1987 190 211 169 301 150 15 143 9 118 1988 162 215 108 201 96 15 94 7 82 1989 148 167 118 90 150 0 31 6 50 1990 152 154 147 109 143 2 57 8 66 1991 144 128 159 191 111 0 146 9 90 1992 143 112 0 212 0 0 65 13 62 1993 106 38 0 169 0 8 58 13 60 1994 133 55 0 129 0 11 48 10 50 1995 88 77 0 119 0 0 16 4 39 1996 33 45 0 140 0 2 0 4 28 1997 31 27 0 147 0 0 0 5 32 1998 18 38 0 186 0 0 26 3 43 1999 0 37 0 245 0 0 37 2 49 2000 1 26 0 176 0 0 11 2 33 2001 42 48 0 138 0 0 4 2 27 2002 24 35 0 161 0 0 0 2 32 2003 18 46 0 240 0 2 2 2 36 2004 1 33 0 238 0 2 2 1 31 2005 2 54 0 168 0 0 0 2 17 2006 3 74 0 66 0 0 0 1 15 2007 1 68 0 99 0 0 0 1 11

38
Appendix Table 4 (continued): Annual distortion estimates, France, 1956 to 2007 (b) Nominal and relative rates of assistance to alla agricultural products, to exportableb and import-competing b agricultural industries, and relativec to non-agricultural industries (percent)
NRA, all agric products,a by component NRA, agric tradables
NRA, covere
d produc
ts (1)
NRA, non-
covered
products
(2)
NRA, non-
product-specific support
(3)
NRA, all ag
products (incl NPS)
(4)=1+2+3
NRA, all ag products (incl NPS
and decoupled)
(5)
NRA, ag export- ables (6)
NRA, ag import- competi
ng (7)
NRA, all agric
tradable goods c (8)=6+7
NRA, all non-ag tradable goods
(9) RRAb
(10) 1956 32 9 na 27 27 -11 41 27 10 151957 47 18 na 40 40 1 54 40 11 251958 73 36 na 64 64 50 68 64 14 441959 40 18 na 35 35 7 45 35 13 191960 16 2 na 13 13 -20 25 13 12 11961 32 11 na 27 27 -15 46 27 12 141962 79 58 na 75 75 20 111 75 12 561963 71 49 na 67 67 19 94 67 12 501964 67 46 na 62 62 18 85 62 11 461965 72 50 na 68 68 22 91 68 11 511966 71 49 na 67 67 22 87 67 10 511967 73 47 na 68 68 22 87 68 11 511968 82 54 na 76 76 22 102 76 8 631969 77 51 na 72 72 24 92 72 7 601970 60 43 na 57 57 16 77 57 7 471971 73 48 na 68 68 31 89 68 6 581972 59 36 na 55 55 20 71 55 6 461973 24 15 na 22 22 5 31 22 5 161974 16 11 na 15 15 8 18 15 4 111975 37 25 na 35 35 16 44 35 4 301976 52 32 na 48 48 18 58 48 4 431977 52 31 na 48 48 26 56 48 4 421978 59 37 na 55 55 28 66 55 5 471979 57 39 12 66 67 31 63 66 5 581980 50 33 12 58 60 29 52 58 4 511981 68 39 10 71 73 31 71 71 4 651982 78 45 9 80 82 30 86 80 4 731983 89 50 9 89 92 30 99 89 4 811984 69 39 8 70 72 19 80 70 4 641985 61 40 10 67 70 7 81 67 6 581986 114 68 3 107 109 38 128 107 6 951987 118 70 3 111 113 46 129 111 6 981988 82 45 3 77 80 31 87 77 5 681989 50 26 3 48 51 15 55 48 5 411990 66 35 4 63 67 20 74 63 5 561991 90 48 5 85 90 30 96 85 5 761992 62 37 5 61 69 24 69 61 5 541993 60 35 5 59 72 24 65 59 5 521994 50 30 4 50 65 21 55 50 5 431995 39 24 5 41 58 13 45 41 5 341996 28 16 4 30 46 5 43 30 5 231997 32 19 4 34 50 7 47 34 5 271998 43 26 4 44 61 15 59 44 5 371999 49 32 4 50 67 17 69 50 5 432000 33 20 3 34 51 8 50 34 5 272001 27 16 4 29 46 5 39 29 5 222002 32 19 5 34 51 4 52 34 5 272003 36 22 5 38 57 5 59 38 5 312004 31 19 4 33 51 4 52 33 5 262005 17 9 4 17 36 1 39 17 4 132006 15 7 4 16 37 1 33 16 4 112007 11 6 4 13 31 0 29 13 4 8

39
a. NRAs including assistance to nontradables and via inputs and other forms of non-product-specific (NPS) assistance without and (in column (5)) with decoupled support. b. The Relative Rate of Assistance (RRA) is defined as 100*[(100+NRAagt)/ (100+NRAnonagt)-1], where NRAagt and NRAnonagt are the percentage NRAs for the tradables parts of the agricultural and non-agricultural sectors (columns 8 and 9), respectively, so it excludes decoupled payments but includes all NPS support. c. Including NPS but excluding decoupled payments, so more than the weighted average of columns (6) and (7).

40
Appendix Table 4 (continued): Annual distortion estimates, France, 1956 to 2007 (c) Value shares of primary production of covereda and non-covered products,
(percent)
Barley Beef Egg Maize Milk Oat Pigmea
t Potato Poultry Rapese
ed 1956 8 10 5 2 8 6 7 na 3 0 1957 4 10 5 1 8 3 8 na 3 0 1958 4 11 5 1 11 4 9 na 4 0 1959 5 10 5 1 8 3 9 na 3 0 1960 6 9 5 2 10 3 9 na 3 0 1961 5 10 5 1 8 2 8 na 3 0 1962 5 8 4 1 5 2 7 na 4 0 1963 6 9 4 3 6 2 7 na 4 0 1964 5 10 4 2 6 2 7 na 4 1 1965 6 12 4 3 6 2 6 na 4 1 1966 6 13 4 3 7 2 6 na 3 1 1967 7 13 4 3 7 2 6 na 3 1 1968 5 13 4 3 7 2 6 na 3 1 1969 7 13 4 4 7 2 6 na 4 1 1970 5 11 4 5 6 1 5 na 3 1 1971 5 12 4 6 6 2 6 na 2 1 1972 7 10 4 4 6 2 5 2 2 1 1973 6 9 4 5 6 1 5 2 2 1 1974 6 14 2 6 6 1 5 2 2 1 1975 5 15 3 5 6 1 6 2 3 1 1976 6 15 3 4 5 1 6 1 3 1 1977 5 15 2 4 4 1 7 3 3 1 1978 5 16 3 4 4 1 6 3 3 1 1979 5 18 2 5 5 1 5 3 4 1 1980 7 18 3 4 5 2 6 2 4 1 1981 7 16 3 5 7 1 5 2 4 1 1982 7 13 3 5 7 1 5 2 4 2 1983 6 6 3 7 8 1 5 2 4 1 1984 7 5 3 7 7 1 5 3 3 2 1985 6 5 3 7 7 1 7 3 3 2 1986 3 8 3 6 8 0 8 3 5 1 1987 2 11 3 4 5 1 9 3 4 2 1988 3 11 2 6 10 1 6 2 4 2 1989 3 8 2 5 14 0 8 2 4 1 1990 3 9 2 3 12 0 8 2 3 1 1991 3 7 3 5 13 0 8 3 4 1 1992 3 9 2 4 12 0 10 2 3 1 1993 2 10 3 5 13 0 8 1 4 1 1994 2 10 3 5 12 0 8 3 4 2 1995 2 9 2 4 14 0 8 3 3 2 1996 3 7 3 6 12 0 8 2 4 2 1997 3 6 3 6 12 0 9 2 4 3 1998 2 6 2 5 12 0 7 3 5 3 1999 2 6 2 5 12 0 5 3 4 3 2000 3 6 3 5 15 0 7 2 4 2 2001 3 4 3 6 17 0 9 2 5 2 2002 3 5 3 6 13 0 7 2 4 2 2003 3 5 4 4 14 0 7 2 4 3 2004 3 5 3 5 14 0 7 3 3 3 2005 4 4 3 4 4 0 8 2 4 3 2006 4 4 3 4 4 0 7 3 4 4 2007 5 3 3 5 6 0 5 1 3 4
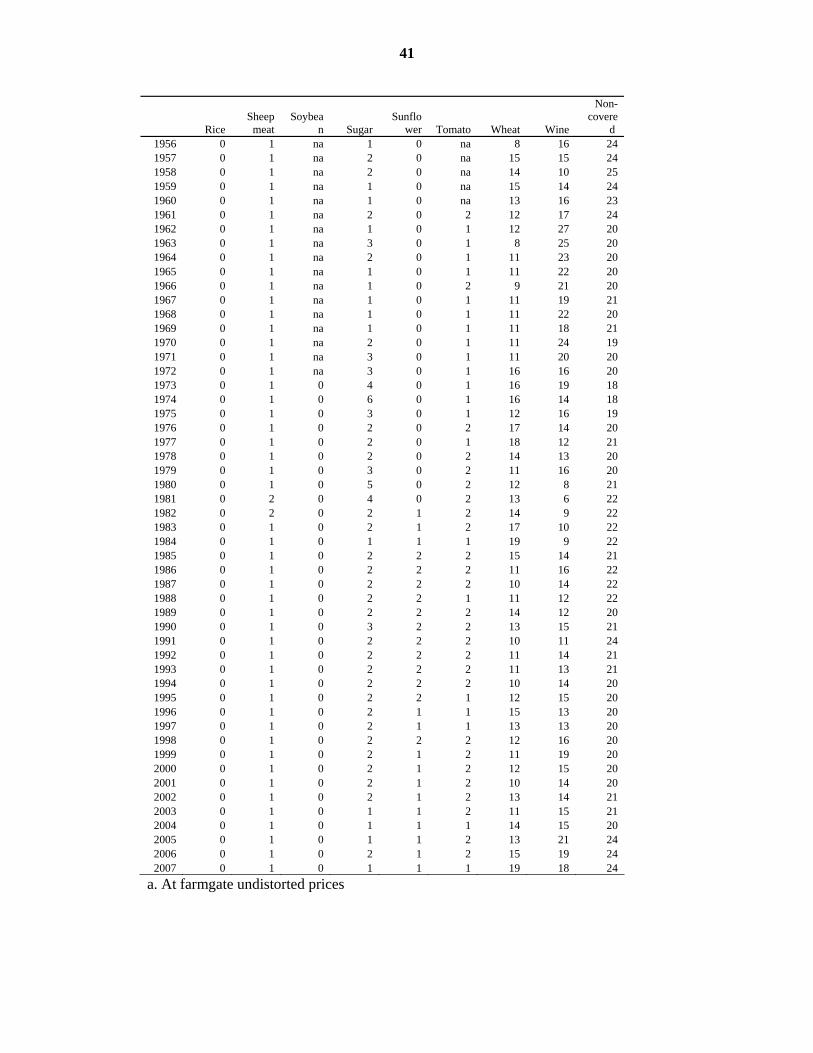
41
Rice Sheep
meat Soybea
n Sugar Sunflo
wer Tomato Wheat Wine
Non-covere
d 1956 0 1 na 1 0 na 8 16 24 1957 0 1 na 2 0 na 15 15 24 1958 0 1 na 2 0 na 14 10 25 1959 0 1 na 1 0 na 15 14 24 1960 0 1 na 1 0 na 13 16 23 1961 0 1 na 2 0 2 12 17 24 1962 0 1 na 1 0 1 12 27 20 1963 0 1 na 3 0 1 8 25 20 1964 0 1 na 2 0 1 11 23 20 1965 0 1 na 1 0 1 11 22 20 1966 0 1 na 1 0 2 9 21 20 1967 0 1 na 1 0 1 11 19 21 1968 0 1 na 1 0 1 11 22 20 1969 0 1 na 1 0 1 11 18 21 1970 0 1 na 2 0 1 11 24 19 1971 0 1 na 3 0 1 11 20 20 1972 0 1 na 3 0 1 16 16 20 1973 0 1 0 4 0 1 16 19 18 1974 0 1 0 6 0 1 16 14 18 1975 0 1 0 3 0 1 12 16 19 1976 0 1 0 2 0 2 17 14 20 1977 0 1 0 2 0 1 18 12 21 1978 0 1 0 2 0 2 14 13 20 1979 0 1 0 3 0 2 11 16 20 1980 0 1 0 5 0 2 12 8 21 1981 0 2 0 4 0 2 13 6 22 1982 0 2 0 2 1 2 14 9 22 1983 0 1 0 2 1 2 17 10 22 1984 0 1 0 1 1 1 19 9 22 1985 0 1 0 2 2 2 15 14 21 1986 0 1 0 2 2 2 11 16 22 1987 0 1 0 2 2 2 10 14 22 1988 0 1 0 2 2 1 11 12 22 1989 0 1 0 2 2 2 14 12 20 1990 0 1 0 3 2 2 13 15 21 1991 0 1 0 2 2 2 10 11 24 1992 0 1 0 2 2 2 11 14 21 1993 0 1 0 2 2 2 11 13 21 1994 0 1 0 2 2 2 10 14 20 1995 0 1 0 2 2 1 12 15 20 1996 0 1 0 2 1 1 15 13 20 1997 0 1 0 2 1 1 13 13 20 1998 0 1 0 2 2 2 12 16 20 1999 0 1 0 2 1 2 11 19 20 2000 0 1 0 2 1 2 12 15 20 2001 0 1 0 2 1 2 10 14 20 2002 0 1 0 2 1 2 13 14 21 2003 0 1 0 1 1 2 11 15 21 2004 0 1 0 1 1 1 14 15 20 2005 0 1 0 1 1 2 13 21 24 2006 0 1 0 2 1 2 15 19 24 2007 0 1 0 1 1 1 19 18 24
a. At farmgate undistorted prices

42
Appendix Table 4 (continued): Annual distortion estimates, France, 1956 to 2007 (d) Trade status of of covered productsa
Barley Beef Egg Maize Milk Oat Pigme
at Potato Poultr
y Rapes
eed 1956 M M M M M M M na M M1957 M M M M M M M na M M1958 M M M M M M M na M M1959 M M M M M M M na M M1960 M M M M M M M na M M1961 M M M M M M M na M M1962 M M M M M M M na M X1963 M M M M M M M na M M1964 M M M M M M M na M X1965 M M M M M M M na M M1966 M M M M M M M na M M1967 M M M M M M M na M M1968 M M M M M M M na M M1969 M M M M M M M na M M1970 M M M M M M M na M M1971 X M M M M M M na M M1972 X M M M M M M M M M1973 X M M M M M M M M M1974 X M M M M M M M M M1975 X M M M M M M M M M1976 M M M M M M M M M M1977 X M M M M M M M M M1978 X M M M M M M M M M1979 X M M M M M M M M M1980 X M M M M M M M M M1981 X M M M M M M M M M1982 X M M M M M M M M M1983 X M M M M M M M M M1984 X M M M M M M M M M1985 X M M M M M M M M M1986 M M M M M M M M M M1987 M M M M M M M M M M1988 M M M M M M M M M M1989 M M M M M M M M M M1990 M M M M M M M M M M1991 M M M M M M M M M M1992 M M M M M M M M M X1993 M M M M M M M M M X1994 M M M M M M M M M M1995 M M M M M M M M M M1996 X M M M M M M M M X1997 X M M M M M M M M X1998 M M M M M M M M M X1999 M M M M M M M M M X2000 X M X M M M M M M X2001 X M X M M M M M M M2002 X M X M M M M M M X2003 X M X M M M M M M X2004 X M X M M M M M M X2005 X M M M M M M M M X2006 X M M M M M M M M X2007 X M M M M M M M M X

43
Rice Sheepmeat
Soybean Sugar
Sunflower
Tomato Wheat Wine
1956 X M 0 M M na M X1957 X M 0 M M na M X1958 X M 0 M M na M X1959 X M 0 M M na M X1960 X M 0 M M na M X1961 X M 0 M M X M X1962 X M 0 M M X M X1963 X M 0 M M X M X1964 X M 0 M M M M X1965 X M 0 M M M M X1966 X M 0 M M M M X1967 X M 0 M M M M X1968 X M 0 M M M M X1969 X M 0 M M M M X1970 X M 0 M M M M X1971 X M 0 M M M M X1972 X M 0 M M M M X1973 X M M M M M M X1974 X M M M M M M X1975 X M M M X M M X1976 X M M M M M M X1977 X M M M M M M X1978 X M M M M M M X1979 X M M M M M M X1980 X M M M M M M X1981 X M M M X M M X1982 X M M M X M M X1983 X M M M X M M X1984 X M M M X M M X1985 X M M M X M M X1986 X M M M M M M X1987 X M M M M M M X1988 X M M M M M M X1989 X M M M M X M X1990 X M M M M X M X1991 X M M M M X M X1992 X M M M M X M X1993 X M M M M X M X1994 X M M M M X M X1995 X M M M M X M X1996 X M M M M X X X1997 X M M M M X X X1998 X M M M M X X X1999 X M M M M X X X2000 X M M M M X X X2001 X M M M M X X X2002 X M M M M X X X2003 X M M M M X X X2004 X M M M M X X X2005 X M M M M X X X2006 X M M M M X X X2007 X M M M M X X X
a. Exportables (X), import-competing products (M) and nontradables (H). Source: Anderson and Valenzuela (2008), based on author’s spreadsheet

44
Appendix Table 5: Annual distortion estimates, Germany, 1956 to 2007 (a) Nominal rates of assistance to covered products
(percent)
Barley Beef Egg Maize Milk Oat Pigmea
t Potato Poultry Rapese
ed 1956 35 32 33 na 453 15 25 na 23 64 1957 51 41 38 na 434 19 32 na 28 74 1958 74 43 66 na 460 29 19 na 27 75 1959 72 52 37 na 412 44 29 na 23 57 1960 70 80 27 na 390 32 20 na 20 35 1961 96 77 39 na 361 57 39 na 31 24 1962 75 127 22 47 421 49 120 na 80 0 1963 69 103 11 44 339 51 117 na 73 0 1964 60 86 25 41 277 41 87 na 57 0 1965 52 62 32 45 320 48 133 na 61 0 1966 54 51 16 36 296 42 149 na 59 0 1967 69 53 15 49 310 43 129 na 51 0 1968 99 73 20 77 337 54 132 na 51 0 1969 54 73 16 66 307 41 152 na 48 0 1970 54 71 -4 41 308 48 142 na 43 0 1971 89 69 3 48 317 31 136 na 162 0 1972 37 89 -5 73 300 14 114 54 106 0 1973 -7 34 -17 19 208 0 106 57 74 0 1974 3 -4 30 2 210 7 69 18 54 0 1975 23 11 16 22 264 23 65 49 60 0 1976 20 26 5 39 366 10 122 327 69 0 1977 56 11 41 72 598 35 65 71 61 0 1978 49 11 13 81 488 74 78 -15 49 0 1979 75 0 41 67 440 80 109 17 38 0 1980 17 -1 22 62 434 -27 71 7 37 0 1981 7 23 2 43 330 -2 148 73 72 0 1982 8 49 18 66 313 22 125 95 99 0 1983 32 264 40 29 287 -1 129 87 73 0 1984 6 265 3 15 311 8 81 -24 95 0 1985 18 293 8 28 282 -6 22 11 91 0 1986 157 188 31 110 361 83 40 17 79 153 1987 233 107 21 170 533 77 11 17 90 145 1988 85 80 21 79 192 14 34 17 69 112 1989 45 79 29 62 84 15 14 17 66 140 1990 94 98 12 108 125 48 7 16 100 200 1991 119 157 13 120 128 39 20 16 83 97 1992 103 93 15 103 118 63 0 17 118 0 1993 105 63 10 69 123 44 18 17 110 0 1994 100 53 0 45 117 43 18 16 114 0 1995 41 69 12 53 79 40 16 15 129 0 1996 2 68 5 14 70 34 16 14 77 0 1997 7 117 1 19 78 25 13 12 55 0 1998 64 121 11 32 100 50 22 11 51 0 1999 44 125 16 39 106 84 57 11 90 0 2000 3 113 3 27 57 59 32 10 57 1 2001 0 140 0 14 40 29 24 10 52 0 2002 0 157 0 9 75 0 24 10 56 0 2003 1 157 0 34 70 1 33 10 54 0 2004 1 92 0 39 62 23 27 10 101 0 2005 0 109 0 19 33 24 19 10 69 0 2006 0 81 0 19 25 0 14 10 42 02007 0 66 0 21 0 0 18 10 99 0
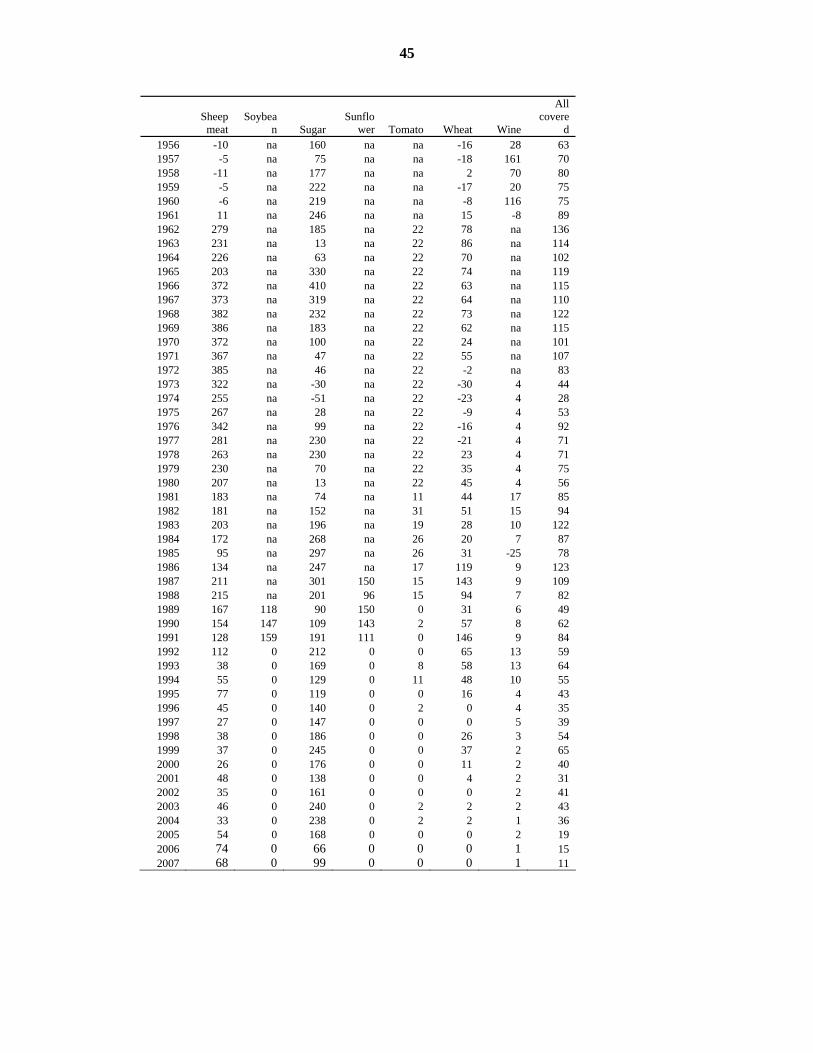
45
Sheep
meat Soybea
n Sugar Sunflo
wer Tomato Wheat Wine
All covere
d 1956 -10 na 160 na na -16 28 63 1957 -5 na 75 na na -18 161 70 1958 -11 na 177 na na 2 70 80 1959 -5 na 222 na na -17 20 75 1960 -6 na 219 na na -8 116 75 1961 11 na 246 na na 15 -8 89 1962 279 na 185 na 22 78 na 136 1963 231 na 13 na 22 86 na 114 1964 226 na 63 na 22 70 na 102 1965 203 na 330 na 22 74 na 119 1966 372 na 410 na 22 63 na 115 1967 373 na 319 na 22 64 na 110 1968 382 na 232 na 22 73 na 122 1969 386 na 183 na 22 62 na 115 1970 372 na 100 na 22 24 na 101 1971 367 na 47 na 22 55 na 107 1972 385 na 46 na 22 -2 na 83 1973 322 na -30 na 22 -30 4 44 1974 255 na -51 na 22 -23 4 28 1975 267 na 28 na 22 -9 4 53 1976 342 na 99 na 22 -16 4 92 1977 281 na 230 na 22 -21 4 71 1978 263 na 230 na 22 23 4 71 1979 230 na 70 na 22 35 4 75 1980 207 na 13 na 22 45 4 56 1981 183 na 74 na 11 44 17 85 1982 181 na 152 na 31 51 15 94 1983 203 na 196 na 19 28 10 122 1984 172 na 268 na 26 20 7 87 1985 95 na 297 na 26 31 -25 78 1986 134 na 247 na 17 119 9 123 1987 211 na 301 150 15 143 9 109 1988 215 na 201 96 15 94 7 82 1989 167 118 90 150 0 31 6 49 1990 154 147 109 143 2 57 8 62 1991 128 159 191 111 0 146 9 84 1992 112 0 212 0 0 65 13 59 1993 38 0 169 0 8 58 13 64 1994 55 0 129 0 11 48 10 55 1995 77 0 119 0 0 16 4 43 1996 45 0 140 0 2 0 4 35 1997 27 0 147 0 0 0 5 39 1998 38 0 186 0 0 26 3 54 1999 37 0 245 0 0 37 2 65 2000 26 0 176 0 0 11 2 40 2001 48 0 138 0 0 4 2 31 2002 35 0 161 0 0 0 2 41 2003 46 0 240 0 2 2 2 43 2004 33 0 238 0 2 2 1 36 2005 54 0 168 0 0 0 2 19 2006 74 0 66 0 0 0 1 15 2007 68 0 99 0 0 0 1 11
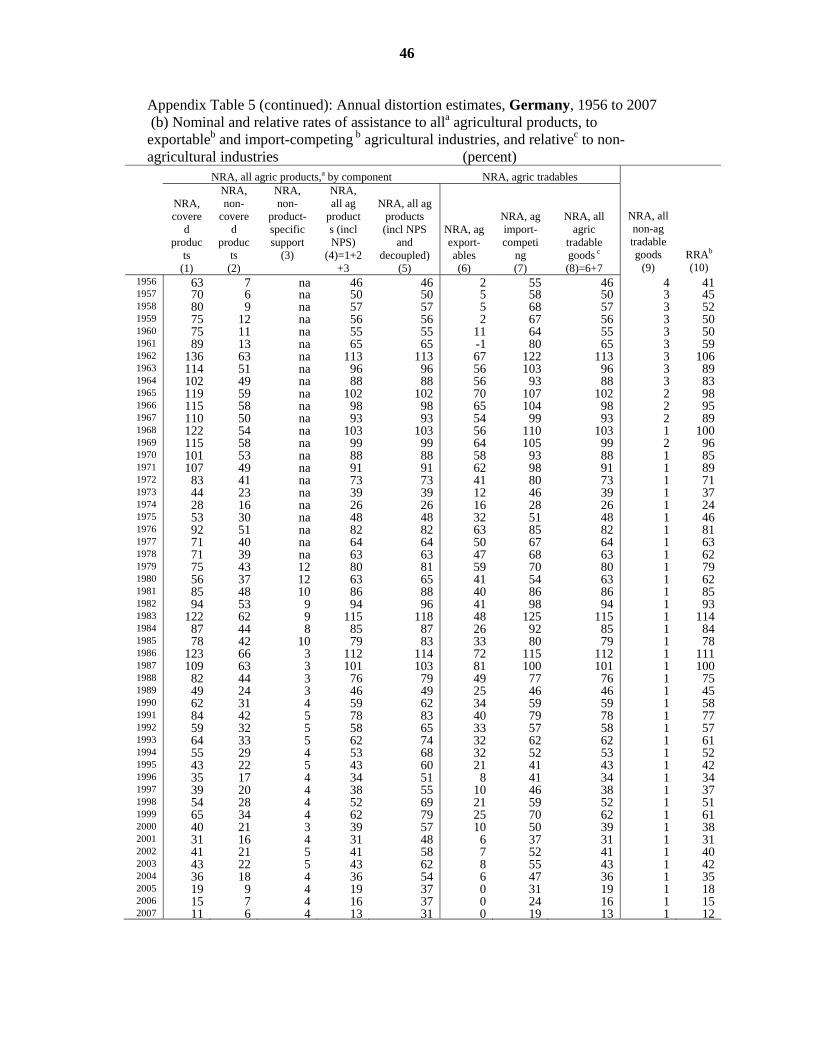
46
Appendix Table 5 (continued): Annual distortion estimates, Germany, 1956 to 2007 (b) Nominal and relative rates of assistance to alla agricultural products, to exportableb and import-competing b agricultural industries, and relativec to non-agricultural industries (percent)
NRA, all agric products,a by component NRA, agric tradables
NRA, covere
d produc
ts (1)
NRA, non-
covered
products
(2)
NRA, non-
product-specific support
(3)
NRA, all ag
products (incl NPS)
(4)=1+2+3
NRA, all ag products (incl NPS
and decoupled)
(5)
NRA, ag export- ables (6)
NRA, ag import- competi
ng (7)
NRA, all agric
tradable goods c (8)=6+7
NRA, all non-ag tradable goods
(9) RRAb
(10) 1956 63 7 na 46 46 2 55 46 4 411957 70 6 na 50 50 5 58 50 3 451958 80 9 na 57 57 5 68 57 3 521959 75 12 na 56 56 2 67 56 3 501960 75 11 na 55 55 11 64 55 3 501961 89 13 na 65 65 -1 80 65 3 591962 136 63 na 113 113 67 122 113 3 1061963 114 51 na 96 96 56 103 96 3 891964 102 49 na 88 88 56 93 88 3 831965 119 59 na 102 102 70 107 102 2 981966 115 58 na 98 98 65 104 98 2 951967 110 50 na 93 93 54 99 93 2 891968 122 54 na 103 103 56 110 103 1 1001969 115 58 na 99 99 64 105 99 2 961970 101 53 na 88 88 58 93 88 1 851971 107 49 na 91 91 62 98 91 1 891972 83 41 na 73 73 41 80 73 1 711973 44 23 na 39 39 12 46 39 1 371974 28 16 na 26 26 16 28 26 1 241975 53 30 na 48 48 32 51 48 1 461976 92 51 na 82 82 63 85 82 1 811977 71 40 na 64 64 50 67 64 1 631978 71 39 na 63 63 47 68 63 1 621979 75 43 12 80 81 59 70 80 1 791980 56 37 12 63 65 41 54 63 1 621981 85 48 10 86 88 40 86 86 1 851982 94 53 9 94 96 41 98 94 1 931983 122 62 9 115 118 48 125 115 1 1141984 87 44 8 85 87 26 92 85 1 841985 78 42 10 79 83 33 80 79 1 781986 123 66 3 112 114 72 115 112 1 1111987 109 63 3 101 103 81 100 101 1 1001988 82 44 3 76 79 49 77 76 1 751989 49 24 3 46 49 25 46 46 1 451990 62 31 4 59 62 34 59 59 1 581991 84 42 5 78 83 40 79 78 1 771992 59 32 5 58 65 33 57 58 1 571993 64 33 5 62 74 32 62 62 1 611994 55 29 4 53 68 32 52 53 1 521995 43 22 5 43 60 21 41 43 1 421996 35 17 4 34 51 8 41 34 1 341997 39 20 4 38 55 10 46 38 1 371998 54 28 4 52 69 21 59 52 1 511999 65 34 4 62 79 25 70 62 1 612000 40 21 3 39 57 10 50 39 1 382001 31 16 4 31 48 6 37 31 1 312002 41 21 5 41 58 7 52 41 1 402003 43 22 5 43 62 8 55 43 1 422004 36 18 4 36 54 6 47 36 1 352005 19 9 4 19 37 0 31 19 1 182006 15 7 4 16 37 0 24 16 1 152007 11 6 4 13 31 0 19 13 1 12

47
a. NRAs including assistance to nontradables and via inputs and other forms of non-product-specific (NPS) assistance without and (in column (5)) with decoupled support. b. The Relative Rate of Assistance (RRA) is defined as 100*[(100+NRAagt)/ (100+NRAnonagt)-1], where NRAagt and NRAnonagt are the percentage NRAs for the tradables parts of the agricultural and non-agricultural sectors (columns 8 and 9), respectively, so it excludes decoupled payments but includes all NPS support. c. Including NPS but excluding decoupled payments, so more than the weighted average of columns (6) and (7).

48
Appendix Table 5 (continued): Annual distortion estimates, Germany, 1956 to 2007 (c) Value shares of primary production of covereda and non-covered products,
(percent)
Barley Beef Egg Maize Milk Oat Pigmea
t Potato Poultry Rapese
ed 1956 5 10 6 na 6 5 24 na 1 0 1957 4 11 6 na 7 4 24 na 1 0 1958 4 11 5 na 7 4 26 na 1 0 1959 4 11 6 na 7 3 24 na 1 0 1960 4 9 6 na 8 4 25 na 1 0 1961 3 10 7 na 8 3 24 na 1 0 1962 6 11 7 0 9 4 20 na 2 1 1963 5 11 8 0 9 3 20 na 2 1 1964 5 12 6 0 11 3 22 na 2 1 1965 5 15 8 0 10 3 19 na 2 1 1966 5 16 8 0 11 3 18 na 2 1 1967 6 15 8 0 10 3 17 na 2 1 1968 5 14 8 0 10 3 18 na 2 1 1969 6 15 8 0 10 3 18 na 2 1 1970 5 15 9 0 9 2 17 na 2 1 1971 5 15 9 0 9 3 17 na 1 1 1972 6 11 8 0 8 3 15 9 1 1 1973 7 12 7 0 8 3 13 8 1 1 1974 7 15 4 0 7 3 13 8 1 1 1975 6 16 4 0 8 3 17 6 2 1 1976 7 16 6 0 7 2 15 6 2 1 1977 6 17 4 0 4 2 18 8 2 1 1978 7 18 5 0 6 2 17 8 2 1 1979 5 21 3 0 6 2 14 9 2 1 1980 8 19 4 0 6 3 16 6 2 1 1981 9 17 5 1 9 3 13 6 2 1 1982 11 16 4 1 10 3 13 5 2 1 1983 9 7 5 1 12 2 15 6 2 1 1984 11 6 5 1 9 3 16 9 2 2 1985 9 5 4 1 10 3 22 8 1 2 1986 5 9 4 1 10 1 23 8 2 2 1987 3 13 4 0 7 1 25 9 2 1 1988 5 13 3 1 14 2 18 7 2 1 1989 5 10 2 1 18 1 20 6 1 1 1990 4 10 3 1 15 1 22 6 1 1 1991 5 9 3 1 16 1 20 6 1 2 1992 4 10 3 1 16 1 24 4 1 2 1993 4 11 3 1 18 1 18 4 2 3 1994 3 10 3 1 17 1 17 7 1 3 1995 4 9 2 1 19 0 16 8 1 3 1996 5 8 3 1 19 1 17 4 2 2 1997 6 6 3 1 18 1 19 4 2 3 1998 4 7 3 1 19 0 15 7 2 4 1999 5 7 2 1 19 0 12 8 2 4 2000 5 6 3 1 21 0 16 4 2 3 2001 5 4 3 1 22 0 18 4 2 3 2002 4 5 3 2 19 0 17 5 2 4 2003 5 5 4 2 20 0 16 4 3 4 2004 5 5 2 1 19 0 15 7 2 4 2005 7 4 4 2 3 0 23 6 2 6 2006 6 5 3 1 7 0 20 7 2 6 2007 7 4 3 2 11 0 15 6 1 6

49
Sheep
meat Soybea
n Sugar Sunflo
wer Tomato Wheat Wine
Non-covere
d 1956 0 na 2 na na 8 1 31 1957 0 na 2 na na 8 1 32 1958 0 na 2 na na 7 1 32 1959 0 na 2 na na 8 2 31 1960 0 na 1 na na 8 2 32 1961 0 na 2 na na 7 3 32 1962 1 na 2 na 0 7 na 32 1963 0 na 5 na 0 6 na 29 1964 0 na 3 na 0 6 na 28 1965 0 na 1 na 0 6 na 29 1966 0 na 1 na 0 6 na 29 1967 0 na 1 na 0 7 na 29 1968 0 na 2 na 0 8 na 28 1969 0 na 2 na 0 7 na 28 1970 0 na 2 na 0 8 na 28 1971 0 na 3 na 0 8 na 27 1972 0 na 3 na 0 10 na 25 1973 0 na 5 na 0 11 2 22 1974 0 na 7 na 0 10 1 21 1975 0 na 4 na 0 9 2 22 1976 0 na 2 na 0 11 2 24 1977 0 na 2 na 0 11 2 23 1978 0 na 2 na 0 8 2 23 1979 0 na 3 na 0 7 2 23 1980 0 na 5 na 0 6 1 22 1981 0 na 4 na 0 7 1 23 1982 0 na 2 na 0 7 1 24 1983 0 na 2 na 0 10 2 25 1984 0 na 2 na 0 10 1 24 1985 0 na 2 na 0 8 1 24 1986 0 na 2 na 0 7 2 25 1987 0 na 2 0 0 6 2 25 1988 0 na 2 0 0 6 2 24 1989 0 0 2 0 0 7 2 23 1990 0 0 3 0 0 6 2 23 1991 0 0 2 0 0 5 3 25 1992 0 0 2 0 0 7 2 24 1993 0 0 2 0 0 7 2 24 1994 0 0 2 0 0 7 3 23 1995 0 0 2 0 0 8 3 23 1996 0 0 2 0 0 10 3 22 1997 0 0 2 0 0 10 3 23 1998 0 0 2 0 0 8 4 23 1999 0 0 2 0 0 8 5 24 2000 1 0 2 0 0 9 3 23 2001 0 0 2 0 0 9 3 22 2002 1 0 2 0 0 9 3 23 2003 1 0 1 0 0 9 3 24 2004 1 0 1 0 0 11 3 23 2005 1 0 1 0 0 13 5 24 2006 0 0 1 0 0 12 4 24 2007 0 0 1 0 0 15 4 24
a. At farmgate undistorted prices

50
Appendix Table 5 (continued): Annual distortion estimates, Germany, 1956 to 2007 (d) Trade status of of covered productsa
Barley Beef Egg Maize Milk Oat Pigme
at Potato Poultr
y Rapes
eed 1956 M M M na M M M na M M1957 M M M na M M M na M M1958 M M M na M M M na M M1959 M M M na M M M na M M1960 M M M na M M M na M M1961 M M M na M M M na M M1962 M M M M M M M na M X1963 M M M M M M M na M M1964 M M M M M M M na M X1965 M M M M M M M na M M1966 M M M M M M M na M M1967 M M M M M M M na M M1968 M M M M M M M na M M1969 M M M M M M M na M M1970 M M M M M M M na M M1971 X M M M M M M na M M1972 X M M M M M M M M M1973 X M M M M M M M M M1974 X M M M M M M M M M1975 X M M M M M M M M M1976 M M M M M M M M M M1977 X M M M M M M M M M1978 X M M M M M M M M M1979 X M M M M M M M M M1980 X M M M M M M M M M1981 X M M M M M M M M M1982 X M M M M M M M M M1983 X M M M M M M M M M1984 X M M M M M M M M M1985 X M M M M M M M M M1986 M M M M M M M M M M1987 M M M M M M M M M M1988 M M M M M M M M M M1989 M M M M M M M M M M1990 M M M M M M M M M M1991 M M M M M M M M M M1992 M M M M M M M M M X1993 M M M M M M M M M X1994 M M M M M M M M M M1995 M M M M M M M M M M1996 X M M M M M M M M X1997 X M M M M M M M M X1998 M M M M M M M M M X1999 M M M M M M M M M X2000 X M X M M M M M M X2001 X M X M M M M M M M2002 X M X M M M M M M X2003 X M X M M M M M M X2004 X M X M M M M M M X2005 X M M M M M M M M X2006 X M M M M M M M M X2007 X M M M M M M M M X

51
sheepmeat
soybean sugar
sunflower tomato wheat wine
1956 M na M na na M X1957 M na M na na M X1958 M na M na na M X1959 M na M na na M X1960 M na M na na M X1961 M na M na na M X1962 M na M na X M na1963 M na M na X M na1964 M na M na M M na1965 M na M na M M na1966 M na M na M M na1967 M na M na M M na1968 M na M na M M na1969 M na M na M M na1970 M na M na M M na1971 M na M na M M na1972 M na M na M M na1973 M na M na M M X1974 M na M na M M X1975 M na M na M M X1976 M na M na M M X1977 M na M na M M X1978 M na M na M M X1979 M na M na M M X1980 M na M na M M X1981 M na M na M M X1982 M na M na M M X1983 M na M na M M X1984 M na M na M M X1985 M na M na M M X1986 M na M na M M X1987 M na M M M M X1988 M na M M M M X1989 M M M M X M X1990 M M M M X M X1991 M M M M X M X1992 M M M M X M X1993 M M M M X M X1994 M M M M X M X1995 M M M M X M X1996 M M M M X X X1997 M M M M X X X1998 M M M M X X X1999 M M M M X X X2000 M M M M X X X2001 M M M M X X X2002 M M M M X X X2003 M M M M X X X2004 M M M M X X X2005 M M M M X X X2006 M M M M X X X2007 M M M M X X X
a. Exportables (X), import-competing products (M) and nontradables (H). Source: Anderson and Valenzuela (2008), based on author’s spreadsheet
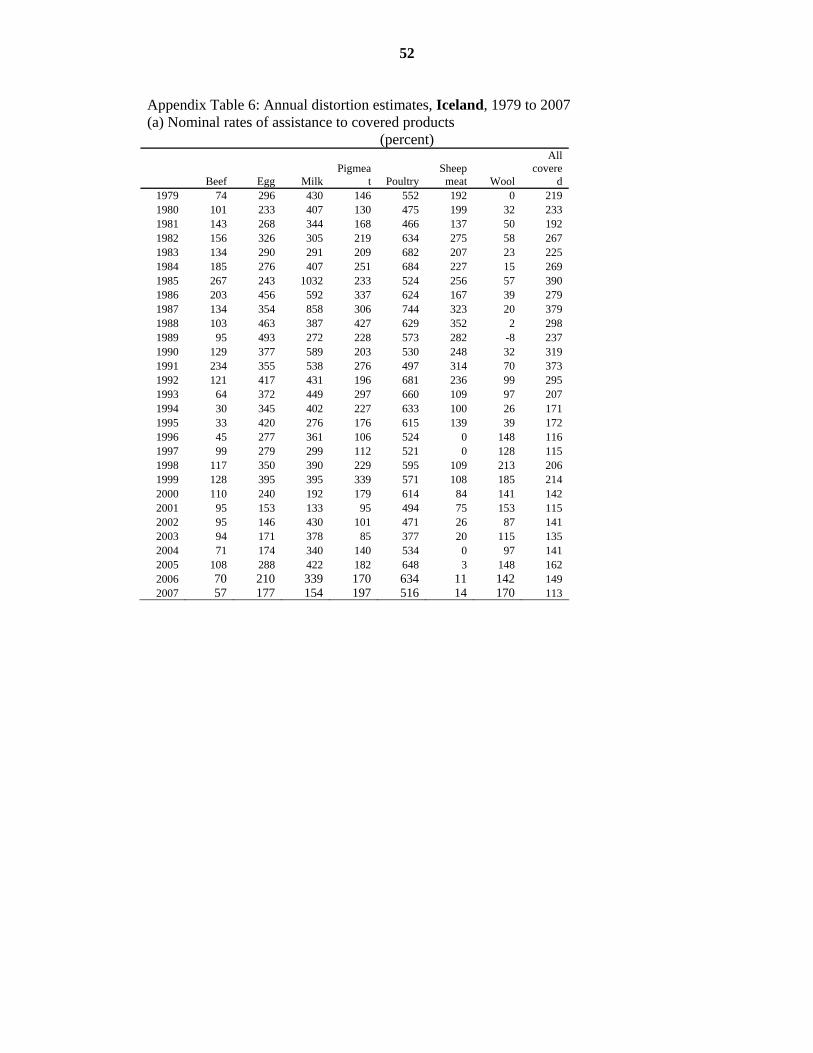
52
Appendix Table 6: Annual distortion estimates, Iceland, 1979 to 2007 (a) Nominal rates of assistance to covered products
(percent)
Beef Egg Milk Pigmea
t Poultry Sheep
meat Wool
All covere
d 1979 74 296 430 146 552 192 0 219 1980 101 233 407 130 475 199 32 233 1981 143 268 344 168 466 137 50 192 1982 156 326 305 219 634 275 58 267 1983 134 290 291 209 682 207 23 225 1984 185 276 407 251 684 227 15 269 1985 267 243 1032 233 524 256 57 390 1986 203 456 592 337 624 167 39 279 1987 134 354 858 306 744 323 20 379 1988 103 463 387 427 629 352 2 298 1989 95 493 272 228 573 282 -8 237 1990 129 377 589 203 530 248 32 319 1991 234 355 538 276 497 314 70 373 1992 121 417 431 196 681 236 99 295 1993 64 372 449 297 660 109 97 207 1994 30 345 402 227 633 100 26 171 1995 33 420 276 176 615 139 39 172 1996 45 277 361 106 524 0 148 116 1997 99 279 299 112 521 0 128 115 1998 117 350 390 229 595 109 213 206 1999 128 395 395 339 571 108 185 214 2000 110 240 192 179 614 84 141 142 2001 95 153 133 95 494 75 153 115 2002 95 146 430 101 471 26 87 141 2003 94 171 378 85 377 20 115 135 2004 71 174 340 140 534 0 97 141 2005 108 288 422 182 648 3 148 162 2006 70 210 339 170 634 11 142 149 2007 57 177 154 197 516 14 170 113

53
Appendix Table 6 (continued): Annual distortion estimates, Iceland, 1979 to 2007 (b) Nominal and relative rates of assistance to alla agricultural products, to exportableb and import-competing b agricultural industries, and relativec to non-agricultural industries (percent)
NRA, all agric products,a by component NRA, agric tradables
NRA, covere
d produc
ts (1)
NRA, non-
covered
products
(2)
NRA, non-
product-specific support
(3)
NRA, all ag
products (incl NPS)
(4)=1+2+3
NRA, all ag products (incl NPS
and decoupled)
(5)
NRA, ag export- ables (6)
NRA, ag import- competi
ng (7)
NRA, all agric
tradable goods c (8)=6+7
NRA, all non-ag tradable goods
(9) RRAb
(10) 1979 219 219 10 229 229 na 229 229 10 1991980 233 233 11 243 245 na 243 243 10 2131981 192 192 10 202 202 na 202 202 10 1751982 267 267 15 282 282 na 282 282 11 2441983 225 225 17 242 243 na 242 242 11 2091984 269 269 20 290 290 684 262 290 9 2591985 390 390 43 434 435 292 411 434 9 3921986 279 279 25 303 303 276 337 303 6 2801987 379 379 26 405 408 341 539 405 6 3761988 298 298 23 321 324 370 161 321 6 2981989 237 237 27 264 266 226 246 264 6 2431990 319 319 26 345 348 213 437 345 4 3291991 373 373 21 394 397 418 288 394 4 3761992 295 295 14 310 311 313 266 310 4 2951993 207 207 9 216 216 70 264 216 4 2041994 171 171 8 179 179 29 239 179 4 1691995 172 172 7 179 179 218 156 179 4 1691996 116 116 7 123 149 150 107 123 4 1151997 115 115 6 121 147 49 234 121 6 1091998 206 206 12 218 247 154 284 218 4 2051999 214 214 9 223 253 157 377 223 4 2102000 142 142 8 149 175 100 201 149 4 1402001 115 115 7 122 155 107 126 122 3 1152002 141 141 8 150 179 70 362 150 3 1422003 135 135 10 146 179 60 277 146 3 1392004 141 141 12 153 185 68 247 153 3 1462005 162 162 16 178 211 83 308 178 2 1722006 149 149 10 159 194 91 235 159 2 1532007 113 113 8 121 155 96 131 121 2 116
a. NRAs including assistance to nontradables and via inputs and other forms of non-product-specific (NPS) assistance without and (in column (5)) with decoupled support. b. The Relative Rate of Assistance (RRA) is defined as 100*[(100+NRAagt)/ (100+NRAnonagt)-1], where NRAagt and NRAnonagt are the percentage NRAs for the tradables parts of the agricultural and non-agricultural sectors (columns 8 and 9), respectively, so it excludes decoupled payments but includes all NPS support. c. Including NPS but excluding decoupled payments, so more than the weighted average of columns (6) and (7).

54
Appendix Table 6 (continued): Annual distortion estimates, Iceland, 1979 to 2007 (c) Value shares of primary production of covereda and non-covered products,
(percent)
Beef Egg Milk Pigmea
t Poultry Sheep
meat Wool
Non- covere
d 1979 10 3 19 2 1 37 8 20 1980 7 4 20 3 1 39 6 20 1981 6 3 19 2 1 44 5 20 1982 6 4 25 3 1 37 5 20 1983 7 4 27 3 1 34 5 20 1984 6 4 23 4 1 34 7 20 1985 7 6 15 5 3 38 6 20 1986 8 3 17 4 2 42 6 19 1987 12 4 15 5 2 35 7 20 1988 12 2 27 4 1 26 9 20 1989 11 2 31 5 1 25 6 19 1990 13 3 23 7 2 32 5 15 1991 10 4 28 7 2 32 3 15 1992 15 3 32 8 2 18 5 17 1993 19 4 16 7 2 27 4 23 1994 19 4 15 8 2 24 6 24 1995 16 3 19 9 2 19 6 26 1996 13 3 13 9 2 30 2 28 1997 9 3 15 9 2 34 2 26 1998 10 2 16 7 3 37 2 23 1999 10 2 16 6 3 39 2 22 2000 9 2 22 7 2 42 2 13 2001 7 2 23 10 3 35 2 17 2002 7 3 14 9 3 38 1 24 2003 8 4 18 9 4 41 2 15 2004 10 3 21 9 3 34 3 18 2005 10 2 17 8 4 40 2 16 2006 12 3 20 10 4 37 2 12 2007 12 3 30 8 4 31 2 12
a. At farmgate undistorted prices

55
Appendix Table 6 (continued): Annual distortion estimates, Iceland, 1979 to 2007 (d) Trade status of of covered productsa
Beef Egg Milk Pigme
at Poultr
y Sheepmeat Wool
1979 M M M M M M M1980 M M M M M M M1981 M M M M M M M1982 M M M M M M M1983 M M M M M M M1984 M M M M X M M1985 M X M X X M M1986 X X X M X X X1987 M X M X X X H1988 M M X M M X M1989 X M M M M X M1990 X M M M M X M1991 M M X M M X H1992 X M X M M M X1993 X M M M M M X1994 X M M M M M X1995 M X M X X M X1996 M X M X M M X1997 X M M M X X X1998 M M M X X X M1999 X M M X X X M2000 M M M X M X X2001 M M M X X X X2002 X M M X X X M2003 M M M X X X X2004 M M M X X X X2005 M M M X X X X2006 M M M X X X X2007 M M M X X X X
a. Exportables (X), import-competing products (M) and nontradables (H). Source: Anderson and Valenzuela (2008), based on author’s spreadsheet
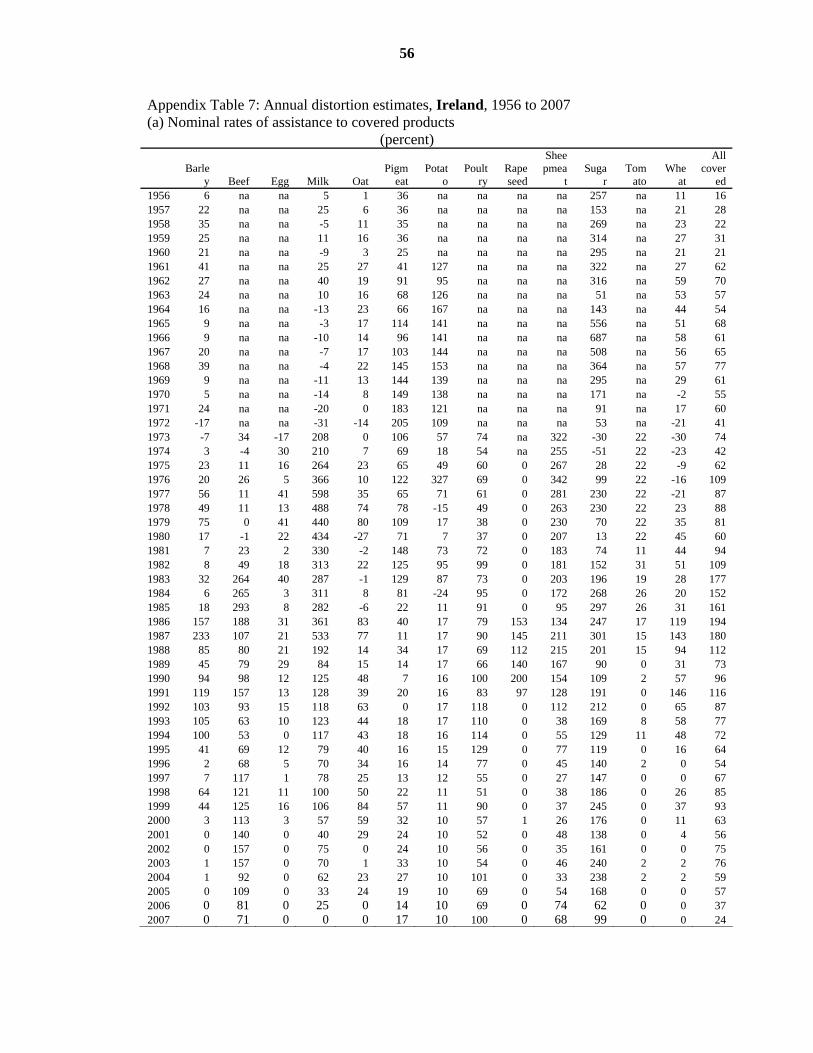
56
Appendix Table 7: Annual distortion estimates, Ireland, 1956 to 2007 (a) Nominal rates of assistance to covered products
(percent)
Barle
y Beef Egg Milk Oat Pigm
eat Potat
o Poult
ry Rapeseed
Sheepmea
t Suga
r Tom
ato Whe
at
All cover
ed 1956 6 na na 5 1 36 na na na na 257 na 11 16 1957 22 na na 25 6 36 na na na na 153 na 21 28 1958 35 na na -5 11 35 na na na na 269 na 23 22 1959 25 na na 11 16 36 na na na na 314 na 27 31 1960 21 na na -9 3 25 na na na na 295 na 21 21 1961 41 na na 25 27 41 127 na na na 322 na 27 62 1962 27 na na 40 19 91 95 na na na 316 na 59 70 1963 24 na na 10 16 68 126 na na na 51 na 53 57 1964 16 na na -13 23 66 167 na na na 143 na 44 54 1965 9 na na -3 17 114 141 na na na 556 na 51 68 1966 9 na na -10 14 96 141 na na na 687 na 58 61 1967 20 na na -7 17 103 144 na na na 508 na 56 65 1968 39 na na -4 22 145 153 na na na 364 na 57 77 1969 9 na na -11 13 144 139 na na na 295 na 29 61 1970 5 na na -14 8 149 138 na na na 171 na -2 55 1971 24 na na -20 0 183 121 na na na 91 na 17 60 1972 -17 na na -31 -14 205 109 na na na 53 na -21 41 1973 -7 34 -17 208 0 106 57 74 na 322 -30 22 -30 74 1974 3 -4 30 210 7 69 18 54 na 255 -51 22 -23 42 1975 23 11 16 264 23 65 49 60 0 267 28 22 -9 62 1976 20 26 5 366 10 122 327 69 0 342 99 22 -16 109 1977 56 11 41 598 35 65 71 61 0 281 230 22 -21 87 1978 49 11 13 488 74 78 -15 49 0 263 230 22 23 88 1979 75 0 41 440 80 109 17 38 0 230 70 22 35 81 1980 17 -1 22 434 -27 71 7 37 0 207 13 22 45 60 1981 7 23 2 330 -2 148 73 72 0 183 74 11 44 94 1982 8 49 18 313 22 125 95 99 0 181 152 31 51 109 1983 32 264 40 287 -1 129 87 73 0 203 196 19 28 177 1984 6 265 3 311 8 81 -24 95 0 172 268 26 20 152 1985 18 293 8 282 -6 22 11 91 0 95 297 26 31 161 1986 157 188 31 361 83 40 17 79 153 134 247 17 119 194 1987 233 107 21 533 77 11 17 90 145 211 301 15 143 180 1988 85 80 21 192 14 34 17 69 112 215 201 15 94 112 1989 45 79 29 84 15 14 17 66 140 167 90 0 31 73 1990 94 98 12 125 48 7 16 100 200 154 109 2 57 96 1991 119 157 13 128 39 20 16 83 97 128 191 0 146 116 1992 103 93 15 118 63 0 17 118 0 112 212 0 65 87 1993 105 63 10 123 44 18 17 110 0 38 169 8 58 77 1994 100 53 0 117 43 18 16 114 0 55 129 11 48 72 1995 41 69 12 79 40 16 15 129 0 77 119 0 16 64 1996 2 68 5 70 34 16 14 77 0 45 140 2 0 54 1997 7 117 1 78 25 13 12 55 0 27 147 0 0 67 1998 64 121 11 100 50 22 11 51 0 38 186 0 26 85 1999 44 125 16 106 84 57 11 90 0 37 245 0 37 93 2000 3 113 3 57 59 32 10 57 1 26 176 0 11 63 2001 0 140 0 40 29 24 10 52 0 48 138 0 4 56 2002 0 157 0 75 0 24 10 56 0 35 161 0 0 75 2003 1 157 0 70 1 33 10 54 0 46 240 2 2 76 2004 1 92 0 62 23 27 10 101 0 33 238 2 2 59 2005 0 109 0 33 24 19 10 69 0 54 168 0 0 57 2006 0 81 0 25 0 14 10 69 0 74 62 0 0 37 2007 0 71 0 0 0 17 10 100 0 68 99 0 0 24

57
Appendix Table 7 (continued): Annual distortion estimates, Ireland, 1956 to 2007 (b) Nominal and relative rates of assistance to alla agricultural products, to exportableb and import-competing b agricultural industries, and relativec to non-agricultural industries (percent)
NRA, all agric products,a by component NRA, agric tradables
NRA, covere
d produc
ts (1)
NRA, non-
covered
products
(2)
NRA, non-
product-specific support
(3)
NRA, all ag
products (incl NPS)
(4)=1+2+3
NRA, all ag products (incl NPS
and decoupled)
(5)
NRA, ag export- ables (6)
NRA, ag import- competi
ng (7)
NRA, all agric
tradable goods c (8)=6+7
NRA, all non-ag tradable goods
(9) RRAb
(10) 1956 16 6 na 14 14 13 14 14 12 11957 28 11 na 23 23 24 23 23 13 91958 22 11 na 19 19 10 32 19 12 61959 31 13 na 26 26 18 34 26 11 141960 21 9 na 17 17 7 27 17 9 71961 62 20 na 48 48 56 38 48 9 371962 70 22 na 54 54 64 41 54 9 421963 57 16 na 43 43 55 26 43 8 321964 54 16 na 41 41 47 30 41 8 301965 68 18 na 50 50 62 32 50 8 391966 61 17 na 44 44 52 31 44 9 321967 65 19 na 47 47 52 41 47 9 351968 77 24 na 58 58 62 50 58 8 461969 61 16 na 45 45 58 26 45 7 351970 55 12 na 39 39 58 14 39 7 301971 60 14 na 43 43 58 23 43 7 341972 41 5 na 28 28 55 -7 28 7 201973 74 41 na 66 66 29 76 66 6 571974 42 33 na 40 40 33 42 40 3 361975 62 48 na 59 59 58 59 59 5 511976 109 76 na 102 102 125 98 102 1 1001977 87 71 na 83 83 94 81 83 0 821978 88 71 na 84 84 92 82 84 0 831979 81 70 12 91 92 105 73 91 0 901980 60 65 12 73 75 68 60 73 0 721981 94 68 10 98 100 56 99 98 0 971982 109 71 10 110 112 57 115 110 0 1091983 177 90 9 163 165 69 183 163 1 1611984 152 78 8 141 143 46 167 141 1 1401985 161 83 10 150 153 61 166 150 1 1491986 194 104 3 173 175 130 176 173 0 1721987 180 112 3 166 168 167 162 166 0 1651988 112 59 3 102 105 77 102 102 1 1011989 73 36 3 66 70 36 68 66 1 661990 96 48 4 87 91 52 88 87 0 861991 116 57 5 105 110 54 107 105 0 1041992 87 45 5 81 89 51 80 81 0 811993 77 41 5 73 85 54 70 73 1 721994 72 38 4 68 83 50 66 68 1 671995 64 32 5 61 77 35 59 61 1 601996 54 27 4 51 67 18 54 51 1 501997 67 33 4 63 79 23 67 63 1 621998 85 42 4 78 95 39 80 78 1 771999 93 46 4 85 102 44 87 85 1 842000 63 31 3 58 76 18 64 58 1 582001 56 29 4 53 70 12 58 53 1 522002 75 37 5 70 87 20 77 70 1 692003 76 39 5 71 91 18 80 71 1 702004 59 28 4 55 73 13 61 55 1 542005 57 28 4 47 66 0 67 47 1 472006 37 19 4 33 54 0 42 33 1 322007 24 12 4 22 41 0 30 22 1 22

58
a. NRAs including assistance to nontradables and via inputs and other forms of non-product-specific (NPS) assistance without and (in column (5)) with decoupled support. b. The Relative Rate of Assistance (RRA) is defined as 100*[(100+NRAagt)/ (100+NRAnonagt)-1], where NRAagt and NRAnonagt are the percentage NRAs for the tradables parts of the agricultural and non-agricultural sectors (columns 8 and 9), respectively, so it excludes decoupled payments but includes all NPS support. c. Including NPS but excluding decoupled payments, so more than the weighted average of columns (6) and (7).

59
Appendix Table 7 (continued): Annual distortion estimates, Ireland, 1956 to 2007 (c) Value shares of primary production of covereda and non-covered products,
(percent)
Barle
y Beef Egg Milk Oat Pigm
eat Potat
o Poult
ry Rapeseed
Sheepmea
t Suga
r Tom
ato Whe
at
Non-cover
ed 1956 8 na na 23 15 14 na na na na 1 na 12 27 1957 9 na na 21 11 15 na na na na 3 na 14 28 1958 7 na na 26 11 19 na na na na 2 na 9 27 1959 10 na na 21 11 18 na na na na 2 na 10 28 1960 9 na na 16 11 20 na na na na 2 na 12 31 1961 8 na na 10 6 16 16 na na na 1 na 10 33 1962 10 na na 9 7 13 19 na na na 2 na 7 33 1963 10 na na 12 6 14 15 na na na 4 na 5 34 1964 10 na na 16 5 16 11 na na na 3 na 5 35 1965 11 na na 15 5 15 13 na na na 1 na 4 36 1966 11 na na 16 5 14 13 na na na 1 na 3 37 1967 10 na na 17 5 11 13 na na na 1 na 5 38 1968 10 na na 18 4 12 11 na na na 2 na 7 37 1969 12 na na 18 4 14 10 na na na 2 na 6 36 1970 12 na na 17 3 13 10 na na na 2 na 7 36 1971 11 na na 17 3 12 10 na na na 4 na 6 37 1972 15 na na 18 3 13 7 na na na 3 na 6 36 1973 9 23 3 13 2 7 6 2 na 4 4 1 4 23 1974 8 36 2 11 1 6 4 1 na 3 3 1 3 21 1975 7 41 2 10 1 5 4 1 0 3 2 1 2 21 1976 8 35 2 11 1 5 5 2 0 3 2 1 3 23 1977 8 41 1 7 1 6 6 2 0 3 1 1 3 22 1978 8 42 2 9 1 6 4 2 0 3 1 1 2 21 1979 7 43 1 10 0 5 4 2 0 3 2 1 2 21 1980 10 43 1 8 1 5 3 2 0 3 2 1 1 19 1981 13 31 2 14 1 5 2 2 0 4 2 1 2 22 1982 13 29 1 15 1 5 3 2 0 4 1 0 2 23 1983 13 15 2 21 1 6 4 3 0 4 2 1 4 27 1984 15 14 2 18 1 6 5 2 0 4 1 0 5 26 1985 11 15 2 21 1 8 3 2 0 5 1 0 4 26 1986 6 26 1 19 1 8 3 3 0 5 1 0 2 26 1987 4 33 2 13 1 9 4 3 0 3 1 0 2 25 1988 5 29 1 22 1 5 2 3 0 3 1 0 2 25 1989 5 23 1 30 1 6 2 2 0 3 1 0 2 24 1990 4 24 1 25 1 8 3 2 0 4 1 0 2 25 1991 3 20 1 26 1 8 3 2 0 5 1 0 2 27 1992 3 24 1 24 0 10 2 2 0 5 1 0 2 25 1993 2 27 1 24 0 7 1 2 0 8 1 0 2 24 1994 2 25 1 25 0 8 3 2 0 7 1 0 2 24 1995 3 24 1 28 0 7 4 1 0 5 1 0 2 24 1996 4 22 1 27 0 8 2 2 0 6 1 0 3 24 1997 4 20 1 27 0 9 1 2 0 7 1 0 3 25 1998 2 23 1 26 0 7 2 2 0 7 1 0 2 26 1999 3 24 1 25 0 6 3 2 0 7 1 0 2 26 2000 4 20 1 29 0 7 1 2 0 7 1 0 2 25 2001 4 15 1 34 0 9 1 2 0 6 1 0 2 24 2002 3 16 1 30 1 8 2 3 0 7 1 0 3 26 2003 4 17 1 30 0 6 2 3 0 6 1 0 3 27 2004 4 19 1 31 0 6 2 2 0 6 1 0 3 25 2005 6 27 2 6 0 12 2 4 0 10 1 0 5 24 2006 5 17 2 30 1 7 2 2 0 6 0 0 4 24 2007 9 15 1 28 1 7 3 2 0 6 0 0 5 24 a. At farmgate undistorted prices

60
Appendix Table 7 (continued): Annual distortion estimates, Ireland, 1956 to 2007 (d) Trade status of of covered productsa
Barle
y Beef Egg Milk Oat Pigm
eat Potat
o Poult
ry Rapeseed
Sheepmea
t Sugar Toma
to Whea
t 1956 M na na X M X na na na na M na M1957 M na na X M X na na na na M na M1958 M na na X M X na na na na M na M1959 M na na X M X na na na na M na M1960 M na na X M X na na na na M na M1961 M na na X M X X na na na M na M1962 M na na X M X X na na na M na M1963 M na na X M X X na na na M na M1964 M na na X M X X na na na M na M1965 M na na X M X X na na na M na M1966 M na na X M X X na na na M na M1967 M na na X M X X na na na M na M1968 M na na X M X X na na na M na M1969 M na na X M X X na na na M na M1970 M na na X M X X na na na M na M1971 M na na X M X X na na na M na M1972 M na na X M X X na na na M na M1973 X M M M M M M M na M M M M1974 X M M M M M M M na M M M M1975 X M M M M M M M M M M M M1976 M M M M M M M M M M M M M1977 X M M M M M M M M M M M M1978 X M M M M M M M M M M M M1979 X M M M M M M M M M M M M1980 X M M M M M M M M M M M M1981 X M M M M M M M M M M M M1982 X M M M M M M M M M M M M1983 X M M M M M M M M M M M M1984 X M M M M M M M M M M M M1985 X M M M M M M M M M M M M1986 M M M M M M M M M M M M M1987 M M M M M M M M M M M M M1988 M M M M M M M M M M M M M1989 M M M M M M M M M M M X M1990 M M M M M M M M M M M X M1991 M M M M M M M M M M M X M1992 M M M M M M M M X M M X M1993 M M M M M M M M X M M X M1994 M M M M M M M M M M M X M1995 M M M M M M M M M M M X M1996 X M M M M M M M X M M X X1997 X M M M M M M M X M M X X1998 M M M M M M M M X M M X X1999 M M M M M M M M X M M X X2000 X M X M M M M M X M M X X2001 X M X M M M M M M M M X X2002 X M X M M M M M X M M X X2003 X M X M M M M M X M M X X2004 X M X M M M M M X M M X X2005 X M M M M M M M X M M X X2006 X M M M M M M M X M M X X2007 X M M M M M M M X M M X X
a. Exportables (X), import-competing products (M) and nontradables (H). Source: Anderson and Valenzuela (2008), based on author’s spreadsheet

61
Appendix Table 7: Annual distortion estimates, Italy, 1956 to 2007 (a) Nominal rates of assistance to covered products
(percent)
Barley Beef Egg Maize Milk Oat Pigmea
t Potato Poultry Rapese
ed 1956 -12 -25 5 -17 211 -61 26 na 25 -38 1957 1 -9 24 -24 284 -72 24 na 16 -33 1958 13 -2 25 -11 215 -69 16 na 3 -28 1959 4 -7 6 -21 264 -64 15 na -8 -38 1960 1 26 7 -23 224 -60 1 na -2 -35 1961 17 4 10 -1 325 -61 11 na -5 -43 1962 75 127 22 47 421 49 120 na 80 0 1963 69 103 11 44 339 51 117 na 73 0 1964 60 86 25 41 277 41 87 na 57 0 1965 52 62 32 45 320 48 133 na 61 0 1966 54 51 16 36 296 42 149 na 59 0 1967 69 53 15 49 310 43 129 na 51 0 1968 99 73 20 77 337 54 132 na 51 0 1969 54 73 16 66 307 41 152 na 48 0 1970 54 71 -4 41 308 48 142 na 43 0 1971 89 69 3 48 317 31 136 na 162 0 1972 37 89 -5 73 300 14 114 54 106 0 1973 -7 34 -17 19 208 0 106 57 74 0 1974 3 -4 30 2 210 7 69 18 54 0 1975 23 11 16 22 264 23 65 49 60 0 1976 20 26 5 39 366 10 122 327 69 0 1977 56 11 41 72 598 35 65 71 61 0 1978 49 11 13 81 488 74 78 -15 49 0 1979 75 0 41 67 440 80 109 17 38 0 1980 17 -1 22 62 434 -27 71 7 37 0 1981 7 23 2 43 330 -2 148 73 72 0 1982 8 49 18 66 313 22 125 95 99 0 1983 32 264 40 29 287 -1 129 87 73 0 1984 6 265 3 15 311 8 81 -24 95 0 1985 18 293 8 28 282 -6 22 11 91 0 1986 157 188 31 110 361 83 40 17 79 153 1987 233 107 21 170 533 77 11 17 90 145 1988 85 80 21 79 192 14 34 17 69 112 1989 45 79 29 62 84 15 14 17 66 140 1990 94 98 12 108 125 48 7 16 100 200 1991 119 157 13 120 128 39 20 16 83 97 1992 103 93 15 103 118 63 0 17 118 0 1993 105 63 10 69 123 44 18 17 110 0 1994 100 53 0 45 117 43 18 16 114 0 1995 41 69 12 53 79 40 16 15 129 0 1996 2 68 5 14 70 34 16 14 77 0 1997 7 117 1 19 78 25 13 12 55 0 1998 64 121 11 32 100 50 22 11 51 0 1999 44 125 16 39 106 84 57 11 90 0 2000 3 113 3 27 57 59 32 10 57 1 2001 0 140 0 14 40 29 24 10 52 0 2002 0 157 0 9 75 0 24 10 56 0 2003 1 157 0 34 70 1 33 10 54 0 2004 1 92 0 39 62 23 27 10 101 0 2005 0 109 0 19 33 24 19 10 69 0 2006 0 86 0 19 24 0 14 10 69 02007 0 66 0 23 0 0 17 10 99 0

62
Rice Sheep
meat Soybea
n Sugar Sunflo
wer Tomato Wheat Wine
All covere
d 1956 -53 89 14 -11 5 1 15 -43 4 1957 -54 99 13 -31 15 -2 6 -53 -1 1958 -59 126 13 46 20 23 -3 2 23 1959 -81 120 12 59 9 -13 7 -52 -3 1960 -89 105 12 -30 9 11 23 -53 0 1961 -87 117 11 12 3 -6 9 -33 12 1962 -15 279 na 185 0 22 78 4 52 1963 -20 231 na 13 0 22 86 4 46 1964 -19 226 na 63 0 22 70 4 45 1965 8 203 na 330 0 22 74 4 51 1966 -12 372 na 410 0 22 63 4 49 1967 -24 373 na 319 0 22 64 4 47 1968 -2 382 na 232 0 22 73 4 55 1969 25 386 na 183 0 22 62 4 49 1970 43 372 na 100 0 22 24 4 42 1971 -12 367 na 47 0 22 55 4 50 1972 -31 385 na 46 0 22 -2 4 44 1973 -61 322 0 -30 0 22 -30 4 17 1974 -55 255 0 -51 0 22 -23 4 12 1975 -19 267 0 28 0 22 -9 4 26 1976 0 342 0 99 0 22 -16 4 40 1977 -10 281 0 230 0 22 -21 4 38 1978 16 263 0 230 0 22 23 4 40 1979 -15 230 0 70 0 22 35 4 37 1980 -38 207 0 13 0 22 45 4 34 1981 1 183 0 74 0 11 44 17 51 1982 17 181 0 152 0 31 51 15 64 1983 -10 203 0 196 0 19 28 10 65 1984 41 172 0 268 0 26 20 7 58 1985 105 95 0 297 0 26 31 -25 48 1986 127 134 211 247 144 17 119 9 74 1987 190 211 169 301 150 15 143 9 74 1988 162 215 108 201 96 15 94 7 57 1989 148 167 118 90 150 0 31 6 36 1990 152 154 147 109 143 2 57 8 44 1991 144 128 159 191 111 0 146 9 51 1992 143 112 0 212 0 0 65 13 42 1993 106 38 0 169 0 8 58 13 42 1994 133 55 0 129 0 11 48 10 37 1995 88 77 0 119 0 0 16 4 31 1996 33 45 0 140 0 2 0 4 23 1997 31 27 0 147 0 0 0 5 27 1998 18 38 0 186 0 0 26 3 30 1999 0 37 0 245 0 0 37 2 33 2000 1 26 0 176 0 0 11 2 24 2001 42 48 0 138 0 0 4 2 22 2002 24 35 0 161 0 0 0 2 26 2003 18 46 0 240 0 2 2 2 27 2004 1 33 0 238 0 2 2 1 23 2005 2 54 0 168 0 0 0 2 10 2006 3 74 0 66 0 0 0 1 8 2007 1 68 0 99 0 0 0 1 8

63
Appendix Table 7 (continued): Annual distortion estimates, Italy, 1956 to 2007 (b) Nominal and relative rates of assistance to alla agricultural products, to exportableb and import-competing b agricultural industries, and relativec to non-agricultural industries (percent)
NRA, all agric products,a by component NRA, agric tradables
NRA, covere
d produc
ts (1)
NRA, non-
covered
products
(2)
NRA, non-
product-specific support
(3)
NRA, all ag
products (incl NPS)
(4)=1+2+3
NRA, all ag products (incl NPS
and decoupled)
(5)
NRA, ag export- ables (6)
NRA, ag import- competi
ng (7)
NRA, all agric
tradable goods c (8)=6+7
NRA, all non-ag tradable goods
(9) RRAb
(10) 1956 4 2 na 3 3 -35 36 3 3 01957 -1 1 na -1 -1 -43 41 -1 3 -41958 23 10 na 20 20 -1 36 20 4 151959 -3 1 na -2 -2 -45 43 -2 4 -51960 0 2 na 0 0 -45 50 0 3 -31961 12 7 na 11 11 -31 52 11 3 81962 52 47 na 51 51 14 101 51 3 471963 46 39 na 45 45 13 83 45 3 411964 45 37 na 44 44 12 67 44 3 391965 51 41 na 49 49 14 75 49 2 461966 49 38 na 47 47 13 69 47 2 441967 47 37 na 45 45 11 69 45 2 421968 55 42 na 52 52 13 79 52 2 501969 49 40 na 47 47 13 72 47 1 451970 42 32 na 40 40 11 58 40 1 381971 50 38 na 48 48 13 70 48 1 461972 44 31 na 42 42 9 60 42 1 401973 17 11 na 16 16 -1 27 16 1 151974 12 9 na 12 12 1 17 12 1 111975 26 19 na 24 24 8 33 24 1 241976 40 26 na 37 37 12 47 37 0 371977 38 28 na 37 37 13 48 37 0 361978 40 30 na 38 38 15 50 38 0 381979 37 31 12 48 50 15 47 48 0 481980 34 28 12 45 47 14 40 45 0 451981 51 34 10 58 59 28 55 58 0 581982 64 42 9 69 71 29 72 69 0 691983 65 42 9 69 72 21 79 69 0 691984 58 37 8 62 64 20 69 62 0 621985 48 39 10 56 59 2 67 56 0 561986 74 55 3 74 76 31 90 74 0 741987 74 58 3 74 77 36 87 74 0 741988 57 40 3 58 60 27 66 58 0 581989 36 23 3 36 39 11 53 36 0 361990 44 30 4 45 48 15 66 45 0 451991 51 36 5 54 58 15 82 54 0 541992 42 32 5 45 52 18 61 45 0 451993 42 31 5 45 58 20 58 45 0 451994 37 28 4 39 54 18 51 39 0 391995 31 24 5 34 51 10 47 34 0 341996 23 16 4 25 42 7 38 25 0 251997 27 19 4 30 46 7 44 30 0 301998 30 23 4 33 49 8 54 33 0 331999 33 27 4 36 53 9 66 36 0 362000 24 17 3 26 43 5 47 26 0 262001 22 15 4 24 41 4 40 24 0 242002 26 18 5 29 46 5 50 29 0 292003 27 19 5 30 49 5 55 30 0 302004 23 18 4 27 45 4 49 27 0 272005 10 5 4 12 31 1 31 12 0 122006 8 5 4 11 32 1 24 11 0 112007 8 4 4 10 29 0 21 10 0 10
64
a. NRAs including assistance to nontradables and via inputs and other forms of non-product-specific (NPS) assistance without and (in column (5)) with decoupled support. b. The Relative Rate of Assistance (RRA) is defined as 100*[(100+NRAagt)/ (100+NRAnonagt)-1], where NRAagt and NRAnonagt are the percentage NRAs for the tradables parts of the agricultural and non-agricultural sectors (columns 8 and 9), respectively, so it excludes decoupled payments but includes all NPS support. c. Including NPS but excluding decoupled payments, so more than the weighted average of columns (6) and (7).

65
Appendix Table 7 (continued): Annual distortion estimates, Italy, 1956 to 2007 (c) Value shares of primary production of covereda and non-covered products,
(percent)
Barley Beef Egg Maize Milk Oat Pigmea
t Potato Poultry Rapese
ed 1956 1 2 1 6 7 1 5 na 0 0 1957 1 2 1 5 6 1 5 na 1 0 1958 1 2 1 5 9 1 5 na 1 0 1959 1 2 1 5 7 1 5 na 1 0 1960 0 2 1 5 8 1 6 na 1 0 1961 0 2 1 4 6 1 6 na 1 0 1962 0 5 4 3 3 1 3 na 3 0 1963 0 6 5 4 3 1 3 na 4 0 1964 0 6 4 4 4 0 4 na 4 0 1965 0 8 5 4 4 1 3 na 5 0 1966 0 9 5 4 4 0 3 na 5 0 1967 0 10 4 4 4 1 3 na 4 0 1968 0 10 4 3 4 0 3 na 5 0 1969 0 10 4 4 3 0 3 na 4 0 1970 0 10 5 4 3 0 3 na 4 0 1971 0 11 5 4 4 0 3 na 3 0 1972 0 10 5 3 4 0 4 1 3 0 1973 0 10 5 4 3 0 3 1 3 0 1974 0 13 3 5 3 0 3 1 4 0 1975 0 11 3 5 3 0 4 1 4 0 1976 1 12 4 5 3 0 4 1 4 0 1977 0 14 3 5 2 0 6 1 5 0 1978 1 13 4 4 2 0 5 1 5 0 1979 0 15 2 4 3 0 4 1 5 0 1980 1 16 3 4 3 1 5 1 5 0 1981 1 14 4 6 4 0 5 1 5 0 1982 1 13 4 6 5 0 5 1 5 0 1983 1 5 3 7 4 0 5 1 5 0 1984 2 5 3 7 4 0 6 1 4 0 1985 1 5 3 6 4 0 8 1 4 0 1986 1 7 3 4 4 0 7 1 5 0 1987 1 9 3 3 3 0 9 1 4 0 1988 1 10 3 4 6 0 7 1 5 0 1989 1 8 2 3 8 0 8 1 4 0 1990 1 8 3 3 7 0 9 1 3 0 1991 1 6 3 3 7 0 8 1 4 0 1992 1 8 3 3 7 0 10 1 3 0 1993 1 10 3 4 8 0 8 1 3 0 1994 0 10 3 4 7 0 7 1 3 0 1995 1 9 2 4 9 0 7 2 2 0 1996 1 7 3 5 8 0 8 1 3 0 1997 1 6 3 5 9 0 9 1 4 0 1998 0 6 2 4 8 0 6 1 3 0 1999 0 6 2 4 8 0 4 1 2 0 2000 1 6 3 5 10 0 6 1 3 0 2001 1 4 3 5 11 0 8 1 3 0 2002 1 5 3 6 9 0 7 1 3 0 2003 0 5 4 4 9 0 7 1 3 0 2004 1 6 3 5 9 0 7 1 2 0 2005 1 2 3 4 3 0 7 1 1 0 2006 1 3 3 4 3 0 8 1 1 0 2007 1 3 2 5 7 0 6 1 1 0
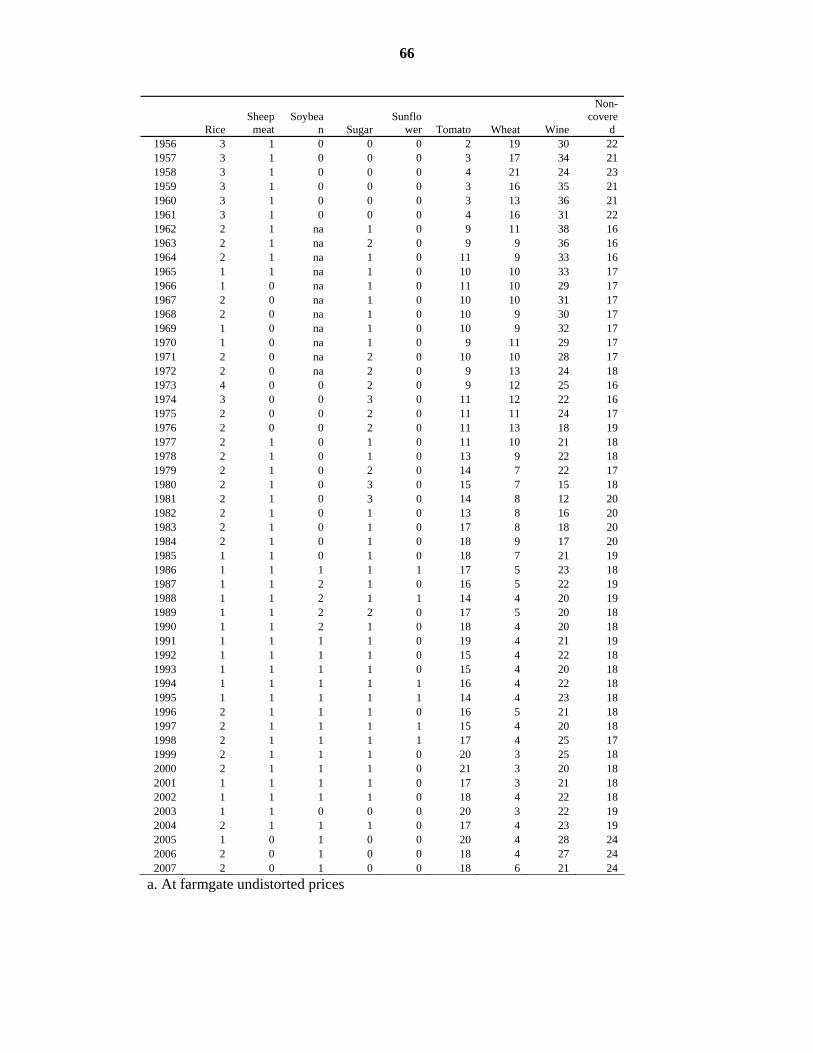
66
Rice Sheep
meat Soybea
n Sugar Sunflo
wer Tomato Wheat Wine
Non-covere
d 1956 3 1 0 0 0 2 19 30 22 1957 3 1 0 0 0 3 17 34 21 1958 3 1 0 0 0 4 21 24 23 1959 3 1 0 0 0 3 16 35 21 1960 3 1 0 0 0 3 13 36 21 1961 3 1 0 0 0 4 16 31 22 1962 2 1 na 1 0 9 11 38 16 1963 2 1 na 2 0 9 9 36 16 1964 2 1 na 1 0 11 9 33 16 1965 1 1 na 1 0 10 10 33 17 1966 1 0 na 1 0 11 10 29 17 1967 2 0 na 1 0 10 10 31 17 1968 2 0 na 1 0 10 9 30 17 1969 1 0 na 1 0 10 9 32 17 1970 1 0 na 1 0 9 11 29 17 1971 2 0 na 2 0 10 10 28 17 1972 2 0 na 2 0 9 13 24 18 1973 4 0 0 2 0 9 12 25 16 1974 3 0 0 3 0 11 12 22 16 1975 2 0 0 2 0 11 11 24 17 1976 2 0 0 2 0 11 13 18 19 1977 2 1 0 1 0 11 10 21 18 1978 2 1 0 1 0 13 9 22 18 1979 2 1 0 2 0 14 7 22 17 1980 2 1 0 3 0 15 7 15 18 1981 2 1 0 3 0 14 8 12 20 1982 2 1 0 1 0 13 8 16 20 1983 2 1 0 1 0 17 8 18 20 1984 2 1 0 1 0 18 9 17 20 1985 1 1 0 1 0 18 7 21 19 1986 1 1 1 1 1 17 5 23 18 1987 1 1 2 1 0 16 5 22 19 1988 1 1 2 1 1 14 4 20 19 1989 1 1 2 2 0 17 5 20 18 1990 1 1 2 1 0 18 4 20 18 1991 1 1 1 1 0 19 4 21 19 1992 1 1 1 1 0 15 4 22 18 1993 1 1 1 1 0 15 4 20 18 1994 1 1 1 1 1 16 4 22 18 1995 1 1 1 1 1 14 4 23 18 1996 2 1 1 1 0 16 5 21 18 1997 2 1 1 1 1 15 4 20 18 1998 2 1 1 1 1 17 4 25 17 1999 2 1 1 1 0 20 3 25 18 2000 2 1 1 1 0 21 3 20 18 2001 1 1 1 1 0 17 3 21 18 2002 1 1 1 1 0 18 4 22 18 2003 1 1 0 0 0 20 3 22 19 2004 2 1 1 1 0 17 4 23 19 2005 1 0 1 0 0 20 4 28 24 2006 2 0 1 0 0 18 4 27 24 2007 2 0 1 0 0 18 6 21 24
a. At farmgate undistorted prices

67
Appendix Table 7 (continued): Annual distortion estimates, Italy, 1956 to 2007 (d) Trade status of of covered productsa
Barley Beef Egg Maize Milk Oat Pigme
at Potato Poultr
y Rapes
eed 1956 M M M M M M M na M M1957 M M M M M M M na M M1958 M M M M M M M na M M1959 M M M M M M M na M M1960 M M M M M M M na M M1961 M M M M M M M na M M1962 M M M M M M M na M X1963 M M M M M M M na M M1964 M M M M M M M na M X1965 M M M M M M M na M M1966 M M M M M M M na M M1967 M M M M M M M na M M1968 M M M M M M M na M M1969 M M M M M M M na M M1970 M M M M M M M na M M1971 X M M M M M M na M M1972 X M M M M M M M M M1973 X M M M M M M M M M1974 X M M M M M M M M M1975 X M M M M M M M M M1976 M M M M M M M M M M1977 X M M M M M M M M M1978 X M M M M M M M M M1979 X M M M M M M M M M1980 X M M M M M M M M M1981 X M M M M M M M M M1982 X M M M M M M M M M1983 X M M M M M M M M M1984 X M M M M M M M M M1985 X M M M M M M M M M1986 M M M M M M M M M M1987 M M M M M M M M M M1988 M M M M M M M M M M1989 M M M M M M M M M M1990 M M M M M M M M M M1991 M M M M M M M M M M1992 M M M M M M M M M X1993 M M M M M M M M M X1994 M M M M M M M M M M1995 M M M M M M M M M M1996 X M M M M M M M M X1997 X M M M M M M M M X1998 M M M M M M M M M X1999 M M M M M M M M M X2000 X M X M M M M M M X2001 X M X M M M M M M M2002 X M X M M M M M M X2003 X M X M M M M M M X2004 X M X M M M M M M X2005 X M M M M M M M M X2006 X M M M M M M M M X2007 X M M M M M M M M X

68
Rice Sheepmeat
Soybean Sugar
Sunflower
Tomato Wheat Wine
1956 X M M M M X M X1957 X M M M M X M X1958 X M M M M X M X1959 X M M M M X M X1960 X M M M M X M X1961 X M M M M X M X1962 X M na M M X M X1963 X M na M M X M X1964 X M na M M M M X1965 X M na M M M M X1966 X M na M M M M X1967 X M na M M M M X1968 X M na M M M M X1969 X M na M M M M X1970 X M na M M M M X1971 X M na M M M M X1972 X M na M M M M X1973 X M M M M M M X1974 X M M M M M M X1975 X M M M X M M X1976 X M M M M M M X1977 X M M M M M M X1978 X M M M M M M X1979 X M M M M M M X1980 X M M M M M M X1981 X M M M X M M X1982 X M M M X M M X1983 X M M M X M M X1984 X M M M X M M X1985 X M M M X M M X1986 X M M M M M M X1987 X M M M M M M X1988 X M M M M M M X1989 X M M M M X M X1990 X M M M M X M X1991 X M M M M X M X1992 X M M M M X M X1993 X M M M M X M X1994 X M M M M X M X1995 X M M M M X M X1996 X M M M M X X X1997 X M M M M X X X1998 X M M M M X X X1999 X M M M M X X X2000 X M M M M X X X2001 X M M M M X X X2002 X M M M M X X X2003 X M M M M X X X2004 X M M M M X X X2005 X M M M M X X X2006 X M M M M X X X2007 X M M M M X X X
a. Exportables (X), import-competing products (M) and nontradables (H). Source: Anderson and Valenzuela (2008), based on author’s spreadsheet
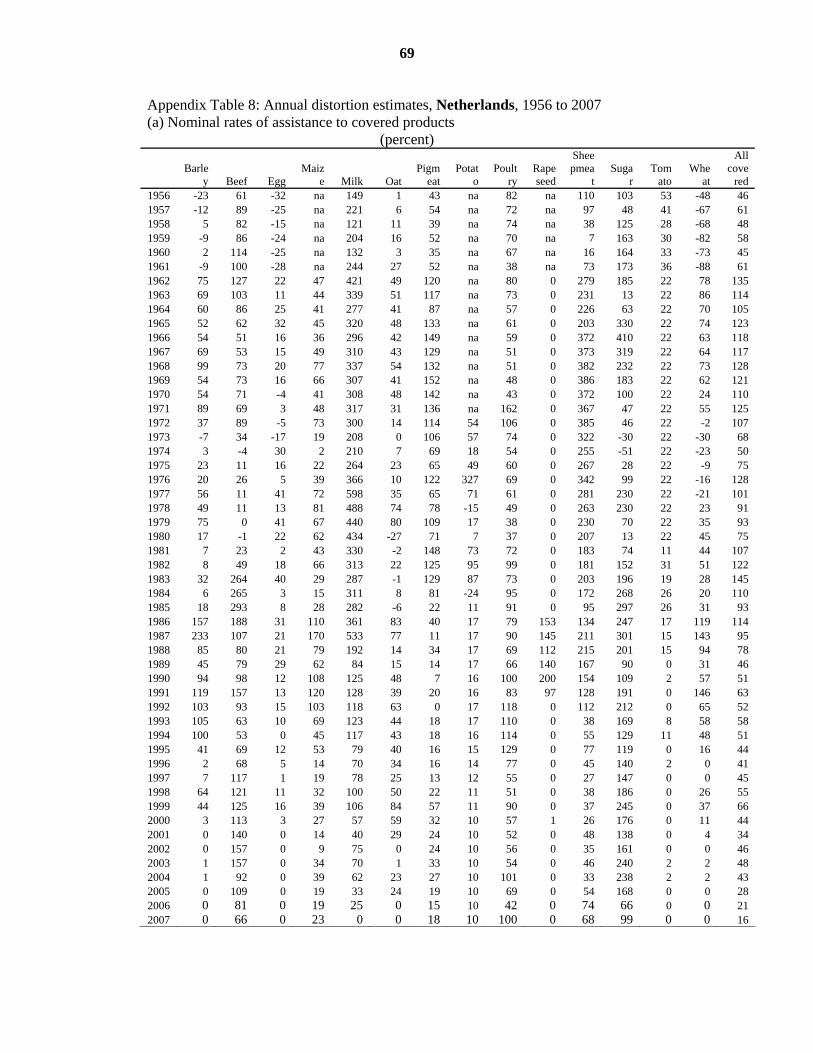
69
Appendix Table 8: Annual distortion estimates, Netherlands, 1956 to 2007 (a) Nominal rates of assistance to covered products
(percent)
Barle
y Beef Egg Maiz
e Milk Oat Pigm
eat Potat
o Poult
ry Rapeseed
Sheepmea
t Suga
r Tom
ato Whe
at
All cove
red 1956 -23 61 -32 na 149 1 43 na 82 na 110 103 53 -48 46 1957 -12 89 -25 na 221 6 54 na 72 na 97 48 41 -67 61 1958 5 82 -15 na 121 11 39 na 74 na 38 125 28 -68 48 1959 -9 86 -24 na 204 16 52 na 70 na 7 163 30 -82 58 1960 2 114 -25 na 132 3 35 na 67 na 16 164 33 -73 45 1961 -9 100 -28 na 244 27 52 na 38 na 73 173 36 -88 61 1962 75 127 22 47 421 49 120 na 80 0 279 185 22 78 135 1963 69 103 11 44 339 51 117 na 73 0 231 13 22 86 114 1964 60 86 25 41 277 41 87 na 57 0 226 63 22 70 105 1965 52 62 32 45 320 48 133 na 61 0 203 330 22 74 123 1966 54 51 16 36 296 42 149 na 59 0 372 410 22 63 118 1967 69 53 15 49 310 43 129 na 51 0 373 319 22 64 117 1968 99 73 20 77 337 54 132 na 51 0 382 232 22 73 128 1969 54 73 16 66 307 41 152 na 48 0 386 183 22 62 121 1970 54 71 -4 41 308 48 142 na 43 0 372 100 22 24 110 1971 89 69 3 48 317 31 136 na 162 0 367 47 22 55 125 1972 37 89 -5 73 300 14 114 54 106 0 385 46 22 -2 107 1973 -7 34 -17 19 208 0 106 57 74 0 322 -30 22 -30 68 1974 3 -4 30 2 210 7 69 18 54 0 255 -51 22 -23 50 1975 23 11 16 22 264 23 65 49 60 0 267 28 22 -9 75 1976 20 26 5 39 366 10 122 327 69 0 342 99 22 -16 128 1977 56 11 41 72 598 35 65 71 61 0 281 230 22 -21 101 1978 49 11 13 81 488 74 78 -15 49 0 263 230 22 23 91 1979 75 0 41 67 440 80 109 17 38 0 230 70 22 35 93 1980 17 -1 22 62 434 -27 71 7 37 0 207 13 22 45 75 1981 7 23 2 43 330 -2 148 73 72 0 183 74 11 44 107 1982 8 49 18 66 313 22 125 95 99 0 181 152 31 51 122 1983 32 264 40 29 287 -1 129 87 73 0 203 196 19 28 145 1984 6 265 3 15 311 8 81 -24 95 0 172 268 26 20 110 1985 18 293 8 28 282 -6 22 11 91 0 95 297 26 31 93 1986 157 188 31 110 361 83 40 17 79 153 134 247 17 119 114 1987 233 107 21 170 533 77 11 17 90 145 211 301 15 143 95 1988 85 80 21 79 192 14 34 17 69 112 215 201 15 94 78 1989 45 79 29 62 84 15 14 17 66 140 167 90 0 31 46 1990 94 98 12 108 125 48 7 16 100 200 154 109 2 57 51 1991 119 157 13 120 128 39 20 16 83 97 128 191 0 146 63 1992 103 93 15 103 118 63 0 17 118 0 112 212 0 65 52 1993 105 63 10 69 123 44 18 17 110 0 38 169 8 58 58 1994 100 53 0 45 117 43 18 16 114 0 55 129 11 48 51 1995 41 69 12 53 79 40 16 15 129 0 77 119 0 16 44 1996 2 68 5 14 70 34 16 14 77 0 45 140 2 0 41 1997 7 117 1 19 78 25 13 12 55 0 27 147 0 0 45 1998 64 121 11 32 100 50 22 11 51 0 38 186 0 26 55 1999 44 125 16 39 106 84 57 11 90 0 37 245 0 37 66 2000 3 113 3 27 57 59 32 10 57 1 26 176 0 11 44 2001 0 140 0 14 40 29 24 10 52 0 48 138 0 4 34 2002 0 157 0 9 75 0 24 10 56 0 35 161 0 0 46 2003 1 157 0 34 70 1 33 10 54 0 46 240 2 2 48 2004 1 92 0 39 62 23 27 10 101 0 33 238 2 2 43 2005 0 109 0 19 33 24 19 10 69 0 54 168 0 0 28 2006 0 81 0 19 25 0 15 10 42 0 74 66 0 0 21 2007 0 66 0 23 0 0 18 10 100 0 68 99 0 0 16

70
Appendix Table 8 (continued): Annual distortion estimates, Netherlands, 1956 to 2007 (b) Nominal and relative rates of assistance to alla agricultural products, to exportableb and import-competing b agricultural industries, and relativec to non-agricultural industries (percent)
NRA, all agric products,a by component NRA, agric tradables
NRA, covere
d produc
ts (1)
NRA, non-
covered
products
(2)
NRA, non-
product-specific support
(3)
NRA, all ag
products (incl NPS)
(4)=1+2+3
NRA, all ag products (incl NPS
and decoupled)
(5)
NRA, ag export- ables (6)
NRA, ag import- competi
ng (7)
NRA, all agric
tradable goods c (8)=6+7
NRA, all non-ag tradable goods
(9) RRAb
(10) 1956 46 14 na 38 38 27 39 38 3 341957 61 16 na 48 48 37 50 48 3 441958 48 16 na 39 39 29 41 39 3 351959 58 19 na 47 47 32 51 47 3 431960 45 11 na 36 36 25 38 36 3 331961 61 20 na 50 50 32 54 50 3 461962 135 64 na 114 114 63 126 114 3 1081963 114 53 na 97 97 54 106 97 3 921964 105 50 na 90 90 62 94 90 3 841965 123 60 na 106 106 74 111 106 3 1001966 118 58 na 101 101 68 107 101 3 951967 117 55 na 100 100 63 106 100 4 931968 128 58 na 108 108 65 115 108 3 1021969 121 60 na 104 104 67 110 104 3 981970 110 56 na 95 95 63 100 95 3 901971 125 56 na 106 106 69 113 106 3 1011972 107 53 na 94 94 61 99 94 3 891973 68 34 na 60 60 37 63 60 3 561974 50 28 na 45 45 43 45 45 2 421975 75 41 na 67 67 60 68 67 2 631976 128 67 na 113 113 99 115 113 2 1091977 101 56 na 90 90 87 91 90 2 871978 91 48 na 80 80 67 82 80 2 771979 93 49 12 94 95 73 83 94 1 921980 75 41 12 79 80 64 67 79 1 771981 107 53 10 103 105 67 97 103 1 1011982 122 60 9 115 117 74 111 115 1 1131983 145 72 9 135 137 72 134 135 1 1321984 110 56 8 105 107 50 103 105 1 1031985 93 46 10 92 95 56 85 92 1 901986 114 60 3 104 106 77 103 104 1 1011987 95 53 3 88 90 80 85 88 1 851988 78 41 3 72 75 53 71 72 1 701989 46 23 3 43 46 22 44 43 1 421990 51 26 4 49 53 27 49 49 1 481991 63 31 5 61 65 27 61 61 1 591992 52 28 5 51 58 31 49 51 1 491993 58 30 5 56 69 33 55 56 1 551994 51 26 4 49 64 30 48 49 1 481995 44 22 5 44 60 21 42 44 1 421996 41 20 4 40 56 17 40 40 1 381997 45 22 4 44 60 18 44 44 1 421998 55 27 4 52 69 24 54 52 1 511999 66 34 4 62 79 25 65 62 1 602000 44 23 3 43 60 12 48 43 1 412001 34 18 4 34 51 8 37 34 1 332002 46 23 5 45 62 11 50 45 1 432003 48 25 5 47 67 11 54 47 1 462004 43 21 4 42 60 10 47 42 1 402005 28 14 4 25 44 0 32 25 1 242006 21 11 4 20 41 0 23 20 1 192007 16 8 4 17 35 0 19 17 1 15

71
a. NRAs including assistance to nontradables and via inputs and other forms of non-product-specific (NPS) assistance without and (in column (5)) with decoupled support. b. The Relative Rate of Assistance (RRA) is defined as 100*[(100+NRAagt)/ (100+NRAnonagt)-1], where NRAagt and NRAnonagt are the percentage NRAs for the tradables parts of the agricultural and non-agricultural sectors (columns 8 and 9), respectively, so it excludes decoupled payments but includes all NPS support. c. Including NPS but excluding decoupled payments, so more than the weighted average of columns (6) and (7).

72
Appendix Table 8 (continued): Annual distortion estimates, Netherlands, 1956 to 2007 (c) Value shares of primary production of covereda and non-covered products,
(percent)
Barl
ey Beef Egg Maiz
e Milk Oat Pigm
eat Potat
o Poult
ry Rapeseed
Sheepme
at Suga
r Tom
ato Whe
at
Non-covered
1956 2 9 17 na 16 4 17 na 1 na 0 2 1 3 27 1957 2 8 17 na 14 4 16 na 2 na 0 3 2 3 28 1958 2 9 16 na 17 3 16 na 2 na 0 2 3 3 27 1959 2 8 20 na 14 2 15 na 2 na 0 2 3 4 27 1960 2 7 18 na 16 2 16 na 3 na 0 2 3 4 27 1961 2 8 19 na 12 2 17 na 3 na 0 2 4 3 27 1962 2 10 16 0 12 4 14 na 5 0 1 2 4 3 29 1963 2 11 16 0 12 3 14 na 5 0 0 3 3 3 27 1964 2 11 11 0 14 2 15 na 6 0 0 3 5 3 27 1965 2 14 11 0 13 2 15 na 6 0 1 1 4 3 27 1966 2 14 10 0 14 2 14 na 7 0 0 1 4 3 28 1967 2 14 8 0 13 2 15 na 8 0 0 2 5 3 28 1968 1 14 9 0 13 1 16 na 8 0 0 2 4 3 28 1969 2 14 9 0 13 1 15 na 8 0 0 2 4 3 28 1970 1 14 9 0 12 1 16 na 9 0 0 3 4 3 28 1971 1 15 9 0 13 1 17 na 5 0 0 4 4 3 28 1972 1 11 8 0 13 0 15 9 6 0 0 4 4 3 25 1973 1 12 8 0 12 0 15 9 5 0 0 6 4 4 24 1974 1 16 4 0 12 1 15 8 5 0 0 7 4 3 23 1975 1 17 5 0 12 0 18 8 5 0 1 4 4 2 24 1976 1 16 7 0 11 0 16 7 5 0 0 3 5 4 25 1977 1 17 6 0 7 0 20 9 5 0 1 2 4 3 24 1978 1 16 7 0 9 0 18 10 5 0 1 2 4 2 24 1979 1 19 6 0 9 0 15 10 5 0 1 3 4 2 24 1980 1 17 8 0 9 0 16 9 5 0 1 5 4 2 24 1981 1 15 10 0 13 0 14 8 5 0 1 3 4 2 25 1982 1 13 10 0 15 0 14 8 5 0 0 2 4 2 26 1983 0 6 10 0 17 0 16 9 6 0 0 2 4 3 26 1984 1 6 11 0 14 0 18 12 4 0 0 2 4 3 25 1985 0 5 9 0 13 0 25 10 4 0 0 1 4 2 25 1986 0 8 7 0 12 0 23 10 5 0 0 2 5 1 25 1987 0 11 8 0 8 0 26 11 4 0 0 1 4 1 25 1988 0 11 6 0 16 0 21 9 5 0 0 2 4 1 25 1989 0 8 5 0 20 0 23 8 3 0 0 2 4 2 23 1990 0 8 6 0 16 0 25 9 3 0 0 2 5 1 23 1991 0 7 6 0 17 0 22 11 4 0 0 2 5 1 25 1992 0 9 5 0 18 0 27 7 3 0 0 1 4 1 24 1993 0 12 6 0 18 0 22 6 4 0 1 2 4 1 24 1994 0 11 6 0 17 0 20 11 4 0 0 2 4 1 24 1995 0 10 4 0 20 0 19 14 3 0 0 2 3 1 23 1996 0 9 6 0 20 0 22 7 5 0 0 1 3 2 23 1997 0 7 6 0 21 0 21 7 6 0 1 2 3 2 24 1998 0 8 6 0 21 0 19 9 6 0 0 1 4 1 25 1999 0 7 5 0 20 0 14 16 5 0 1 1 4 1 26 2000 0 6 7 0 24 0 18 8 5 0 1 1 4 1 24 2001 0 4 6 0 26 0 19 8 6 0 1 1 4 1 23 2002 0 4 7 0 23 0 17 9 6 0 1 1 5 1 24 2003 0 4 7 0 25 0 15 9 5 0 1 1 5 2 25 2004 0 5 6 0 25 0 15 13 4 0 1 1 4 2 24 2005 1 6 9 0 5 0 23 12 7 0 1 1 8 2 24 2006 0 4 6 0 22 0 16 13 5 0 1 1 6 2 24 2007 1 4 6 0 21 0 15 15 5 0 0 1 6 3 24 a. At farmgate undistorted prices

73
Appendix Table 8 (cont.): Annual distortion estimates, Netherlands, 1956 to 2007 (d) Trade status of of covered productsa
Barl
ey Beef Egg Maiz
e Milk Oat Pigm
eat Potat
o Poult
ry Rapeseed
Sheepme
at Suga
r Tom
ato Whe
at 1956 M M M 0 M M M na M na M M X M1957 M M M 0 M M M na M na M M X M1958 M M M 0 M M M na M na M M X M1959 M M M 0 M M M na M na M M X M1960 M M M 0 M M M na M na M M X M1961 M M M 0 M M M na M na M M X M1962 M M M M M M M na M X M M X M1963 M M M M M M M na M M M M X M1964 M M M M M M M na M X M M M M1965 M M M M M M M na M M M M M M1966 M M M M M M M na M M M M M M1967 M M M M M M M na M M M M M M1968 M M M M M M M na M M M M M M1969 M M M M M M M na M M M M M M1970 M M M M M M M na M M M M M M1971 X M M M M M M na M M M M M M1972 X M M M M M M M M M M M M M1973 X M M M M M M M M M M M M M1974 X M M M M M M M M M M M M M1975 X M M M M M M M M M M M M M1976 M M M M M M M M M M M M M M1977 X M M M M M M M M M M M M M1978 X M M M M M M M M M M M M M1979 X M M M M M M M M M M M M M1980 X M M M M M M M M M M M M M1981 X M M M M M M M M M M M M M1982 X M M M M M M M M M M M M M1983 X M M M M M M M M M M M M M1984 X M M M M M M M M M M M M M1985 X M M M M M M M M M M M M M1986 M M M M M M M M M M M M M M1987 M M M M M M M M M M M M M M1988 M M M M M M M M M M M M M M1989 M M M M M M M M M M M M X M1990 M M M M M M M M M M M M X M1991 M M M M M M M M M M M M X M1992 M M M M M M M M M X M M X M1993 M M M M M M M M M X M M X M1994 M M M M M M M M M M M M X M1995 M M M M M M M M M M M M X M1996 X M M M M M M M M X M M X X1997 X M M M M M M M M X M M X X1998 M M M M M M M M M X M M X X1999 M M M M M M M M M X M M X X2000 X M X M M M M M M X M M X X2001 X M X M M M M M M M M M X X2002 X M X M M M M M M X M M X X2003 X M X M M M M M M X M M X X2004 X M X M M M M M M X M M X X2005 X M M M M M M M na X M M X X2006 X M M M M M M M na X M M X X2007 X M M M M M M M M X M M X Xa. Exportables (X), import-competing products (M) and nontradables (H). Source: Anderson and Valenzuela (2008), based on author’s spreadsheet

74
Appendix Table 9: Annual distortion estimates, Norway, 1956 to 2007 (a) Nominal rates of assistance to covered products
(percent)
Barle
y Beef Egg Milk Oat Pigm
eat Potat
o Poult
ry
Sheepmea
t Whea
t Wool
All cover
ed 1956 426 385 355 284 244 252 169 431 119 169 na 249 1957 426 385 355 284 244 252 169 431 119 169 na 259 1958 426 385 355 284 244 252 169 431 119 169 na 258 1959 426 385 355 284 244 252 169 431 119 169 na 256 1960 426 385 355 284 244 252 169 431 119 169 na 257 1961 426 385 355 284 244 252 169 431 119 169 na 258 1962 426 385 355 284 244 252 169 431 119 169 na 264 1963 426 385 355 284 244 252 169 431 119 169 na 260 1964 426 385 355 284 244 252 169 431 119 169 na 270 1965 426 385 355 284 244 252 169 431 119 169 na 262 1966 426 385 355 284 244 252 169 431 119 169 na 261 1967 426 385 355 284 244 252 169 431 119 169 na 269 1968 426 385 355 284 244 252 169 431 119 169 na 270 1969 426 385 355 284 244 252 169 431 119 169 na 269 1970 426 385 355 284 244 252 169 431 119 169 na 271 1971 426 385 355 284 244 252 169 431 119 169 na 275 1972 426 385 355 284 244 252 169 431 119 169 na 275 1973 426 385 355 284 244 252 169 431 119 169 na 275 1974 426 385 355 284 244 252 169 431 119 169 na 274 1975 426 385 355 284 244 252 169 431 119 169 na 280 1976 426 385 355 284 244 252 169 431 119 169 na 278 1977 426 385 355 284 244 252 169 431 119 169 na 278 1978 426 385 355 284 244 252 169 431 119 169 na 279 1979 416 385 355 441 374 252 169 431 119 236 281 324 1980 242 385 355 377 194 252 169 431 119 181 na 287 1981 284 385 355 315 133 252 169 431 119 311 na 283 1982 454 385 355 235 234 252 169 431 119 344 na 291 1983 358 385 355 251 264 252 169 431 119 210 na 292 1984 269 385 355 300 170 252 169 431 119 155 na 276 1985 391 385 355 433 226 252 169 431 119 196 na 314 1986 507 506 387 593 287 252 na 431 206 198 147 405 1987 666 347 239 620 241 207 na 529 318 317 91 372 1988 352 272 356 271 142 289 na 431 355 310 64 272 1989 245 262 357 227 146 179 na 417 281 210 101 226 1990 360 319 247 486 234 179 na 390 287 309 221 329 1991 329 482 240 391 161 210 na 362 259 420 330 329 1992 295 300 303 304 156 127 na 512 213 237 357 254 1993 287 213 209 350 112 200 na 372 100 214 352 247 1994 286 181 175 307 143 166 na 301 97 235 207 224 1995 155 167 234 175 143 125 na 277 127 120 205 161 1996 79 205 97 219 104 98 na 197 70 77 207 153 1997 112 315 120 246 116 97 na 167 47 131 181 179 1998 231 294 173 297 171 200 na 201 82 134 227 239 1999 189 286 254 279 238 297 na 244 91 220 236 252 2000 93 242 94 179 161 148 na 253 73 136 168 163 2001 92 386 94 151 110 102 na 174 83 121 163 151 2002 140 420 116 323 74 187 na 439 70 165 216 237 2003 111 382 56 161 102 205 na 395 69 140 192 170 2004 89 234 99 123 117 140 na 446 39 98 187 129 2005 112 193 141 110 144 106 na 310 42 148 216 127 2006 104 205 139 105 74 123 na 442 68 111 227 130 2007 12 206 114 16 31 153 na 247 93 29 261 65

75
Appendix Table 9 (continued): Annual distortion estimates, Norway, 1956 to 2007 (b) Nominal and relative rates of assistance to alla agricultural products, to exportableb and import-competing b agricultural industries, and relativec to non-agricultural industries (percent)
NRA, all agric products,a by component NRA, agric tradables
NRA, covere
d produc
ts (1)
NRA, non-
covered
products
(2)
NRA, non-
product-specific support
(3)
NRA, all ag
products (incl NPS)
(4)=1+2+3
NRA, all ag products (incl NPS
and decoupled)
(5)
NRA, ag export- ables (6)
NRA, ag import- competi
ng (7)
NRA, all agric
tradable goods c (8)=6+7
NRA, all non-ag tradable goods
(9) RRAb
(10) 1956 249 63 na 184 184 0 223 184 2 1791957 259 65 na 191 191 0 231 191 2 1841958 258 65 na 190 190 0 231 190 2 1841959 256 64 na 189 189 0 229 189 2 1831960 257 65 na 189 189 0 230 189 2 1831961 258 65 na 190 190 0 231 190 2 1841962 264 66 na 194 194 0 236 194 2 1881963 260 65 na 191 191 0 232 191 2 1861964 270 68 na 198 198 0 241 198 2 1931965 262 66 na 193 193 0 234 193 2 1881966 261 66 na 192 192 0 234 192 2 1881967 269 68 na 197 197 0 240 197 1 1941968 270 68 na 198 198 0 241 198 1 1951969 269 68 na 197 197 0 240 197 1 1951970 271 68 na 199 199 0 242 199 1 1971971 275 69 na 201 201 0 245 201 1 2001972 275 70 na 202 202 0 246 202 1 2001973 275 70 na 202 202 0 246 202 0 2001974 274 69 na 201 201 0 244 201 0 2001975 280 71 na 205 205 0 250 205 0 2041976 278 70 na 203 203 0 248 203 0 2031977 278 70 na 203 203 0 248 203 0 2021978 279 71 na 205 205 0 249 205 0 2041979 324 71 25 276 444 186 276 276 0 2761980 287 68 21 247 394 131 257 247 0 2461981 283 70 20 241 389 173 266 241 0 2401982 291 70 15 241 389 231 216 241 0 2401983 292 70 15 243 394 235 212 243 0 2411984 276 69 13 229 375 214 218 229 0 2281985 314 70 12 248 420 223 249 248 0 2461986 405 73 43 319 344 12 347 319 0 3171987 372 70 44 301 326 8 323 301 0 3001988 272 49 39 230 254 6 237 230 0 2291989 226 39 34 195 216 8 197 195 0 1941990 329 63 39 264 288 10 280 264 0 2631991 329 60 44 267 297 0 277 267 0 2661992 254 46 44 222 255 0 218 222 0 2201993 247 45 43 217 252 0 212 217 0 2161994 224 41 44 204 240 0 194 204 0 2031995 161 28 40 159 187 0 141 159 0 1571996 153 26 44 155 182 0 133 155 0 1541997 179 33 53 181 212 0 155 181 0 1801998 239 47 59 227 261 0 206 227 0 2261999 252 51 58 232 274 0 216 232 0 2312000 163 31 49 168 209 3 143 168 0 1672001 151 29 47 156 197 0 132 156 0 1552002 237 46 58 223 278 4 203 223 0 2212003 170 38 34 156 235 3 149 156 0 1542004 129 31 29 124 191 3 115 124 0 1232005 127 28 11 116 201 149 126 116 0 1152006 130 28 11 117 199 146 129 117 0 1162007 65 14 8 60 119 122 63 60 0 60

76
a. NRAs including assistance to nontradables and via inputs and other forms of non-product-specific (NPS) assistance without and (in column (5)) with decoupled support. b. The Relative Rate of Assistance (RRA) is defined as 100*[(100+NRAagt)/ (100+NRAnonagt)-1], where NRAagt and NRAnonagt are the percentage NRAs for the tradables parts of the agricultural and non-agricultural sectors (columns 8 and 9), respectively, so it excludes decoupled payments but includes all NPS support. c. Including NPS but excluding decoupled payments, so more than the weighted average of columns (6) and (7).
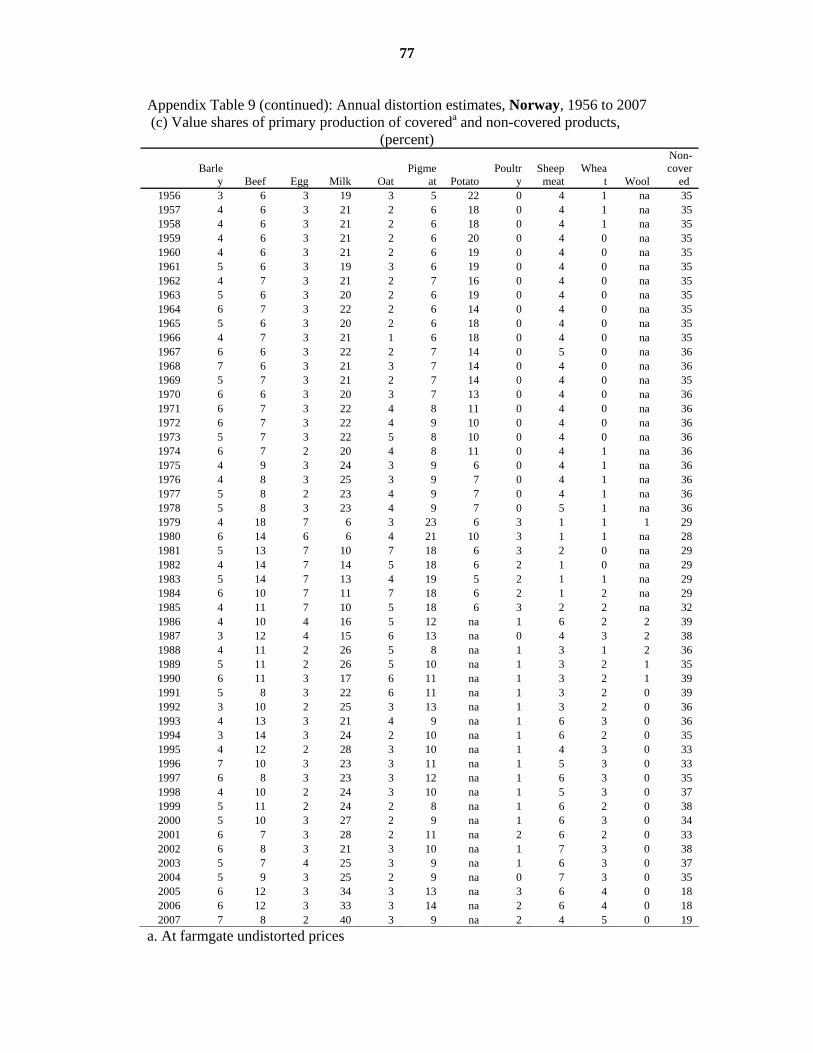
77
Appendix Table 9 (continued): Annual distortion estimates, Norway, 1956 to 2007 (c) Value shares of primary production of covereda and non-covered products,
(percent)
Barle
y Beef Egg Milk Oat Pigme
at Potato Poultr
y Sheep
meat Whea
t Wool
Non-cover
ed 1956 3 6 3 19 3 5 22 0 4 1 na 35 1957 4 6 3 21 2 6 18 0 4 1 na 35 1958 4 6 3 21 2 6 18 0 4 1 na 35 1959 4 6 3 21 2 6 20 0 4 0 na 35 1960 4 6 3 21 2 6 19 0 4 0 na 35 1961 5 6 3 19 3 6 19 0 4 0 na 35 1962 4 7 3 21 2 7 16 0 4 0 na 35 1963 5 6 3 20 2 6 19 0 4 0 na 35 1964 6 7 3 22 2 6 14 0 4 0 na 35 1965 5 6 3 20 2 6 18 0 4 0 na 35 1966 4 7 3 21 1 6 18 0 4 0 na 35 1967 6 6 3 22 2 7 14 0 5 0 na 36 1968 7 6 3 21 3 7 14 0 4 0 na 36 1969 5 7 3 21 2 7 14 0 4 0 na 35 1970 6 6 3 20 3 7 13 0 4 0 na 36 1971 6 7 3 22 4 8 11 0 4 0 na 36 1972 6 7 3 22 4 9 10 0 4 0 na 36 1973 5 7 3 22 5 8 10 0 4 0 na 36 1974 6 7 2 20 4 8 11 0 4 1 na 36 1975 4 9 3 24 3 9 6 0 4 1 na 36 1976 4 8 3 25 3 9 7 0 4 1 na 36 1977 5 8 2 23 4 9 7 0 4 1 na 36 1978 5 8 3 23 4 9 7 0 5 1 na 36 1979 4 18 7 6 3 23 6 3 1 1 1 29 1980 6 14 6 6 4 21 10 3 1 1 na 28 1981 5 13 7 10 7 18 6 3 2 0 na 29 1982 4 14 7 14 5 18 6 2 1 0 na 29 1983 5 14 7 13 4 19 5 2 1 1 na 29 1984 6 10 7 11 7 18 6 2 1 2 na 29 1985 4 11 7 10 5 18 6 3 2 2 na 32 1986 4 10 4 16 5 12 na 1 6 2 2 39 1987 3 12 4 15 6 13 na 0 4 3 2 38 1988 4 11 2 26 5 8 na 1 3 1 2 36 1989 5 11 2 26 5 10 na 1 3 2 1 35 1990 6 11 3 17 6 11 na 1 3 2 1 39 1991 5 8 3 22 6 11 na 1 3 2 0 39 1992 3 10 2 25 3 13 na 1 3 2 0 36 1993 4 13 3 21 4 9 na 1 6 3 0 36 1994 3 14 3 24 2 10 na 1 6 2 0 35 1995 4 12 2 28 3 10 na 1 4 3 0 33 1996 7 10 3 23 3 11 na 1 5 3 0 33 1997 6 8 3 23 3 12 na 1 6 3 0 35 1998 4 10 2 24 3 10 na 1 5 3 0 37 1999 5 11 2 24 2 8 na 1 6 2 0 38 2000 5 10 3 27 2 9 na 1 6 3 0 34 2001 6 7 3 28 2 11 na 2 6 2 0 33 2002 6 8 3 21 3 10 na 1 7 3 0 38 2003 5 7 4 25 3 9 na 1 6 3 0 37 2004 5 9 3 25 2 9 na 0 7 3 0 35 2005 6 12 3 34 3 13 na 3 6 4 0 18 2006 6 12 3 33 3 14 na 2 6 4 0 18 2007 7 8 2 40 3 9 na 2 4 5 0 19
a. At farmgate undistorted prices

78
Appendix Table 9 (continued): Annual distortion estimates, Norway, 1956 to 2007 (d) Trade status of of covered productsa
Barle
y Beef Egg Milk Oat Pigm
eat Potat
o Poult
ry
Sheepmea
t Whea
t Wool 1956 M M M M M M M M M M na1957 M M M M M M M M M M na1958 M M M M M M M M M M na1959 M M M M M M M M M M na1960 M M M M M M M M M M na1961 M M M M M M M M M M na1962 M M M M M M M M M M na1963 M M M M M M M M M M na1964 M M M M M M M M M M na1965 M M M M M M M M M M na1966 M M M M M M M M M M na1967 M M M M M M M M M M na1968 M M M M M M M M M M na1969 M M M M M M M M M M na1970 M M M M M M M M M M na1971 M M M M M M M M M M na1972 M M M M M M M M M M na1973 M M M M M M M M M M na1974 M M M M M M M M M M na1975 M M M M M M M M M M na1976 M M M M M M M M M M na1977 M M M M M M M M M M na1978 M M M M M M M M M M na1979 M M X X M M M M M M M1980 M M M X X M M M M M na1981 M M M X X X M M M M na1982 X X M X X X M M M M na1983 M X X X M X M M M M na1984 M X X M X X M M M M na1985 M M X X M X M M M M na1986 M M M M M M na M M M X1987 M M M M M M na M M M X1988 M M M M M M na M M M X1989 M M M M M M na M M M X1990 M M M M M M na M M M X1991 M M M M M M na M M M M1992 M M M M M M na M M M M1993 M M M M M M na M M M M1994 M M M M M M na M M M M1995 M M M M M M na M M M M1996 M M M M M M na M M M M1997 M M M M M M na M M M M1998 M M M M M M na M M M M1999 M M M M M M na M M M M2000 M M M M M M na M M M X2001 M M M M M M na M M M M2002 M M M M M M na M M M X2003 M M M M M M na M M M X2004 M M M M M M na M M M X2005 M M X M M M na M M M X2006 M M X M M M na M M M X2007 M M X M M M na M M M X
a. Exportables (X), import-competing products (M) and nontradables (H). Source: Anderson and Valenzuela (2008), based on author’s spreadsheet

79
Appendix Table 10: Annual distortion estimates, Portugal, 1956 to 2007 (a) Nominal rates of assistance to covered products
(percent)
Barley Beef Egg Maize Milk Oat Pigmea
t Potato Poultry Rice 1956 na na na na na na na na na na 1957 na na na na na na na na na na 1958 na na na na na na na na na na 1959 na na na na na na na na na na 1960 na 42 na 45 0 na na na na 2 1961 na 52 na 12 0 na na na na 4 1962 na 53 na 14 0 na na na na -36 1963 na 58 na 19 0 na na na na -3 1964 na 26 na 19 0 na na na na 5 1965 na 24 na 39 0 na na na na 24 1966 na 40 na 27 0 na na na na 11 1967 na 66 na 27 22 na na na na 6 1968 na 77 na 24 19 na na na na 9 1969 na 67 na 23 18 na na na na 31 1970 na 46 na 7 19 na na na na 27 1971 na 42 na 33 9 na na na na -12 1972 na 42 na 47 12 na na na na 37 1973 na 66 na 0 12 na na na na -16 1974 na 55 na -22 11 na na na na -39 1975 na 123 na 30 5 na na na na -12 1976 na 151 na 30 4 na na na na 0 1977 na 140 na 35 3 na na na na -10 1978 na 122 na 32 2 na na na na -6 1979 na 123 na 24 2 na na na na 7 1980 na 86 na 18 5 na na na na 13 1981 na 63 na 14 7 na na na na -21 1982 na 41 na 34 6 na na na na 1 1983 na 69 na 35 31 na na na na 13 1984 na 38 na 31 3 na na na na 18 1985 na 38 na 31 3 na na na na 18 1986 157 188 31 110 361 83 40 17 79 127 1987 233 107 21 170 533 77 11 17 90 190 1988 85 80 21 79 192 14 34 17 69 162 1989 45 79 29 62 84 15 14 17 66 148 1990 94 98 12 108 125 48 7 16 100 152 1991 119 157 13 120 128 39 20 16 83 144 1992 103 93 15 103 118 63 0 17 118 143 1993 105 63 10 69 123 44 18 17 110 106 1994 100 53 0 45 117 43 18 16 114 133 1995 41 69 12 53 79 40 16 15 129 88 1996 2 68 5 14 70 34 16 14 77 33 1997 7 117 1 19 78 25 13 12 55 31 1998 64 121 11 32 100 50 22 11 51 18 1999 44 125 16 39 106 84 57 11 90 0 2000 3 113 3 27 57 59 32 10 57 1 2001 0 140 0 14 40 29 24 10 52 42 2002 0 157 0 9 75 0 24 10 56 24 2003 1 157 0 34 70 1 33 10 54 18 2004 1 92 0 39 62 23 27 10 101 1 2005 0 109 0 19 33 24 19 10 69 2 2006 0 86 0 11 25 0 14 10 69 32007 0 71 0 21 0 0 18 10 100 1
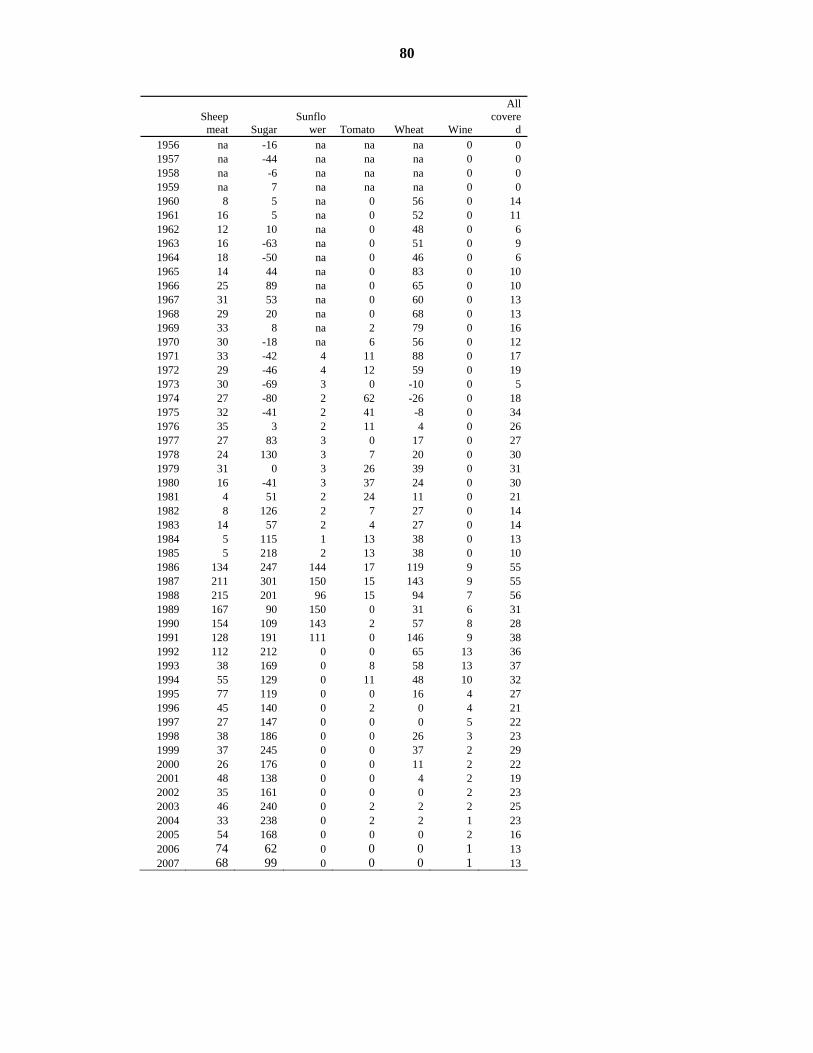
80
Sheep
meat Sugar Sunflo
wer Tomato Wheat Wine
All covere
d 1956 na -16 na na na 0 0 1957 na -44 na na na 0 0 1958 na -6 na na na 0 0 1959 na 7 na na na 0 0 1960 8 5 na 0 56 0 14 1961 16 5 na 0 52 0 11 1962 12 10 na 0 48 0 6 1963 16 -63 na 0 51 0 9 1964 18 -50 na 0 46 0 6 1965 14 44 na 0 83 0 10 1966 25 89 na 0 65 0 10 1967 31 53 na 0 60 0 13 1968 29 20 na 0 68 0 13 1969 33 8 na 2 79 0 16 1970 30 -18 na 6 56 0 12 1971 33 -42 4 11 88 0 17 1972 29 -46 4 12 59 0 19 1973 30 -69 3 0 -10 0 5 1974 27 -80 2 62 -26 0 18 1975 32 -41 2 41 -8 0 34 1976 35 3 2 11 4 0 26 1977 27 83 3 0 17 0 27 1978 24 130 3 7 20 0 30 1979 31 0 3 26 39 0 31 1980 16 -41 3 37 24 0 30 1981 4 51 2 24 11 0 21 1982 8 126 2 7 27 0 14 1983 14 57 2 4 27 0 14 1984 5 115 1 13 38 0 13 1985 5 218 2 13 38 0 10 1986 134 247 144 17 119 9 55 1987 211 301 150 15 143 9 55 1988 215 201 96 15 94 7 56 1989 167 90 150 0 31 6 31 1990 154 109 143 2 57 8 28 1991 128 191 111 0 146 9 38 1992 112 212 0 0 65 13 36 1993 38 169 0 8 58 13 37 1994 55 129 0 11 48 10 32 1995 77 119 0 0 16 4 27 1996 45 140 0 2 0 4 21 1997 27 147 0 0 0 5 22 1998 38 186 0 0 26 3 23 1999 37 245 0 0 37 2 29 2000 26 176 0 0 11 2 22 2001 48 138 0 0 4 2 19 2002 35 161 0 0 0 2 23 2003 46 240 0 2 2 2 25 2004 33 238 0 2 2 1 23 2005 54 168 0 0 0 2 16 2006 74 62 0 0 0 1 13 2007 68 99 0 0 0 1 13

81
Appendix Table 10 (continued): Annual distortion estimates, Portugal, 1956 to 2007 (b) Nominal and relative rates of assistance to alla agricultural products, to exportableb and import-competing b agricultural industries, and relativec to non-agricultural industries (percent)
NRA, all agric products,a by component NRA, agric tradables
NRA, covere
d produc
ts (1)
NRA, non-
covered
products
(2)
NRA, non-
product-specific support
(3)
NRA, all ag
products (incl NPS)
(4)=1+2+3
NRA, all ag products (incl NPS
and decoupled)
(5)
NRA, ag export- ables (6)
NRA, ag import- competi
ng (7)
NRA, all agric
tradable goods c (8)=6+7
NRA, all non-ag tradable goods
(9) RRAb
(10) 1956 0 -22 na -7 -7 -5 -16 -7 10 -151957 0 -20 na -7 -7 -5 -16 -7 9 -141958 0 -12 na -4 -4 -2 -13 -4 9 -121959 0 -13 na -5 -5 -3 -14 -5 10 -131960 14 -14 na 8 8 -3 19 8 10 -21961 11 -14 na 5 5 -4 14 5 10 -41962 6 -13 na 2 2 -3 8 2 10 -81963 9 -20 na 3 3 -5 13 3 10 -61964 6 -21 na 1 1 -5 8 1 8 -71965 10 -21 na 5 5 -5 16 5 9 -41966 10 -22 na 4 4 -7 12 4 8 -41967 13 -16 na 7 7 -5 16 7 8 -11968 13 -15 na 8 8 -4 19 8 8 01969 16 -15 na 9 9 -5 19 9 8 11970 12 -13 na 7 7 -3 16 7 9 -11971 17 -16 na 11 11 -5 22 11 7 31972 19 -12 na 12 12 -3 22 12 7 51973 5 -11 na 2 2 -2 4 2 6 -31974 18 -13 na 12 12 -3 22 12 47 -241975 34 -6 na 25 25 -1 38 25 5 201976 26 -3 na 20 20 1 30 20 5 141977 27 4 na 22 22 6 29 22 4 171978 30 18 na 27 27 16 32 27 3 231979 31 11 na 27 27 8 41 27 2 241980 30 3 na 24 24 5 35 24 2 211981 21 1 na 17 17 4 24 17 2 141982 14 1 na 11 11 3 15 11 2 91983 14 3 na 11 11 3 16 11 2 91984 13 4 na 11 11 3 15 11 1 91985 10 -5 na 6 6 -4 14 6 1 51986 55 40 3 56 58 25 64 56 1 541987 55 44 3 57 59 27 66 57 1 541988 56 36 3 55 57 33 57 55 0 551989 31 21 3 32 35 10 46 32 0 321990 28 25 4 31 35 11 51 31 0 311991 38 28 5 41 46 13 62 41 0 411992 36 26 5 39 47 16 48 39 0 391993 37 27 5 40 52 18 49 40 0 401994 32 24 4 35 50 17 43 35 0 351995 27 20 5 31 47 9 41 31 0 311996 21 17 4 24 40 8 34 24 0 241997 22 18 4 26 42 7 37 26 0 261998 23 19 4 26 43 6 43 26 0 261999 29 24 4 32 49 7 56 32 0 322000 22 16 3 24 42 5 41 24 0 242001 19 14 4 22 39 4 34 22 0 222002 23 17 5 27 44 5 43 27 0 272003 25 19 5 28 48 5 47 28 0 282004 23 18 4 26 44 4 44 26 0 262005 16 9 4 16 35 1 37 16 0 162006 13 7 4 14 36 1 30 14 0 142007 13 7 4 14 32 1 26 14 0 14

82
a. NRAs including assistance to nontradables and via inputs and other forms of non-product-specific (NPS) assistance without and (in column (5)) with decoupled support. b. The Relative Rate of Assistance (RRA) is defined as 100*[(100+NRAagt)/ (100+NRAnonagt)-1], where NRAagt and NRAnonagt are the percentage NRAs for the tradables parts of the agricultural and non-agricultural sectors (columns 8 and 9), respectively, so it excludes decoupled payments but includes all NPS support. c. Including NPS but excluding decoupled payments, so more than the weighted average of columns (6) and (7).

83
Appendix Table 10 (continued): Annual distortion estimates, Portugal, 1956 to 2007 (c) Value shares of primary production of covereda and non-covered products,
(percent)
Barley Beef Egg Maize Milk Oat Pigmea
t Potato Poultry Rice 1956 na na na na na na na na na na 1957 na na na na na na na na na na 1958 na na na na na na na na na na 1959 na na na na na na na na na na 1960 na 4 na 5 3 na na na na 6 1961 na 5 na 6 3 na na na na 7 1962 na 4 na 6 2 na na na na 4 1963 na 4 na 6 2 na na na na 4 1964 na 4 na 6 3 na na na na 4 1965 na 6 na 4 2 na na na na 2 1966 na 8 na 6 3 na na na na 4 1967 na 6 na 5 2 na na na na 4 1968 na 6 na 4 2 na na na na 3 1969 na 8 na 5 3 na na na na 3 1970 na 8 na 5 2 na na na na 2 1971 na 8 na 5 3 na na na na 3 1972 na 7 na 4 3 na na na na 4 1973 na 8 na 4 3 na na na na 6 1974 na 10 na 5 3 na na na na 3 1975 na 12 na 4 3 na na na na 3 1976 na 10 na 4 3 na na na na 2 1977 na 13 na 4 2 na na na na 3 1978 na 15 na 4 2 na na na na 2 1979 na 13 na 3 2 na na na na 3 1980 na 15 na 4 2 na na na na 4 1981 na 18 na 4 4 na na na na 3 1982 na 15 na 4 4 na na na na 3 1983 na 6 na 6 5 na na na na 3 1984 na 5 na 6 4 na na na na 2 1985 na 4 na 5 4 na na na na 1 1986 0 5 2 3 3 1 8 7 5 1 1987 0 6 3 2 3 1 10 7 4 1 1988 0 9 3 4 7 1 9 6 5 1 1989 0 7 2 3 8 1 10 5 3 1 1990 0 4 2 2 6 0 11 4 2 1 1991 0 4 3 2 7 0 10 6 3 1 1992 0 6 3 2 8 0 16 5 4 1 1993 0 7 3 2 8 0 13 3 4 0 1994 0 5 3 2 7 0 11 6 4 1 1995 0 5 2 3 9 0 11 8 3 1 1996 0 4 3 3 9 0 12 3 4 1 1997 0 4 3 3 9 0 12 2 5 1 1998 0 3 2 3 7 0 8 4 5 1 1999 0 3 2 3 8 0 7 6 4 1 2000 0 3 3 3 11 0 9 3 5 1 2001 0 2 3 3 12 0 11 3 5 1 2002 0 3 3 3 10 0 10 4 5 1 2003 0 3 4 3 10 0 9 4 4 1 2004 0 4 3 2 10 0 8 5 3 1 2005 0 3 3 1 7 0 9 2 4 1 2006 0 2 4 2 7 0 8 3 4 1 2007 1 2 4 3 9 0 8 3 4 1

84
Sheep
meat Sugar Sunflo
wer Tomato Wheat Wine
Non-covere
d 1956 na 0 na na na 70 30 1957 na 0 na na na 67 33 1958 na 0 na na na 65 35 1959 na 0 na na na 64 36 1960 2 0 na 7 12 39 22 1961 3 0 na 9 9 35 23 1962 2 0 na 7 7 48 21 1963 3 0 na 9 7 45 20 1964 3 0 na 13 5 43 19 1965 3 0 na 15 5 44 18 1966 2 0 na 21 4 33 20 1967 2 0 na 21 6 33 21 1968 1 0 na 18 6 38 20 1969 2 0 na 24 4 30 21 1970 2 0 na 18 6 36 21 1971 2 0 0 19 8 32 20 1972 2 0 0 24 8 27 21 1973 2 0 0 24 7 26 20 1974 2 0 0 21 6 30 20 1975 2 0 0 27 7 21 21 1976 2 0 0 24 10 24 22 1977 3 0 0 29 4 20 23 1978 3 0 0 30 3 18 23 1979 2 0 0 19 2 32 24 1980 3 0 0 20 3 24 23 1981 3 0 0 19 3 24 23 1982 3 0 0 19 4 25 23 1983 4 0 0 24 4 24 25 1984 3 0 1 26 5 22 27 1985 3 0 0 24 3 31 26 1986 2 0 0 21 2 20 19 1987 2 0 0 17 2 24 18 1988 2 0 1 19 2 11 21 1989 1 0 0 20 3 18 18 1990 1 0 0 19 1 31 15 1991 1 0 0 20 2 22 19 1992 2 0 0 15 1 18 19 1993 2 0 0 19 2 16 19 1994 2 0 0 19 1 19 18 1995 1 0 0 16 1 20 18 1996 2 0 0 17 2 23 17 1997 2 0 0 16 1 24 17 1998 2 0 0 21 0 25 17 1999 2 0 0 20 1 26 18 2000 2 0 0 19 1 23 18 2001 2 0 0 17 0 22 18 2002 2 0 0 17 1 23 18 2003 2 0 0 18 1 24 19 2004 2 0 0 17 1 24 18 2005 2 0 0 17 0 27 24 2006 2 0 0 16 1 25 24 2007 2 0 0 15 1 21 24
a. At farmgate undistorted prices
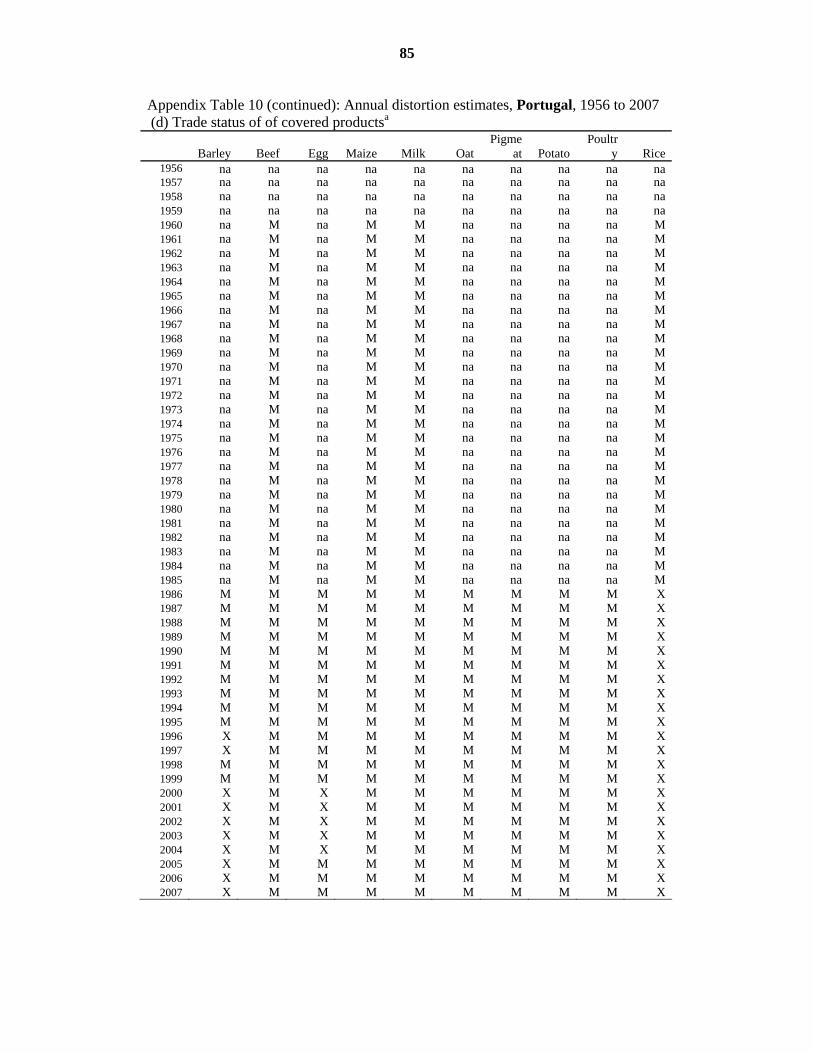
85
Appendix Table 10 (continued): Annual distortion estimates, Portugal, 1956 to 2007 (d) Trade status of of covered productsa
Barley Beef Egg Maize Milk Oat Pigme
at Potato Poultr
y Rice 1956 na na na na na na na na na na1957 na na na na na na na na na na1958 na na na na na na na na na na1959 na na na na na na na na na na1960 na M na M M na na na na M1961 na M na M M na na na na M1962 na M na M M na na na na M1963 na M na M M na na na na M1964 na M na M M na na na na M1965 na M na M M na na na na M1966 na M na M M na na na na M1967 na M na M M na na na na M1968 na M na M M na na na na M1969 na M na M M na na na na M1970 na M na M M na na na na M1971 na M na M M na na na na M1972 na M na M M na na na na M1973 na M na M M na na na na M1974 na M na M M na na na na M1975 na M na M M na na na na M1976 na M na M M na na na na M1977 na M na M M na na na na M1978 na M na M M na na na na M1979 na M na M M na na na na M1980 na M na M M na na na na M1981 na M na M M na na na na M1982 na M na M M na na na na M1983 na M na M M na na na na M1984 na M na M M na na na na M1985 na M na M M na na na na M1986 M M M M M M M M M X1987 M M M M M M M M M X1988 M M M M M M M M M X1989 M M M M M M M M M X1990 M M M M M M M M M X1991 M M M M M M M M M X1992 M M M M M M M M M X1993 M M M M M M M M M X1994 M M M M M M M M M X1995 M M M M M M M M M X1996 X M M M M M M M M X1997 X M M M M M M M M X1998 M M M M M M M M M X1999 M M M M M M M M M X2000 X M X M M M M M M X2001 X M X M M M M M M X2002 X M X M M M M M M X2003 X M X M M M M M M X2004 X M X M M M M M M X2005 X M M M M M M M M X2006 X M M M M M M M M X2007 X M M M M M M M M X
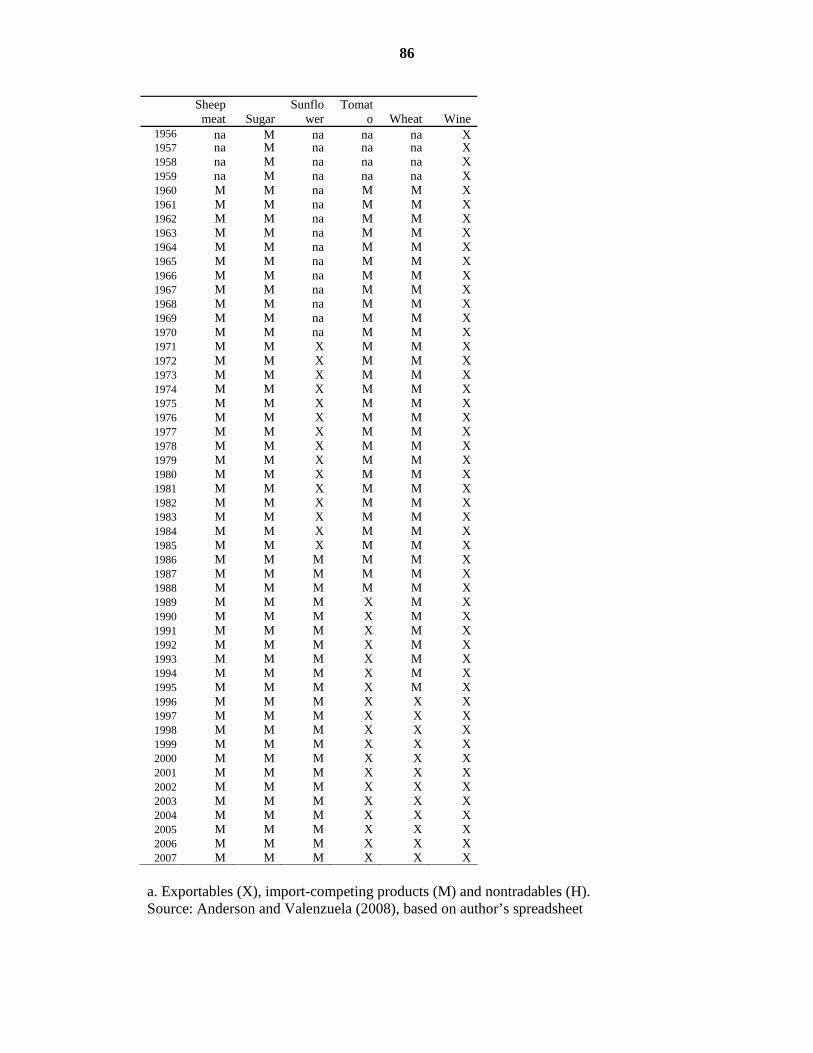
86
Sheep
meat Sugar Sunflo
wer Tomat
o Wheat Wine 1956 na M na na na X1957 na M na na na X1958 na M na na na X1959 na M na na na X1960 M M na M M X1961 M M na M M X1962 M M na M M X1963 M M na M M X1964 M M na M M X1965 M M na M M X1966 M M na M M X1967 M M na M M X1968 M M na M M X1969 M M na M M X1970 M M na M M X1971 M M X M M X1972 M M X M M X1973 M M X M M X1974 M M X M M X1975 M M X M M X1976 M M X M M X1977 M M X M M X1978 M M X M M X1979 M M X M M X1980 M M X M M X1981 M M X M M X1982 M M X M M X1983 M M X M M X1984 M M X M M X1985 M M X M M X1986 M M M M M X1987 M M M M M X1988 M M M M M X1989 M M M X M X1990 M M M X M X1991 M M M X M X1992 M M M X M X1993 M M M X M X1994 M M M X M X1995 M M M X M X1996 M M M X X X1997 M M M X X X1998 M M M X X X1999 M M M X X X2000 M M M X X X2001 M M M X X X2002 M M M X X X2003 M M M X X X2004 M M M X X X2005 M M M X X X2006 M M M X X X2007 M M M X X X
a. Exportables (X), import-competing products (M) and nontradables (H). Source: Anderson and Valenzuela (2008), based on author’s spreadsheet
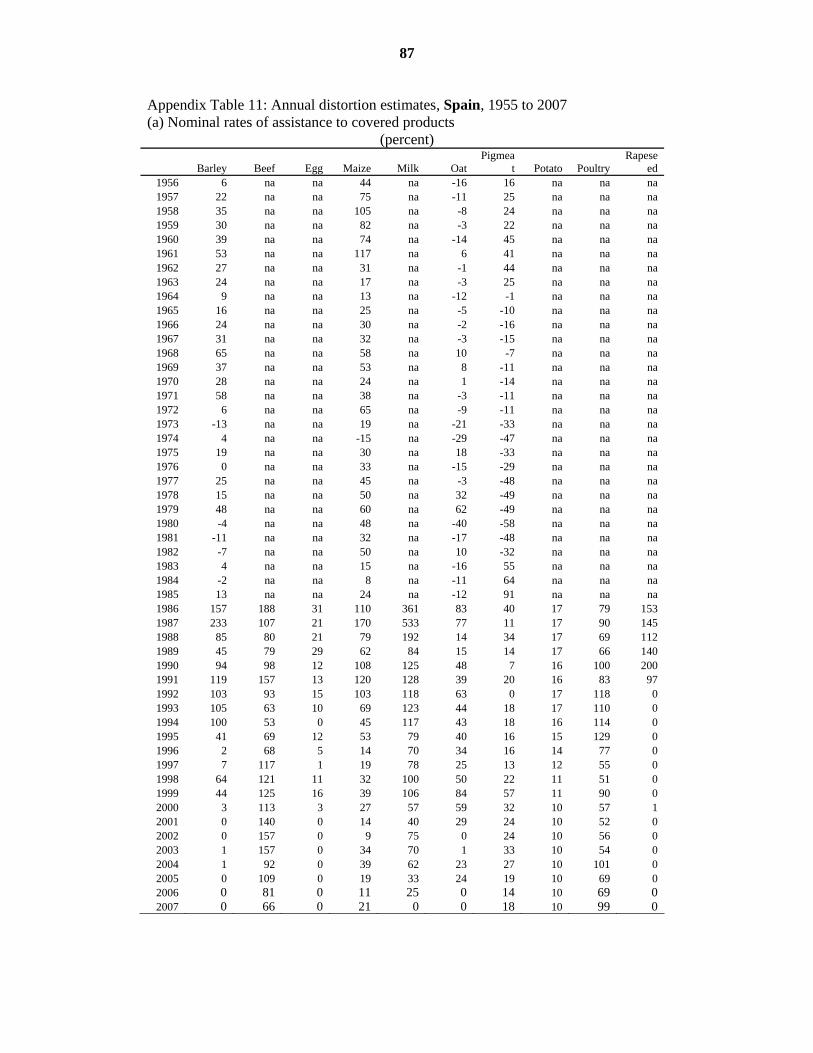
87
Appendix Table 11: Annual distortion estimates, Spain, 1955 to 2007 (a) Nominal rates of assistance to covered products
(percent)
Barley Beef Egg Maize Milk Oat Pigmea
t Potato Poultry Rapese
ed 1956 6 na na 44 na -16 16 na na na 1957 22 na na 75 na -11 25 na na na 1958 35 na na 105 na -8 24 na na na 1959 30 na na 82 na -3 22 na na na 1960 39 na na 74 na -14 45 na na na 1961 53 na na 117 na 6 41 na na na 1962 27 na na 31 na -1 44 na na na 1963 24 na na 17 na -3 25 na na na 1964 9 na na 13 na -12 -1 na na na 1965 16 na na 25 na -5 -10 na na na 1966 24 na na 30 na -2 -16 na na na 1967 31 na na 32 na -3 -15 na na na 1968 65 na na 58 na 10 -7 na na na 1969 37 na na 53 na 8 -11 na na na 1970 28 na na 24 na 1 -14 na na na 1971 58 na na 38 na -3 -11 na na na 1972 6 na na 65 na -9 -11 na na na 1973 -13 na na 19 na -21 -33 na na na 1974 4 na na -15 na -29 -47 na na na 1975 19 na na 30 na 18 -33 na na na 1976 0 na na 33 na -15 -29 na na na 1977 25 na na 45 na -3 -48 na na na 1978 15 na na 50 na 32 -49 na na na 1979 48 na na 60 na 62 -49 na na na 1980 -4 na na 48 na -40 -58 na na na 1981 -11 na na 32 na -17 -48 na na na 1982 -7 na na 50 na 10 -32 na na na 1983 4 na na 15 na -16 55 na na na 1984 -2 na na 8 na -11 64 na na na 1985 13 na na 24 na -12 91 na na na 1986 157 188 31 110 361 83 40 17 79 153 1987 233 107 21 170 533 77 11 17 90 145 1988 85 80 21 79 192 14 34 17 69 112 1989 45 79 29 62 84 15 14 17 66 140 1990 94 98 12 108 125 48 7 16 100 200 1991 119 157 13 120 128 39 20 16 83 97 1992 103 93 15 103 118 63 0 17 118 0 1993 105 63 10 69 123 44 18 17 110 0 1994 100 53 0 45 117 43 18 16 114 0 1995 41 69 12 53 79 40 16 15 129 0 1996 2 68 5 14 70 34 16 14 77 0 1997 7 117 1 19 78 25 13 12 55 0 1998 64 121 11 32 100 50 22 11 51 0 1999 44 125 16 39 106 84 57 11 90 0 2000 3 113 3 27 57 59 32 10 57 1 2001 0 140 0 14 40 29 24 10 52 0 2002 0 157 0 9 75 0 24 10 56 0 2003 1 157 0 34 70 1 33 10 54 0 2004 1 92 0 39 62 23 27 10 101 0 2005 0 109 0 19 33 24 19 10 69 0 2006 0 81 0 11 25 0 14 10 69 02007 0 66 0 21 0 0 18 10 99 0

88
Rice Sheep
meat Soybea
n Sugar Sunflo
wer Tomato Wheat Wine
All covere
d 1956 -11 na na 191 0 0 17 0 11 1957 -16 na na 94 0 0 23 0 15 1958 -20 na na 177 0 0 29 0 20 1959 -24 na na 211 0 0 31 0 19 1960 -30 na na 202 0 0 35 0 23 1961 -33 na na 223 0 0 40 0 24 1962 -29 na na 212 0 0 56 0 23 1963 -34 na na 13 0 0 29 0 11 1964 -44 na na 79 0 0 13 0 3 1965 -19 na na 427 0 0 30 0 12 1966 -31 na na 556 0 0 28 0 10 1967 -45 na na 393 0 0 23 0 10 1968 -33 na na 308 0 0 41 0 22 1969 -4 na na 264 0 0 44 0 19 1970 7 na -39 150 0 0 3 0 7 1971 -32 na -36 88 0 0 32 0 16 1972 -47 na -31 66 0 0 -10 0 1 1973 -71 na -18 -1 0 0 -31 0 -17 1974 -65 na -16 -43 0 0 -32 0 -21 1975 -21 na 55 76 0 0 -2 0 0 1976 -18 na 35 168 0 0 -16 0 -3 1977 -38 na -1 251 0 0 -28 0 -10 1978 -21 na 10 171 0 0 0 0 -7 1979 -32 na 23 45 0 0 40 0 -7 1980 -49 na 37 -6 0 0 43 0 -18 1981 -22 na 46 105 0 0 38 0 -14 1982 -9 na 49 201 0 0 45 0 -2 1983 -28 na 17 159 0 0 8 0 19 1984 15 na 2 269 0 0 16 0 17 1985 63 na 13 268 0 0 43 0 30 1986 127 134 211 247 144 17 119 9 75 1987 190 211 169 301 150 15 143 9 76 1988 162 215 108 201 96 15 94 7 63 1989 148 167 118 90 150 0 31 6 35 1990 152 154 147 109 143 2 57 8 40 1991 144 128 159 191 111 0 146 9 52 1992 143 112 0 212 0 0 65 13 38 1993 106 38 0 169 0 8 58 13 42 1994 133 55 0 129 0 11 48 10 39 1995 88 77 0 119 0 0 16 4 32 1996 33 45 0 140 0 2 0 4 21 1997 31 27 0 147 0 0 0 5 22 1998 18 38 0 186 0 0 26 3 30 1999 0 37 0 245 0 0 37 2 36 2000 1 26 0 176 0 0 11 2 22 2001 42 48 0 138 0 0 4 2 22 2002 24 35 0 161 0 0 0 2 24 2003 18 46 0 240 0 2 2 2 27 2004 1 33 0 238 0 2 2 1 24 2005 2 54 0 168 0 0 0 2 15 2006 3 74 0 62 0 0 0 1 13 2007 1 68 0 99 0 0 0 1 10

89
Appendix Table 11 (continued): Annual distortion estimates, Spain, 1956 to 2007 (b) Nominal and relative rates of assistance to alla agricultural products, to exportableb and import-competing b agricultural industries, and relativec to non-agricultural industries (percent)
NRA, all agric products,a by component NRA, agric tradables
NRA, covere
d produc
ts (1)
NRA, non-
covered
products
(2)
NRA, non-
product-specific support
(3)
NRA, all ag
products (incl NPS)
(4)=1+2+3
NRA, all ag products (incl NPS
and decoupled)
(5)
NRA, ag export- ables (6)
NRA, ag import- competi
ng (7)
NRA, all agric
tradable goods c (8)=6+7
NRA, all non-ag tradable goods
(9) RRAb
(10) 1956 11 1 na 8 8 -1 16 8 13 -41957 15 3 na 12 12 -1 22 12 13 -11958 20 4 na 16 16 -1 29 16 14 11959 19 5 na 16 16 -2 30 16 3 121960 23 6 na 19 19 -2 35 19 6 121961 24 8 na 20 20 -3 44 20 6 131962 23 7 na 18 18 -2 40 18 6 121963 11 3 na 9 9 -3 20 9 5 31964 3 1 na 3 3 -3 9 3 5 -21965 12 3 na 9 9 -1 19 9 4 51966 10 3 na 8 8 -2 17 8 5 31967 10 2 na 8 8 -4 16 8 4 31968 22 5 na 17 17 -2 32 17 4 131969 19 5 na 15 15 0 27 15 4 111970 7 2 na 6 6 0 9 6 3 21971 16 4 na 13 13 -2 24 13 3 91972 1 0 na 1 1 -3 3 1 4 -31973 -17 -6 na -14 -14 -8 -18 -14 3 -171974 -21 -6 na -17 -17 -5 -25 -17 2 -191975 0 0 na 0 0 -1 0 0 2 -31976 -3 -1 na -2 -2 -1 -3 -2 2 -41977 -10 -3 na -8 -8 -2 -11 -8 3 -101978 -7 -2 na -6 -6 -1 -9 -6 2 -81979 -7 -2 na -6 -6 -2 -8 -6 2 -81980 -18 -5 na -15 -15 -4 -21 -15 3 -181981 -14 -4 na -12 -12 -2 -17 -12 3 -141982 -2 -1 na -2 -2 -1 -3 -2 3 -51983 19 2 na 14 14 -1 23 14 3 111984 17 2 na 13 13 1 18 13 3 101985 30 5 na 23 23 2 33 23 4 191986 75 50 3 73 75 29 85 73 3 691987 76 51 3 74 77 32 86 74 2 711988 63 38 3 61 64 30 66 61 0 611989 35 22 3 35 39 11 46 35 0 351990 40 27 4 42 45 14 56 42 0 421991 52 33 5 53 57 16 67 53 0 531992 38 28 5 41 48 19 47 41 0 411993 42 30 5 45 57 20 51 45 0 451994 39 26 4 40 55 19 45 40 0 401995 32 22 5 34 51 11 40 34 0 341996 21 14 4 24 40 7 32 24 0 241997 22 16 4 25 41 8 32 25 0 251998 30 22 4 33 50 9 44 33 0 331999 36 27 4 39 56 10 58 39 0 392000 22 16 3 24 42 5 41 24 0 242001 22 14 4 24 41 5 34 24 0 242002 24 16 5 27 44 5 40 27 0 272003 27 17 5 30 49 5 46 30 0 302004 24 17 4 27 45 5 42 27 0 272005 15 8 4 16 35 1 35 16 0 162006 13 7 4 14 35 1 29 14 0 142007 10 6 4 12 31 0 27 12 0 12

90
a. NRAs including assistance to nontradables and via inputs and other forms of non-product-specific (NPS) assistance without and (in column (5)) with decoupled support. b. The Relative Rate of Assistance (RRA) is defined as 100*[(100+NRAagt)/ (100+NRAnonagt)-1], where NRAagt and NRAnonagt are the percentage NRAs for the tradables parts of the agricultural and non-agricultural sectors (columns 8 and 9), respectively, so it excludes decoupled payments but includes all NPS support. c. Including NPS but excluding decoupled payments, so more than the weighted average of columns (6) and (7).

91
Appendix Table 11 (continued): Annual distortion estimates, Spain, 1956 to 2007 (c) Value shares of primary production of covereda and non-covered products,
(percent)
Barley Beef Egg Maize Milk Oat Pigmea
t Potato Poultry Rapese
ed 1956 7 na na 3 na 2 6 na na na 1957 8 na na 2 na 3 6 na na na 1958 7 na na 2 na 2 6 na na na 1959 7 na na 2 na 2 6 na na na 1960 8 na na 3 na 2 5 na na na 1961 6 na na 2 na 2 6 na na na 1962 7 na na 3 na 2 6 na na na 1963 7 na na 4 na 2 8 na na na 1964 6 na na 4 na 1 9 na na na 1965 7 na na 4 na 1 10 na na na 1966 6 na na 3 na 1 12 na na na 1967 7 na na 3 na 1 14 na na na 1968 8 na na 4 na 1 13 na na na 1969 11 na na 4 na 1 13 na na na 1970 8 na na 5 na 1 14 na na na 1971 9 na na 5 na 1 13 na na na 1972 11 na na 4 na 1 12 na na na 1973 10 na na 4 na 1 15 na na na 1974 11 na na 4 na 1 18 na na na 1975 12 na na 3 na 1 16 na na na 1976 11 na na 3 na 1 17 na na na 1977 10 na na 3 na 1 21 na na na 1978 12 na na 3 na 1 23 na na na 1979 8 na na 3 na 1 28 na na na 1980 13 na na 3 na 2 28 na na na 1981 10 na na 4 na 1 31 na na na 1982 11 na na 3 na 1 29 na na na 1983 14 na na 4 na 1 14 na na na 1984 21 na na 5 na 2 11 na na na 1985 19 na na 7 na 1 11 na na na 1986 5 4 4 3 4 0 12 4 5 0 1987 4 5 5 2 2 0 14 4 4 0 1988 8 5 4 3 5 1 12 3 5 0 1989 6 4 3 2 7 0 14 4 4 0 1990 5 4 3 2 5 0 15 4 3 0 1991 5 3 4 2 6 0 15 5 4 0 1992 3 5 3 2 6 0 20 3 3 0 1993 5 6 3 1 7 0 16 2 3 0 1994 4 6 4 2 7 0 16 4 3 0 1995 3 6 3 2 8 0 18 5 3 0 1996 7 4 3 3 6 0 16 2 3 0 1997 5 4 3 3 6 0 17 1 3 0 1998 4 4 2 2 6 0 14 2 4 0 1999 4 5 2 2 6 0 12 3 3 0 2000 6 4 3 2 6 0 14 1 3 0 2001 3 3 3 3 8 0 18 2 4 0 2002 4 3 3 3 7 1 16 2 4 0 2003 5 3 4 2 7 0 14 1 4 0 2004 5 4 3 2 7 0 15 2 3 0 2005 2 3 3 2 6 0 12 1 3 0 2006 5 3 3 2 5 1 12 2 3 0 2007 11 2 2 2 5 1 10 2 2 0

92
a. At farmgate undistorted prices
Rice Sheep
meat Soybea
n Sugar Sunflo
wer Tomato Wheat Wine
Non-covere
d 1956 2 na na 1 0 8 22 22 26 1957 2 na na 2 0 9 25 18 26 1958 3 na na 1 0 10 25 18 27 1959 3 na na 1 0 11 23 20 26 1960 3 na na 2 0 12 22 16 28 1961 4 na na 2 0 14 17 19 27 1962 3 na na 1 0 13 17 21 27 1963 3 na na 2 0 12 16 20 26 1964 3 na na 2 0 14 12 23 26 1965 2 na na 1 0 13 15 20 28 1966 3 na na 1 0 12 14 20 27 1967 3 na na 1 0 11 16 15 27 1968 3 na na 1 0 12 15 15 28 1969 2 na na 1 0 12 13 14 28 1970 1 na 0 2 1 14 13 13 27 1971 2 na 0 3 1 14 13 12 27 1972 2 na 0 3 1 14 15 11 26 1973 4 na 0 4 1 13 13 11 24 1974 2 na 0 4 1 15 12 8 24 1975 2 na 0 3 2 18 11 7 26 1976 2 na 0 3 1 17 14 5 26 1977 2 na 0 1 1 18 13 4 26 1978 1 na 0 2 1 17 9 6 26 1979 2 na 0 2 1 14 7 8 26 1980 2 na 0 3 1 13 7 5 24 1981 2 na 0 2 1 14 5 5 25 1982 1 na 0 2 2 13 7 5 26 1983 1 na 0 3 3 16 9 5 29 1984 1 na 0 1 4 13 10 4 27 1985 1 na 0 1 3 14 8 5 29 1986 1 3 0 1 2 11 4 17 20 1987 1 3 0 1 2 11 4 17 21 1988 1 2 0 1 2 10 5 11 21 1989 0 2 0 1 1 12 5 15 19 1990 0 2 0 1 2 13 3 19 19 1991 1 2 0 1 1 12 3 16 21 1992 1 2 0 1 2 10 3 17 19 1993 0 4 0 1 2 11 3 15 20 1994 0 4 0 1 2 13 3 12 20 1995 0 3 0 1 1 11 3 13 20 1996 1 3 0 1 1 11 5 15 19 1997 1 4 0 1 2 11 3 18 18 1998 1 3 0 1 2 13 3 18 19 1999 1 4 0 1 1 14 3 20 19 2000 1 3 0 1 1 12 4 20 18 2001 1 3 0 1 1 12 3 16 19 2002 1 4 0 1 1 13 4 16 19 2003 1 4 0 0 1 13 4 16 21 2004 1 4 0 0 1 11 4 17 20 2005 1 3 0 0 0 14 2 24 24 2006 1 3 0 0 1 11 3 24 24 2007 1 2 0 0 1 10 6 19 24

93
Appendix Table 11 (continued): Annual distortion estimates, Spain, 1956 to 2007 (d) Trade status of of covered productsa
Barley Beef Egg Maize Milk Oat Pigme
at Potato Poultr
y Rapes
eed 1956 M na na M na M M na na na1957 M na na M na M M na na na1958 M na na M na M M na na na1959 M na na M na M M na na na1960 M na na M na M M na na na1961 M na na M na M M na na na1962 M na na M na M M na na na1963 M na na M na M M na na na1964 M na na M na M M na na na1965 M na na M na M M na na na1966 M na na M na M M na na na1967 M na na M na M M na na na1968 M na na M na M M na na na1969 M na na M na M M na na na1970 M na na M na M M na na na1971 M na na M na M M na na na1972 M na na M na M M na na na1973 M na na M na M M na na na1974 M na na M na M M na na na1975 M na na M na M M na na na1976 M na na M na M M na na na1977 M na na M na M M na na na1978 M na na M na M M na na na1979 M na na M na M M na na na1980 M na na M na M M na na na1981 M na na M na M M na na na1982 M na na M na M M na na na1983 M na na M na M M na na na1984 M na na M na M M na na na1985 M na na M na M M na na na1986 M M M M M M M M M M1987 M M M M M M M M M M1988 M M M M M M M M M M1989 M M M M M M M M M M1990 M M M M M M M M M M1991 M M M M M M M M M M1992 M M M M M M M M M X1993 M M M M M M M M M X1994 M M M M M M M M M M1995 M M M M M M M M M M1996 X M M M M M M M M X1997 X M M M M M M M M X1998 M M M M M M M M M X1999 M M M M M M M M M X2000 X M X M M M M M M X2001 X M X M M M M M M M2002 X M X M M M M M M X2003 X M X M M M M M M X2004 X M X M M M M M M X2005 X M M M M M M M M X2006 X M M M M M M M M X2007 X M M M M M M M M X

94
Rice Sheepmeat
Soybean Sugar
Sunflower
Tomato Wheat Wine
1956 X na na M M X M X1957 X na na M M X M X1958 X na na M M X M X1959 X na na M M X M X1960 X na na M M X M X1961 X na na M M X M X1962 X na na M M X M X1963 X na na M M X M X1964 X na na M M X M X1965 X na na M M X M X1966 X na na M M X M X1967 X na na M M X M X1968 X na na M M X M X1969 X na na M M X M X1970 X na M M M X M X1971 X na M M M X M X1972 X na M M M X M X1973 X na M M M X M X1974 X na M M M X M X1975 X na M M M X M X1976 X na M M M X M X1977 X na M M M X M X1978 X na M M M X M X1979 X na M M M X M X1980 X na M M M X M X1981 X na M M M X M X1982 X na M M M X M X1983 X na M M M X M X1984 X na M M M X M X1985 X na M M M X M X1986 X M M M M M M X1987 X M M M M M M X1988 X M M M M M M X1989 X M M M M X M X1990 X M M M M X M X1991 X M M M M X M X1992 X M M M M X M X1993 X M M M M X M X1994 X M M M M X M X1995 X M M M M X M X1996 X M M M M X X X1997 X M M M M X X X1998 X M M M M X X X1999 X M M M M X X X2000 X M M M M X X X2001 X M M M M X X X2002 X M M M M X X X2003 X M M M M X X X2004 X M M M M X X X2005 X M M M M X X X2006 X M M M M X X X2007 X M M M M X X X
a. Exportables (X), import-competing products (M) and nontradables (H). Source: Anderson and Valenzuela (2008), based on author’s spreadsheet

95
Appendix Table 12: Annual distortion estimates, Sweden, 1956 to 2007 (a) Nominal rates of assistance to covered products
(percent)
Barle
y Beef Egg Milk Oat Pigm
eat Potat
o Poult
ry Rapeseed
Sheepmea
t Suga
r Whe
at
All cover
ed 1956 17 83 na 269 -17 69 46 33 26 65 97 10 77 1957 34 121 na 335 -18 61 131 33 27 65 65 18 102 1958 54 118 na 225 10 54 204 33 27 65 92 15 100 1959 44 120 na 324 42 49 220 33 24 65 104 14 115 1960 43 168 na 265 21 40 65 33 23 65 101 25 96 1961 68 167 na 401 29 62 250 33 21 65 108 33 131 1962 66 174 na 462 43 109 223 33 20 65 104 83 155 1963 70 131 na 354 37 114 289 33 19 65 38 80 144 1964 64 86 na 297 55 96 329 33 19 65 55 65 121 1965 60 64 na 381 54 133 286 33 17 65 142 82 132 1966 57 61 na 377 52 157 270 33 16 65 166 72 138 1967 74 78 na 404 65 133 281 33 16 65 130 63 132 1968 91 108 na 457 77 139 276 33 17 65 99 66 147 1969 64 112 na 430 50 154 282 33 16 65 83 64 141 1970 36 105 na 417 25 160 218 33 16 65 59 5 111 1971 69 109 na 454 20 152 208 33 15 65 42 33 121 1972 19 116 na 448 9 121 184 33 13 65 34 -12 94 1973 -2 65 na 356 -11 106 136 33 10 65 18 -36 60 1974 -8 30 na 349 -15 92 126 33 8 65 10 -33 42 1975 24 43 na 406 20 79 135 33 9 65 23 -9 74 1976 17 62 na 554 2 132 159 33 9 65 34 -18 82 1977 53 45 na 885 21 87 129 33 8 65 48 -26 89 1978 37 48 na 749 53 127 122 33 9 65 42 3 112 1979 53 33 na 667 62 168 111 33 9 65 20 14 119 1980 6 28 na 633 -34 121 97 33 10 65 12 28 74 1981 8 45 na 401 -1 165 138 33 8 65 21 39 83 1982 3 63 na 371 22 165 144 33 8 65 29 45 92 1983 17 299 na 345 -10 157 68 33 8 65 26 15 103 1984 5 315 na 363 -5 107 86 33 5 65 35 23 82 1985 29 334 na 334 3 47 82 33 6 65 35 47 88 1986 163 52 69 267 87 35 95 33 11 65 254 134 115 1987 223 76 58 213 54 52 68 45 17 187 227 144 117 1988 97 103 87 167 17 32 76 53 12 177 127 85 91 1989 70 89 86 150 36 26 53 51 12 173 97 65 78 1990 105 78 82 218 63 27 66 35 141 165 143 129 103 1991 121 172 177 230 44 35 73 32 136 210 219 147 121 1992 108 112 154 176 47 38 99 21 131 98 160 75 103 1993 74 102 173 146 2 52 44 13 51 54 102 40 81 1994 102 75 351 144 39 26 70 11 115 59 125 41 83 1995 41 69 12 79 40 16 15 129 0 77 119 16 46 1996 2 68 5 70 34 16 14 77 0 45 140 0 36 1997 7 117 1 78 25 13 12 55 0 27 147 0 40 1998 64 121 11 100 50 22 11 51 0 38 186 26 61 1999 44 125 16 106 84 57 11 90 0 37 245 37 76 2000 3 113 3 57 59 32 10 57 1 26 176 11 45 2001 0 140 0 40 29 24 10 52 0 48 138 4 35 2002 0 157 0 75 0 24 10 56 0 35 161 0 44 2003 1 157 0 70 1 33 10 54 0 46 240 2 45 2004 1 92 0 62 23 27 10 101 0 33 238 2 40 2005 0 109 0 33 24 19 10 69 0 54 168 0 25 2006 0 81 0 24 0 14 10 42 0 74 62 0 19 2007 0 66 0 0 0 17 10 99 0 68 99 0 10

96
Appendix Table 12 (continued): Annual distortion estimates, Sweden, 1956 to 2007 (b) Nominal and relative rates of assistance to alla agricultural products, to exportableb and import-competing b agricultural industries, and relativec to non-agricultural industries (percent)
NRA, all agric products,a by component NRA, agric tradables
NRA, covere
d produc
ts (1)
NRA, non-
covered
products
(2)
NRA, non-
product-specific support
(3)
NRA, all ag
products (incl NPS)
(4)=1+2+3
NRA, all ag products (incl NPS
and decoupled)
(5)
NRA, ag export- ables (6)
NRA, ag import- competi
ng (7)
NRA, all agric
tradable goods c (8)=6+7
NRA, all non-ag tradable goods
(9) RRAb
(10) 1956 77 40 na 68 68 19 126 68 2 641957 102 55 na 90 90 25 170 90 2 861958 100 51 na 87 87 30 154 87 3 831959 115 62 na 101 101 35 186 101 3 961960 96 50 na 85 85 29 153 85 3 801961 131 75 na 117 117 41 226 117 3 1111962 155 83 na 136 136 63 232 136 3 1301963 144 70 na 124 124 63 192 124 2 1181964 121 63 na 106 106 59 168 106 2 1011965 132 68 na 115 115 65 180 115 2 1101966 138 66 na 119 119 73 169 119 2 1141967 132 68 na 115 115 68 178 115 2 1111968 147 77 na 129 129 75 202 129 2 1251969 141 72 na 123 123 69 192 123 2 1191970 111 61 na 98 98 46 174 98 1 951971 121 68 na 107 107 54 187 107 1 1041972 94 62 na 86 86 27 188 86 1 841973 60 40 na 55 55 8 133 55 1 531974 42 28 na 39 39 1 99 39 1 381975 74 43 na 67 67 24 131 67 1 651976 82 53 na 75 75 21 168 75 1 741977 89 57 na 81 81 25 176 81 1 801978 112 60 na 99 99 47 171 99 0 981979 119 57 na 103 103 64 146 103 0 1021980 74 41 na 66 66 20 130 66 0 651981 83 46 na 74 74 33 133 74 0 731982 92 51 na 82 82 39 146 82 0 811983 103 66 na 94 94 33 202 94 0 931984 82 64 na 78 78 21 201 78 0 771985 88 64 na 82 82 25 199 82 0 821986 115 78 0 108 108 109 105 108 0 1081987 117 76 1 110 110 108 113 110 0 1091988 91 43 1 82 82 84 63 82 1 811989 78 23 2 68 68 71 37 68 0 671990 103 39 5 91 91 93 56 91 0 911991 121 61 9 113 113 102 110 113 0 1121992 103 51 5 95 95 88 94 95 1 931993 81 48 2 75 75 70 79 75 1 731994 83 0 2 65 65 88 69 65 1 631995 46 0 5 40 56 na 46 40 1 391996 36 17 4 35 51 8 42 35 1 341997 40 20 4 40 56 11 46 40 1 391998 61 30 4 58 74 27 61 58 1 561999 76 38 4 70 87 34 74 70 1 692000 45 23 3 43 61 11 54 43 1 422001 35 18 4 35 52 7 42 35 1 342002 44 21 5 43 61 8 54 43 1 422003 45 23 5 44 64 8 57 44 1 432004 40 19 4 39 57 7 50 39 1 382005 25 13 4 24 42 0 38 24 1 232006 19 9 4 19 40 0 25 19 1 182007 10 5 4 12 30 0 17 12 1 11

97
a. NRAs including assistance to nontradables and via inputs and other forms of non-product-specific (NPS) assistance without and (in column (5)) with decoupled support. b. The Relative Rate of Assistance (RRA) is defined as 100*[(100+NRAagt)/ (100+NRAnonagt)-1], where NRAagt and NRAnonagt are the percentage NRAs for the tradables parts of the agricultural and non-agricultural sectors (columns 8 and 9), respectively, so it excludes decoupled payments but includes all NPS support. c. Including NPS but excluding decoupled payments, so more than the weighted average of columns (6) and (7).

98
Appendix Table 12 (continued): Annual distortion estimates, Sweden, 1956 to 2007 (c) Value shares of primary production of covereda and non-covered products,
(percent)
Barle
y Beef Egg Milk Oat Pigm
eat Potat
o Poult
ry Rapeseed
Sheepmea
t Suga
r Whe
at
Non-cover
ed 1956 6 8 na 13 12 13 9 1 0 0 2 10 25 1957 5 8 na 13 9 16 7 1 3 0 3 8 25 1958 5 8 na 15 9 17 6 1 3 0 2 8 26 1959 6 9 na 13 9 20 5 1 2 0 2 7 26 1960 6 7 na 15 8 18 8 1 3 0 1 9 25 1961 7 7 na 11 12 16 6 2 3 0 2 9 25 1962 8 9 na 10 11 13 7 2 3 0 1 8 26 1963 9 10 na 11 10 12 7 2 2 0 3 6 27 1964 10 10 na 12 10 12 4 1 3 0 2 8 26 1965 11 12 na 11 10 10 5 1 5 0 1 8 26 1966 11 16 na 12 9 11 5 2 2 0 1 5 27 1967 10 13 na 10 10 10 4 2 5 0 1 9 26 1968 10 12 na 9 10 11 5 2 5 0 1 8 26 1969 12 14 na 10 8 11 3 2 4 0 1 7 26 1970 13 12 na 8 11 10 5 1 4 0 2 9 25 1971 12 11 na 9 13 10 4 1 5 0 2 7 25 1972 13 9 na 8 11 10 4 1 6 0 3 11 24 1973 12 10 na 8 8 10 3 1 6 0 4 14 23 1974 13 11 na 7 9 8 3 1 6 0 6 14 22 1975 11 13 na 8 8 12 3 1 6 0 3 12 24 1976 12 12 na 7 9 10 3 1 4 0 2 18 23 1977 9 14 na 5 8 13 4 1 5 0 1 16 23 1978 12 15 na 6 7 12 5 2 5 0 2 9 25 1979 11 17 na 7 7 11 5 2 4 0 3 7 26 1980 12 15 na 6 14 10 4 1 4 0 4 6 24 1981 16 13 na 8 13 8 3 1 4 0 2 6 24 1982 17 12 na 10 10 9 3 1 5 0 2 8 24 1983 14 5 na 12 11 10 4 2 5 0 2 13 24 1984 18 4 na 9 13 10 5 1 7 0 1 10 22 1985 14 4 na 10 12 15 4 1 6 0 1 8 23 1986 6 13 4 17 5 19 4 2 3 0 2 6 18 1987 4 12 4 21 6 18 4 2 2 0 1 6 19 1988 6 10 3 21 7 17 4 1 2 0 2 5 21 1989 7 9 3 19 6 16 4 2 3 0 2 7 22 1990 6 10 3 15 6 16 6 2 3 0 2 7 25 1991 6 7 2 16 7 18 6 3 2 0 1 4 28 1992 4 10 2 20 4 17 5 3 2 0 2 6 26 1993 5 9 2 19 6 14 4 3 3 0 2 7 25 1994 11 9 1 18 5 16 5 3 1 0 2 5 24 1995 9 7 3 20 4 14 4 2 1 0 2 10 24 1996 9 7 3 20 4 14 4 2 1 0 2 10 23 1997 8 6 3 20 4 16 3 2 1 0 2 9 24 1998 5 7 3 21 4 13 7 3 1 0 2 9 25 1999 7 8 3 23 3 10 7 2 1 0 2 7 26 2000 7 7 4 25 3 11 3 2 1 0 2 10 24 2001 7 5 3 27 3 13 4 3 1 0 2 10 24 2002 7 5 4 22 6 12 4 3 2 0 2 9 24 2003 7 5 4 23 4 11 4 3 1 0 1 11 25 2004 7 6 3 24 3 11 5 2 2 0 1 11 24 2005 9 7 5 13 3 14 5 3 2 1 1 13 24 2006 6 5 4 23 4 11 5 2 3 0 2 11 24 2007 11 4 3 17 5 8 5 2 3 0 1 18 24 a. At farmgate undistorted prices

99
Appendix Table 12 (continued): Annual distortion estimates, Sweden, 1956 to 2007 (d) Trade status of of covered productsa
Barle
y Beef Egg Milk Oat Pigm
eat Potat
o Poult
ry Rapeseed
Sheepmea
t Sugar Whea
t 1956 X M na M X X M M X M M X1957 X M na M X X M M X M M X1958 X M na M X X M M X M M X1959 X M na M X X M M X M M X1960 X M na M X X M M X M M X1961 X M na M X X M M X M M X1962 X M na M X X M M X M M X1963 X M na M X X M M X M M X1964 X M na M X X M M X M M X1965 X M na M X X M M X M M X1966 X M na M X X M M X M M X1967 X M na M X X M M X M M X1968 X M na M X X M M X M M X1969 X M na M X X M M X M M X1970 X M na M X X M M X M M X1971 X M na M X X M M X M M X1972 X M na M X X M M X M M X1973 X M na M X X M M X M M X1974 X M na M X X M M X M M X1975 X M na M X X M M X M M X1976 X M na M X X M M X M M X1977 X M na M X X M M X M M X1978 X M na M X X M M X M M X1979 X M na M X X M M X M M X1980 X M na M X X M M X M M X1981 X M na M X X M M X M M X1982 X M na M X X M M X M M X1983 X M na M X X M M X M M X1984 X M na M X X M M X M M X1985 X M na M X X M M X M M X1986 X X X X X X M X X M X X1987 X X X X X X M X X M M X1988 X X X X X X M X X M X X1989 X X X X X X M X X M X X1990 X X X X X X M X X M X X1991 X M X X X X M X X M M X1992 X M X X X X M X X M M M1993 X M X X X X M X X M X X1994 X M X X X X M X X M M M1995 M M M M M M M M M M M M1996 X M M M M M M M X M M X1997 X M M M M M M M X M M X1998 M M M M M M M M X M M X1999 M M M M M M M M X M M X2000 X M X M M M M M X M M X2001 X M X M M M M M M M M X2002 X M X M M M M M X M M X2003 X M X M M M M M X M M X2004 X M X M M M M M X M M X2005 X M M M M M M M X M M X2006 X M M M M M M M X M M X2007 X M M M M M M M X M M X
a. Exportables (X), import-competing products (M) and nontradables (H). Source: Anderson and Valenzuela (2008), based on author’s spreadsheet

100
Appendix Table 13: Annual distortion estimates, Switzerland, 1956 to 2007 (a) Nominal rates of assistance to covered products
(percent)
Barle
y Beef Egg Maiz
e Milk Oat Oilse
ed Pigm
eat Poult
ry
Sheepmea
t Suga
r Whe
at
All cove
red 1956 na 252 285 156 295 na na 160 334 124 384 296 255 1957 na 252 285 156 295 na na 160 334 124 384 296 256 1958 na 252 285 156 295 na na 160 334 124 384 296 256 1959 na 252 285 156 295 na na 160 334 124 384 296 256 1960 na 252 285 156 295 na na 160 334 124 384 296 255 1961 na 252 285 156 295 na na 160 334 124 384 296 253 1962 na 252 285 156 295 na na 160 334 124 384 296 256 1963 na 252 285 156 295 na na 160 334 124 384 296 253 1964 na 252 285 156 295 na na 160 334 124 384 296 253 1965 na 252 285 156 295 na na 160 334 124 384 296 251 1966 na 252 285 156 295 na na 160 334 124 384 296 251 1967 na 252 285 156 295 na na 160 334 124 384 296 251 1968 na 252 285 156 295 na na 160 334 124 384 296 249 1969 na 252 285 156 295 na na 160 334 124 384 296 246 1970 na 252 285 156 295 na na 160 334 124 384 296 246 1971 na 252 285 156 295 na na 160 334 124 384 296 244 1972 na 252 285 156 295 na na 160 334 124 384 296 244 1973 na 252 285 156 295 na na 160 334 124 384 296 241 1974 na 252 285 156 295 na na 160 334 124 384 296 242 1975 na 252 285 156 295 na na 160 334 124 384 296 240 1976 na 252 285 156 295 na na 160 334 124 384 296 242 1977 na 252 285 156 295 na na 160 334 124 384 296 240 1978 na 252 285 156 295 na na 160 334 124 384 296 241 1979 405 252 285 156 295 444 481 160 334 124 384 296 237 1980 303 202 232 137 243 296 542 160 309 120 230 222 204 1981 256 230 234 89 169 199 499 160 347 75 102 175 178 1982 305 287 293 137 166 268 597 160 369 133 194 240 194 1983 422 369 351 131 228 418 589 160 420 181 339 273 234 1984 292 398 310 102 257 270 275 160 409 168 414 209 242 1985 384 423 329 134 437 313 423 160 398 164 472 254 298 1986 1092 454 554 192 712 na 440 160 578 305 334 278 398 1987 1770 314 469 249 795 na 746 218 702 476 365 315 419 1988 1148 242 599 297 826 na 499 260 604 545 353 312 432 1989 609 236 502 217 248 na 452 141 529 464 283 218 230 1990 605 329 441 194 548 na 646 206 596 524 213 248 349 1991 1057 473 432 201 418 na 639 245 536 485 271 248 367 1992 609 191 513 154 264 na 616 115 591 399 345 264 224 1993 520 209 457 175 385 na 432 207 600 251 321 282 299 1994 579 295 460 118 319 na 321 225 613 262 323 267 292 1995 617 191 574 130 153 na 397 154 643 368 277 283 184 1996 274 100 377 92 271 na 353 157 499 178 244 153 201 1997 na 129 393 116 252 na 277 140 388 132 231 196 201 1998 na 134 422 151 256 na 259 210 459 183 195 230 225 1999 na 120 463 131 270 na 385 278 492 173 217 206 239 2000 na 221 292 92 197 na 322 187 463 147 280 143 198 2001 na 194 283 58 174 na 259 138 409 147 229 56 161 2002 na 147 237 101 233 na 253 181 527 117 225 81 198 2003 na 126 178 117 160 na 232 214 534 92 263 67 166 2004 na 172 263 78 122 na 234 182 581 65 279 48 142 2005 na 156 287 91 131 na 287 131 464 37 251 48 136 2006 na 176 261 78 57 na na 118 492 71 145 64 98 2007 na 69 202 22 14 na na 82 376 70 124 34 44

Appendix Table 13 (continued): Annual distortion estimates, Switzerland, 1956 to 2007 (b) Nominal and relative rates of assistance to alla agricultural products, to exportableb and import-competing b agricultural industries, and relativec to non-agricultural industries (percent)
NRA, all agric products,a by component NRA, agric tradables
NRA, covere
d produc
ts (1)
NRA, non-
covered
products
(2)
NRA, non-
product-specific support
(3)
NRA, all ag
products (incl NPS)
(4)=1+2+3
NRA, all ag products (incl NPS
and decoupled)
(5)
NRA, ag export- ables (6)
NRA, ag import- competi
ng (7)
NRA, all agric
tradable goods c (8)=6+7
NRA, all non-ag tradable goods
(9) RRAb
(10) 1956 255 246 na 252 252 310 210 252 5 2361957 256 247 na 254 254 311 214 254 5 2381958 256 247 na 253 253 311 212 253 5 2351959 256 243 na 252 252 309 212 252 5 2351960 255 241 na 251 251 308 211 251 6 2331961 253 244 na 251 251 310 209 251 6 2321962 256 247 na 253 253 311 214 253 5 2351963 253 246 na 251 251 310 211 251 5 2331964 253 244 na 250 250 311 212 250 5 2321965 251 246 na 249 249 312 210 249 6 2311966 251 247 na 250 250 312 210 250 6 2321967 251 246 na 250 250 312 211 250 6 2311968 249 245 na 248 248 312 209 248 6 2291969 246 245 na 246 246 313 207 246 5 2281970 246 245 na 246 246 312 207 246 4 2321971 244 245 na 244 244 314 206 244 4 2301972 244 245 na 244 244 315 206 244 5 2291973 241 243 na 241 241 314 202 241 4 2281974 242 246 na 243 243 316 206 243 3 2321975 240 246 na 242 242 315 202 242 4 2281976 242 242 na 242 242 313 204 242 4 2291977 240 241 na 240 240 313 201 240 3 2291978 241 243 na 242 242 314 203 242 4 2301979 237 242 13 251 264 342 227 251 3 2401980 204 243 12 223 237 344 199 223 3 2151981 178 242 11 200 213 343 175 200 3 1921982 194 238 12 213 227 337 189 213 3 2041983 234 240 16 251 270 341 224 251 3 2421984 242 243 16 258 277 344 231 258 2 2491985 298 243 18 304 328 345 279 304 2 2951986 398 242 37 393 411 558 261 393 3 3811987 419 265 37 415 436 615 270 415 2 4031988 432 264 32 418 440 632 269 418 2 4061989 230 115 19 217 236 207 191 217 2 2101990 349 211 21 332 354 443 244 332 2 3231991 367 176 22 330 361 339 286 330 2 3201992 224 111 17 209 236 219 170 209 3 2011993 299 151 24 280 318 314 216 280 3 2691994 292 140 27 274 319 264 235 274 3 2631995 184 89 19 177 214 131 185 177 3 1681996 201 105 20 195 249 224 139 195 3 1861997 201 104 22 195 255 209 145 195 3 1861998 225 114 22 214 275 212 175 214 3 2051999 239 121 20 223 305 222 186 223 3 2132000 198 94 17 186 259 163 173 186 3 1772001 161 78 18 155 229 145 130 155 3 1482002 198 92 19 186 270 190 146 186 3 1772003 166 85 17 160 240 133 152 160 3 1522004 142 68 15 137 208 101 143 137 3 1302005 136 66 12 118 195 131 140 118 2 1142006 98 48 11 87 155 57 140 87 2 832007 44 21 8 44 96 14 78 44 2 41
a. NRAs including assistance to nontradables and via inputs and other forms of non-product-specific (NPS) assistance without and (in column (5)) with decoupled support.

2
b. The Relative Rate of Assistance (RRA) is defined as 100*[(100+NRAagt)/ (100+NRAnonagt)-1], where NRAagt and NRAnonagt are the percentage NRAs for the tradables parts of the agricultural and non-agricultural sectors (columns 8 and 9), respectively, so it excludes decoupled payments but includes all NPS support. c. Including NPS but excluding decoupled payments, so more than the weighted average of columns (6) and (7).

3
Appendix Table 13 (continued): Annual distortion estimates, Switzerland, 1956 to 2007 (c) Value shares of primary production of covereda and non-covered products, (percent)
Barley Beef Egg Maize Milk Oat Oilsee
d Pigme
at Poultr
y Sheep
meat Sugar Wheat
Non-cover
ed 1956 na 14 2 0 28 na na 17 1 1 2 6 29 1957 na 13 2 0 27 na na 17 1 1 2 8 29 1958 na 13 2 0 27 na na 17 1 1 2 8 29 1959 na 12 2 0 27 na na 17 1 1 2 8 29 1960 na 12 2 0 26 na na 18 1 1 2 9 29 1961 na 13 2 0 26 na na 18 1 1 2 8 29 1962 na 14 2 0 26 na na 17 1 1 2 10 29 1963 na 14 2 0 26 na na 18 2 1 2 7 29 1964 na 13 2 0 25 na na 19 2 1 2 9 29 1965 na 12 2 0 25 na na 20 2 1 2 8 28 1966 na 13 2 0 25 na na 19 3 1 2 7 28 1967 na 13 2 0 24 na na 20 3 1 1 8 28 1968 na 13 2 0 23 na na 21 3 1 1 8 28 1969 na 13 2 1 23 na na 22 3 1 1 7 28 1970 na 14 2 1 23 na na 22 3 1 1 7 28 1971 na 13 2 1 22 na na 23 3 1 1 7 28 1972 na 12 2 1 21 na na 23 3 1 1 8 27 1973 na 12 2 2 21 na na 24 3 0 1 7 27 1974 na 13 2 2 21 na na 23 3 1 1 8 27 1975 na 13 2 2 22 na na 24 3 1 1 6 28 1976 na 13 2 2 21 na na 24 3 1 2 6 28 1977 na 13 2 1 21 na na 25 3 1 2 5 28 1978 na 13 2 1 21 na na 24 3 1 1 6 28 1979 1 17 2 1 24 0 0 30 1 1 1 4 19 1980 1 17 2 1 25 0 0 30 1 1 1 4 17 1981 1 13 2 1 31 0 0 26 1 1 2 4 16 1982 1 13 2 1 32 0 0 28 1 1 1 4 17 1983 1 11 2 1 30 0 0 28 1 0 1 4 19 1984 2 11 2 1 27 0 1 27 1 0 1 6 20 1985 1 12 2 2 21 0 1 31 1 1 1 6 21 1986 1 14 2 2 19 na 1 26 1 1 2 7 26 1987 0 18 2 2 18 na 1 24 0 0 1 6 27 1988 1 20 2 2 18 na 1 19 0 0 2 7 28 1989 1 13 1 2 29 na 1 18 0 0 1 6 28 1990 1 15 2 2 20 na 0 22 0 0 2 7 28 1991 1 11 1 2 26 na 1 18 0 0 1 7 31 1992 1 11 1 2 30 na 0 19 0 0 1 5 29 1993 2 15 1 2 26 na 1 16 1 1 1 6 29 1994 1 13 1 3 29 na 0 15 1 1 1 6 29 1995 1 12 1 2 38 na 0 12 0 0 1 5 28 1996 2 14 1 2 28 na 1 15 1 1 2 8 28 1997 na 11 1 2 30 na 1 16 1 1 2 6 29 1998 na 12 1 2 31 na 1 14 1 1 2 6 30 1999 na 13 1 2 32 na 1 11 1 1 2 5 30 2000 na 10 1 2 34 na 0 14 1 1 2 6 29 2001 na 8 1 2 36 na 0 15 1 1 1 6 28 2002 na 9 2 2 33 na 1 15 1 1 2 6 29 2003 na 8 2 1 38 na 1 13 1 1 1 5 29 2004 na 8 1 1 38 na 1 12 1 1 1 7 28 2005 na 15 1 1 36 na 1 15 1 1 2 6 22 2006 na 14 1 1 40 na na 14 1 1 2 5 22 2007 na 16 1 1 43 na na 12 1 1 2 5 19 a. At farmgate undistorted prices

4
Appendix Table 13 (continued): Annual distortion estimates, Switzerland, 1956 to 2007 (d) Trade status of of covered productsa
Barle
y Beef Egg Maiz
e Milk Oat Oilse
ed Pigm
eat Poult
ry
Sheepmea
t Sugar Whea
t 1956 na M M M X na na M M M M M1957 na M M M X na na M M M M M1958 na M M M X na na M M M M M1959 na M M M X na na M M M M M1960 na M M M X na na M M M M M1961 na M M M X na na M M M M M1962 na M M M X na na M M M M M1963 na M M M X na na M M M M M1964 na M M M X na na M M M M M1965 na M M M X na na M M M M M1966 na M M M X na na M M M M M1967 na M M M X na na M M M M M1968 na M M M X na na M M M M M1969 na M M M X na na M M M M M1970 na M M M X na na M M M M M1971 na M M M X na na M M M M M1972 na M M M X na na M M M M M1973 na M M M X na na M M M M M1974 na M M M X na na M M M M M1975 na M M M X na na M M M M M1976 na M M M X na na M M M M M1977 na M M M X na na M M M M M1978 na M M M X na na M M M M M1979 M M M M M M M M M M M M1980 M M M M M M M M M M M M1981 M M M M M M M M M M M M1982 M M M M M M M M M M M M1983 M M M M M M M M M M M M1984 M M M M M M M M M M M M1985 M M M M M M M M M M M M1986 M M M M X na M M M M M M1987 M M M M X na M M M M M M1988 M M M M X na M M M M M M1989 M M M M X na M M M M M M1990 M M M M X na M M M M M M1991 M M M M X na M M M M M M1992 M M M M X na M M M M M M1993 M M M M X na M M M M M M1994 M M M M X na M M M M M M1995 M M M M X na M M M M M M1996 M M M M X na M M M M M M1997 na M M M X na M M M M M M1998 na M M M X na M M M M M M1999 na M M M X na M M M M M M2000 na M M M X na M M M M M M2001 na M M M X na M M M M M M2002 na M M M X na M M M M M M2003 na M M M X na M M M M M M2004 na M M M X na M M M M M M2005 na M M M X na M M M M M M2006 na M M M X na na M M M M M2007 na M M M X na na M M M M Ma. Exportables (X), import-competing products (M) and nontradables (H). Source: Anderson and Valenzuela (2008), based on author’s spreadsheet
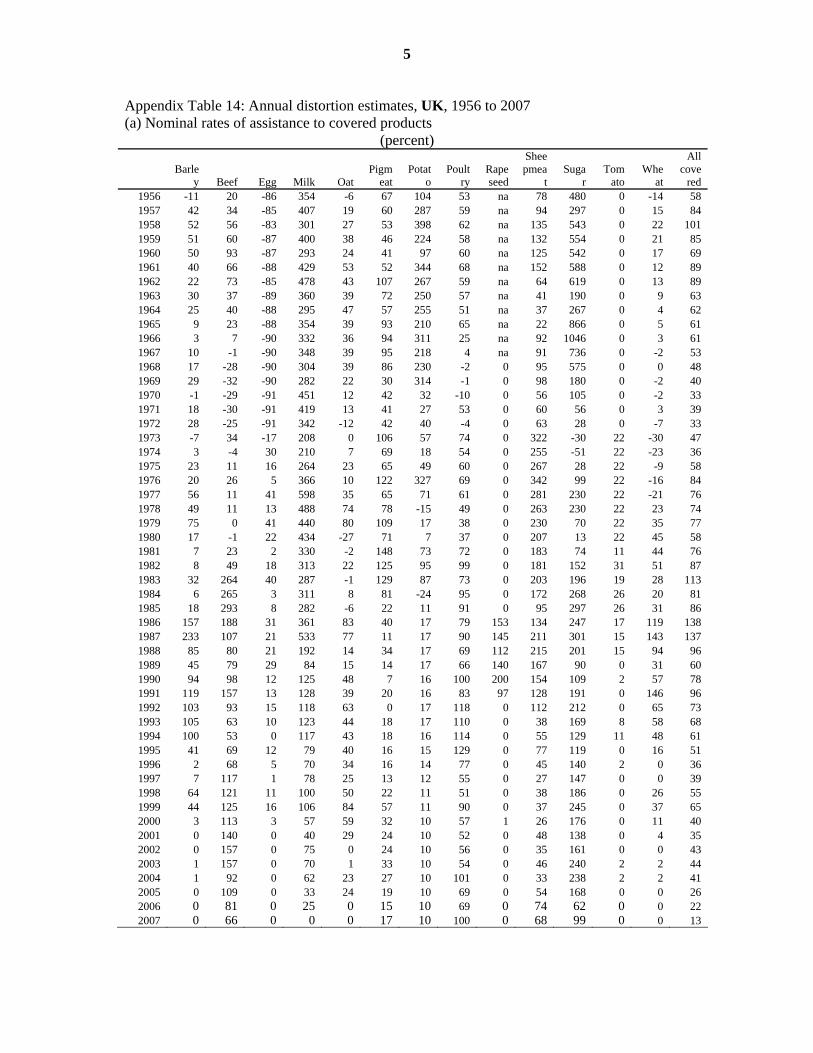
5
Appendix Table 14: Annual distortion estimates, UK, 1956 to 2007 (a) Nominal rates of assistance to covered products
(percent)
Barle
y Beef Egg Milk Oat Pigm
eat Potat
o Poult
ry Rapeseed
Sheepmea
t Suga
r Tom
ato Whe
at
All cove
red 1956 -11 20 -86 354 -6 67 104 53 na 78 480 0 -14 58 1957 42 34 -85 407 19 60 287 59 na 94 297 0 15 84 1958 52 56 -83 301 27 53 398 62 na 135 543 0 22 101 1959 51 60 -87 400 38 46 224 58 na 132 554 0 21 85 1960 50 93 -87 293 24 41 97 60 na 125 542 0 17 69 1961 40 66 -88 429 53 52 344 68 na 152 588 0 12 89 1962 22 73 -85 478 43 107 267 59 na 64 619 0 13 89 1963 30 37 -89 360 39 72 250 57 na 41 190 0 9 63 1964 25 40 -88 295 47 57 255 51 na 37 267 0 4 62 1965 9 23 -88 354 39 93 210 65 na 22 866 0 5 61 1966 3 7 -90 332 36 94 311 25 na 92 1046 0 3 61 1967 10 -1 -90 348 39 95 218 4 na 91 736 0 -2 53 1968 17 -28 -90 304 39 86 230 -2 0 95 575 0 0 48 1969 29 -32 -90 282 22 30 314 -1 0 98 180 0 -2 40 1970 -1 -29 -91 451 12 42 32 -10 0 56 105 0 -2 33 1971 18 -30 -91 419 13 41 27 53 0 60 56 0 3 39 1972 28 -25 -91 342 -12 42 40 -4 0 63 28 0 -7 33 1973 -7 34 -17 208 0 106 57 74 0 322 -30 22 -30 47 1974 3 -4 30 210 7 69 18 54 0 255 -51 22 -23 36 1975 23 11 16 264 23 65 49 60 0 267 28 22 -9 58 1976 20 26 5 366 10 122 327 69 0 342 99 22 -16 84 1977 56 11 41 598 35 65 71 61 0 281 230 22 -21 76 1978 49 11 13 488 74 78 -15 49 0 263 230 22 23 74 1979 75 0 41 440 80 109 17 38 0 230 70 22 35 77 1980 17 -1 22 434 -27 71 7 37 0 207 13 22 45 58 1981 7 23 2 330 -2 148 73 72 0 183 74 11 44 76 1982 8 49 18 313 22 125 95 99 0 181 152 31 51 87 1983 32 264 40 287 -1 129 87 73 0 203 196 19 28 113 1984 6 265 3 311 8 81 -24 95 0 172 268 26 20 81 1985 18 293 8 282 -6 22 11 91 0 95 297 26 31 86 1986 157 188 31 361 83 40 17 79 153 134 247 17 119 138 1987 233 107 21 533 77 11 17 90 145 211 301 15 143 137 1988 85 80 21 192 14 34 17 69 112 215 201 15 94 96 1989 45 79 29 84 15 14 17 66 140 167 90 0 31 60 1990 94 98 12 125 48 7 16 100 200 154 109 2 57 78 1991 119 157 13 128 39 20 16 83 97 128 191 0 146 96 1992 103 93 15 118 63 0 17 118 0 112 212 0 65 73 1993 105 63 10 123 44 18 17 110 0 38 169 8 58 68 1994 100 53 0 117 43 18 16 114 0 55 129 11 48 61 1995 41 69 12 79 40 16 15 129 0 77 119 0 16 51 1996 2 68 5 70 34 16 14 77 0 45 140 2 0 36 1997 7 117 1 78 25 13 12 55 0 27 147 0 0 39 1998 64 121 11 100 50 22 11 51 0 38 186 0 26 55 1999 44 125 16 106 84 57 11 90 0 37 245 0 37 65 2000 3 113 3 57 59 32 10 57 1 26 176 0 11 40 2001 0 140 0 40 29 24 10 52 0 48 138 0 4 35 2002 0 157 0 75 0 24 10 56 0 35 161 0 0 43 2003 1 157 0 70 1 33 10 54 0 46 240 2 2 44 2004 1 92 0 62 23 27 10 101 0 33 238 2 2 41 2005 0 109 0 33 24 19 10 69 0 54 168 0 0 26 2006 0 81 0 25 0 15 10 69 0 74 62 0 0 22 2007 0 66 0 0 0 17 10 100 0 68 99 0 0 13

6
Appendix Table 14 (continued): Annual distortion estimates, UK, 1956 to 2007 (b) Nominal and relative rates of assistance to alla agricultural products, to exportableb and import-competing b agricultural industries, and relativec to non-agricultural industries (percent)
NRA, all agric products,a by component NRA, agric tradables
NRA, covere
d produc
ts (1)
NRA, non-
covered
products
(2)
NRA, non-
product-specific support
(3)
NRA, all ag
products (incl NPS)
(4)=1+2+3
NRA, all ag products (incl NPS
and decoupled)
(5)
NRA, ag export- ables (6)
NRA, ag import- competi
ng (7)
NRA, all agric
tradable goods c (8)=6+7
NRA, all non-ag tradable goods
(9) RRAb
(10) 1956 58 14 na 47 47 0 54 47 15 271957 84 21 na 67 67 0 77 67 15 451958 101 25 na 80 80 0 93 80 17 531959 85 21 na 68 68 0 78 68 17 431960 69 17 na 55 55 0 64 55 16 341961 89 22 na 71 71 0 82 71 18 441962 89 22 na 70 70 0 82 70 18 441963 63 16 na 51 51 0 59 51 18 281964 62 16 na 50 50 0 57 50 18 271965 61 15 na 49 49 0 57 49 18 271966 61 15 na 49 49 0 57 49 18 271967 53 13 na 43 43 0 49 43 17 221968 48 12 na 39 39 0 44 39 17 181969 40 10 na 33 33 0 37 33 18 131970 33 8 na 27 27 0 30 27 16 101971 39 10 na 32 32 0 37 32 16 141972 33 8 na 27 27 0 31 27 16 101973 47 23 na 41 41 8 52 41 9 301974 36 19 na 32 32 14 38 32 6 251975 58 31 na 52 52 33 57 52 7 411976 84 43 na 74 74 55 77 74 7 631977 76 40 na 67 67 54 71 67 7 571978 74 39 na 66 66 49 70 66 7 551979 77 41 12 81 82 64 70 81 6 701980 58 34 12 65 66 34 58 65 0 651981 76 40 10 77 79 30 80 77 0 771982 87 46 9 87 89 32 94 87 0 871983 113 57 9 108 111 43 118 108 0 1081984 81 41 8 79 81 21 89 79 0 791985 86 43 10 86 89 32 90 86 0 861986 138 68 3 123 125 74 126 123 0 1231987 137 68 3 122 124 83 124 122 0 1221988 96 47 3 87 90 53 89 87 0 871989 60 29 3 55 58 26 56 55 0 551990 78 37 4 72 75 37 73 72 0 721991 96 46 5 88 92 45 89 88 0 881992 73 36 5 68 76 35 69 68 0 681993 68 34 5 65 77 35 64 65 0 651994 61 30 4 58 73 36 57 58 0 581995 51 25 5 49 66 25 47 49 0 491996 36 17 4 35 52 6 46 35 0 351997 39 19 4 38 54 9 47 38 0 381998 55 28 4 52 69 23 57 52 0 521999 65 33 4 61 78 30 66 61 0 612000 40 21 3 39 56 11 49 39 0 392001 35 19 4 35 52 7 42 35 0 352002 43 22 5 42 60 7 56 42 0 422003 44 23 5 44 63 7 58 44 0 442004 41 20 4 40 58 7 52 40 0 402005 26 13 4 24 43 0 39 24 0 242006 22 11 4 21 42 0 34 21 0 212007 13 7 4 14 33 0 24 14 0 14
a. NRAs including assistance to nontradables and via inputs and other forms of non-product-specific (NPS) assistance without and (in column (5)) with decoupled support.

7
b. The Relative Rate of Assistance (RRA) is defined as 100*[(100+NRAagt)/ (100+NRAnonagt)-1], where NRAagt and NRAnonagt are the percentage NRAs for the tradables parts of the agricultural and non-agricultural sectors (columns 8 and 9), respectively, so it excludes decoupled payments but includes all NPS support. c. Including NPS but excluding decoupled payments, so more than the weighted average of columns (6) and (7).

8
Appendix Table 14 (continued): Annual distortion estimates, UK, 1956 to 2007 (c) Value shares of primary production of covereda and non-covered products,
(percent)
Barle
y Beef Egg Milk Oat Pigme
at Potato Poultr
y Rapes
eed Sheep
meat Sugar Tomat
o Wheat
Non-cover
ed 1956 6 11 12 8 6 10 8 3 na 3 1 0 7 26 1957 6 11 13 8 5 10 6 3 na 3 1 0 7 28 1958 7 12 12 10 5 4 6 4 na 3 1 0 7 29 1959 8 10 15 8 5 4 6 5 na 4 1 0 7 27 1960 7 7 13 8 4 11 8 4 na 3 1 0 6 27 1961 9 9 14 7 3 10 5 5 na 4 1 0 6 28 1962 11 8 11 6 3 8 6 5 na 5 1 0 8 28 1963 11 9 13 7 2 9 5 5 na 5 2 0 6 26 1964 12 11 10 8 2 10 4 5 na 5 2 0 7 26 1965 13 12 11 7 2 8 5 5 na 5 1 0 7 26 1966 14 13 11 7 2 8 4 5 na 3 1 0 6 26 1967 14 13 12 7 2 7 4 5 na 3 1 0 7 25 1968 12 13 12 7 2 8 4 6 0 3 1 0 7 25 1969 11 13 12 8 2 8 4 7 0 3 1 0 6 24 1970 12 13 12 7 2 8 5 7 0 3 1 0 8 23 1971 11 13 12 8 2 8 5 4 0 3 2 0 8 24 1972 10 13 12 9 2 8 5 5 0 3 2 0 8 23 1973 12 13 10 8 1 7 4 4 0 3 3 0 11 23 1974 12 19 5 7 1 7 4 4 0 3 3 1 11 22 1975 10 23 6 8 1 7 3 5 0 4 1 1 8 23 1976 11 19 8 7 1 6 3 5 0 3 1 1 10 24 1977 10 20 6 5 1 8 5 5 1 3 1 1 12 24 1978 10 21 7 6 1 7 5 6 0 3 1 1 9 24 1979 9 23 5 6 0 6 5 6 1 4 2 1 9 24 1980 12 21 5 5 1 6 5 5 1 4 3 1 9 23 1981 14 17 6 8 1 5 4 5 1 4 2 1 10 23 1982 15 14 6 9 1 5 4 4 1 4 1 0 11 24 1983 13 7 5 10 1 6 5 6 2 5 1 1 15 25 1984 14 6 5 8 1 6 6 4 3 4 1 0 18 24 1985 12 6 5 9 1 9 5 5 3 5 1 1 14 25 1986 7 9 5 9 0 9 6 7 2 5 1 1 12 26 1987 5 14 6 7 0 11 6 7 2 4 1 1 10 26 1988 7 13 4 13 1 8 5 7 2 4 1 1 10 26 1989 6 11 3 17 1 9 5 5 1 4 1 1 13 23 1990 5 10 4 16 0 10 6 5 2 4 1 1 12 25 1991 5 8 4 16 0 10 7 6 2 4 1 1 9 26 1992 4 10 4 16 0 12 5 5 2 5 1 1 11 25 1993 3 11 4 16 0 9 4 6 2 7 1 1 10 25 1994 3 12 4 16 0 9 7 5 2 7 2 1 9 24 1995 4 11 3 17 0 8 8 4 2 5 1 0 12 24 1996 6 7 4 17 0 8 4 6 2 6 1 0 15 23 1997 6 5 4 17 0 10 4 7 2 7 2 0 13 24 1998 3 6 4 17 0 8 7 8 3 7 1 1 11 24 1999 4 6 3 18 0 6 9 6 3 8 1 1 10 25 2000 5 6 4 20 0 6 4 7 2 8 1 1 13 23 2001 5 4 4 24 0 7 5 8 2 5 1 0 10 23 2002 5 5 4 19 1 6 5 7 3 7 1 1 13 24 2003 5 5 5 20 1 5 5 8 3 7 1 0 12 25 2004 4 6 4 21 0 5 7 6 3 7 1 0 13 24 2005 6 5 7 13 1 7 5 5 4 7 1 0 15 24 2006 6 5 6 13 0 7 8 4 4 5 1 0 17 24 2007 8 4 3 19 0 5 4 3 4 4 1 0 21 24
a. At farmgate undistorted prices

9
Appendix Table 14 (continued): Annual distortion estimates, UK, 1956 to 2007 (d) Trade status of of covered productsa
Barle
y Beef Egg Milk Oat Pigme
at Potato Poultr
y Rapes
eed Sheepmeat Sugar
Tomato
Wheat
1956 M M M M M M M M na M M M M1957 M M M M M M M M na M M M M1958 M M M M M M M M na M M M M1959 M M M M M M M M na M M M M1960 M M M M M M M M na M M M M1961 M M M M M M M M na M M M M1962 M M M M M M M M na M M M M1963 M M M M M M M M na M M M M1964 M M M M M M M M na M M M M1965 M M M M M M M M na M M M M1966 M M M M M M M M na M M M M1967 M M M M M M M M na M M M M1968 M M M M M M M M M M M M M1969 M M M M M M M M M M M M M1970 M M M M M M M M M M M M M1971 M M M M M M M M M M M M M1972 M M M M M M M M M M M M M1973 X M M M M M M M M M M M M1974 X M M M M M M M M M M M M1975 X M M M M M M M M M M M M1976 M M M M M M M M M M M M M1977 X M M M M M M M M M M M M1978 X M M M M M M M M M M M M1979 X M M M M M M M M M M M M1980 X M M M M M M M M M M M M1981 X M M M M M M M M M M M M1982 X M M M M M M M M M M M M1983 X M M M M M M M M M M M M1984 X M M M M M M M M M M M M1985 X M M M M M M M M M M M M1986 M M M M M M M M M M M M M1987 M M M M M M M M M M M M M1988 M M M M M M M M M M M M M1989 M M M M M M M M M M M X M1990 M M M M M M M M M M M X M1991 M M M M M M M M M M M X M1992 M M M M M M M M X M M X M1993 M M M M M M M M X M M X M1994 M M M M M M M M M M M X M1995 M M M M M M M M M M M X M1996 X M M M M M M M X M M X X1997 X M M M M M M M X M M X X1998 M M M M M M M M X M M X X1999 M M M M M M M M X M M X X2000 X M X M M M M M X M M X X2001 X M X M M M M M M M M X X2002 X M X M M M M M X M M X X2003 X M X M M M M M X M M X X2004 X M X M M M M M X M M X X2005 X M M M M M M M X M M X X2006 X M M M M M M M X M M X X2007 X M M M M M M M X M M X X
a. Exportables (X), import-competing products (M) and nontradables (H). Source: Anderson and Valenzuela (2008), based on author’s spreadsheet

Appendix Table 15: Shares of the global value of production and consumption of key covered agricultural products, Western European economiesa, 2000-03 (percent)
Austria Denmar
k Finland France German
y Ireland Italy Netherla
nds Norway Portugal Spain Sweden Switzerl
and UK Region
al World Grains Q 0.2 0.4 0.1 2.7 1.6 0.1 0.9 0.1 0.0 0.1 1.0 0.2 0.1 0.9 8.3 100 C 0.2 0.3 0.1 1.6 1.5 0.1 1.2 0.3 0.1 0.2 1.3 0.2 0.1 0.8 7.3 100 Rice Q 0.0 0.4 0.0 0.3 0.7 100 C 0.2 0.2 0.1 0.2 0.6 100 Wheat Q 0.2 0.8 0.1 6.0 3.7 0.1 1.2 0.2 0.1 0.0 1.1 0.4 0.2 2.5 16.6 100 C 0.2 0.7 0.1 3.4 3.0 0.2 1.9 0.7 0.1 0.3 1.5 0.3 0.3 2.3 12.7 100 Maize Q 0.3 2.9 0.7 1.9 0.0 0.2 0.8 0.0 6.8 100 C 0.4 2.3 1.3 3.1 0.7 0.6 2.0 0.1 10.6 100 Barley Q 0.7 3.0 1.4 8.0 9.4 1.0 0.9 0.3 0.5 0.0 7.1 1.3 4.9 38.4 100 C 0.9 2.6 1.2 3.3 8.5 0.9 1.8 0.6 1.0 0.3 8.9 1.2 4.2 31.2 100 Oat Q 0.5 1.1 5.1 2.3 4.4 0.5 1.3 0.1 1.3 0.2 3.5 4.2 2.7 27.0 100 C 0.6 1.1 3.6 2.5 5.4 0.6 1.8 0.4 2.5 0.4 4.1 3.5 2.4 26.5 100 Oilseeds Q 0.1 0.1 0.0 1.9 1.5 0.0 0.3 0.0 0.0 0.3 0.1 0.5 4.8 100 C 0.1 na na 1.7 3.8 na 0.9 na 0.1 1.9 na na 8.9 100 Soybean Q na 0.1 0.0 0.4 0.0 0.6 100 C 0.7 3.0 1.3 2.4 7.3 100 Rapeseed Q 0.3 0.9 0.3 10.1 12.1 0.0 0.1 0.0 0.1 0.5 4.3 28.6 100 C na na na na na na na na na na na na 100 Sunflower Q 0.3 7.5 0.3 1.6 0.1 3.9 13.8 100 C 0.6 7.0 1.6 2.5 0.9 6.3 19.0 100
Austria Denmar
k Finland France German
y Ireland Italy Netherla
nds Norway Portugal Spain Sweden Switzerl
and UK Region
al World Tropical crops Q 0.1 0.1 0.0 0.8 0.7 0.0 0.3 0.2 0.0 0.2 0.1 0.0 0.2 2.7 100 C 0.1 0.1 0.0 0.4 0.6 0.0 0.3 0.2 0.1 0.3 0.1 0.1 0.4 2.2 100 Sugar Q 0.2 0.3 0.1 2.4 2.1 0.1 0.8 0.5 0.0 0.6 0.2 0.1 0.7 8.2 100 C 0.3 0.2 0.1 1.3 1.8 0.1 1.0 0.5 0.2 0.8 0.2 0.4 1.1 7.0 100 Livestock Q 0.4 0.7 0.2 2.6 2.8 0.5 1.5 1.1 0.1 0.3 1.7 0.3 0.3 1.5 13.9 100 C 0.4 0.4 0.2 2.9 3.3 0.4 2.1 0.9 0.2 0.4 1.8 0.4 0.4 2.2 13.9 100 Pigmeat Q 0.6 1.7 0.2 2.3 4.1 0.2 1.5 1.4 0.1 0.3 3.0 0.3 0.2 0.8 16.9 100 C 0.7 0.4 0.2 2.4 4.9 0.2 2.7 0.8 0.1 0.5 2.9 0.5 0.3 1.6 16.5 100 Milk Q 0.6 0.9 0.5 4.8 5.4 1.0 2.1 2.1 0.3 0.4 1.4 0.6 0.7 2.8 23.6 100 C 0.7 1.0 0.6 5.4 6.0 1.2 2.9 2.4 0.4 0.5 1.8 0.8 0.9 3.5 24.6 100 Beef Q 0.2 0.2 0.1 1.9 1.5 0.7 1.3 0.5 0.1 0.1 0.8 0.2 0.2 0.8 8.6 100 C 0.3 0.3 0.2 2.9 1.8 0.2 2.6 0.6 0.2 0.3 1.1 0.5 0.3 2.1 11.1 100 Poultry Q 0.1 0.2 0.1 2.1 0.9 0.1 1.0 0.7 0.0 0.2 1.1 0.1 0.0 1.5 0.1 100 C 0.2 0.1 0.1 2.0 1.5 0.1 1.3 0.3 0.0 0.3 1.5 0.3 0.1 2.3 0.3 100 Egg Q 0.2 0.1 0.1 1.8 1.5 0.1 1.2 1.1 0.1 0.2 1.3 0.2 0.1 1.0 0.2 100 C 0.1 0.1 0.1 1.3 1.4 0.0 0.9 0.4 0.0 0.2 0.9 0.1 0.1 0.8 0.1 100 Sheepmeat Q 0.1 0.0 0.0 1.4 0.5 0.7 0.7 0.2 0.3 0.3 2.6 0.0 0.1 3.3 0.0 100
2
C 0.1 0.1 0.0 3.7 1.1 0.3 1.2 0.3 0.5 0.5 3.4 0.1 0.2 5.1 0.1 100 Total of above Q 0.3 0.5 0.2 2.4 2.2 0.3 1.1 0.6 0.1 0.2 1.2 0.2 0.2 1.2 0.2 100 C 0.3 0.3 0.2 2.2 2.5 0.2 1.6 0.6 0.1 0.3 1.5 0.3 0.2 1.5 0.3 100 Production All covered Q 0.3 0.5 0.2 3.2 2.5 0.3 2.3 0.8 0.1 0.4 2.0 0.2 0.2 1.3 0.2 100 Non-covered Q 0.2 0.3 0.1 1.7 1.6 0.2 1.1 0.5 0.1 0.2 1.0 0.2 0.1 0.8 0.2 100 All agriculture Q 0.3 0.5 0.2 2.7 2.2 0.3 1.9 0.7 0.1 0.3 1.7 0.2 0.2 1.1 0.2 100
Source: Authors’ calculations using Project data and FAO Production and Commodity Balance Data.

3
Appendix Table 16: Shares of the global value of exports and imports of key covered agricultural products, Western European economiesa, 2000-03 (percent)
Austria Denmar
k Finland France German
y Ireland Italy Netherl
ands Norway Portugal Spain Sweden Switzerl
and UK Region
al World Grains X 0.5 0.7 0.1 10.6 3.6 0.1 1.0 0.4 0.0 0.1 0.9 0.4 0.0 1.4 19.7 100 M 0.2 0.3 0.1 1.0 1.6 0.3 3.4 2.0 0.1 1.1 2.8 0.1 0.2 1.7 15.0 100 Rice X 0.0 0.0 0.0 0.8 0.6 0.0 4.3 0.9 0.0 2.0 0.0 0.6 9.3 100 M 0.3 0.3 0.2 3.2 2.1 0.2 0.6 1.2 0.5 0.4 0.5 3.4 12.9 100 Wheat X 0.6 0.6 0.0 13.0 4.7 0.1 0.3 0.2 0.0 0.1 1.0 0.5 0.0 2.1 23.2 100 M 0.1 0.3 0.1 0.4 1.1 0.3 6.3 2.2 0.2 1.2 3.1 0.1 0.3 1.2 16.9 100 Maize X 0.6 0.0 0.0 12.5 1.2 0.0 0.4 0.3 0.0 0.3 0.0 0.0 0.0 15.4 100 M 0.4 0.2 0.0 1.0 1.7 0.2 1.4 2.4 1.4 4.2 0.0 0.1 2.1 15.2 100 Barley X 0.7 5.2 0.4 22.4 16.1 0.4 0.0 1.1 0.0 0.1 0.7 1.8 4.9 53.8 100 M 0.5 1.4 0.3 0.2 4.0 0.3 3.8 3.3 0.0 1.3 3.1 0.4 0.5 19.1 100 Oat X 0.3 1.0 11.7 2.2 3.3 1.1 0.0 0.4 0.0 0.0 1.2 9.3 9.0 39.7 100 M 0.7 2.3 0.0 1.3 3.3 0.2 2.3 1.6 0.1 0.4 1.9 0.1 0.6 14.9 100 Oilseeds X 0.2 0.1 0.0 3.2 1.6 0.0 0.2 2.4 0.1 0.2 0.0 0.2 8.2 100 M 0.4 0.9 0.2 2.4 4.6 0.2 1.7 4.1 0.7 2.5 0.3 1.7 19.6 100 Soybean X 0.1 0.1 0.0 0.2 1.6 0.0 0.3 4.5 0.2 0.1 0.0 0.0 7.1 100 M 0.5 1.5 0.2 5.0 6.3 0.4 3.5 7.9 1.2 5.2 0.3 2.4 34.4 100 Rapeseed X 0.5 0.7 0.0 20.9 7.5 0.0 0.0 0.6 0.0 0.0 0.0 1.7 32.0 100 M 0.8 2.4 0.9 0.2 13.8 0.0 0.1 1.6 0.0 0.1 1.4 4.0 25.4 100 Sunflower X 1.0 0.2 0.0 9.6 2.0 0.0 0.9 6.7 0.5 1.8 0.0 0.3 22.9 100 M 1.3 0.6 0.2 4.7 7.2 0.3 3.6 10.0 2.5 5.9 0.4 3.4 40.3 100 Sesame X 100 M 100

4
Austria Denmar
k Finland France German
y Ireland Italy Netherl
ands Norway Portugal Spain Sweden Switzerl
and UK Region
al World Tropical crops X 0.2 0.4 0.0 4.5 1.8 0.2 0.4 0.4 0.2 0.1 0.1 0.0 0.7 9.1 100 M 0.1 0.2 0.2 0.8 0.8 0.1 1.2 0.2 0.5 0.9 0.1 0.2 2.6 7.8 100 Sugar X 0.5 1.0 0.1 11.7 4.6 0.4 1.0 1.0 0.4 0.3 0.4 0.0 1.9 23.5 100 M 0.2 0.4 0.4 2.0 2.1 0.3 3.3 0.5 1.4 2.4 0.2 0.5 6.8 20.3 100 Livestock products X 1.4 6.6 0.5 9.3 9.2 3.7 2.8 9.3 0.1 0.2 2.5 0.3 0.5 2.2 48.6 100 M 1.0 1.0 0.2 5.9 8.7 0.8 7.4 4.1 0.1 1.0 2.3 0.9 0.7 7.8 41.9 100 Pigmeat X 1.9 19.8 0.3 6.6 7.7 1.8 4.2 9.1 0.0 0.2 5.9 0.3 0.0 1.3 59.3 100 M 1.3 1.0 0.3 5.8 10.0 0.9 9.4 1.9 0.0 1.4 1.2 1.3 0.5 10.6 45.5 100 Milk X 2.0 4.9 0.9 13.6 14.8 4.0 3.6 11.7 0.3 0.5 1.9 0.5 1.2 3.2 63.2 100 M 1.2 1.0 0.4 6.7 10.8 0.9 8.8 6.0 0.1 0.9 3.5 0.8 0.7 6.1 47.9 100 Beef X 1.0 1.7 0.1 4.5 6.4 6.1 1.5 7.1 0.0 0.0 1.8 0.1 0.1 0.3 30.6 100 M 0.4 1.5 0.1 4.9 3.3 0.2 8.4 3.5 0.1 1.3 2.2 0.9 0.4 5.7 33.0 100 Poultry X 0.5 2.1 0.1 11.6 3.8 1.9 1.9 10.1 0.0 0.0 1.0 0.1 0.0 2.8 35.9 100 M 1.4 0.9 0.2 3.0 10.7 1.6 1.1 4.2 0.0 0.3 1.6 0.8 1.3 11.6 38.6 100 Sheepmeat X 0.1 0.1 0.0 2.1 1.3 7.4 0.2 1.1 0.0 0.0 2.6 0.0 0.0 9.0 23.8 100 M 0.4 0.8 0.2 19.4 7.0 0.2 4.0 1.9 0.2 1.1 1.4 0.7 2.4 12.9 52.5 100 Total of above X 0.9 3.4 0.3 8.1 5.8 1.8 1.7 5.0 0.1 0.2 1.5 0.3 0.2 1.6 30.7 100 M 0.6 0.7 0.2 3.4 5.1 0.5 4.7 2.9 0.1 0.9 2.2 0.5 0.4 4.7 26.8 100 All exports X 0.9 2.2 0.3 7.9 6.0 1.5 3.9 7.3 0.1 0.4 3.7 0.5 0.5 3.5 38.5 100 M 1.1 1.1 0.5 5.7 8.3 0.8 5.1 4.3 0.5 0.9 2.8 1.0 1.2 6.5 40.0 100
Source: Authors’ derivation using trade value data from FAOSTAT.