dissolved silver in european estuarine and coastal waters
TRANSCRIPT
wat e r r e s e a r c h 4 4 ( 2 0 1 0 ) 4 2 0 4e4 2 1 6
Avai lab le at www.sc iencedi rect .com
journa l homepage : www.e lsev ier . com/ loca te /wat res
Dissolved silver in European estuarine and coastal waters
Alan D. Tappin a, Jose L. Barriada b, Charlotte B. Braungardt a, E. Hywel Evans a,Matthew D. Patey c, Eric P. Achterberg c,*aSchool of Geography, Earth and Environmental Sciences, University of Plymouth, Plymouth PL4 8AA, UKb Instituto Universitario de Medio Ambiente, Universidad de A Coruna, Pazo de Longora 15179, Oleiros, A Coruna, SpaincSchool of Ocean and Earth Science, University of Southampton, National Oceanography Centre, Southampton, European Way,
Southampton SO14 3ZH, UK
a r t i c l e i n f o
Article history:
Received 26 May 2009
Received in revised form
19 February 2010
Accepted 17 May 2010
Available online 24 May 2010
Keywords:
Dissolved silver
Marine waters
Estuaries
Coastal waters
Sediments
Contamination
* Corresponding author.E-mail address: [email protected] (E.P
0043-1354/$ e see front matter ª 2010 Elsevdoi:10.1016/j.watres.2010.05.022
a b s t r a c t
Silver is one of the most toxic elements for the marine microbial and invertebrate
community. However, little is knownabout thedistribution andbehaviour of dissolved silver
in marine systems. This paper reports data on dissolved and sediment-associated silver in
European estuaries and coastal waters which have been impacted to different extents by
past and present anthropogenic inputs. This is the first extended dataset for dissolved silver
in European marine waters. Lowest dissolved silver concentrations were observed in the
Gullmar Fjord, Sweden (8.9 � 2.9 pM; x � 1s), the Tamar Estuary, UK (9.7 � 6.2 pM), the Fal
Estuary, UK (20.6 � 8.3 pM), and the Adriatic Sea (21.2 � 6.8 pM). Enhanced silver concen-
trations were observed in Atlantic coastal waters receiving untreated sewage effluent from
the city of A Cor~una, Spain (243 � 195 pM), and in themine-impacted Restronguet Creek, UK
(91 � 71 pM). Anthropogenic wastewater inputs were a source of dissolved silver in the
regions studied, with the exception of the Gullmar Fjord. Remobilisation of dissolved silver
from historically contaminated sediments, resulting from acid mine drainage or sewage
inputs, provided an additional source of dissolved silver to the estuaries. The ranges in the
log particle-water partition coefficient (Kd) values of 5e6were similar for theTamar andMero
estuaries and agreed with reported values for other estuaries. These high Kd values indicate
the particle reactive nature of silver with oxic sediments. In contrast, low Kd values (1.4e2.7)
were observed in the Fal system, which may have been due to enhanced benthic inputs of
dissolved silver coupled to limited scavenging of silver on to sediments rich in Fe oxide.
ª 2010 Elsevier Ltd. All rights reserved.
1. Introduction strongly bioaccumulated by a number of marine phyto-
Silver is one of the most toxic elements to bacteria, phyto-
plankton and invertebrates (Richards, 1981; Bryan, 1984;
Luoma et al., 1995; Ratte, 1999), principally by disabling the
enzymes Na/K adenosine triphosphatase and carbonic anhy-
drase in animals (Morgan et al., 2004; Bielmyer et al., 2007),
and interacting with thiol groups in enzymes and proteins of
micro-organisms (McDonnell and Russell, 1999). Silver is
. Achterberg).ier Ltd. All rights reserve
plankton, macro-algae and invertebrates (Fisher et al., 1984;
Bryan, 1984), and it is known that the degree of silver accu-
mulation by organisms is dependent on its chemical specia-
tion. The monovalent silver ion (Agþ) is considered the most
toxic silver species in aquatic systems and it has been shown
that silver toxicity in freshwater phytoplankton is directly
related to intracellular accumulation (Campbell, 1995; Lee
et al., 2005).
d.
wat e r r e s e a r c h 4 4 ( 2 0 1 0 ) 4 2 0 4e4 2 1 6 4205
Whilst it has been predicted that themonovalent silver ion
is themaindissolvedspecies in freshwaters, experimentaldata
have shown that in rivers and estuaries dissolved silver asso-
ciated with colloidal macromolecular organic matter is
a significant or dominant fraction of the total dissolved silver
pool (Wenet al., 1997, 2002). Itwas proposed that the silverwas
bound to organo-thiol (sulfhydryl) groups in this fraction (Wen
et al., 1997; Adams and Kramer, 1998). The macromolecular
fraction is reported to decrease with an increase in salinity
(Wen et al., 1997), perhaps because of flocculation, precipita-
tion or salting out processes. In tandem, silver chloro-
complexes (AgCl0, AgCl2�, AgCl3
2� and AgCl43�) appeared to
become more important in saline waters, as predicted by
speciation modelling (Turner et al., 1981; Cowan et al., 1985).
Indeed, Miller and Bruland (1995) could find no evidence for
organiccomplexationofdissolvedsilver in fullymarinewaters.
In the estuarine water of Galveston Bay, Wen et al. (1997)
observed that most of the particulate silver (77 � 6%) was in
an Fe/Mn oxyhydroxide/sulfidic phase, and suggested that
complexation with thiol groups was again important.
However, this predominantly river-borne material was lost
from the water column with increasing salinity. In contrast,
the solid state speciation of silver becamemore dominated by
a weakly adsorbed phase at higher salinities, suggesting that
a dynamic exchange of silver between water and particles
occurred in Galveston Bay, even though silver chloro-
complexes appear to have limited particle-reactivity at salin-
ities >5 (Luoma et al., 1995). In oxic surface sediments of 17
English estuaries, Luoma et al. (1995) observed that particulate
silver was mostly associated with an uncharacterised organic
phase, and the authors did not discount the potential impor-
tance of sulfide complexation of silver in this phase.
In addition to the role of monovalent silver as a toxin, the
bioaccumulation of dissolved silver in estuaries may be
further enhanced by of the formation of the neutral, and
potentially lipophilic, species AgCl (aq) and AgHS (aq) in low
salinity waters (Cowan et al., 1985; Sunda, 1993; Bell and
Kramer, 1999; Reinfelder and Chang, 1999). The presence of
other, particle-unreactive, chloro-complexed species may
also enhance biological uptake. The Criteria Maximum
Concentration (CMC) for dissolved silver is 17.6 nM in fresh-
water and 29.7 nM in salt water (based on CaCO3 hardness of
100 mg L�1) (USEPA, http://www.epa.gov/waterscience/
criteria/wqctable/index.html#D, accessed May 2009),
although equivalent criteria for particulate silver do not
appear to be as well developed (Langston et al., 2003).
Despite the potential environmental impacts of silver, very
little is known about the distribution and behaviour of this
element in marine waters. This has been largely due to the
challenges involved in the accurate and precise analysis of the
low levels of dissolved silver that occur in seawater (Barriada
et al., 2007). The few data that exist show that in oceanic
waters dissolved silver concentrations are in the range
<1e30 pM; oceanic silver depth profiles indicate low surface
water concentrations which increase with depth, indicating
a nutrient-type behaviour for this element (Martin et al., 1983;
Flegal et al., 1995; Rivera-Duarte et al., 1999; Ndung’u et al.,
2001; Ranville and Flegal, 2005). Phytoplankton play a key
role in this water column distribution, with silver adsorption
to cell surfaces or incorporation in to cells during their growth
in the euphotic zone (Fisher andWente, 1993), and subsequent
downward transport and release during re-mineralisation at
depth (Martin et al., 1983; Ndung’u et al., 2001). Anthropogenic
perturbations of oceanic surface water concentrations have
recently been observed in the North Pacific Ocean and tenta-
tively ascribed to industrial aerosol inputs derived from the
Asian mainland (Ranville and Flegal, 2005).
Elevated silver concentrations occur in estuarine and
coastal waters subjected to anthropogenic inputs, including
those from wastewater effluents and acid mine drainage. In
San Francisco Bay enhanced concentrations have been
reported due to silver-rich wastewater discharges from
hospitals, photographic and electronics industries (e.g. Flegal
et al., 1991; Sanudo-Wilhelmy and Flegal, 1992; Smith and
Flegal, 1993; Stephenson and Leonard, 1994; Flegal et al.,
1997; Squire et al., 2002). The introduction of more stringent
discharge regulations has resulted in a decrease in silver
concentrations over the last two decades in San Francisco Bay
(Flegal et al., 2007). Sediments form an important sink of silver
under oxic conditions (Luoma et al., 1995), whilst sediment
resuspension (Wen et al., 1997) and diffusion of silver-rich
porewaters (Rivera-Duarte and Flegal, 1997; Morford et al.,
2008) are mechanisms of dissolved and colloidal silver re-
supply to overlying estuarine and coastal waters.
Previous studies of silver inmarine systems in Europe have
focused on metal-mine impacted systems in southwest
England (Tamar, Looe and Fal estuaries), reporting particulate
silver concentrations that were up to 400 times higher than
background levels for sediments and bed dwelling organisms
(Bryan and Hummerstone, 1977; Bryan and Langston, 1992).
This paper reports data on dissolved and sediment-associated
silver in a range of European estuarine and coastal systems,
and relate the observed distributions to anthropogenic inputs
and water column processes.
2. Methods
2.1. Sampling locations
Samples were collected from European estuaries and coastal
waters (Fig. 1a) subjected to varying levels of anthropogenic
pressures, including discharges from sewage treatmentworks
and drainage from disusedmines. The Tamar Estuary, located
in southwest England (Fig. 1a, b), extends 31 km from its
boundary at Plymouth Sound to the limit of tidal influence.
The major freshwater input is from the River Tamar. The
estuary is macro-tidal, and maximum suspended particulate
matter (SPM) concentrations can exceed 1 g L�1 (Uncles et al.,
1994); suspended phytoplankton growth is restricted because
of the high turbidity. The estuary receives acid mine drainage
from numerous abandoned mine workings. The silver-lead
mines in the upper estuary are estimated to have produced ca.
28 tons of silver in the seven centuries of operation until the
mid 19th century (Booker, 1976). The seaward end of the
estuary receives sewage effluent from the city of Plymouth
(ca. 240,000 inhabitants), of which until recently (2000), two-
thirds was untreated or only partially treated.
The Fal Estuary is situated in southwest England and is
comprised of a complex of creeks and tidal rivers extending

Fig. 1 e Locations of sampling sites in European marine waters. Numbers on Fig. 1 bef relate to sampling sites for which
details are reported in Table 1.
wat e r r e s e a r c h 4 4 ( 2 0 1 0 ) 4 2 0 4e4 2 1 64206
17 km inland (Fig. 1a, c). The catchment of the estuary was
extensively mined for metals for many centuries and as
a consequence the estuary receives acid mine drainage from
numerous disused mine workings (Langston et al., 2003). In
the lower salinity stretches of the Restronguet Creek, which is
the most metal polluted estuary in the UK, the pH of the
inflowing waters of the River Carnon can be as low as 3.8
because of themine drainage. The Fal Estuary receives sewage
effluent in both the upper and lower reaches, particularly
from the city of Falmouth (ca. 20,000 inhabitants) at the
seaward end (Langston et al., 2003).
The coastal city of A Coruna (ca. 240,000 inhabitants) in
Galicia, Spain, is located beside A Coruna Bay (Fig. 1a, d). The
bay is meso-tidal (2e4 m range) and ca. 10 m deep on average.
A harbour is located on the western side of the bay which
receives continuous wastewater inputs from the city (Varela
and Prego, 2003). The River Mero, which flows into the bay,
drains a predominantly agricultural catchment (Felipe-Sotelo
et al., 2007). The city’s main discharge of untreated sewage is
located ca. 7 kmwest of A Coruna Bay at Cala de Bens. The rias
in this part of Spain have received large wastewater inputs
since the 1950’s (Varela and Prego, 2003).
The western Adriatic Sea is characterised by a low tidal
range (ca. 0.2e0.6 m; Fain et al., 2007) and large anthropogenic
inputs, concentrated in the northwest area where the River Po
(annual mean discharge 1470 m3 s�1; UNEP, 2004) enters the
sea (Fig. 1a, e). The Po drains a densely populated (ca. 17
million people; UNEP, 2004) and industrialised catchment, and
contributes ca. 50% of the annual freshwater and nutrient load
to the northern Adriatic Sea basin (average depth ca. 30 m).
During summer frequent and extensive algal blooms occur in
this area, together with water column hypoxia and fish
mortality (Penna et al., 2004).
In contrast to these systems, the Gullmar Fjord is a rela-
tively pristine micro-tidal fjord situated on the west coast of
Sweden (Fig. 1a, f) in a region with a low population density
(Lindahl and Hernroth, 1983). It is 30 km long, a maximum of
3 km wide, and with a maximum depth of 120 m and a sill
depth of 45 m. Below the sill is Atlantic saline water which
enters the fjord via the North Sea and the Skaggerak, whilst
the upper water column is derived from surface Kattegat and
Skaggerak waters, together with freshwater inflows to the
fjord. The upper water column is often stratified with respect
to both temperature and salinity. There is a phytoplankton
bloom in February/March, followed by continuing production
at lower levels during the summer and autumn.
2.2. Sample collection and analysis
Surface water samples (Tamar, Fal, Restroguet Creek, A
Coruna Bay, Cala de Bens) were collected directly into acid-
cleaned low-density polyethylene (LDPE; Nalgene) bottles (see
Achterberg et al. (2001) for cleaning procedure) from the bow
of an inflatable boat, whilst depth profiles (Gullmar Fjord,
Adriatic) were obtained on research vessels using a hydrowire
with Teflon-lined Go-Flo bottles. In addition, effluent was
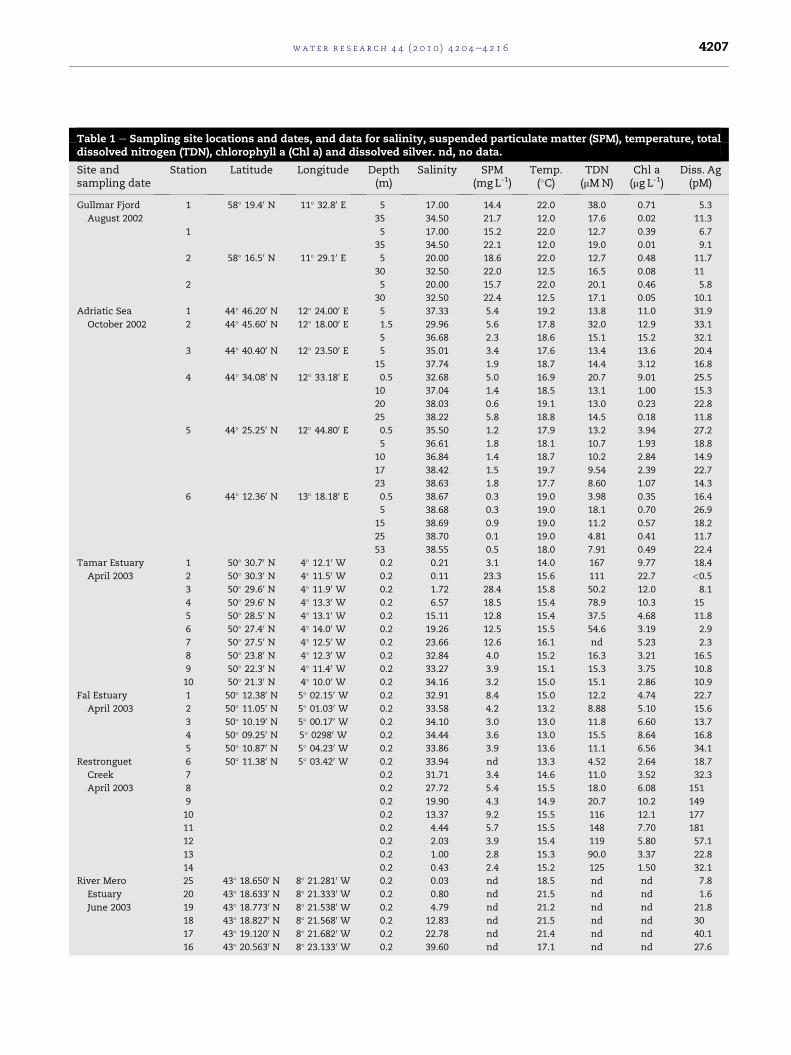
Table 1 e Sampling site locations and dates, and data for salinity, suspended particulate matter (SPM), temperature, totaldissolved nitrogen (TDN), chlorophyll a (Chl a) and dissolved silver. nd, no data.
Site andsampling date
Station Latitude Longitude Depth(m)
Salinity SPM(mg L-1)
Temp.(�C)
TDN(mMN)
Chl a(mg L-1)
Diss. Ag(pM)
Gullmar Fjord
August 2002
1 58� 19.40 N 11� 32.80 E 5 17.00 14.4 22.0 38.0 0.71 5.3
35 34.50 21.7 12.0 17.6 0.02 11.3
1 5 17.00 15.2 22.0 12.7 0.39 6.7
35 34.50 22.1 12.0 19.0 0.01 9.1
2 58� 16.50 N 11� 29.10 E 5 20.00 18.6 22.0 12.7 0.48 11.7
30 32.50 22.0 12.5 16.5 0.08 11
2 5 20.00 15.7 22.0 20.1 0.46 5.8
30 32.50 22.4 12.5 17.1 0.05 10.1
Adriatic Sea
October 2002
1 44� 46.200 N 12� 24.000 E 5 37.33 5.4 19.2 13.8 11.0 31.9
2 44� 45.600 N 12� 18.000 E 1.5 29.96 5.6 17.8 32.0 12.9 33.1
5 36.68 2.3 18.6 15.1 15.2 32.1
3 44� 40.400 N 12� 23.500 E 5 35.01 3.4 17.6 13.4 13.6 20.4
15 37.74 1.9 18.7 14.4 3.12 16.8
4 44� 34.080 N 12� 33.180 E 0.5 32.68 5.0 16.9 20.7 9.01 25.5
10 37.04 1.4 18.5 13.1 1.00 15.3
20 38.03 0.6 19.1 13.0 0.23 22.8
25 38.22 5.8 18.8 14.5 0.18 11.8
5 44� 25.250 N 12� 44.800 E 0.5 35.50 1.2 17.9 13.2 3.94 27.2
5 36.61 1.8 18.1 10.7 1.93 18.8
10 36.84 1.4 18.7 10.2 2.84 14.9
17 38.42 1.5 19.7 9.54 2.39 22.7
23 38.63 1.8 17.7 8.60 1.07 14.3
6 44� 12.360 N 13� 18.180 E 0.5 38.67 0.3 19.0 3.98 0.35 16.4
5 38.68 0.3 19.0 18.1 0.70 26.9
15 38.69 0.9 19.0 11.2 0.57 18.2
25 38.70 0.1 19.0 4.81 0.41 11.7
53 38.55 0.5 18.0 7.91 0.49 22.4
Tamar Estuary
April 2003
1 50� 30.70 N 4� 12.10 W 0.2 0.21 3.1 14.0 167 9.77 18.4
2 50� 30.30 N 4� 11.50 W 0.2 0.11 23.3 15.6 111 22.7 <0.5
3 50� 29.60 N 4� 11.90 W 0.2 1.72 28.4 15.8 50.2 12.0 8.1
4 50� 29.60 N 4� 13.30 W 0.2 6.57 18.5 15.4 78.9 10.3 15
5 50� 28.50 N 4� 13.10 W 0.2 15.11 12.8 15.4 37.5 4.68 11.8
6 50� 27.40 N 4� 14.00 W 0.2 19.26 12.5 15.5 54.6 3.19 2.9
7 50� 27.50 N 4� 12.50 W 0.2 23.66 12.6 16.1 nd 5.23 2.3
8 50� 23.80 N 4� 12.30 W 0.2 32.84 4.0 15.2 16.3 3.21 16.5
9 50� 22.30 N 4� 11.40 W 0.2 33.27 3.9 15.1 15.3 3.75 10.8
10 50� 21.30 N 4� 10.00 W 0.2 34.16 3.2 15.0 15.1 2.86 10.9
Fal Estuary
April 2003
1 50� 12.380 N 5� 02.150 W 0.2 32.91 8.4 15.0 12.2 4.74 22.7
2 50� 11.050 N 5� 01.030 W 0.2 33.58 4.2 13.2 8.88 5.10 15.6
3 50� 10.190 N 5� 00.170 W 0.2 34.10 3.0 13.0 11.8 6.60 13.7
4 50� 09.250 N 5� 02980 W 0.2 34.44 3.6 13.0 15.5 8.64 16.8
5 50� 10.870 N 5� 04.230 W 0.2 33.86 3.9 13.6 11.1 6.56 34.1
Restronguet
Creek
April 2003
6 50� 11.380 N 5� 03.420 W 0.2 33.94 nd 13.3 4.52 2.64 18.7
7 0.2 31.71 3.4 14.6 11.0 3.52 32.3
8 0.2 27.72 5.4 15.5 18.0 6.08 151
9 0.2 19.90 4.3 14.9 20.7 10.2 149
10 0.2 13.37 9.2 15.5 116 12.1 177
11 0.2 4.44 5.7 15.5 148 7.70 181
12 0.2 2.03 3.9 15.4 119 5.80 57.1
13 0.2 1.00 2.8 15.3 90.0 3.37 22.8
14 0.2 0.43 2.4 15.2 125 1.50 32.1
River Mero
Estuary
June 2003
25 43� 18.6500 N 8� 21.2810 W 0.2 0.03 nd 18.5 nd nd 7.8
20 43� 18.6330 N 8� 21.3330 W 0.2 0.80 nd 21.5 nd nd 1.6
19 43� 18.7730 N 8� 21.5380 W 0.2 4.79 nd 21.2 nd nd 21.8
18 43� 18.8270 N 8� 21.5680 W 0.2 12.83 nd 21.5 nd nd 30
17 43� 19.1200 N 8� 21.6820 W 0.2 22.78 nd 21.4 nd nd 40.1
16 43� 20.5630 N 8� 23.1330 W 0.2 39.60 nd 17.1 nd nd 27.6
wat e r r e s e a r c h 4 4 ( 2 0 1 0 ) 4 2 0 4e4 2 1 6 4207
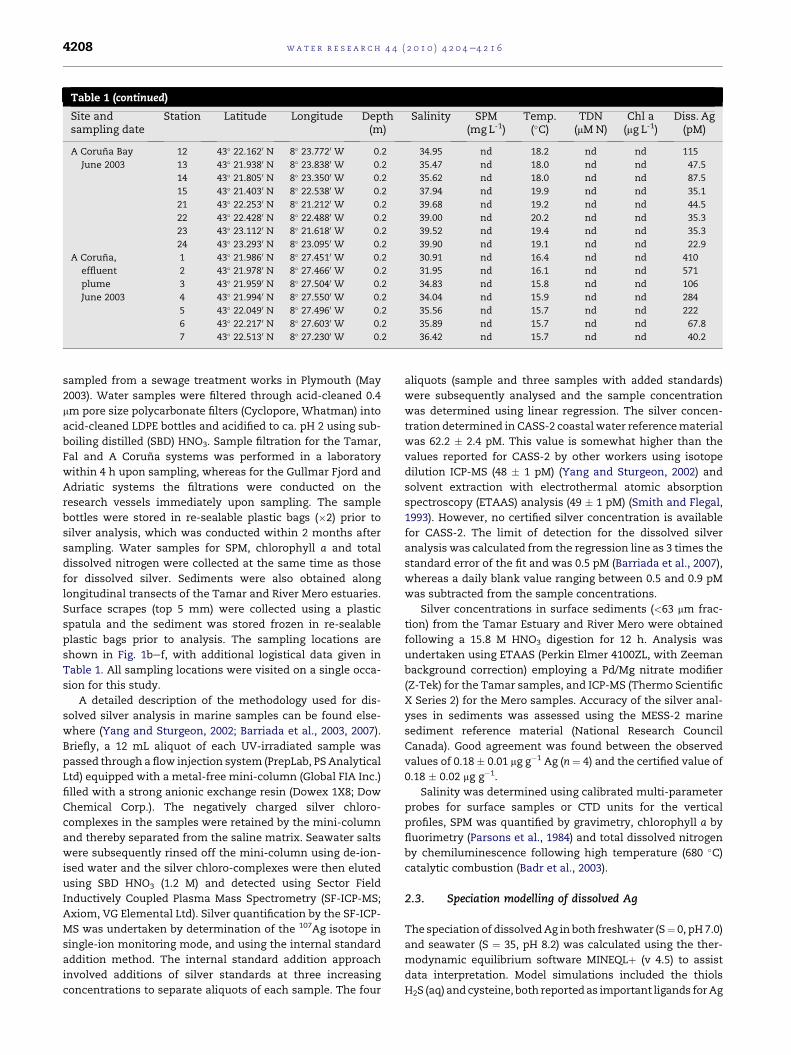
Table 1 (continued)
Site andsampling date
Station Latitude Longitude Depth(m)
Salinity SPM(mg L-1)
Temp.(�C)
TDN(mMN)
Chl a(mg L-1)
Diss. Ag(pM)
A Coruna Bay
June 2003
12 43� 22.1620 N 8� 23.7720 W 0.2 34.95 nd 18.2 nd nd 115
13 43� 21.9380 N 8� 23.8380 W 0.2 35.47 nd 18.0 nd nd 47.5
14 43� 21.8050 N 8� 23.3500 W 0.2 35.62 nd 18.0 nd nd 87.5
15 43� 21.4030 N 8� 22.5380 W 0.2 37.94 nd 19.9 nd nd 35.1
21 43� 22.2530 N 8� 21.2120 W 0.2 39.68 nd 19.2 nd nd 44.5
22 43� 22.4280 N 8� 22.4880 W 0.2 39.00 nd 20.2 nd nd 35.3
23 43� 23.1120 N 8� 21.6180 W 0.2 39.52 nd 19.4 nd nd 35.3
24 43� 23.2930 N 8� 23.0950 W 0.2 39.90 nd 19.1 nd nd 22.9
A Coruna,
effluent
plume
June 2003
1 43� 21.9860 N 8� 27.4510 W 0.2 30.91 nd 16.4 nd nd 410
2 43� 21.9780 N 8� 27.4660 W 0.2 31.95 nd 16.1 nd nd 571
3 43� 21.9590 N 8� 27.5040 W 0.2 34.83 nd 15.8 nd nd 106
4 43� 21.9940 N 8� 27.5500 W 0.2 34.04 nd 15.9 nd nd 284
5 43� 22.0490 N 8� 27.4960 W 0.2 35.56 nd 15.7 nd nd 222
6 43� 22.2170 N 8� 27.6030 W 0.2 35.89 nd 15.7 nd nd 67.8
7 43� 22.5130 N 8� 27.2300 W 0.2 36.42 nd 15.7 nd nd 40.2
wat e r r e s e a r c h 4 4 ( 2 0 1 0 ) 4 2 0 4e4 2 1 64208
sampled from a sewage treatment works in Plymouth (May
2003). Water samples were filtered through acid-cleaned 0.4
mm pore size polycarbonate filters (Cyclopore, Whatman) into
acid-cleaned LDPE bottles and acidified to ca. pH 2 using sub-
boiling distilled (SBD) HNO3. Sample filtration for the Tamar,
Fal and A Coruna systems was performed in a laboratory
within 4 h upon sampling, whereas for the Gullmar Fjord and
Adriatic systems the filtrations were conducted on the
research vessels immediately upon sampling. The sample
bottles were stored in re-sealable plastic bags (�2) prior to
silver analysis, which was conducted within 2 months after
sampling. Water samples for SPM, chlorophyll a and total
dissolved nitrogen were collected at the same time as those
for dissolved silver. Sediments were also obtained along
longitudinal transects of the Tamar and River Mero estuaries.
Surface scrapes (top 5 mm) were collected using a plastic
spatula and the sediment was stored frozen in re-sealable
plastic bags prior to analysis. The sampling locations are
shown in Fig. 1bef, with additional logistical data given in
Table 1. All sampling locations were visited on a single occa-
sion for this study.
A detailed description of the methodology used for dis-
solved silver analysis in marine samples can be found else-
where (Yang and Sturgeon, 2002; Barriada et al., 2003, 2007).
Briefly, a 12 mL aliquot of each UV-irradiated sample was
passed through a flow injection system (PrepLab, PS Analytical
Ltd) equipped with a metal-free mini-column (Global FIA Inc.)
filled with a strong anionic exchange resin (Dowex 1X8; Dow
Chemical Corp.). The negatively charged silver chloro-
complexes in the samples were retained by the mini-column
and thereby separated from the saline matrix. Seawater salts
were subsequently rinsed off the mini-column using de-ion-
ised water and the silver chloro-complexes were then eluted
using SBD HNO3 (1.2 M) and detected using Sector Field
Inductively Coupled Plasma Mass Spectrometry (SF-ICP-MS;
Axiom, VG Elemental Ltd). Silver quantification by the SF-ICP-
MS was undertaken by determination of the 107Ag isotope in
single-ion monitoring mode, and using the internal standard
addition method. The internal standard addition approach
involved additions of silver standards at three increasing
concentrations to separate aliquots of each sample. The four
aliquots (sample and three samples with added standards)
were subsequently analysed and the sample concentration
was determined using linear regression. The silver concen-
tration determined in CASS-2 coastal water referencematerial
was 62.2 � 2.4 pM. This value is somewhat higher than the
values reported for CASS-2 by other workers using isotope
dilution ICP-MS (48 � 1 pM) (Yang and Sturgeon, 2002) and
solvent extraction with electrothermal atomic absorption
spectroscopy (ETAAS) analysis (49 � 1 pM) (Smith and Flegal,
1993). However, no certified silver concentration is available
for CASS-2. The limit of detection for the dissolved silver
analysis was calculated from the regression line as 3 times the
standard error of the fit and was 0.5 pM (Barriada et al., 2007),
whereas a daily blank value ranging between 0.5 and 0.9 pM
was subtracted from the sample concentrations.
Silver concentrations in surface sediments (<63 mm frac-
tion) from the Tamar Estuary and River Mero were obtained
following a 15.8 M HNO3 digestion for 12 h. Analysis was
undertaken using ETAAS (Perkin Elmer 4100ZL, with Zeeman
background correction) employing a Pd/Mg nitrate modifier
(Z-Tek) for the Tamar samples, and ICP-MS (Thermo Scientific
X Series 2) for the Mero samples. Accuracy of the silver anal-
yses in sediments was assessed using the MESS-2 marine
sediment reference material (National Research Council
Canada). Good agreement was found between the observed
values of 0.18 � 0.01 mg g�1 Ag (n ¼ 4) and the certified value of
0.18 � 0.02 mg g�1.
Salinity was determined using calibrated multi-parameter
probes for surface samples or CTD units for the vertical
profiles, SPM was quantified by gravimetry, chlorophyll a by
fluorimetry (Parsons et al., 1984) and total dissolved nitrogen
by chemiluminescence following high temperature (680 �C)catalytic combustion (Badr et al., 2003).
2.3. Speciation modelling of dissolved Ag
The speciation of dissolvedAg in both freshwater (S¼ 0, pH 7.0)
and seawater (S ¼ 35, pH 8.2) was calculated using the ther-
modynamic equilibrium software MINEQLþ (v 4.5) to assist
data interpretation. Model simulations included the thiols
H2S (aq) and cysteine, both reportedas important ligands forAg
wat e r r e s e a r c h 4 4 ( 2 0 1 0 ) 4 2 0 4e4 2 1 6 4209
complexation (Bell and Kramer, 1999). The free copper ion
Cu2þ (aq) was also included because of its high affinity for thiol
groups (Al-Farawati and van den Berg, 1999), and EDTA (ethyl-
enediamine tetraacetic acid)was addedas a competitive ligand
forAgþandCu2þ. ConcentrationsofH2S (aq), cysteine,Cu2þ (aq)
and EDTA were 4 nM, 10 nM, 10 nM and 100 mM, respectively
(Tang and Santschi, 2000; Macko and Green, 1982; Braungardt
et al., 2009). Stability constants (log values) for the formation
ofAgHS (aq), Ag-cysteine,Ag-EDTAandCu(HS)2were 11.6, 11.9,
7.22 and 12.9 (Bell and Kramer, 1999; Al-Farawati and van den
Berg, 1999). Other stability constants for complexation reac-
tions of these components were included in the MINEQLþdatabase.Major ionconcentrations for seawater andaglobally-
averaged riverwere taken fromStummandMorgan (1996), and
stability constants for their complexation reactions were
obtained from the MINEQLþ database.
0 10 20 30 400
40
80
120
160
0 10 20 30 400
40
80
120
160
200
RestronguetFal
0 10 20 30 400
5
10
15
20
25
Tamar Estuary
Restronguet Creek / Fal Estuary
River Mero Estuary/ A Coruña Bay
Dis
solv
ed A
g (p
M)
Salinity
harbour
a
b
c
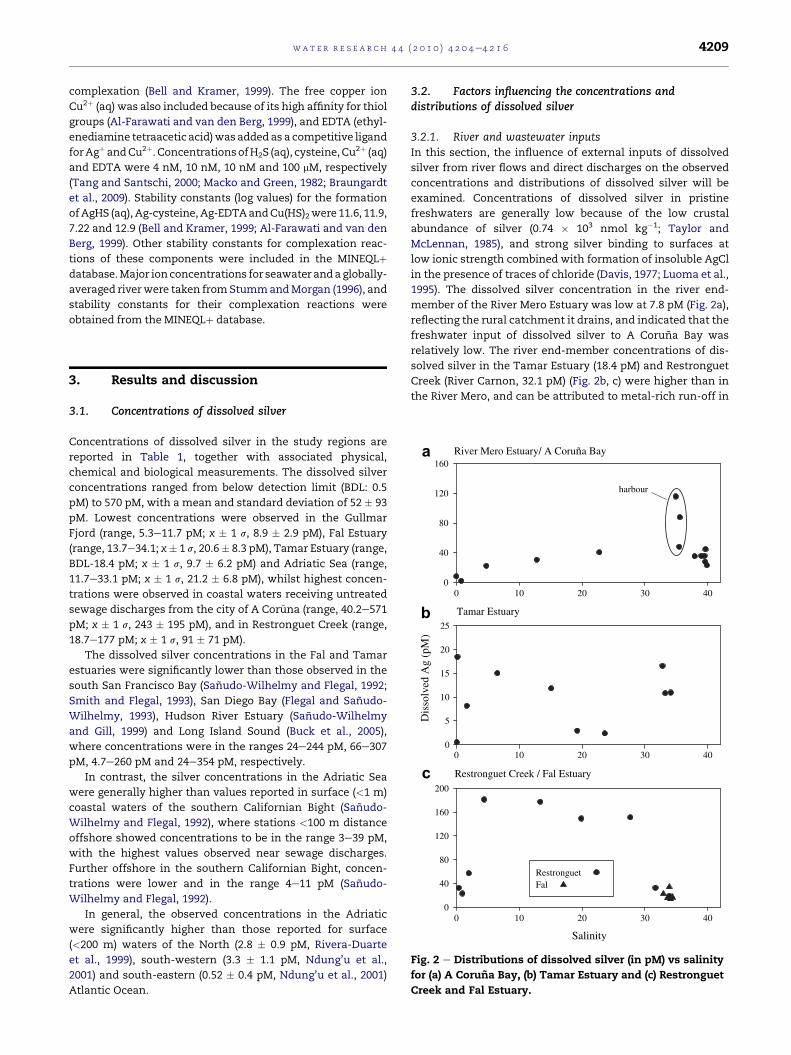
Fig. 2 e Distributions of dissolved silver (in pM) vs salinity
for (a) A Coruna Bay, (b) Tamar Estuary and (c) Restronguet
Creek and Fal Estuary.
3. Results and discussion
3.1. Concentrations of dissolved silver
Concentrations of dissolved silver in the study regions are
reported in Table 1, together with associated physical,
chemical and biological measurements. The dissolved silver
concentrations ranged from below detection limit (BDL: 0.5
pM) to 570 pM, with a mean and standard deviation of 52 � 93
pM. Lowest concentrations were observed in the Gullmar
Fjord (range, 5.3e11.7 pM; x � 1 s, 8.9 � 2.9 pM), Fal Estuary
(range, 13.7e34.1; x� 1 s, 20.6� 8.3 pM), Tamar Estuary (range,
BDL-18.4 pM; x � 1 s, 9.7 � 6.2 pM) and Adriatic Sea (range,
11.7e33.1 pM; x � 1 s, 21.2 � 6.8 pM), whilst highest concen-
trations were observed in coastal waters receiving untreated
sewage discharges from the city of A Cor~una (range, 40.2e571
pM; x � 1 s, 243 � 195 pM), and in Restronguet Creek (range,
18.7e177 pM; x � 1 s, 91 � 71 pM).
The dissolved silver concentrations in the Fal and Tamar
estuaries were significantly lower than those observed in the
south San Francisco Bay (Sanudo-Wilhelmy and Flegal, 1992;
Smith and Flegal, 1993), San Diego Bay (Flegal and Sanudo-
Wilhelmy, 1993), Hudson River Estuary (Sanudo-Wilhelmy
and Gill, 1999) and Long Island Sound (Buck et al., 2005),
where concentrations were in the ranges 24e244 pM, 66e307
pM, 4.7e260 pM and 24e354 pM, respectively.
In contrast, the silver concentrations in the Adriatic Sea
were generally higher than values reported in surface (<1 m)
coastal waters of the southern Californian Bight (Sanudo-
Wilhelmy and Flegal, 1992), where stations <100 m distance
offshore showed concentrations to be in the range 3e39 pM,
with the highest values observed near sewage discharges.
Further offshore in the southern Californian Bight, concen-
trations were lower and in the range 4e11 pM (Sanudo-
Wilhelmy and Flegal, 1992).
In general, the observed concentrations in the Adriatic
were significantly higher than those reported for surface
(<200 m) waters of the North (2.8 � 0.9 pM, Rivera-Duarte
et al., 1999), south-western (3.3 � 1.1 pM, Ndung’u et al.,
2001) and south-eastern (0.52 � 0.4 pM, Ndung’u et al., 2001)
Atlantic Ocean.
3.2. Factors influencing the concentrations anddistributions of dissolved silver
3.2.1. River and wastewater inputsIn this section, the influence of external inputs of dissolved
silver from river flows and direct discharges on the observed
concentrations and distributions of dissolved silver will be
examined. Concentrations of dissolved silver in pristine
freshwaters are generally low because of the low crustal
abundance of silver (0.74 � 103 nmol kg�1; Taylor and
McLennan, 1985), and strong silver binding to surfaces at
low ionic strength combined with formation of insoluble AgCl
in the presence of traces of chloride (Davis, 1977; Luoma et al.,
1995). The dissolved silver concentration in the river end-
member of the River Mero Estuary was low at 7.8 pM (Fig. 2a),
reflecting the rural catchment it drains, and indicated that the
freshwater input of dissolved silver to A Coruna Bay was
relatively low. The river end-member concentrations of dis-
solved silver in the Tamar Estuary (18.4 pM) and Restronguet
Creek (River Carnon, 32.1 pM) (Fig. 2b, c) were higher than in
the River Mero, and can be attributed to metal-rich run-off in
wat e r r e s e a r c h 4 4 ( 2 0 1 0 ) 4 2 0 4e4 2 1 64210
to these rivers from disusedmines and spoil heaps (Bryan and
Gibbs, 1983; Burt, 1998). In each system however, concentra-
tions of dissolved silver in the estuary were enhanced relative
to the river waters, indicating that processes adding to dis-
solved silver concentrationswere in operation, as discussed in
Section 3.2.2. Non-conservative behaviour of dissolved silver
in estuaries has been reported previously (Wen et al., 1997).
The freshwater concentrations observed in the current study
are comparable to those reported for rivers sampled using
similar trace metal clean procedures, with values ranging
from ca. 6 pM in the Sacramento and San Joaquin Rivers
feeding San Francisco Bay (Flegal et al., 1996), 5e40 pM in
rivers feeding the Hudson River Estuary (Sanudo-Wilhelmy
and Gill, 1999) and up to 90 pM in rivers discharging into
Long Island Sound (Buck et al., 2005).
In the Adriatic Sea, a significant inverse correlation was
observed between salinity and total dissolved nitrogen
(r2 ¼ 0.73, p ¼ 0.004) for waters above the halocline (but
including the offshore well-mixed water column) indicating
that N-rich river water, resulting from anthropogenic inputs
in the River Po catchment (UNEP, 2004), was mixing with low-
N marine water. Consequently, for the same waters a signifi-
cant positive correlation between total dissolved nitrogen and
dissolved silver (r2 ¼ 0.76, p ¼ 0.002) and a negative correlation
between salinity and dissolved silver (r2 ¼ 0.51, p ¼ 0.032)
suggested that land-based inputs were also important for
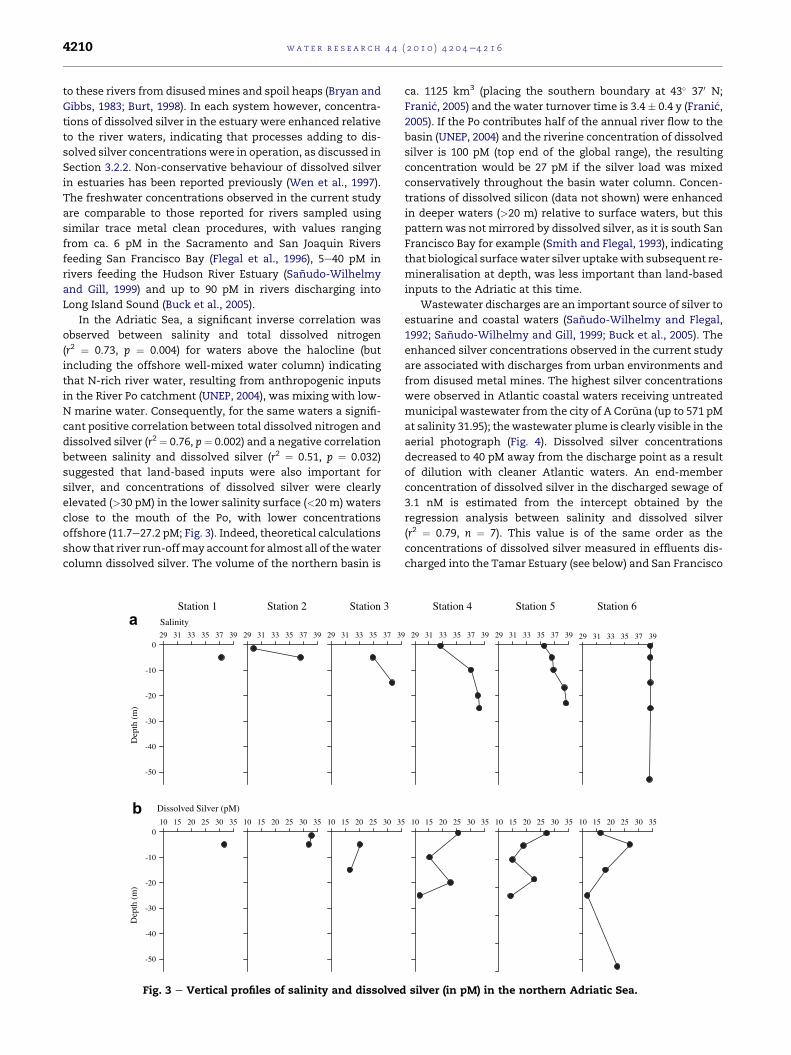
silver, and concentrations of dissolved silver were clearly
elevated (>30 pM) in the lower salinity surface (<20 m) waters
close to the mouth of the Po, with lower concentrations
offshore (11.7e27.2 pM; Fig. 3). Indeed, theoretical calculations
show that river run-offmay account for almost all of thewater
column dissolved silver. The volume of the northern basin is
29 31 33 35 37 39
-50
-40
-30
-20
-10
029 31 33 35 37 39 29 31 33 35 37 3
Station 1 Station 2 Station 3Salinity
10 15 20 25 30 35
-50
-40
-30
-20
-10
010 15 20 25 30 35 10 15 20 25 30 3
Dissolved Silver (pM)
Dep
th (
m)
Dep
th (
m)
a
b
Fig. 3 e Vertical profiles of salinity and dissolved
ca. 1125 km3 (placing the southern boundary at 43� 370 N;
Frani�c, 2005) and the water turnover time is 3.4� 0.4 y (Frani�c,
2005). If the Po contributes half of the annual river flow to the
basin (UNEP, 2004) and the riverine concentration of dissolved
silver is 100 pM (top end of the global range), the resulting
concentration would be 27 pM if the silver load was mixed
conservatively throughout the basin water column. Concen-
trations of dissolved silicon (data not shown) were enhanced
in deeper waters (>20 m) relative to surface waters, but this
pattern was not mirrored by dissolved silver, as it is south San
Francisco Bay for example (Smith and Flegal, 1993), indicating
that biological surfacewater silver uptakewith subsequent re-
mineralisation at depth, was less important than land-based
inputs to the Adriatic at this time.
Wastewater discharges are an important source of silver to
estuarine and coastal waters (Sanudo-Wilhelmy and Flegal,
1992; Sanudo-Wilhelmy and Gill, 1999; Buck et al., 2005). The
enhanced silver concentrations observed in the current study
are associated with discharges from urban environments and
from disused metal mines. The highest silver concentrations
were observed in Atlantic coastal waters receiving untreated
municipal wastewater from the city of A Cor~una (up to 571 pM
at salinity 31.95); thewastewater plume is clearly visible in the
aerial photograph (Fig. 4). Dissolved silver concentrations
decreased to 40 pM away from the discharge point as a result
of dilution with cleaner Atlantic waters. An end-member
concentration of dissolved silver in the discharged sewage of
3.1 nM is estimated from the intercept obtained by the
regression analysis between salinity and dissolved silver
(r2 ¼ 0.79, n ¼ 7). This value is of the same order as the
concentrations of dissolved silver measured in effluents dis-
charged into the Tamar Estuary (see below) and San Francisco
9 29 31 33 35 37 39 29 31 33 35 37 39 29 31 33 35 37 39
Station 4 Station 5 Station 6
5 10 15 20 25 30 35 10 15 20 25 30 35 10 15 20 25 30 35
silver (in pM) in the northern Adriatic Sea.
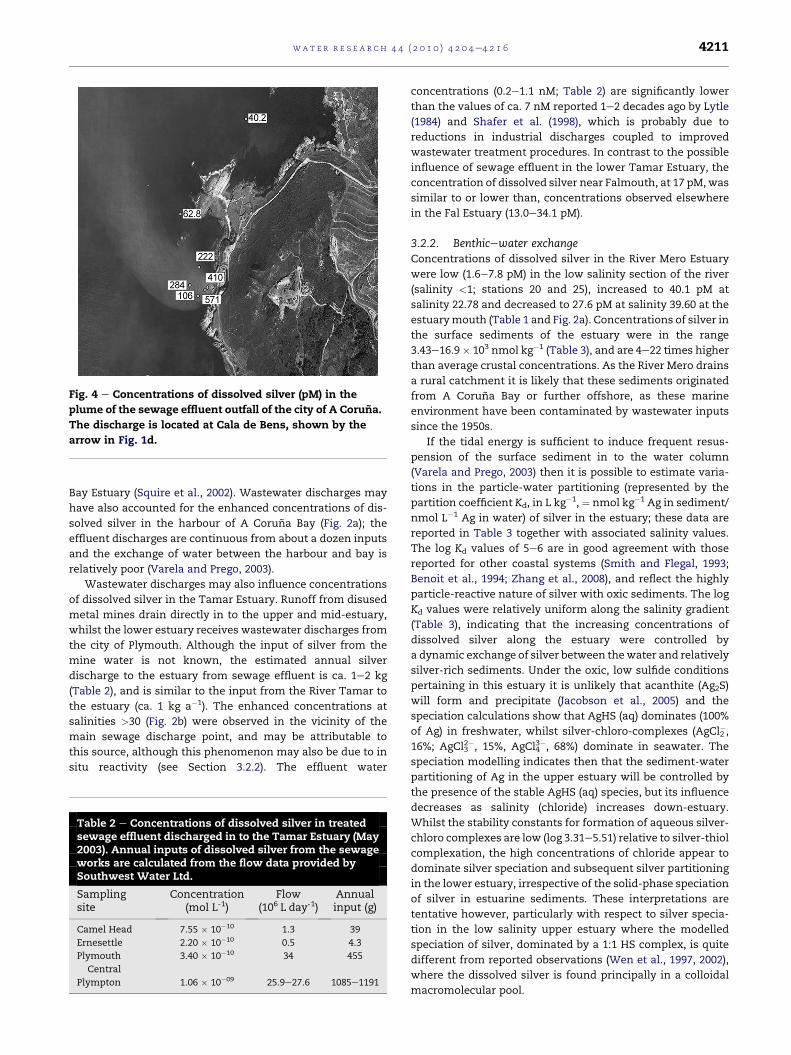
Fig. 4 e Concentrations of dissolved silver (pM) in the
plume of the sewage effluent outfall of the city of A Coruna.
The discharge is located at Cala de Bens, shown by the
arrow in Fig. 1d.
wat e r r e s e a r c h 4 4 ( 2 0 1 0 ) 4 2 0 4e4 2 1 6 4211
Bay Estuary (Squire et al., 2002). Wastewater discharges may
have also accounted for the enhanced concentrations of dis-
solved silver in the harbour of A Coruna Bay (Fig. 2a); the
effluent discharges are continuous from about a dozen inputs
and the exchange of water between the harbour and bay is
relatively poor (Varela and Prego, 2003).
Wastewater discharges may also influence concentrations
of dissolved silver in the Tamar Estuary. Runoff from disused
metal mines drain directly in to the upper and mid-estuary,
whilst the lower estuary receives wastewater discharges from
the city of Plymouth. Although the input of silver from the
mine water is not known, the estimated annual silver
discharge to the estuary from sewage effluent is ca. 1e2 kg
(Table 2), and is similar to the input from the River Tamar to
the estuary (ca. 1 kg a�1). The enhanced concentrations at
salinities >30 (Fig. 2b) were observed in the vicinity of the
main sewage discharge point, and may be attributable to
this source, although this phenomenon may also be due to in
situ reactivity (see Section 3.2.2). The effluent water
Table 2 e Concentrations of dissolved silver in treatedsewage effluent discharged in to the Tamar Estuary (May2003). Annual inputs of dissolved silver from the sewageworks are calculated from the flow data provided bySouthwest Water Ltd.
Samplingsite
Concentration(mol L-1)
Flow(106 L day-1)
Annualinput (g)
Camel Head 7.55 � 10�10 1.3 39
Ernesettle 2.20 � 10�10 0.5 4.3
Plymouth
Central
3.40 � 10�10 34 455
Plympton 1.06 � 10�09 25.9e27.6 1085e1191
concentrations (0.2e1.1 nM; Table 2) are significantly lower
than the values of ca. 7 nM reported 1e2 decades ago by Lytle
(1984) and Shafer et al. (1998), which is probably due to
reductions in industrial discharges coupled to improved
wastewater treatment procedures. In contrast to the possible
influence of sewage effluent in the lower Tamar Estuary, the
concentration of dissolved silver near Falmouth, at 17 pM,was
similar to or lower than, concentrations observed elsewhere
in the Fal Estuary (13.0e34.1 pM).
3.2.2. Benthicewater exchangeConcentrations of dissolved silver in the River Mero Estuary
were low (1.6e7.8 pM) in the low salinity section of the river
(salinity <1; stations 20 and 25), increased to 40.1 pM at
salinity 22.78 and decreased to 27.6 pM at salinity 39.60 at the
estuarymouth (Table 1 and Fig. 2a). Concentrations of silver in
the surface sediments of the estuary were in the range
3.43e16.9� 103 nmol kg�1 (Table 3), and are 4e22 times higher
than average crustal concentrations. As the River Mero drains
a rural catchment it is likely that these sediments originated
from A Coruna Bay or further offshore, as these marine
environment have been contaminated by wastewater inputs
since the 1950s.
If the tidal energy is sufficient to induce frequent resus-
pension of the surface sediment in to the water column
(Varela and Prego, 2003) then it is possible to estimate varia-
tions in the particle-water partitioning (represented by the
partition coefficient Kd, in L kg�1, ¼ nmol kg�1 Ag in sediment/
nmol L�1 Ag in water) of silver in the estuary; these data are
reported in Table 3 together with associated salinity values.
The log Kd values of 5e6 are in good agreement with those
reported for other coastal systems (Smith and Flegal, 1993;
Benoit et al., 1994; Zhang et al., 2008), and reflect the highly
particle-reactive nature of silver with oxic sediments. The log
Kd values were relatively uniform along the salinity gradient
(Table 3), indicating that the increasing concentrations of
dissolved silver along the estuary were controlled by
a dynamic exchange of silver between thewater and relatively
silver-rich sediments. Under the oxic, low sulfide conditions
pertaining in this estuary it is unlikely that acanthite (Ag2S)
will form and precipitate (Jacobson et al., 2005) and the
speciation calculations show that AgHS (aq) dominates (100%
of Ag) in freshwater, whilst silver-chloro-complexes (AgCl2�,
16%; AgCl32�, 15%, AgCl4
3�, 68%) dominate in seawater. The
speciation modelling indicates then that the sediment-water
partitioning of Ag in the upper estuary will be controlled by
the presence of the stable AgHS (aq) species, but its influence
decreases as salinity (chloride) increases down-estuary.
Whilst the stability constants for formation of aqueous silver-
chloro complexes are low (log 3.31e5.51) relative to silver-thiol
complexation, the high concentrations of chloride appear to
dominate silver speciation and subsequent silver partitioning
in the lower estuary, irrespective of the solid-phase speciation
of silver in estuarine sediments. These interpretations are
tentative however, particularly with respect to silver specia-
tion in the low salinity upper estuary where the modelled
speciation of silver, dominated by a 1:1 HS complex, is quite
different from reported observations (Wen et al., 1997, 2002),
where the dissolved silver is found principally in a colloidal
macromolecular pool.
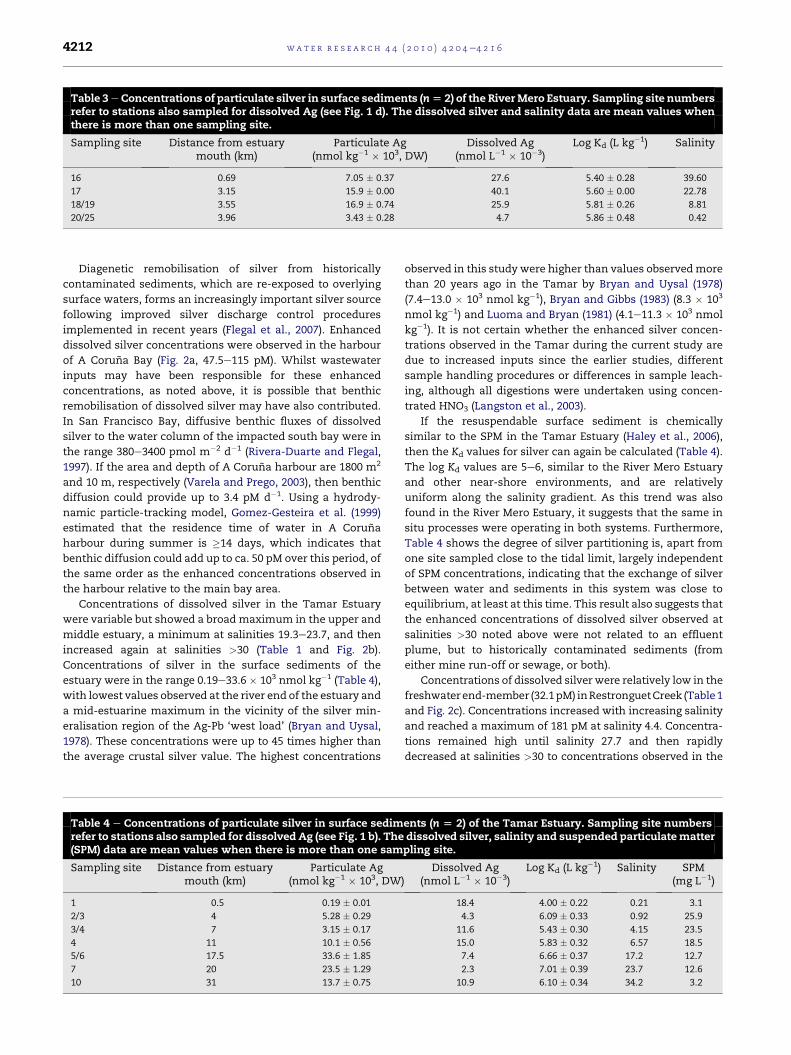
Table 3eConcentrations of particulate silver in surface sediments (n[ 2) of the RiverMero Estuary. Sampling site numbersrefer to stations also sampled for dissolved Ag (see Fig. 1 d). The dissolved silver and salinity data are mean values whenthere is more than one sampling site.
Sampling site Distance from estuarymouth (km)
Particulate Ag(nmol kg�1 � 103, DW)
Dissolved Ag(nmol L�1 � 10�3)
Log Kd (L kg�1) Salinity
16 0.69 7.05 � 0.37 27.6 5.40 � 0.28 39.60
17 3.15 15.9 � 0.00 40.1 5.60 � 0.00 22.78
18/19 3.55 16.9 � 0.74 25.9 5.81 � 0.26 8.81
20/25 3.96 3.43 � 0.28 4.7 5.86 � 0.48 0.42
wat e r r e s e a r c h 4 4 ( 2 0 1 0 ) 4 2 0 4e4 2 1 64212
Diagenetic remobilisation of silver from historically
contaminated sediments, which are re-exposed to overlying
surface waters, forms an increasingly important silver source
following improved silver discharge control procedures
implemented in recent years (Flegal et al., 2007). Enhanced
dissolved silver concentrations were observed in the harbour
of A Coruna Bay (Fig. 2a, 47.5e115 pM). Whilst wastewater
inputs may have been responsible for these enhanced
concentrations, as noted above, it is possible that benthic
remobilisation of dissolved silver may have also contributed.
In San Francisco Bay, diffusive benthic fluxes of dissolved
silver to the water column of the impacted south bay were in
the range 380e3400 pmol m�2 d�1 (Rivera-Duarte and Flegal,
1997). If the area and depth of A Coruna harbour are 1800 m2
and 10 m, respectively (Varela and Prego, 2003), then benthic
diffusion could provide up to 3.4 pM d�1. Using a hydrody-
namic particle-tracking model, Gomez-Gesteira et al. (1999)
estimated that the residence time of water in A Coruna
harbour during summer is �14 days, which indicates that
benthic diffusion could add up to ca. 50 pM over this period, of
the same order as the enhanced concentrations observed in
the harbour relative to the main bay area.
Concentrations of dissolved silver in the Tamar Estuary
were variable but showed a broad maximum in the upper and
middle estuary, a minimum at salinities 19.3e23.7, and then
increased again at salinities >30 (Table 1 and Fig. 2b).
Concentrations of silver in the surface sediments of the
estuary were in the range 0.19e33.6 � 103 nmol kg�1 (Table 4),
with lowest values observed at the river end of the estuary and
a mid-estuarine maximum in the vicinity of the silver min-
eralisation region of the Ag-Pb ‘west load’ (Bryan and Uysal,
1978). These concentrations were up to 45 times higher than
the average crustal silver value. The highest concentrations
Table 4 e Concentrations of particulate silver in surface sedimrefer to stations also sampled for dissolved Ag (see Fig. 1 b). The(SPM) data are mean values when there is more than one sam
Sampling site Distance from estuarymouth (km)
Particulate Ag(nmol kg�1 � 103, DW
1 0.5 0.19 � 0.01
2/3 4 5.28 � 0.29
3/4 7 3.15 � 0.17
4 11 10.1 � 0.56
5/6 17.5 33.6 � 1.85
7 20 23.5 � 1.29
10 31 13.7 � 0.75
observed in this study were higher than values observedmore
than 20 years ago in the Tamar by Bryan and Uysal (1978)
(7.4e13.0 � 103 nmol kg�1), Bryan and Gibbs (1983) (8.3 � 103
nmol kg�1) and Luoma and Bryan (1981) (4.1e11.3 � 103 nmol
kg�1). It is not certain whether the enhanced silver concen-
trations observed in the Tamar during the current study are
due to increased inputs since the earlier studies, different
sample handling procedures or differences in sample leach-
ing, although all digestions were undertaken using concen-
trated HNO3 (Langston et al., 2003).
If the resuspendable surface sediment is chemically
similar to the SPM in the Tamar Estuary (Haley et al., 2006),
then the Kd values for silver can again be calculated (Table 4).
The log Kd values are 5e6, similar to the River Mero Estuary
and other near-shore environments, and are relatively
uniform along the salinity gradient. As this trend was also
found in the River Mero Estuary, it suggests that the same in
situ processes were operating in both systems. Furthermore,
Table 4 shows the degree of silver partitioning is, apart from
one site sampled close to the tidal limit, largely independent
of SPM concentrations, indicating that the exchange of silver
between water and sediments in this system was close to
equilibrium, at least at this time. This result also suggests that
the enhanced concentrations of dissolved silver observed at
salinities >30 noted above were not related to an effluent
plume, but to historically contaminated sediments (from
either mine run-off or sewage, or both).
Concentrations of dissolved silver were relatively low in the
freshwaterend-member (32.1pM) inRestronguetCreek (Table1
and Fig. 2c). Concentrations increased with increasing salinity
and reached a maximum of 181 pM at salinity 4.4. Concentra-
tions remained high until salinity 27.7 and then rapidly
decreased at salinities >30 to concentrations observed in the
ents (n [ 2) of the Tamar Estuary. Sampling site numbersdissolved silver, salinity and suspended particulatematterpling site.
)Dissolved Ag
(nmol L�1 � 10�3)Log Kd (L kg�1) Salinity SPM
(mg L�1)
18.4 4.00 � 0.22 0.21 3.1
4.3 6.09 � 0.33 0.92 25.9
11.6 5.43 � 0.30 4.15 23.5
15.0 5.83 � 0.32 6.57 18.5
7.4 6.66 � 0.37 17.2 12.7
2.3 7.01 � 0.39 23.7 12.6
10.9 6.10 � 0.34 34.2 3.2
wat e r r e s e a r c h 4 4 ( 2 0 1 0 ) 4 2 0 4e4 2 1 6 4213
wider Fal system (Table 1). Bryan and Gibbs (1983) reported
elevated silver concentrations (24.1e38.0 � 103 nmol kg�1) in
surface sediments from Restronguet Creek (<100 mm fraction,
concentrated HNO3 digest; Langston et al., 2003), as a result of
metal-richmine run-off, relative to thewider Fal system,where
sediment concentrations were generally lower (0.93e7.4 � 103
nmolkg�1).Theseconcentrationsanddistributionsofdissolved
and sediment-associated silver suggest that the enhanced
levels of dissolved silver observed were caused by the silver-
rich sediments releasing silver in to the water column whilst
relatively high salinity water was resident in the Creek at high
water. Substantial benthic re-mineralisation from Restronguet
Creek sediments has been reported for dissolved metals
(Langston et al., 2003), and the release of dissolved silver, at the
rates reportedbyRivera-DuarteandFlegal (1997), couldaccount
for the enhanced water column concentrations if the water
residence times, which are not known (Uncles et al., 2002), are
sufficiently long.
Estimated log Kd values were 2.1e2.4 in Restronguet Creek
and 1.4e2.7 in the wider Fal system, indicating that the solid-
solution partitioning of silver was similar throughout this
system. These values, which are much lower than the log Kd
values of 5e6 calculated for the Tamar and Mero estuaries,
indicate sorptive exchange was less important in moderating
concentrations of dissolved silver in these waters. Rivers
draining in to the Fal system contain high concentrations of
dissolved iron because of acid mine drainage. On contact with
saline water the dissolved iron flocculates, and consequently
as a result of this process, the bed sediments (<100 mm frac-
tion) in the Fal system contain iron oxyhydroxide concen-
trations in the range 30e95 mg g�1, which are some of the
highest measured in UK estuarine sediments (Bryan and
Gibbs, 1983; Langston et al., 2003). It is known that hydrated
iron oxides are poor scavengers of silver, yielding log Kd
values of ca. 2 (Luoma et al., 1995; Wen et al., 1997). Thus the
low Kd values may be due to limited sorption of silver on to
iron oxide e rich sediments, perhaps coupled with extensive
benthic re-mineralisation of dissolved silver.
3.3. A pristine coastal system
The Gullmar Fjord had the lowest mean concentration of
dissolved silver (8.9 � 2.9 pM) in the study regions (Table 1),
which can be explained by the absence of a major source of
water pollution (Lindahl, 1995). Lowest dissolved silver
concentrations in the fjord were observed in the surface
waters of the stratified water column, with concentrations
ranging between 5.3 and 11 pM. The deeper waters showed
slightly higher concentrations, ranging from 10.1 to 11 pM,
indicating silver sorption to phytoplankton cells in the surface
waterswith consequent sinking and release of silver following
mineralisation of the algal material. The deep water is usually
renewed annually, during late winter or early spring, when
Skagerrak deep water enters the fjord (Rydberg, 1975). The
dissolved silver concentrations in the deep water of the fjord
(salinity 30e35) are only slightly higher than in the deep North
Atlantic Ocean (ca. 4e10 pM, Flegal et al., 1995; Ndung’u et al.,
2001), indicating the low silver inputs to this fjord. From this
perspective, Gullmar fjord can be considered a pristine site
with respect to dissolved silver.
3.4. Anticipated future silver burden to the marineenvironment
Whilst it is likely that the sedimentswill remainas a secondary
source of silver to estuarine and coastal waters for some time
to come, reduction of silver discharges by the photographic
and electroplating industries could clearly result in reduced
environmental pressures. It is anticipated, however, that silver
discharges to theenvironmentwill increasemarkedly in future
years through the incorporation of silver in nanoparticles
added to consumer goods for their antimicrobial function
(Benn and Westerhoff, 2008). Application of silver nano-
particles has been reported in socks to restrict the growth of
odour causing bacteria, and also in fridges, washingmachines
and water filters to control pathogenic bacterial growth
(Woodrow Wilson International Center for Scholars, www.
nanotechproject.org/44, accessed January 2009; Duran et al.,
2007). There are now 803 consumer products that contain
nanoparticles, with silver forming the active ingredient in 56%
of these products (Woodrow Wilson International Center for
Scholars, www.nanotechproject.org/44, accessed January
2009). The release of silver from commercial clothing (socks
with maximum ca. 6 mmol Ag g-1 sock) into wash water can be
up to 50% (Benn and Westerhoff, 2008), resulting in a serious
silver burden for sewage treatment plants, with accumulation
in the sewage sludge, and for the receiving natural waters.
4. Conclusions
This paper presents the first extended dataset on dissolved
silver in estuaries and coastal waters of Europe. Main findings
are that enhanced dissolved silver concentrations are found in
waters impacted by sewage discharges and overlying histori-
cally contaminated sediments, and the concentrations of
dissolved silver along the Tamar and Mero estuaries were
controlled by a dynamic exchange of silver between the water
and relatively silver-rich sediments. Furthermore, the range
in log Kd (5e6) were similar for the Tamar and Mero estuaries
and compared well with other estuaries in the US and Japan,
despite differences in physico-chemical conditions in the
different catchments. The relatively narrow Kd range reported
in all studies indicates that the partitioning of silver between
the particulate and dissolved phases in estuarine waters is
controlled by similar factors worldwide.
The phenomenon of invariant Kd with changing salinity is
probably a function of the balance between the chloro-
complexation of dissolved silver, rapid exchange of silver
betweenwater and particles, and the precipitation, salting out
or sorption on to particles of a pool of organically-complexed
dissolved silver.
The Restronguet Creek and Fal estuarine system, which
has been subjected to centuries of silver run-off from mines,
had estimated log Kd values (1.4e2.7) which deviate markedly
from reported values. The relatively low Kd values in this
system are most likely due to enhanced benthic silver mobi-
lization coupled to limited sorption of silver on to iron oxide-
rich sediments.
The emergence of digital photography, in addition to
improved wastewater treatment, has resulted in reduced

wat e r r e s e a r c h 4 4 ( 2 0 1 0 ) 4 2 0 4e4 2 1 64214
silver inputs to marine systems over the last decade(s), whilst
it is likely that the sediments will remain as a secondary
source of silver to marine waters for some time to come.
A clear immediate concern is the incorporation of silver in
nanoparticles added to consumer goods, with subsequent
release into the marine environment through wastewater
discharges. Whilst the toxicity of silver to humans is very low,
the high toxicity of this element to marine microbial and
invertebrate communities may warrant strict controls.
Acknowledgements
This research has been supported by a Marie Curie Fellowship
of the European Community programme Energy, Environ-
ment and Sustainable Development under contract number
EVK3-CT-2001-50004. We thank J. Rattray for silver analysis of
the Tamar sediments, and Kate Davies for assistance with the
figures. The captain and crews of the G. Dallaporta and the
A. Tiselius are thanked for their assistance, as are the boat
crew of the University of Plymouth Diving Centre.
r e f e r e n c e s
Achterberg, E.P., Holland, T.W., Bowie, A.R., Mantoura, R.F.C.,Worsfold, P.J., 2001. Determination of iron in seawater.Analytica Chimica Acta 442, 1e14.
Adams, N.W.H., Kramer, J.R., 1998. Reactivity of Agþ ion with thiolligands in the presence of iron sulfide. EnvironmentalToxicology and Chemistry 17, 625e629.
Al-Farawati, R., van den Berg, C.M.G., 1999. Metal-sulfidecomplexation in seawater. Marine Chemistry 63, 331e352.
Badr, E.- S.A., Achterberg, E.P., Tappin, A.D., Hill, S.J.,Braungardt, C.B., 2003. Determination of dissolved organicnitrogen in natural waters using high temperature catalyticoxidation. Trends in Analytical Chemistry 22, 819e827.
Barriada, J.L., Truscott, J.B., Achterberg, E.P., 2003. Automation ofa flow injection system for the determination of dissolvedsilver at picomolar concentrations in seawater withInductively Coupled Plasma Mass Spectrometry. Journal ofAutomated Methods and Management in Chemistry 25,93e100.
Barriada, J.L., Tappin, A.D., Evans, E.H., Achterberg, E.P., 2007.Dissolved silver measurements in seawater. Trends inAnalytical Chemistry 26, 809e817.
Bell, R.A., Kramer, J.R., 1999. Structural chemistry andgeochemistry of silver-sulfur compounds: critical review.Environmental Toxicology and Chemistry 18, 9e22.
Benn, T.M., Westerhoff, P., 2008. Nanoparticle silver released intowater from commercially available sock fabrics.Environmental Science and Technology 42, 4133e4139.
Benoit, G., Oktay-Marshall, S.D., Cantu, A., Hood, E.M.,Coleman, C.H., Corapcioglu, M.O., Santschi, P.H., 1994.Partitioning of Cu, Pb, Ag, Zn, Fe, Al, and Mn between filter-retained particles, colloids, and solution in six Texasestuaries. Marine Chemistry 45, 307e336.
Bielmyer, G.K., Grosell, M., Paquin, P.R., Mathews, R., Wu, K.B.,Santore, R.C., Brix, K.V., 2007. Validation study of the acutebiotic ligand model for silver. Environmental Toxicology andChemistry 26, 2241e2246.
Booker, F., 1976. The Industrial Archaeology of the Tamar Valley.David & Charles, Newton Abbot.
Braungardt, C.B., Achterberg, E.P., Axelsson, B., Buffle, J.,Graziotton, F., Howell, K.A., Illuminati, S., Scarponi, G.,Tappin, A.D., Tercier-Waeber, M.-L., Turner, D., 2009. Analysisof dissolved metal fractions in coastal waters: an inter-comparison of five voltammetric in situ profiling (VIP)systems. Marine Chemistry 114, 47e55.
Bryan, G.W., 1984. Pollution due to heavy metals and theircompounds. In: Kinne, O. (Ed.), Marine Ecology, volume 5, part3. John Wiley & Sons Ltd, Chichester, pp. 1289e1431.
Bryan, G.W., Hummerstone, L.G., 1977. Indicators of heavy-metalcontamination in the Looe Estuary (Cornwall) with particularregard to silver and lead. Journal of the Marine BiologicalAssociation UK 57, 75e92.
Bryan, G.W., Gibbs, P.E., 1983. Heavy Metals in the Fal Estuary,Cornwall. A Study of Long term Contamination by MiningWaste and its Effects on Estuarine Organisms. MarineBiological Association UK. Occasional Publication 2.
Bryan, G.W., Langston, W.J., 1992. Bioavailability, accumulationand effects of heavy metals in sediments with specialreference to United Kingdom estuaries: a review.Environmental Pollution 76, 89e131.
Bryan, G.W., Uysal, H., 1978. Heavy metals in the burrowingbivalve Scrobicularia plana from the Tamar Estuary in relationto environmental levels. Journal of the Marine BiologicalAssociation UK 58, 89e108.
Buck, N.J., Gobler, C.J., Sanudo-Wilhelmy, S.A., 2005. Dissolvedtrace element concentrations in the East RivereLong IslandSound system: relative importance of autochthonous versusallochthonous sources. Environmental Science andTechnology 39, 3528e3533.
Burt, R., 1998. History of metalliferous mining. In: Sellwood, E.B.,Durrance, E.M., Bristow, C.M. (Eds.), The Geology of Cornwall.University of Exeter Press, Exeter, pp. 211e225.
Campbell, P.G.C., 1995. Interactions between trace metals andaquatic organisms: a critique of the free-ion activity model. In:Tessier, A., Turner, D.R. (Eds.), Metal Speciation andBioavailability on Aquatic Systems. John Wiley & Son,Chichester, pp. 45e102.
Cowan, C.E., Jenne, E.A., Crecelius, E.A., 1985. Silver speciation inseawater: the importance of sulphide and organic complexes.In: Sigleo, A.C., Hattori, A. (Eds.), Marine and EstuarineGeochemistry. Lewis Publishers Inc, Michigan, pp. 285e303.
Davis, J.A., 1977 Adsorption of Trace Metals and ComplexingLigands at the Oxide/Water Interface. PhD Thesis. StanfordUniversity, Stanford, California, 176 pp.
Duran, N., Marcato, P.D., De Souza, G.I.H., Alves, O.L., Esposito, E.,2007. Antibacterial effect of silver nanoparticles produced byfungal process on textile fabrics and their effluent treatment.Journal of Biomedical Nanotechnology 3, 203e208.
Fain, A.M.V., Ogston, A.S., Sternberg, R.W., 2007. Sedimenttransport event analysis on the western Adriatic continentalshelf. Continental Shelf Research 27, 431e451.
Felipe-Sotelo, M., Andrade, J.M., Carlosena, A., Tauler, R., 2007.Temporal characterisation of river waters in urban and semi-urban areas using physico-chemical parameters andchemometric methods. Analytica Chimica Acta 583, 128e137.
Fisher, N.S., Bohe, M., Teyssie, J.L., 1984. Accumulation andtoxicity of Cd, Zn, Ag, and Hg in four marine phytoplankters.Marine Ecology Progress Series 18, 201e213.
Fisher, N.S., Wente, M., 1993. The release of trace elements bydyingmarine phytoplankton. Deep-Sea Research I 40, 671e694.
Flegal, A.R., Smith, G.J., Gill, G.A., Sanudo-Wilhelmy, S.,Anderson, L.C.D., 1991. Dissolved trace-element cycles in theSan-Francisco Bay estuary. Marine Chemistry 36, 329e363.
Flegal, A.R., Sanudo-Wilhelmy, S.A., 1993. Comparable levels oftrace metal contamination in two semi-enclosedembayments; San Diego Bay and south San Francisco Bay.Environmental Science and Technology 27, 1934e1936.
wat e r r e s e a r c h 4 4 ( 2 0 1 0 ) 4 2 0 4e4 2 1 6 4215
Flegal, A.R., Sanudo-Wilhelmy, S.A., Scelfo, G.M., 1995. Silver inthe eastern Atlantic-Ocean. Marine Chemistry 49, 315e320.
Flegal, A.R., Rivera-Duarte, I., Ritson, P.I., Scelfo, G.M., Smith, G.J.,Gordon, M.R., Sanudo-Wilhelmy, S.A., 1996. Metalcontamination in San Francisco Bay waters: historicperturbations, contemporary concentrations, and futureconsiderations. In: Hollibaugh, J.T. (Ed.), San Francisco Bay:The Ecosystem. American Association for the Advancement ofScience, San Francisco, pp. 173e188.
Flegal, A.R., Rivera-Duarte, I., Sanudo-Wilhelmy, S.A., 1997. Silvercontamination in aquatic environments. ReviewsContamination and Toxicology 148, 139e162.
Flegal, A.R., Brown, C.L., Squire, S., Ross, J.R.M., Scelfo, G.M.,Hibdon, S., 2007. Spatial and temporal variations in silvercontamination and toxicity in San Francisco Bay.Environmental Research 105, 34e52.
Frani�c, Z., 2005. Estimation of the Adriatic Sea water turnovertime using fallout 90Sr as a radioactive tracer. Journal ofMarine Systems 57, 1e12.
Gomez-Gesteira, M., Montero, P., Prego, R., Taboada, J.J., Leitao, P.,Ruiz-Villarreal, M., Neves, R., Perez-Villar, P., 1999. A two-dimensional particle-tracking model for pollution dispersionin A Coruna and Vigo rias (NW Spain). Oceanologica Acta 22,167e177.
Haley, S.M., Tappin, A.D., Bond, P.R., Fitzsimons, M.F., 2006. Acomparison of SEM-EDS with ICP-AES for the quantitativeelemental determination of estuarine particles.Environmental Chemistry Letters 4, 235e238.
Jacobson, A.R., Martınez, C.E., Spagnuolo, M., McBride, M.B.,Baveye, P., 2005. Reduction of silver solubility by humic acidand thiol ligands during acanthite (b-Ag2S) dissolution.Environmental Pollution 135, 1e9.
Langston, W.J., Chesman, B.S., Burt, G.R., Hawkins, S.J.,Readman, J., Worsfold, P.J., 2003. Characterisation of EuropeanMarine Sites. The Fal and Helford, Occasional Publication No.8, p. 160. Marine Biological Association. ISSN 0260e2784.
Lee, D.Y., Fortin, C., Campbell, P.G.C., 2005. Contrasting effects ofchloride on the toxicity of silver to two green algae,Pseudokirchneriella subcapitata and Chlamydomonas reinhardtii.Aquatic Toxicology 75, 127e135.
Lindahl, O., 1995. Long-term studies of primary phytoplanktonproduction in the Gullmar fjord, Sweden. In: Skjoldal, H.R.,Hopkins, C., Erikstad, K.E., Leinaas, H.P. (Eds.), Ecology ofFjords and Coastal Waters. Elsevier, Amsterdam, pp. 105e112.
Lindahl, O., Hernroth, L., 1983. Phyto-zooplankton community incoastal waters of western Swedendan ecosystem off balance.Marine Ecology Progress Series 10, 119e126.
Luoma, S.N., Bryan, G.W., 1981. A statistical assessment of theform of trace metals in oxidised estuarine sedimentemploying chemical extractants. Science of the TotalEnvironment 17, 165e196.
Luoma, S.N., Ho, Y.B., Bryan, G.W., 1995. Fate, bioavailability andtoxicity of silver in estuarine environments. Marine PollutionBulletin 31, 44e54.
Lytle, P.E., 1984. Fate and speciation of silver in publicly ownedtreatment works. Environmental Toxicology and Chemistry 3,21e30.
Macko, S.A., Green, E.J., 1982. An investigation of the dissolved freeamino acids and their relation to phytoplankton cell density inthe Damariscotta River Estuary, Maine. Estuaries 5, 68e73.
Martin, J.H., Knauer, G.A., Gordon, R.M., 1983. Silver distributionsand fluxes in northeast Pacific waters. Nature 305, 306e309.
McDonnell, G., Russell, A.D., 1999. Antiseptics and disinfectants:activity, action, and resistance. Clinical Microbiology Reviews12, 147e179.
Miller, L.A., Bruland, K.W., 1995. Organic speciation of silver inmarine waters. Environmental Science and Technology 29,2616e2621.
Morford, J.L., Kalnejais, L.H., Helman, P., Yen, G., Reinard, M.,2008. Geochemical cycling of silver in marine sedimentsalong an offshore transect. Marine Chemistry 110,77e88.
Morgan, T.P., Grosell, M., Gilmour, M., Playle, R.C., Wood, C.M.,2004. Time course analysis of the mechanism by which silverinhibits active Naþ and Cl� uptake in gills of rainbow trout.American Journal of Physiology-Regulative Integrative andComparative Physiology 287, R234eR242.
Ndung’u, K., Thomas, M.A., Flegal, A.R., 2001. Silver in thewestern equatorial and South Atlantic Ocean. Deep-SeaResearch Part II e Topical Studies in Oceanography 48,2933e2945.
Parsons, T.R., Maita, Y., Lalli, C.M., 1984. A Manual of Chemicaland Biological Methods for Seawater Analysis. PergamonPress, Oxford, 173 pp.
Penna, N., Capellacci, S., Ricci, F., 2004. The influence of the PoRiver discharge on phytoplankton bloom dynamics along thecoastline of Pesaro (Italy) in the Adriatic Sea. Marine PollutionBulletin 48, 321e326.
Ranville, M.A., Flegal, A.R., 2005. Silver in the North Pacific Ocean.Geochemistry, Geophysics, Geosystems. doi:10.1029/2004GC000770.
Ratte, H.T., 1999. Bioaccumulation and toxicity of silvercompounds: a review. Environmental Toxicology andChemistry 18, 89e108.
Reinfelder, J.R., Chang, S.I., 1999. Speciation and microalgalbioavailability of inorganic silver. Environmental Science andTechnology 33, 1860e1863.
Richards, R.M.E., 1981. Antimicrobial action of silver-nitrate.Microbios 31, 83e91.
Rivera-Duarte, I., Flegal, A.R., 1997. Porewater silverconcentration gradients and benthic fluxes fromcontaminated sediments of San Francisco Bay, California, U.S.A. Marine Chemistry 56, 15e26.
Rivera-Duarte, I., Flegal, A.R., Sanudo-Wilhelmy, S.A., Veron, A.J.,1999. Silver in the far North Atlantic Ocean. Deep-SeaResearch II 46, 979e990.
Rydberg, L., 1975. Hydrographic observations in the Gullmar Fjordduring April 1973. Department of Oceanography, University ofGothenburg, Sweden. Report 10.
Sanudo-Wilhelmy, S.A., Flegal, A.R., 1992. Anthropogenic silver inthe southern California Bight. Environmental Science andTechnology 26, 2147e2151.
Sanudo-Wilhelmy, S.A., Gill, G.A., 1999. Impact of the CleanWater Act on the levels of toxic metals in urban estuaries: theHudson River Estuary revisited. Environmental Science andTechnology 30, 3477e3481.
Shafer, M.M., Overdier, J.T., Armstong, D.E., 1998. Removal,partitioning, and fate of silver and other metals in wastewatertreatment plants and effluent-receiving stream.Environmental Toxicology and Chemistry 17, 630e641.
Smith, G.J., Flegal, A.R., 1993. Silver in San Francisco Bay estuarinewaters. Estuaries 16, 547e558.
Squire, S., Scelfo, G.M., Revenaugh, J., Flegal, A.R., 2002. Decadaltrends of silver and lead contamination in San Francisco Baysurface waters. Environmental Science and Technology 36,2379e2386.
Stephenson, M.D., Leonard, G.H., 1994. Evidence for the decline ofsilver and lead and the increase of copper from 1977 to 1990 inthe coastal marine waters of California. Marine PollutionBulletin 28, 148e153.
Stumm,W., Morgan, J.J., 1996. Aquatic Chemistry, third ed. Wiley-Interscience, New York.
Sunda, W.G., 1993. Factors and mechanisms regulating theuptake and effects of metals in aquatic organisms. In: Marineand Estuarine Geochemistry. Proceedings of the FirstInternational Conference on Transport, Fate, and
wat e r r e s e a r c h 4 4 ( 2 0 1 0 ) 4 2 0 4e4 2 1 64216
Effects of Silver in the Environment. Lewis Publishers Inc.,Michigan.
Taylor, S.R., McLennan, S.M., 1985. The Continental Crust: ItsComposition and Evolution. Blackwell Scientific Publications,Oxford, 312 pp.
Tang, D., Santschi, P.H., 2000. Sensitive determination ofdissolved sulfide in estuarine water by solid-phase extractionand high-performance liquid chromatography of methyleneblue. Journal of Chromatography A 883, 305e309.
Turner, D.R., Whitfield, M., Dickson, A.G., 1981. The equilibriumspeciation of dissolved components in freshwater andseawater at 25�C and 1 atm pressure. Geochimica etCosmochimica Acta 45, 855e881.
Uncles, R.J., Barton, M.L., Stephens, J.A., 1994. Seasonal variabilityof fine-sediment concentrations in the turbidity maximumregion of the Tamar Estuary. Estuarine, Coastal and ShelfScience 38, 19e39.
Uncles, R.J., Stephens, J.A., Smith, R.E., 2002. The dependence ofestuarine turbidity on tidal intrusion length and residencetime. Continental Shelf Research 22, 1835e1856.
UNEP Freshwater in Europe, 2004. United Nations EnvironmentProgramme/DEWAeEurope.
Varela, M., Prego, R., 2003. Hydrography and phytoplankton in anisolated and non-pristine ria area: the A Coruna Harbour (NWSpain). Acta Oecologica 24, 113e124.
Wen, L.-S., Santschi, P.H., Gill, G.A., Paternostro, C.L., Lehman, R.D.,1997. Colloidal and particulate silver in river and estuarinewaters of Texas. Environmental Science and Technology 31,723e731.
Wen, L.-S., Santschi, P.H., Gill, G.A., Tang, D.G., 2002. Silverconcentrations in Colorado, USA, watersheds using improvedmethodology. Environmental Toxicology and Chemistry 21,2040e2051.
Yang, L., Sturgeon, R.E.J., 2002. On-line determination of silver insea-water and marine sediment by inductively coupledplasma-mass spectrometry. Journal of Analytical AtomicSpectrometry 17, 88e93.
Zhang, Y., Obata, H., Gamo, T., 2008. Silver in Tokyo Bay estuarinewaters and Japanese rivers. Journal of Oceanography 64,259e265.