dissolution trapping of carbon dioxide in reservoir
TRANSCRIPT
10
Dissolution Trapping of Carbon Dioxide in Reservoir Formation
Brine – A Carbon Storage Mechanism
Stefan Iglauer Curtin University, Department of Petroleum Engineering, ARRC Building,
Australia
1. Introduction
Carbon Capture and Storage (CCS) is a method to reduce anthropogenic greenhouse gas emissions thereby mitigating global warming. In CCS, carbon dioxide (CO2) is captured from fossil fuel-fired power plants or other large point-source emitters, purified, compressed and injected deep underground into subsurface formations at depths of or greater than 800m. At such depths CO2 is in a supercritical (sc) state increasing storage capacity (IPCC 2005). In CCS, there are four main mechanisms which keep the buoyant CO2 underground: 1. Structural/stratigraphic trapping – here an impermeable caprock prevents the CO2
from flowing upwards, 2. Capillary trapping, where micrometer-sized disconnected CO2 bubbles are formed and
held in place by local capillary forces in the rock pore-network, 3. Dissolution trapping, where CO2 dissolves in the formation brine and sinks in the
reservoir as the CO2-enriched brine has an increased density, 4. Mineral trapping, where the dissolved CO2 reacts with the formation brine, forms
carbonic acid which dissociates generating protons, 3HCO− and 23CO − ions; these
species subsequently react with the formation brine and/or host rock to form solid minerals which trap the CO2 very safely.
The focus of this text is on dissolution trapping; how much CO2 dissolves under which geothermal conditions and what happens to the CO2-enriched brine, which is slightly denser than the original formation brine, in the formation. Important open questions in this context are: How fast are these mass transfer processes in real geological porous media under realistic CCS conditions? Are there means of accelerating CO2 dissolution? How do separate gas and/or oil phases (oil and/or gas reservoirs) in the reservoir affect CO2 dissolution processes and reservoir fluid dynamics? How does the pressure drop due to CO2 dissolution affect injectivity and storage capacity of CO2?
2. Geological background of dissolution trapping
The International Panel on Climate Change (IPCC) (2005) has suggested several possible geological storage media, including deep saline aquifers, oil or gas reservoirs and unmineable
www.intechopen.com
Mass Transfer - Advanced Aspects
234
coal seams. In case of CO2 storage in coal, a benefit is that additional methane is produced which is adsorbed on the coal surface and displaced by CO2 (so-called enhanced coal-bed methane (ECBM) production). However, CO2 injection leads to the highly detrimental effect of coal swelling which strongly deteriorates injectivity as observed from laboratory and pilot field studies (Reeves and Oudinot, 2005). This text focuses on aquifers and oil/gas reservoirs and will not discuss ECBM any further as low permeability and swelling characteristics limit the scale of exploitation of coalbeds as potential CO2 storage sinks. In terms of CO2 storage, deep saline aquifers – too saline for drinking water or agricultural usage – are most promising, because they are geographically widespread and have large potential storage capacities. Published storage capacity estimates especially for aquifers vary widely based on the assumptions made. This is an active area of research with the objective to provide accurate basic information so that effective CCS schemes can be planned in order to store the large quantities of anthopogenic CO2 emitted (circa 30 Gt CO2/a, IPCC 2007). To focus on dissolution trapping, the topic of this chapter, the main problem associated with it is addressed straight away: it is the slow speed of CO2 dissolution and the two-phase (CO2 and brine) reservoir flow dynamics – as long as the CO2 is in a separate supercritical state it tends to flow upwards because of buoyancy forces, and it can potentially leak to the surface. Mass transfer of CO2 from the supercritical phase into the aqueous phase is the time-determining step in dissolution trapping which therefore also determines leakage risk. In fact CO2 is only stored safely once it is dissolved in the aqueous phase (or precipitated as a solid). Hence the study of CO2 dissolution is an essential aspect of CCS risk assessment. Mass transfer and solubilities of CO2 into brine are functions of pressure, temperature, salinity, local CO2 concentration and subsequent chemical reactions (formation and dissociation of carbonic acid and following rock dissolution/precipitation). Moreover interfacial areas scCO2-brine play a vital role in the mass transfer kinetics, and they are closely related to the two-phase flow dynamics in the reservoir. All these aspects will be discussed in this chapter. In addition several reservoir scale computer simulations will be presented which analyze fluid flow and CO2 storage in CCS schemes. In this context it is worth noting that CO2 is a naturally abundant species in the subsurface. Rumble et al. (1982) suggested two possible chemical reactions between calcite and quartz which formed this naturally occuring CO2 over geological times. A result of this is that CO2 content in oil or gas reservoirs can be very high. In gas reservoirs CO2 content can reach concentrations larger than 90 mol% and in oil reservoirs CO2 content can be as high as 70-80 mol% (Badessich et al. 2005). As an example Ballentine et al. (2001) state that the CO2 concentration in gas fields in Texas varies from 3% to 97% depending on the geographical location. In summary dissolution trapping is a feasible mechanism to store large quantities of CO2, and if a route could be found to quickly dissolve scCO2 into brine CO2 emissions could be dramatically, rapidly and economically reduced this way, maybe even solving the climate change problem caused by CO2 gas emitted from large point-sources. However, although CO2 contributes the largest chunk to greenhouse gas emissions, other gases such as CH4, CO, N2O, halogenated carbons, etc., also need to be eliminated to completely stop global warming. One route for disposing these gases may also be dissolution into formation brines.
3. Reservoir fluid dynamics
In actual ongoing CCS projects large quantities of CO2 are injected deep underground. The largest injection time for a pure CCS project has been achieved in Norway in the Sleipner
www.intechopen.com
Dissolution Trapping of Carbon Dioxide in Reservoir Formation Brine – A Carbon Storage Mechanism
235
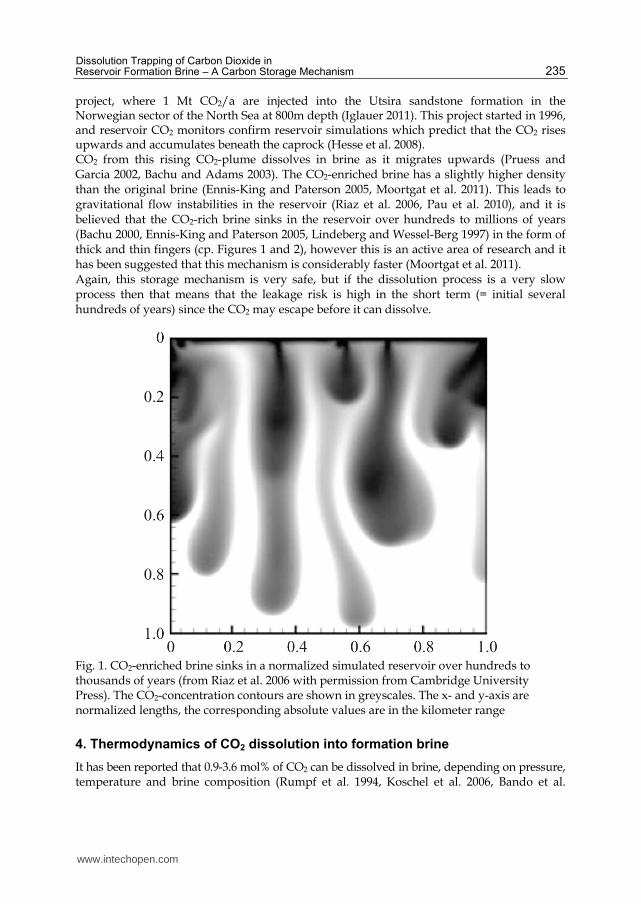
project, where 1 Mt CO2/a are injected into the Utsira sandstone formation in the Norwegian sector of the North Sea at 800m depth (Iglauer 2011). This project started in 1996, and reservoir CO2 monitors confirm reservoir simulations which predict that the CO2 rises upwards and accumulates beneath the caprock (Hesse et al. 2008). CO2 from this rising CO2-plume dissolves in brine as it migrates upwards (Pruess and Garcia 2002, Bachu and Adams 2003). The CO2-enriched brine has a slightly higher density than the original brine (Ennis-King and Paterson 2005, Moortgat et al. 2011). This leads to gravitational flow instabilities in the reservoir (Riaz et al. 2006, Pau et al. 2010), and it is believed that the CO2-rich brine sinks in the reservoir over hundreds to millions of years (Bachu 2000, Ennis-King and Paterson 2005, Lindeberg and Wessel-Berg 1997) in the form of thick and thin fingers (cp. Figures 1 and 2), however this is an active area of research and it has been suggested that this mechanism is considerably faster (Moortgat et al. 2011). Again, this storage mechanism is very safe, but if the dissolution process is a very slow process then that means that the leakage risk is high in the short term (= initial several hundreds of years) since the CO2 may escape before it can dissolve.
Fig. 1. CO2-enriched brine sinks in a normalized simulated reservoir over hundreds to thousands of years (from Riaz et al. 2006 with permission from Cambridge University Press). The CO2-concentration contours are shown in greyscales. The x- and y-axis are normalized lengths, the corresponding absolute values are in the kilometer range
4. Thermodynamics of CO2 dissolution into formation brine
It has been reported that 0.9-3.6 mol% of CO2 can be dissolved in brine, depending on pressure, temperature and brine composition (Rumpf et al. 1994, Koschel et al. 2006, Bando et al.
www.intechopen.com

Mass Transfer - Advanced Aspects
236
Fig. 2. The advance of the fastest finger front is shown for different permeabilities (represented by different lines) (from Riaz et al. 2006 with permission from Cambridge University Press)
2003, Kiepe et al. 2002). Before analyzing these relationships in more depth, it should be pointed out that CO2 and brine are a reactive system, CO2 reacts with water to form carbonic acid which subsequently dissociates (scheme 1) through a proton-relay mechanism that is catalyzed by several water molecules (Adamczyk et al. 2009) lowering the pH value of the brine.
CO2(sc) + 3H2O t CO2(aq) + 3H2O (a)
H2O + CO2(aq) t H2CO3 (b)
H2CO3 t 3HCO− + H+ (c)
3HCO− t 23CO − + H+ (d)
Scheme 1. Formation and dissociation of carbonic acid. Reaction scheme (a) assumes that scCO2 is dissolved in an analogous way to gaseous CO2 (Adamczyk et al. 2009)
Adamczyk et al. (2009) studied these reactions at atmospheric pressure and found that the slowest step in scheme 1 is the forward reaction of (b), the hydration of CO2(aq) resulting in
www.intechopen.com
Dissolution Trapping of Carbon Dioxide in Reservoir Formation Brine – A Carbon Storage Mechanism
237
H2CO3. The dehydration of H2CO3 is also relatively slow, with a dehydration rate constant of kde = 18 s-1 (Pocker and Bjorkquist 1977). The deprotonation rate in scheme (c) is koff = 710 s-1 (Pocker and Bjorkquist 1977) and the associated pKa value is 3.45. Note that this pKa value published by Adamczyk et al. (2009) is considerably different from the normally assumed pKa = 6.35 for the CO2(aq)/H2O system at atmospheric pressure conditions. The protonation rate of scheme (c) then results in kon = koff/Ka. The K value at 50.66 MPa for the reaction in scheme (d) is 5.13 x 1110− (Hirai et al. 1997) In addition, one consequence of an increase in CO2 solubility with increasing pressure (or decreasing temperature or salinity) is that the aqueous phase increasingly acidifies because more CO2 is present in the aqueous phase and reaction (b) is shifted to the right side according to Le-Chatelier’s principle. It can therefore be expected that the pKa value of scheme (c) drops further at increased CO2 pressure. In laboratory measurements pH values between 3.2-3.6 were observed within a temperature range between 300-343 K, a pressure range between 4-11 MPa and a salinity range 1-4 M NaCl solutions (Schaeff and McGrail 2004). In siliclastic and carbonate gas fields however pH values between 5-5.8 have been observed (Gilfillan et al. 2009); the discrepancy between lab and field data is most likely caused by complex geochemical buffering reactions, e.g. with carbonate host rock or carbonate based cements. The increased proton concentration in the brine has significant implications for geochemical reactions (Stumm and Morgan 1996, Gauss 2010) generally leading to more rock dissolution and higher dissolution rates. When the pH value has increased again to sufficiently high levels CO2 can be trapped as a solid phase – so-called mineral trapping (IPCC 2005, Gauss 2010). This could in principle also be engineered in the future although the physical and chemical phenomena associated with this process are highly complex and coupled. Such reactions bring a range of problems and advantages with them: • It is possible that too much rock is dissolved and high permeability channels are
formed; this is especially a problem in carbonates (Egermann et al. 2005, Luquot and Gouze 2009). Injected CO2 will preferentially flow through such channels, which are also termed “wormholes”. This reduces reservoir sweep efficiency which again decreases capillary trapping as only low initial CO2 saturations are achieved. Low initial CO2 saturations however result in low residual CO2 saturations (Pentland 2010 and 2011a,b; Al-Mansoori et al. 2010; Iglauer 2009). In addition such high permeability flow paths increase the risk of CO2 leakage, especially if caprock material is affected.
• Should so much host rock be dissolved that the mechanical rock integrity is affected, then this can result in wellbore instability or even landmass subsidence.
• In case of precipitation of solid minerals due to geochemical reactions (when the pH value has increased again) rock permeability can be significantly reduced, e.g. by blockage of small pore throats (which determine the permeability value). This can result in serious injectivity problems, e.g. injection rates may have to be reduced dramatically which may render CCS schemes ineffective.
• Rock dissolution increases permeability and enhances injectivity rendering CCS schemes more economical.
• Precipitation of CO2 in solid minerals (after chemical reactions) is the safest form of CO2 storage in CCS as the CO2 cannot escape to the surface anymore. This trapping mechanism is believed to take between thousands to billions of years (IPCC 2005, Xu et al. 2003).
www.intechopen.com
Mass Transfer - Advanced Aspects
238
In light of the new results published by Adamczyk et al. (2009) it is important to note that carbonic acid has a considerable acidity as it acts like a carboxylic acid on nanosecond timescales; this may have significant implications for geochemical reactions, rock surface alterations and associated possible rock wettability changes. Rock wettability strongly influences multi-phase fluid dynamics and capillary trapping. On an important side issue these chemical reactions also happen in the oceans when CO2 gas in the atmosphere dissolves in seawater thereby reducing its pH value. With the increasing CO2 concentration in the atmosphere (from 190 ppm in 1750 to 380 ppm in 2005, IPCC 2005) more carbonic acid is formed in the oceans and the seawater pH value decreases with possible massive effects on sea life, starting with the sensitive but all important sea plankton. Therefore disposing anthropogenic CO2 by dissolving it into the ocean seems to be a risky enterprise, as the pH value would drop further and locally reach substantially lower numbers.
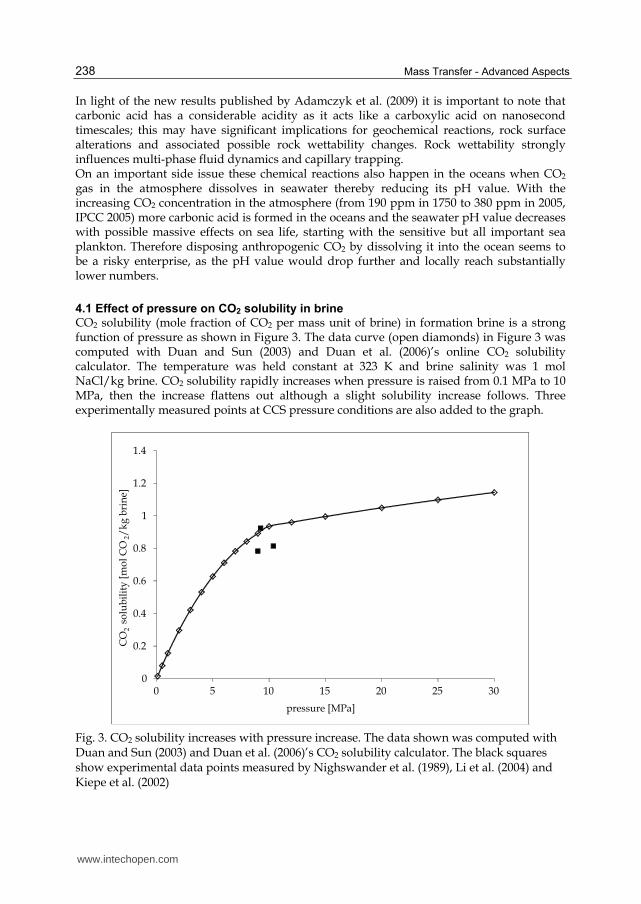
4.1 Effect of pressure on CO2 solubility in brine CO2 solubility (mole fraction of CO2 per mass unit of brine) in formation brine is a strong function of pressure as shown in Figure 3. The data curve (open diamonds) in Figure 3 was computed with Duan and Sun (2003) and Duan et al. (2006)’s online CO2 solubility calculator. The temperature was held constant at 323 K and brine salinity was 1 mol NaCl/kg brine. CO2 solubility rapidly increases when pressure is raised from 0.1 MPa to 10 MPa, then the increase flattens out although a slight solubility increase follows. Three experimentally measured points at CCS pressure conditions are also added to the graph.
0
0.2
0.4
0.6
0.8
1
1.2
1.4
0 5 10 15 20 25 30
CO
2so
lub
ilit
y [
mo
l C
O2/
kg
bri
ne]
pressure [MPa]
Fig. 3. CO2 solubility increases with pressure increase. The data shown was computed with Duan and Sun (2003) and Duan et al. (2006)’s CO2 solubility calculator. The black squares show experimental data points measured by Nighswander et al. (1989), Li et al. (2004) and Kiepe et al. (2002)
www.intechopen.com
Dissolution Trapping of Carbon Dioxide in Reservoir Formation Brine – A Carbon Storage Mechanism
239
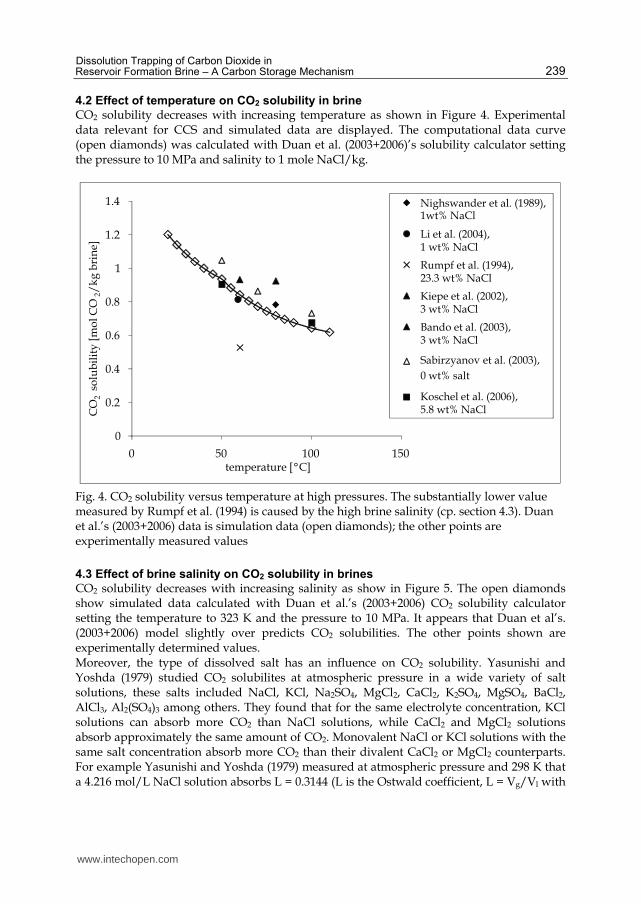
4.2 Effect of temperature on CO2 solubility in brine CO2 solubility decreases with increasing temperature as shown in Figure 4. Experimental data relevant for CCS and simulated data are displayed. The computational data curve (open diamonds) was calculated with Duan et al. (2003+2006)’s solubility calculator setting the pressure to 10 MPa and salinity to 1 mole NaCl/kg.
0
0.2
0.4
0.6
0.8
1
1.2
1.4
0 50 100 150
CO
2so
lub
ilit
y [
mo
l C
O2/
kg
bri
ne]
temperature [°C]
Nighswander et al. (1989), 1wt% NaCl
Li et al. (2004), 1 wt% NaCl
Rumpf et al. (1994), 23.3 wt% NaCl
Kiepe et al. (2002), 3 wt% NaCl
Bando et al. (2003), 3 wt% NaCl
Sabirzyanov et al. (2003),
0 wt% salt
Koschel et al. (2006), 5.8 wt% NaCl
Fig. 4. CO2 solubility versus temperature at high pressures. The substantially lower value measured by Rumpf et al. (1994) is caused by the high brine salinity (cp. section 4.3). Duan et al.’s (2003+2006) data is simulation data (open diamonds); the other points are experimentally measured values
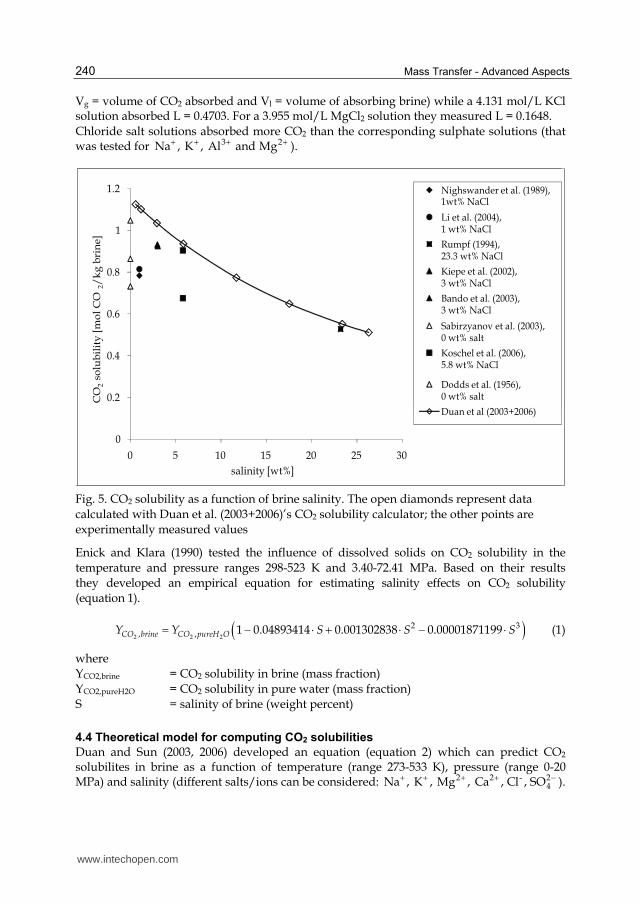
4.3 Effect of brine salinity on CO2 solubility in brines CO2 solubility decreases with increasing salinity as show in Figure 5. The open diamonds show simulated data calculated with Duan et al.’s (2003+2006) CO2 solubility calculator setting the temperature to 323 K and the pressure to 10 MPa. It appears that Duan et al’s. (2003+2006) model slightly over predicts CO2 solubilities. The other points shown are experimentally determined values. Moreover, the type of dissolved salt has an influence on CO2 solubility. Yasunishi and Yoshda (1979) studied CO2 solubilites at atmospheric pressure in a wide variety of salt solutions, these salts included NaCl, KCl, Na2SO4, MgCl2, CaCl2, K2SO4, MgSO4, BaCl2, AlCl3, Al2(SO4)3 among others. They found that for the same electrolyte concentration, KCl solutions can absorb more CO2 than NaCl solutions, while CaCl2 and MgCl2 solutions absorb approximately the same amount of CO2. Monovalent NaCl or KCl solutions with the same salt concentration absorb more CO2 than their divalent CaCl2 or MgCl2 counterparts. For example Yasunishi and Yoshda (1979) measured at atmospheric pressure and 298 K that a 4.216 mol/L NaCl solution absorbs L = 0.3144 (L is the Ostwald coefficient, L = Vg/Vl with
www.intechopen.com
Mass Transfer - Advanced Aspects
240
Vg = volume of CO2 absorbed and Vl = volume of absorbing brine) while a 4.131 mol/L KCl solution absorbed L = 0.4703. For a 3.955 mol/L MgCl2 solution they measured L = 0.1648. Chloride salt solutions absorbed more CO2 than the corresponding sulphate solutions (that was tested for 3 2Na , K , Al and Mg+ + + + ).
0
0.2
0.4
0.6
0.8
1
1.2
0 5 10 15 20 25 30
CO
2so
lub
ilit
y [
mo
l C
O2/
kg
bri
ne]
salinity [wt%]
Nighswander et al. (1989), 1wt% NaCl
Li et al. (2004), 1 wt% NaCl
Rumpf (1994), 23.3 wt% NaCl
Kiepe et al. (2002), 3 wt% NaCl
Bando et al. (2003), 3 wt% NaCl
Sabirzyanov et al. (2003), 0 wt% salt
Koschel et al. (2006), 5.8 wt% NaCl
Dodds et al. (1956), 0 wt% salt
Duan et al (2003+2006)
Fig. 5. CO2 solubility as a function of brine salinity. The open diamonds represent data calculated with Duan et al. (2003+2006)’s CO2 solubility calculator; the other points are experimentally measured values
Enick and Klara (1990) tested the influence of dissolved solids on CO2 solubility in the temperature and pressure ranges 298-523 K and 3.40-72.41 MPa. Based on their results they developed an empirical equation for estimating salinity effects on CO2 solubility (equation 1).
( )2 2 2
2 3, , 1 0.04893414 0.001302838 0.00001871199CO brine CO pureH OY Y S S S= − ⋅ + ⋅ − ⋅ (1)
where YCO2,brine = CO2 solubility in brine (mass fraction) YCO2,pureH2O = CO2 solubility in pure water (mass fraction) S = salinity of brine (weight percent)
4.4 Theoretical model for computing CO2 solubilities Duan and Sun (2003, 2006) developed an equation (equation 2) which can predict CO2 solubilites in brine as a function of temperature (range 273-533 K), pressure (range 0-20 MPa) and salinity (different salts/ions can be considered: 2 2 - 2
4Na , K , Mg , Ca , Cl , SO+ + + + − ).
www.intechopen.com

Dissolution Trapping of Carbon Dioxide in Reservoir Formation Brine – A Carbon Storage Mechanism
241
( )( )2 2 2 2
2
2 4
(0)ln ln /
2 2 2
0.07
lCO CO CO CO
CO Na Na K Ca Mg
CO Na Cl Cl Na K Mg Ca SO
m y F p RT
m m m m
m m m m m m
μλ
ζ−
− −
= −− + + +− + + + +
(2)
Here T is the temperature, p the pressure, R is the universal gas constant, m is the molality of components dissolved in water, yCO2 is the mole fraction of CO2 in the vapour phase, FCO2
is the fugacity coefficient of CO2, 2
(0)lCOμ is the standard chemical potential of CO2 in the
liquid phase, ┣CO2-Na is the interaction parameter between CO2 and Na+ and ┞CO2-Na-Cl is the interaction parameter between CO2 and Na+ , -Cl . The fugacity FCO2 can be calculated via a fifth-order virial equation of state (equation 3). The coefficients ci are stored in a look-up table (Duan et al. 2006) and they vary with the pressure and temperature regime.
[ ] [ ]
[ ] [ ]2
21 2 3 4 5 6 7 8
29 10 11 12 13 14 15
/ /( 150) /
/ ln / /
COF c c c T c T c T p c c T c T p
c c T c T p c c T p c T c T
= + + + + − + + ++ + + + + + + (3)
For the pressure and temperature regime most relevant to CCS, i.e. for a pressure below 100 MPa and a temperature range 273-340 K, the coefficients are inserted and shown in equation (3b).
2
7
7 9 2
6 2
0.71734882 0.00015985379 4.9286471 10
2.7855285 10 1.1877015 10
96.539512 0.44774938 /
101.81078 / 5.3783879 10
COF T p
T p
T p
T T
−− −
−
⎡ ⎤= − + − ⋅⎣ ⎦⎡ ⎤+ − ⋅ + ⋅⎣ ⎦⎡ ⎤+ − + ⋅⎣ ⎦
+ + ⋅
(3b)
The mole fraction of CO2 in the vapour phase yCO2 can be computed with equation (4)
( )2 2/CO H Oy p p p= − (4)
where pH2O is the water vapour pressure which can be estimated with the empirical equation (5) (Duan and Sun 2003).
2
1.9 2
3 4
1 38.640844( ) 5.8948420 59.876516
26.654627 10.637097 c
H Oc
t t tp Tp
T t t
⎡ ⎤− − + ⋅ + ⋅⎛ ⎞= ⎢ ⎥⎜ ⎟ + ⋅ + ⋅⎢ ⎥⎝ ⎠ ⎣ ⎦ (5)
where t = (T-Tc)/Tc and Tc and pc are the critical temperature and critical pressure of water (Tc = 647.29 K, pc = 22.085 MPa).
The parameters 2
(0)lCOμ , ┣CO2-Na and ┞CO2-Na-Cl are estimated with equation (6) and Table 1
(Duan and Sun 2003).
( ) 21 2 3 4 5 6 7
2 28 9 10 11
, / /(630 ) ln
/ /(630 ) /(630 ) ln
Par T p a a T a T a T a T a p a p T
a p T a p T a p T a T p
= + ⋅ + + ⋅ + − + ⋅ + ⋅ ⋅+ ⋅ + ⋅ − + ⋅ − + ⋅ ⋅ (6)
www.intechopen.com

Mass Transfer - Advanced Aspects
242
T-p coefficient 2
(0)μ lCO
RT λCO2-Na ζCO2-Na-Cl
a1 28.9447706 -0.411370585 3.36389723E-4 a2 -0.0354581768 6.07632013E-4 -1.98298980E-5 a3 -4770.67077 97.5347708 a4 1.02782768E-5 a5 33.8126098 a6 9.04037140E-3 a7 -1.14934031E-3 a8 -0.307405726 -0.0237622469 2.12220830E-3 a9 -0.0907301486 0.0170656236 -5.24873303E-3 a10 9.32713393E-4 a11 1.41335834E-5
Table 1. CO2 solubility interactions parameters (Duan et al. 2003, 2006)
4.5 Effect of injection depth on CO2 solubilities In a deep saline aquifer or oil reservoir high pressures and elevated temperatures are found. The pore pressure at depth is usually assumed to be equal to the hydrostatic pressure; a typical hydrostatic pressure gradient is 10.35 MPa/1000m (Dake 2007). In addition a geothermal gradient exists, the reservoir temperature increases with depth. Average typical geothermal gradients are 25-30 K/1000 m (Fridleifsson et al. 2008). Average temperatures and pressures at depth are listed in Table 2, they were calculated assuming typical pressure and temperature gradients and a surface temperature of 293 K. The surface temperature needs to be adjusted for each specific geographical location, e.g. average temperature is low in Norway (average temperature throughout the year is around 281 K) while average yearly temperature is high in Saudi Arabia (298 K). As stated above CO2 solubility decreases with increase in temperature, but increases with increase in pressure. In Table 2 CO2 solubilities calculated with Duan’s web based CO2-solubility calculator (Duan et al. 2003, 2006) are shown. The pressure effect over compensates the temperature effect so that CO2 solubility increases with reservoir depth up to a depth of approximately 900m when it reaches a plateau. With regard to storage of CO2 in a supercritical phase optimal CCS conditions are conditions where the CO2 density ┩CO2 is maximal, because then a maximum mass of CO2 can be stored in the same rock pore space. Thermodynamically ┩CO2 increases with pressure but decreases with temperature. ┩CO2 as a function of depth increases monotonically as the pressure effect also over compensates the temperature effect (Table 2).
4.6 Effect of presence of oil (CCS in oil reservoirs) CO2 can also be injected into depleted oil reservoirs although storage capacities are much smaller than in aquifers (IPCC 2005). It is estimated that 50 Gt of CO2 can be stored in this way worldwide (Firoozabadi and Cheng 2010) which is roughly 1.5 times of what is emitted per year. So this is clearly not the solution to mitigate global warming, however CO2 solubility in oil is very high, up to 60-80 mol% of CO2 can be dissolved (De Ruiter et al. 1994, Kokal and Sayegh 1993, Emera and Sarma 2006, Firoozabadi and Cheng 2010). CO2 solubility generally increases with pressure and it is higher at lower temperatures. If the temperature is below the critical CO2 temperature (Tc = 304.13 K), then CO2 solubility increases until the CO2 liquefaction pressure is reached (circa 5.88 MPa), then it levels off
www.intechopen.com

Dissolution Trapping of Carbon Dioxide in Reservoir Formation Brine – A Carbon Storage Mechanism
243
with further pressure increase. CO2 solubility also depends on oil composition and for light oils CO2 can be completely miscible. For example De Ruiters et al. (1994) measured a strong increase of CO2 solubility with pressure in two crude oils, at low pressures (0.69 MPa) the gas-oil ratio (GOR) was approximately 5.3 m3/m3, and GOR increased rapidly up to the CO2 liquefaction pressure when it reached 71 m3/m3 and 102 m3/m3, respectively. With a further pressure increase GOR stayed approximately constant. The experimental temperature in De Ruiters et al. experiments was low (290 K). If the temperature is above Tc as expected for CCS conditions, then CO2 solubility monotonically increases; but it is nominally lower as compared to lower temperatures (Kokal and Sayegh 1993).
Depth [m]
Temperature [K]
Pressure [MPa]
ρCO2
[kg/m3]*
CO2 solubility [mol/kg]**
0 293 0.1 1.8 0.0307 100 296 1.135 21.8 0.3036 200 299 2.17 43.7 0.5037 300 302 3.205 68.3 0.6496 400 305 4.24 96.5 0.7542 500 308 5.275 130 0.8274 600 311 6.31 171.7 0.8769 700 314 7.345 221.8 0.9082 800 317 8.38 311.8 0.9260 900 320 9.415 391.9 0.9338
1000 323 10.45 412.8 0.9353 1100 326 11.485 449.6 0.9344 1200 329 12.52 486.3 0.9334 1300 332 13.555 522.7 0.9330 1400 335 14.59 561.3 0.9335 1500 338 15.625 576.1 0.9348
* estimated from Span and Wagner (1996). ** 1 mol/kg NaCl brine, calculated with Duan et al.’s (2003, 2006) calculator.
Table 2. Variation of temperature, pressure, CO2 solubility and CO2 density with depth
In case of heavy oils CO2 dissolves into the oil phase while some light oil fractions are extracted into the CO2 phase. Depending on the oil and thermophysical condition, vapour-liquid, liquid-liquid, liquid-supercritical fluid, liquid-liquid-vapour phase behaviours are observed. The densities of CO2-saturated oil increase at lower temperature (294 K) while they decrease at higher temperature (e.g. 413 K) (Kokal and Sayegh 1993). This makes CO2 a very efficient solvent for crude oil extraction in tertiary oil recovery processes (Green and Willhite 1998, Blunt et al. 1993). The dissolved CO2 reduces oil viscosity significantly which improves the mobility ratio oil-injected fluid (for improving production) and results in a much better reservoir sweep efficiency. The flow of oil in the reservoir is improved by the improved oil relative permeability, which leads to increased oil production. In addition, CO2 which dissolves into the oil causes oil swelling (up to 50-60%, Firoozabadi and Cheng 2010) which also leads to enhanced oil production. One side effect of CO2 addition to crude oil is that large asphaltene molecules precipitate (crude oil is a very complex fluid (cp. Table 3) with a multitude of components including such large asphaltene
www.intechopen.com
Mass Transfer - Advanced Aspects
244
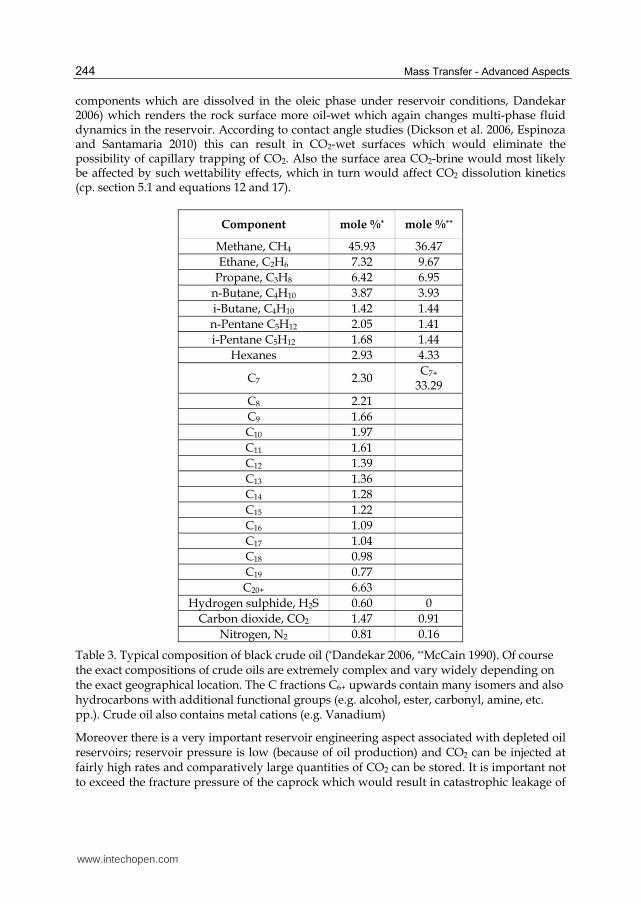
components which are dissolved in the oleic phase under reservoir conditions, Dandekar 2006) which renders the rock surface more oil-wet which again changes multi-phase fluid dynamics in the reservoir. According to contact angle studies (Dickson et al. 2006, Espinoza and Santamaria 2010) this can result in CO2-wet surfaces which would eliminate the possibility of capillary trapping of CO2. Also the surface area CO2-brine would most likely be affected by such wettability effects, which in turn would affect CO2 dissolution kinetics (cp. section 5.1 and equations 12 and 17).
Component mole %* mole %**
Methane, CH4 45.93 36.47 Ethane, C2H6 7.32 9.67
Propane, C3H8 6.42 6.95 n-Butane, C4H10 3.87 3.93 i-Butane, C4H10 1.42 1.44 n-Pentane C5H12 2.05 1.41 i-Pentane C5H12 1.68 1.44
Hexanes 2.93 4.33
C7 2.30 C7+
33.29 C8 2.21 C9 1.66 C10 1.97 C11 1.61 C12 1.39 C13 1.36 C14 1.28 C15 1.22 C16 1.09 C17 1.04 C18 0.98 C19 0.77 C20+ 6.63
Hydrogen sulphide, H2S 0.60 0 Carbon dioxide, CO2 1.47 0.91
Nitrogen, N2 0.81 0.16
Table 3. Typical composition of black crude oil (*Dandekar 2006, **McCain 1990). Of course the exact compositions of crude oils are extremely complex and vary widely depending on the exact geographical location. The C fractions C6+ upwards contain many isomers and also hydrocarbons with additional functional groups (e.g. alcohol, ester, carbonyl, amine, etc. pp.). Crude oil also contains metal cations (e.g. Vanadium)
Moreover there is a very important reservoir engineering aspect associated with depleted oil reservoirs; reservoir pressure is low (because of oil production) and CO2 can be injected at fairly high rates and comparatively large quantities of CO2 can be stored. It is important not to exceed the fracture pressure of the caprock which would result in catastrophic leakage of
www.intechopen.com
Dissolution Trapping of Carbon Dioxide in Reservoir Formation Brine – A Carbon Storage Mechanism
245
CO2. Exceeding the capillary entry pressure of CO2 into the caprock should also be avoided (then CO2 will also flow through the caprock although very slowly because of the very low permeability of the caprock shale) resulting in potential CO2 leakage to the surface. Estimates suggest that many millions of tons of crude oil are produced yearly via enhanced oil recovery with CO2 (CO2-EOR) (Firoozabadi and Cheng (2010)). Crude oil production could be further increased if more CO2 would be used but such CO2-EOR schemes should have a CO2 storage element. In principle oil would be a very good storage medium for CO2 (provided that the oil does not migrate upwards after CO2-takeup, so ideally the process would be designed in such a way that oil density increases), but of course oil is an economically valuable commodity and will be produced, so oil production schemes need to be combined with CCS schemes and optimized, essentially as much oil as possible needs to be recovered while storing as much CO2 as possible. Reservoir simulations can calculate such CO2-EOR recovery/injection schemes over several years (Qi et al. 2008, Firoozabadi 2011), one complication here is the three-phase flow and the associated complex fluid thermodynamics occurring in the reservoir. This includes mass transfer of CO2 into the oil and aqueous phases. In summary, most of the current CCS schemes which are online are actually EOR processes because of profitability. Example projects are the Weyburn-Midale project in Canada, which started in the year 2000. 1.8 Mt/a of CO2 are injected into a depth of 1500m into a depleted oil reservoir (PTRC 2011, Pentland 2011). 225 m3 of CO2 produce 0.12 m3 extra crude oil there. Another CO2-EOR project is underway in the Salt Creek field in Wyoming, USA; here 2.09 Mt of CO2 are injected yearly and more than 1.2 x 610 m3 of incremental crude oil have been recovered so far and it is planned to store 50 Mt of CO2 in total (Andarko 2010, Pentland 2011).
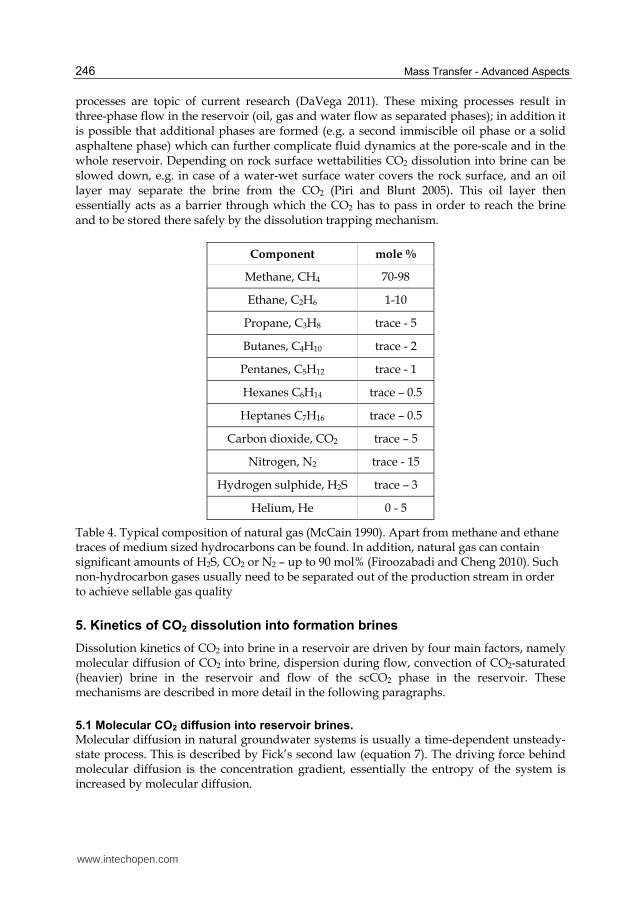
4.7 Effect of presence of gas (gas reservoirs or oil reservoirs with a gas cap) CO2 can also be injected into depleted gas reservoirs in order to produce additional gas, this is called enhanced gas recovery (EGR). The injected CO2 increases reservoir pressure which supports gas production. As in the case of oil reservoirs or indeed aquifers the caprock failure stress must not be exceeded. Natural gas is a mixture of various components (cp. Table 4); the exact composition varies with the location of the gas fields and it is determined by the original hydrocarbon generation (Dandekar 2006). In the reservoir, the CO2 flood front mixes with the natural gas by dispersion and diffusion. In parallel to the CO2 – gas mixing process, CO2 also equilibrates with the formation brine, similar to the mixing processes occurring in deep saline aquifers. The main advantage of CO2-EGR is profitability as in CO2-EOR, and an optimum between additional gas production and CO2 sequestration needs to be found. There are several CO2-EGR pilot units where these processes are tested, e.g. in the Lacq demonstration project in southwest France,
510 t of CO2 will be injected and stored in a depleted gas field at a depth of 4500m (Total 2011). A thorough study of nine natural gas fields (including sandstone and carbonate reservoirs) concludes that the main trapping mechanism over millennial timescales is dissolution trapping. At most 18% of injected CO2 is stored as a solid mineral phase (Gilfillan et al. 2009) and mineral trapping is predicted to happen only for siliclastic reservoirs. In the case of oil reservoirs with a gas cap, the mixing thermodynamics are a combination of CO2-gas mixing, CO2 dissolution in oil and CO2 dissolution in brine. These complex
www.intechopen.com
Mass Transfer - Advanced Aspects
246
processes are topic of current research (DaVega 2011). These mixing processes result in three-phase flow in the reservoir (oil, gas and water flow as separated phases); in addition it is possible that additional phases are formed (e.g. a second immiscible oil phase or a solid asphaltene phase) which can further complicate fluid dynamics at the pore-scale and in the whole reservoir. Depending on rock surface wettabilities CO2 dissolution into brine can be slowed down, e.g. in case of a water-wet surface water covers the rock surface, and an oil layer may separate the brine from the CO2 (Piri and Blunt 2005). This oil layer then essentially acts as a barrier through which the CO2 has to pass in order to reach the brine and to be stored there safely by the dissolution trapping mechanism.
Component mole %
Methane, CH4 70-98
Ethane, C2H6 1-10
Propane, C3H8 trace - 5
Butanes, C4H10 trace - 2
Pentanes, C5H12 trace - 1
Hexanes C6H14 trace – 0.5
Heptanes C7H16 trace – 0.5
Carbon dioxide, CO2 trace – 5
Nitrogen, N2 trace - 15
Hydrogen sulphide, H2S trace – 3
Helium, He 0 - 5
Table 4. Typical composition of natural gas (McCain 1990). Apart from methane and ethane traces of medium sized hydrocarbons can be found. In addition, natural gas can contain significant amounts of H2S, CO2 or N2 – up to 90 mol% (Firoozabadi and Cheng 2010). Such non-hydrocarbon gases usually need to be separated out of the production stream in order to achieve sellable gas quality
5. Kinetics of CO2 dissolution into formation brines
Dissolution kinetics of CO2 into brine in a reservoir are driven by four main factors, namely molecular diffusion of CO2 into brine, dispersion during flow, convection of CO2-saturated (heavier) brine in the reservoir and flow of the scCO2 phase in the reservoir. These mechanisms are described in more detail in the following paragraphs.
5.1 Molecular CO2 diffusion into reservoir brines. Molecular diffusion in natural groundwater systems is usually a time-dependent unsteady-state process. This is described by Fick’s second law (equation 7). The driving force behind molecular diffusion is the concentration gradient, essentially the entropy of the system is increased by molecular diffusion.
www.intechopen.com
Dissolution Trapping of Carbon Dioxide in Reservoir Formation Brine – A Carbon Storage Mechanism
247
2
2
c cD
tz
∂ ∂= ∂∂ (7)
where D = diffusion coefficient c = concentration t = time z = depth A limited number of measurements of the CO2 diffusion coefficient in water DCO2-H2O at high pressure have been conducted. Renner (1988) measured DCO2-H2O for 0.25 N NaCl brine at 311 K for a pressure range 1.54-5.86 MPa and recorded DCO2-H2O values in the range 3.07-7.35 x 910− m2/s. More measurements at atmospheric pressure were conducted and DCO2-
H2O values between 1.8 x 910− – 8 x 910− m2/s (Mazarei and Sandall 1980, Unver and Himmelblau 1964) were reported. Based on these datasets, Renner (1988) developed an empirical-statistical expression (equation 8).
2 2 2 2
0.1584 6.9116391 CO H O CO H OD μ μ−− = (8)
where ┤CO2 = CO2 viscosity ┤H2O = H2O viscosity Renner’s analysis (1988) indicated that water viscosity and CO2 viscosity were highly correlated with the diffusion coefficient, but molecular weight of CO2, molar volume of CO2, pressure or temperature were not statistically significant. However Renner states in his paper and Renner’s data show that DCO2-H2O increases with an increase in pressure. Therefore it can be expected that CO2 diffusion processes under CCS conditions are faster than at atmospheric pressure conditions – which is positive news for dissolution trapping as it minimizes leakage risks by absorbing the mobile CO2 faster in the aqueous phase. Hirai et al. (1997) measured DCO2-H2O via laser-induced fluorescence at 286 K and 29.4 and 39.3 MPa (DCO2-H2O = 1.3 x 910− and 1.5 x 910− m2/s). Their results fit perfectly with the empirical equation (9) suggested by Wilke and Chang (1955). ι is an association parameter equal to 2.26 for water. The experimental data measured by Shimizu et al. (1995) (DCO2-H2O is approximately 1.8 x 910− m2/s at 286 K and 9-13 MPa) is however 40% larger than predicted by equation (9). Hirai’s data and the Wilke-Chang equation both indicate that DCO2-H2O
increases slightly with pressure.
( ) ( )2 2 2 2 2
0.58 0.67.4 10 /CO H O H O CO COD M T Vι μ−− = ⋅ (9)
More recently, Mutoru et al. (2010) developed a semi-empirical model for calculating diffusion coefficients for infinitely diluted CO2 and water mixtures (equation 10) based on 187 experimental data points. The subscript 1 denotes CO2 and the subscript 2 denotes water. However, in case of water diffusing into the CO2 phase, subscript 1 denotes water and subscript 2 CO2.
( )
( )2 3
2 2 54
1 12 12 ,2
2 2,2
k kr
CO H O kkr
k M TD
p c
εμ− = (10)
www.intechopen.com
Mass Transfer - Advanced Aspects
248
where
2 2
1
121 1
H O CO
MM M
−⎛ ⎞⎜ ⎟= +⎜ ⎟⎝ ⎠ (11)
M = molecular mass ┝1 = dipole moment ┝12 = ratio of dipole moments, ┝1/ ┝2
k1 = 7.2338910−
k2 = 0.135607 k3 = 1.84220 k4 = 2.41943 x 310−
k5 = 0.858204 Tr,2 = reduced temperature pr,2 = reduced pressure µ = viscosity c2 = solvent molar density (the solvent is defined here as the dominant component) The advantage of Mutoru et al.’s (2010) model is that it incorporates the temperature and pressure effects on the total dipole moment of water and the induced dipole moment of CO2. In addition, it can predict DCO2-H2O over the complete range from infinitely diluted CO2 to infinitely diluted H2O. From equation (10) it is clear that temperature has a stronger influence on DCO2-H2O than pressure. This is due to the strong dependence of the viscosity and the solvent molar density on the temperature. However, pressure influences are also strong as pressure determines equilibrium compositions (Mutoru et al. 2010). An interesting perspective on CO2 dissolution into brine is the consideration of the CO2 droplet diameter (Hirai et al. 1997). Especially in the context of residual trapping; here the rising CO2 plume is split into a large number of small disconnected CO2 clusters at the trailing edge of the plume due to natural water influx or chase brine injection (Iglauer et al. 2010). The drop diameter is expected to have a highly significant effect on CO2 dissolution speed. A strong enhancement of CO2 dissolution is expected for such small CO2 bubbles as their CO2-brine surface area is significantly increased compared with that of a single-cluster CO2 plume. The dissolution rate of CO2 can be described by equation (12) (Hirai et al. 1997).
( ) ( )2 0/COd V dt kA C Cρ ∞= − − (12)
where V = volume of the scCO2 droplet, A = surface area of the scCO2 droplet k = mass transfer coefficient C0 = surface concentration of the droplet C∞ = concentration at infinity The mass transfer coefficient k is expressed in equation (13) for high Schmidt (Sc) numbers
( )1 3 0.4721 1 /Re 0.752ReSh Sc= + + (13)
www.intechopen.com
Dissolution Trapping of Carbon Dioxide in Reservoir Formation Brine – A Carbon Storage Mechanism
249
where Sh = Sherwood number (=
2 2 2CO CO H O
k d D −⋅ )
Sc = Schmidt number (=2 2CO H O
Dν − )
Re = Reynolds number (=2COu d ν⋅ )
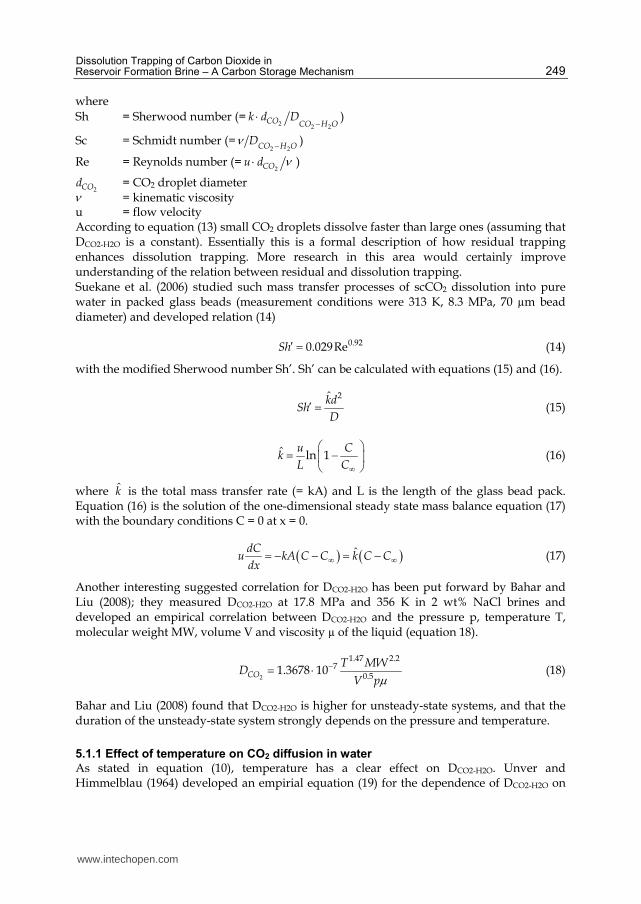
2COd = CO2 droplet diameter ν = kinematic viscosity u = flow velocity According to equation (13) small CO2 droplets dissolve faster than large ones (assuming that DCO2-H2O is a constant). Essentially this is a formal description of how residual trapping enhances dissolution trapping. More research in this area would certainly improve understanding of the relation between residual and dissolution trapping. Suekane et al. (2006) studied such mass transfer processes of scCO2 dissolution into pure water in packed glass beads (measurement conditions were 313 K, 8.3 MPa, 70 µm bead diameter) and developed relation (14)
0.920.029ReSh′ = (14)
with the modified Sherwood number Sh’. Sh’ can be calculated with equations (15) and (16).
2k̂d
ShD
′ = (15)
ˆ ln 1u C
kL C∞
⎛ ⎞= −⎜ ⎟⎝ ⎠ (16)
where k̂ is the total mass transfer rate (= kA) and L is the length of the glass bead pack. Equation (16) is the solution of the one-dimensional steady state mass balance equation (17) with the boundary conditions C = 0 at x = 0.
( ) ( )ˆdCu kA C C k C C
dx∞ ∞= − − = − (17)
Another interesting suggested correlation for DCO2-H2O has been put forward by Bahar and Liu (2008); they measured DCO2-H2O at 17.8 MPa and 356 K in 2 wt% NaCl brines and developed an empirical correlation between DCO2-H2O and the pressure p, temperature T, molecular weight MW, volume V and viscosity µ of the liquid (equation 18).
2
1.47 2.27
0.51.3678 10CO
T MWD
V pμ−= ⋅ (18)
Bahar and Liu (2008) found that DCO2-H2O is higher for unsteady-state systems, and that the duration of the unsteady-state system strongly depends on the pressure and temperature.
5.1.1 Effect of temperature on CO2 diffusion in water As stated in equation (10), temperature has a clear effect on DCO2-H2O. Unver and Himmelblau (1964) developed an empirial equation (19) for the dependence of DCO2-H2O on
www.intechopen.com

Mass Transfer - Advanced Aspects
250
temperature for atmospheric pressure within a temperature range between 279-338 K. D increases monotonically with temperature T (equation 19).
( )2 910D A BT CT −= + + ⋅ (19)
A = 0.95893, B = 0.024161, C = 0.00039813 are constants for CO2, A, B and C adopt different values for other gases. D is given in m2/s. Again, diffusion-dominated CO2 dissolution is more effective at higher temperatures.
5.1.2 Effect of pressure on CO2 diffusion in water According to measurements conducted by Wilke-Chang (1955), Shimizu et al. (1995) and Hirai et al. (1997) DCO2-H2O (approximately 1.5 x 910− m2/s) is quasi independent of pressure in the tested range of circa 9-40 MPa. Their measurements were all performed at 286 K. However, Renner’s (1988) measurements show that DCO2-H2O increases with pressure, this is supported by Mutora et al.’s (2010) analysis.
5.2 CO2 diffusion into oil Renner (1988) measured diffusion coefficients of CO2 in decane DCO2-C10 at a temperature of 311 K and in a pressure range 1.54-5.86 MPa. The results for DCO2-C10 ranged from 1.97-11.8 x
910− m2/s. An increase in pressure led to an increase in DCO2-C10 and measured diffusion coefficients in a vertical sandstone core were significantly higher than in a horizontal core; this might have been due to convective forces in the vertical core. Renner developed the empirical-statistical equation (20) for DCO2-HC estimates.
2 2 2 2
9 0.4562 0.6898 1.706 1.831 4.52410CO CO COCO HCD M V p Tμ− − − − −− = (20)
where VCO2 is the molar volume of CO2. Model equation (10) can also estimate the diffusion coefficients of CO2-hydrocarbon (HC) systems DCO2-HC; predictions can be made for small alkane molecules (e.g. methane, ethane, butane) and polar H2S.
5.3 Water diffusion into scCO2 phase Although not essential for CO2 storage, it is noted for completeness that water diffuses and dissolves into the scCO2 phase. Water solubility in scCO2 is low, it increases with pressure. For a pressure range from 8.31-20.54 MPa at 313 K water mole fractions between 0.00053-0.00596 were measured, for a pressure range between 2.51-10.20 MPa at 323 K the water mole fraction measured ranged between 0.00251-0.0120 (Sabirzyanov et al. 2002). Measured diffusion coefficients of water in CO2 DH2O-CO2 are reported to be much higher than diffusion coefficients of CO2 into water. Values between 1.5 x 810− to 1.8 x 910− m2/s were published for a pressure range between 7-20 MPa and a temperature of 298 K (Espinoza and Santamaria 2010). However the investigated temperature was lower than the expected temperature at CCS storage depths. The cited numbers could therefore be slightly different for actual CCS conditions. In addition, the semi-empirical model equation (10) can also estimate DH2O-CO2 diffusion coefficients.
www.intechopen.com
Dissolution Trapping of Carbon Dioxide in Reservoir Formation Brine – A Carbon Storage Mechanism
251
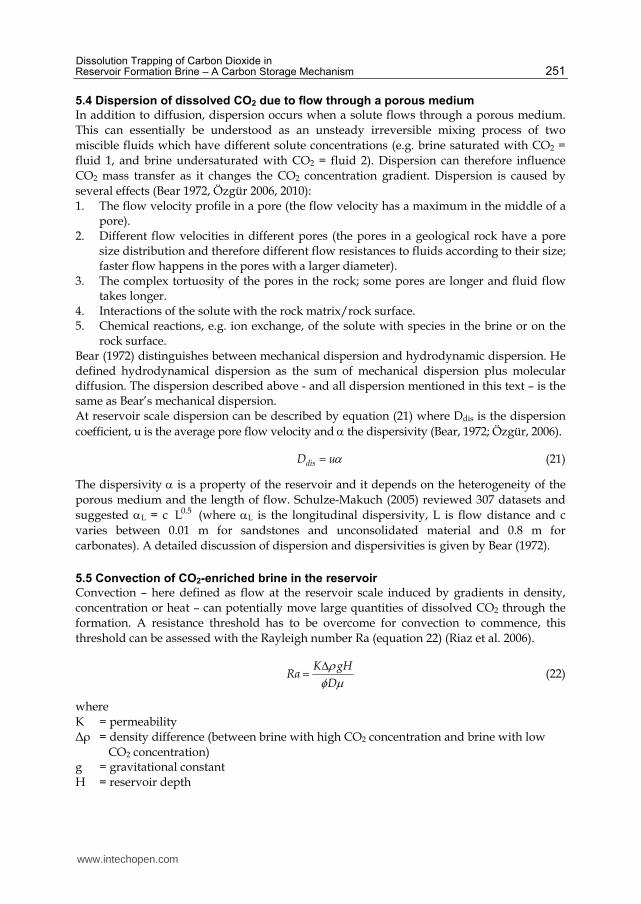
5.4 Dispersion of dissolved CO2 due to flow through a porous medium In addition to diffusion, dispersion occurs when a solute flows through a porous medium. This can essentially be understood as an unsteady irreversible mixing process of two miscible fluids which have different solute concentrations (e.g. brine saturated with CO2 = fluid 1, and brine undersaturated with CO2 = fluid 2). Dispersion can therefore influence CO2 mass transfer as it changes the CO2 concentration gradient. Dispersion is caused by several effects (Bear 1972, Özgür 2006, 2010): 1. The flow velocity profile in a pore (the flow velocity has a maximum in the middle of a
pore). 2. Different flow velocities in different pores (the pores in a geological rock have a pore
size distribution and therefore different flow resistances to fluids according to their size; faster flow happens in the pores with a larger diameter).
3. The complex tortuosity of the pores in the rock; some pores are longer and fluid flow takes longer.
4. Interactions of the solute with the rock matrix/rock surface. 5. Chemical reactions, e.g. ion exchange, of the solute with species in the brine or on the
rock surface. Bear (1972) distinguishes between mechanical dispersion and hydrodynamic dispersion. He defined hydrodynamical dispersion as the sum of mechanical dispersion plus molecular diffusion. The dispersion described above - and all dispersion mentioned in this text – is the same as Bear’s mechanical dispersion. At reservoir scale dispersion can be described by equation (21) where Ddis is the dispersion coefficient, u is the average pore flow velocity and α the dispersivity (Bear, 1972; Özgür, 2006).
disD uα= (21)
The dispersivity α is a property of the reservoir and it depends on the heterogeneity of the porous medium and the length of flow. Schulze-Makuch (2005) reviewed 307 datasets and suggested αL = c 0.5L (where αL is the longitudinal dispersivity, L is flow distance and c varies between 0.01 m for sandstones and unconsolidated material and 0.8 m for carbonates). A detailed discussion of dispersion and dispersivities is given by Bear (1972).
5.5 Convection of CO2-enriched brine in the reservoir Convection – here defined as flow at the reservoir scale induced by gradients in density, concentration or heat – can potentially move large quantities of dissolved CO2 through the formation. A resistance threshold has to be overcome for convection to commence, this threshold can be assessed with the Rayleigh number Ra (equation 22) (Riaz et al. 2006).
K gH
RaD
ρφ μΔ= (22)
where K = permeability Δ┩ = density difference (between brine with high CO2 concentration and brine with low CO2 concentration) g = gravitational constant H = reservoir depth
www.intechopen.com

Mass Transfer - Advanced Aspects
252
D = diffusion coefficient µ = brine viscosity φ = porosity Above a critical Rayleigh number Rac convection will occur; Rac is a function of the boundary conditions of the system (Weatherill et al. 2004), e.g. for a homogenous reservoir where the horizontal boundaries are impermeable and perfect heat conductors Rac = 4┨2 (Lindeberg and Wessel-Berg 1997). One mechanism which can trigger convective flow is dissolution of CO2 into brine, which can increase brine density by 1% under CCS conditions (Ennis-King and Paterson 2005). Based on an expression suggested by Garcia (2001) Özgür (2006) developed an equation (23) with which the effect of aqueous CO2 concentration on brine density can be estimated.
2
2
,,1 1
brineCO brine
m brineCO brine
VY
M
ρρρ
= ⎛ ⎞− −⎜ ⎟⎝ ⎠ (23)
where ┩CO2,brine = density of CO2-enriched brine ┩brine = original brine density YCO2 = dissolved CO2 mass fraction Vm,brine = apparent molar volume of CO2 in brine M = molecular weight of CO2
6. Reservoir scale dissolution trapping
In the context of reservoir flow where dissolved CO2 molecules are transported, convection, dispersion, diffusion and maximum CO2 solubilities can all play a significant role. This is an active field of research, and three literature examples are presented where CO2 solute transport was modelled at reservoir scale. Interesting conclusions extracted from these computations are that dissolution trapping is favourably done in a high permeability reservoir. Moreover CO2 dissolution can significantly reduce reservoir pressure (the pressure is increased by CO2 injection, but only a maximum reservoir pressure is tolerable, the fracture pressure), improving injectivity, i.e. CO2 can be injected at a faster rate, and more CO2 can be stored in total – provided that CO2 dissolves at an adequate rate or CO2 injection is slow enough.
6.1 Özgür model (2006) Özgür (2006, 2010) modelled diffusion and convection in an aquifer with the diffusion-
convection equation (24). 2
2
cD
z
∂∂ is the diffusion term and
u c
zφ∂∂ is the convection term.
2
2
c u c cD
z tz φ∂ ∂ ∂− =∂ ∂∂ (24)
This model considers one-dimensional vertical flow in an aquifer, temperature and CO2 gas cap pressure are assumed to be constant; chemical reactions are ignored and the porous
www.intechopen.com
Dissolution Trapping of Carbon Dioxide in Reservoir Formation Brine – A Carbon Storage Mechanism
253
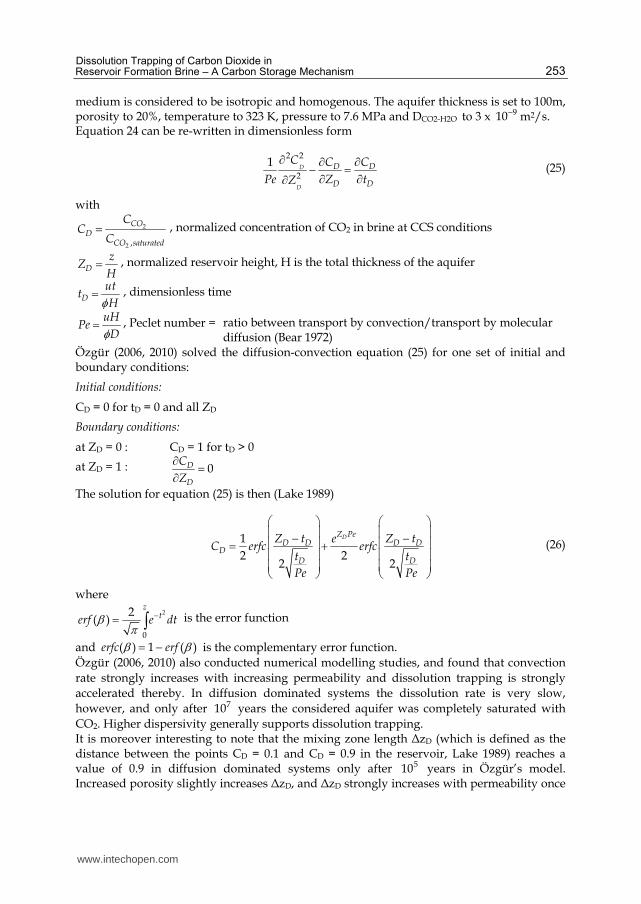
medium is considered to be isotropic and homogenous. The aquifer thickness is set to 100m, porosity to 20%, temperature to 323 K, pressure to 7.6 MPa and DCO2-H2O to 3 x 910− m2/s. Equation 24 can be re-written in dimensionless form
2 2
2
1D
D
D D
D D
C C C
Pe Z tZ
∂ ∂ ∂− =∂ ∂∂ (25)
with
2
2 ,
COD
CO saturated
CC
C= , normalized concentration of CO2 in brine at CCS conditions
D
zZ
H= , normalized reservoir height, H is the total thickness of the aquifer
D
utt
Hφ= , dimensionless time
uHPe
Dφ= , Peclet number = ratio between transport by convection/transport by molecular diffusion (Bear 1972)
Özgür (2006, 2010) solved the diffusion-convection equation (25) for one set of initial and boundary conditions:
Initial conditions:
CD = 0 for tD = 0 and all ZD
Boundary conditions:
at ZD = 0 : CD = 1 for tD > 0
at ZD = 1 : 0D
D
C
Z
∂ =∂
The solution for equation (25) is then (Lake 1989)
1
2 22 2
DZ PeD D D D
DD D
Z t e Z tC erfc erfc
t t
Pe Pe
⎛ ⎞ ⎛ ⎞⎜ ⎟ ⎜ ⎟− −⎜ ⎟ ⎜ ⎟= +⎜ ⎟ ⎜ ⎟⎜ ⎟ ⎜ ⎟⎝ ⎠ ⎝ ⎠ (26)
where 2
0
2( )
zterf e dtβ π −= ∫ is the error function
and ( ) 1 ( )erfc erfβ β= − is the complementary error function. Özgür (2006, 2010) also conducted numerical modelling studies, and found that convection rate strongly increases with increasing permeability and dissolution trapping is strongly accelerated thereby. In diffusion dominated systems the dissolution rate is very slow, however, and only after 710 years the considered aquifer was completely saturated with CO2. Higher dispersivity generally supports dissolution trapping. It is moreover interesting to note that the mixing zone length ΔzD (which is defined as the distance between the points CD = 0.1 and CD = 0.9 in the reservoir, Lake 1989) reaches a value of 0.9 in diffusion dominated systems only after 510 years in Özgür’s model. Increased porosity slightly increases ΔzD, and ΔzD strongly increases with permeability once
www.intechopen.com
Mass Transfer - Advanced Aspects
254
a threshold (when convection sets in) is reached. In convection dominated systems, porosity decreases ΔzD, while dispersivity slightly increases ΔzD.
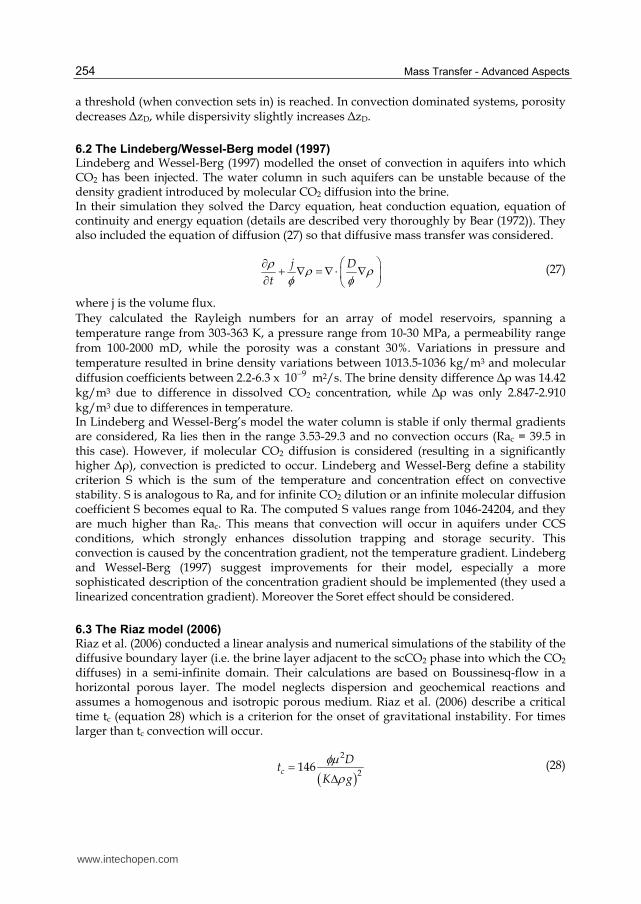
6.2 The Lindeberg/Wessel-Berg model (1997) Lindeberg and Wessel-Berg (1997) modelled the onset of convection in aquifers into which CO2 has been injected. The water column in such aquifers can be unstable because of the density gradient introduced by molecular CO2 diffusion into the brine. In their simulation they solved the Darcy equation, heat conduction equation, equation of continuity and energy equation (details are described very thoroughly by Bear (1972)). They also included the equation of diffusion (27) so that diffusive mass transfer was considered.
j D
t
ρ ρ ρφ φ⎛ ⎞∂ + ∇ = ∇ ⋅ ∇⎜ ⎟∂ ⎝ ⎠ (27)
where j is the volume flux. They calculated the Rayleigh numbers for an array of model reservoirs, spanning a temperature range from 303-363 K, a pressure range from 10-30 MPa, a permeability range from 100-2000 mD, while the porosity was a constant 30%. Variations in pressure and temperature resulted in brine density variations between 1013.5-1036 kg/m3 and molecular diffusion coefficients between 2.2-6.3 x 910− m2/s. The brine density difference Δ┩ was 14.42 kg/m3 due to difference in dissolved CO2 concentration, while Δ┩ was only 2.847-2.910 kg/m3 due to differences in temperature. In Lindeberg and Wessel-Berg’s model the water column is stable if only thermal gradients are considered, Ra lies then in the range 3.53-29.3 and no convection occurs (Rac = 39.5 in this case). However, if molecular CO2 diffusion is considered (resulting in a significantly higher Δ┩), convection is predicted to occur. Lindeberg and Wessel-Berg define a stability criterion S which is the sum of the temperature and concentration effect on convective stability. S is analogous to Ra, and for infinite CO2 dilution or an infinite molecular diffusion coefficient S becomes equal to Ra. The computed S values range from 1046-24204, and they are much higher than Rac. This means that convection will occur in aquifers under CCS conditions, which strongly enhances dissolution trapping and storage security. This convection is caused by the concentration gradient, not the temperature gradient. Lindeberg and Wessel-Berg (1997) suggest improvements for their model, especially a more sophisticated description of the concentration gradient should be implemented (they used a linearized concentration gradient). Moreover the Soret effect should be considered.
6.3 The Riaz model (2006) Riaz et al. (2006) conducted a linear analysis and numerical simulations of the stability of the diffusive boundary layer (i.e. the brine layer adjacent to the scCO2 phase into which the CO2 diffuses) in a semi-infinite domain. Their calculations are based on Boussinesq-flow in a horizontal porous layer. The model neglects dispersion and geochemical reactions and assumes a homogenous and isotropic porous medium. Riaz et al. (2006) describe a critical time tc (equation 28) which is a criterion for the onset of gravitational instability. For times larger than tc convection will occur.
( )2
2146c
Dt
K g
φμρ= Δ (28)
www.intechopen.com

Dissolution Trapping of Carbon Dioxide in Reservoir Formation Brine – A Carbon Storage Mechanism
255
tc influences the penetration depth of the diffusive boundary layer ├(t), which again influences Rac = Ra(├(t)). tc can vary over several magnitudes, mainly because permeability can span several magnitudes in a geological formation. For a permeability increase from 1 mD to 3 Darcy Riaz et al. (2006) calculated a tc decrease from 2000 years to below 10 days, and associated with that ├(t) changed from 55 m (for 1 mD permeability) to 0.07 m. The model also demonstrates that Ra has a strong influence on the finger-like flow in the reservoir, including finger thickness and shape. In terms of the numerical model they found that grid size plays an important role and a fine grid is required to resolve disturbances at small times. Correct identification of such early disturbances is necessary to obtain reliable results. One important conclusion they make is that dissolution trapping is strongly enhanced in high permeability reservoirs. They estimate that the onset of gravitational instabilities - essentially induced by molecular diffusion mass transfer processes – occurs after several hundreds of years for typical aquifers with average permeability. It should be noted that these estimates are quite rough because of the assumptions made.
6.4 Summary of reservoir models There are other reservoir models described in the literature, e.g. Ennis-King and Paterson (2005) conclude that anisotropy of the reservoir has a strong effect on dissolution trapping, but this is beyond the scope of this book chapter and the reader is encouraged to check current research; this is an active area of research. The simulation results are very important for CCS assessments and project planning, but it must be emphasized that more experimental research should be conducted, in the laboratory and especially at field scale to evaluate the quality of the model predictions. In addition, it is important to stress the approximative character of these models, real field situations are much more complex, e.g. it is not clear whether Fick’s law can describe diffusion in the field or whether very heterogeneous pore structures (for instance in carbonate reservoirs) enhance convection or slow it down.
7. Multiphase flow in the reservoir – flow of the scCO2 phase
The flow of the scCO2 phase affects the dissolution process as it determines interfacial areas and overall position of the CO2 in the reservoir. Reservoir models predict that the injected CO2 phase rises upwards and is stopped by the caprock (Qi et al. 2009, Juanes 2006, Hesse 2008). This behaviour has been confirmed experimentally in the Sleipner formation by seismic imaging (Iglauer 2011). Small residual CO2 clusters at the trailing edge of the rising CO2 plume - trapped by capillary forces (Iglauer et al. 2010, Juanes et al. 2006) - strongly increase CO2-brine interfacial areas. Hence CO2 dissolution speed is predicted to be accelerated, especially if combined with convective flow of saturated/undersaturated brine. However experimental reservoir monitoring data is needed to confirm these predictions. Optimal conditions would be to bring undersaturated brine continuously into contact with residual micrometer-sized CO2 bubbles while removing saturated or highly CO2-enriched brine simultaneously. Engineering this dissolution phenomenon can be a promising topic for future research. Moreover, and most likely even more significant in the short term - thereby strongly affecting the economics of CCS schemes are the fluid dynamics associated with CO2 injection. CO2 injectivity and CO2-wellbore effects can strongly impact CCS schemes. For
www.intechopen.com

Mass Transfer - Advanced Aspects
256
example, flow in the reservoir is strongly influenced by changes in rock morphology and wettability, which can result in changes of relative permeabilites and capillary pressures of CO2 and brine. Relative permeability and capillary pressures however strongly influence multi-phase fluid flow in the reservoir. As an example, there is evidence that wettability (Espinoza and Santamaria 2010, Chiquet et al. 2007) and rock pore morphology – especially carbonates (Luquot and Gouze 2009) are changed by scCO2. More research work is required in this area to completely understand these changes and improve CCS risk assessment.
8. Conclusions
In summary it is clear that dissolution trapping is a potential solution for storing large quantities of anthropogenic CO2 thereby reducing carbon emissions. More research is required, especially field testing with integrated monitoring to check how the CO2 behaves under realistic injection and reservoir conditions in the medium-to-long term. The major advantages of dissolution trapping are that very substantial amounts of CO2 can be stored very safely. The risk is that CO2 dissolves too slowly so that a significant part of CO2 is still in a mobile separate supercritical phase (separated from the brine phase) which is buoyant and could escape to the surface. There are however two other CCS mechanisms, structural and residual trapping which prevent or at least reduce the CO2 leakage risk. It must also be guaranteed that no drinkable-water aquifers are contaminated with CO2 or any harmful species mobilized by CO2 injection (e.g. dissolution of heavy metal ions by the acidic brine generated), which may then be transported into drinking water reservoirs.
9. Acknowledgements
I would like to thank Prof. Martin Blunt, Prof. Tetsuya Suekane, Dr. Amer Syed and Prof. Abbas Firoozabadi for reviewing this book chapter and helpful comments. Many thanks go to Prof. Zhenhao Duan for supplying the CO2 solubility calculator software.
10. Nomenclature
CCS carbon capture and storage (of carbon dioxide) CO2 carbon dioxide
3HCO− hydrogen carbonate anion 23CO − carbonate anion
H+ proton HC hydrocarbon a year Gt Gigatons = 910 tons φ porosity [-] K permeability [m2] M molar mass [g/mol] ┤ viscosity [Pa.s] ┩CO2 CO2 density [kg/m3] GOR gas-oil ratio [m3/m3] H domain depth; reservoir height [m] D diffusion coefficient [m2/s]
www.intechopen.com
Dissolution Trapping of Carbon Dioxide in Reservoir Formation Brine – A Carbon Storage Mechanism
257
DCO2-H2O diffusion coefficient of CO2 into brine [m2/s] DH2O-CO2 diffusion coefficient of H2O into scCO2 [m2/s] DCO2-HC diffusion coefficient of CO2 into hydrocarbon [m2/s] DCO2-C10 diffusion coefficient of CO2 into n-decane [m2/s] p pressure [Pa] T temperature [K] µ viscosity [Pa.s] µCO2 viscosity of CO2 [Pa.s] µH2O viscosity of water [Pa.s] ┩ density [kg/m3] ┩brine density of brine [kg/m3] ┩CO2,brine density of CO2-enriched brine [kg/m3] Δ┩ density difference [kg/m3] g gravitational constant [m/s2] y molality [mol/kg] R universal gas constant [J/mol.K]
2
1(0)COμ standard chemical potential of CO2 [J/mol]
F fugacity coefficient [-] ┞CO2-Na-Cl interaction parameter between CO2 and Na+ and -Cl
┣CO2-Na interaction parameter between CO2 and Na+
H reservoir height [m] ZD normalized reservoir height [-] Vm,brine apparent molar volume of CO2 in brine [m3/mol] VCO2 molar volume of CO2 [m3/mol]
YCO2 dissolved CO2 mass fraction [-] tD dimensionless time [-] t time [s] u interstitial or pore flow velocity [m/s] Ra Rayleigh number [-] Re Reynolds number [-] Sh Sherwood number [-] Sc Schmidt number [-] z depth [m] α dispersivity [m] αL longitudinal dispersivity [m] Ddis dispersion coefficient [m2/s] C0 surface concentration of droplet [mol/L] C∞ concentration at infinity [mol/L] A surface area of CO2 droplet [m2] k mass transfer coefficient [m/s] j volumetric flux [m/s]
11. References
Adamczyk, K., Premont-Schwarz, M., Pines, D., Pines, E., Nibbering, E.T.J. (2009). Real-time observation of carbonic acid formation in aqueous solution”, Science, 326, 1690- 1694.
www.intechopen.com
Mass Transfer - Advanced Aspects
258
Andarko (2010). Wyoming Fact Sheet. Al-Mansoori, S.K., Itsekiri, E., Iglauer, S., Pentland, C.H., Bijeljic, B., Blunt, M.J. (2010).
Measurements of non-wetting phase trapping applied to carbon dioxide storage, International Journal of Greenhouse Gas Control, 4, 283-288.
Bachu, S. (2000). Sequestration of CO2 in geological media: criteria and approach for site selection in response to climate change, Energy Conversion and Management, 41,953- 970.
Bachu, S., Adams, J.J. (2003). Sequestration of CO2 in geological media in response to climate change: capacity of deep saline aquifers to sequester CO2 in solution, Energy Conversion and Management, 44, 3151-3175.
Badessich, M.F., Gait, M., Carbone, C., Dzelalija, F., Giampaoli, P. (2005). Integrated reservoir characterization for the redevelopment of a highly complex field, SPE 93797, Proceedings of the SPE Europec/EAGE Annual Conference, Madrid, Spain, 13-16 June.
Bahar, M., Liu, K. (2008). Measurement of the diffusion coefficient of CO2 in formation water under reservoir conditions: implications for CO2 storage, SPE 116513, Proceedings of the SPE Asia Pacific Oil & Gas Conference and Exhibition, Perth, Australia, 20-22 October.
Ballentine, C.J., Schoell, M., Coleman, D., Cain, B.A. (2001). 300-Myr-old magmatic CO2 in natural gas reservoirs of the west Texas Permian basin, Nature, 409, 327-331.
Bando, S., Takemura, F., Nishio, M., Hihara, E., Akai, M. (2003). Solubility of CO2 in aqueous solutions of NaCl at (30 to 60) ºC and (10 to 20) MPa, Journal of Chemical & Engineering Data, 48, 576-579.
Bear, J. (1972). Dynamics of fluids in porous media, New York: Dover Publications. Blunt, M.J., Fayers, F.J., Orr, F.M. (1993) Carbon dioxide in enhanced oil recovery Energy
Conversion and Management, 34, 9-11, 1197- 1204. Chiquet, P., Broseta, D., Thibeau, S. (2007). Wettability alteration of caprock minerals by
carbon dioxide, Geofluids, 7, 112-122. Dake, L.P. (2007). Fundamentals of reservoir engineering, Elsevier: Amsterdam. Dandekar, A.Y. (2006). Petroleum reservoir rock and fluid properties, Boca Raton: Taylor &
Francis. Vega Maza, D. (2011). Private communication. De Ruiter, R.A., Nash, L.J., Singletary, M.S. (1994). Solubility and displacement behavior of a
viscous crude with CO2 and hydrocarbon gas, SPE Reservoir Engineering, 101-106. Dickson, J.L., Gupta, G., Horozov, T.S., Binks, B.P., Johnston, K.P. (2006). Wetting
phenomena at the CO2/water/glass interface, Langmuir, 22, 2161-2170. Duan, Z., Sun, R. (2003). An improved model calculating CO2 solubility in pure water and
aqueous NaCl solutions from 273 to 533 K and from 0 to 2000 bar, Chemical Geology, 193, 257-271.
Duan, Z., Sun, R., Zhu, C., Chou, I.-M. (2006). An improved model for the calculation of CO2 solubilites in aqueous solutions containing 2 2 - 2
4Na , K , Ca , Mg , Cl and SO+ + + + − , Marine Chemistry, 98, 131-139.
Egermann, P., Bazin, B., Vizika, O. (2005). An experimental investigation of reaction- transport phenomena during CO2 injection, SPE 93674, Proceedings of the 14th Middle East Oil & Gas Show, Bahrain.
www.intechopen.com
Dissolution Trapping of Carbon Dioxide in Reservoir Formation Brine – A Carbon Storage Mechanism
259
Enick, R.M., Klara, S.M. (1990). CO2 solubility in water and brine under reservoir conditions, Chem. Eng. Comm., 90, 23-22.
Ennis-King J., Paterson, L. (2005). Role of convective mixing in the long-term storage of carbon dioxide in deep saline formations, SPE Journal, 10, 3, 349-356.
Espinoza, D.N., Santamarina, J.C. (2010). Water-CO2-mineral systems: interfacial tension, contact angle, and diffusion-implications to CO2 geological storage, Water Resources Research, 46, W07537.
Firoozabadi, A., Cheng, P. (2010). Prospects for subsurface CO2 sequestration, AIChE Journal, 56, 6, 1398-1405.
Fridleifsson, I.B., Bertani, R., Huenges, E., Lund, J.W., Ragnarsson, A., Rybach, L. (2008). The possible role and contribution of geothermal energy to the mitigation of climate change. In: O. Hohmeyer and T. Trittin (Eds.) IPCC Scoping Meeting on Renewable Energy Sources, Luebeck, Germany.
Garcia, J. E. (2001). Density of aqueous solutions of CO2, Report LBNL-49023, Lawrence Berkeley National Laboratory, CA.
Gaus, I. (2010). Role and impact of CO2-rock interactions during CO2 storage in sedimentary rocks, International Journal of Greenhouse Gas Control, 4, 73-89.
Gilfillan, S.M.V., Sherwood Lollar, B., Holland, G., Blagburn, D., Stevens, S., Schoell, M., Cassidy, M., Ding, Z., Zhou, Z., Lacrampe-Couloume, G., Ballentine, C.J. (2009). Solubility trapping in formation water as dominant CO2 sink in natural gas fields, Nature, 458, 2, 614-618.
Green, D.W., Willhite, G.P. (1998). Enhanced oil recovery, Richardson: SPE Publications. Hesse, M.A., Orr, F.M., Tchelepi, H.A. (2008). Gravity currents with residual trapping,
Journal of Fluid Mechanics, 611, 35-60. Hirai, S., Okazaki, K., Yazawa, H., Ito, H., Tabe, Y., Hijikata, K. (1997). Measurement of CO2
diffusion coefficient and application of LIF in pressurized water, Energy, 22, 2-3, 363-367.
Iglauer, S. (2011). Carbon capture and storage with a focus on capillary trapping as a mechanism to store carbon dioxide in geological porous media, in Advances in Multiphase Flow and Heat Transfer, volume 3, chapter 4, 177-197 (eds. L. Cheng and D. Mewes) [in press]
Iglauer, S., Favretto, S, Spinelli, G., Schena, G., Blunt, M.J. (2010). X-ray tomography measurements of power-law cluster size distributions for the nonwetting phase in sandstones, Physical Review E, 82, 056315.
Iglauer, S., Wülling, W., Pentland, C.H., Al Mansoori, S.K., Blunt, M.J. (2009). Capillary trapping capacity of rocks and sandpacks. SPE 120960, Proceedings of the SPE EUROPEC/EAGE Annual Conference and Exhibition, Amsterdam, The Netherlands.
Intergovernmental Panel on Climate Change (IPCC), (2005). IPCC Special Report on Carbon Dioxide Capture and Storage. Prepared by Working Group III of the Intergovernmental
Panel on Climate Change, Cambridge University Press. Intergovernmental Panel on Climate Change (IPCC) (2007). Climate Change 2007: The Physical
Science Basis. Working Group I Contribution to the Fourth Assessment Report of the
Intergovernmental Panel on Climate Change, Cambridge University Press. Juanes, R., Spiteri, E.J., Orr, F.M., Blunt, M.J. (2006). Impact of relative permeability
hysteresis on geological CO2 storage, Water Resources Research, 42, W12418.
www.intechopen.com

Mass Transfer - Advanced Aspects
260
Kiepe, J., Horstmann, S., Fischer, K., Gmehling, J. (2002). Experimental determination and prediction of gas solubility data for CO2 + H2O mixtures containing NaCl or KCl at temperatures between 313 and 393 K and pressures up to 10 MPa, Industrial and
Engineering Chemistry Research, 41, 4393-4398. Kokal, S.L., Sayegh, S.G. (1993). Phase behavior and physical properties of CO2-saturated
heavy oil and its constitutive fractions: experimental data and correlations, Journal
of Petroleum Science and Engineering, 9, 289-302. Koschel, D., Coxam, J.-Y., Rodier, L., Majer, V. (2006). Enthalpy and solubility data of CO2 in
water and NaCl(aq) at conditions of interest for geological sequestration, Fluid
Phase Equilibria, 247, 107-120. Lake, L. W. (1989). Enhanced oil recovery, New Jersey: Prentice-Hall. Li, Z., Dong, M., Li, S., Dai, L. (2004). Densities and solubilities for binary systems of carbon
dioxide + water and carbon dioxide + brine at 59ºC and pressures to 29 MPa, J.
Chem. Eng. Data, 49, 4, 1026-1031. Li, Z., Firoozabadi, A. (2009). Cubic-plus-association equation of state for water- containing
mixtures: is cross association necessary?, AIChEJ, 55, 1803. Lindeberg, E., Wessel-Berg, D. (1997). Vertical convection in an aquifer column under a gas
cap of CO2, Energy Conversion Management, 38, 1, 229-234. Luquot, L., Gouze, P. (2009). Experimental determination of porosity and permeability
changes induced by injection of CO2 into carbonate rocks, Chemical Geology, 265, 148-159.
Mazarei, A.F., Sandall, O.C. (1980). Diffusion coefficients for helium, hydrogen and carbon dioxide in water at 25ºC, AIChE Journal, 26, 1, 154-157.
McCain, W.D. (1990). The properties of petroleum fluids, Tulsa: Penn Well Corporation. McCain, W.D. (1991). Reservoir fluid property correlations-state of the art, SPE Reservoir
Engineering, 6, 266-272. Moortgat, J., Sun, S., Firoozabadi, A. (2011). Compositional modeling of three-phase flow
with gravity using higher-order finite element methods, Water Resources Research, 47, W05511.
Mutoru, J.W., Leahy-Dios, A., Firoozabadi, A. (2011). Modeling infinite dilution and Fickian diffusion coefficients of carbon dioxide in water, AIChE Journal, 57, 6, 1617-1627.
Nighswander, J.A., Kalogerakis, N., Mehrotra, K. (1989). Solubilities of carbon dioxide in water and 1 wt% NaCl solution at pressures up to 10 MPa and temperatures from 80 to 200º C, J. Chem. Eng. Data, 34, 355-360.
Özgür, E. (2006). Assessment of diffusive and convective mechanisms during carbon dioxide
sequestration into deep saline aquifers, PhD thesis, Middle East Technical University, Ankara, Turkey.
Özgür, E., Gümrah, F. (2010). Analytical and numerical modeling of CO2 sequestration in deep saline aquifers. Energy Sources, Part A, 32, 674-687.
Pau, G.S.H., Bell, J.B., Pruess, K., Almgren, A.S., Lijewski, M.J., Zhang, K. (2010). High-resolution simulation and characterisation of density-driven flow in CO2 storage in saline aquifers, Advances in Water Resources, 33, 443-455.
Pentland, C.H., Itsekiri, E., Al-Mansoori, S.K., Iglauer, S., Bijeljic, B., Blunt, M.J. (2010). Measurements of nonwetting-phase trapping in sandpacks, SPE Journal, 38, 274-281.
www.intechopen.com
Dissolution Trapping of Carbon Dioxide in Reservoir Formation Brine – A Carbon Storage Mechanism
261
Pentland, C.H. (2011a). Measurements of non-wetting phase trapping in porous media, PhD thesis, Imperial College London, UK.
Pentland, C.H., El-Maghraby, R., Iglauer, S., Blunt, M.J. (2011b). Measurements of the capillary trapping of supercritical carbon dioxide in Berea sandstone, Geophysical Research Letters, 38, L06401.
Piri, M., Blunt, M.J. (2005). Three-dimensional mixed-wet random pore-scale network modeling of two- and three-phase flow in porous media. I. Model description, Physical Review E, 71, 026301.
Pocker, Y., Bjorkquist, D.W. (1977). Stopped-flow studies of carbon dioxide hydration and bicarbonate dehydration in H2O and D2O. Acid-base and metal ion catalysis, Journal of the Americal Chemical Society, 99, 20, 6537-6543.
Pruess, K., Garcia, J. (2002). Multiphase flow dynamics during CO2 disposal into saline aquifers, Environmental Geology, 42, 282-295.
PTRC, Petroleum Technology Research Center, 6 Research Drive Regina, SK, Canada [online]. Available:
http://www.ptrc.ca/weyburn_overview.php. [accessed: 22.3.2011]. Qi, R., LaForce, T.C., Blunt, M.J. (2009). Design of carbon dioxide storage in aquifers,
International Journal of Greenhouse Gas Control, 3, 195-205. Reeves, S., Oudinot, A. (2005). The Allison CO2 ECBM pilot: A reservoir and economic
analysis, Proceedings of the International Coalbed Methane Symposium, Tuscaloosa, USA, May 17-19, Paper 0522.
Rumble, D., Ferry, J.M., Hoering, T.C., Boucot, A.J. (1982). Fluid flow during metamorphism at the Beaver Brook fossil locality, New Hampshire, American Journal of Science, 282, 886-919.
Rumpf, B., Nicolaisen, H., Őcal, C., Maurer, G. (1994). Solubility of carbon dioxide in aqueous solutions and sodium chloride: experimental results and correlation, Journal of Solution Chemistry, 23, 3, 431-448.
Reamer, H.H., Sage, B.H. (1963). Phase equilibria in hydrocarbon systems. Volumetric and phase behavior of the n-decane-CO2 system, J. Chem. Eng. Data, 8, 508.
Renner, T.A. (1988). Measurement and correlation of diffusion coefficients for CO2 and rich-gas applications, SPE Reservoir Engineering, 3, 2, 517-523.
Riaz, A., Hesse, M., Tchelepi, H.A., Orr, F.M. (2006). Onset of convection in a gravitationally unstable diffusive boundary layer in porous media, Journal of Fluid Mechanics, 548, 87-111.
Sabirzyanov, A.N., Il’in, A.P., Akhunov, A.R., Gumerov, F.M. (2002). Solubility of water in supercritical carbon dioxide, High Temperature, 40, 2, 203-206.
Sabirzyanov, A.N., Shagiakhmetov, R.A., Gabitov, F.R., Tarzimanov, A.A., Gumerov, F.M. (2003). Water solubility of carbon dioxide under supercritical and subcritical conditions, Theoretical Foundations of Chemical Engineering, 37, 1, 51-53.
Schaeff, H.T., McGrail, B.P. (2004). Direct measurements of pH in H2O-CO2 brine mixtures to supercritical conditions, Proceedings of the 7th International Conference on Greenhouse Gas Control Technologies (GHGT-7), Vancouver, Canada.
Schulze-Makuch, D. (2005). Longitudinal dispersivity data and implications for scaling behavior, Groundwater, 43, 3, 443-456.
Shimizu, K., Kikkawa, N., Nagashima, A. (1995). Proceedings of the 4th Asian Thermophysical Properties Conference, 3, 771.
www.intechopen.com

Mass Transfer - Advanced Aspects
262
Span, R., Wagner, W. (1996). A new equation of state for carbon dioxide covering the fluid region from the triple-point temperature to 1100 K at pressures up to 800 MPa. Journal of Physical and Chemical Reference Data, 25, 6, 1509-1596.
Stumm, W., Morgan, J.J. (1996). Aquatic chemistry: chemical equilibria and rates in natural waters, New York: John Wiley and Sons.
Suekane, T., Mizumoto, A., Nobuso, T., Yamazaki, M., Tsushima, S., Hirai, S. (2006). Solubility and residual gas trapping of CO2 in geological storage, Proceedings of the 8th International Conference on Greenhouse Gas Control Technologies GHGT-8 (CD-ROM).
Tang, Y.P., Himmelblau, D.M. (1965). Effect of solute concentration on the diffusivity of carbon dioxide in water, Chemcial Engineering Sciences, 20, 7-14.
Total, [online], available: http://www.total.com/en/special-reports/capture-and- geological-storage-of-co2/capture-and-geological-storage-of-co2-the-lacq- demonstration-200969.html, [accessed: 22.3.2011].
Unver, A.A, Himmelblau, D.M. (1964). Diffusion coefficients of CO2, C2H4, C3H6, and C4H8 in water from 6°C to 65°C, Journal of Chemical and Engineering Data, 9, 3, 428-431.
Weatherill, D., Simmons, C. T., Voss, C. I., and Robinson, N. I. (2004). Testing density- dependent groundwater models: two-dimensional steady state unstable convection in infinite, finite and inclined porous layers, Advances in Water Resources, 27, 547-562.
Wilke, C.R., Chang, P. (1955). Correlation of diffusion coefficients in dilute solutions. Am. Inst. Chem. Eng. J., 1, 264-270.
Xu, T.F., Apps, J.A., Pruess, K. (2003). Reactive geochemical transport simulation to study mineral trapping for CO2 disposal in deep arenaceous formations”, Journal of Geophysical Research, 108, B2, 2071.
Yasunishi, A., Yoshida, F. (1979). Solubility of carbon dioxide in aqueous electrolyte solutions, J. Chem. Eng. Data, 24, 1, 11-14.
www.intechopen.com
Mass Transfer - Advanced AspectsEdited by Dr. Hironori Nakajima
ISBN 978-953-307-636-2Hard cover, 824 pagesPublisher InTechPublished online 07, July, 2011Published in print edition July, 2011
InTech EuropeUniversity Campus STeP Ri Slavka Krautzeka 83/A 51000 Rijeka, Croatia Phone: +385 (51) 770 447 Fax: +385 (51) 686 166www.intechopen.com
InTech ChinaUnit 405, Office Block, Hotel Equatorial Shanghai No.65, Yan An Road (West), Shanghai, 200040, China
Phone: +86-21-62489820 Fax: +86-21-62489821
Our knowledge of mass transfer processes has been extended and applied to various fields of science andengineering including industrial and manufacturing processes in recent years. Since mass transfer is aprimordial phenomenon, it plays a key role in the scientific researches and fields of mechanical, energy,environmental, materials, bio, and chemical engineering. In this book, energetic authors provide presentadvances in scientific findings and technologies, and develop new theoretical models concerning masstransfer. This book brings valuable references for researchers and engineers working in the variety of masstransfer sciences and related fields. Since the constitutive topics cover the advances in broad research areas,the topics will be mutually stimulus and informative to the researchers and engineers in different areas.
How to referenceIn order to correctly reference this scholarly work, feel free to copy and paste the following:
Stefan Iglauer (2011). Dissolution Trapping of Carbon Dioxide in Reservoir Formation Brine – A CarbonStorage Mechanism, Mass Transfer - Advanced Aspects, Dr. Hironori Nakajima (Ed.), ISBN: 978-953-307-636-2, InTech, Available from: http://www.intechopen.com/books/mass-transfer-advanced-aspects/dissolution-trapping-of-carbon-dioxide-in-reservoir-formation-brine-a-carbon-storage-mechanism

© 2011 The Author(s). Licensee IntechOpen. This is an open access articledistributed under the terms of the Creative Commons Attribution 3.0License, which permits unrestricted use, distribution, and reproduction inany medium, provided the original work is properly cited.