dissolution of nitrides and precipitation of an austenitic phase on
TRANSCRIPT

1
Dissolution of Nitrides and Precipitation of an Austenitic
Phase on the Surface of Fe-20%Cr alloys
Jesper Janis, Andrey Karasev, Keiji Nakajima, Stefan Jonsson and Pär G. Jönsson
ISRN KTH/MSE--10/15--SE+APRMETU/ART
Abstract
New phases have been observed on surfaces of metal specimens during
cooling after heat treatment at 1200, 1300 and 1400 °C of an Fe-20mass% Cr alloy
with different nitrogen contents (65, 248 and 490 ppm) and deoxidised by Ti and
Zr. These phases were assumed to be related to a phase transformation. The
analysis of nitrogen content in matrix metal and new phase crystals was carried out
based on point analysis of nitrogen using SEM. According to obtained results it
was concluded that the nitrogen had been dissolved from the nitrides during 60
minutes of heat treatment at high temperature and diffused in to the matrix. These
areas of enriched nitrogen content were then transformed to a new phase during
cooling. This new phase was assumed to be austenite because the nitrogen is a well
known element for promotion of austenite formation. The possibility of austenite
formation in Fe-20mass% Cr alloys with different nitrogen content was considered
and confirmed thermodynamically by using the Thermo-Calc software.
Keywords: ferritic stainless steel, high Cr alloy; Ti and Zr deoxidation; N content,
austenite.
2
1. Introduction
High chromium stainless steels with low alloying contents of the austenite
forming alloying elements ( such as Zn, Cu, Ni, Mn, N and C) likely occur as
ferritic stainless steels from solidification temperature down to room
temperature.[1] There are, although, some aspects to consider when discussing
special elements which can occur as precipitations, i.e. Nitrogen and Carbon. The
effect of Nitrogen and Carbon contents on the precipitation is dependent on the
distribution in the steel matrix. If precipitated as nitrides or carbides, the structure
is more or less independent of the content. At the same time, if N or C are
dissolved, it can change the structure from pure ferritic to pure austenitic[2-3]. These
phenomena have become interesting when the steel is under the influence of an
increased temperature. Different precipitations can act differently and be more or
less stable.
These phenomena can be of great importance when a ferritic stainless steel is under
the influence of high temperature changes. New precipitations can have a
significant effect on the corrosion properties of the steel after i.e. welding.
Boundary migration and pinning effect of particles during heat treatment of
Fe-20mass% Cr alloys at 1200, 1300 and 1400 oC were investigated in a previous
3
study[4]. Dissolution of nitrides in metal specimens with different nitrogen contents
during heat treatment experiments was also investigated.[4].
The purpose with the present study was therefore to investigate the
precipitation mechanism and to identify the new phase. The number and
composition of the inclusions in the metal were changed by varying the nitrogen
content in the samples. The dissolution of nitrides where observed as a reduced
pinning effect[4] together with heterogeneities in the structure and precipitation of
small areas with austenite. The dissolution behavior of the nitrides and pinning
effect of particles were determined based on the in-situ observations by using a
CSLM.
2. Experimental work
2.1. Sample Preparation
Three groups of Fe-20 mass% Cr samples with different nitrogen contents
were made by melting electrolytic Fe and pure Cr metal in an arc furnace under an
Ar atmosphere. A part of each group samples (150 g) was re-melted in an
induction furnace at 1600°C and deoxidised by Ti and Zr. After addition of
deoxidants, and stirring for homogenisation of chemical composition, the melt was

4
cooled to 1400oC at a cooling rate of 0.8oC/s, followed by quenching in water. The
final total nitrogen contents in the obtained ingot samples were 65, 248 and 490
ppm, respectively, with an oxygen content of approximately 150 ppm in all
samples. Detailed description of melting procedure is given in previous paper.[5]
After etching and verification of equiaxed grain zone, four pieces were cut
from the equiaxed zone of horizontal slices in each ingot sample. One metal piece
was used for determination of particle content and composition by observation on
surface of film filters after electrolytic extraction.[5] The other three pieces from
each ingot (totally 9 pieces from three ingots, hereafter named specimens 1a, 1b,
1c, 2a,..., 3c) were cut in the shape of cylinders (Ø4.2 x 1.5 mm) for heat treatment
experiments in a Confocal Scanning Laser Microscope (CSLM). Specimens 1a, 1b
and 1c were heated in CSLM chamber under pure Ar atmosphere to 1200, 1300
and 1400°C, respectively. Basic experimental conditions for heat treatments of
different metal samples are given in Table 1. The procedure was repeated with
specimens of ingot samples 2 and 3. Each specimen was kept at the experimental
temperature for 60 minutes followed by cooling down to room temperature. The
changes of temperature and cooling rate during cooling of specimens from
different experimental temperatures down to 500oC are shown in Figures 1 and 2.

5
During cooling of the specimens, a precipitation of new phase was observed
directly on metal surface. More experimental details of the in-situ observation
during heat treatment in the CSLM are given elsewhere.[4]
2.2. Examination of New Phases
The specimens after heat treatment experiments were observed and the
micrographs of the new phases were taken by using a Scanning Electron
Microscope (SEM) equipped with an Electron Probe Micro Analyzer (EPMA). A
computer based image analyzing software (Winroof©) was used to analyze the
area fraction (in %) of the new phase on a surface of metal specimens. A SEM
equipped with Wave length Dispersive Spectrometry (WDS) was used for
characterization of the new precipitated phase. Determination of the chemical
composition of the new phase was performed with focus on the composition
differences between N contents in the matrix and the new phase.
6
2.3. Thermodynamic Calculations of New Phase Formation
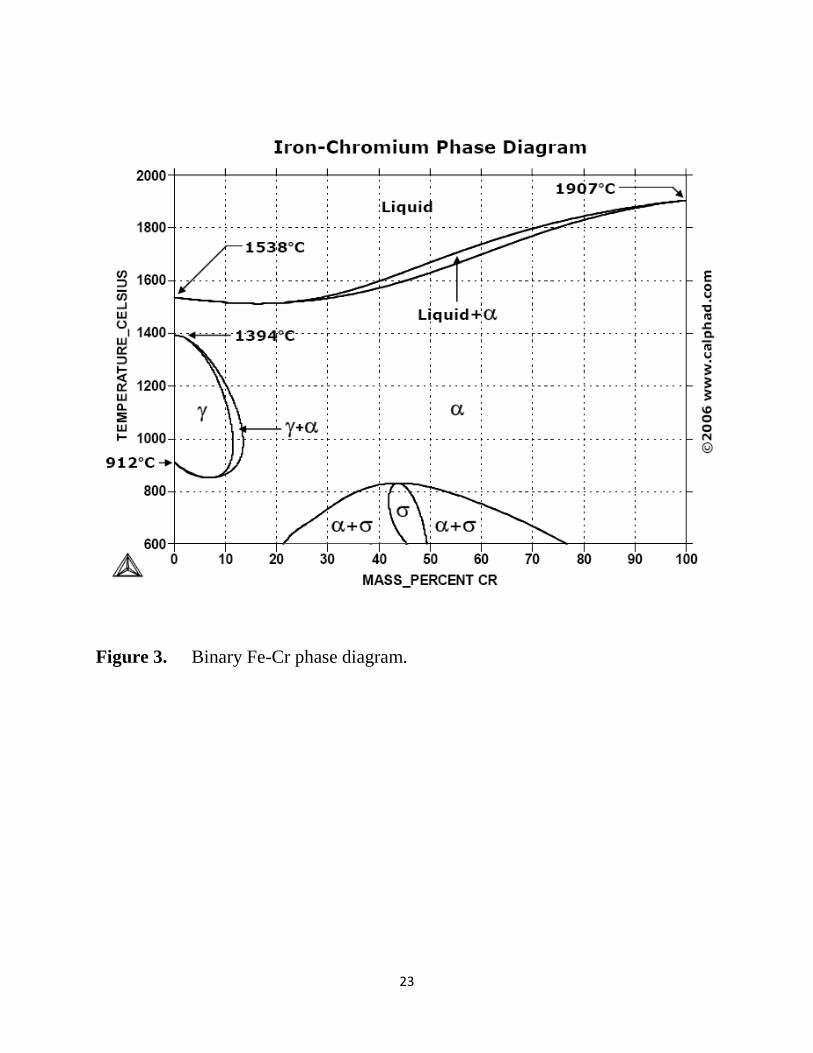
Passing the gamma loop during cooling or heating in the binary Fe-Cr phase
diagram in Fig. 3 results in an austenitic transformation. The loop is proven to be
enlarged by dissolved nitrogen[2-3] resulting in Cr-contents much higher than the
13-14% representative for the maximum Cr-content in the binary phase diagram.
In order to explore the extension of the gamma loop and the possibility of forming
new phases during cooling of Fe-20mass% alloys with different nitrogen contents,
the Thermo-Calc software was used. Based on the information from the WDS
analysis of the new phases, a series of vertical sections were calculated in the Fe-
Cr-N system using 50, 300, 500, 6000 and 10 000 ppm N. For each vertical
section, the total nitrogen content was fixed (to one of the above values), the total
number of mole of atoms in the system was fixed to 1 and the pressure was set to
105 Pa (1 bar). The total mass fraction of Cr and absolute temperature were used as
starting conditions and as axes in the automatic mapping procedure performed by
the software. The thermodynamic descriptions of the phases were taken from the
TCFE4 database, the most recent updated database for Fe-alloys, distributed
together with the Thermo-Calc software. In order to get accurate calculations,
small step sizes had to be used. The mass fraction was varied with 10-3 and the
7
absolute temperature with 1K. Finally, the calculated results were plotted as weight
percent Cr and temperature Celsius.
3. Results and Discussion
The grain boundary, which is revealed by thermal etching (thermal
groove)[7-8] at high temperature, starts to be visible in a CSLM after approximately
800 °C. In addition, it becomes clearer with an increased temperature (more than
1100oC).
The pinning effect of particles clearly decreased with an increased heat
treatment temperature, as is described in a previous paper.[4] It was shown that the
growth of grain on a surface of metal specimens almost stops after 60 minutes of
holding time at high temperature (1200, 1300 and 1400oC). It is believed that the
metal system (the grain growth and pinning effect of particles) in practice
approaches an equilibrium condition. However, during cooling of the heat treated
specimens, some small regions of a new phase appeared and could be observed by
microscope system of CSLM. The consideration of the formation of a new phase in
Fe-20mass% Cr alloy and in ferritic stainless steels after heat treatment is given
below.
8
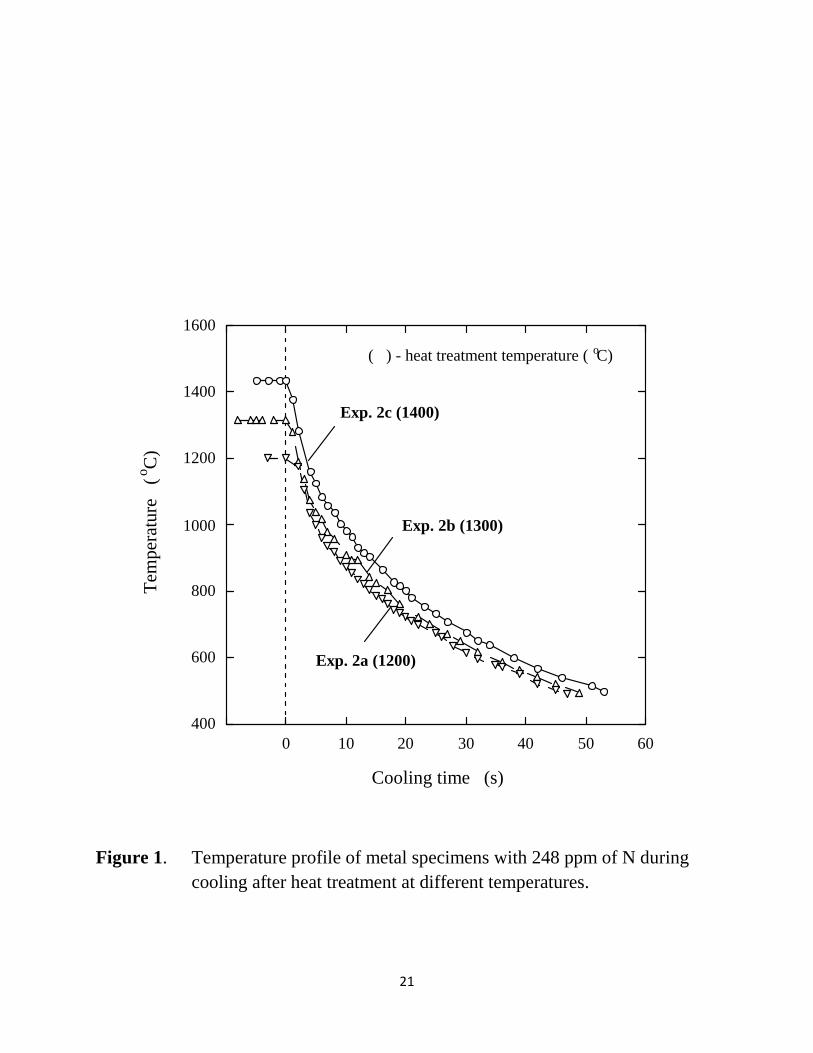
A comparable analysis of temperature profile and cooling rate of different
specimens after heat treatment are shown in Figures 1 and 2 for metal specimens
with 248 ppm of nitrogen (Exps. 2a, 2b and 2c). As shown in Fig. 2a, the data
points of calculated cooling rate for Exp.2c specimen has a significant dispersion,
particularly in period from 5 to 25 s of cooling time. However, the temperature
profile during cooling of this specimen (Fig. 1) is very smoothed. The same
tendency is observed for all other specimens. This significant scatter of data points
for different cooling rates can be explained by some inert temperature
measurement and renewal of updated fixed data on the screen of CSLM. It can be
seen in Fig. 2b that the total cooling rates of all metal specimens after holding at
1200, 1300 and 1400oC are very similar. They do not show some deviation (such
as peak or shelf) from a smoothed curve. This means that all specimens were
cooled for almost the same conditions.
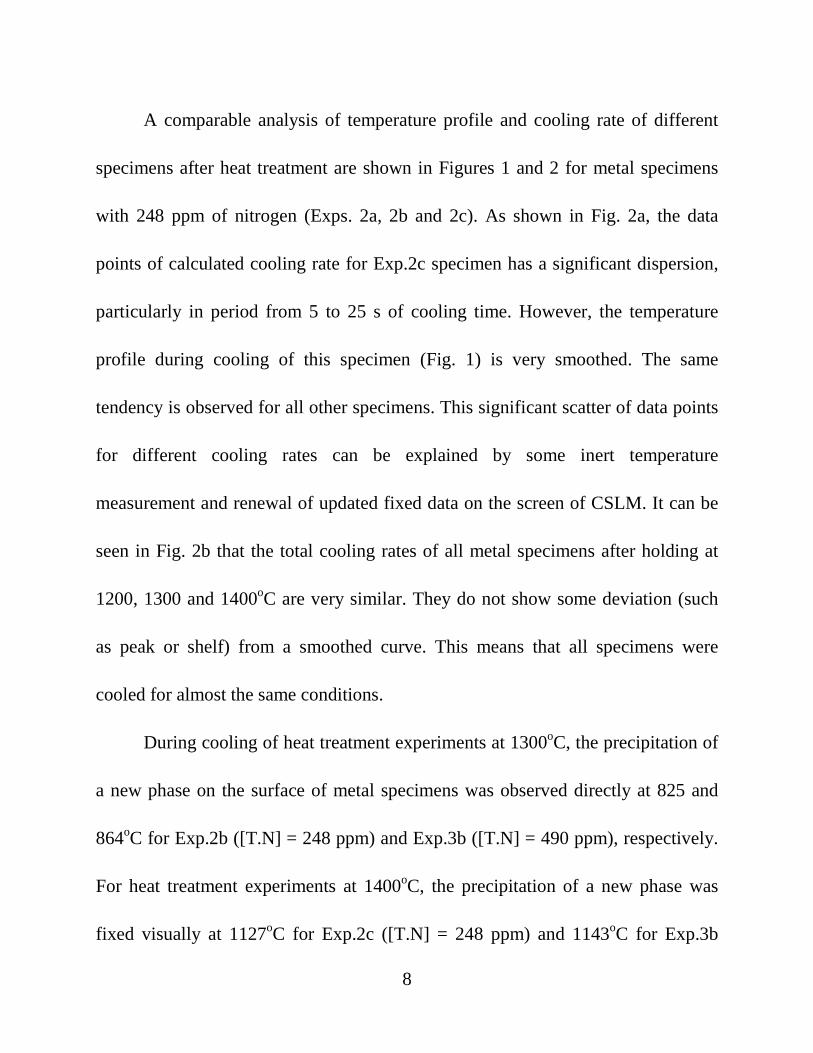
During cooling of heat treatment experiments at 1300oC, the precipitation of
a new phase on the surface of metal specimens was observed directly at 825 and
864oC for Exp.2b ([T.N] = 248 ppm) and Exp.3b ([T.N] = 490 ppm), respectively.
For heat treatment experiments at 1400oC, the precipitation of a new phase was
fixed visually at 1127oC for Exp.2c ([T.N] = 248 ppm) and 1143oC for Exp.3b
9
([T.N] = 490 ppm). By direct observation of other experimental specimens during
cooling (particularly of metal specimens with 65 ppm of N), it was difficult to fix
visually the moment of formation of a new phase due to the very small size of
precipitated phase in these experiments. Because of the absence of oxygen or
nitrogen in the experimental atmosphere (pure Ar atmosphere) in CSLM chamber,
the precipitation was concluded to be originated from the composition of the steel
and the heat treatment parameters.
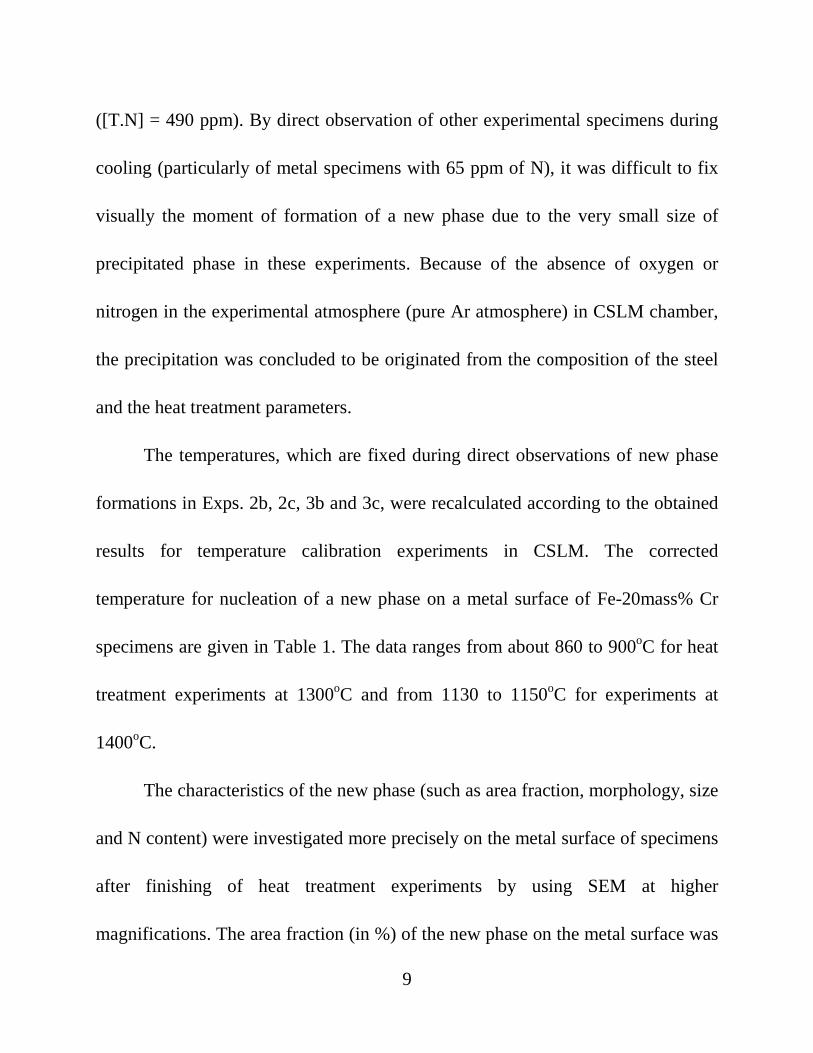
The temperatures, which are fixed during direct observations of new phase
formations in Exps. 2b, 2c, 3b and 3c, were recalculated according to the obtained
results for temperature calibration experiments in CSLM. The corrected
temperature for nucleation of a new phase on a metal surface of Fe-20mass% Cr
specimens are given in Table 1. The data ranges from about 860 to 900oC for heat
treatment experiments at 1300oC and from 1130 to 1150oC for experiments at
1400oC.
The characteristics of the new phase (such as area fraction, morphology, size
and N content) were investigated more precisely on the metal surface of specimens
after finishing of heat treatment experiments by using SEM at higher
magnifications. The area fraction (in %) of the new phase on the metal surface was

10
determined by using image analyzing software (Winroof©). According to obtained
results, the area fraction of new phase crystals on surface of metal specimens is
varied in the range from 1 to 5 % for heat treatment experiments at 1200oC, from 7
to 16 % for experiments at 1300oC and from 4 to 11 % for experiments at 1400oC.
It was found that the value of the area fraction depends first of all on the
morphology of precipitated new phase crystals.
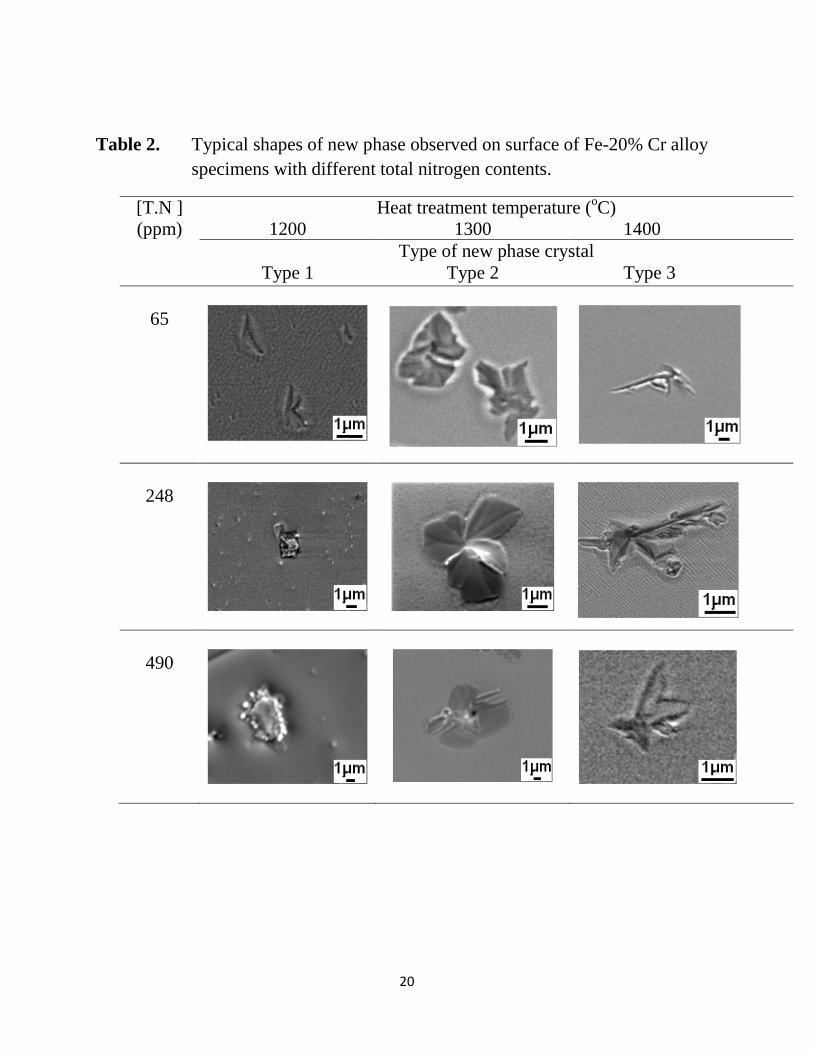
It should be pointed out that new phase crystals have a different morphology
for different heat treatment experiments at various temperatures. The typical
micrographs of new phase with different shapes are shown in Table 2 for various
N contents in metal specimens and heat treatment temperatures. It can be seen that
the shape of the precipitated new phase (hereinafter called “Type 1”, “Type 2” and
“Type 3” which have “leaf”, “flower” and “dendrite”-shapes, respectively) changes
according to the temperature of heat treatment experiments. Furthermore, it is
practically independent on the N content in metal specimens. It should be pointed
out that all types of new phases can be found on the surface of metal specimens for
heat treatment experiments at different temperatures. However, most of the new
phase crystals for 1200oC experiments have Type 1, for 1300oC – Type 2 and for
1400oC – Type 3.

11
One of the possible explanations of relationship between the morphology of
precipitated new phase and the temperature of heat treatment experiments is
discussed below. All specimens have almost the same cooling rate curves (Fig. 2b).
However, the values of cooling rate, which correspond to the temperature intervals
for appearance of new phase, are different. More specifically, they equals to 18-20
and 40-43 oC/s for experiments at 1300 and 1400oC, respectively. Based on these
results, it may be concluded that the morphology of the precipitated new phase
depends above all on the cooling rate of metal specimens and the heat treatment
temperature.
However, the size of new phase crystals depends significantly on the
nitrogen content in the metal specimens. The size of the new phase crystal, DNP,
was determined as the equivalent diameter of a circle having the same area as the
image of the measured crystal on the SEM micrograph. It was found that the
average value of DNP increases with an increased N content. For example, the
average size of new phase crystals increases. More specifically, the DNP values
were 1.86, 4.24, and 4.92 µm for metal specimens having the 65, 248 and 490 ppm
of N, respectively. A similar tendency was obtained also for precipitated new
phase for heat treatment experiments at temperatures of 1200 and 1400oC.
12
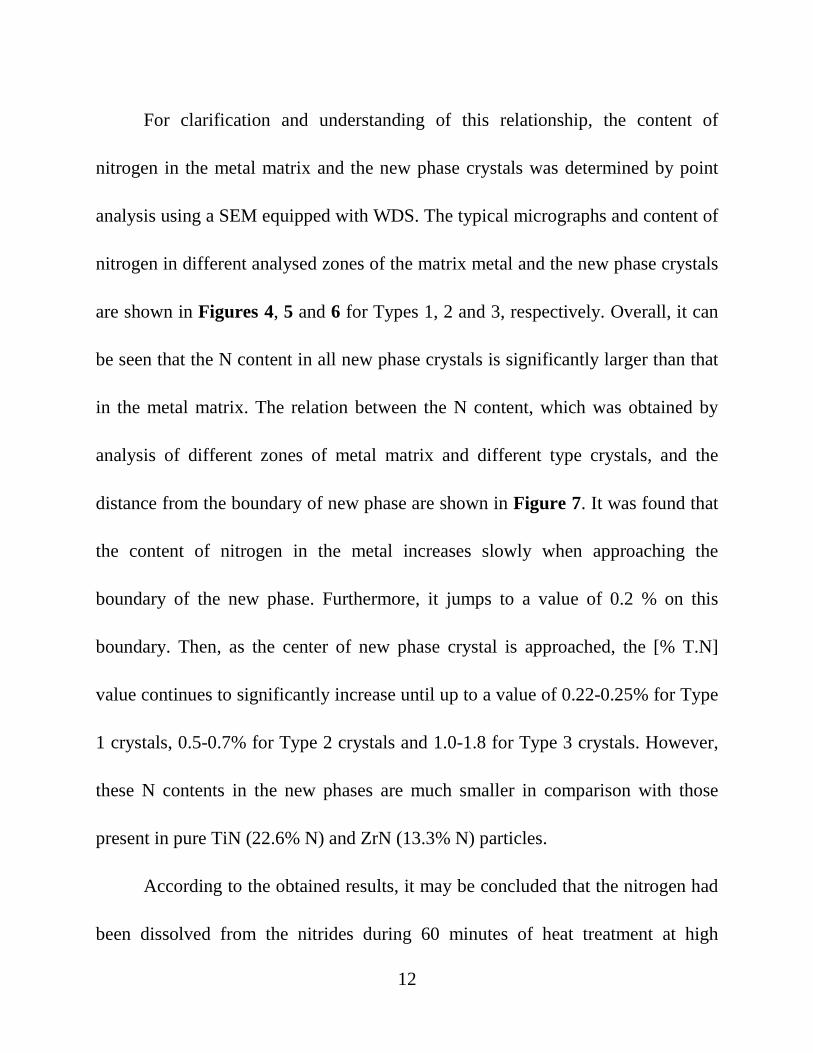
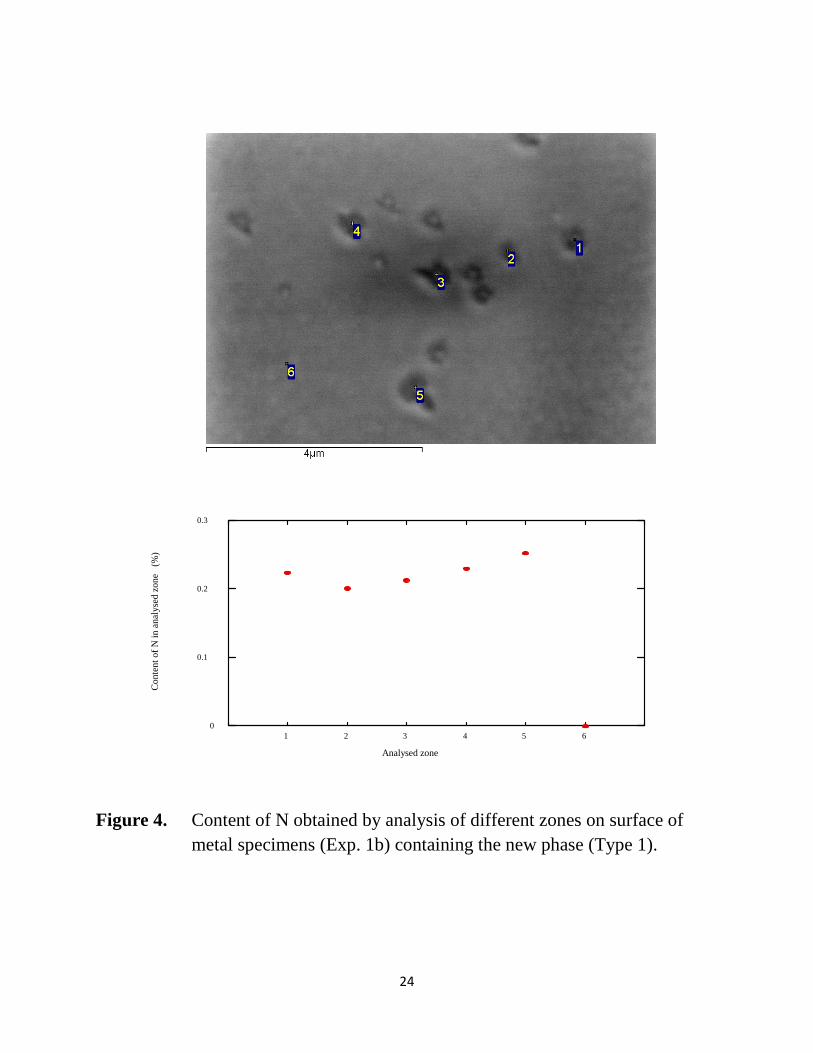
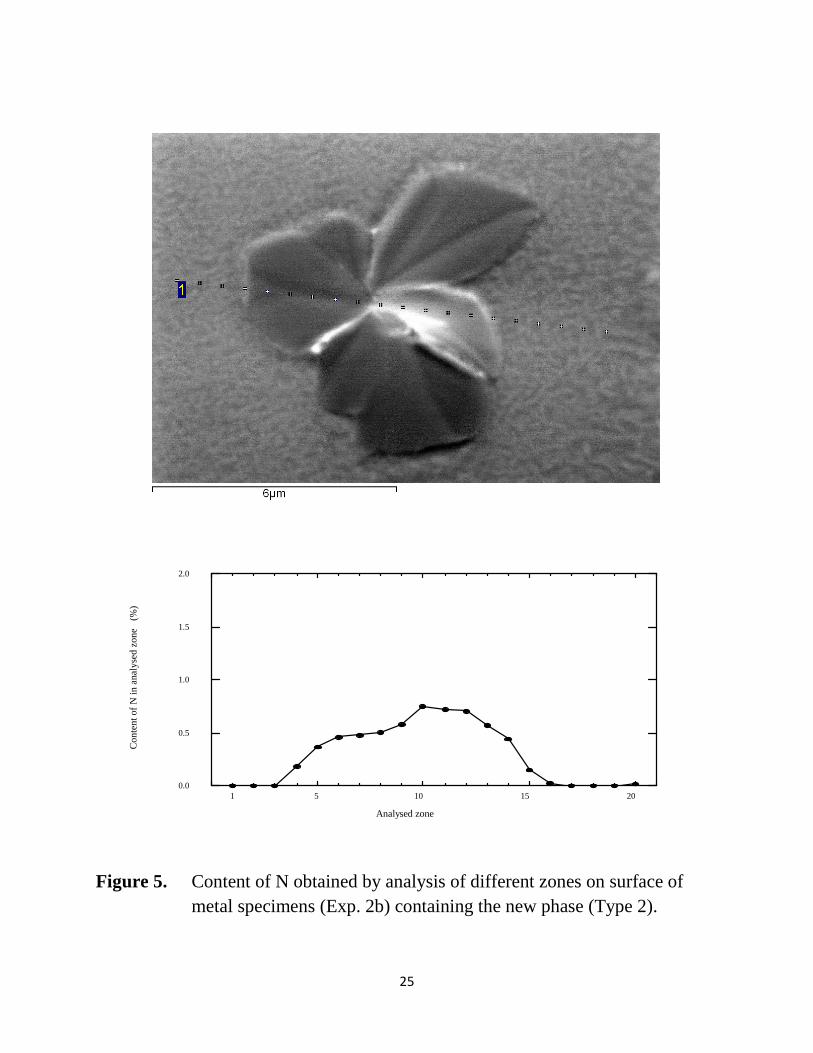
For clarification and understanding of this relationship, the content of
nitrogen in the metal matrix and the new phase crystals was determined by point
analysis using a SEM equipped with WDS. The typical micrographs and content of
nitrogen in different analysed zones of the matrix metal and the new phase crystals
are shown in Figures 4, 5 and 6 for Types 1, 2 and 3, respectively. Overall, it can
be seen that the N content in all new phase crystals is significantly larger than that
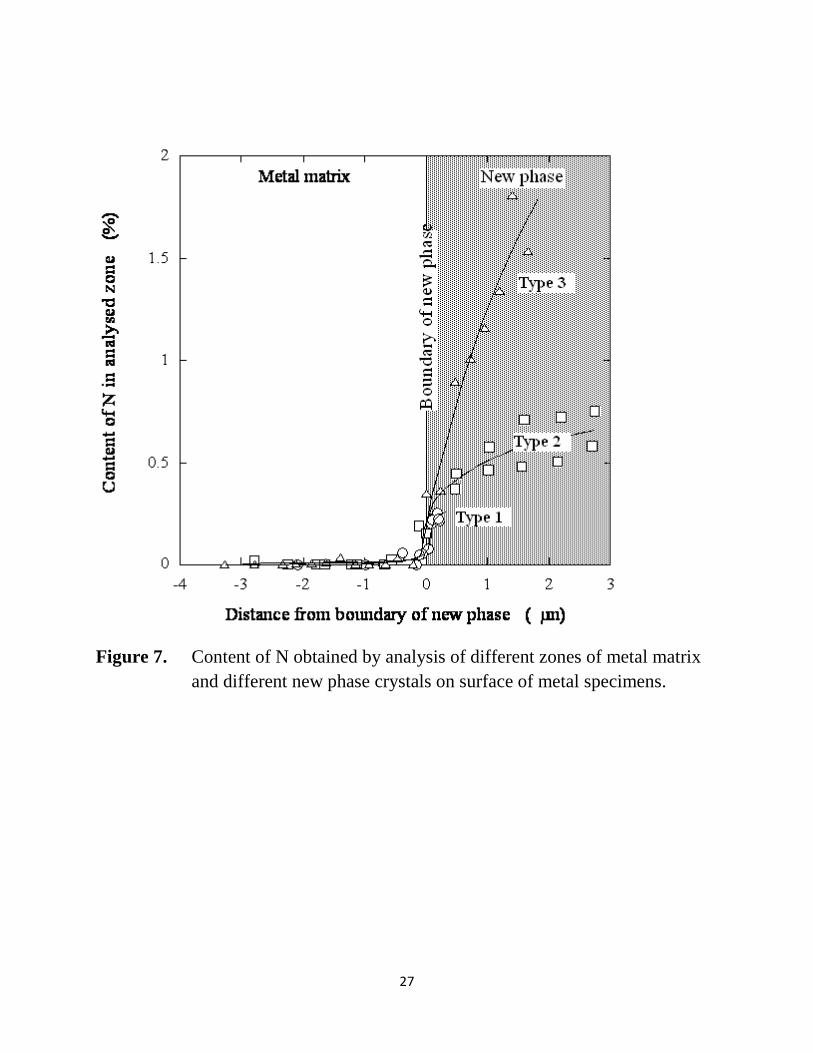
in the metal matrix. The relation between the N content, which was obtained by
analysis of different zones of metal matrix and different type crystals, and the
distance from the boundary of new phase are shown in Figure 7. It was found that
the content of nitrogen in the metal increases slowly when approaching the
boundary of the new phase. Furthermore, it jumps to a value of 0.2 % on this
boundary. Then, as the center of new phase crystal is approached, the [% T.N]
value continues to significantly increase until up to a value of 0.22-0.25% for Type
1 crystals, 0.5-0.7% for Type 2 crystals and 1.0-1.8 for Type 3 crystals. However,
these N contents in the new phases are much smaller in comparison with those
present in pure TiN (22.6% N) and ZrN (13.3% N) particles.
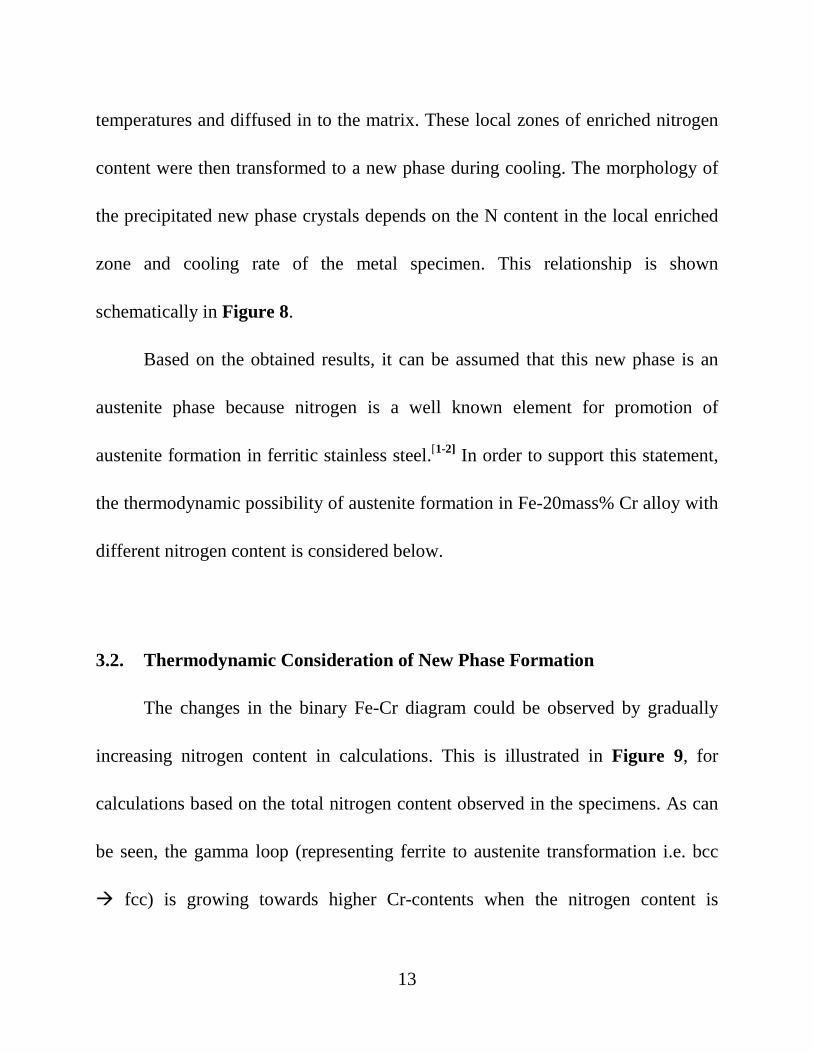
According to the obtained results, it may be concluded that the nitrogen had
been dissolved from the nitrides during 60 minutes of heat treatment at high
13
temperatures and diffused in to the matrix. These local zones of enriched nitrogen
content were then transformed to a new phase during cooling. The morphology of
the precipitated new phase crystals depends on the N content in the local enriched
zone and cooling rate of the metal specimen. This relationship is shown
schematically in Figure 8.
Based on the obtained results, it can be assumed that this new phase is an
austenite phase because nitrogen is a well known element for promotion of
austenite formation in ferritic stainless steel.[1-2] In order to support this statement,
the thermodynamic possibility of austenite formation in Fe-20mass% Cr alloy with
different nitrogen content is considered below.
3.2. Thermodynamic Consideration of New Phase Formation
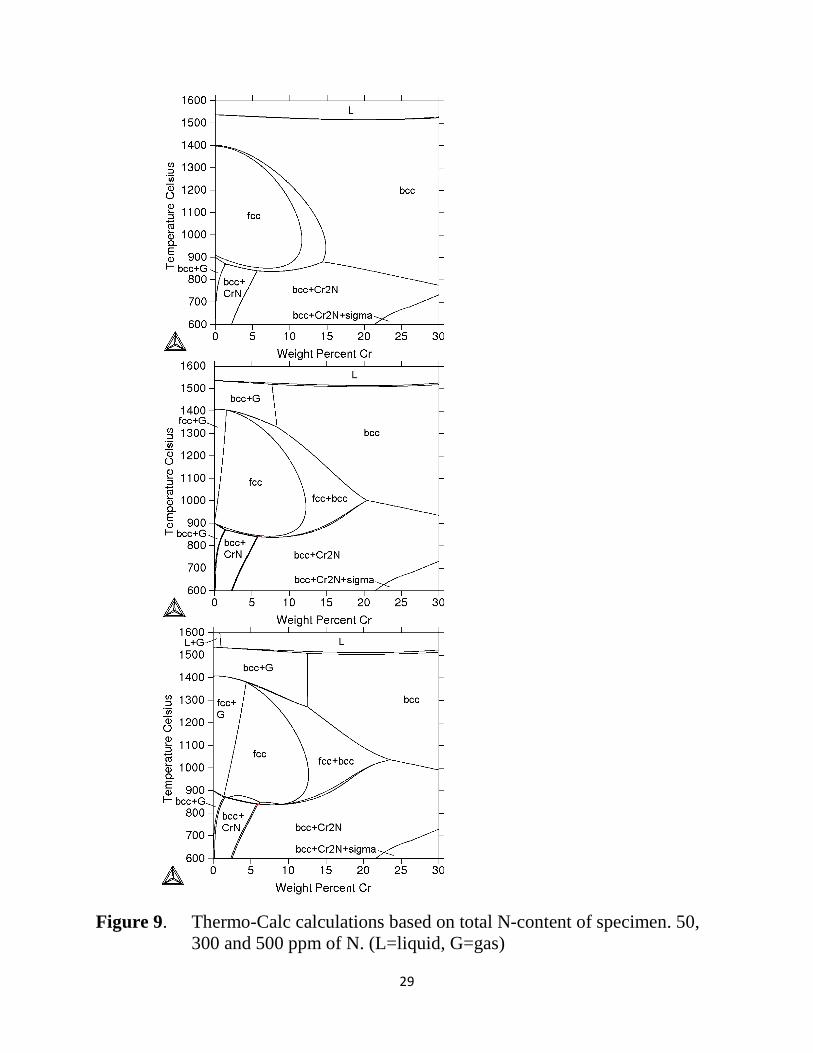
The changes in the binary Fe-Cr diagram could be observed by gradually
increasing nitrogen content in calculations. This is illustrated in Figure 9, for
calculations based on the total nitrogen content observed in the specimens. As can
be seen, the gamma loop (representing ferrite to austenite transformation i.e. bcc
� fcc) is growing towards higher Cr-contents when the nitrogen content is
14
increased. These calculations show that more than 300 ppm of nitrogen is enough
for austenite formation at around 1000 °C for this Fe-20mass% Cr alloy. When the
nitrogen content is further increased, the gamma loop extends towards both higher
Cr-content as well as higher temperatures. Furthermore, the gamma loop becomes
more complex and more phases can be observed in the calculations.
The calculations in Figure 10 were based on the actual composition
variations analysed by WDS. More specifically, in the 6000 ppm (0.6wt %)
nitrogen case, there are three to four different possible phase regions for
precipitation during cooling from 1400 °C. The different shapes, compositions and
morphologies, which will be discussed below, can be explained by combining
these calculated phase diagrams and the heat treatment temperature data. More
specifically, the 1400 °C specimen is kept at the phase region well above austenite
(fcc), while the 1300 °C is close to the phase line. However, the 1200 °C specimen
is instead inside the austenite phase region.
It can be assumed that diffusion of nitrogen back towards initial nitrides can
occur during cooling. Thus, this may thereby determine the structure of the
precipitations. Different types of precipitations have been discussed (Types 1, 2
15
and 3), as seen in Table 2. Depending on the cooling rate, from ferrite through the
austenite region below ~1250 °C, the time for diffusion of nitrogen can be related
to the different shapes and composition gradients for the different phase types. The
heat treatment at 1200 °C seems to be inside the phase region of austenite in Fig.
10. Therefore, it can be assumed that phase transformations occurred during heat
treatment which lead to more evenly distributed small Type 1 precipitations. For
higher temperatures (above ~1250 °C), it can instead be assumed that the
diffusivity of nitrogen is increased. Thus, this will lead to formations of larger
precipitations during cooling. According to the upper phase diagram in Fig. 10
representing the nitrogen content analysed for the Type 2 precipitations (see Fig 8),
there should be austenite and ferrite (fcc + bcc) down to ~1150 °C followed by fcc.
Thereafter, fcc + Cr2N between 1000 and 900 °C. According to the lower phase
diagram in Fig. 9 representing the type 3 precipitations (see Fig 8) there should be
austenite and gas (fcc + G) down to ~1100 °C and thereafter fcc + Cr2N between
1100 and 900 °C. More specifically, according to Table 1, the Types 2 and 3
precipitations can be assumed to represent two different precipitated phase
transformations involving austenite.

16
4. Conclusions
New phases have been observed, measured and investigated on the surface
of metal specimens during cooling after heat treatment at 1200, 1300 and 1400 °C
of an Fe-20mass% Cr alloy with different nitrogen contents (65, 248 and 490 ppm)
and deoxidised by Ti and Zr. The possibility of austenite formation in the Fe-
20mass% Cr alloy at different nitrogen content was considered and confirmed
thermodynamically by using Thermo-Calc software. The most important specific
conclusions may be summarized as follows:
1) The new phase crystals are precipitated on the surface of metal specimens of
an Fe-20mass% Cr alloy with different nitrogen contents of (65, 248 and 490 ppm)
during cooling, after being heat treated at high temperatures (1200, 1300 and
1400oC).
2) Three different types of new phases were observed. The content of nitrogen
in new phase crystals varied in the ranges of 0.22-0.25% N for Type 1 crystals, to
0.5-0.7% for Type 2 and to 1.0-1.8 for Type 3. The morphology of the precipitated
new phases depends on the nitrogen content in local zones of the metal matrix and
the cooling rate of the metal specimens.

17
3) Thermodynamic calculations showed that the Gamma loop (representing
austenite formation) was increased towards higher Cr-contents, when the nitrogen
content was increased. Furthermore, it was found that austenite transformation in
an Fe-20mass%Cr alloy is possible at dissolved nitrogen contents above 300 ppm.
4) According to the nitrogen contents in the new phase crystals and the results
obtained by thermodynamic calculations for the Fe-20mass% Cr alloy, this new
phase was assumed to be austenite.
18
REFERENCES
1) A. C. T. M. Van Zwieten and J. H. Bulloch., Int. J. Pres. Ves. & Piping 56
(1993) 1-31.
2) D. Chae, S. Lee, S. Son., la metallurgia italiana, febbraio 2009, 55-62.
3) L.S. Chumbley., CLEAN CAST STEEL TECHNOLOGY:
DETERMINATION OF TRANSFORMATION DIAGRAMS FOR
DUPLEX STAINLESS STEEL., September 2005 REPORT NO. 527992-
2005.
4) J. Janis, K. Nakajima, A. Karasev, H. Shibata and P.G. Jönsson: J. Mater.
Sci., (2009), DOI 10.1007/s10853-009-3908-7.
5) J. Janis, R. Inoue, A. Karasev, K. Nakajima and P. Jönsson: Steel Res. Int.,
80 (2009), 450.
6) J-O. Andersson, T. Helander, L Höglund, P. Shi, B. Sundman: Elsevier
Science Ltd., Calphad, 26 (2002), 273.
7) García de Andrés, C., Caballero, F.G., Capdevila, C., San Martín, D. (2002)
Materials Characterization, 49 (2), pp. 121-127.
8) D.J. Allen., Scr. Metall. 16 (1982), 5.
19
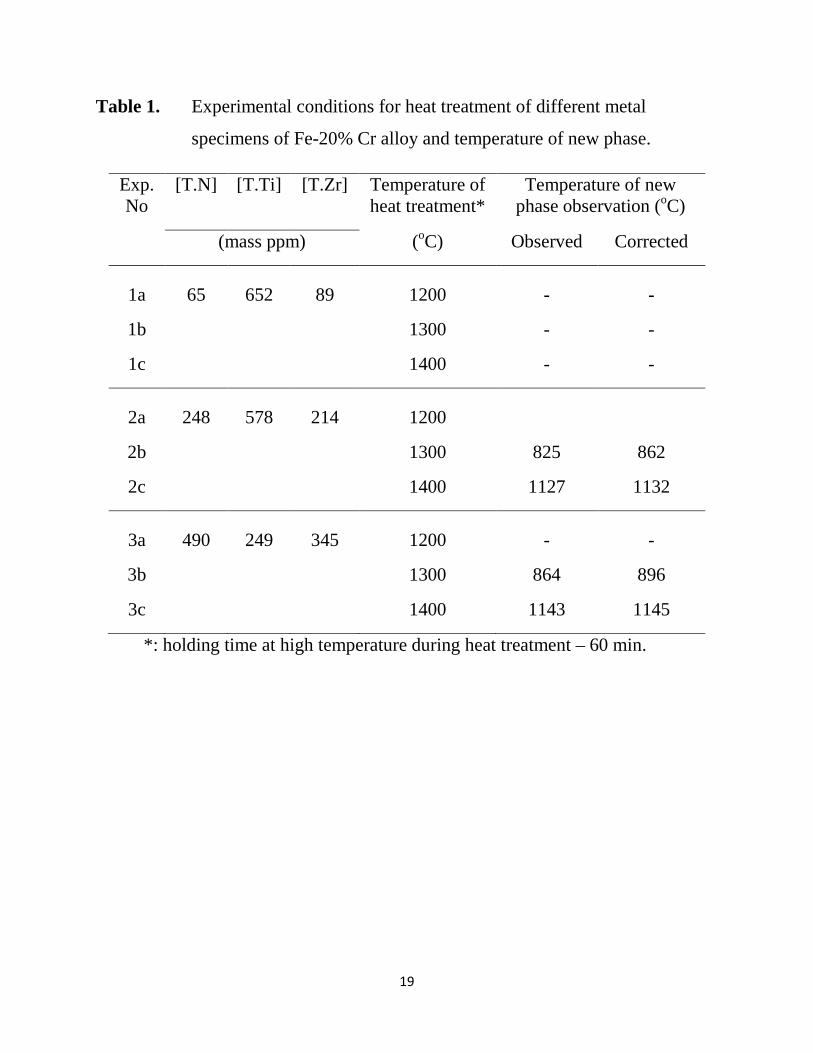
Table 1. Experimental conditions for heat treatment of different metal
specimens of Fe-20% Cr alloy and temperature of new phase.
Exp. No
[T.N] [T.Ti] [T.Zr] Temperature of heat treatment*
Temperature of new phase observation (oC)
(mass ppm) (oC) Observed Corrected
1a 65 652 89 1200 - -
1b 1300 - -
1c 1400 - -
2a 248 578 214 1200
2b 1300 825 862
2c 1400 1127 1132
3a 490 249 345 1200 - -
3b 1300 864 896
3c 1400 1143 1145
*: holding time at high temperature during heat treatment – 60 min.
20
Table 2. Typical shapes of new phase observed on surface of Fe-20% Cr alloy specimens with different total nitrogen contents.
[T.N ] (ppm)
Heat treatment temperature (oC) 1200 1300 1400
Type of new phase crystal Type 1 Type 2 Type 3
65
248
490
21
Figure 1. Temperature profile of metal specimens with 248 ppm of N during cooling after heat treatment at different temperatures.
400
600
800
1000
1200
1400
1600
-10 0 10 20 30 40 50 60
Tem
pera
ture
(
C)
o
Cooling time (s)
Exp. 2c (1400)
Exp. 2b (1300)
Exp. 2a (1200)
( ) - heat treatment temperature ( C)o

22
Figure 2. Cooling rate of metal specimens with 248 ppm of N after heat treatment at different temperatures.
0
20
40
60
80
100
Coo
ling
rate
(
C/s
)o
Exp. 2c (1400)
( ) - heat treatment temperature ( C)o (a)
0
20
40
60
80
100
-10 0 10 20 30 40 50 60
Co
olin
g r
ate
(
C/s
)o
Cooling time (s)
Exp. 2c (1400)
Exp. 2b (1300)
Exp. 2a (1200)
(b)
23
Figure 3. Binary Fe-Cr phase diagram.
24
Figure 4. Content of N obtained by analysis of different zones on surface of metal specimens (Exp. 1b) containing the new phase (Type 1).
0
0.1
0.2
0.3
0 1 2 3 4 5 6 7
Con
tent
of N
in a
naly
sed
zone
(%
)
Analysed zone
25
Figure 5. Content of N obtained by analysis of different zones on surface of metal specimens (Exp. 2b) containing the new phase (Type 2).
0.0
0.5
1.0
1.5
2.0
0 5 10 15 20
Con
tent
of
N in
ana
lyse
d zo
ne
(%
)
Analysed zone
1

26
Figure 6. Content of N obtained by analysis of different zones on surface of metal specimens (Exp. 2c) containing the new phase (Type 3).
0.0
0.5
1.0
1.5
2.0
0 5 10 15 20
Co
nte
nt
of N
in a
nal
ysed
zo
ne
(%
)
Analysed zone
1
27
Figure 7. Content of N obtained by analysis of different zones of metal matrix and different new phase crystals on surface of metal specimens.

28
Figure 8. Schematic illustration of the relationship between the morphology of a new phase precipitated in an Fe-20mass% Cr alloy, the content of N in local zones of the metal matrix and the cooling rate of metal specimens after heat treatment.
29
Figure 9. Thermo-Calc calculations based on total N-content of specimen. 50, 300 and 500 ppm of N. (L=liquid, G=gas)

30
Figure 10. Thermo-Calc calculations based on analysed N-content in precipitations, 0.6 and 1.0 wt% of N. (L=liquid, G=gas)