dissertation proposal endogenous tick sizes effect in the ... filedissertation endogenous tick...
TRANSCRIPT

Dissertation
Endogenous Tick Sizes, Bid-Ask Spreads, Depths, and Trading Volumes: the Evidence on the Stock Exchange of Thailand
Tanachote Boonvorachote
The Joint Doctoral Program in Business Administration (JDBA) Thammasat Business School

11/23/2007 Tanachote B., JDBA program 2
DefinitionsMinimum price variation, also called the tick or the minimum price increment, is the smallest amount by which two prices can differ. A tick size determines quoted bid-ask spreads directly.Order-driven markets use trading rules to arrange their trades.Endogenous tick change refers to tick change due to stock prices cross price boundaries.Exogenous tick change refers to tick change according to external factors e.g. tick size reduction by exchange policy, stock splits, etc.Endogenous tick change benefits study in effect of tick sizes on market quality because it completely screens out other effects, especially for SET, an order-driven marketsimplementing several price ranges.

11/23/2007 Tanachote B., JDBA program 3
Economic implicationsTick sizes as a binding constraint on bid-ask spreads are the price impatient traders pay for immediacy, trading costs, however, a bid-ask spread rewards patient traders who provide liquidity to market.Hence, an optimal tick recommends an appropriate trading cost for impatient traders, while provide enough incentive to liquidity providers.

11/23/2007 Tanachote B., JDBA program 4
MotivationTick policy comparison
Exchange Median relative tick (Basis points)
Numbers of price range
Canada 65.8 2
Hong Kong 33.2 8
Malaysia 62.9 7
Singapore 59.9 5
Thailand 66.7 10
United States 33.2 2
Remark: Relative tick means tick sizes divided by stock price.

11/23/2007 Tanachote B., JDBA program 5
MotivationAngel (1997) reports markets regulators in order-driven markets always design the tick size as a percentage of stock prices by the median of relative tick size at 25.9 basis points that creates average bid-ask spread at 3.7 ticks. SET also implements this policy with the median of relative tick size at 66.7 basis points in 10 price ranges.

11/23/2007 Tanachote B., JDBA program 6
Minimum Price Variation in SETTable 1
Before Nov 5, 01___________________________________________________________________________________
Tick-to-price ratio (in %)
__________________________________________________________________Price range Tick size Median Min Max
___________________________________________________________________________________ < Bt 10.00 0.10 Baht 2.000 1.000 100.000
Bt 10.00 < Bt 50.00 0.25 Baht 0.834 0.500 2.500Bt 50.00 < Bt 100.00 0.50 Baht 0.667 0.500 1.000Bt 100.00 < Bt 200.00 1.00 Baht 0.667 0.500 1.000Bt 200.00 < Bt 600.00 2.00 Baht 0.500 0.333 1.000Bt 600.00 < Bt1,000.00 4.00 Baht 0.500 0.400 0.667Bt1,000.00 <= 6.00 Baht --- --- 0.600____________________________________________________________________________________

11/23/2007 Tanachote B., JDBA program 7
Minimum Price Variation in SETTable 1 After Nov 5, 01
_____________________________________________________________________________Tick-to-price ratio (in %)
___________________________________________
Price range Tick size Median Min Max_____________________________________________________________________________
< Bt 2.00 0.01 Baht 1.000 0.500 100.000 Bt 2.00 < Bt 5.00 0.02 Baht 0.571 0.400 1.000Bt 5.00 < Bt 10.00 0.05 Baht 0.667 0.500 1.000Bt 10.00 < Bt 25.00 0.10 Baht 0.571 0.400 1.000Bt 25.00 < Bt 50.00 0.25 Baht 0.667 0.500 1.000Bt 50.00 < Bt 100.00 0.50 Baht 0.667 0.500 1.000Bt 100.00 < Bt 200.00 1.00 Baht 0.667 0.500 1.000Bt 200.00 < Bt 400.00 2.00 Baht 0.667 0.500 1.000Bt 400.00 < Bt 800.00 4.00 Baht 0.667 0.500 1.000Bt 800.00 <= 6.00 Baht --- --- 0.600
_____________________________________________________________________________________________________________________

11/23/2007 Tanachote B., JDBA program 8
Motivation
While there are attempts by market regulators around the world to reduce tick sizes and numbers of price ranges in other equity markets.
Do we implement too large tick sizes in SET?
Does SET have too many price ranges?

11/23/2007 Tanachote B., JDBA program 9
ContributionWe explore the effectiveness of existing
multiple tick-sizes policy in SET on market quality by exploring the effect on Bid-Ask Spreads, Depths, and Trading Volumes.
we expect to suggest:
Range of optimal tick sizes in SETPossible optimal numbers of price ranges in SET

11/23/2007 Tanachote B., JDBA program 10
Data setWe develop the limit order book from Year-2003
data of the Security Exchange of Thailand (SET).
We focus on SET50 stocks (57 stocks).We select continuous trading periods on main board
10:00-12:30 p.m.14:30-16:30 p.m.
We observeBetween consecutive price rangesOn trading days that stock prices experienced threshold passing

11/23/2007 Tanachote B., JDBA program 11
Data transformationThe limit order book [7 Giga bytes for SET50 stocks or 12.33
million transactions] is created from the order files and deal files[total at 8 Giga bytes] by the MATLAB programming under the following algorithms:
Matching the order and deal numbers by order direction (buy or sell)Price and time priority (matching price first, then, by time stamped)
Remarks:Limit orders mean orders by specific price.Market orders mean marketable limit orders at the best bid or best ask prices.

11/23/2007 Tanachote B., JDBA program 12
Literature reviewEffect of exogenous tick size on market quality smaller
tick sizes lead to narrower spreads and smaller depths
(Lau and McInish (1995), Van Ness, Van Ness, and Pruit(2000), Goldstein and Kavajecz (2000), Chung and Chuwonganant (2004), Chung, Chuwonganant, and McCormick (2004)).
However, it is not a consensus that smaller tick sizes always lead to narrower depth as shown in Ahn, Cao and Choe(1996), MacKinnon and Nemiroff (1999), and Chung, Kim, and Kitsabunnarat (2004))

11/23/2007 Tanachote B., JDBA program 13
Literature reviewNiemeyer and Sandas (1994) show evidence
in the order-driven market.
The regulated tick size in the Stockholm Stock Exchange (SSE) is positively related to the bid-ask spread and market depth, while negatively related to traded volume as same as Harris (1994), although SSE is operated in different market structure from the NYSE.

11/23/2007 Tanachote B., JDBA program 14
Theoretical framework
Tick size as a binding constraint on quoted bid-ask spread
As shown in Angel (1997) that the average tick size (25.9 basis points) is a large portion in quoted bid-ask spread (3.7 ticks), while SET implements tick level at 66.67 basis points.
If a tick size imposes a strong binding constraint on the width of quotable spreads, we expect to observe high frequency in one-tick bid-ask spreads.

11/23/2007 Tanachote B., JDBA program 15
Theoretical framework
Effect of tick size on market depths
Because liquidity providers are encouraged from time precedence and price priority to display more depths when spreads increase,
hence, we expect that displayed depths will always increase when stocks are traded in higher-price zones with larger minimum price increments.

11/23/2007 Tanachote B., JDBA program 16
Theoretical framework
Effect of tick size on trading volumes
Because spreads determine trading costs, simple demand theory implies that smaller spreads (decrease in price) will be associated with larger volumes (higher demand) because liquidity providers will feel that higher bid-ask spread as higher price or higher transaction cost is more expensive.
Hence, we expect that too large tick will harm trading volume in SET.

11/23/2007 Tanachote B., JDBA program 17
MethodologyDescriptive statistics
We explore effect of endogenous tick size change on bid-ask spreads, depths, and trading volumes by comparing between consecutive price ranges and threshold passing trading days.
Regression analysis
To observe that tick sizes in SET are too large, we need the models to predict effect of tick size change on bid-ask spreads, depths, and trading volumes.

11/23/2007 Tanachote B., JDBA program 18
Regression models
1. Bid-ask spread2. A Discrete model for bid-ask spreads3. Depths (Quotation shares) 4. Trading volumes5. Simultaneous equations
11/23/2007 Tanachote B., JDBA program 19
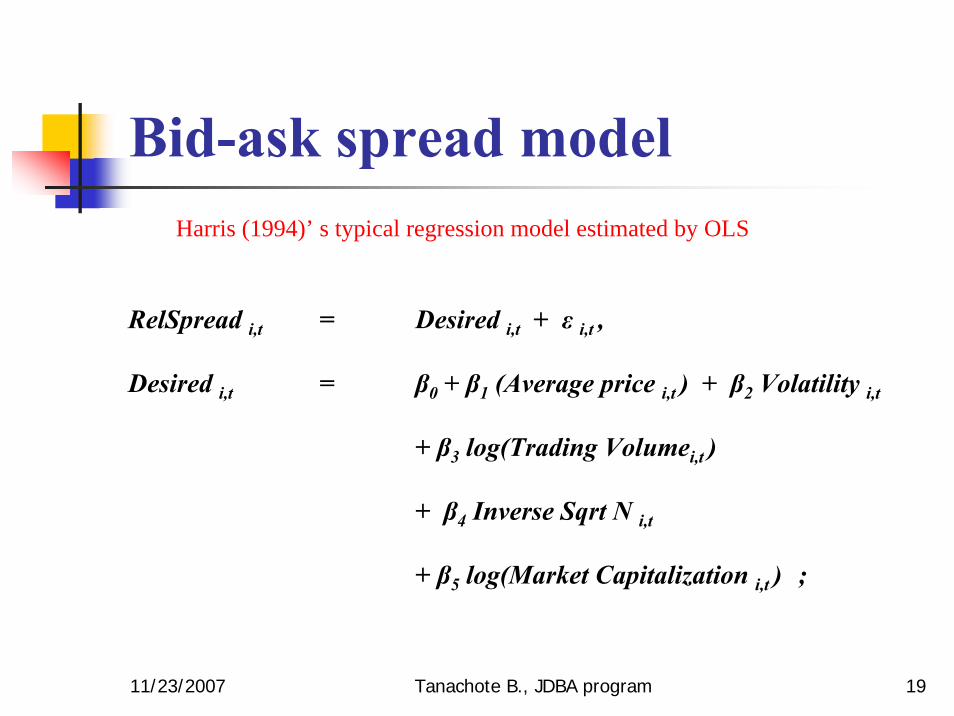
Bid-ask spread model
RelSpread i,t = Desired i,t + ε i,t ,
Desired i,t = β0 + β1 (Average price i,t ) + β2 Volatility i,t
+ β3 log(Trading Volumei,t )
+ β4 Inverse Sqrt N i,t
+ β5 log(Market Capitalization i,t ) ;
Harris (1994)’ s typical regression model estimated by OLS

11/23/2007 Tanachote B., JDBA program 20
Bid-ask spread modelHarris (1994)’s ad hoc switching regression model
RelSpread i,t = Rounded i,t + ε i,t ,
WhereRounded i,t = (1/8) / mid-quote,
Desired i,t , if Desired i,t > (1/8) / mid-quote,
AndDesired i,t = β0 + β1 (Average price i,t ) + β2 Volatility i,t
+ β3 log( Trading Volume i,t ) + β4 Inverse Sqrt N i,t
+ β5 log( Market Capitalization i,t );

11/23/2007 Tanachote B., JDBA program 21
Discrete Bid-ask spread modelHarris (1994)’s discrete gamma bid-ask spread model
1 / 8 2 / 8 3 / 8 >= 4 / 8 Relative spread (%)
Probability distribution
k1 k2 k3
Cumulative probability distribution
k1 k2 k3
1 / 8 2 / 8 3 / 8 > =4 / 8 Relative spread (%)

11/23/2007 Tanachote B., JDBA program 22
Discrete bid-ask spread model
The MLE bid-ask spread model Harris (1994)
The discrete quote generation process
Rounding of random draws from a continuous distribution, F(RelSpread i,t ; m i , ν) where m i is the mean unrounded relative spread, ν is a distributional shape parameter, and F denotes the cumulative distribution function. Harris assumes a gamma distribution in his study.

11/23/2007 Tanachote B., JDBA program 23
Discrete Bid-ask spread modelHarris (1994)’s discrete gamma bid-ask spread model
m i,t = β0 + β1 (Invprice size i,t ) + β2 Volatility i,t
+ β3 log(Trading Volumei,t ) + β4 Inverse Sqrt N i,t
+ β5 log(Market Capitalization i,t ) ;
F(RelSpread i,t ; m i , ν) = [1/(Γ(ν) ] τ (τy) ν-1 exp ( - τy ) dy,∫lSpreadRe
0

11/23/2007 Tanachote B., JDBA program 24
Discrete Bid-ask spread modelHarris (1994)’s discrete gamma bid-ask spread model
The implications of this model for discrete spread frequencies are as follows:
Prob (spread = $ 1 / 8) = F (k1 / P),
Prob (spread = $ 2 / 8) = F (k2 / P) – F (k1 / P),
Prob (spread = $ 3 / 8) = F (k3 / P) – F (k2 / P),
Prob (spread >= $ 4 / 8) = 1 – F (k3 / P),
Where the geometric rounding midpoints are given by
k i = Sqrt [ (i/8).(i+1)/8 ] , i = 1, 2, and 3
The model is estimated with the maximum likelihood estimation method.

11/23/2007 Tanachote B., JDBA program 25
Bid-ask spread model
RelSpread i,t = a 0 + a 1 Relative tick size i,t
+ a 2 Inverse Sqrt N of limit orders i,t
+ a 3 Inverse Sqrt N of transactions i,t
+ a 4 Volatility i,t + ε i,t , (1b)
Niemeyer and Sandas (1994)
11/23/2007 Tanachote B., JDBA program 26
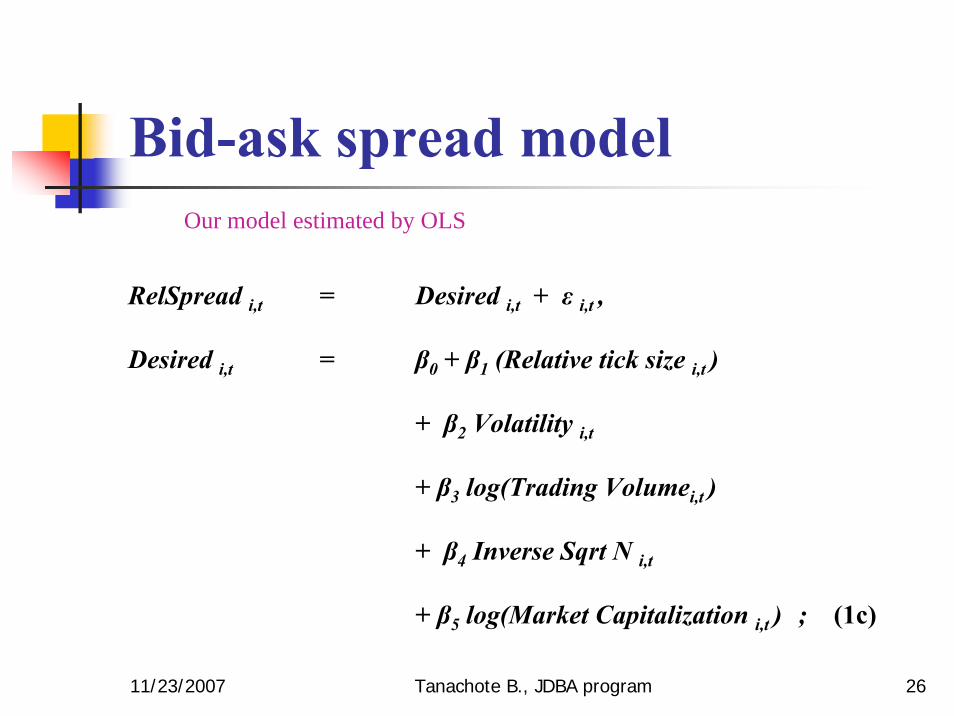
Bid-ask spread model
RelSpread i,t = Desired i,t + ε i,t ,
Desired i,t = β0 + β1 (Relative tick size i,t )
+ β2 Volatility i,t
+ β3 log(Trading Volumei,t )
+ β4 Inverse Sqrt N i,t
+ β5 log(Market Capitalization i,t ) ; (1c)
Our model estimated by OLS

11/23/2007 Tanachote B., JDBA program 27
bid-ask spread modelThe ad hoc switching model Our model
RelSpread i,t = Rounded i,t + ε i,t ,
WhereRounded i,t = Full tick quote / mid-quote,
or = Desired i,t , if Desired i,t > Full tick quote / mid-quote,(2)
AndDesired i,t = β0 + β1 ( Relative tick size i,t ) + β2 Volatility i,t
+ β3 log( Trading Volume i,t ) + β4 Inverse Sqrt N i,t
+ β5 log( Market Capitalization i,t ); (1c)

11/23/2007 Tanachote B., JDBA program 28
A Discrete model for bid-ask spreads
The MLE bid-ask spread model Our model
The discrete quote generation process
Rounding of random draws from a continuous distribution, F(RelSpread i,t ; m i , ν) where m i is the mean unrounded relative spread, ν is a distributional shape parameter, and F denotes the cumulative distribution function. We assume a gamma distribution in our study in every price range.

11/23/2007 Tanachote B., JDBA program 29
Discrete bid-ask spread model
1 tick 2 ticks 3 ticks … 1 tick 2 ticks 3 ticks … 1 tick 2 ticks 3 ticks … Relative spread (%)
Probability distribution
Below 2 Baht 2-5 Baht 5-10 Baht 10-25 Baht …

11/23/2007 Tanachote B., JDBA program 30
Discrete bid-ask spread model
1 tick 2 ticks 3 ticks >=4 tick Relative spread (%)
Probability distribution
0.660
0.058
0.010
k1 k2 k3
Cumulative probability distribution
1.000.93
k1 k2 k3
0.66
1 tick 2 ticks 3 ticks >=4 tick Relative spread (%)

11/23/2007 Tanachote B., JDBA program 31
Discrete bid-ask spread model
m i,t = β0 + β1 (Relative tick size
+ β3 log(Trading V
+ β5 log(Market Capitalization
i,t ; m i , ν) = [1/(Γ(ν) y)] [( y ν∫lSpreadRe
0
i,t ) + β2 Volatility i,t
olumei,t ) + β4 Inverse Sqrt N i,t
i,t ) ; (6)
F(RelSpread /m i ) ν exp ( -y ν/ m i ) dy, (7)

11/23/2007 Tanachote B., JDBA program 32
The MLE bid-ask spread modelThe implications of this model for discrete spread frequencies are as follows:
Prob (spread = 1 tick) = F (k1 / P), (8a)
Prob (spread = 2 tick) = F (k2 / P) – F (k1 / P), (8b)
Prob (spread = 3 tick) = F (k3 / P) – F (k2 / P), (8c)
Prob (spread >= 4 tick) = 1 – F (k3 / P), (8d)
Where the geometric rounding midpoints are given by
k 1 = Sqrt [ tick 1 tick 2 ] , (9a)
k 2 = Sqrt [ tick 2 tick 3 ] , (9b)
k 3 = Sqrt [ tick 3 tick 4 ] , (9c)
and tick i‘s are the sizes of ticks quoted. The model is estimated with the maximum likelihood estimation method.

11/23/2007 Tanachote B., JDBA program 33
The MLE bid-ask spread modelProjection for half tick sizes
We will half the coefficient of the relative tick size in the MLE model and
the geometric rounding midpoints are given by
k` 1 = Sqrt [ tick ` 1 tick` 2 ] , (9a)
k` 2 = Sqrt [ tick` 2 tick` 3 ], (9b)
k` 3 = Sqrt [ tick` 3 tick` 4 ], (9c)
and tick` i‘s are the sizes of halved ticks quoted. The model is estimated with the maximum likelihood estimation method.
And tick` i = (1/2) tick i‘

11/23/2007 Tanachote B., JDBA program 34
Depths (Quotation shares) model
Log Depth i,t = α 0 + α 1 (Inverse mid-quote i,t ) + α 2 Volatility i,t
+ α 3 log (Trading Volume i,t ) + α 4 Inverse Sqrt N i,t
+ α 5 log (Market Capitalization i,t )
+ α 6 Relative spread i,t + α 7 One-tick quote i,t
+ ε i,t ; (3)
Our model

11/23/2007 Tanachote B., JDBA program 35
Trading volume model
Log Trading Volume i,t = ψ 0 + ψ 1 Volatility i,t
+ ψ 2 log (Market Capitalization i,t )
+ ψ 3 Relative spread i,t + ε i,t ;
(4)
Our model

11/23/2007 Tanachote B., JDBA program 36
Simultaneous equationsRelSpread i,t = β’0 + β’1 ( Relative tick size i,t ) + β’2 Volatility i,t
+ β’3 log( Trading Volume i,t ) + β’4 Inverse Sqrt N i,t
+ β’5 log( Market Capitalization i,t ) + ε 1 i,t ; (5a)
Log Depth i,t = α 0 + α 1 ( Inverse mid-quote i,t ) + α 2 Volatility i,t
+ α 3 log( Trading Volume i,t ) + α 4 Inverse Sqrt N i,t
+ α 5 log( Market Capitalization i,t )
+ α 6 Relative spread i,t + α 7 One-tick quote i,t + ε 2 i,t ; (5b)
Log Trading Volume i,t = ψ 0 + ψ 1 Volatility i,t + ψ 2 log( Market Capitalization i,t )
+ ψ 3 Relative spread i,t + ε 3 i,t ; (5c)

11/23/2007 Tanachote B., JDBA program 37
Tick sizes as a binding constraint on bid-ask spreadFigure 1. Spreads distribution under and above 2-Baht threshold
price.

11/23/2007 Tanachote B., JDBA program 38
Endogenous tick size change on spreads, depths, and trading volumes
Result:1. Tick sizes in SET are very large as a strong binding
constraint on its quoted bid-ask spreads.2. Although large tick sizes in SET encourage quoted
depths, they discourage trading activities for price above 200 Baht or tick sizes starting at 2 Baht.
Hence, SET might set the largest tick size at 1 Baht. Price range above 200 Baht might be unnecessary.

11/23/2007 Tanachote B., JDBA program 39
Empirical resultsRegression analysis
1. OLS estimation gives better results than the system equation estimation (higher R-sq.). In sum, all techniques yield same quality in expected significant coefficient signs including switching and gamma models.
2. The discrete bid-ask spread model predicts that investors in SET still mainly quote one-tick spreads.

11/23/2007 Tanachote B., JDBA program 40
Empirical resultsRegression analysis
1. Spreads increase by higher volatility and decrease with higher volume and larger firm size. Tick size is a binding constraint on bid-ask spreads.
2. Depths decrease with higher volatility and larger price.
3. Trading volumes increase with larger firm size, while they decrease by larger spread.

11/23/2007 Tanachote B., JDBA program 41
Effect of tick size decrease for200-400 Baht price range
A tick size decrease from 2 Baht to 1 Baht.Relative spread decreases by 32.91 %Quoted depths decrease by 4.63 %Trading volumes increase by 1.09 %

11/23/2007 Tanachote B., JDBA program 42
Summary and conclusion1. Nominal tick sizes from 0.01 to 1.00 Baht will
encourage depths, while do not preclude trading volumes.
2. Evidence that main quoted spreads are in one tick confirms large tick sizes in SET
3. If SET sets the largest tick size at 1 Baht for starting price at 100 Baht, quoted spreads will decrease substantially while there are trivial effects on quoted depths and trading volumes. This confirms some unnecessary price ranges.

11/23/2007 Tanachote B., JDBA program 43
Pricing grids and tick sizes in SET with the largest tick size at 1 Baht
Table 13. Recommended Tick Sizes and Pricing Grids on the Stock Exchange of Thailand_____________________________________________________________________________________________________________________
Tick-to-price ratio (in %)
_______________________________________________________________________________
Price range Tick size Median Min Max_____________________________________________________________________________________________________________________
< Bt 2.00 0.01 Baht 1.000 0.500 100.000 Bt 2.00 < Bt 5.00 0.02 Baht 0.571 0.400 1.000Bt 5.00 < Bt 10.00 0.05 Baht 0.667 0.500 1.000Bt 10.00 < Bt 25.00 0.10 Baht 0.571 0.400 1.000Bt 25.00 < Bt 50.00 0.25 Baht 0.667 0.500 1.000Bt 50.00 < Bt 100.00 0.50 Baht 0.667 0.500 1.000Bt 100.00 < 1.00 Baht --- --- 1.000
_____________________________________________________________________________________________________________________

11/23/2007 Tanachote B., JDBA program 44
Essay 2Endogenous Tick Sizes and Traders’ Choice between Limit and
Market Orders: The Evidence on the Stock Exchange of Thailand
Motivation and contribution
To answer whether SET might implement too large tick sizes and provide too many price ranges, we explore endogenous tick size effect on traders’ choice between limit and market orders in SET. Because same investor can be both liquidity provider and demander, he/she can change his/her trading strategy by endogenous tick size change. If existing tick policy is optimal to trading environment in SET, current multiple tick sizes will encourage liquidity providers to submit limit orders, while they do not impose too high trading costs to liquidity consumers.

11/23/2007 Tanachote B., JDBA program 45
Literature reviewBiais et al. (1995) examine the interaction between the order
book and order flow in the Paris Bourse. They show that traders place limit orders when the bid-ask spread is large and the order book is thin. This also confirms by Harris and Hasbrouck (1996) for NYSE.
Arnold and Lipson (1997) also confirm that the proportion of limit order submission increase substantially after stock splits because stock splits alter pricing grids (larger spreads) to market makers.
Chung et al. (1999) examine the intraday variation in spreads established by limit-order traders and show that more investors enter limit orders when the spread is wide.
Hence, traders will submit more limit orders when spreads are large.

11/23/2007 Tanachote B., JDBA program 46
Literature reviewHanda and Schwartz (1996) predict that traders will submit more
limit orders relative to market orders when they expect a rise in transitory volatility because the liquidity-driven price volatility will attract public traders to submit limit orders rather than market orders.
Kiem and Madhaven (1995) suggest that informed traders prefer limit orders.
Contemporary paper, Bae et al 2003, find that traders place more limit orders relative to market orders when: (1) the spread is large, (2) the order size is large, and (3) They expect high transitory price volatility using a sample of orders submitted through NYSE SuperDot.

11/23/2007 Tanachote B., JDBA program 47
Theoretical frameworkTick size effect on limit order submission
As shown by Harris (1991), a nontrivial tick enforces time and price priority in a limit order book, providing incentives for investors to provide liquidity with limit orders.
Hence, the theory predicts that limit order investors should submit more limit order rather than market orders when tick sizes increase. Higher tick sizes impose higher transaction costs to market order submission.

11/23/2007 Tanachote B., JDBA program 48
Theoretical frameworkPrice volatility effect on limit order submission
Because informed traders endanger liquidity traders, Handa and Schwartz (1996) predict that traders will submit more limit orders relative to market orders when they expect a rise in transitory volatility.

11/23/2007 Tanachote B., JDBA program 49
MethodologyDescriptive statistics
We explore effect of endogenous tick sizes on limit order submissions by comparing between consecutive price ranges and on trading days that stock prices experienced price threshold passing.
Regression analysis
To observe that tick sizes in SET are too large, we need the models to predict effect of tick size change on limit order submissions:

11/23/2007 Tanachote B., JDBA program 50
Regression models
Propt t = β0 + β1 (Relative spread t)
+ β2 log (Trading volume t) + β3 Volatility t
+ β4 log (Market cap t) + β5 Inv sqrt N t
+ Σ αk Time k,t + ε t;
and Σ αk = 0. (1)
Our model

11/23/2007 Tanachote B., JDBA program 51
Empirical results5.1 Intraday variation of market and limit orders
Result: Figure 1 shows V-shaped intraday frequency for both market and limit orders as confirmed by many literatures. We separate our observations into 30-min intervals.
Figure 2 shows that traders will submit more market orders until the market closes.

11/23/2007 Tanachote B., JDBA program 52
5.1 Intraday variation of market and limit orders

11/23/2007 Tanachote B., JDBA program 53
5.1 Intraday variation of market and limit orders
Result: Figure 3 shows V-shaped intraday frequency for both market and limit orders for the trading days that stock prices pass price thresholds.
Figure 4 shows that traders will submit more market orders until the market closes.

11/23/2007 Tanachote B., JDBA program 54
5.1 Intraday variation of market and limit orders

11/23/2007 Tanachote B., JDBA program 55
5.2 Endogenous tick size change on limit order submission
Result: Figure 5 shows that the numbers of limit orders increases substantially when tick sizes increase.
Figure 6 reports same result by an increase in the proportion of limit order submission after tick sizes increase.

11/23/2007 Tanachote B., JDBA program 56
5.2 Endogenous tick size change on limit order submission

11/23/2007 Tanachote B., JDBA program 57
5.2 Endogenous tick size change on limit order submission
Result: In sum, we can conclude that a larger tick size will encourage traders to submit more limit orders; however, we found the evidence that a tick size at 1 Baht should be the biggest nominal tick size which does not encourage too high limit order proportion.

11/23/2007 Tanachote B., JDBA program 58
Regression results
Result: Table 5 show that higher spreads (tick size increase) attract limit order submissions. Price volatility in SET shows transitory price volatility. Investors will submit more limit orderswith higher transitory price volatility.

11/23/2007 Tanachote B., JDBA program 59
Regression results
Price range Observe
limitorder
Predictedlimitorder
Change(%)
Below 2 Bt 73.02 N/A N/A2-5 Bt 70.77 70.55 -0.31%5-10 Bt 72.76 72.32 -0.60%10-25 Bt 72.68 72.43 -0.34%25-50 Bt 72.98 72.69 -0.40%50-100 Bt 75.05 74.81 -0.33%100-200 Bt 75.73 75.47 -0.34%200-400 Bt 75.96 75.48 -0.64%
Observed and fitted limit order submission (%)
Half tick size

11/23/2007 Tanachote B., JDBA program 60
Summary and conclusion
1. Larger spread (tick size increase) encourages limit order submission and transitory price volatility encourages limit order submission.
2. Nominal tick sizes varying form 0.01 Baht to 1.00 Baht will encourages optimal limit order submission in SET and they are not considered as too high trading costs. Largest tick size at 1 Baht for prices above 200 Baht has a trivial effect on investors’ order submission strategy.