dissertation - othes.univie.ac.atothes.univie.ac.at/8464/1/2009-12-18_0004554.pdf · 4.7 antigen...
TRANSCRIPT

DISSERTATION
Titel der Dissertation
Direct antigen presentation by medullary thymic epithelial cells
is essential for CD4 T cell tolerance
angestrebter akademischer Grad
Doktor/in der Naturwissenschaften (Dr. rer.nat.) Verfasserin / Verfasser: Mag. Maria Hinterberger
Matrikel-Nummer: 0004554
Dissertationsgebiet (lt. Studienblatt):
Genetik - Mikrobiologie
Betreuerin / Betreuer: Univ.-Prof. Dr. Ludger Klein
Wien, am 16. Dezember 2009
1

TABLE OF CONTENTS Summary…………………………………………………………………………………………………………………...….………
Zusammenfassung……………………………………………………………………………………………………........... 1. Introduction……………………………………………………………………………………………………………..
1.1 The Thymus…………………………………………………………………………………………………..
1.1.1 Ontogenesis…………………………………………………………………………………………………..
1.1.2 Common TEC progenitor……………………………………………………………………..……..
1.1.3 cTEC progenitor……………………………………………………………………………………….…..
1.1.4 mTEC progenitor………………………………………………………………………………………….
1.1.5 The Autoimmune regulator (AIRE)………………………………………………………………
1.2 T cell development – thymic microenvironments………………………………………..
1.2.1 Early T cell development in the thymic cortex………………………………………………
1.2.2 Positive selection……………………………………………………………………………………………..
1.2.3 CD4/CD8 lineage choice……………………………………………………………………………….
1.2.4 Central tolerance – a historical overview…………………………………………………..
1.2.5 Negative selection………...………………………………………………………………………………….
1.2.6 Dominant tolerance – regulatory T cells………………………………………………………
1.2.7 Antigen presentation in the thymic medulla………………………………………………..
2. Aim of the study………………………………………………………………………………………………………
3. Results…………………………………………………………………………………………………………………….
3.1 Cloning and in vitro evaluation of C2TA-designer miRNA……………………
3.2 Generation of mTEC-specific C2TA knockdown mouse……………………….
3.3 C2TAkd mice show highly specific and efficient
down-modulation of MHCII…………………………………………………………………………..
3.4 Diminished MHCII expression does not affect
thymus integrity………………………………………………………………………………………………
3.5 Normal mTEC development in C2TAkd animals………………………………………
4
5
6
7
7
9
9
10
12
15
16
18
22
25
27
29
32
35
36
36
38
40
42
43
2

3.6 Defective negative selection of polyclonal CD4+ SP T cells
in C2TAkd mice…………………………………………………………………………………………….
3.7 A non-redundant role of mTEC and DC in negative selection………….…
3.8 Impaired negative selection of Ovalbumin-specific T cells…………….….…..
3.9 Enhanced induction of DO11.10+ Treg in C2TAkd mice………………….……….
3.10 Impaired deletion and enhanced Treg induction of HA-specific
T Cells…………………………………………………………………………………………………….………..
3.11 DC are dispensable for the deletion and Treg induction
of Ova-specific T cells………………………………………………….…………………..………
4. Discussion………………………………………………………………………………………………………..………..
4.1 Transcriptional and translational RNA interference
in C2TAkd mice?...............................................................................................................................
4.2 Specificity of C2TA for MHCII…………………………………………………………………….
4.3 Potential off-target effects………………………………………………………………………………
4.4 mTEC development in C2TAkd mice…………………………………………………………
4.5 Negative selection in C2TAkd mice…………………………………………………………….
4.6 Treg induction in C2TAkd mice………………………………………………………………………
4.7 Antigen transfer to DC……………………………………………………………………………………
4.8 Avidity impinge on the mode of tolerance……………………………………….…………..
5. Material and Methods………………………………………………………………………………….………….
6. References…………………………………………………………………………………………………….………….
7. Acknowledgements………………………………………………………………………………….……………..
8. Curriculum vitae…………………………………………………………………………………….…………………..
44
45
47
49
50
54
57
57
58
58
59
60
61
62
63
65
84
100
101
3

SUMMARY
Medullary thymic epithelial cells (mTEC) play an essential role in the establishment of
central tolerance as they express rare, otherwise tissue-restricted antigens. The
overall contribution of direct antigen presentation by mTEC as opposed to mere
provision of antigens, however, remains to be established.
Here, we generated a transgenic mouse (C2TAkd) expressing a “designer miRNA”
against C2TA, the master regulator of MHCII, specifically in mTEC. Tissue-specific
and efficient knock-down of C2TA was observed in mTEC, but not in other thymic
stromal cell types. In C2TAkd mice the polyclonal CD4+ single positive compartment
was enlarged and CD4+ thymocytes were self-reactive in vitro, presumably due to
impaired negative selection. In several TCR transgenic models of tolerance to
mTEC-derived self-antigens diminished negative selection was observed when
interfering with antigen presentation by mTEC, irrespective of whether potentially
cross-presenting dendritic cells (DC) were present or not. In addition we found that
reduced antigen presentation by mTEC shifted the mode of tolerance from negative
selection towards regulatory T cell (Treg) development which is in support of an avidity
model of Treg induction.
Taken together we propose a dual function for mTEC in CD4+ T cell tolerance as
antigen reservoir and as antigen presenting cells.
4

ZUSAMMENFASSUNG
Medulläre thymische Epithelzellen (mTEC) spielen eine wichtige Rolle für die
Entstehung zentraler Toleranz, da sie gewebsspezifische Antigene exprimieren. Die
Relevanz direkter Antigenpräsentation, im Gegensatz zur ausschließlichen
Produktion von Antigenen durch mTEC, ist undurchsichtig.
Diese Arbeit beschreibt die Generierung einer Transgenen Maus (C2TAkd), die eine
„Designer miRNA“ gegen C2TA, den Hauptregulator von MHCII, spezifisch in mTEC
exprimiert. Der gewebsspezifische und effiziente Knockdown von C2TA konnte in
mTEC, nicht jedoch in anderen thymischen Stromazellen detektiert werden. In
C2TAkd Tieren fanden wir eine vergrößerte CD4+ einfach positive T-Zell Population,
die CD4+ Zellen mit autoreaktivem Potential enthielt, was wahrscheinlich auf einen
Defekt in der negativen Selektion zurückzuführen ist. Des weiteren führte die
Inhibierung von MHCII in mTEC in mehreren Mausmodellen, in denen ein von
mTEC produziertes Antigen zusammen mit einem T-Zell Rezeptor spezifisch für das
Antigen exprimiert wurde, zu einer Verminderung der negativen Selektion. Diese
Beobachtung konnte in An- und Abwesenheit von Dendritischen Zellen (DC)
gemacht werden. Darüber hinaus konnten wir in den T-Zell Rezeptor transgenen
Modellen mit verminderter Antigenpräsentation durch mTEC eine Verschiebung von
negativer Selektion Richtung Induktion von regulatorischen T-Zellen (Treg) feststellen.
Dies ist ein starker Hinweis darauf, dass die Entwicklung von Treg auf einem
Aviditätsmodell beruht.
Wir vertreten die These, dass mTEC eine zweifache Funktion in der
Toleranzinduktion von CD4+ T-Zellen innehaben, als Antigenreservoir und als
Antigen präsentierende Zellen.
5

1. INTRODUCTION
The immune system is a remarkably old “institution” as even the most primitive
multicellular organisms have some kind of defense mechanism against potentially
dangerous pathogens. Innate immunity is a hallmark of all metazoan species and
depends, amongst others, on the recognition of highly conserved pathogen
associated molecular patterns (PAMPS) by germ line–encoded pattern recognition
receptors. Microorganisms on the other hand steadily develop new strategies to
evade these host defense tactics, thereby constantly putting immense selective
pressure on the host. Thus, there is a permanent need to respond to new and
improved invaders, which most likely led to the evolution of a new, highly
sophisticated defense mechanism, the so called adaptive immune system (1, 2).
The adaptive immune system first can be found in jawed vertebrates, and in a
rudimentary form also in jawless vertebrates. Unlike the innate immune system it is
characterized by the remarkable ability to specifically respond to virtually any given
pathogen. The enormous diversity and flexibility of the adaptive immune system is
ensured by different lymphocyte species and their ability to perform somatic
diversification of antigen receptor genes, thereby generating a vast repertoire of cells,
each of which expressing a different antigen receptor. Antigen recognition by specific
lymphocyte clones initiates a sequence of inter-depending processes including
proliferation, differentiation and production of specific antibodies.
Representing the major lymphocyte populations, T cells are primarily responsible for
cell-mediated immunity while B cells are mediating antibody responses or humoral
immunity, whereby their cross-talk is indispensible for an effective immune response.
Another hallmark of the adaptive immune system is its ability to memorize previously
encountered pathogens, enabling the host to erase future infections more quickly and
efficiently.
The generation of a nearly infinite antigen receptor repertoire is made possible by the
perpetual development of new lymphocytes and the somatic rearrangement of their
V-D-J immunoglobulin gene segments. As this process is entirely random it is an
obvious consequence that also potentially harmful receptors recognizing self
constituents are generated. Mechanisms of tolerance induction have therefore
arisen, eliminating auto-reactive lymphocytes and leading to the ability to distinguish
6

harmful/foreign from self, which is a fundamental feature of the adaptive immune
system.
1.1 The Thymus Concomitant with the emergence of the adaptive immune system and its T cell arm
500 million years ago, a co-evolution of a specialized organ for T cell development
took place, i.e. the thymus (2). T cell development is a non-autonomous process in
which the thymus as a primary lymphoid organ provides the essential niches and
constant signals for maturing T cells. The thymic stroma plays a key role at multiple
stages of T cell development, on the one hand it ensures T cell lineage specification
of common lymphoid precursors and on the other hand it is absolutely essential for
MHC-self restriction via positive selection and the elimination of auto-reactive T cells
via negative selection (3). Constituting the functional unit of the thymus, the thymic
stroma consists of hematopoietic as well as non-hematopoietic components which
are heterogeneous in their developmental origin, whereby dendritic cells (DC) and
macrophages belong to the first group while epithelial cells and mesenchymal cells
compose the latter. The postnatal thymus is compartmentalized into the inner
morphologically lighter zone, the medulla, containing medullary thymic epithelial cells
(mTEC), DC and macrophages and the outer morphologically darker zone, the
cortex, mainly comprising cortical thymic epithelial cells (cTEC). While the cortex is
operative in positive selection, the medulla has been shown to crucially contribute to
tolerance induction by expressing otherwise tissue-restricted antigens (TRA), thereby
mirroring the peripheral self.
1.1.1 Ontogenesis Thymus ontogenesis can be divided into pre- and post-thymus committed stages,
whereby thymus specification is strictly linked to the expression of the transcription
factor Forkhead box N1 (Foxn1) (4, 5). To date Foxn1 is the only marker that
identifies early thymic epithelial cell commitment and its expression can be first
detected around embryonic day 11.5 prior to vascularization and colonization by
hematopoietic cells, indicating that early thymus development is a cell autonomous
process or at least independent of hematopoietic cell immigrants (4, 6). Fate
7

mapping studies using Foxn1-Cre mice crossed to the Rosa26R-eYFP reporter
system revealed that more or less all adult TEC have expressed Foxn1 at some point
during development (7). The crucial role of Foxn1, not only as a marker but also
functionally, has been unambiguously shown in Foxn1-deficient nude mice that
exhibited a total block in early TEC development and consequently did not harbor
any differentiation into cTEC and mTEC. Moreover, nude mice did not support any T
cell development demonstrating the importance of a fully differentiated thymic
epithelium for this process. A detailed analysis showed that the Foxn1-deficient
thymus anlage did not express CCL25 and CXCL12 as well as Notch ligands, all
absolutely required for T cell development (8, 9). Importantly, mixed chimera
experiments established a cell autonomous role of Foxn1 in thymus development
(10).
TEC derive exclusively from the endodermal lining of the third pharyngeal pouch
which was confirmed by grafting endoderm-only third pouch of day 9 mouse embryos
into athymic mice and showing that this was sufficient to support T cell development
(11, 12). In addition it was found that the neural crest-derived mesenchyme is crucial
for early thymus organogenesis and thymus function (13). Factors that have been
implied in thymus development prior to thymus specification are rare; Tbx1, a gene
that has also been linked to the DiGeorge syndrome, was found to be essential for
the formation of pharyngeal pouch-derived organs such as the thymus (14, 15). Of
note, several other genes, like Hoxa3, Pax1 and Pax9, have also been shown to
have functional roles in early thymus generation (16-19).
The typical medullary-cortical structures first become apparent around E12,
interestingly coinciding with the first hematopoietic cell immigration. It is well
established that proper TEC development into medulla and cortex is dependent, at
least during some stages of maturation, on “thymic cross talk” which describes the
requirement of immature TEC to interact with T cells in order to differentiate into
cTEC and mTEC (20). This is based on the observation that T cell-deficient mice did
not show the typical thymic architecture and exhibited a disrupted medulla-cortex
organization (21-23). This cross talk involves various crucial cell surface molecules
and pathways all of which will be discussed later in this section.
8

1.1.2 Common TEC progenitor It had been a long standing issue whether cTEC and mTEC originate from a common
progenitor. This idea first came up with the observation that rare TEC in the adult
thymus simultaneously express cTEC and mTEC markers; keratin 8 (K8) is largely
expressed by cTEC while keratin 5 (K5) is specific to mTEC, however a rare
population of TECs in the adult thymus appears to be positive for both, thus possibly
representing a bi-potential progenitor. This hypothesis was even bolstered by the
finding that large clusters of K8+K5+ TEC accumulated in thymi of mice that showed a
block in T cell development (24). An ensuing study proposed MTS24+ cells, a subset
of K8+K5+ TEC, to fulfill the criteria for a common progenitor, however this has been
disproven later (25-27).
Today it is largely accepted that cTEC and mTEC both arise from the same
progenitor which was convincingly proven by two independent studies. First, Foxn1-
reactivation in single TEC of a Foxn1-deficient adult thymus led to the generation of a
fully competent thymus capable of supporting T cell development (7). Second, a
single yellow fluorescent protein expressing keratin+ cell isolated from embryonic day
12.5 murine thymi gave rise to both cTEC and mTEC clusters when placed into an
embryonic thymus (28). While these studies clearly demonstrate the existence of a
bi-potent TEC precursor, yet no specific marker for the identification of a common
progenitor has been described.
1.1.3 cTEC progenitor Whereas the last few years brought some insight into the mechanisms of TEC
development, especially mTEC development, still very little is known about cTEC
differentiation. Bleul et al. could prove the existence of a cTEC-committed progenitor
by fate mapping experiments using a YFP reporter, however, no specific marker of
early cTEC has been defined in this study (7). cTEC in contrast to mTEC appear to
be a largely homogenous population and are generally recognized by the surface
expression of EpCAM-1 and Ly51. Very recently a potential cTEC precursor was
identified in the embryo which was characterized by the expression of EpCAM-1 and
CD205 while being negative or low for MHCII and CD40 expression (29). Moreover
this presumable cTEC progenitor was highly proliferative and independent of
9

crosstalk with thymocytes while later stages of cTEC differentiation were found to
require the presence of T cells.
1.1.4 mTEC progenitor The earliest mTEC-specific progenitor that has been identified to date is a subset of
Claudin-3 and -4 expressing TEC, isolated from E13.5 embryonic thymi (30). These
cells were found to exclusively give rise to mTEC and not to cTEC when mixed into
RTOC and grafted into nude mice, whereas Claudin3/4 negative TEC showed both,
cTEC and mTEC potential. This data is indicative of a very early mTEC specification
during ontogeny.
Based on the expression of CD80, MHCII and AIRE, mTEC can be subdivided into
three major subsets: CD80-MHCII-AIRE- mTEC, CD80+MHCII+AIRE- mTEC and
CD80+MHCII+AIRE+ mTEC, whereby promiscuous gene expression (pGE), i.e. the
ectopic expression of otherwise tissue restricted genes, increases in the same order,
being highest in AIRE+ mTEC. pGE, a phenomenon that has been shown to be
essential for the establishment of central tolerance, is largely controlled by AIRE (31,
32). Initially it was found that the human Autoimmune Polyendocrine Syndrome Type
I (APS-1) was linked to a mutation in the AIRE gene. Soon after, AIRE-deficient mice
were generated, shedding more light on how AIRE enables tolerance induction to
TRA. The function and molecular mechanism of AIRE is described below.
In the context of mTEC development there has been a long lasting debate whether
AIRE-expressing mTEC represent the most mature or immature cell subset. Two
models have been proposed: The progressive restriction model assumes that AIRE-
expressing mTEC are progenitor cells that still have features of multipotent stem cells
and constantly minimize pGE as they mature (33). The second competing hypothesis
is the terminal differentiation model which implies that progressive differentiation
leads to increased pGE. A prerequisite for this of course is, that CD80-MHCII-AIRE-
mTEC develop into CD80+MHCII+AIRE- and finally into CD80+MHCII-AIRE- mTEC. In
the last few years there was evidence accumulating, strongly arguing for the terminal
differentiation model. For example AIRE+ mTEC were found to be postmitotic and
have an unexpectedly high turnover rate of 1 week which has been attributed to the
pro-apoptotic function of AIRE (34, 35). The final prove was brought by reaggregate
thymic organ culture (RTOC) experiments directly showing the progeny-precursor
10

relationship of CD80-MHCII-AIRE-, CD80+MHCII+AIRE- and CD80+MHCII+AIRE+
mTEC (Figure 1).
While early TEC development (before thymus specification) is independent of
hematopoietic immigrants, proper cTEC and mTEC development requires interaction
with T cells. Several surface molecules and signaling pathways have been implicated
in this process: The NF-κB pathway plays a fundamental role in mTEC development.
Interfering with components of the NF-κB pathway by inactivation of the TNF
receptor-associated factor TRAF6 or the NF-κB complex component RelB and NF-κB
inducing kinase (NIK) severely disrupted mTEC development and medulla formation
(36). The lack of a functional medulla led to an uncontrolled release of auto-reactive
T cells to the periphery and consequently to the development of multiorgan
autoimmunity. In the same line it was shown that receptors activating the NF-κB
pathway, namely the receptor activator of nuclear factor-kappa B (RANK) and CD40,
critically contribute to normal mTEC differentiation. RANK-ligand/RANK and CD40L-
ligand/CD40 interactions with T cells synergistically induce mTEC maturation in the
adult thymus (37-39), whereas RANK signaling provided by CD3+CD4- lymphoid
tissue inducer cells was essential and sufficient to support the maturation of mature
AIRE+ mTEC in the fetal thymus (37).
The lymphotoxin-β receptor (LTβ-R) has also been implicated to be important for
mTEC development, however its role has been controversial. While the LTβ-R was
initially described to directly regulate AIRE and TRA transcription, this observation
was soon challenged by the report of Boehm et al. showing that LTβ-R, instead of
regulating AIRE itself, contribute to mTEC development (40-42). This controversy
notwithstanding, there seems to be a role for LTβ-R signaling in mTEC development,
albeit not a very fundamental one. Finally there was a report proposing that cognate
interactions between mTEC and auto-reactive CD4+ SP T cells crucially contribute to
mTEC maintenance (43).
Collectively these data imply that a common TEC progenitor, that is present
throughout life, differentiates into a cTEC or mTEC-commited progenitor in order to
finally form mature cTEC and mTEC lineages respectively. The specification of these
two lineages seems to undergo T cell-dependent as well as –independent stages
(Figure 1).
11

Figure 1 – TEC development. TEC development proceeds along several stages that are partially dependent on interactions with T cells. The thymus originates from the endodermal lining of the third pharyngeal pouch and gives rise to a common, bi-potent TEC progenitor which branches into the cTEC and mTEC lineage respectively. The receptors and signaling molecules involved in various developmental stages as well as the surface markers identifying the state of maturity are indicated.
1.1.5 The Autoimmune Regulator (AIRE) The discovery of AIRE and its important role in tolerance induction is based on the
genetic analysis of the autoimmune syndrome APS-1. Compared to other
autoimmune diseases, the underlying genetics of APS-1 is rather simple with almost
all identified mutations located exclusively in the AIRE gene (44). AIRE expression is
restricted to very few cell types, being almost exclusively expressed in mature mTEC
and to much lesser degree in DC in the thymus (45). With the generation of AIRE-
deficient mice it finally became clear that AIRE is directly linked to central tolerance.
Loss of AIRE expression led to the development of multiorgan autoimmunity with
inflammatory infiltrates and autoantibody production, thus by and large recapitulating
the disease pattern of APS-1 (46). These observations prompted the speculation that
TRA expression might be controlled by AIRE and indeed detailed analysis of AIRE-
deficient mTEC revealed that hundreds if not thousands of promiscuously expressed
12

transcripts are regulated by AIRE, e.g. insulin, salivary protein 1 and fatty acid
binding protein. Of note not all TRA are under the control of AIRE, examples of which
are C-reactive protein or GAD67, implying a potential role for additional, yet unknown
factors (32).
The precise molecular mechanism of AIRE is still largely obscure. At first glance
AIRE appears to be a classical transcription factor, however several findings hint at a
broader function of AIRE. First, AIRE regulates the transcription of several thousand
genes which is by far more than any other known transcription factor (32). Second,
there appears to be an extremely high variability in the transcriptional footprint of
AIRE between individual mTEC (47, 48). Third, the pattern of TRA transcription in
mTEC differs from that in the respective tissue and beyond that it appears to be
independent of the tissue-specific transcriptional regulators (49). Interestingly it was
shown that transcriptional start sites can also differ in AIRE-dependent transcripts
(49). Fourth, rather than qualitatively activating gene expression, AIRE quantitatively
increases the level of transcription, thereby accentuating “transcriptional noise” (47,
50). Fifth, AIRE-regulated genes appears to be clustered in the genome (32).
Structural analysis of AIRE shed some light on how AIRE might exert its function.
First, AIRE contains a SAND domain (Sp100 AIRE-1 NucP41/75 DEAF-1) that was
suggested to be involved in DNA binding. But instead of a strong and specific binding
to DNA, AIRE seemed to interact with DNA in a rather non-specific manner and no
conserved DNA binding element has be identified (51). Second, the PHD finger
(plant homeo domain), a typical protein-protein interaction site, was speculated to
enable AIRE to interact with nucleosomal histones (52). In particular it was found that
AIRE specifically binds to unmethylated lysin 4 histon 3 (K4m0H3), interestingly a
marker for inactive regions. This might be operative in concentrating AIRE at
transcriptionally inactive sites in order to activate transcription. A third important
domain, the CARD domain (caspase recruitment domain), was shown to be a crucial
protein interaction domain, which could for example serve as a site for interactions
with other transcriptional regulators (53). Therefore the identification of potential
interaction partners of AIRE has been of great interest to in order to understand its
mode of action (Figure 2).
13
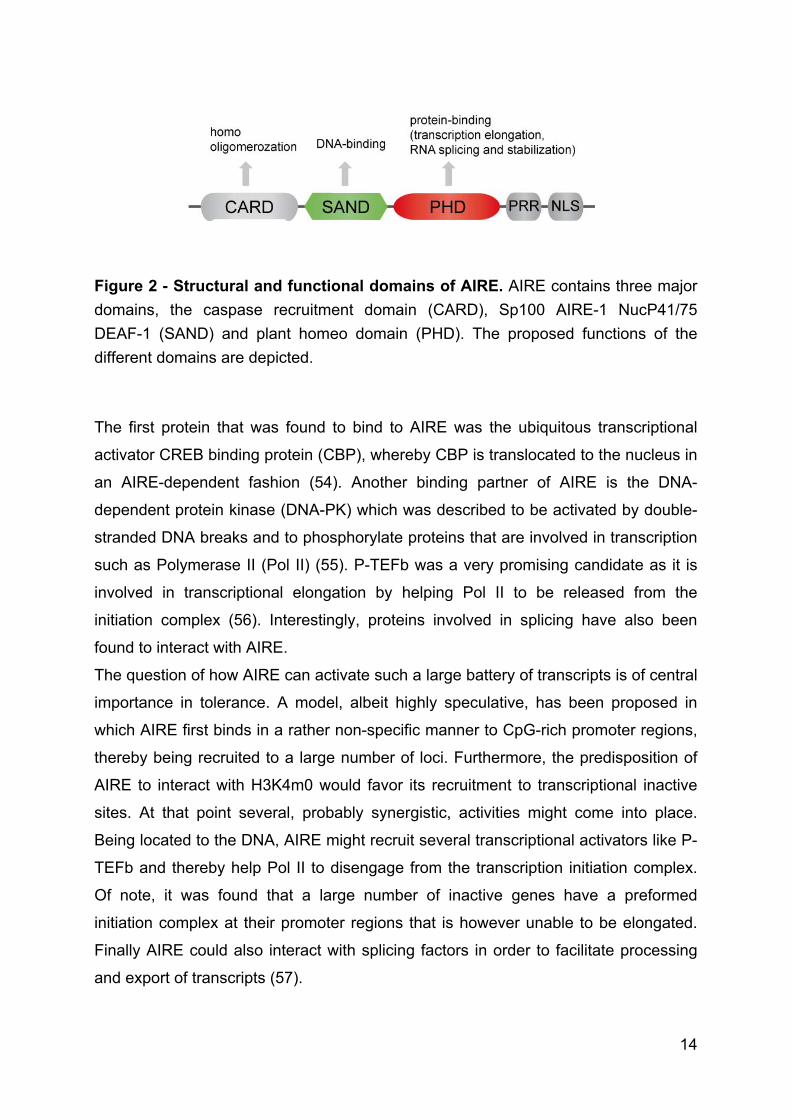
Figure 2 - Structural and functional domains of AIRE. AIRE contains three major domains, the caspase recruitment domain (CARD), Sp100 AIRE-1 NucP41/75 DEAF-1 (SAND) and plant homeo domain (PHD). The proposed functions of the different domains are depicted.
The first protein that was found to bind to AIRE was the ubiquitous transcriptional
activator CREB binding protein (CBP), whereby CBP is translocated to the nucleus in
an AIRE-dependent fashion (54). Another binding partner of AIRE is the DNA-
dependent protein kinase (DNA-PK) which was described to be activated by double-
stranded DNA breaks and to phosphorylate proteins that are involved in transcription
such as Polymerase II (Pol II) (55). P-TEFb was a very promising candidate as it is
involved in transcriptional elongation by helping Pol II to be released from the
initiation complex (56). Interestingly, proteins involved in splicing have also been
found to interact with AIRE.
The question of how AIRE can activate such a large battery of transcripts is of central
importance in tolerance. A model, albeit highly speculative, has been proposed in
which AIRE first binds in a rather non-specific manner to CpG-rich promoter regions,
thereby being recruited to a large number of loci. Furthermore, the predisposition of
AIRE to interact with H3K4m0 would favor its recruitment to transcriptional inactive
sites. At that point several, probably synergistic, activities might come into place.
Being located to the DNA, AIRE might recruit several transcriptional activators like P-
TEFb and thereby help Pol II to disengage from the transcription initiation complex.
Of note, it was found that a large number of inactive genes have a preformed
initiation complex at their promoter regions that is however unable to be elongated.
Finally AIRE could also interact with splicing factors in order to facilitate processing
and export of transcripts (57).
14

The role of AIRE with respect to tolerance induction has been extensively explored. It
is believed that the main role of AIRE is to ensure the deletion of TRA-reactive T cells
which was confirmed by the detection of eye and stomach-specific T cell clones and
auto-antibodies in AIRE-deficient mice (58, 59). In the same line, negative selection
was diminished in TCR/neo-self-antigen double transgenic mice in the absence of
AIRE (35, 60, 61). Another potential mode of tolerance that might be influenced by
AIRE is the induction of regulatory T cells (Treg). It was shown that AIRE+ mTEC are
capable of directly inducing Treg in a TCR/neo-self-antigen transgenic mouse model
(62). However, transplantation of WT and AIRE-deficient thymi into athymic mice did
not rescue from autoimmunity which speaks in favor of a Treg-independent defect in
tolerance (35). In a similar vein crossing AIRE-deficient mice onto a Treg-deficient
background did even deteriorate the clinical picture strongly arguing for a defect in
negative selection. Finally AIRE was also proposed to play a role in the periphery
where it was found to be expressed by very rare cells in the LN and spleen that also
express TRA, although with limited diversity (63). To date the physiological relevance
of this phenomenon is unclear.
1.2 T cell development – thymic microenvironments Whereas most hematopoietic cell lineages undergo differentiation and maturation in
the bone marrow, T cells develop in a specialized organ, the thymus. T cell
development proceeds in a temporarily and spatially strictly controlled order which is
dictated by the microenvironment provided by the thymic stroma. The journey
through the thymus is a matter of surviving; developing T cells have to go through
several checkpoints where they either die or pass on until they are released to join
the peripheral T cell pool as mature T cells. Only those T cells bearing a functional
TCR that is self-MHC restricted and able to interact with peptide-MHC (pMHC)
complexes in a certain window of affinity and/or avidity will pass the first checkpoints,
the so-called β-selection and positive selection which takes place in the thymic
cortex. After the first selection process that is accompanied by a tremendous cell
loss, T cells translocate to the medulla and undergo tolerance induction during which
self-reactive T cells are deleted, leaving a fully tolerant T cell repertoire (3, 64, 65).
15

1.2.1 Early T cell development in the thymic cortex
Thymus-resident T cell progenitors have no or only very limited self-renewing
potential; thus, in order to generate new T lymphocytes throughout life, a continuous
influx of bone marrow-derived hematopoietic progenitor cells from the blood is
required (66, 67). The entry of early thymic progenitor cells into the thymus, a
process that is thought to be a gated phenomenon, was suggested to happen
through high endothelial venules (HEV) that are located at the cortico-medullary
junction (68, 69). The mechanism of thymus homing is not completely understood,
however the involvement of different adhesion molecules (P-selectin, VCAM-1,
MadCAM-1, ICAM-1, laminin and fibronectin) and chemokines such as CXCL12,
CCL21 and CCL25 has been proposed (8, 70-76).
Classically, early T cell development is subdivided into four stages defined by the cell
surface markers CD25 and CD44 and location of the cell within the cortex (77). The
earliest T cell progenitors are found within the most immature subset of thymocyte
precursors, the double negative (DN) 1 cells that lack CD4 and CD8 expression.
Typically enriched in the perimedullary cortex, DN1 cells are characterized by the
surface expression of CD44 and CD117 and the absence of CD24 and CD25 (78).
Not yet being committed to the T cell lineage, Notch-1 was shown to provide a crucial
signal for T lineage specification as deletion of Notch-1 led to a complete block in T
cell development and ectopic differentiation of B cells in the thymus (79-82). The
requirement for Notch-1 signaling will not be lost until TCR rearrangement is
complete in later stages of development.
Lasting up to two weeks in the DN1 stage until progressing to the DN2 stage, DN1
cells have by far the longest single period of intrathymic residence during which they
expand by about 1000 fold (83, 84). The proliferation and survival of developing T
cells is absolutely dependent on interactions with thymic microenvironments. Even
though the molecular mechanisms involved are not fully understood, the Wnt
signaling pathway and Kit ligand (stem cell factor) seem to play a role in providing
signals for proliferation (85-87).
After this period of proliferation, cells differentiate into the more T cell-restricted DN2
stage that is marked by the up-regulation of CD25 and accompanied by migration
outwards into the inner cortex. Note worthy, it is here that recombination-activating
protein (RAG) gene expression is up-regulated for the first time and the first
16

rearrangements in the TCRγ/δ gene loci appear, whereas TCRα/β loci genes are still
not accessible at this stage leading to TCRγ/δ versus TCRα/β lineage divergence
(88). IL-7 has been shown to be essential for TCRγ/δ locus accessibility.
Furthermore, IL-7 is required for survival and expansion of DN2 cells, as has also
been shown for Kit ligand provided by cTEC (89-92).
The signals involved in emigration from the perimedullary cortex are largely obscure.
CXCR4 mutant lymphocytes have been found to be blocked at the DN1 stage as a
consequence of being unable to migrate into the central cortex (75). A prerequisite
for directional cell migration is not only a polarizing signal, but also a substrate for cell
adhesion. Much in contrast to conventional migration along an extracellular matrix,
DN2 cells “crawl” along the stromal matrix involving VCAM-1 and E-cadherin on
epithelial cells (73). It has been speculated that the need for direct interaction with
thymic stromal cells might represent an intrathymic feedback loop controlling the size
of the various differentiation stages of T cell development. Like DN1, DN2
thymocytes still retain the potential to develop into non-T cell lineages, i.e. DC and
NK cells; thus, Notch-1 signaling in DN2 cells triggered by its ligand Delta-like 4 on
cortical epithelial cells is indispensible for further T lineage specification (93, 94).
After a rather short residence time of about two days, DN2 cells precede their
maturation and migrate into the outer cortex, where they enter the again two days
lasting DN3 stage which is concurrent with the down-regulation of CD44 and CD117
and a low rate of cell cycling (83). Key events at this stage are the opening of the
TCRβ locus, presumably regulated by IL-7 signaling, and the recombination of the
germ line encoded VDJ segments of the TCRβ locus (95, 96). First D – J
rearrangements take place on both alleles and subsequently the recombined DJ
segments rearrange with the V segment forming the TCRβ chain. This second step
however strictly underlies the so-called “allelic exclusion”, meaning only one allele
will eventually complete TCRβ recombination (97, 98). Implicit in this process is the
formation of the pre-TCR, a complex consisting of a TCRβ chain, a pre-TCRα chain,
CD3δ, ε, γ and TCRζ, an event that is decisive for the fate of the individual cell (99,
100). Pre-TCR formation is a key process in T cell development and represents the
first checkpoint, known as β-selection, which ensures that only those T cells that
have successfully rearranged their TCRβ gene segments and hence express a fully
functional pre-TCR on their surface are permitted to survive and to undergo further
17

differentiation (101, 102). This is marked by proliferation, the up-regulation of the co-
receptors CD4 and CD8 and finally irreversible T lineage commitment (103-105) .
The transition from CD4/CD8 double negative to double positive immature T cells is
referred to as DN4 or pre-DP stage and coincides with the continued migration to the
outermost cortex, the subcapsular zone, which is critically dependent on CCL25
(106). It is here that rearrangement of the TCRα gene locus is initiated but only after
a massive expansion of those cells carrying a functional pre-TCR took place (107).
During the whole expansion phase, the Rag genes are turned off to prevent any
premature rearrangements of the TCRα locus. The enlargement of the precursor
pool makes sure that every TCRβ positive cell gives rise to numerous progeny cells,
each of which able to independently rearrange their α-chain, thereby increasing the
possibility to survive and more importantly the diversity of the α/β−T cell repertoire.
1.2.2 Positive selection
The second important checkpoint in T cell development, the so called positive
selection, is reached when DN cells become DP and ensures the generation of a
self-restricted TCR pool. Here for the first time the polarity of cell migration is
changed and DP cells migrate inwards towards the medulla (108). This
developmental stage is mainly characterized by the rearrangement of the TCRα-
locus and, albeit low level of TCRα-locus rearrangement is readily detected in DN4
cells, full-scale α-locus rearrangement does not take place until the DP T cell stage.
In contrast to β-selection that simply requires T cell intrinsic pre-TCR signaling,
positive selection is strictly dependent on TCR-pMHC interaction between T cells and
cTEC (109-111). Accordingly it is not sufficient to simply express a functional TCR
consisting of a successfully rearranged β- and α-chain, but to generate a TCR that
additionally recognizes self-peptide–MHC complexes (112). This phenomenon was
termed “recognition of self” and was first described in F1 bone marrow chimeras
revealing that T cells did only recognize antigen when presented by MHC of the
same type as the bone marrow recipient (113). Direct proof followed with the
generation of the first TCR transgenic mouse; T cells ectopically expressing a
18

rearranged TCR were only positively selected in a thymus of the same haplotype the
TCR originated from in the first place.
Intuitively one would expect that the possibility of a T cell receptor to recognize MHC
by chance is extremely low, therefore it was speculated that the TCR has developed
an inherent propensity to bind MHC (114). In support of this notion it was shown that
random combinations of TCR α and β chains or pre-positive selection TCR react with
a surprisingly high frequency with MHC (115-117). In the same line it was found by
studying the crystal structure of the TCR that the CDR1 and CDR2 loops encoded in
the V region showed an intrinsic specificity for MHC (118).
Despite this inherent specificity for MHC, the efficiency of generating a MHC-
restricted TCR is very low; thus, T cells are able to continuously rearrange their
TCRα-locus, which is structured in a way that allows for multiple rearrangements on
each allele, until they are positive selected. However, DP T cells have only a certain
amount of time, as they have a life span of only 3-4 days until they either have
generated the right TCR or die. Several factors, such as RORγ and TCF-1, have
been implicated in the regulation of survival during positive selection by up-regulating
the anti-apoptotic factor Bcl-XL (119-121). Notwithstanding all these mechanisms to
increase the possibility for a DP cell to be positively selected, most developing T cells
do not pass this checkpoint and die through “death by neglect” (Figure 3).
19

Figure 3 – T cell development. Early T cell development in the thymus proceeds along several distinct stages marked by the differential expression of CD44, CD117, CD25, CD4 and CD8. Essential factors for differentiation are depicted. Developing T cells are passing three major checkpoints, β-selection, positive selection and negative selection, at which they either die or further differentiate. Cortical thymic epithelial cells play a central role in positive selection. Presenting self-
peptide-MHC complexes to developing T cells, cTEC select those TCR fulfilling the
requirements for positive selection, thereby shaping the T cell repertoire towards self-
restriction. Considering the paradox that antigen recognition by DP T cells in the
cortex can lead to positive selection and survival while the very same event in the
medulla can trigger negative selection and cell death (see section on negative
selection below), it is of great interest to identify the decisive factor(s) leading to
these completely opposite outcomes.
20

One possibility implicates the T cell itself which might integrate signals differently
depending on its differentiation stage. Changes in gene expression pattern might not
only impinge on the acquisition of responses to new signals but also on the loss of
response to former signals. Indeed it was shown that the threshold to discriminate
between a strong and a weak engagement of the TCR is actively altered in DP T
cells as compared to mature T cells, whereby the latter completely lose their ability to
respond to weak TCR-binders implying an intrinsic regulation of T cell sensitivity
during development (122).The molecular mechanisms underlying this phenomenon
are largely unknown. It has been postulated that the signaling molecules proximal of
the TCR play a fundamental role by acting as signal integrators of activating and
inhibiting signals. Precisely, the TCR threshold is fine-tuned by constant inhibition via
dephosphorylation involving several phosphatases like SHP-2 and PTPN22, whereby
their quantitative alteration can either increase the threshold of activation or turn the
cell more sensitive to TCR engagement as in the case of DP T cells (123).
A different way to explain the paradox of positive selection was the affinity and avidity
models that were focusing on the TCR itself and its binding property to the pMHC
complex. Supporting this, it was found that very low concentrations of an antigenic
peptide could mediate survival and efficient positive selection, while high avidity
interactions promoted cell death in fetal thymic organ cultures (FTOC) (111, 124).
Whereas these studies are in support of the avidity model, others clearly speak in
favor of the affinity hypothesis by showing that positive selection requires pMHC
complexes with antagonist or partial agonist properties (125). Generally, whether the
selecting peptide was related or not, affinity studies supported the idea that the TCR
affinity for ligands mediating positive selection was much lower than for negative
selection.
Another mutually non-exclusive possibility was based on the assumption that
peptides presented in the cortex possess unique features that are required for
positive selection. This so-called “altered peptide hypothesis” suggests that there are
different ligands presented by cTEC as compared to those presented in the medulla
and in the periphery. Peptide elution studies, however, comparing cTEC and splenic
APC did not reveal any major differences in the ligandome of these two cell types
(126). In line with this, two other studies showed that even a drastically reduced
ligandome, using single-ligand mouse or an H-2DM deficient mouse, was able to
support the selection of a normal T-cell repertoire (127, 128). However, later it was
21
shown that positive selection by H-2DM-/- epithelium, bearing a limited peptide
spectrum, was reduced threefold in the absence of negative selection by DC (129).
Whereas most of these findings would rather argue against an altered peptide
hypothesis, several studies clearly speak in favor of it, all implying a differential
antigen processing in cTEC: It was found that the cTEC-specific endoprotease
Cathepsin L was critical for a normal CD4+ SP T cell compartment, presumably by
generating peptides for MHCII suitable for positive selection (130). Likewise,
inactivation of the thymus specific serine protease TSSP lead to decreased positive
selection of several transgenic TCRs (131). Furthermore, another study showed the
importance of macroautophagy, a peptide degradation process, in the selection of
the TCR repertoire as positive selection of several TCR transgenic T cells was
altered in autophagy-deficient thymi (132). There are also some indications for a
differential MHCI peptide generation in the cortex. Recently a cTEC-specific
proteasome was identified which was shown to be absolutely essential for normal
CD8 T cell development beyond the DP stage, again indicating a role for the
generation of “altered peptides” in the cortex (133).
1.2.3 CD4/CD8 lineage choice
The next important step immediately following positively selection is the so-called
CD4/CD8-lineage choice in which thymocytes either differentiate into MHCII-
restricted CD4 or MHCI-restricted CD8 single positive (SP) T cells. This decision-
making process, albeit not fully understood yet, has been subject of intense
investigations. Based on the fact that the extracellular domain of CD4 can only bind
to the invariant domain of MHCII and CD8 can only bind to MHCI, CD4 bearing T
cells recognize antigen exclusively in the context of MHCII and vice versa (134, 135).
Several classical and non-classical theoretical models have been proposed trying to
explain how the T cell is able to sense whether it is MHCII- or MHCI-restricted:
The classical models are either of stochastic or instructive nature and are built on the
assumption that the termination of one or the other co-receptor irreversibly defines
the lineage fate. While the stochastic selection model implies that CD4 or CD8
termination occurs randomly and thymocytes either receive a second TCR rescue
signal in case the right receptor was repressed or die (136, 137), the instructive
22

model suggests that the MHCII- and MHCI-restricted TCR signals are distinct from
one another, with respect to the signal strength (138). Another classical instructive
model is the duration-of-signal model which also comprises that the CD4/CD8
lineage decision requires qualitatively different signals, however not the signal
strength but the duration of the TCR signal determines the lineage choice (139).
Accordingly, TCR signals of long duration terminate CD8 expression while short TCR
signals terminate CD4 expression.
In the end all three models have been contradicted by experimental observations,
however the idea of the TCR signal duration as a major CD4/CD8 lineage
determinant remains still valid today and is the central feature of the kinetic signaling
model (140).
With the finding that positively selected TCR-signaled DP T cells terminate CD8
expression, it became clear that CD4+CD8low T cells are uncommitted and represent
the immediate precursor of CD8 and CD4 SP T cells (141, 142). Consequently,
MHCI-restricted signals are short natured whereas MHCII-restricted signals are long
natured. Based on this, the kinetic signaling model suggests a scenario in which the
T cell senses changes in TCR signaling after CD8 down-regulation; if the T cell is
MHCII-restricted and therefore CD4-dependent, the TCR signal will not alter after
termination of CD8 and the cell will be deviated into the CD4 SP lineage, however if
the T cell is MHCI-restricted and consequently dependent on CD8, the TCR signal
will be weaker without CD8 expression, signaling the cell to differentiate into the CD8
lineage.
Of central importance in the process of CD4/CD8 lineage choice are IL-7 as well as
several transcription factors. IL-7 was shown to be crucial for CD8 lineage choice as
blockade of IL-7R signaling abrogated the termination of CD4 transcription and up-
regulation of CD8 transcription and hence CD8 lineage commitment (143). Recently
a transcriptional network has been implicated in T lineage choice including the
transcription factors ThPOK (T-helper-inducing POZ/Krueppel-like factor) and
RUNX3 (Runt-related transcription factor). CD8 down-regulation is dependent on
ThPOK and further it prevents RUNX3 from silencing the CD4 locus (144, 145).
Moreover, TOX (Thymocyte selection-associated high mobility group box protein
TOX) has been found to be responsible for maintaining or up-regulating CD4
transcription in positively selected DP T cells and finally it was observed that GATA3
blocks CD8 lineage differentiation while promoting CD4 lineage choice (146-149).
23

Intense studies in the last years have shed much light on the process of CD4/CD8
lineage choice, however the exact sequence of events and the molecular players
involved still remain to be determined (Figure 4).
Figure 4 - Kinetic signaling model. Depicted are the three sequential steps in the CD4/CD8 lineage decision process. Surface molecules indicative of different maturation stages as well as factors necessary for CD4 or CD8 lineage choice are shown.
24

1.2.4 Central tolerance – a historical overview
Early concepts of immunity date back to the beginning of the 20th century and the
theory of Paul Ehrlich on antigen recognition. To enlighten the conundrum how the
body can respond to an enormously wide range of pathogens, he proposed the “side-
chain theory”. He believed that every naturally occurring antigen can be recognized
by at least one chemical side chain expressed on the surface of cells. A side chain
can form a link with the appropriate antigen which leads to the production of high
amounts of the very same chain and its secretion into the blood as an “antibody”.
Ehrlich´s selective theory of antibody production had soon been challenged by the
work of Karl Landsteiner and Merill Chase, showing that antibodies could be raised
against any chemical structure – even synthetic structures. Thus they introduced the
“template instructive hypothesis” that dominated the first half of the 20th century. The
common believe was that an antigen interacts with a globulin in the early stage of
globulin formation and thereby helps to form a mature globulin molecule specific for
the antigen. Even though this concept could explain how antibodies can be formed
against any synthetic structure, it failed to account for the rapid rise in antibody
production after immunization as well as the phenomenon of memory formation.
Niels Jerne, in 1955, dealt with this problem. He picked up Ehrlich´s initial ideas and
proposed the “natural selection theory” of antibody formation. According to his theory,
an antigen binds to an antibody by chance, and triggers replication of the very same
antibody (150).
Jerne´s selection theory paved the way for Frank Macfarlane Burnett´s “clonal
selection theory”, a seminal landmark modern immunology (150). While Jerne
considered the antibody as the replicating unit, Burnett for the first time positioned
the cell itself in the center of interest, being the replicating unit. According to this,
antibodies would function as cell surface receptors that can eventually bind to an
antigen, whereby the cell is activated and gives rise to numerous clones that
massively produce and secrete antibodies of the very same specificity. Consequently
the cell became the important unit being the selectable element in immunity. Burnett
also solved the problem of memory formation as well as affinity maturation
suggesting that mutations in the process of replication would eventually result in an
increased affinity to a particular antigen. Most importantly he proposed a model for
the phenomenon of tolerance, for which he together with Peter Medawar shared the
25

Nobel Prize for physiology and medicine in 1960 and which is, at least in part, still
valid today (151). He was convinced that as a consequence of random antibody
generation, the immune system had to be purged from auto-reactive cells during
embryogenesis and early after birth when the cells are exclusively exposed to self
antigens.
It took over 20 years and great advances in cellular and molecular immunology until
the paradigm of “developmental tolerance” was again disproven by the work of Nicole
Le Dourain and colleagues. They found that embryonic tissues from quail engrafted
into age-matched chickens were rejected soon after birth (152, 153) and importantly,
this graft rejection could be prevented by solely transplanting thymic rudiments from
the graft donor. This certainly highly unexpected finding revealed two important
points: first, it was not sufficient to simply “see” antigen during embryogenesis in
order to acquire self-tolerance and second, peripheral, tissue-specific tolerance was
established by pure thymic epithelium that was completely devoid of hematopoietic
cells. The mechanism of how thymic epithelium can induce tolerance to the whole
spectrum of peripheral antigens was still not understood at that time. However, a few
years later, in 1989 Linsk et al. proposed a model according to which the thymus
represents a patch quilt of ectopically expressed genes (154). Direct proof followed
with the finding that “promiscuous gene expression” (pGE) of tissue-restricted
antigens (TRA) was a specific attribute of medullary thymic epithelial cells (mTEC)
and that this phenomenon was largely regulated by AIRE (45, 46) and absolutely
crucial for central tolerance.
The mechanism of how self-reactive T cells are purged from the body became clear
in the middle of the 80s when B and T cell receptors were discovered and the first T
cell receptor transgenic mouse was generated, making it possible to follow and
visualize T cells during development (155). Self-reactive T cells were found to be
deleted upon antigen encounter in the thymus. However, in all these systems,
deletion was rarely complete raising the question whether there might be additional
mechanisms of tolerance.
The missing link was provided a few years later by the identification of a T cell subset
that was essential for the prevention of autoimmunity. Belonging to the CD4 T cell
lineage, these cells expressed the high affinity interleukin-2 receptor and functioned
by actively suppressing other potentially dangerous T cells (156-159). A new
26

mechanism of tolerance was finally established, termed dominant tolerance, which
should dominate the field of immunology ever since.
1.2.5 Negative selection Negative selection represents the third and last critical checkpoint during T cell
development and is operative in removing potentially dangerous self-reactive T cells. Even though Le Dourain most convincingly established the importance of the thymus
in central tolerance, the biological mechanism of how auto-reactive T cells are
rendered innocuous was only speculative. Two scenarios were favored, proposing
that potentially harmful T cells are either silenced by undergoing anergy or are
purged from the repertoire by clonal deletion. The outstanding work of Marrack et al.
finally shed more light on this issue by showing that T cells, that recognized antigen
in the thymus were eliminated, a finding that was clearly in support of the clonal
deletion model (160). It was found that T cells carrying the Vβ17a TCR chain were
deleted in animals expressing superantigens derived from the mouse mammary
tumor virus and presented in the context of I-E MHC molecules, while the same T
cells normally matured and migrated to the periphery in the absence of
superantigens. Moreover, it became clear that there are various superantigens (Mtv-
8,-9) depending on the mouse strain that are recognized by particular Vβ segments
(Vβ17a, Vβ5, Vβ11) (161, 162).
Later, the clonal deletion model was further validated in numerous TCR transgenic
mouse models expressing a receptor for a self antigen along with the self antigen. In
most of these systems the antigen was transgenically expressed (e.g. Hemagglutinin,
HA), in some others however TCR-transgenic mice were generated that recognized a
naturally expressed antigen (e.g. H-Y) (reviewed in (3)). These mice provided an
excellent tool for studying negative selection, with respect to the anatomical location,
the relevant APC and the molecular signaling events involved.
It has been a longstanding issue where and when self-reactive T cells are removed
from the thymus. Intuitively, the medulla is the likely site for negative selection, as it
provides the most complex ligandome. Unlike the cortex it is heavily colonized by
hematopoietic APC, presumably carrying all kinds of peripheral blood-born antigens
and furthermore, the medulla is composed of mTEC, providing a wide range of rare
27

tissue-restricted antigens. In the same line, clonal deletion most likely occurs rather
late in T cell development as DN T cells not yet express an intact TCR which is
prerequisite for negative selection. The problem appears, however, that the medulla
contains mainly mature T cells that are resistant to negative selection; nevertheless it
can be assumed that mature SP T cells upon migration to the medulla remain
susceptible to deletion for a certain time span. Indeed it was found that the medulla
contains a substantial fraction of semi-mature, HSAhigh CD4+ SP T cells that were still
sensitive to tolerance induction (163).
The process of negative selection was found to be remarkably efficient, as already
minute amounts of DC were sufficient to switch from no deletion to full scale deletion
of polyclonal T cells in an in vitro RTOC system (64, 164). Ligands inducing negative
selection are unlike positively selecting ligands highly stimulatory to mature T cells.
Thus negative selection of T cells is generally initiated by high affinity pMHC-TCR
interactions that induce strong signaling through the TCR, albeit TCR triggering alone
was shown to be insufficient for negative selection. Several co-stimulatory cell
surface molecules have been described to play a role in the induction of negative
selection; among these are CD28, CD5, CD43 and Fas (165, 166). In addition it was
found that mice deficient for the co-stimulatory receptor CD40 were also found to be
impaired in negative selection (167).
Even though the proximal TCR signaling events overall appear to be similar in
positive and negative selection, some molecules have been uniquely attributed to
negative selection (3). In particular the mitogen activated protein kinase (MAPK)
family members Jun N-terminal kinase (JNK) and p38 are central players in the
initiation of negative selection as deficiency in either one of these pathways leads to
defective induction of apoptosis in self-reactive T cells (168). Early TCR proximal
signaling events involved the adaptor protein Grb-2 which recruits the Ras-activator
SOS1 to the membrane and ultimately leads to the activation the JNK/p38 pathways
(168). Recently another important activator of the JNK/p38 kinases, the Misshapen-
Nck-interacting kinase-related kinase (MINK), has been identified to play a
fundamental role in negative selection (169). Its expression is highly regulated in T
cell development, being low in DN and strongly up-regulated in DP thymocytes.
Accordingly, knock down of MINK had no effect on positive selection, while it
specifically interfered with negative selection by crippling the apoptosis pathway
(170).
28
Apoptosis has a central function in tolerance induction by being essential for the
deletion of auto-reactive T cells. The executor molecules in this process are primarily
members of the Bcl-2 family, like BIM as well as Bax and Bak that are pro-apoptotic
family members. Accordingly, deficiency of BIM as well as combined deficiency of its
down-stream effectors Bax and Bak hampered negative selection (170, 171).
Furthermore, it was shown that BIM activation crucially depends on the JNK and p38
kinase pathways, whereby expression of BIM is directly regulated by the transcription
factor Nur77 which belongs to the orphan steroid receptor family. Interestingly, in
addition to its function as a transcription factor, Nur77 has been found to directly bind
to the anti-apoptotic factor Bcl-2, thereby converting it into a pro-apoptotic molecule.
Thus in the presence of Nur77, Bcl-2 is unable to inhibit BIM (172).
Taken together, negative selection involves several, in part synergistic events
including the activation of the JNK/p38 pathways by Grb-2 and MINK, which in turn
leads to the induction of the pro-apoptotic factors BIM, Bax and Bak. Furthermore,
besides activating BIM expression, Nur77 inhibits the anti-apoptotic molecule Bcl-2
ultimately leading to induced cell death which is the basis of negative selection.
1.2.6 Dominant tolerance - Regulatory T cells
Ever since its discovery, negative selection was proposed to be the ultimate
mechanism mediating central tolerance. However, in the middle of the 90s it became
clear that an additional branch exists, representing a yet unknown mode of tolerance,
the so-called dominant tolerance. This was based on the observation that the
process of negative selection in the thymus is incomplete as the normal immune
system harbors T cells that are self-reactive and even capable of inducing
autoimmune disease. Consistent with the notion that auto-reactive T cells are present
in the periphery, a subset of CD4+ T cells expressing the IL-2 high affinity receptor
CD25 was found to suppress the activation and expansion of these potentially
hazardous cells and therefore crucially contribute to the prevention of autoimmunity
(173).
Evidence for dominant tolerance came from experiments showing that neonatal
thymectomy between day 2 and 4 after birth led to severe autoimmunity (174, 175).
Soon after, more light was shed on this observation by identifying the regulatory cell
29

subset responsible for this phenomenon. Transfer of splenic T cells depleted of
CD4+CD25+ T cells and injected into athymic mice was shown to be sufficient to
induce autoimmune disease. Importantly the transfer of CD25+ together with CD25-
CD4+ T cells completely prevented disease development. Thus it was thereon
accepted that CD4+CD25+ regulatory T cells (Treg) are crucial mediators of tolerance
by keeping auto-reactive T cells under control (176).
Treg share many hallmarks with conventional activated T cells, e.g. CD25, PD-1,
GITR and CTLR-4, which makes their reliable identification very difficult. With the
discovery of the transcription factor Foxp3 (Forkhead Box protein P3) a true marker
and moreover a master regulator of Treg was finally found (177-179). Foxp3 was first
identified in the “scurfy” mouse mutant strain that suffered from severe autoimmune
manifestations that were caused by a complete lack of Treg. Detailed analysis
revealed that Foxp3 is essential for the development of Treg by amplifying already
established features of Treg precursors in the thymus and furthermore, it was shown
to be indispensible for the function and maintenance of Treg (180-182).
It is well established that the induction of autoimmunity is driven by the recognition of
self constituents by naive T cells in the periphery. In healthy animals these potentially
harmful T cells that have escaped negative selection in the thymus are controlled and
suppressed by Treg. This raised the question whether Treg might overlap with auto-
reactive T cells with respect to their TCR specificities, implying that Treg development
might also depend on tolerogenic interactions with self–antigens. Evidence for an
affinity model of Treg development came from TCR transgenic mouse models
showing that the expression of a cognate antigen in the thymus could lead to the
development of TCR transgenic Treg specific for the antigen (183, 184). Thus it was
believed that the increased affinity of a given TCR to a self-peptide-MHC complex
would favor the induction of Treg. In a polyclonal system the requirement of self-
peptide for Treg development is difficult to prove as it is not feasible to trace the fate of
individual T cells carrying a specific TCR. Studies analyzing the diversity of the TCR
repertoire, however, yielded some interesting insights concerning the TCR specificity
of Treg. Using a TCRβ transgenic mouse with a single copy of a TCRα minilocus, the
variability of the α-chain could be determined. Vα2-containing variable regions of the
naïve versus the regulatory thymic and peripheral T cell pool were sequenced and
compared to each other (185, 186). Strikingly, the repertoire of the two pools was
highly distinct and only partially overlapping whereas the diversity was comparable.
30

Of note, there was a high similarity between thymic and peripheral Treg as was the
case for thymic and peripheral naïve T cells, again suggesting that the majority of Treg
arise in the thymus.
TCR signaling is essential but not alone sufficient for the development of regulatory T
cells. Cytokine signaling and co-receptor signaling were found to crucially contribute
to this process. Studies interfering with cytokine signaling by either making use of a
common γ chain-deficient or a STAT5-deficient mouse revealed an importance of
these pathways for Treg generation (187-189). Attempts to nail down a particular
cytokine crucial for this process failed. Neither IL-2 nor IL-15 alone was required for
the generation of Treg in the thymus, albeit IL-2 was found to be essential for the
maintenance and survival of Treg in the periphery (187, 190). Thus it is currently
unknown whether a single cytokine or a combination of several common γ chain
cytokines, acting in a redundant manner, is essential for the development of Treg.
Furthermore, interference with TGFβ signaling demonstrated a requirement of TGFβ
in the first wave of Treg induction, a requirement that is later compensated for by IL-2
(191). Finally CD28-B7 signaling plays a central role for the development of Treg.
CD28-deficient mice have a strongly reduced Treg compartment in the thymus which
was not a consequence of a lack of soluble factors like IL-2 but of a defective in the T
cell intrinsic program induced by CD28 itself (192, 193).
In summary, the initiative step in Treg development seems to be high affinity
interactions with self-peptide-MHC complexes, whereby cytokines and co-receptor
signaling support this differentiation process. How Treg are rescued from negative
selection and what particular features of APC are needed for Treg induction is still
poorly understood. A recent study was addressing this question and found that Treg
differentiation does not require a particular APC but instead underlies an intrinsically
regulated mechanism whereas the capacity to differentiate into Treg inversely
correlates with the maturation status of the T cell (194). However, if there is an
optimal window of avidity that favors Treg induction which is lower than the avidity
required for negative selection is still unknown and will be a prospect of this study.
31

1.2.7 Antigen presentation in the medulla
To understand how central tolerance is maintained and how different modes of
tolerance are induced, it is indispensable to get a detailed picture of the different APC
in the medulla and their specific properties regarding antigen presentation. Tolerance
induction occurs mainly in the medulla which consists of two types of APC, namely
mTEC and DC. DC are a rather heterogeneous population containing CD11cint
plasmacytoid DC (pDC) and CD11chigh conventional DC (cDC) that can be further
subdivided according to SIRPα expression (195). SIRPα- cDC were found to
originate in the thymus, while about one third of cDC, characterized by the presence
of SIRPα, are immigrants from peripheral sites (196-198). Of note, pDC are also
highly abundant in the thymus, however, their function has yet to be established.
In general DC in the thymus were unambiguously shown to be of central importance
for tolerance induction (199, 200). Accordingly, DC-deficient mice developed
multiorgan autoimmune disease and moreover diminished negative selection of bulk
polyclonal CD4+SP T cells was observed in mice deficient of antigen presentation by
DC (201, 202). In addition to that, an indispensible role of DC in negative selection
was also confirmed in a TCR-transgenic mouse models of deletion (203). Another
remarkable feature of DC in the thymus is their ability to efficiently take up and
present extracellular antigens (204-206). Consistent with this notion, it was found that
a neo-self antigen that was expressed only by mTEC could lead to the deletion of T
cells carrying the respective TCR in a DC-dependant manner (203). More
importantly, even TRA expressed by mTEC were shown to be transferred to and
presented by DC in the thymus (207). In contrast to previous assumptions, terminally
differentiated mTEC, possibly through the proapoptotic function of AIRE, have a very
high turn over rate of 1 – 2 weeks (34, 208). Considering the fact that only about 1-
3% of mTEC express a given TRA, dying mTEC may therefore substantially
contribute to antigen spreading to DC which might be a mechanism to increase the
efficacy of tolerance induction (209).
The central question therefore is whether mTEC solely serve as an antigen reservoir
which would support a “division of labor” model of tolerance induction by DC and
mTEC or whether mTEC themselves have a function as antigen presenters. Several
observations, however, strongly speak in favor of an autonomous role of mTEC as
APC.
32
First, mTEC are besides cTEC the only non-hematopoietic cells that constitutively
express MHCII and a range of co-stimulatory molecules such as CD80 upon
maturation, therefore being perfectly equipped for tolerance induction (209). Second,
it was recently shown that developing T cells in the medulla engage multiple short-
lived interactions with APC, thereby probably thoroughly scanning their environment
for self antigens (210). Thus, despite the relatively low percentage of mTEC
expressing a given TRA, it would still be feasible that mTEC themselves induce
tolerance, considering the long residence time of 4 – 5 days until CD4+ SP T cells
leave the medulla. Third, mTEC have been shown to be poor in antigen uptake from
the extracellular space, indicating that they probably focus on their intracellular milieu
for antigen presentation and in that way presumably enhance tolerance induction to
TRA (205). Interestingly it was found that mTEC indeed use an unconventional
MHCII loading pathway termed macroautophagy. In this study it was proposed that
macroautophagy is shaping the CD4 T cell repertoire by biasing the MHCII
ligandome of mTEC on their intracellular compartment. Consistent with this
assumption, macroautophagy-deficient mice developed severe autoimmune disease
(132). Forth, Gallegos et al. convincingly proved that mTEC autonomously induced
the deletion of CD8+ T cells specific for a neo-self antigen that was expressed in a
promiscuous fashion (203). Moreover, in support of an independent role of mTEC as
APC it was shown that mTEC-specific expression of hemagglutinin (HA) led to the
induction of HA-specific CD4+ Treg in a cell autonomous, DC-independent manner
(62). These results, however, have to be interpreted with caution. Recently it was
found that even intact peptide-MHC (pMHC) complexes can be transferred from
mTEC to DC (207, 211), which was never taken into account when MHC-deficient
bone marrow chimeras were used to prove the autonomous role of mTEC in
tolerance induction.
Collectively, in addition to antigen presentation by mTEC themselves, antigens can
efficiently spread in the thymic medulla, whereby mTEC-derived self antigens may be
transferred to and presented by DC. This process does not only seem to involve
conventional pathways of antigen spreading but also the intercellular transfer of
functional MHC molecules and other TEC-specific membrane proteins. Finally
antigen presentation by mTEC and DC might not differ with respect to the mode of
tolerance that is induced but with respect to the selection of antigens that are
33

presented by a particular APC, e.g. TRA, soluble or peripheral antigens, thereby
autonomously shaping the TCR repertoire (Figure 5).
Figure 5 - Antigen presentation by medullary APC. This is a model of how self-reactive T cells might recognize antigen in the medulla. Tissue restricted antigens (TRA) are produced by mTEC in an AIRE–dependent manner and subsequently loaded on MHC molecules which might be enhanced by macroautophagy. Furthermore, TRA can also be transferred to and presented by DC, thereby possibly increasing the efficiency of tolerance induction to rare tissue restricted antigens. In addition, migratory DC might provide antigen from peripheral sites.
34

2. AIM OF THE STUDY
The ectopic transcription of thousands of tissue restricted antigens (TRA) is a
fundamental hallmark of medullary thymic epithelial cells (mTEC) and is
indispensable for tolerance induction in the thymus (33, 45). This phenomenon,
termed promiscuous gene expression (pGE), is largely controlled by the autoimmune
regulator (AIRE) and genetic ablation of AIRE has been shown to lead to multi-organ
autoimmune disease. Thus, mTEC inarguably represent an essential source of
peripheral tissue antigens for central tolerance. However, it is less clear whether
mTEC, beside antigen production, also serve an important role in antigen
presentation and direct tolerance induction of T cells, in particular for CD4+ T cell
tolerance.
Aim of this study was to address this issue by interfering with MHCII-restricted
antigen presentation directly and only in mTEC. In order to do so we chose an RNA
interference (RNAi) approach to tissue-specifically knock-down the Class 2
transactivator (C2TA), the master regulator of MHCII expression. Selecting C2TA
instead of directly targeting MHCII enabled us to study antigen presentation by
mTEC irrespective of the mouse background. In this model we aimed to assess the
consequence of impaired antigen presentation by mTEC on tolerance induction of
polyclonal as well as of TCR-transgenic CD4+ T cells.
35

3. RESULTS
3.1 Cloning and in vitro evaluation of C2TA-designer miRNA
It has been previously published that a short hairpin that is integrated into the human
miRNA30 backbone can be used to obtain knock-down of any gene of interest (212).
Importantly, in contrast to conventional short hairpins, transcription was strictly
dependent on Polymerase II, which enables tissue-specific knock-down of the gene.
We took advantage of this new approach and generated five predicted designer
miRNA against C2TA, the master-regulator of MHCII expression. In order to identify
functional miRNA30-based C2TAsh constructs, the MHCII+ B cell line WEHI279.1
was infected with a retroviral vector expressing the different C2TAsh constructs and
MHCII down-regulation of stable B cell clones was monitored. Figure 6A shows the
most potent C2TAsh construct that was henceforth used in all experiments.
C2TAsh#6 most strongly down-modulated MHCII mRNA expression (Figure 6B) and
protein level (Figure 6C).
The functional consequence of MHCII down-modulation was tested via an antigen
presenation assay using the A5 T cell hybridoma expressing the clonotypic TCR
specific for HA(107-119) and GFP under the contol of IL-2 promoter elements. The
results revealed a more than five fold difference in T cell stimulation capacity of
C2TA knock-down B cells as compared to control-infected B cells when increasing
amounts of petide were added to the co-cultures (Figure 6D).
A
36

D B
igure 6 – Determination of knock-down efficiency of C2TA-specific designer
C
FmiRNA in vitro. (A) Scheme of the retroviral vector (LMP) containing the C2TAsh#6. The LMP vector used for screening of C2TAsh constructs contained 5´ and 3´ regions of the primary human miRNA30 as well as the selection marker puromycin and GFP. (B) Quantitative analysis of MHCII mRNA of control and C2TAsh#6 infected B cells using real time PCR (n=3). (C) Quantification of MHCII protein levels of control and C2TAsh#6 infected B cells by FACS and western blot analysis (n=3). (D) Assessment of antigen presentation capacity. Control or C2TAsh#6 infected B cells were co-cultured with A5 hybridoma T cells in the presence of increasing amounts of HA peptide. After 19h GFP expression of hybridoma T cells was determined by FACS analysis.
37

3.2 Generation of mTEC-specific C2TA knockdown mouse
o address the role of antigen presentation by mTEC in tolerance induction of CD4+
attern of the miRNA30-C2TAsh#6 transgene was analyzed. To
ntify the impact of the miRNA30-C2TAsh#6 transgene
T
T cells, we generated an mTEC-specific C2TA knock-down mouse (C2TAkd). A
bacterial artificial chromosome transgenic construct containing 152kb upstream and
58kb downstream flanking regions of AIRE was cloned, in which the AIRE start
codon was replaced by an open reading frame encoding the miRNA30-C2TAsh#6
construct (Figure 7A). Pronuclear injection of fertilized eggs resulted in the
generation of two founder lines, both showing similar phenotypes in preliminary
analyses (data not shown). One founder, termed C2TAkd, was used to perform all
further experiments.
First the expression p
this end, various thymic stromal cell subsets were purified from C2TAkd animals and
relative expression was determined using a custom small RNATaqMan assay.
Expression of the C2TAmiRNA was exclusively restricted to mTEC, whereby
CD80hiAIRE+ mTEC (mTEChi AIRE+) showed the highest level of the C2TA miRNA,
followed by CD80hiAIRE- mTEC (mTEC AIRE-)(Figure 7B). Signals derived from
cTEC as well as DC were below the sensitivity of the assay. These data established
that the transgene was faithfully expressed, mirroring the endogenous AIRE
expression (Figure 7C).
Next we aimed to qua
expression on C2TA as well as on MHCII mRNA levels in all mTEC subsets. MHCII
expression was strongly down-regulated in CD80hiAIRE+ mTEC (mTEChi AIRE+) and
to lesser extend in CD80hiAIRE- mTEC (mTEChi AIRE-) and CD80- mTEC (mTEClo).
The same was found for C2TA expression itself, although the degree of down-
modulation was lower, implying that both translational and transcriptional silencing of
C2TA was induced by the C2TA miRNA (Figure 7D). Importantly, MHCI expression
which was shown to be slightly activated by C2TA (213, 214) was not altered in
C2TAkd animals as compared to WT. The results confirmed highly specific and
efficient C2TA knockdown in C2TAkd mice, being exclusively restricted to mTEC and
most distinct in mature mTEC.
38

A
B C
D
D
39

Figure 7 – Generation of C2TAkd mouse and analysis of transgene expression. (A) Schematic illustration of transgenic construct. The scheme shows the bacterial artificial chromosome construct containing 152kb upstream and 58kb downstream of the transcriptional start site of AIRE. The AIRE start codon is replaced by an open reading frame encoding the microRNA30-C2TAsh#6 construct cloned downstream of the β globin intron. (B) Expression analysis of the C2TA miRNA. Quantification of the C2TA miRNA in different stromal cell types (mTEChiAIRE+, mTEChiAIRE-, mTEClo, cTEC and DC) isolated from 2-3-weeks-old C2TAkd mice is depicted in the graph (n=3). (C) The graph shows the relative expression of AIRE mRNA in mTEChiAIRE+, mTEChiAIRE-, mTEClo and DC from 5 weeks old C2TAkd animals (n=3). (D) Determination of knockdown efficiency. C2TA mRNA levels in mTEChiAIRE+, mTEChiAIRE-, mTEClo from 5-weeks-old C2TAkd mice compared to WT was determined by real time PCR. Relative MHCII and MHCI expression in mTEChiAIRE+, mTEChiAIRE-, mTEClo form 5-weeks-old C2TAkd and WT animals is depicted in the graph (n=3).
3.3 C2TAkd mice show highly specific and efficient down-modulation of MHCII
Next the efficiency and tissue specificity of MHCII protein down-regulation in C2TAkd
animals was assessed. Western blot analysis of highly purified thymic stromal cell
populations confirmed a strong reduction of MHCII on the protein level in mature
C2TAkd mTEC (mTEChi), whereas no alteration was seen in C2TAkd DC. Immature
mTEC (mTEClo) isolated from C2TAkd mice were also found to reduce MHCII protein
levels as compared to WT. Calculations of the relative changes in MHCII protein
levels showed a more than tenfold reduction of MHCII in mature mTEC (Figure 8A).
In addition to that, we performed flow cytometric analysis of MHCII of all major thymic
stromal cell subsets, namely Sirpα- and Sirpα+ cDC, pDC, cTEC, immature and
mature mTEC. The results revealed a remarkable reduction of MHCII protein
exclusively in mTEC of C2TAkd animals but not in any other stromal cell types
analyzed (Figure 8B).
40

A
B
Figure 8 – Determination of C2TA knock-down efficiency and specificity in C2TAkd mice. (A) Immature CD80lo and mature CD80hi mTEC as well as DC were purified from thymic stroma of 5–6-weeks-old WT or C2TAkd mice. Knockdown specificity and efficiency was assessed by western blot analysis of MHCII (upper left) (n=2). Relative quantification of MHCII protein level is depicted in the upper right panel. (B) MHCII expression by different thymic stroma cell populations of WT, C2TAkd and C2TA-/-thymi was determined by FACS analysis (n=3).
41

3.4 Diminished MHCII expression does not affect thymus integrity
A recent study proposed a crucial role of MHCII in mTEC development or
maintenance (43). Therefore we carefully analyzed the overall integrity of C2TAkd
thymi by staining sections with different TEC markers (Figure 9). Medullae as well as
cortico-medullary junctions were properly formed in C2TAkd animals. Similarly,
AIRE+ mature mTEC were also normally abundant. MHCII stainings of WT thymi
showed a strong positive signal in the medulla which is in accordance with an earlier
study that reported a predominance of mTEC-derived cytoplasmatic MHCII signal in
the thymic medulla (215). By contrast, C2TAkd sections stained only weakly for
MHCII, whereby residual MHCII expression most likely derived from DC.
C2TAkd
MHCII
AIRE/K5
K5/K8
WT
42

Figure 9 – Examination of medulla-cortex formation in C2TAkd mice. Depicted are stainings of cryosections from thymi of 6-weeks-old WT and C2TAkd mice for Keratin 5 (K5, green) and Keratin 8 (K8, red) to identify medulla and cortex (upper row). Middle and bottom rows show in situ detection of AIRE+ (red) or MHCII+ (red) cells in WT versus C2TAkd medullary areas (K5, green) (n=3). Scale bars are indicated. 3.5 Normal mTEC development in C2TAkd animals Detailed flow cytometric analysis revealed no changes in the composition of mTEC
subpopulations. About one fourth of all WT as well as C2TAkd mTEC expressed
AIRE (24.2 ± 4.6 (n = 25) versus 22.2 ± 4 (n = 11); P = 0.19), the same hold true for
CD80, albeit expression was slightly reduced in C2TAkd mTEC as compared to WT
controls (60.8 ± 7 (n = 33) versus 55.8 ± 5 (n = 22); P = 0.004) (Figure 10A and 10B).
Overall, mTEC development did not seem to be affected in C2TAkd mice, which
therefore indicates a negligible role of MHCII in this process.
To test the antigen presentation ability of C2TAkd and WT mice, mTEC were sorted
and co-cultured with A5 GFP reporter hybridoma T cells recognizing HA(107-119) in
the context of I-Ed. C2TAkd mTEC required at least ten times more peptide in order
to have the same stimulatory effect on T cells as WT mTEC (Figure 10C). Taken
together these results established that mTEC development and maintenance is
normal in C2TAkd mice, while antigen presentation capacity is strongly diminished.
A C
B
43

Figure 10 - Characterization of mTEC properties in C2TAkd mice. (A) The plots olated from 5–6-weeks-old WT or C2TAkd animals for
MHCII and CD80. (B) The histograms show Aire-GFP expression in mTEC of WT x Aire-GFP and C2TAkd x Aire-GFP mice as well as Aire protein quantification of C2TAkd mTEC versus WT mTEC by WB analysis. Numbers indicate the average frequency (± s.d.) of cells within the gates. (C) Antigen presentation capacity of C2TAkd mTEC. Ex-vivo isolated mTEC from WT or C2TAkd animals were co-cultured with A5 hybridoma T cells in the presence of increasing amounts of HA peptide. After 19h GFP expression of hybridoma T cells was determined by FACS
is. 3.6 Defective negative selection of polyclonal CD4+ SP T cells in C2TAkd mice
order to assess the co equence of diminished MHCII expression in mTEC on
tolerance induction of CD4 T cells, bulk T cell development was analyzed. The CD4
and CD8 profile of C2TAkd thymi revealed a significant increase in the CD4+ SP T
cell compartment (9.0 ± 1.7 (n = 10) versus 12.1 ± 1.7 (n = 9); P = 0.001) while the
CD8+ SP T cell compartment was essentially unaltered compared to WT thymi
(Figure 11). These observations are reminiscent of earlier studies investigating the
role of DC in negative selection and showing that the absence of antigen
presentation by DC resulted in an enlarged CD4+ SP compartment, presumably due
to reduced deletion of auto-reactive T cells (201, 202). Accordingly, our results
support the notion that mTEC play a non-redundant role as antigen presenting cells
(APC) in negative selection of CD4+ T cells.
depict stainings of mTEC is
analys
In ns+
44

Figure 11 – Selection of CD4+ and CD8+ T cells in C2TAkd thymi. CD4 and CD8
stainings of thymocytes from 5-months-old WT and C2TAkd mice (left panel) (n=9). Average percentages of CD4 positive cells are indicated (± s.d.). The bar diagram depicts the relative distribution of different thymic T cell subsets of WT and C2TAkd mice respectively (right panel). P values are indicated. 3.7 A non-redundant role of mTEC and DC in negative selection
To address the contribution of DC versus mTEC in CD4 T cell tolerance induction in
re generated. Irradiated WT recipients
the thymus. Likewise, to ascertain the impact of antigen presentation by mTEC,
ntly also imply that these cells have an
uto-reactive potential. To test this hypothesis, an in vitro proliferation assay was
erformed using peripheral lymph node (LN) DC from WT animals as APC and CD4+
SP T cells from the above described bone marrow chimeras as responders. The
results demonstrated that CD4+ SP T cells derived from thymi either devoid of
antigen presentation by DC or mTEC or both contain a fraction of cells recognizing
self-peptide MHC complexes (Figure 12B). Of note, again an additive effect was
observed when both, DC and mTEC were unable to present antigen.
Importantly, we did not find any significant changes in Treg development with respect
to the overall size of the Foxp3+ compartment (Figure 12C). However, it is still
repertoire of the Treg pool might be altered and some TCR
specificities might therefore be missing in C2TAkd mice.
detail, different bone marrow chimeras we
were reconstituted with MHCII-/- bm resulting in the inability of DC to present antigen
in
irradiated C2TAkd recipients were reconstituted with WT bone marrow. In both types
of chimeras, an enlargement of the CD4+ SP T cell compartment could be observed
(8.5 ± 0.3 (n = 9) versus 12.1 ± 0.1 (n = 7), P = 0.0006 and 8.5 ± 0.3 (n = 9) versus
10.3 ± 0.3 (n = 10), P = 0.002) (Figure 12A). Importantly, an additive effect was found
when both DC and mTEC were unable to present antigen to CD4+ T cells in C2TAkd
animals that were reconstituted with MHCII-/- bone marrow (12.1 ± 0.1 (n = 7) versus
15.2 ± 0.7 (n = 9), P = 0.01). Taken together, these observations speak in favor of a
non-redundant role of both DC and mTEC in negative selection by autonomous
presentation of antigens to CD4+ T cells.
The assumption that the increased proportion of CD4+ SP T cells is caused by
defective negative selection would conseque
a
p
possible that the TCR
45

A
B C
Figure 12 – CD4+ T cell selection by DC versus mTEC. (A) CD4+ T cell development in WT or C2TAkd recipients of WT or MHCII-/- bone marrow. The plots depict CD4 and CD8 profiles of WT or C2TAkd animals reconstituted with WT bone marrow and analyzed 6 weeks later (upper left panel). Lower left panel, WT or C2TAkd animals reconstituted with MHCII-/- bone marrow. Average percentages of CD4+ SP T cells are shown (± SEM). The bar diagram in the upper right panel shows the percentages of CD4+ T cells versus CD8+ T cells in the four different bone marrow chimeras (P values are indicated). (B) Self-reactive potential of CD4+ SP T cells that developed in the absence of antigen presentation by DC or mTEC or both. H3 thymidin incorporation of CD4+ SP T cells isolated from the four different combinations of bone marrow chimeras 6 weeks after reconstitution (see A) and cultivated with WT lymph node DC for 4 days is shown. (C) Unaltered percentage of Treg. The graph depicts percentages of CD4+ Foxp3+ T cells in WT or C2TAkd recipients reconstituted with either WT or MHCII-/- bone marrow (P = n.s.).
46

3.8 Impaired negative selection of Ovalbumin-specific T cells Next we aimed to directly address the role of antigen presentation by mTEC in
negative selection versus Treg development by taking advantage of a TCR transgenic
approach which would enable us to study tolerance induction of T cells with known
specificity. We used a previously described model system in which mTEC-specific
expression of Ovalbumin (Ova) in AIRE-HCO mice led to massive deletion of Ova-
specific T cells (DO11.10) (62, 194). In the absence of Ova, DO11.10 transgenic T
cells were normally selected and represented the majority of naïve CD4+ SP T cells
in WT as well as in C2TAkd thymi (69.4 ± 6.7 (n = 10) versus 73.5 ± 5.4 (n = 10); P =
0.14) (Figure 13A). In the presence of cognate antigen in AIRE-HCO x DO11.10
nimals a large proportion of DO11.10+ T cells was lost. Importantly, the deletion of
DO11.10+ T cells was nearly reversed when mTEC were impaired to present the
cognate antigen in C2TAkd x AIRE-HCO x DO11.10 mice (24.1 ± 6.2 (n = 12) versus
53.2 ± 10 (n = 14); P = 4 × 10⁻⁹) (Figure 13A and 13B).
To exclude the possibility that altered HCO expression in C2TAkd mice might have
led to the impaired deletion of DO11.10+ T cells, expression analysis of HCO in WT
versus C2TAkd mice was performed. Results clearly showed comparable HCO levels
in C2TAkd x AIRE-HCO and AIRE-HCO thymi (Figure 13C).
a
A
47

48
B C
Figure 13 – Reduced negative selection of DO11.10+ T cells in DO11.10 × AIRE-HCO × C2TAkd mice. (A) Altered deletion in DO11.10 × AIRE-HCO × C2TAkd mice. The plots depict CD4 and CD8 stainings of thymocytes of 6-weeks-old DO11.10 and
C2TAkd mice (upper left) or DO11.10 x AIRE-HCO and DO11.10 x AIRE-CO x C2TAkd (upper right) mice. In the respective histograms below CD4+ SP T
cells stained for DO11.10 are shown. Numbers indicate the average frequency (± s.d.) of cells within these areas. (B) The diagram depicts the percentage of DO11.10+ cells of CD4+ SP T cells of DO11.10, DO11.10 × AIRE-HCO and DO11.10 × AIRE-HCO × C2TAkd mice (P values are shown). (C) Quantification of HCO-expression. Quantification of relative HCO expression in CD80hi and CD80lo mTEC as well as DC isolated from AIRE-HCO or AIRE-HCO x C2TAkd animals is depicted in the graph.
DO11.10 x H

49
3.9 Enhanced induction of DO11.10+ T C2TAkd mice
While DO11.10 single-transgenic T cells developed into naïve CD4+ SP T cells, the
same cells were strongly deleted in the presence of cognate antigen. The remaining
cells were found to contain a substantial fraction of Ova-specific Treg, identified by the
expression of Foxp3. Therefore we sought to ascertain the consequence of
diminished antigen presentation by mTEC on Treg development. Interestingly,
C2TAkd × DO11.10 × AIRE-HCO animals, beside diminished deletion of Ova-specific
T cells, were found to exhibit a significant increase in the % of Foxp3+ DO11.10+
CD4+ SP T cells (5.2 ± 2.1, n = 11 versus 14.3 ± 2.4, n = 13; P = 1.5 x 10⁻⁹) (Figure
14A). This was also reflected in the absolute cell numbers of Ova-specific Treg (Figure
14B).
Together we showed that the reduced presentation of HCO by down-modulation of
HCII on mTEC diminished deletion and at the same time favored Treg induction of
. Our observations would be in accordance of an avidity model
of tolerance induction, whereby the threshold for negative selection lies above the
reg in
M
HCO-specific T cells
optimal avidity window for Treg induction.
A
B
Figure 14 – Increased selection of Treg in DO11.10 x AIRE-HCO x C2TAkd mice. ) Increased percentage of Ova-specific Treg in DO11.10 x AIRE-HCO x C2TAkd
lude the possibility that the above described findings were just a particular
cells in WT as well as in C2TAkd animals
(Figure 15A) (29.7 ± 4.2 (n = 7) versus 32.5 ± 2.8 (n = 8), P = 0.17), HA-specific T
cells were deleted in AIRE-HA mice that expressed HA exclusively in mTEC (Figure
15A). Importantly, interfering with antigen presentation by mTEC, C2TAkd × TCR-HA
× AIRE-HA animals exhibited reduced deletion of HA-specific T cells (5.9 ± 2.2 (n =
6) versus 14.5 ± 4.9 (n = 14), P = 5 x 10⁻⁵) which is in line with the results obtained by
the DO11.10 model (Figure 15A and B).
Reminiscent of the DO11.10 system, Treg development was also affected, being
strongly increased in C2TAkd × AIRE-HA × TCR-HA mice with respect to
percentages (2.9 ± 0.5 (n = 6) versus 7.9 ± 3.4 (n = 14), P = 9 x 10⁻⁵) as well as
absolute cell numbers of HA-specific Treg (Figure 15C and D).
Similar results were obtained using a system in which HA was ubiquitously
expressed (Pgk-HA) (Figure 16A-C) (216).
(Amice. Depicted are CD4+ SP T cells of DO11.10, DO11.10 x AIRE-HCO or DO11.10 x AIRE-HCO x C2TAkd mice stained for Foxp3 and DO11.10. The average percentages of Foxp3+ DO11.10+ T cells are shown (± SEM). (B) The diagrams depict the absolute numbers of Foxp3+ DO11.10+ and Foxp3- DO11.10+ T cells of DO11.10, DO11.10 x AIRE-HCO or DO11.10 x AIRE-HCO x C2TAkd mice (P values are indicated).
3.10 Impaired deletion and enhanced Treg induction of HA-specific T cells
To exc
attribute of the DO11.10 TCR, a second TCR transgenic mouse model was tested.
As previously described by our lab, Hemagglutinin (HA) expression by mTEC led to
partial deletion and concomitant Treg induction of TCR-HA transgenic T cells (62).
While TCR-HA single transgenic T cells normally developed into naïve T cells and
composed roughly 30% of all CD4+ SP T
50

51
A
B C
D

Figure 15 – Altered selection of HA-specific T cells in TCR-HA × AIRE-HA × C2TAkd mice. (A) Diminished deletion in TCR-HA × AIRE-HA × C2TAkd mice. Histograms depict staining of CD4+ SP T cells for TCR-HA from either 6-weeks-old TCR-HA and TCR-HA × C2TAkd mice (lower left panel) or TCR-HA × AIRE-HA and TCR-HA × AIRE-HA × C2TAkd mice (lower right panel). The respective CD4 and CD8 profiles are shown above (upper row). Numbers indicate the average frequency (± s.d.) of cells within these areas. (B) The graph displays the percentages of TCR-HA+ cells of CD4+ SP T cells of individual TCR-HA, TCR-HA × AIRE-HA and TCR-HA × AIRE-HA × C2TAkd animals. P values are indicated. (C) Enhanced Treg induction in TCR-HA × AIRE-HA × C2TAkd mice. The plots depict TCR-HA versus Foxp3 stainings of CD4+ SP T cells from TCR-HA (left) and TCR-HA × AIRE-HA or TCR-HA × AIRE-HA × C2TAkd thymi. Numbers indicate the average frequency (± s.d.) of cells within these areas. (D) Absolute cell numbers of HA-specific Treg (left) and naïve T cells (right) from TCR-HA, TCR-HA × AIRE and TCR-HA × AIRE-HA × C2TAkd
e shown in the graph, P lues are indicated. animals ar va
52

Figure 16 - Altered selection of HA-specific T cells in TCR-HA × Pgk-HA × C2TAkd mice. (A) Diminished deletion in TCR-HA × Pgk-HA × C2TAkd mice. The plots depict stainings of thymocytes of 6-week-old TCR-HA × Pgk-HA or TCR-HA × Pgk-HA × C2TAkd mice for CD4 and CD8 (upper row). The respective histograms below show stainings of CD4+ SP T cells from TCR-HA × Pgk-HA and TCR-HA × Pgk-HA × C2TAkd mice for TCR-HA (lower row). Numbers indicate the average frequency (± s.d.) of cells within these areas. (B) The percentages of TCR-HA+ cells of CD4+ SP T cells of individual TCR-HA, TCR-HA × Pgk-HA and TCR-HA × Pgk-HA × C2TAkd animals are shown in the graph. P values are indicated. (C) Increased Treg induction in TCR-HA × Pgk-HA × C2TAkd mice. CD4+ SP T cells form TCR-HA and TCR-HA × Pgk-HA or TCR-HA × Pgk-HA × C2TAkd mice were stained for TCR-HA and Foxp3. Numbers indicate the average frequency of cells within these areas (± s.d.).
A
B C
53

3.11 Dendritic cells are dispensable for the deletion and Treg induction of Ova- specific T cells Our observations clearly suggest an autonomous role of mTEC in CD4 T cell
tolerance not only as antigen producer but also as antigen presenter. However,
considering the recent finding that intact peptide-MHC complexes can be efficiently
transferred to and presented by DC, an alternative explanation needed to be
considered (207, 211). Accordingly, the altered selection of CD4+ T cells might as
well be a secondary effect of the C2TA knock-down and might be a consequence of
diminished pMHC complex transfer to DC.
Thus we aimed to address this issue and ascertain the role of DC in the two TCR-
ed, by removing DC from the system. To this end, we took
antage of mice that expressed diphtheria toxin A (DTA) under the control of a
loxP-flanked neomycin resistance (neoR) cassette from the ROSA26 locus and
crossed them to CD11c-Cre mice leading to the physical ablation of DC (ΔDC) (201).
To ascertain the contribution of DC to tolerance induction in DO11.10 × AIRE-HCO
mice, AIRE-HCO or AIRE-HCO × C2TAkd animals were reconstituted with DO11.10
or DO11.10 × ΔDC bone marrow. While DO11.10+ T cells were normally selected in
WT animals reconstituted with DO11.10+ bone marrow, DO11.10+ T cells were
deleted in recipients expressing Ova in mTEC (83.0 ± 4.1 (n = 3) versus 37.7 ± 8.5 (n
= 8), P = 3 x 10⁻⁶) (Figure 17A). Importantly, deletion was not affected in AIRE-HCO
mice that were devoid of DC (37.7 ± 8.5 (n = 8) versus 24.67 ± 15.4 (n = 8), P = 0.6)
plying a redundant role of DC in the deletion of Ova-specific T cells (Figure 17A).
system in the absence of DC (Figure 18).
transgenic models us
adv
im
In contrast to this, C2TAkd × AIRE-HCO mice reconstituted with ΔDC bone marrow
and therefore free of DC, showed strongly reduced deletion of DO11.10+ T cells
(Figure 17A) (24.67 ± 15.4 (n = 8) versus 70.5 ± 10.5 (n = 10), P = 1 x 10⁻⁵), which
can only be a consequence of diminished Ova presentation by mTEC. In accordance
with this, induction of Ova-specific Treg was also unaffected by the absence of DC in
AIRE-HCO mice reconstituted with DO11.10 ΔDC bone marrow, whereas interfering
with antigen presentation by mTEC significantly enhanced Treg induction even in the
absence of DC (2.8 ± 4.9 (n = 8) versus 10.0 ± 4.0 (n = 8), P = 0.005) (Figure 17B).
The same held true for the absolute cell numbers of DO11.10+ Foxp3+ CD4+ SP T
cells (Figure 17C). Essentially the same findings were obtained in the TCR-HA
54

Figure 17 – Altered selection of DO11.10+ T cells in DO11.10 x AIRE-HCO x C2TAkd mice is independent of DC. (A) Analysis of DC-deficient (ΔDC) bone marrow chimeras. WT recipients and AIRE-HCO or AIRE-HCO x C2TAkd recipients were either reconstituted with DO11.10 or DO11.10 x ΔDC bone marrow and CD4/CD8 T cell profiles as well as the percentage of CD4+ DO11.10+ cells of chimeric animals were analyzed 6 weeks later. Numbers indicate the average
stainings of CD4+ SP T cells from AIRE-HCO and AIRE-HCO x C2TAkd recipients reconstituted with DO11.10 x ΔDC bone marrow. Numbers indicate the average frequency of cells within these areas (± s.d.). (C) Absolute cell numbers of DO11.10+ Foxp3+ cells are shown in the graph. P values are indicated.
frequency of cells within these areas (± s.d.). (B) Plots depict DO11.10 and Foxp3
B
A
C
55

Figure 18 – Altered selection of TCR-HA+ T cells in TCR-HA x AIRE-HA x C2TAkd mice is independent of DC. (A) Analysis of ΔDC bone marrow chimera.
-HA x C2TAkd recipients were either nstituted with TCR-HA or TCR-HA x ΔDC bone marrow and CD4/CD8 T cell
A
B
WT recipients and AIRE-HA or AIRErecoprofiles as well as the percentage of CD4+ TCR-HA+ T cells of chimeric animals were analyzed 6 weeks later. (B) Plots depict TCR-HA and Foxp3 stainings of CD4+ SP T cells from AIRE-HA and AIRE-HA x C2TAkd recipients reconstituted with TCR-HA x ΔDC bone marrow. Numbers indicate the average frequency of cells within these areas (± s.d.).
56

4. DISCUSSION
Ever since the discovery of medullary thymic epithelial cells (mTEC) and their
in ensable role in central tolerance induction, the mechanism(s) of how mTEC
might contribute to this important task has been the center of investigations. The
unique hallmark of mTEC is their capacity to express rare, otherwise tissue restricted
genes thereby crucially contributing to the prevention of autoimmunity against
peripheral organs. Hence, mTEC have a major function as antigen expressing cell,
however, whether they also induce tolerance by direct antigen presentation to T cells
is not known. We addressed this issue by generating a tissue-specific C2TAkd
mouse and directly interfering with antigen presentation by mTEC in vivo.
Here, we show that mTEC serve a dual, non-redundant function in tolerance
induction of CD4+ T cells not only as antigen expressing cell but also as antigen
presenting cell.
4.1 Transcriptional and translational RNA interference in C2TAkd mice?
Analysis of C2TAkd mice revealed efficient down regulation of MHCII mRNA and
protein expression in mTEC. Quantification of C2TA mRNA, which is the actual target
of the miRNA, showed a milder reduction as compared to MHCII. A plausible
explanation for this finding could be the type of RNA interference (RNAi) that is
induced. Generally miRNAs can regulate gene expression on two levels; first, by
assembly into the RNA induced silencing complex (RISC) and the subsequent
binding to and endonucleolytic cleavage of the target mRNA or second, by binding to
the 3´UTR region of the target mRNA and inhibition of its translation. In other words,
iRNAs can either repress the amount of mRNA and protein or only the amount of
rotein. Why and when a particular mode of RNAi is induced by a specific miRNA is
disp
m
p
still poorly understood. However, there are multiple examples showing either no
change in mRNA level or a significant smaller reduction of the mRNA level as
compared to the protein level, indicating that both transcriptional and translational
silencing can be concomitantly induced by a single miRNA (217-220). Thus, it is
likely that in C2TAkd mice mRNA and protein levels of C2TA are repressed at the
same time, thereby synergistically leading to the strong reduction of MHCII.
57

Another possible explanation would be that the transcription of MHCII is very
sensitive to alterations in the abundance of the co-activator C2TA. This would mean
at already a moderate knock down of C2TA would be sufficient for a strong
however, is rather unlikely as
C2TA+/- mice do not show significant alterations in MHCII expression as compared to
WT mice (data not shown).
4.2 Specificity of C2TA for MHCII
The choice of C2TA as the miRNA target instead of MHCII itself was based on the
fact that this would enable us to study antigen presentation by mTEC irrespective of
the genetic background, e.g. Balb/c and BL6. Furthermore, C2TA is considered to
be the master regulator of MHCII transcription. Accordingly C2TA-/- animals by and
large recapitulate the phenotype of MHCI-/- mice and thus are devoid of MHCII
expression (215). Indeed we found that less than 1% of all mTEC expressed MHCII
at very low levels on their surface (data not shown + (43)).
Even though C2TA has a remarkable degree of specificity for MHCII and genes
involved in the MHCII loading pathway (221-228), a few MHCII-unrelated genes have
been reported to be influenced by C2TA. In all cases, however, expression was only
very mildly regulated by C2TA and not observed in vivo or were subject of
controversy (229, 230). Beside transcriptional repression of IL-4, FasL and Collagen
α2 (225, 231-233), C2TA was also reported to up-regulate expression of MHCI and
the co-stimulatory molecule Plexin A1 (213, 214, 234). Importantly, we tested all
known targets of C2TA and found them either not to be expressed in mTEC or not
differentially regulated in C2TAkd mTEC (Figure 7 + data not shown). Thus, potential
unwanted effects of C2TAkd on other C2TA-regulated genes than MHCII can be
largely excluded.
4.3 Potential off-target effects
Endogenous, naturally occurring miRNA and their mode of action have been
thoroughly investigated in the last decade. Today it is known that a given miRNA
usually targets much more than one mRNA as its function does not require full
th
reduction of MHCII mRNA transcription. This scenario,
58

complementarity to the target (235) but instead a so called “seed region” of about 8
bases at the 5´end is essential and sufficient for effective repression of target mRNA
anslation. Bioinformatic predictions in mammals estimated that a few hundred
respect to
s well as the generation of a second C2TAkd mouse, carrying a
ifferent hairpin, will uncover such off-target effects.
.4 mTEC development in C2TAkd mice
tr
miRNAs control approximately 30% of all protein-encoding genes (236).
Although the algorithm of the miRNA design program we used for the C2TA-specific
miRNA design (http://katahdin.cshl.org:9331/RNAi_web/scripts/main2.pl) excluded
sequence homologies to other genes than C2TA, it cannot be entirely excluded that
the C2TA-specific miRNA represses the translation of other transcripts. This
technical caveat is also known as “off-targeting”.
Therefore we carefully analyzed the phenotype of C2TAkd mTEC, including all
known markers, e.g. MHCII, CD80, AIRE, MHCI, UEA-1, pGE (Figure 8,9 and data
not shown). Except for the down-modulation of MHCII, no alterations with
the markers we tested could be detected. Formally, however, this possibility still has
to be considered. Future microarray analysis of mTEC from WT versus C2TAkd
versus C2TA-/- a
d
4
It is well established that efficient TEC development depends on the cross-talk with
developing T cells (237-239), involving CD40-CD40L as well as RANK-RANKL
interactions (37-39). One study, however, also proposed a requirement of cognate
pMHC-TCR interactions for the development of mature AIRE+ mTEC (43). This
hypothesis was based on the observation that mice expressing only one TCR and
thus supposedly did not interact with peptide-MHCII (pMHCII) complexes on mTEC
showed strongly reduced numbers of mTEC. Importantly, the mTEC compartment
was completely restored when the cognate antigen of the TCR was expressed. The
authors attributed this defect to the reduced proliferation they observed in the
residual mTEC and suggested a model by which proliferating precursors in the
immature mTEC population differentiate and/or expand into mature mTEC via the
help of cognate self-peptide MHCII complex interactions with self-reactive CD4+ T
cells.
59

In consideration of these findings, we performed detailed analysis of mTEC
development. Beside the normal appearance of the thymic architecture, all major
mTEC subsets were normally formed. AIRE+ mTEC that were notably most affected
in the above mentioned study, were not reduced in C2TAkd animals as compared to
WT. If anything at all, a slight increase of AIRE protein could be observed in C2TAkd
mTEC. Our findings, however, do not necessarily contradict the hypothesis described
bove. First, even though MHCII is strongly reduced in C2TAkd mice, there is still
al MHCII, which might be sufficient and essential
r the development of a full mTEC compartment because it still allows for cognate
so be explained by secondary effects, such as disrupted medulla
rmation and consequently hampered DC recruitment or T cell intrinsic defects (36).
bserved an altered thymic architecture nor mTEC
evelopment, but exclusively diminished MHCII expression by mTEC, leaving the
a
some low expression level of residu
fo
pMHC-TCR interactions. The lack of MHCII could be compensated for by increased
proliferation of mTEC subsets, a possibility that we did not test for. Second, as C2TA
miRNA expression is under the control of the AIRE promoter, MHCII is most strongly
down-regulated in mature mTEC while immature CD80- mTEC are affected to a
lesser extent. Hence, TCR – pMHC interactions between immature mTEC and T cells
could still take place in C2TAkd animals which might be sufficient for proper mTEC
development.
4.5 Negative selection in C2TAkd mice
The highly efficient and mTEC-specific C2TA knock down in C2TAkd mice, resulting
in a strong reduction of MHCII, allowed us to directly investigate the consequences of
impaired antigen presentation by mTEC on tolerance induction in CD4+ T cell.
Analysis of bulk CD4+ T cell development in C2TAkd mice revealed an increase of
CD4+ SP T cells of about 30%. This observation is in agreement with another report
that found a similar enlargement of the CD4+ SP T cell compartment in mice that
were completely devoid of UEA+ mTEC. In this study, however, impaired tolerance
induction could al
fo
In contrast to this, we neither o
d
thymic environment fully intact. Thus, alterations in T cell development can only be a
direct result of diminished MHCII levels in mTEC.
60

An increase in the CD4+ SP T cell compartment was also found when the role of DC
in negative selection was studied. Chimeric mice reconstituted with MHCII-/- bone
marrow to abolish antigen presentation by DC showed an enrichment of CD4+ SP T
cells which was supposedly caused by defective deletion of self-reactive T cells
and mTEC were diminished in
ntigen presentation is clearly in agreement with a non-redundant function of mTEC + lls.
ht compensate for the absence of one or the other APC type, changes on the
level of TCR specificities could still occur. Alterations in the TCR repertoire of Treg can
(202). This interpretation has later been strengthened by the fact that T cells from
such chimeras indeed showed elevated auto-reactivity in vitro (240). Essentially the
same conclusions were drawn from the analysis of DC knockout animals that were
found to develop severe autoimmune disease, presumably as a consequence of
defective negative selection (201).
Here we further clarified the role of mTEC versus DC in negative selection, using
different bone marrow chimeras that were designed to eliminate antigen presentation
by either mTEC or DC and found that in both cases negative selection of CD4+ T
cells was impaired. This became apparent by the enlargement of the CD4+ SP
compartment and the ability of these cells to react towards self-peptide-MHC
molecules in an in vitro proliferation assay. The observation that the increase of CD4+
SP T cells was even more pronounced if both DC
a
and DC as APC in the deletion of CD4 T ce
4.6 Treg induction in C2TAkd mice
mTEC have been implicated in the induction of regulatory T cells (Treg). As previously
established in our lab, expression and presentation of HA by mTEC was sufficient for
the development of HA-specific Treg and moreover, mTEC as well as DC were found
to autonomously induce Treg in vitro (62, 241). In contrast, here we did not observe
any significant changes in the polyclonal CD4+ Treg compartment in mice diminished
in antigen presentation by mTEC or DC, at least not with respect to the pool size. Of
note, we always found a marked, yet not significant reduction of Treg in mice devoid of
antigen presentation by both mTEC and DC. Our findings do not necessarily imply a
complete redundancy of mTEC and DC in the process of Treg induction. While
homeostatic mechanisms acting downstream of bona fide differentiation processes of
Treg mig
61

certainly not be detected in a polyclonal system. This might as well explain why
neither the complete absence of mTEC by blocking their development nor the lack of
DC promoted significant perturbation in the size of the Treg compartment (37, 201).
A major limitation inherent to analysis of the polyclonal T cell repertoire is that
defective tolerance induction on the level of distinct TCR specificities is difficult to
address. Therefore we ascertained the role of antigen presentation by mTEC in
negative selection as well as in Treg induction by using a TCR transgenic mouse
model. As we previously published, targeted expression of Ova as well as HA to
AIRE+ mTEC led to the development of CD4+ Foxp3+ Treg of the cognate TCR
specificity concomitant to the partial deletion of specific TCR-transgenic CD4+ T cells.
Interfering with antigen presentation by mTEC in these systems resulted in
diminished deletion and remarkably, increased Treg development of TCR-transgenic
CD4+ T cells. This indicates that mTEC promote the selection of certain Treg
specificities, supposedly recognizing mTEC-derived antigens such as TRA, thereby
crucially contributing to the repertoire formation of CD4+ Treg. Moreover, our
observations provide direct evidence for an autonomous role of mTEC as APC not
nly in recessive tolerance but also the dominant tolerance induction of CD4+ T cells.
.7 Antigen transfer to DC
it has
might have led to reduced capture
of MHCII molecules by DC and thus to the altered tolerance induction we observed in
o
4
Antigen transfer between different types of APC has been suggested to substantially
contribute to increase the efficiency of tolerance induction (242). For example
been shown that Ova transfer to DC was not only sufficient but also essential to
induce negative selection of Ova-specific TCR transgenic CD4+ T cells (203).
Recently much progress has been made to understand the modalities of antigen
spreading within the thymic microenvironment. There appears to be a unidirectional
transfer of mTEC-derived antigens, including rare tissue specific antigens, from
mTEC to DC. Efficient antigen capture and presentation by DC does not only engage
conventional MHCII loading pathways but also extends to the level of intercellular
transfer of functional MHC molecules and other TEC-specific membrane proteins
(207, 211). In view of this new observations, we addressed the possibility that
reduced MHCII levels on mTEC in C2TAkd mice
62

CD4+ T cells. To this end we eliminated DC in the TCR-transgenic systems we
previously used to test the importance of mTEC as antigen presenters and found that
neither deletion nor Treg induction of HA- or Ova-specific T cells was dependent on
DC.
4.8 Avidity impinge on the mode of tolerance
Analysis of the TCR transgenic models showed that antigen presentation of HA or
Ova by mTEC always led to both deletion and concomitant Treg induction of CD4+ T
tion is favored upon low avidity
teractions which might lead to shaping the repertoire towards low abundance
owever, it is still unresolved why within an apparently homogenous cohort of T
cells specific for the antigen, implying that these two different tolerogenic pathways
can occur side by side. Large amounts of antigen presented by mTEC induced
massive deletion of specific T cells, whereas reducing the amount of antigen on
mTEC favored Treg development and inhibited negative selection of T cells
recognizing the cognate antigen. Thus, our findings, for the first time, provided
evidence for a model by which Treg induction occurs within a defined “window of
avidity” which is below the threshold of negative selection, whereby the optimal
antigen dose might vary between different TCR affinities as well as different APC, i.e.
DC and mTEC (241). This would imply that Treg induc
in
antigens such as TRA.
H
cells, all expressing the same TCR, one T cell develops into a Treg while another T
cell is deleted in one and the same antigen expressing environment. We provide
several potential explanations: First, there is more and more evidence that the thymic
medulla is rather heterogeneous with respect to availability of antigens, in particular
with respect to low abundant antigens. Accordingly, it has been shown for
promiscuously expressed genes that a given TRA was expressed by only about 3-
5% of all mTEC (209). Therefore it might be a stochastic event whether a T cell runs
into an APC presenting its cognate antigen. Second, T cells were shown to have a
residence time of about 4 days in the medulla during which they have multiple
interactions with APC thereby probably screening their environment for antigens
(210). In view of this, one could speculate that a single pMHC-TCR contact might not
be sufficient to induce tolerance but instead multiple consecutive interactions are
63

required for Treg induction or deletion. Third, the medulla is a patchwork of different
types of APC, all of which might have different tolerogenic properties. For example it
has been recently shown that mTEC require higher optimal antigen doses for Treg
induction compared to DC (194). Forth, the susceptibility for tolerance induction
might also be intrinsically regulated with the maturation stage. Accordingly, it was
found that the capacity to deviate into the Treg lineage inversely correlated with the
maturation status (194). Similar rules could also apply for negative selection.
Together, several stochastic and probabilistic factors might impinge on the mode of
tolerance that is induced. Depending on the encounter of different APC, the
maturation status of the T cell and the availability of the cognate antigen, a T cell
might be deleted or deviated into the Treg lineage. It is intuitive that the amount of
antigen on APC dictates the probability of interactions with T cells expressing the
cognate TCR and thereby influences the mode of tolerance that is induced.
Therefore there might be a balance between Treg induction and negative selection,
which is shifted to the one or the other direction depending on the availability of the
given antigen (Figure 19).
Figure 19 - Avidity model of central tolerance induction. The avidity of TCR - self peptide MHC interactions influences the mode of tolerance that is induced. Accordingly, high antigen doses lead to a strong susceptibility for negative selection, whereas lower antigen doses increase to probability of a T cell to be deviated into the Treg lineage. Thus there is an optimal window of avidity for the development of Treg that might partially overlap with positive selection or deletion. This could explain why deletion and Treg induction of T cells with the very same TCR can often occur in parallel in vivo.
64
5. MATERIAL AND METHODS Animals
TCR-HA, DO11.10, PGK-HA, C2TA-/- has been described elsewhere (215, 216, 243,
44). AIRE-GFP reporter mice were kindly provided by Dr. Mark Anderson (63).
d from Dr. David Vöhringer (201).
57-BL6 and Balb/c mice were purchased from Charles River. All other strains were
), CD80 (B7.1, 16-10A1) were purchased from Becton
2
CD11c-Cre and DTA-floxed mice were obtaine
C
from in-house breeding colonies. AIRE-HCO, AIRE-HA, C2TAkd mice were
generated at the Research Institute of Molecular Pathology (62). All mice were breed
in individually ventilated cages in the animal facility of the Research Institute of
Molecular Pathology or in the animal facility of the Institute for Immunology of the
LMU Munich. All animal studies were done according to the local regulations. Antibodies and flow cytometry
Phycoerythrin (PE)-conjugated mAbs to CD45.1 (A20), Ly51 (BP-1), Cy-chrome-
conjugated mAbs to CD8 (53-6.7), CD45 (Ly-5), CD11c (HL3), allophycocyanin
(APC)-conjugated mAbs to CD45.1 (A20), phycoerythrin-Cy7 (PE-Cy7)-conjugated
streptavidine, mAbs to CD25 (PC61), allophycocyanin-Cy7 (APC-Cy7)-conjugated
mAbs to CD4 (GK1.5) and biotin-conjugated monoclonal antibodies (mAbs) to CD8
(53-6.7), CD4 (GK 1.5
Dickinson. APC-conjugated EpCAM (G8.8) was purchased from BioLegend.
Monoclonal Abs to EpCAM (G8.8), TCR-HA (6.5), DO11.10 (KJ1.26) and pan-MHC
class II (P7.7) were purified from hybridoma supernatant and conjugated to FITC, PE
or Alexa647 in our lab. 4',6-Diamidin-2'-phenylindol- dihydrochlorid (DAPI) was
purchased from Invitrogen.
Intracellular staining of Foxp3 was performed according to the manufacturer’s
protocol using FITC–, PE- or APC-conjugated mAbs to Foxp3 (FJK-16s,
eBiosciences). Surface stainings were performed according to standard procedures
at a density of 1-2 x 10⁶ per 50 μl and volumes were scaled up accordingly. Flow-
cytometric analysis was performed on FACS Canto II (Becton Dickinson) using FACS
DIVA software (Becton Dickinson) for acquisition and Flowjo (Treestar) for analysis.
65

Immunofluorescence
5μm frozen sections were fixed in cold acetone and permeabilized with 0.1% (vol/vol)
Tween in PBS for 30 min. Sections were blocked with 10% (vol/vol) FCS in PBS for
30 min and washed 3 x 15min in 0.1% (vol/vol) Tween in PBS. Rabbit anti-keratin 5
antibody (Covance, 1:100) staining was carried out overnight at 4°C. Next day
sections were washed 3 x 15min and incubated with Alexa Fluor 488-conjugated
secondary anti-rabbit antibody (Molecular Probes, 1:800) for 60 min at room
th ProLong Gold antifade reagent with 4, 6-diamidino-2-
henylindole (DAPI) (Molecular Probes) and samples were analyzed with the
fluorescence microscope BX41 (Olympus).
Western blotting
1x10⁶ (5x10⁵) cells were lysed in 50µl (20µl) lysis buffer at 4°C for 5 min. 1x sample
buffer was added and lysate was boiled at 95°C for 4 min. Subsequently samples
were loaded on a SDS-PAGE (see below).
SDS-PAGE
Running gel (15%) Loading gel
temperature. After washing 3 x 15 min, sections were blocked with rabbit serum
(Jackson Immuno Research Laboratories, Inc.) for 30 min at room temperature and
incubated with biotin anti-keratin 8 antibody (TROMA-1, Developmental Studies
Hybridoma Bank, 1:100), biotin anti-AIRE antibody (5H12-2, kindly provided by Dr
Hamish Scott, 1:400) or biotin anti-I-Ad (AMS-32.1, Becton Dickinson, 1:800) for 2 h
at room temperature. Subsequently sections are washed 3 x 15min and the
secondary reagent straptavidin-Cy3 (Jackson Immuno Research Laboratories,Inc.,
1:1000) was added for 60 min at room temperature. Finally after washing 3 x 15min
nuclei were counterstained wi
p
H2O 4.9ml 6ml
1.5M TrisHCl+0.4% SDS (pH6.8) 5ml 2.5ml
29.2% acrylamid+0.8% bis-acrylamid 10ml 1.5ml
10% TEMED 100µl 100µl
10% ammonium-persulfat (APS) 100µl 100µl
< 10ml per 1.5mm gel
< 4ml per 1.5mm gel
66
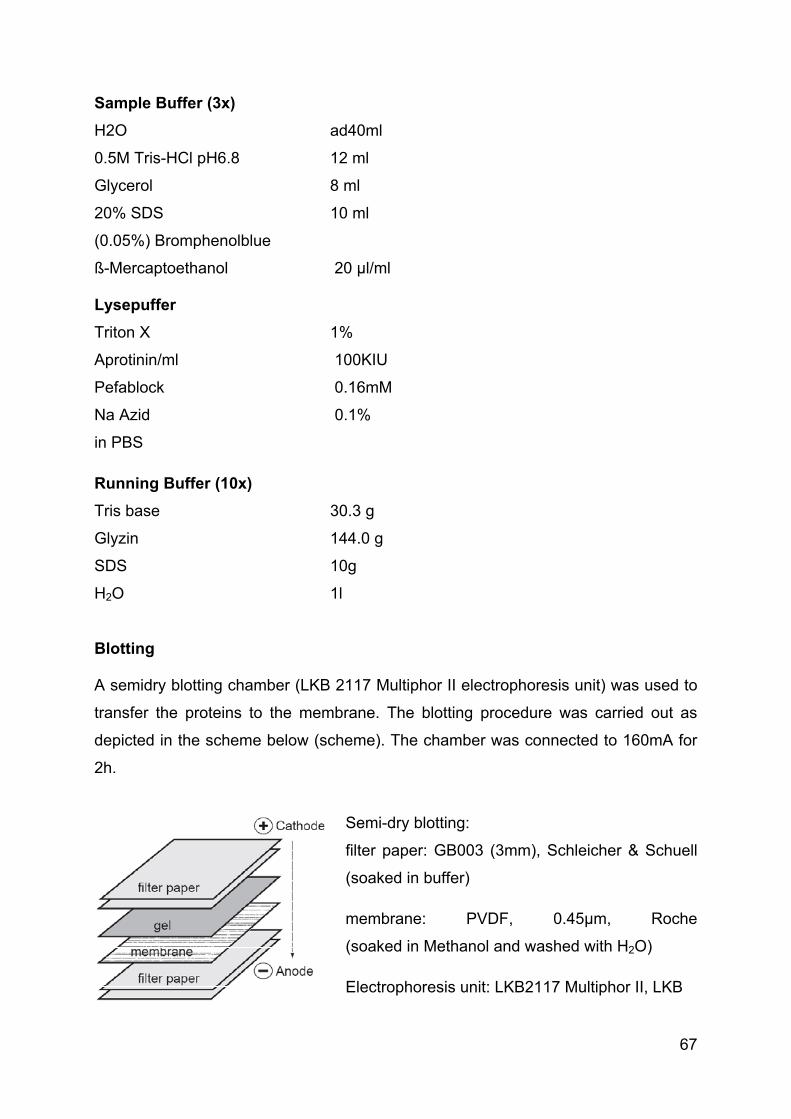
Sample Buffer (3x) H2O ad40ml
HCl pH6.8 12 ml
PBS
Running Buffer (10x)
Electrophoresis unit: LKB2117 Multiphor II, LKB
0.5M Tris-
Glycerol 8 ml
20% SDS 10 ml
(0.05%) Bromphenolblue
ß-Mercaptoethanol 20 µl/ml
Lysepuffer Triton X 1%
Aprotinin/ml 100KIU
Pefablock 0.16mM
Na Azid 0.1%
in
Tris base 30.3 g
Glyzin 144.0 g
SDS 10g
H2O 1l
Blotting
A semidry blotting chamber (LKB 2117 Multiphor II electrophoresis unit) was used to
transfer the proteins to the membrane. The blotting procedure was carried out as
depicted in the scheme below (scheme). The chamber was connected to 160mA for
2h.
Semi-dry blotting:
filter paper: GB003 (3mm), Schleicher & Schuell
(soaked in buffer)
membrane: PVDF, 0.45µm, Roche
(soaked in Methanol and washed with H2O)
67
After transfer of proteins the membrane was transferred to a blocking solution (4%
agarosegel and purified using the Gel
it (Quiagen). Before ligation vector backbones were dephosphorylated
ith 10U alkaline phosphatase (Roche t 7°C for 1h.
on was performed using quick lig ioLabs) with th propriate buffer for
of insert and backbone were used. 10µl
ligation mix was incubated together with competent E.coli (DH5α), provided by the
m h, followed by a heat shock of 2min at
transfected bacteria wer ked on LB-Ag s containing the
mark
milk powder) for 1h on room temperature. Thereafter the primary antibody was added
and incubated over night at 4°C. Next day the membrane was thoroughly washed (8
x 5min) with wash buffer (PBS supplemented with 0.05% Tween20) before it was
incubated with the secondary antibody (in 4% milk powder) for 4h on room
temperature. After thoroughly washing at least 8 x 5min substrate is added for 5 min
and the membrane can be exposed to the film.
Antibodies for WB
Mouse anti mouse β-actin (AC-15, Sigma-Aldrich; 1:20000)
Polyclonal rabbit anti mouse horse radish peroxidase (HRP) (P260, DAKO; 1:2000)
Rat anti mouse MHCII (H2-Ea) (IBL-5/22, Santa Cruz; 1:200)
Polyclonal mouse anti rat HRP (212-035-168, Dianova; 1:9000)
Polyclonal rabbit anti AIRE (Hamish Scott; 1:100)
Polyclonal goat anti rabbit HRP (111-035-144, Dianova; 1:70 000)
Substrate: Super Signal West Pico (Pierce)
Film: WICORex B+ (Linhardt Röntgenbedarf)
Developer: 35 Compact (PROTEC)
Cloning
Restriction enzymes were purchased from Roche. Digestions of plasmids were
performed in the appropriate buffers with 10U restriction enzyme at 37°C or 55°C for
1h. Cut vectors were separated on a 1-2%
purification K
w ) with the appropria e buffer at 3
Ligati ase (B e ap
5min on 25°C. Equal stoechiometric amounts
IMP service department, on ice for 20 in wit
42°C. Finally e strea ar plate
appropriate antibiotic as selection er.
68

Cloning of the retroviral CIITAsh vector (LMP CIITAsh)
LMP vector was purchased from
prov ed th ng regions of the human miRNA30 (scheme)
gene of interest, the miRNA30 can be
i o the sequence s for this gene. Subsequently this “designer
iRNA processing pathway and this
e aimed to target MHCII by either
specific sequences.
://katahdin.cshl.org:9331/homepage/siRNA/RNAi.cgi?type=shRNA
The murine stem cell virus (MSCV)-based
OpenBioscience and id e flanki
(245). In order to obtain the knock-down of a
exchanged nt pecific
miRNA” will be normally processed in the m
ultimately leads to efficient knock-down. Here w
using C2TA-
CIITA (MH3-6) specific short hairpins (97mers) were designed with the help of the
website:
http
The RNAi oligo retriever generated the hairpin primer by selecting a ‘sense’
sequence of 22 nucleotides (nt) in ding sequence of the gene of
interest. Generally there are seve
applied to the designe: The select usually targeted to the coding
sequences or 3’ UTR and contains
SNPs were avoided as well as c liced
mRNAs. Importantly the 5´end of the antisense strand was thermodynamically
destabilized in order to favor its inco
length from the co
ral common rules that the RNAi oligo retriever
ed sequence was
>3 mismatches to any other gene. Furthermore
ommon exons targeted in alternatively sp
rporation into RISC.
69

Sequences of 97mers:
MH3 5´ TGCTGTTGACAGTGAGCGCGGGCCTCCTTGAGTGATACAATAGTGAAG
CCACAGATGTATTGTATCACTCAAGGAGGCCCTTGCCTACTGCCTCGGA 3´
MH4 5´ TGCTGTTGACAGTGAGCGAGCAGCTACCTGGAACTCCTTATAGTGAAG
CCACAGATGTATAAGGAGTTCCAGGTAGCTGCCTGCCTACTGCCTCGGA 3´
MH5 5´ TGCTGTTGACAGTGAGCGAGCCCAGCTACCTTGTACACTTTAGTGAAGC
CACAGATGTAAAGTGTACAAGGTAGCTGGGCCTGCCTACTGCCTCGGA 3´
ACAGTGAGCGCGGCTGGCACAGTGCAATGAAATAGTGAAG
CTGCCCGGA 3´
e LMP vector, unique
TATTGCTGTTGACAGTGAGCG 3´;
CCGAGGCAGTAGGCA 3´).
am
MH6 5´ TGCTGTTG
CCACAGATGTATTTCATTGCACTGTGCCAGCCATGACTA
Amplification of the unique CIITA short hairpin sequence
In order to clone the CIITAsh into the miRNA30 backbone on th
restriction sites were inserted by PCR amplification:
(XhoI-MH7 5´CAGAAGGCTCGAGAAGGTA
EcoRI-MH8 5´ CTAAAGTAGCCCCTTGAATT
PCR-mix PCR-progr
10µl MgCl2 (25mM) 94°C 1min
1µl Advantage II
10µl 10x Buffer
10µl dNTP (2mM)
5µl XhoI primer (10µM)
5µl EcoRI primer (10µM)
5µl GCmelt (Clontech)
44µl dH2O
10µl 97mer (0.1µM)
94°C 30sec
54°C 30sec
75°C 1min
75°C 10min
15°C hold
70

The PCR product (138bp) was loaded on an agarose gel and purified with the
sertion, the DNA was digested with XhoI and SacII
hich resulted in two products, 7019bp and 985bp if insertion was successful.
etroviral vectors were ready for testing in vitro.
Qiagen Gel Extraction Kit. The PCR product as well as the LMP vector was then
digested with EcoRI and XhoI and again purified. After dephosphorylation of the LMP
vector, the PCR product was ligated into the LMP vector (scheme). The Ligation was
then transformed into DH5α bacteria that were subsequently streaked on plates with
ampicillin and incubated at 37°C over night. Next day colonies were picked and
incubated in 4ml LB plus ampicillin over night to perform minipreps next day. To
identify clones with the proper in
w
R
71

Retroviral infection of B cell line
ht at
.
000
GFP
xpression and subsequently infection of B cells could be performed. Supernatant
as cleared from cells with a 0.45µm syringe filter and polybrene was added (4µg/ml
supernatant containing
Puromycin selection was started
48h after the last infection to obtain stable clones.
eneration of the transgenic CIITAkd mouse
loning RE targeting construct
The tar e B C generated by PCR-
amplific sh flank 5´ and 3´ flanking
regions u peI sites (prove reading polymerase was used).
EcoRV- 2 ´ AT T GGCGCCG 3´
SpeI-M 5 CCG CCC 3´
The PCR product (328bp) was gel purified and subsequently digested with EcoRV
and SpeI to be ligated into the hogness #56 instead of HA (see scheme below).
Transient transfection of virus producer cells (Phoenix):
Phoenix cells were seeded (1.5x10⁶ cells per 6cm plate) and incubated over nig
37°C and 5% CO2. Next day cells were adherent and formed a 70% confluent layer
Phoenix cells were transfected with 1-10µg vector DNA using Lipofectamin2
(Invitrogen) according to the manufacturers protocol. DMEM medium without FCS
and antibiotics was used. Transfection was repeated 24h later.
One day after the last transfection efficiency was controlled by measuring
e
w
final). 0.5x10⁶ B cells (WEHI279.1) were resuspended in the
the virus and incubated at 37°C and 5%CO2. Infection procedure was repeated next
day and infection efficiency was checked 48h after.
G
C of the AI
geting construct used for th A modification was
ation of the miRNA30-CIITA ed by the miRNA30
introd cing EcoRV and S
MH2 : 5 GGGATATCCACTCC TCTCTA
H23: ´ A GACTAGTGGAAAAGCGCCTC TACC
72

The targeting construct was recombined into the mouse BAC RP23-77011 which
contains 58kb downstream and 152kb upstream from the transcription start site of
AIRE (BACPAC Resources Center, Oakland, USA (246). Homology boxes spanning
nucleotides -379 to -2 (5’: box1) and 17 to 399 (3’: box2) (with A of the start-codon
being +1) were used for homologous recombination of the miR30-CIITAsh into the
AIRE locus.
BAC modification
Transformation of BAC with pBAD
DH10β bacteria containing the BAC RP23-77011 were grown in 4ml LB
supplemented with chloramphenicol (12.5µg/ml) over night at 37°C. Bacteria were
then spun down at 10000 rpm for 2min and resuspended in 1ml ice-cold 10%
lycerol. This washing step was repeated twice followed by electroporation (200Ω,
5uFD, 2,5kV) of bacteria in 50µl 10% glycerol with 500ng pBAD. pBAD encodes for
e recombinase required for BAC modification later on. LB was added to the
g
2
th
73

transformed bacteria and incubated for 1h at 37°C without antibiotics. After that
th chloramphenicol and
ampicillin (100µg/ml) and incubated on 37°C over night.
own in 70ml LB plus
ampicillin and chloramphenicol at 37°C until OD600=0.1. At that point L-arabinose was
d on LB plated supplemented with
anamycin and chloramphenicol at 37°C over night.
bated over night with LB plus kanamycin
creening scheme
KA9 and KA10 identified empty vectors, MH40 and MH23 amplified positive clones
nd KA8 and KA10 were used to check for the loss of neomycin. TD5430 PCR
program was used in all cases.
Left over of the LB culture of the positive clones was diluted 1 to 1000 and one drop
was plated on kanamycinan/chloramphenicol LB plates and incubated at 37°C over
periode, bacteria were plated on LB plates supplemented wi
Transformation and recombination of insert
3 colonies were picked next day and again incubated in 2-4ml LB plus ampicillin and
chloramphenicol over night. Next day 1ml of the culture was gr
added and bacteria were further grown until an OD600 of 0.3-0.4 was reached.
Bacteria were spun down at 7000rpm for 5min and washed 3 times with 1ml cold
10% glycerol. The supernatant was then discarded and bacteria were resuspended
in remaining glycerol. 400-1000ng insert (targeting construct digested with AhdI and
SalI) was added and bacteria were electroporated (see pBAD transformation).
Transformed bacteria were incubated at 37°C for 1.5h. In order to select for
recombination of the insert, bacteria were streake
k
Screening for positive clones
Next day 12 colonies were picked and incu
and chloramphenicol. From these cultures DNA was isolated using Quiagen Miniprep
kit and tested for successful recombination via PCR.
S
400bp 600bp 330bp 140bp 1170bp 400bp
KA9 MH40 MH23 KA8 KA10
a
74

night. On the next day, 50 colonies per plate were picked and replica-plated first on
plates with ampicillin and second on plates with chloramphenicol/kanamycin plates.
Those clones that were growing on chloramphenicol/kanamycin plates but not under
ampicillin selection already lost the recombinase plasmid and can therefore be
further used.
Deletion of kanamycin resistance
In order to delete the kanamycin resistance, bacteria were transformed with the flp-
plasmid carrying the flp recombinase. For that purpose 4 clones were inoculated in
2ml LB supplemented with kanamycin and chloramphenicol over night. Next day
cultures were washed and transformed with approximately 300ng of flp-plasmid.
Transformed bacteria were first incubated at 30°C for one hour and subsequently
streaked on LB plates supplemented with tetracyclin and incubated on 30°C over
night.
Next 6 clones from different tetracyclin plates were inoculated in 2ml LB without
antibiotics over night on 37°C leading to the loss of the flp plasmid. To test for the
eletion of the kanamycin resistance over night cultures were diluted 1 to 1000 and
yclin second chloramphenicol and third chloramphenicol/kanamycin
lates. In parallel the very same clones were inoculated in 4ml LB with
r night at 37°C.
only growing on chloramphenicol plates were
d
streaked on chloramphenicol plates and on plates containing both chloramphenicol
and kanamycin plates were incubated at 37°C over night. Those clones that grow
significantly less on kanamycin/chloramphenicol plates were tested for the loss of the
kanamycin by PCR (see screening scheme). Those clones that were screened
positive for the loss of the kanamycin resistance were again tested and replica plated
on first tetrac
p
chloramphenicol ove
The 4ml LB culture of clones that were
used for injection.
Large scale preparation of BAC DNA
One or two clones that positively passed all screening procedures were inoculated in
2 x 1l LB with chloramphenicol at 37°C over night. Cultures were centrifuged and
pellet were resuspended in buffer P1 (45ml P1 per 1l culture, Maxi Prep Quiagen).
To lyse the cells 15ml of P2 was added per 45ml bacteria suspension and the lysate
75

was incubated for 15min at room temperature. Next 15ml buffer P3 was added
followed by a 20min incubation step on ice and a centrifugation step for 30min at
4500rpm. After that the supernatant (filtered) was loaded on equilibrated columns (6
er 2l culture) and columns were washed 2x with 30ml wash buffer. BAC DNA was
h 10.5ml
le was mixed, spun down and
upernatant was discarded. This step was repeated several times.
ffer for several days whereas the buffer
830ml H2O
7.5)
ml EDTA (0.5M)
NaCl (100mM final)
t n fo pronuclear jecti
centration of 1ng/ml.
p
eluted with 15ml pre-warmed elution buffer per column and precipitated wit
isopropanol. After 1h centrifugation a small pellet was visible which was then
transferred to an eppendorf tube and washed 3x with 70% Ethanol. Finally the DNA
was air-dried and resuspended in 500µl TE-buffer.
BAC DNA purification – Cesiumchloride gradient
Two snap cap tubes with 4.4g of cesiumchloride were filled with either 4400µl TE-
buffer or 4150µl BAC DNA and 250µl EtBr. As soon as the cesiumchloride was
dissolved, solutions were transferred to Vt.65.2 Beckman centrifuge tubes, balanced
and sealed. The gradient was ultra centrifuged at 58000rpm at 22°C for 17h (Vt.65.2
rotor). Next day the purified BAC DNA was recovered under the UV light. To extract
the DNA, 1ml isoamylalcohole was added, the samp
s
The DNA was dialyzed against injection bu
was changed every day.
10x injection buffer
1
160ml TRIS (1M, pH
4
BAC DNA prepara io r in ons
After dialysis BAC DNA concentration was determined by spectrophotometry. The
quality was controlled on a 0.5% agarosegel. For pronuclear injections DNA was
diluted in injection buffer to a con
76

Bone marrow chimeras
Bone marrow was obtained from donor mice by isolating tibia and femur and flushing
out the bone marrow mass using a syringe and a needle. Single cell suspension was
made and subsequently bone marrow was depleted from T cells using biotinylated
CD8 and CD4 mAbs and streptavidin MACS beads (Myltenyi) according to standard
rocedures. Balb/c and BL6 recipient mice were lethally irradiated with 2x450rad and
ted by injecting 6-8x10⁶ bone marrow cells into
HA107-119 peptide (SVSSFERFEIFPK, recognized by the TCR-HA in the d
92mg/ml L-Glutamin
p
2x550rad respectively and reconstitu
the tail vein. Chimeras were analyzed 5-6 weeks after reconstitution.
Antigen-presentation assay
2 x 10⁴ A5 T cell hybridoma cells were co-cultured with 1 – 2 x 10⁴ antigen presenting
cells (APC) in 200 µl IMDM supplemented with 1% FCS in 96-well round bottom
plates.
context of I-E ). GFP expression of A5 T cells was measured by flow-cytometry 19h
later.
In vitro assay
5 x 10⁴ CD4+SP thymocytes were co-cultered with 2.5x10⁴ thymic APCs in IMDM
supplemented 10% FCS, PenStrep glu?,b merc. H3 thymidine was added to the
culture on day 3 (1µCu/well) and thymidin incorporation was measured 19h later
using a scintillation counter.
Media for primary T cell culture
IMDM (Gibco)
10% FCS
0.2
100U/ml Streptomycin
100U/ml Penicilin
50μM β-Mercaptoethanol
77

Isolation of thymic epithelium
Thymi were disenthralled from connective tissue and fat, cut into very small pieces
using scissors and transferred to pre-warmed digestion medium (IMDM containing
0.2 mg/ml Collagenase (Roche), 0.2 mg/ml DispaseI (Roche), 2% FCS, 25mM
HEPES (pH 7.2) and 25 μg/ml DNase I). 1ml digestion medium was used per
thymus. Digestion was performed in a FACS tube at 37 °C; First the suspension was
mixed using a 1000µl pipette, later on the 200µl pipette was used to digest the
epithelial cells and DC out of the matrix. After about 45-50min the cell suspension
as transferred to 4°C followed by the addition of EDTA (5 mM final) for 5min at RT.
ended in PercollTM (ρ 1.115;
w
Cells were filtered and washed in PBS and resusp
GEHealthcare). A second layer of Percoll (ρ 1.055) and a third layer of FACS buffer
was carefully added on top.
The Percoll solutions were prepared as follows:
ρ 1.115 ρ 1.055
9x Percoll stock (ρ 1.134)
1x PBS (10x)
1x Percoll (ρ 1.115)
1.09x PBS (1x)
25mM HEPES pH=7.2 (final)
The densities were calculated according to the following formula:
Vy…volume of diluting solution (PBS)
Vi…volume of Percoll stock solution
) / (Dii-Dy) Di…density of Percoll stock solution
Di…desired density
Dy…density of PBS (=1)
Optionally the low density Percoll solution can be decreased or increased to ρ 1.050
acceleration and
ning the desired low density cell fraction,
as harvested and washed in FACS buffer. Cells were now ready for staining.
Vy= Vi x (Di-Dii
or ρ 1.060 respectively.
After that the gradient was centrifuged at 4°C and 1350g without
break for 30min. The upper interface, contai
w
78

RNA isolation
Total RNA was isolated from FACS sorted thymic stromal subsets using the
miRNAeasy kit (Qiagen) including an on column DNAseI (Qiagen) digest according
to the manufacturers recommendations.
Quantitative PCR RNA was reverse transcribed using the iScript cDNA synthesis kit (Biorad) according
ndations.
g conditions 94°C for 180sec
40x (plate read)
Primers:
quence
to the manufacturers recomme
qPCR reactions were performed in duplicates on a CFX96 realtime thermal cycler
(Biorad) using the myIQ sybrgreen mastermix (Biorad) in 10µl reactions according to
the manufacturers recommendations. Primers were used at 500nM each.
Cyclin
94°C for 10sec
56°C for 20sec
72°C for 20sec
Melting curve analysis
gene product se
actb 97bp 5´ GCCTTCCTTCTTGGGTAT 3´
5´ GGCATAGAGGTCTTTACGG 3´
Aire 117bp 5´ CCTTATCCAGCAGGTGTTT 3´
5´ CGGGCCTTGTTCTTCA 3´
HA 147bp 5´ GCTGGGAGGATGAACTATTA 3´
5´ CATTGATGCGTTTGAGGT 3´
H2-IA-alpha 185bp 5´ GGCTCAGAAATAGCAAGTCA 3´
5´ AATCTCAGGTTCCCAGTGTT 3´
79

C2TA 148bp 5´ CCTATGCCAACATTGCG 3´
5´ GGCTTCTGTCCTGCTTCTA 3´
H2-K (pan MHCI)
151bp 5´ GATTACATCGCCCTGAACG 3´
5´ GGTATCTGCGGAGCCACT 3´
Relative expression levels were calculated using the comparative Ct method using
actb for normalization.
Small RNA quantification
A custom small RNA assay for the detection of UUUCAUUGCACUGUGCCAGCCA
d by Applied Biosystems.
otal RNA including the smallRNA fraction was isolated from FACS sorted thymic
ubsets (see above) using Aeasy kit (QIAGEN) including an on
digest acc urers recommendations.
tely 21 cells ere verse transcribed using specific
RNA (snoRNA202) and the mature C2TA
it (Applied Biosystems) according to the manufacturers recommendations.
cDNA reactions were diluted 5 fold and ctions
were run in duplicate using primer / probe combinations for snoRNA202 and C2TAsh
pErase
UNG (Applied Biosystems) in 20ul to the manufacturer´s
recommendations. Fluorescence was step and relative
xpression levels were calculated with the comparative Ct method using snoRNA202
(mature C2TAsh) was designed and manufacture
T
stromal s the miRN
column DNAseI (QIAGEN) ording to the manufact
RNA equivalents of approxima 00 w re
RT primers for mouse small nucleolar
antisense shRNA (C2TAsh) (Applied Biosystems) using the TaqMan microRNA RT
k
used as template for PCR. PCR rea
(Applied Biosystems) and the TaqMan 2x Universal PCR Master Mix, No Am
reactions according
recorded at the annealing
e
for normalization.
80

Genotyping
ffer at 55°C for 5h. Proteinase K inactivation
was carried out at 95°C for 5min.
buffer (10x) 70mM Tris pH 8.8
.1% Gelatin
2.5μl Triton (10% Stock)
0x)
ethanol
for genotyping.
250mM KCl
0mM Tris pH 8.3
rol
7.5mM MgCl2
resol Red
il digest
2.5mM primers (final)
M dNTP (final)
PCR Buffer (1x final)
se
Ad 30μl with H2O
DNA preparation Tails were incubated in 50µl digestion bu
Gitocher digestion6
166mM ammonium sulfate
65mM MgCl2
0
Digestion buffer 3μl Proteinase K (10mg/ml stock)
5μl Gitocher Buffer (1
0.5μl β-Mercapto-
39μl H2O
Subsequently 1µl of the DNA was used
PCR Red-buffer (5x)
5
43% Glyce
2mM C
PCR reaction 1μl ta
200μ
Taq Polymera
81

All genotyping reactio ca am.
cycles
ns were rried out using the TD54x30 progr
TD54x30 3min at 94°N
45sec at 94°C
45sec at 60°C 2
60sec at 72°C
45sec at 94°C
45sec at 58°C 2 cycles
60sec at 72°C
45sec at 94°C
45sec at 56°C 2 cycles
60sec at 72°C
45sec at 94°c
45sec at 54°C 30 cycles
60sec at 72°C
10min at 72°C
Primers used for genotyping
gene primer sequence
CIITAkd MH40 fwd 5´ TAAATTCTGGCTGGCGTGG 3´
CIITAkd MH23 rev 5´ ACCGGACTAGTGGAAAAGCGCCTCCCCTACC 3´
TCR-HA 6.5 5´ fwd 5´ ACAAGGTGGCAGTAACAGGA 3´
TCR-HA 6.5 3´ rev 5´ ACAGTCAGTCTGGTTCCTGA 3´
AIRE-HA KA9 fwd 5´ ACAGCCACTCCTGTCTTTGC 3´
AIRE-HA HA3 rev 5´ CTCCGTCAGCCATAGCAAATTTCT 3´
82

pgk-HA HA 5 fwd 5´ GGCTACCATGCGAACAATTCAACCG 3´
pgk-HA HA 3 rev 5´ CTCCGTCAGCCATAGCAAATTTCTG 3´
AIRE-HCO KA9 fwd 5´ ACAGCCACTCCTGTCTTTGC 3´
AIRE-HCO JE12 rev 5´ GAATTGTTCGCATGGTAGCC 3´
DO11.10 DO11.10 5´ fwd 5´ CAGGAGGGATCCAGTGCCAGC 3´
DO11.10 DO11.10 3´ rev 5´ TGGCTCTACAGTGAGTTTGGT 3´
CD11c-Cre Cre 5´ fwd 5´ CGATGCAACGAGTGATGAGG 3´
CD11c-Cre Cre 3´ rev 5´ GCATTGCTGTCACTTGGTCGT 3´
DTA DTA 5´ fwd 5´ TACATCGCATCTTGGCCACG 3´
DTA DTA 3´ rev 5´ CCGACAATAAATACGACGCTG 3´
AIRE-Gfp GFP1 fwd 5´ AAGTTCATCTGCACCACCG 3´
AIRE-Gfp GFP2 rev 5´ TCCTTGAAGAAGATGGTGCG 3´
Rag2 Rag 5´ fwd 5´ GCAACATGTTATCCAGTAGCCGGT 3´
Rag2 rev Rag 3´ 5´ TTGGGAGGACACTCACTTGCCAGT 3´
Rag2 int Rag int 5´ GTATGCAGCCGCCGCATTGCATCA 3´
CIITA wt CIITA1869 fwd 5´ GATCGGAGACAAGGGTGTGT 3´
CIITA wt CIITA1870 rev 5´ GTCAGGGAGCAGGATCTTTG 3´
CIITA ko CIITA 158 fwd 5´ CTGAATGAACTGCAGGACGA 3´
CIITA ko CIITA 159 rev 5´ ATACTTTCTCGGCAGGAGCA 3´
MHCII MA295 fwd 5´ TTCGTGTACCAGTTCATGGG 3´
MHCII MA296 int 5´ TAGTTGTGTCTGCACACCGT 3´
MHCII MA297 rev 5´ CCTGCCGAGAAAGTATCCA 3´
83

6. REFERENCES 1. Cannon, J.P., R.N. Haire, J.P. Rast, and G.W. Litman. 2004. The phylogenetic
origins of the antigen-binding receptors and somatic diversification isms. Immunol Rev 200:12-22.
. 2004. Evolution of innate and adaptive immunity: can we draw a line? Trends Immunol 25:640-644.
K., S.C. Jameson, and K.A. Hogquist. 2003. Positive and negative T cells. Annu Rev Immunol 21:139-176.
M. Messerle, R. Waldschutz, K. Schuddekopf, A.J. nd T. Boehm. 1996. Two genetically separable steps in the
c epithelium. Science 272:886-889. . Nehls, M., D. Pfeifer, M. Schorpp, H. Hedrich, and T. Boehm. 1994. New
of the winged-helix protein family disrupted in mouse and rat nude Nature 372:103-107.
J., A t, C.C. Blackburn, and N.R. Manley. 2001. Gcm2 and ark early parathyroid- and thymus-specific domains in the developing
h. Mech Dev 103:141-143. . Bleul, C.C., T. Corbeaux, A. Reuter, P. Fisch, J.S. Monting, and T. Boehm.
ormation of a functional thymus initiated by a postnatal epithelial Nature 441:992-996.
C.C. . Boehm. 2000. Chemokines define distinct ironments in the developing thymus. Eur J Immunol 30:3371-3379.
awa, and T. Amagai. 2005. Lack of Delta like 1 and 4 expressions in nude thymus anlages. Cell Immunol 234:77-80.
rn, C.C., C.L. Augustine, R. Li, R.P. Harvey, M.A. Malin, R.L. Boyd, . The nu gene acts cell-autonomously and is
for d of thymic epithelial progenitors. Proc Natl Acad Sci :5742-5746.
N.F. Blair, J. Sheridan, A. Farley, L. Wilson, N.R. Manley, and C.C. Blackburn. 2004. Functional evidence for a single
al origin for the thymic epithelium. Nat Immunol 5:546-553. hi. 1995. The role of Hoxa-3 in mouse thymus
and thyroid development. Development 121:1989-2003. 3. Anderson, G., and E.J. Jenkinson. 2001. Lymphostromal interactions in thymic
. Nat Rev Immunol 1:31-40. n, R.G. Kelly, and V.E. Papaioannou. 2005. T-box
genes in vertebrate development. Annu Rev Genet 39:219-239. Lindsay F. Vitelli, Morishima, T. Huynh, T. Pramparo, V. Jurecic unrinu, H. nd, P.J. Scambler, A. Bradley, and A.
dini. haploi es tic a in micenley M.R. Celop migrati yroid glands. Bio lin, l, A. Ne Balling. 1996. i ed durin helium and is ire al T-cell
mechan2. Flajnik, M.F., and L. Du Pasquier
3. Starr, T.selection of
4. Nehls, M., B. Kyewski, Smith, adifferentiation of thymi
5member mutations.
6. Gordon, .R. BennetFoxn1 mthird pharyngeal pouc
72006. Fprogenitor cell.
8. Bleul, , and Tmicroenv
9. Tsukamoto, N., M. Itoi, M. Nishik
10. BlackbuJ.F. Miller, and G. Morahan. 1996required ifferentiationU S A 93
11. Gordon, J., V.A. Wilson,
endoderm12. Manley, N.R., and M.R. Capecc
1development and function
14. Naiche, L.A., Z. Harrelso
15. , E.A., , G. Og
H. Su, M. F. Sutherla
Bal 2001. Tbx1 nsufficieny in the DiGeorge syndrome region causaor
16. March defects, N.R., and
. Nature 410:97-101. apecchi. 1998. Hox group 3 paralogs regulate the
dev ment and on of the thymus, thyroid, and parathDev
17. Wall 195:1-15.J., H. Eibe ubuser, J. Wilting, H. Koseki, and R.
Pax1 s express g development of the thymus epitrequ d for norm maturation. Development 122:23-30.
84

18. Peters, ubuser, ficient ce la eal pou ial and b ab . Genes
r- , M. Scho H. Peters, and mic epithelial
32:11Ew o the mouse
15:214-217. Ew la 0. Stepwise
p mic m by thymocyte ent 127:1583-1591. er, E. C Richie. 1998.
Interde cortic and T-lineage commitmeHolland Wang urg, W. van
, koff, J erhorst. 1995. lo ntrol p regulated by a op rothymo
odew d H.J. Fehling. 1998. Molecular and cellular events in early A
rie, d W. Van mmunol 04-6uzin . Immuno Science :212si, ged, E nd lial progenitor ntia ing .
lysi mm nd medullary pitheli 41:98
. And 9. Ch ymic cortical pitheli munol
T. Kobayashi, Y. Choi, H.S. N. Minato. 2007. Medullary thymic epithelial cells expressing Aire represent a unique lineage derived from cells expressing claudin. Nat Immunol 8:304-311.
1. Farr, A.G., J.L. Dooley, and M. Erickson. 2002. Organization of thymic medullary epithelial heterogeneity: implications for mechanisms of epithelial differentiation. Immunol Rev 189:20-27.
2. Derbinski, J., J. Gabler, B. Brors, S. Tierling, S. Jonnakuty, M. Hergenhahn, L. Peltonen, J. Walter, and B. Kyewski. 2005. Promiscuous gene expression in thymic epithelial cells is regulated at multiple levels. J Exp Med 202:33-45.
3. Kyewski, B., and L. Klein. 2006. A central role for central tolerance. Annu Rev Immunol 24:571-606.
4. Gray, D., J. Abramson, C. Benoist, and D. Mathis. 2007. Proliferative arrest and rapid turnover of thymic epithelial cells expressing Aire. J Exp Med 204:2521-2528.
5. Anderson, M.S., E.S. Venanzi, Z. Chen, S.P. Berzins, C. Benoist, and D. Mathis. 2005. The cellular mechanism of Aire control of T cell tolerance. Immunity 23:227-239.
H., A. Ne K. Kratochwil, and R. Balling. 1998. Pax9-demilim
ck pharyngnormalities
ch derivatives and teeth and exhibit craniofac Dev 12:2735-2747.
19. Hetze Egger, C. rpp, A. Haas-Assenbaum, R. Balling, T. Boehm. 2002. Thymopoiesiscells. Eur J Immunol
requires Pax9 function in thy75-1181.
20. van ijk, W., E.W. Sh res, and A. Singer. 1994. Crosstalk in thymus.
21. van Immunol Todayijk, W., G. Hol nder, C. Terhorst, and B. Wang. 200
develosubsets.
ment of thyDevelopm
icroenvironments in vivo is regulated
22. Klug, D.B., C. Cart rouch, D. Roop, C.J. Conti, and E.R. pendence of
nt. Proc Natl Acad Sci U S Aal thymic epithelial cell differentiation
95:11822-11827. 23. er, G.A., B. , A. Nichogiannopoulou, P.P. Platenb
EwijkDeve
S.J. Burapmental co
.C. Gutierrez-Ramos, and C. Toint in induction of thymic cortex
subp ulation of p cytes. Nature 373:350-353. 24. R
thymocyte development. ald, H.R., an
dv Immunol 69:1-112. 25. Pet H.T., an Ewijk. 2002. Thymus by numbers. Nat I
3:626. Co
05. , J. 2002 logy. Plant a few cells, sprout a thymus.
296 0-2121. 27. Ros
BoyS.W., A.P. Chid.J. Jenkinson, a
y, S.M. Parnell, W.E. Jenkinson, H.S. Scott, R.L. G. Anderson. 2007. Redefining epithe
pote l in the develop thymus. Eur J Immunol 37:2411-241828. Rossi, S.W., W.E. Jenkinson, G. Ander
anason, and E.J. Jenkinson. 2006. Clonal
on progenitor for thymic cortical as reveals a coe
29. Shakib, S.,um. Nature 4
G.E. Desanti, W.E. Jenkinso8-991.
n, S.M. Parnell, E.J. Jenkinson, and G erson. 200 eckpoints in the development of the
30. Hamazaki, Y., H. Fujita, al cells. J Im 182:130-137.
Scott, M. Matsumoto, and
3
3
3
3
3
85

36. Akiyama, T., SMatsumoto, and J. Inoue. 2005. Depend
. Maeda, S. Yamane, K. Ogino, M. Kasai, F. Kajiura, M. ence of self-tolerance on TRAF6-
directed development of thymic stroma. Science 308:248-251.
signals from CD4(+)3(-) inducer cells
, M. Matsumoto, T. Nitta,
.
T. Akiyama, and Y. Takahama. 2008. The
.
of
43. . Gill, T. Nitta, Y. Hikosaka, I.R. Williams, F.X. Hubert,
polyendocrinopathy-
eral self. Nat
46.
ithin the thymus by the aire
47. genetic variation and nongenetic noise in Aire-regulated
48. A 105:14011-
14016.
37. Rossi, S.W., M.Y. Kim, A. Leibbrandt, S.M. Parnell, W.E. Jenkinson, S.H. Glanville, F.M. McConnell, H.S. Scott, J.M. Penninger, E.J. Jenkinson, P.J. Lane, and G. Anderson. 2007. RANK regulate development of Aire-expressing epithelial cells in the thymic medulla. J Exp Med 204:1267-1272.
38. Akiyama, T., Y. Shimo, H. Yanai, J. Qin, D. Ohshima, Y. Maruyama, Y. Asaumi, J. Kitazawa, H. Takayanagi, J.M. PenningerY. Takahama, and J. Inoue. 2008. The tumor necrosis factor family receptors RANK and CD40 cooperatively establish the thymic medullary microenvironment and self-tolerance. Immunity 29:423-437
39. Hikosaka, Y., T. Nitta, I. Ohigashi, K. Yano, N. Ishimaru, Y. Hayashi, M. Matsumoto, K. Matsuo, J.M. Penninger, H. Takayanagi, Y. Yokota, H. Yamada, Y. Yoshikai, J. Inoue,cytokine RANKL produced by positively selected thymocytes fosters medullary thymic epithelial cells that express autoimmune regulator. Immunity 29:438-450.
40. Chin, R.K., J.C. Lo, O. Kim, S.E. Blink, P.A. Christiansen, P. Peterson, Y. Wang, C. Ware, and Y.X. Fu. 2003. Lymphotoxin pathway directs thymic Aire expression. Nat Immunol 4:1121-1127
41. Boehm, T., S. Scheu, K. Pfeffer, and C.C. Bleul. 2003. Thymic medullary epithelial cell differentiation, thymocyte emigration, and the control autoimmunity require lympho-epithelial cross talk via LTbetaR. J Exp Med 198:757-769.
42. Martins, V.C., T. Boehm, and C.C. Bleul. 2008. Ltbetar signaling does not regulate Aire-dependent transcripts in medullary thymic epithelial cells. J Immunol 181:400-407. Irla, M., S. Hugues, JH.S. Scott, Y. Takahama, G.A. Hollander, and W. Reith. 2008. Autoantigen-specific interactions with CD4+ thymocytes control mature medullary thymic epithelial cell cellularity. Immunity 29:451-463.
44. Vogel, A., C.P. Strassburg, P. Obermayer-Straub, G. Brabant, and M.P. Manns. 2002. The genetic background of autoimmunecandidiasis-ectodermal dystrophy and its autoimmune disease components. J Mol Med 80:201-211.
45. Derbinski, J., A. Schulte, B. Kyewski, and L. Klein. 2001. Promiscuous gene expression in medullary thymic epithelial cells mirrors the periphImmunol 2:1032-1039. Anderson, M.S., E.S. Venanzi, L. Klein, Z. Chen, S.P. Berzins, S.J. Turley, H. von Boehmer, R. Bronson, A. Dierich, C. Benoist, and D. Mathis. 2002. Projection of an immunological self shadow wprotein. Science 298:1395-1401. Venanzi, E.S., R. Melamed, D. Mathis, and C. Benoist. 2008. The variable immunological self: transcription. Proc Natl Acad Sci U S A 105:15860-15865. Guerau-de-Arellano, M., D. Mathis, and C. Benoist. 2008. Transcriptional impact of Aire varies with cell type. Proc Natl Acad Sci U S
86

49. Villasenor, J., W. Besse, C. Benoist, and D. Mathis. 2008. Ectopic expression of peripheral-tissue antigens in the thymic epithelium: probabilistic, monoallelic, misinitiated. Proc Natl Acad Sci U S A 105:15854-15859.
J Immunol 37:838-848.
ston, C. Benoist, and D. Mathis. 2008.
HD finger of the
53.
ew structure for central
54. agi, P. Strobel, K. Moll, M.
transcription by autoimmune regulator AIRE and CBP. Biochem
55. , T. Org, M. Saare, J. Maslovskaja, K. Kisand, E. Juronen, L.
iol 27:8815-8823.
58. 2006. Spontaneous autoimmunity
59.
60. etcher, J. Wilson, K.E. Webster, H.S.
ction of organ-specific T cells. Nat Immunol 4:350-354.
specific for self antigen expressed and presented by Aire(+)
63. u, H.Y. Chang, M.F. Krummel, and M.S. Anderson.
50. Taubert, R., J. Schwendemann, and B. Kyewski. 2007. Highly variable expression of tissue-restricted self-antigens in human thymus: implications for self-tolerance and autoimmunity. Eur
51. Koh, A.S., A.J. Kuo, S.Y. Park, P. Cheung, J. Abramson, D. Bua, D. Carney, S.E. Shoelson, O. Gozani, R.E. KingAire employs a histone-binding module to mediate immunological tolerance, linking chromatin regulation with organ-specific autoimmunity. Proc Natl Acad Sci U S A 105:15878-15883.
52. Ragvin, A., H. Valvatne, S. Erdal, V. Arskog, K.R. Tufteland, K. Breen, O.Y. AM, A. Eberharter, T.J. Gibson, P.B. Becker, and R. Aasland. 2004. Nucleosome binding by the bromodomain and Ptranscriptional cofactor p300. J Mol Biol 337:773-788. Ferguson, B.J., C. Alexander, S.W. Rossi, I. Liiv, A. Rebane, C.L. Worth, J. Wong, M. Laan, P. Peterson, E.J. Jenkinson, G. Anderson, H.S. Scott, A. Cooke, and T. Rich. 2008. AIRE's CARD revealed, a ntolerance provokes transcriptional plasticity. J Biol Chem 283:1723-1731. Pitkanen, J., A. Rebane, J. Rowell, A. MurumSaare, J. Heikkila, V. Doucas, A. Marx, and P. Peterson. 2005. Cooperative activation ofBiophys Res Commun 333:944-953. Liiv, I., A. RebaneValmu, M.J. Bottomley, N. Kalkkinen, and P. Peterson. 2008. DNA-PK contributes to the phosphorylation of AIRE: importance in transcriptional activity. Biochim Biophys Acta 1783:74-83.
56. Oven, I., N. Brdickova, J. Kohoutek, T. Vaupotic, M. Narat, and B.M. Peterlin. 2007. AIRE recruits P-TEFb for transcriptional elongation of target genes in medullary thymic epithelial cells. Mol Cell B
57. Mathis, D., and C. Benoist. 2009. Aire. Annu Rev Immunol 27:287-312. DeVoss, J., Y. Hou, K. Johannes, W. Lu, G.I. Liou, J. Rinn, H. Chang, R.R. Caspi, L. Fong, and M.S. Anderson.prevented by thymic expression of a single self-antigen. J Exp Med 203:2727-2735. Gavanescu, I., B. Kessler, H. Ploegh, C. Benoist, and D. Mathis. 2007. Loss of Aire-dependent thymic expression of a peripheral tissue antigen renders it a target of autoimmunity. Proc Natl Acad Sci U S A 104:4583-4587. Liston, A., D.H. Gray, S. Lesage, A.L. FlScott, R.L. Boyd, L. Peltonen, and C.C. Goodnow. 2004. Gene dosage--limiting role of Aire in thymic expression, clonal deletion, and organ-specific autoimmunity. J Exp Med 200:1015-1026.
61. Liston, A., S. Lesage, J. Wilson, L. Peltonen, and C.C. Goodnow. 2003. Aire regulates negative sele
62. Aschenbrenner, K., L.M. D'Cruz, E.H. Vollmann, M. Hinterberger, J. Emmerich, L.K. Swee, A. Rolink, and L. Klein. 2007. Selection of Foxp3(+) regulatory T cellsmedullary thymic epithelial cells. Nat Immunol Gardner, J.M., J.J. Devoss, R.S. Friedman, D.J. Wong, Y.X. Tan, X. Zhou, K.P. Johannes, M.A. S
87

2008. Deletional tolerance mediated by extrathymic Aire-expressing cells. Science 321:843-847. Anderson, G., E.J. Jenkinson, N.C. Moore, and J.J. Owen. 1964. 93. MHC class
65.
ed 179:2027-2031.
67. 5. On the sparse
68.
69. ski, B.A. 1987. Seeding of thymic microenvironments defined by distinct
70. u, H. von Boehmer, and U.H. von
71. d H.J. Ziltener. 2005. Recruitment of adult thymic progenitors is
72. integrins during fetal and adult hematopoiesis. Cell
73.
ol 169:4354-4361.
75. op, A. Lepique, and H.T. Petrie. 2003. Critical role for
76. , L. Li, D. El-Khoury, M. Canelles, B.J. Fowlkes, and
77. nitors. Curr Opin Immunol 8:215-224.
79. moto, T. Nakahata,
decision. Int Immunol 14:637-645.
II-positive epithelium and mesenchyme cells are both required for T-cell development in the thymus. Nature 362:70-73. Anderson, G., J.J. Owen, N.C. Moore, and E.J. Jenkinson. 1994. Thymic epithelial cells provide unique signals for positive selection of CD4+CD8+ thymocytes in vitro. J Exp M
66. Goldschneider, I., K.L. Komschlies, and D.L. Greiner. 1986. Studies of thymocytopoiesis in rats and mice. I. Kinetics of appearance of thymocytes using a direct intrathymic adoptive transfer assay for thymocyte precursors. J Exp Med 163:1-17. Wallis, V.J., E. Leuchars, S. Chwalinski, and A.J. Davies. 197seeding of bone marrow and thymus in radiation chimaeras. Transplantation 19:2-11. Foss, D.L., E. Donskoy, and I. Goldschneider. 2001. The importation of hematogenous precursors by the thymus is a gated phenomenon in normal adult mice. J Exp Med 193:365-374. Kyewthymocyte-stromal cell interactions is developmentally controlled. J Exp Med 166:520-538. Scimone, M.L., I. Aifantis, I. ApostoloAndrian. 2006. A multistep adhesion cascade for lymphoid progenitor cell homing to the thymus. Proc Natl Acad Sci U S A 103:7006-7011. Rossi, F.M., S.Y. Corbel, J.S. Merzaban, D.A. Carlow, K. Gossens, J. Duenas, L. So, L. Yi, anregulated by P-selectin and its ligand PSGL-1. Nat Immunol 6:626-634. Arroyo, A.G., J.T. Yang, H. Rayburn, and R.O. Hynes. 1996. Differential requirements for alpha485:997-1008. Prockop, S.E., S. Palencia, C.M. Ryan, K. Gordon, D. Gray, and H.T. Petrie. 2002. Stromal cells provide the matrix for migration of early lymphoid progenitors through the thymic cortex. J Immun
74. Robertson, P., T.K. Means, A.D. Luster, and D.T. Scadden. 2006. CXCR4 and CCR5 mediate homing of primitive bone marrow-derived hematopoietic cells to the postnatal thymus. Exp Hematol 34:308-319. Plotkin, J., S.E. ProckCXCR4 signaling in progenitor localization and T cell differentiation in the postnatal thymus. J Immunol 171:4521-4527. Uehara, S., S.M. HayesP.E. Love. 2006. Premature expression of chemokine receptor CCR9 impairs T cell development. J Immunol 176:75-84. Zuniga-Pflucker, J.C., and M.J. Lenardo. 1996. Regulation of thymocyte development from immature proge
78. Shortman, K., and L. Wu. 1996. Early T lymphocyte progenitors. Annu Rev Immunol 14:29-47. Han, H., K. Tanigaki, N. Yamamoto, K. Kuroda, M. YoshiK. Ikuta, and T. Honjo. 2002. Inducible gene knockout of transcription factor recombination signal binding protein-J reveals its essential role in T versus B lineage
88

80. Sambandam, A., I. Maillard, V.P. Zediak, L. Xu, R.M. Gerstein, J.C. Aster, W.S. Pear, and A. Bhandoola. 2005. Notch signaling controls the generation and differentiation of early T lineage progenitors. Nat Immunol 6:663-670.
83. intrathymic-signaling environments by stem cell
84.
85. k. 2006. Critical role for
86. ma
87.
mocytes regulate proliferation and cell
88.
89. .J. Leonard, A.M. Baird, L.J. Berg,
T cell
91. and J.J. Peschon. 1996. Impaired survival and proliferation in IL-7
92. atol 20:998-
93.
:469-479.
95.
81. Tan, J.B., I. Visan, J.S. Yuan, and C.J. Guidos. 2005. Requirement for Notch1 signals at sequential early stages of intrathymic T cell development. Nat Immunol 6:671-679.
82. Schmitt, T.M., and J.C. Zuniga-Pflucker. 2002. Induction of T cell development from hematopoietic progenitor cells by delta-like-1 in vitro. Immunity 17:749-756. Porritt, H.E., K. Gordon, and H.T. Petrie. 2003. Kinetics of steady-state differentiation and mapping oftransplantation in nonirradiated mice. J Exp Med 198:957-962. Shortman, K., M. Egerton, G.J. Spangrude, and R. Scollay. 1990. The generation and fate of thymocytes. Semin Immunol 2:3-12. Massa, S., G. Balciunaite, R. Ceredig, and A.G. Rolinc-kit (CD117) in T cell lineage commitment and early thymocyte development in vitro. Eur J Immunol 36:526-532. Rodewald, H.R., M. Ogawa, C. Haller, C. Waskow, and J.P. DiSanto. 1997. Pro-thymocyte expansion by c-kit and the common cytokine receptor gamchain is essential for repertoire formation. Immunity 6:265-272. Staal, F.J., F. Weerkamp, M.R. Baert, C.M. van den Burg, M. van Noort, E.F. de Haas, and J.J. van Dongen. 2004. Wnt target genes identified by DNA microarrays in immature CD34+ thyadhesion. J Immunol 172:1099-1108. Wilson, A., W. Held, and H.R. MacDonald. 1994. Two waves of recombinase gene expression in developing thymocytes. J Exp Med 179:1355-1360. Durum, S.K., S. Candeias, H. Nakajima, Wand K. Muegge. 1998. Interleukin 7 receptor control of T cell receptor gamma gene rearrangement: role of receptor-associated chains and locus accessibility. J Exp Med 188:2233-2241.
90. Maki, K., S. Sunaga, and K. Ikuta. 1996. The V-J recombination of receptor-gamma genes is blocked in interleukin-7 receptor-deficient mice. J Exp Med 184:2423-2427. Maraskovsky, E., M. Teepe, P.J. Morrissey, S. Braddy, R.E. Miller, D.H. Lynch,receptor-deficient peripheral T cells. J Immunol 157:5315-5323. Vissinga, C.S., D.J. Fatur-Saunders, and F. Takei. 1992. Dual role of IL-7 in the growth and differentiation of immature thymocytes. Exp Hem1003. Schmitt, T.M., M. Ciofani, H.T. Petrie, and J.C. Zuniga-Pflucker. 2004. Maintenance of T cell specification and differentiation requires recurrent notch receptor-ligand interactions. J Exp Med 200
94. Taghon, T.N., E.S. David, J.C. Zuniga-Pflucker, and E.V. Rothenberg. 2005. Delayed, asynchronous, and reversible T-lineage specification induced by Notch/Delta signaling. Genes Dev 19:965-978. Petrie, H.T., F. Livak, D. Burtrum, and S. Mazel. 1995. T cell receptor gene recombination patterns and mechanisms: cell death, rescue, and T cell production. J Exp Med 182:121-127.
96. Muegge, K., M.P. Vila, and S.K. Durum. 1993. Interleukin-7: a cofactor for V(D)J rearrangement of the T cell receptor beta gene. Science 261:93-95.
89

97. a rearrangements during adult thymic development: T
98. etrie. 1999. Characterization of
99. uno, H.J. Fehling, and H. von
100. ev Immunol 15:433-452.
Immunol Lett 82:123-130.
n of the interleukin 2 receptor alpha chain. Eur J Immunol
104. cell lineage
105. tokine
106. lar microenvironment within the thymus is not an absolute
107. s maximize
108. f bromodeoxyuridine and
109. munoglobulin domains. Science
110.
ev Immunol 13:93-126.
Capone, M., R.D. Hockett, Jr., and A. Zlotnik. 1998. Kinetics of T cell receptor beta, gamma, and deltcell receptor rearrangements are present in CD44(+)CD25(+) Pro-T thymocytes. Proc Natl Acad Sci U S A 95:12522-12527. Livak, F., M. Tourigny, D.G. Schatz, and H.T. PTCR gene rearrangements during adult murine T cell development. J Immunol 162:2575-2580. Saint-Ruf, C., K. Ungewiss, M. Groettrup, L. BrBoehmer. 1994. Analysis and expression of a cloned pre-T cell receptor gene. Science 266:1208-1212. von Boehmer, H., and H.J. Fehling. 1997. Structure and function of the pre-T cell receptor. Annu R
101. Falk, I., and K. Eichmann. 2002. Heterogeneity of the DN4 (CD44-CD25-) subset of CD4-CD8- double negative thymocytes; dependence on CD3 signaling.
102. Vasseur, F., A. Le Campion, and C. Penit. 2001. Scheduled kinetics of cell proliferation and phenotypic changes during immature thymocyte generation. Eur J Immunol 31:3038-3047.
103. Petrie, H.T., M. Pearse, R. Scollay, and K. Shortman. 1990. Development of immature thymocytes: initiation of CD3, CD4, and CD8 acquisition parallels down-regulatio20:2813-2815. Tanigaki, K., M. Tsuji, N. Yamamoto, H. Han, J. Tsukada, H. Inoue, M. Kubo, and T. Honjo. 2004. Regulation of alphabeta/gammadelta T commitment and peripheral T cell responses by Notch/RBP-J signaling. Immunity 20:611-622. Moore, T.A., and A. Zlotnik. 1995. T-cell lineage commitment and cyresponses of thymic progenitors. Blood 86:1850-1860. Benz, C., K. Heinzel, and C.C. Bleul. 2004. Homing of immature thymocytes to the subcapsurequirement for T cell development. Eur J Immunol 34:3652-3663. Petrie, H.T., F. Livak, D.G. Schatz, A. Strasser, I.N. Crispe, and K. Shortman. 1993. Multiple rearrangements in T cell receptor alpha chain genethe production of useful thymocytes. J Exp Med 178:615-622. Penit, C. 1988. Localization and phenotype of cycling and post-cycling murine thymocytes studied by simultaneous detection osurface antigens. J Histochem Cytochem 36:473-478. Irving, B.A., F.W. Alt, and N. Killeen. 1998. Thymocyte development in the absence of pre-T cell receptor extracellular im280:905-908. Yamasaki, S., E. Ishikawa, M. Sakuma, K. Ogata, K. Sakata-Sogawa, M. Hiroshima, D.L. Wiest, M. Tokunaga, and T. Saito. 2006. Mechanistic basis ofpre-T cell receptor-mediated autonomous signaling critical for thymocyte development. Nat Immunol 7:67-75.
111. Jameson, S.C., K.A. Hogquist, and M.J. Bevan. 1995. Positive selection of thymocytes. Annu R
112. Zinkernagel, R.M., and P.C. Doherty. 1974. Restriction of in vitro T cell-mediated cytotoxicity in lymphocytic choriomeningitis within a syngeneic or semiallogeneic system. Nature 248:701-702.
90

113. Singer, A., K.S. Hathcock, and R.J. Hodes. 1981. Self recognition in allogeneic radiation bone marrow chimeras. A radiation-resistant host element dictates the self specificity and immune response gene phenotype of T-helper
114. ed amino acids that control TCR-MHC interaction. Annu
115. er, and P. Marrack. 1986. The T cell repertoire may be biased in favor of
116. 36.
ction? J Exp Med
118. e alphabeta T-cell receptor control thymic
119. bypasses pre-
120. (+) thymocyte survival. Nat Immunol
121. orton,
122. cytes are more sensitive to T cell
123. P. Skare, L.O. Klein, M.M. Davis, and C.Z. Chen.
124. H.P. Pircher,
125. ist, K.A., S.C. Jameson, W.R. Heath, J.L. Howard, M.J. Bevan, and F.R.
126. and J.H. Freed. 1993.
127. 96. The repertoire of T cells
128. broad repertoire of CD4+ T cells in H-
cells. J Exp Med 153:1286-1301. Marrack, P., J.P. Scott-Browne, S. Dai, L. Gapin, and J.W. Kappler. 2008. Evolutionarily conservRev Immunol 26:171-203. Blackman, M., J. Yague, R. Kubo, D. Gay, C. Coleclough, E. Palmer, J. KapplMHC recognition. Cell 47:349-357. Zerrahn, J., W. Held, and D.H. Raulet. 1997. The MHC reactivity of the T cell repertoire prior to positive and negative selection. Cell 88:627-6
117. Merkenschlager, M., D. Graf, M. Lovatt, U. Bommhardt, R. Zamoyska, and A.G. Fisher. 1997. How many thymocytes audition for sele186:1149-1158. Scott-Browne, J.P., J. White, J.W. Kappler, L. Gapin, and P. Marrack. 2009. Germline-encoded amino acids in thselection. Nature 458:1043-1046. Gounari, F., I. Aifantis, K. Khazaie, S. Hoeflinger, N. Harada, M.M. Taketo, and H. von Boehmer. 2001. Somatic activation of beta-catenin TCR signaling and TCR selection in thymocyte development. Nat Immunol 2:863-869. Ioannidis, V., F. Beermann, H. Clevers, and W. Held. 2001. The beta-catenin--TCF-1 pathway ensures CD4(+)CD82:691-697. Sun, Z., D. Unutmaz, Y.R. Zou, M.J. Sunshine, A. Pierani, S. Brenner-MR.E. Mebius, and D.R. Littman. 2000. Requirement for RORgamma in thymocyte survival and lymphoid organ development. Science 288:2369-2373. Davey, G.M., S.L. Schober, B.T. Endrizzi, A.K. Dutcher, S.C. Jameson, and K.A. Hogquist. 1998. Preselection thymoreceptor stimulation than mature T cells. J Exp Med 188:1867-1874. Li, Q.J., J. Chau, P.J. Ebert, G. Sylvester, H. Min, G. Liu, R. Braich, M. Manoharan, J. Soutschek,2007. miR-181a is an intrinsic modulator of T cell sensitivity and selection. Cell 129:147-161. Ashton-Rickardt, P.G., A. Bandeira, J.R. Delaney, L. Van Kaer,R.M. Zinkernagel, and S. Tonegawa. 1994. Evidence for a differential avidity model of T cell selection in the thymus. Cell 76:651-663. HogquCarbone. 1994. T cell receptor antagonist peptides induce positive selection. Cell 76:17-27. Marrack, P., L. Ignatowicz, J.W. Kappler, J. Boymel,Comparison of peptides bound to spleen and thymus class II. J Exp Med 178:2173-2183. Ignatowicz, L., J. Kappler, and P. Marrack. 19shaped by a single MHC/peptide ligand. Cell 84:521-529. Tourne, S., T. Miyazaki, A. Oxenius, L. Klein, T. Fehr, B. Kyewski, C. Benoist, and D. Mathis. 1997. Selection of a2Ma0/0 mice. Immunity 7:187-195.
91

129. Anderson, G., K.M. Partington, and E.J. Jenkinson. 1998. Differential effects of peptide diversity and stromal cell type in positive and negative selection in the thymus. J Immunol 161:6599-6603. Nakagawa, T., W. Roth, P. Wong, A. Nelson, A. Fa
130. rr, J. Deussing, J.A.
n of a subset of CD4+ thymocytes. Eur J Immunol
132. . Klein. 2009. Macroautophagy,
133. S. Niwa, H. Hayashi, Y. Takahama, and
134. r. 1987. Interaction between CD4 and class II
135.
137. tic mechanism in the differentiation of mature subsets
138. a, and E. Robey. 1996.
139.
140. amashita, S.O.
o CD4-8+TCRhi thymocytes. J Exp Med 181:1643-1651.
re required for differentiation of
Villadangos, H. Ploegh, C. Peters, and A.Y. Rudensky. 1998. Cathepsin L: critical role in Ii degradation and CD4 T cell selection in the thymus. Science 280:450-453.
131. Gommeaux, J., C. Gregoire, P. Nguessan, M. Richelme, M. Malissen, S. Guerder, B. Malissen, and A. Carrier. 2009. Thymus-specific serine protease regulates positive selectio39:956-964. Nedjic, J., M. Aichinger, N. Mizushima, and Lendogenous MHC II loading and T cell selection: the benefits of breaking the rules. Curr Opin Immunol 21:92-97. Murata, S., K. Sasaki, T. Kishimoto, K. Tanaka. 2007. Regulation of CD8+ T cell development by thymus-specific proteasomes. Science 316:1349-1353. Doyle, C., and J.L. StromingeMHC molecules mediates cell adhesion. Nature 330:256-259. Norment, A.M., R.D. Salter, P. Parham, V.H. Engelhard, and D.R. Littman. 1988. Cell-cell adhesion mediated by CD8 and MHC class I molecules. Nature 336:79-81.
136. Chan, S.H., D. Cosgrove, C. Waltzinger, C. Benoist, and D. Mathis. 1993. Another view of the selective model of thymocyte selection. Cell 73:225-236. Davis, C.B., N. Killeen, M.E. Crooks, D. Raulet, and D.R. Littman. 1993. Evidence for a stochasof T lymphocytes. Cell 73:237-247. Itano, A., P. Salmon, D. Kioussis, M. Tolaini, P. CorbellThe cytoplasmic domain of CD4 promotes the development of CD4 lineage T cells. J Exp Med 183:731-741. Yasutomo, K., C. Doyle, L. Miele, C. Fuchs, and R.N. Germain. 2000. The duration of antigen receptor signalling determines CD4+ versus CD8+ T-cell lineage fate. Nature 404:506-510. Brugnera, E., A. Bhandoola, R. Cibotti, Q. Yu, T.I. Guinter, Y. YSharrow, and A. Singer. 2000. Coreceptor reversal in the thymus: signaled CD4+8+ thymocytes initially terminate CD8 transcription even when differentiating into CD8+ T cells. Immunity 13:59-71.
141. Lundberg, K., W. Heath, F. Kontgen, F.R. Carbone, and K. Shortman. 1995. Intermediate steps in positive selection: differentiation of CD4+8int TCRint thymocytes int
142. Suzuki, H., J.A. Punt, L.G. Granger, and A. Singer. 1995. Asymmetric signaling requirements for thymocyte commitment to the CD4+ versus CD8+ T cell lineages: a new perspective on thymic commitment and selection. Immunity 2:413-425.
143. Yu, Q., B. Erman, A. Bhandoola, S.O. Sharrow, and A. Singer. 2003. In vitro evidence that cytokine receptor signals adouble positive thymocytes into functionally mature CD8+ T cells. J Exp Med 197:475-487.
92

144. He, X., V.P. Dave, Y. Zhang, X. Hua, E. Nicolas, W. Xu, B.A. Roe, and D.J. Kappes. 2005. The zinc finger transcription factor Th-POK regulates CD4 versus CD8 T-cell lineage commitment. Nature 433:826-833. Sun, G., X. Liu, P. Mercado, S.R. 145. Jenkinson, M. Kypriotou, L. Feigenbaum, P.
147. e commitment: a single switch. Immunity
148. sveld, and
on in the thymus. Eur J Immunol 29:1912-1918.
n of CD8 single-positive cells and induces
150.
151. R.E., L. Brent, and P.B. Medawar. 1953. Actively acquired
152. elium generate permanent tolerance in embryonically constructed
153.
155. Berns, H.
156. A. Coutinho, P. Pereira, N. Le Douarin, V. Thomas-Vaslin, O.
subset that inhibits this autoimmune potential. J Exp Med
158. f-tolerance maintained by activated T cells expressing IL-2
l 155:1151-1164.
. I. Suppression of mature peripheral non-tolerant T cells. Eur J Immunol 25:2563-2571.
Galera, and R. Bosselut. 2005. The zinc finger protein cKrox directs CD4 lineage differentiation during intrathymic T cell positive selection. Nat Immunol 6:373-381.
146. Aliahmad, P., and J. Kaye. 2008. Development of all CD4 T lineages requires nuclear factor TOX. J Exp Med 205:245-256. Hedrick, S.M. 2008. Thymus lineag28:297-299. Hendriks, R.W., M.C. Nawijn, J.D. Engel, H. van Doorninck, F. GroA. Karis. 1999. Expression of the transcription factor GATA-3 is required for the development of the earliest T cell progenitors and correlates with stages of cellular proliferati
149. Nawijn, M.C., R. Ferreira, G.M. Dingjan, O. Kahre, D. Drabek, A. Karis, F. Grosveld, and R.W. Hendriks. 2001. Enforced expression of GATA-3 during T cell development inhibits maturatiothymic lymphoma in transgenic mice. J Immunol 167:715-723. Hodgkin, P.D., W.R. Heath, and A.G. Baxter. 2007. The clonal selection theory: 50 years since the revolution. Nat Immunol 8:1019-1026. Billingham, tolerance of foreign cells. Nature 172:603-606. Ohki, H., C. Martin, M. Coltey, and N.M. Le Douarin. 1988. Implants of quail thymic epithquail/chick chimeras. Development 104:619-630. Ohki, H., C. Martin, C. Corbel, M. Coltey, and N.M. Le Douarin. 1987. Tolerance induced by thymic epithelial grafts in birds. Science 237:1032-1035.
154. Linsk, R., M. Gottesman, and B. Pernis. 1989. Are tissues a patch quilt of ectopic gene expression? Science 246:261. Uematsu, Y., S. Ryser, Z. Dembic, P. Borgulya, P. Krimpenfort, A. von Boehmer, and M. Steinmetz. 1988. In transgenic mice the introduced functional T cell receptor beta gene prevents expression of endogenous beta genes. Cell 52:831-841. Modigliani, Y.,Burlen-Defranoux, J. Salaun, and A. Bandeira. 1996. Establishment of tissue-specific tolerance is driven by regulatory T cells selected by thymic epithelium. Eur J Immunol 26:1807-1815.
157. Fowell, D., and D. Mason. 1993. Evidence that the T cell repertoire of normal rats contains cells with the potential to cause diabetes. Characterization of the CD4+ T cell 177:627-636. Sakaguchi, S., N. Sakaguchi, M. Asano, M. Itoh, and M. Toda. 1995. Immunologic selreceptor alpha-chains (CD25). Breakdown of a single mechanism of self-tolerance causes various autoimmune diseases. J Immuno
159. Modigliani, Y., P. Pereira, V. Thomas-Vaslin, J. Salaun, O. Burlen-Defranoux, A. Coutinho, N. Le Douarin, and A. Bandeira. 1995. Regulatory T cells in thymic epithelium-induced tolerance
93

160. Kappler, J.W., N. Roehm, and P. Marrack. 1987. T cell tolerance by clonal elimination in the thymus. Cell 49:273-280. Woodland, D.L., F.E. Lund, M.P. Happ,161. M.A. Blackman, E. Palmer, and R.B.
162. etrovirus mediating deletion of alpha beta T cells? Nature
163.
164. er, M., C. Benoist, and D. Mathis. 1994. Evidence for a single-
165. thymocytes by T cell receptor-induced
166. veral different cell surface molecules
167. 2. CD40 ligand
168. .M. Cheng, A.M. Akk, J. Alberola-Ila, G. Gong, T. Pawson, and
d for apoptosis of autoreactive thymocytes.
171. perturbs thymic selection and lymphoid
172.
175. mental abnormality of a T cell
176.
ic and suppressive T cells as a key function of the thymus in maintaining immunologic self-tolerance. J Immunol 162:5317-5326.
Corley. 1991. Endogenous superantigen expression is controlled by mouse mammary tumor proviral loci. J Exp Med 174:1255-1258. Woodland, D.L., M.P. Happ, K.J. Gollob, and E. Palmer. 1991. An endogenous r349:529-530. Kishimoto, H., and J. Sprent. 1997. Negative selection in the thymus includes semimature T cells. J Exp Med 185:263-271. Merkenschlagniche model of positive selection. Proc Natl Acad Sci U S A 91:11694-11698. Punt, J.A., B.A. Osborne, Y. Takahama, S.O. Sharrow, and A. Singer. 1994. Negative selection of CD4+CD8+ apoptosis requires a costimulatory signal that can be provided by CD28. J Exp Med 179:709-713. Kishimoto, H., and J. Sprent. 1999. Secontrol negative selection of medullary thymocytes. J Exp Med 190:65-73. Williams, J.A., S.O. Sharrow, A.J. Adams, and R.J. Hodes. 200functions non-cell autonomously to promote deletion of self-reactive thymocytes. J Immunol 168:2759-2765. Gong, Q., AA.C. Chan. 2001. Disruption of T cell signaling networks and development by Grb2 haploid insufficiency. Nat Immunol 2:29-36.
169. McCarty, N., S. Paust, K. Ikizawa, I. Dan, X. Li, and H. Cantor. 2005. Signaling by the kinase MINK is essential in the negative selection of autoreactive thymocytes. Nat Immunol 6:65-72.
170. Bouillet, P., J.F. Purton, D.I. Godfrey, L.C. Zhang, L. Coultas, H. Puthalakath, M. Pellegrini, S. Cory, J.M. Adams, and A. Strasser. 2002. BH3-only Bcl-2 family member Bim is requireNature 415:922-926. Rathmell, J.C., T. Lindsten, W.X. Zong, R.M. Cinalli, and C.B. Thompson. 2002. Deficiency in Bak and Baxhomeostasis. Nat Immunol 3:932-939. Calnan, B.J., S. Szychowski, F.K. Chan, D. Cado, and A. Winoto. 1995. A role for the orphan steroid receptor Nur77 in apoptosis accompanying antigen-induced negative selection. Immunity 3:273-282.
173. Sakaguchi, S. 2004. Naturally arising CD4+ regulatory t cells for immunologic self-tolerance and negative control of immune responses. Annu Rev Immunol 22:531-562.
174. Bonomo, A., and P. Matzinger. 1993. Thymus epithelium induces tissue-specific tolerance. J Exp Med 177:1153-1164. Asano, M., M. Toda, N. Sakaguchi, and S. Sakaguchi. 1996. Autoimmune disease as a consequence of developsubpopulation. J Exp Med 184:387-396. Itoh, M., T. Takahashi, N. Sakaguchi, Y. Kuniyasu, J. Shimizu, F. Otsuka, and S. Sakaguchi. 1999. Thymus and autoimmunity: production of CD25+CD4+ naturally anerg
94

177. Hori, S., T. Nomura, and S. Sakaguchi. 2003. Control of regulatory T cell development by the transcription factor Foxp3. Science 299:1057-1061. Fontenot, J.D., M.A. Gavin, and A.Y. Rudensky. 2003. Foxp178. 3 programs the
179. 4+CD25+ T regulatory cells. Nat Immunol 4:337-342.
re regulatory T cells requires
181. J.P. Rasmussen, J.D. Fontenot, V. Vasta, V.C. Manganiello, J.A.
182. absence of
183.
nol 2:301-306.
turally arising CD25+ CD4+ T
186. and nonregulatory T cell
187.
09:4368-4375.
190. 5. Development and function of agonist-induced
191. n for TGF-beta signaling in the development of natural
192.
ol
193.
development and function of CD4+CD25+ regulatory T cells. Nat Immunol 4:330-336. Khattri, R., T. Cox, S.A. Yasayko, and F. Ramsdell. 2003. An essential role for Scurfin in CD
180. Williams, L.M., and A.Y. Rudensky. 2007. Maintenance of the Foxp3-dependent developmental program in matucontinued expression of Foxp3. Nat Immunol 8:277-284. Gavin, M.A., Beavo, and A.Y. Rudensky. 2007. Foxp3-dependent programme of regulatory T-cell differentiation. Nature 445:771-775. Lin, W., D. Haribhai, L.M. Relland, N. Truong, M.R. Carlson, C.B. Williams, and T.A. Chatila. 2007. Regulatory T cell development in thefunctional Foxp3. Nat Immunol 8:359-368. Jordan, M.S., A. Boesteanu, A.J. Reed, A.L. Petrone, A.E. Holenbeck, M.A. Lerman, A. Naji, and A.J. Caton. 2001. Thymic selection of CD4+CD25+ regulatory T cells induced by an agonist self-peptide. Nat Immu
184. Apostolou, I., A. Sarukhan, L. Klein, and H. von Boehmer. 2002. Origin of regulatory T cells with known specificity for antigen. Nat Immunol 3:756-763.
185. Hsieh, C.S., Y. Liang, A.J. Tyznik, S.G. Self, D. Liggitt, and A.Y. Rudensky. 2004. Recognition of the peripheral self by nacell receptors. Immunity 21:267-277. Hsieh, C.S., Y. Zheng, Y. Liang, J.D. Fontenot, and A.Y. Rudensky. 2006. An intersection between the self-reactive regulatoryreceptor repertoires. Nat Immunol 7:401-410. Fontenot, J.D., J.P. Rasmussen, M.A. Gavin, and A.Y. Rudensky. 2005. A function for interleukin 2 in Foxp3-expressing regulatory T cells. Nat Immunol 6:1142-1151.
188. Yao, Z., Y. Kanno, M. Kerenyi, G. Stephens, L. Durant, W.T. Watford, A. Laurence, G.W. Robinson, E.M. Shevach, R. Moriggl, L. Hennighausen, C. Wu, and J.J. O'Shea. 2007. Nonredundant roles for Stat5a/b in directly regulating Foxp3. Blood 1
189. Antov, A., L. Yang, M. Vig, D. Baltimore, and L. Van Parijs. 2003. Essential role for STAT5 signaling in CD25+CD4+ regulatory T cell homeostasis and the maintenance of self-tolerance. J Immunol 171:3435-3441. D'Cruz, L.M., and L. Klein. 200CD25+Foxp3+ regulatory T cells in the absence of interleukin 2 signaling. Nat Immunol 6:1152-1159. Liu, Y., P. Zhang, J. Li, A.B. Kulkarni, S. Perruche, and W. Chen. 2008. A critical functioCD4+CD25+Foxp3+ regulatory T cells. Nat Immunol 9:632-640. Tang, Q., K.J. Henriksen, E.K. Boden, A.J. Tooley, J. Ye, S.K. Subudhi, X.X. Zheng, T.B. Strom, and J.A. Bluestone. 2003. Cutting edge: CD28 controls peripheral homeostasis of CD4+CD25+ regulatory T cells. J Immun171:3348-3352. Sansom, D.M., and L.S. Walker. 2006. The role of CD28 and cytotoxic T-lymphocyte antigen-4 (CTLA-4) in regulatory T-cell biology. Immunol Rev 212:131-148.
95

194. Wirnsberger, G., F. Mair, and L. Klein. 2009. Regulatory T cell differentiation of thymocytes does not require a dedicated antigen-presenting cell but is
195.
m bone marrow. J Immunol 171:3568-3575.
three major subsets of dendritic
198. .
199. . Anderson, and J.J. Owen. 1992. Studies on T cell
3-706.
l autoimmunity. J Exp Med
202. impact of thymic clonal deletion on the T
203.
b complex by isolated thymic stromal
205. izes the scope of central T
206. ansfer of self-determinants. Immunol Today 20:8-10.
transfer. J Exp Med 206:1505-
208. dullary thymic epithelial cells. Eur J
209.
105:657-662.
under T cell-intrinsic developmental control. Proc Natl Acad Sci U S A Wu, L., and K. Shortman. 2005. Heterogeneity of thymic dendritic cells. Semin Immunol 17:304-312.
196. Donskoy, E., D. Foss, and I. Goldschneider. 2003. Gated importation of prothymocytes by adult mouse thymus is coordinated with their periodic mobilization fro
197. Li, J., J. Park, D. Foss, and I. Goldschneider. 2009. Thymus-homing peripheral dendritic cells constitute two of thecells in the steady-state thymus. J Exp Med 206:607-622. Proietto, A.I., S. van Dommelen, P. Zhou, A. Rizzitelli, A. D'Amico, R.JSteptoe, S.H. Naik, M.H. Lahoud, Y. Liu, P. Zheng, K. Shortman, and L. Wu. 2008. Dendritic cells in the thymus contribute to T-regulatory cell induction. Proc Natl Acad Sci U S A 105:19869-19874. Jenkinson, E.J., Gmaturation on defined thymic stromal cell populations in vitro. J Exp Med 176:845-853.
200. Volkmann, A., T. Zal, and B. Stockinger. 1997. Antigen-presenting cells in the thymus that can negatively select MHC class II-restricted T cells recognizing a circulating self antigen. J Immunol 158:69
201. Ohnmacht, C., A. Pullner, S.B. King, I. Drexler, S. Meier, T. Brocker, and D. Voehringer. 2009. Constitutive ablation of dendritic cells breaks self-tolerance of CD4 T cells and results in spontaneous fata206:549-559. van Meerwijk, J.P., S. Marguerat, R.K. Lees, R.N. Germain, B.J. Fowlkes, and H.R. MacDonald. 1997. Quantitativecell repertoire. J Exp Med 185:377-383. Gallegos, A.M., and M.J. Bevan. 2004. Central tolerance to tissue-specific antigens mediated by direct and indirect antigen presentation. J Exp Med 200:1039-1049.
204. Humblet, C., A. Rudensky, and B. Kyewski. 1994. Presentation and intercellular transfer of self antigen within the thymic microenvironment: expression of the E alpha peptide-I-Acells. Int Immunol 6:1949-1958. Klein, L., B. Roettinger, and B. Kyewski. 2001. Sampling of complementing self-antigen pools by thymic stromal cells maximcell tolerance. Eur J Immunol 31:2476-2486. Viret, C., A.K. Barlow, and C.A. Janeway, Jr. 1999. On the intrathymic intercellular tr
207. Koble, C., and B. Kyewski. 2009. The thymic medulla: a unique microenvironment for intercellular self-antigen 1513. Gabler, J., J. Arnold, and B. Kyewski. 2007. Promiscuous gene expression and the developmental dynamics of meImmunol 37:3363-3372. Derbinski, J., S. Pinto, S. Rosch, K. Hexel, and B. Kyewski. 2008. Promiscuous gene expression patterns in single medullary thymic epithelial cells argue for a stochastic mechanism. Proc Natl Acad Sci U S A
96

210. Le Borgne, M., E. Ladi, I. Dzhagalov, P. Herzmark, Y.F. Liao, A.K. Chakraborty, and E.A. Robey. 2009. The impact of negative selection on
211. mic epithelial and dendritic cells. Eur J Immunol 38:1257-1263.
pressed in
213. the MHC class II
214. N gamma-induced MHC class I
215. van Ewijk, and R.A. Flavell. 1996.
216.
218. ranslational repressor of APETALA2 in
219. an, and M. Stoffel. 2004. A
220. .A. Calin, M. Fabbri, M.V. Iorio, M. Ferracin, M. Shimizu, S.E.
221. rger, M. Krawczyk, L.A. Otten, T.
hocyte syndrome). Cell 75:135-146.
LA-DOB in B cells. J Immunol 168:1780-1786.
thymocyte migration in the medulla. Nat Immunol 10:823-830. Millet, V., P. Naquet, and R.R. Guinamard. 2008. Intercellular MHC transfer between thy
212. Zeng, Y., E.J. Wagner, and B.R. Cullen. 2002. Both natural and designed micro RNAs can inhibit the expression of cognate mRNAs when exhuman cells. Mol Cell 9:1327-1333. Martin, B.K., K.C. Chin, J.C. Olsen, C.A. Skinner, A. Dey, K. Ozato, and J.P. Ting. 1997. Induction of MHC class I expression bytransactivator CIITA. Immunity 6:591-600. Gobin, S.J., A. Peijnenburg, V. Keijsers, and P.J. van den Elsen. 1997. Site alpha is crucial for two routes of IFtransactivation: the ISRE-mediated route and a novel pathway involving CIITA. Immunity 6:601-611. Chang, C.H., S. Guerder, S.C. Hong, W. Mice lacking the MHC class II transactivator (CIITA) show tissue-specific impairment of MHC class II expression. Immunity 4:167-178. Klein, L., K. Khazaie, and H. von Boehmer. 2003. In vivo dynamics of antigen-specific regulatory T cells not predicted from behavior in vitro. Proc Natl Acad Sci U S A 100:8886-8891.
217. Brennecke, J., A. Stark, R.B. Russell, and S.M. Cohen. 2005. Principles of microRNA-target recognition. PLoS Biol 3:e85. Chen, X. 2004. A microRNA as a tArabidopsis flower development. Science 303:2022-2025. Poy, M.N., L. Eliasson, J. Krutzfeldt, S. Kuwajima, X. Ma, P.E. Macdonald, S. Pfeffer, T. Tuschl, N. Rajewsky, P. Rorsmpancreatic islet-specific microRNA regulates insulin secretion. Nature 432:226-230. Cimmino, A., GWojcik, R.I. Aqeilan, S. Zupo, M. Dono, L. Rassenti, H. Alder, S. Volinia, C.G. Liu, T.J. Kipps, M. Negrini, and C.M. Croce. 2005. miR-15 and miR-16 induce apoptosis by targeting BCL2. Proc Natl Acad Sci U S A 102:13944-13949. LeibundGut-Landmann, S., J.M. WaldbuSuter, A. Fontana, H. Acha-Orbea, and W. Reith. 2004. Mini-review: Specificity and expression of CIITA, the master regulator of MHC class II genes. Eur J Immunol 34:1513-1525.
222. Steimle, V., L.A. Otten, M. Zufferey, and B. Mach. 1993. Complementation cloning of an MHC class II transactivator mutated in hereditary MHC class II deficiency (or bare lymp
223. Westerheide, S.D., P. Louis-Plence, D. Ping, X.F. He, and J.M. Boss. 1997. HLA-DMA and HLA-DMB gene expression functions through the conserved S-X-Y region. J Immunol 158:4812-4821.
224. Taxman, D.J., D.E. Cressman, and J.P. Ting. 2000. Identification of class II transcriptional activator-induced genes by representational difference analysis: discoordinate regulation of the DN alpha/DO beta heterodimer. J Immunol 165:1410-1416.
225. Nagarajan, U.M., J. Lochamy, X. Chen, G.W. Beresford, R. Nilsen, P.E. Jensen, and J.M. Boss. 2002. Class II transactivator is required for maximal expression of H
97

226. Khalil, H., F. Deshaies, A. Bellemare-Pelletier, A. Brunet, A. Faubert, G.A. Azar, and J. Thibodeau. 2002. Class II transactivator-induced expression of HLA-DO(beta) in HeLa cells. Tissue Antigens 60:372-382.
227. Ting, J.P., and J. Trowsdale. 2002. Genetic control of MHC class II expression. Cell 109 Suppl:S21-33.
229. . Interleukin-10 in
230. with NF-AT to bind
231.
ol Cell Biol 21:7078-7088.
.
-898.
236. . 2005. Conserved seed pairing, often
237. 2008. Thymus organogenesis. Annu Rev Immunol 26:355-
238.
ring lymphocytes influence maturation of the
239. J Exp Med 176:611-616.
matopoietic
241. ocytes does not require a dedicated antigen-presenting cell but is
242. r, G. Wirnsberger, and B. Kyewski. 2009. Antigen
228. Boss, J.M., and P.E. Jensen. 2003. Transcriptional regulation of the MHC class II antigen presentation pathway. Curr Opin Immunol 15:105-111. Annacker, O., C. Asseman, S. Read, and F. Powrie. 2003the regulation of T cell-induced colitis. J Autoimmun 20:277-279. Sisk, T.J., T. Gourley, S. Roys, and C.H. Chang. 2000. MHC class II transactivator inhibits IL-4 gene transcription by competingthe coactivator CREB binding protein (CBP)/p300. J Immunol 165:2511-2517. Zhu, X.S., and J.P. Ting. 2001. A 36-amino-acid region of CIITA is an effective inhibitor of CBP: novel mechanism of gamma interferon-mediated suppression of collagen alpha(2)(I) and other promoters. M
232. Yee, C.S., Y. Yao, P. Li, M.J. Klemsz, J.S. Blum, and C.H. Chang. 2004. Cathepsin E: a novel target for regulation by class II transactivator. J Immunol 172:5528-5534
233. Gourley, T.S., D.R. Patel, K. Nickerson, S.C. Hong, and C.H. Chang. 2002. Aberrant expression of Fas ligand in mice deficient for the MHC class II transactivator. J Immunol 168:4414-4419.
234. Wong, A.W., W.J. Brickey, D.J. Taxman, H.W. van Deventer, W. Reed, J.X. Gao, P. Zheng, Y. Liu, P. Li, J.S. Blum, K.P. McKinnon, and J.P. Ting. 2003. CIITA-regulated plexin-A1 affects T-cell-dendritic cell interactions. Nat Immunol 4:891
235. Doench, J.G., and P.A. Sharp. 2004. Specificity of microRNA target selection in translational repression. Genes Dev 18:504-511. Lewis, B.P., C.B. Burge, and D.P. Bartelflanked by adenosines, indicates that thousands of human genes are microRNA targets. Cell 120:15-20. Rodewald, H.R. 388. Shores, E.W., W. Van Ewijk, and A. Singer. 1991. Disorganization and restoration of thymic medullary epithelial cells in T cell receptor-negative scid mice: evidence that receptor-beathymic microenvironment. Eur J Immunol 21:1657-1661. Surh, C.D., B. Ernst, and J. Sprent. 1992. Growth of epithelial cells in the thymic medulla is under the control of mature T cells.
240. van Meerwijk, J.P., and H.R. MacDonald. 1999. In vivo T-lymphocyte tolerance in the absence of thymic clonal deletion mediated by hecells. Blood 93:3856-3862. Wirnsberger, G., F. Mair, and L. Klein. 2009. Regulatory T cell differentiation of thymunder T cell-intrinsic developmental control. Proc Natl Acad Sci U S A 106:10278-10283. Klein, L., M. Hinterbergepresentation in the thymus for positive selection and central tolerance induction. Nat Rev Immunol 9:833-844.
98

243. Kirberg, J., A. Baron, S. Jakob, A. Rolink, K. Karjalainen, and H. von Boehmer. 1994. Thymic selection of CD8+ single positive cells with a class II major histocompatibility complex-restricted receptor. J Exp Med 180:25-34.
lla
245. hort hairpin RNAs for gene knockdown in
246. ne transmission in transgenic mice
244. Murphy, D.B., D. Lo, S. Rath, R.L. Brinster, R.A. Flavell, A. Slanetz, and C.A. Janeway, Jr. 1989. A novel MHC class II epitope expressed in thymic medubut not cortex. Nature 338:765-768. Paddison, P.J., M. Cleary, J.M. Silva, K. Chang, N. Sheth, R. Sachidanandam, and G.J. Hannon. 2004. Cloning of smammalian cells. Nat Methods 1:163-167. Yang, X.W., P. Model, and N. Heintz. 1997. Homologous recombination based modification in Escherichia coli and germliof a bacterial artificial chromosome. Nat Biotechnol 15:859-865.
99

7. ACKNOWLEDGEMENTS
I would like to thank all the people working with me on my PhD project. Martin, Sonja
and Christine, without your support I would probably still be far away from writing my
ledgements today. acknow
fr
and F
Ludge
while a
Finally
n
giving
thank you for being my friend.
freedo
Specia the old crew
Jelena, Gerald and Martin. Moving together to Munich brought us closer together and
iendship means a lot to me. Also not to forget Kathi, Chris, Jan, Louise, Lilly
l thanks should also go to the whole Klein Lab, especially to
your
lorian, who have already left the lab. You have been great colleagues and I
ou all the best for your future. wish y
r, thank you for being a great mentor. Thank you for giving me the chance to
join your lab and leaving me any freedom during the work on this excellent project
lways supporting me with your inspiring ideas and discussions. I really learned
a lot from you during the last years!
, I want to thank my friends and family. Christian, thank you for always being
by my side especially during difficult phases here in Munich. I am fortunate to have
my life! Moni, thank you for being such a good frieyou i nd to me and for always
me advices that all seem to be right in the end. Ursi, sorry for leaving you back
in Vienna. You enrich my life in so many aspects and not only for that I wanted to
Thank should also go to my family, especially my parents, for giving me every
m of decision and for constantly supporting me in any aspect. Robi, thank you
for always listening to me.
100

8. Curriculum Vitae of Maria HINTERBERGER
Perso
nal Data
c803Ge
.deAddress: Da hauer Str. 24
35 Munich rmany
Telephone: +49-1781320347 e-mail: [email protected]
Date of Birth: Jan. 01, 1982 in Bad Ischl, Austria
Education
Nationality: Austria
Mar. 2008- present
Jan. 2006- Feb. 2008
PhD at the Ludwig-Maximilian University Munich Supervisor: Univ. Prof. Dr. Ludger Klein Title: Direct antigen presentation by medullary thymic epithelial cells is essential for CD4 T cell tolerance PhD at the Institute of Molecular Pathology in Vienna Supervisor: Univ. Prof. Dr. Ludger Klein Title: Direct antigen presentation by medullary thymic epithelial cells is essential for CD4 T cell tolerance
Dec. 2005 Diploma examination with distinction
Oct. 2004 –Nov.2005
Diploma Work at the Institute of Immunology in Vienna Supervisor: Univ. Prof. Dr. Hannes Stockinger Project Title: “Regulatory T cells – Identification and characterization of molecules critical for their function”
Jul. 2003 – Jan. 2004
Studies at Victoria University of Wellington/New Zealand
Since 2000 University of ViennaField of Study: Biology Branch of Study: Microbiology/Genetics (since Oct. 2002)
101

102
Work experience
tion of novel antigens for protection against infection by respective bacterial pathogen
• Cloning, expression and purification of recombinant antigens
Jul. 2004- Sep. 2004
Intercell AG Dept. Antigen Identification Molecular Biology Lab
• Identificathe
Apr. 2004- May. 2004
Institute for Genetics and Animal breeding (Veterinarian University)• Allele specific real time PCR • Cytokine quantification in mice by real time PCR
Meetings and conferences
June 2009 Oral presentation: “Kyoto T cell conference” in Kyoto Japan
May 2007 Poster presentation“Rolduc Thymus conference”
Publication list 1. Klein, L., M. Hinterberger, G. Wirnsberger, and B. Kyewski. 2009. Antigen
presentation in the thymusRev Immunol 9:833-844.
for positive selection and central tolerance induction. Nat
sed and presented by Aire(+) medullary thymic epithelial cells. Nat Immunol
3. Drbal, K., M. Moertelmaier, C. Holzhauser, A. Muhammad, E. Fuertbauer, S. Howorka, M. Hinterberger, H. Stockinger, and G.J. Schutz. 2007. Single-molecule microscopy reveals heterogeneous dynamics of lipid raft components upon TCR engagement. Int Immunol 19:675-684.
2. Aschenbrenner, K., L.M. D'Cruz, E.H. Vollmann, M. Hinterberger, J. Emmerich, L.K.
Swee, A. Rolink, and L. Klein. 2007. Selection of Foxp3(+) regulatory T cells specific for self antigen expres