dissertation mapping microclimate ph in biodegradable
TRANSCRIPT

MAPPING MICROCLIMATE PH IN BIODEGRADABLE
POLYMERIC MICROSPHERES
By
Yajun Liu
A dissertation submitted in partial fulfillment
of the requirements for the degree of Doctor of Philosophy
(Pharmaceutical Sciences) in the University of Michigan
2013
Doctoral Committee:
Professor Steven P. Schwendeman, Chair Research Professor Gregory E. Amidon Professor Mark E. Meyerhoff Associate Professor Naír Rodríguez-‐Hornedo

© Yajun Liu 2013

ii
DEDICATION
To my father Jie Liu, mother Guihua Guo, brother Zhibin Liu
To my husband Xiaofeng Wang

iii
ACKNOWLEDGEMENTS
First and foremost, I would like to express my deepest gratitude to my
advisor Dr. Steven P. Schwendeman for his guidance and continuous support
through my Ph.D. study. I have been very fortunate to have an advisor who is
exceptionally intelligent and knowledgeable in the field of biodegradable polymers
and controlled-‐release. His rigorous approach to science and zest for exploring the
challenging questions in research has been and will be a life-‐long inspiration to me. I
am especially grateful for his patience of mentoring me to be a solid scientist and
teaching me how to prepare scientific manuscripts and deliver good oral
presentations.
I would also like to thank the rest of my dissertation committee: Dr. Mark E.
Meyerhoff, Dr. Naír Rodríguez-‐Hornedo, and Dr. Gregory E. Amidon for their
precious time and generousness of offering constructive suggestions to my research.
My understanding on the projects benefited tremendously from every discussion we
had at research update meetings. My dissertation would not have been possible
without the keen insights and valuable feedback from all of you.

iv
My sincere thanks also go to our collaborators in Utrecht University from
Netherlands on the PLHMGA project. It has been a great privilege to work with Prof.
Wim E. Hennink and his students. I owe earnest thanks to him for his valuable
intellectual input, and to Dr. Amir H. Ghassemi for the contribution in supplying the
polymers and manuscript preparation, and to Sima Rahimian for her help in
synthesis of PLHMGA copolymers.
I would also like to thank Dr. Donald W. Schwendeman from Rensselaser
Polytechnic Institute for his generous help in the mathematical solution of
microclimate pH simulation.
I want to take this opportunity to thank Mr. Bruce Donohoe and Mr. Chris
Edwards at Microscopy and Image Analysis Laboratory at the University of Michigan
for training and help with confocal microscope.
I would like to thank my friend Zhenguang Huang from the College of
Engineering at the University of Michigan for his time and patience of helping me
with Matlab.
I am thankful to all the current and previous fellow lab-‐mates in Dr.
Schwendeman’s group: Dr. Kashappa Goud Desai, Dr. Vesna Milacic, Dr. Gwangseong
Kim, Dr. Ying Zhang, Dr. Xiao Wu, Karl Olsen, Ronak B. Shah, Brittany A. Bailey, Amy
Doty, Rae Sung Chang, Karthik Pisupati, J. Maxwell Mazzara, and Kellisa Hansen. I
appreciate their help and suggestions in experiments as well as all the after-‐work
fun we had that enriches the graduate experience. Special thanks to Dr. Ying Zhang

v
for teaching me the use of instruments and our lab manager Karl Olsen for always
being a helpful, kind and patient person to me. I couldn’t ask for a better rapport and
dynamic working environment that makes this journey enjoyable.
Many current and previous staff in the College of Pharmacy have helped me
along the way, including Pat Greeley, L.D. Heiber, Maria Herbel, Mark S. Nelson,
Antoinette Hopper, Jeanne Getty and Patrina Hardy. I am grateful for their kindness
and assistance.
I am truly indebted to my family, my parents Jie Liu and Guihua Guo, my
brother Zhibin Liu and my parents-‐in-‐law Shuqi Wang and Li Meng for their caring,
understanding and unwavering support through every decision I made during the
past. I owe special thanks to my beloved husband, Xiaofeng Wang, for always
standing by me, encouraging and believing in me. I consider myself the luckiest
person to have met and committed to him during graduate school. I would also
thank my M.S. advisor, Dr. Tuo Jin for introducing me to and intriguing my interest
in the field of PLGA delivery.
Finally, I would like to thank the various financial supports from: the College
of Pharmacy, the Rackham Graduate School, the University of Michigan Warner
Lambert/Parke Davis Fellowship, Gordon Amidon Fellowship and the National
Institutes of Health Grant (R01 HL 68345).

vi
Table of Contents
DEDICATION.............................................................................................................................. ii
ACKNOWLEDGEMENTS.........................................................................................................iii
LIST OF TABLES........................................................................................................................ x
LIST OF FIGURES ..................................................................................................................... xi
ABSTRACT...............................................................................................................................xvi
CHAPTER 1 Introduction....................................................................................................... 1
1.1 Biodegradable Polymeric Systems for Controlled Release Proteins ....................1 1.2 Poly(lactic-‐co-‐glycolic acid) (PLGA)....................................................................................2
1.2.1 Physico-‐chemical properties of PLGA .....................................................................3 1.2.2 PLGA degradation and erosion...................................................................................5 1.2.3 PLGA water-‐uptake kinetics ........................................................................................7
1.3 Microspheres Preparation.......................................................................................................9 1.4 Instability of Protein in PLGA Delivery Systems......................................................... 12
1.4.1 Instability mechanisms............................................................................................... 13 1.4.2 Stresses for protein instability ................................................................................ 13
1.5 Acidic Microenvironment in PLGA Microspheres...................................................... 17 1.5.1 Physical-‐chemical description of microclimate pH (μpH)........................... 17 1.5.2 Factors affecting μpH................................................................................................... 18 1.5.3 Formulation strategies for controlling μpH....................................................... 20 1.5.4 Evidence of acidic microclimate in PLGA............................................................ 21
1.5.4.1 Indirect evidence................................................................................................ 21 1.5.4.2 Techniques for direct measurement of μpH........................................... 22
1.6 Thesis Overview ....................................................................................................................... 28
CHAPTER 2 Mapping Microclimate pH Distribution inside Protein-encapsulated PLGA Microspheres Using Confocal Laser Scanning Microscopy.... .....................................................................................................................................................36

vii
2.1 Abstract ........................................................................................................................................ 36 2.2 Introduction................................................................................................................................ 37 2.3 Materials and Method............................................................................................................. 40
2.3.1 Materials ........................................................................................................................... 40 2.3.2 Preparation of microspheres ................................................................................... 40 2.3.3 Confocal laser scanning microscopy for microspheres imaging .............. 41 2.3.4 Calibrating fluorescence intensity ratio vs. pH in the presence of protein .......................................................................................................................................................... 42 2.3.5 Microclimate pH mapping inside microspheres.............................................. 43 2.3.6 Determination of protein loading and encapsulation efficiency .............. 44 2.3.7 Release and stability of protein from microspheres...................................... 44 2.3.8 Water-‐uptake of microspheres ............................................................................... 45 2.3.9 Correction of protein interference on μpH mapping..................................... 46
2.4 Results and Discussion .......................................................................................................... 47 2.4.1 Interference of protein on fluorescent response of the dye....................... 47 2.4.2 Correction of BSA effect on dye interference and BSA buffering capacity. .......................................................................................................................................................... 49 2.4.3 Mapping µpH distribution and kinetics in degrading PLGA microspheres .......................................................................................................................................................... 51 2.4.4 Assumptions for correction and anticipated error........................................ 55 2.4.5 Formulation effects on protein stability ............................................................. 56
2.5 Conclusions................................................................................................................................. 59 2.6 Supporting Information......................................................................................................... 67
CHAPTER 3 Investigation of the Microclimate pH in Degrading Microspheres of Hydrophilic Poly(D,L-lactide-co-hydroxymethyl glycolide) and PLGA ..............77
3.1 Abstract ........................................................................................................................................ 77 3.2 Introduction................................................................................................................................ 78 3.3 Materials and Methods .......................................................................................................... 80
3.3.1 Materials ........................................................................................................................... 80 3.3.2 Preparation of microspheres ................................................................................... 81 3.3.3 Microsphere morphology .......................................................................................... 82 3.3.4 Confocal laser scanning microscopy for microspheres imaging .............. 82 3.3.5 Standard curve of fluorescent intensity ratio vs. pH ..................................... 83 3.3.6 Microclimate pH distribution kinetics inside microspheres...................... 83 3.3.7 Quantification of water-‐soluble acids inside PLHMGAs and PLGA.......... 84 3.3.8 Determination of bodipy diffusivity in PLHMGA and PLGA microspheres .......................................................................................................................................................... 85
3.4 Results........................................................................................................................................... 86 3.4.1 Characteristics of PLHMGA copolymers.............................................................. 86

viii
3.4.2 Preparation of microspheres loaded with an acidic pH sensitive probe .... .......................................................................................................................................................... 87 3.4.3 Microclimate pH distribution inside degrading PLHMGA and PLGA microspheres.............................................................................................................................. 87
3.4.3.1 Effect of polymer composition on μpH distribution kinetics.......... 88 3.4.3.2 Effect of polymer concentration used for preparation of microspheres on μpH distribution kinetics........................................................... 89
3.4.4 Quantification of water-‐soluble acids in PLHMGAs and PLGA.................. 90 3.4.5 pH kinetics in the release media............................................................................. 91 3.4.6 Determination of diffusion coefficient of bodipy in PLHMGA and PLGA microspheres.............................................................................................................................. 91
3.5 Discussion.................................................................................................................................... 93 3.6 Conclusion .................................................................................................................................. 97 3.7 Supporting Information.......................................................................................................107
CHAPTER 4 Simulation of Microclimate pH Distribution and Kinetics inside Degrading PLGA Microspheres ...................................................................................... 113
4.1 Abstract ......................................................................................................................................114 4.2 Introduction..............................................................................................................................114 4.3 Theoretical Section................................................................................................................116
4.3.1 Basic Assumptions .....................................................................................................116 4.3.2 Quantitative treatment .............................................................................................117
4.4 Experimental Section............................................................................................................121 4.4.1 Materials .........................................................................................................................121 4.4.2 Preparation of PLGA microspheres.....................................................................121 4.4.3 Mean microsphere size determination..............................................................122 4.4.4 Separation and quantification of water-‐soluble acids ................................123 4.4.5 Estimation of initial concentration of water-‐soluble acids in polymer for μpH simulation ........................................................................................................................123 4.4.6 Production kinetics of water-‐soluble acids in PLGA microspheres ......124 4.4.7 Estimation of the effective diffusion coefficient of water-‐soluble acids in PLGA microspheres ...............................................................................................................125 4.4.8 Water-‐uptake in degrading PLGA microspheres...........................................126 4.4.9 μpH mapping of degrading PLGA microspheres using confocal laser scanning microscopy (CLSM)............................................................................................127
4.5 Results.........................................................................................................................................128 4.5.1 Microsphere size and morphology ......................................................................128
4.5.2 Estimation of the initial concentration of water-‐soluble acids (
€
C0,i) in
PLGA microspheres for μpH simulation.......................................................................128

ix
4.5.3 Determination of the production rate constant of water-‐soluble acids (
€
ki ) in degrading PLGA microspheres .........................................................................129 4.5.4 Estimation of the effective diffusion coefficient of water-‐soluble acids (
€
Di) in degraded PLGA microspheres ...........................................................................130 4.5.5 Simulation of μpH distribution and kinetics in degrading PLGA microspheres............................................................................................................................132 4.5.6 Effect of varying model parameters on simulated μpH..............................133
4.6 Discussion..................................................................................................................................134 4.7 Conclusion .................................................................................................................................137 4.8 Supporting Information .....................................................................................................148 Appendix............................................................................................................................................151
Chapter 5 Future Directions ........................................................................................... 156
APPENDIX Examination of the Influence of Water-soluble Acids in Carboxylic Acid-terminated PLGA on Peptide-PLGA Sorption.................................................. 159
A.1 Abstract ......................................................................................................................................159 A.2 Introduction .............................................................................................................................160 A.3 Materials and Method ..........................................................................................................162
A.3.1 Materials .........................................................................................................................162 A.3.2 Kinetics of acid content of RG502H during incubation ..............................162 A.3.3 Kinetics of water-‐soluble acids in incubation medium ..............................163 A.3.4 Peptide sorption kinetics to RG502H.................................................................164
A.4 Results and Discussion ........................................................................................................164 A.4.1 Evidence of free water-‐soluble acids in PLGA RG502H .............................164 A.4.2 Composition of water-‐soluble acids in release medium............................165 A.4.3 Sorption kinetics of peptides to RG502H .........................................................166 A.4.4 Effect of water-‐soluble acids on peptide-‐PLGA sorption...........................167
A.5 Conclusions...............................................................................................................................169

x
LIST OF TABLES
Table 2.1 pH comparison of concentrated BSA solution and average µpH after 1 day incubation from confocal microscopy after correction of protein interference. ........ 51 Table 2.2 Release and stability of various microsphere formulations after 28 days incubation. ................................................................................................................................................ 57 Table S2.1 pH distribution of mapped image from standard pH solution. .................. 68
Table 3.1 Characteristics of PLBMGA and PLHMGA copolymers. ................................... 87
Table 3.2 Diffusion coefficient of bodipy in degraded microspheres after 3 hours incubation in bodipy solution. .......................................................................................................... 93
Table S3.1 Diffusion coefficient of bodipy in PLGA 50/50 microspheres a after incubating with bodipy solution in PBST at 37°C for various times. .............................107 Table 4.1 Summary of parameters used for simulation of μpH distribution and kinetics in degrading PLGA microspheres. ...............................................................................132

xi
LIST OF FIGURES
Figure 2.1 Interference of confocal pH measurement of Lysosensor yellow/blue dextran as a function of pH (A) by the presence of 100 mg/ml of BSA (), 100 mg/ml of lysozyme (), or absence of protein (); (B) by the presence of BSA at the concentration of 0 mg/ml (), 25 mg/ml (), 50 mg/ml (), 75 mg/ml (), 100 mg/ml (), 150 mg/ml (), 200 mg/ml (), 250 mg/ml (), and 500 mg/ml (). The concentration of fluorescence dye was 1.2 mg/ml. Lines represent best fits to a third order polynormial function of the experimental data. SD for all data points were less than 2% of mean (n=8). * BSA formed a gel-‐like phase at this protein concentration and pH.......................................................................................................................................................... 61 Figure 2.2 Processed confocal images of microspheres encapsulating dye only (A); dye and BSA of pH of 3 (B); dye and BSA of pH of 4 (C); dye and BSA of pH of 5 (D); and dye and BSA of pH of 7 (E) after incubation at 37°C in PBST buffer for 1 day. The µpH was controlled by the inner water phase pH, as described in Materials and Methods....................................................................................................................................................... 62 Figure 2.3 µpH distribution kinetics of microspheres encapsulating (A) dye and BSA of pH of 3 (); dye and BSA of pH of 4 (); dye and BSA of pH of 5 (); and dye and BSA of pH of 7 () (B) dye only () and dye with BSA (pH of 7)() after incubation at 37°C in PBST buffer for 1 day. The µpH was controlled by the inner water phase pH, as described in Materials and Methods. ..................................................... 63 Figure 2.4 Processed confocal images of microsphere formulations during incubation in PBST at 37°C for 4 weeks. Microspheres were prepared from 40% (w/v) PLGA (A), 40% (w/v) PLGA + MgCO3 (B), 40% (w/v) PLGA + acetate buffer (C) and 30% (w/v) PLGA (D). Images were taken at 1 (A1-‐D1), 7 (A2-‐D2), 14 (A3-‐D3), 21 (A4-‐D4) and 28 (A5-‐D5) days. ....................................................................................................... 64 Figure 2.5 µpH distribution kinetics of microsphere formulations during incubation in PBST at 37°C for 1 day (), 7 days (), 14 days (), 21 days (), and 28 days (). Microspheres were prepared from 40% (w/v) PLGA (A), 40% (w/v) PLGA + MgCO3 (B), 40% (w/v) PLGA + acetate buffer (C) and 30% (w/v) PLGA (D). ........................... 65

xii
Figure 2.6 Kinetics of protein release (A), water uptake of microspheres (B), and estimated protein concentration in polymer pores (C) from PLGA microsphere formulations during incubation in PBST at 37°C for 4 weeks. Microspheres were prepared from 40% (w/v) PLGA (), 40% (w/v) PLGA + MgCO3 (), 40% (w/v) PLGA + acetate buffer () and 30% (w/v) PLGA (). Symbols represent mean ± SD, n=3 for A and B, SD is not applicable for C because the value is calculated from independent parameters from equation 3. ................................................................................. 66
Figure S2.1 The BSA concentration dependency of fluorescence intensity ratio of Lysosensor yellow/blue® dextran at pH 2.8 (), 3.4 (), 4.2 (), 4.9 () and 5.7 (). The concentration of dye was 1.2 mg/ml..................................................................................... 70 Figure S2.2 The pH sensitivity curves of Lysosensor yellow/blue® dextran in presence of 75mg/ml BSA plotted from fitting experiment data (— solid line) and predicted equation (-‐-‐ dashed line). ............................................................................................... 71 Figure S2.3 The pH sensitivity of confocal pH measurement of Lysosensor yellow/blue® dextran at concentration of 0.8 mg/ml (), 1.2 mg/ml (), and 2.0 mg/ml () in presence of 100 mg/ml of BSA (A) and lysozyme (B). Lines represent best fits to a third order polynormial function of experimental data. ............................. 72 Figure S2.4 Fluorescence spectrum of Lysosensor yellow/blue® dextran in the absence (— solid line) and presence of 10 mg/ml BSA (-‐-‐dashed line) in PBST (pH=7.4). The concentration of dye was 1.0 mg/ml................................................................ 73 Figure S2.5 Comparison of µpH kinetics in microspheres estimated from protein concentration calculated from measured water uptake (), 120% of measured water uptake (), 80% of measured water uptake () at 1 day (A, D), 14 days (B, E) and 28 days (C, F). Microspheres were prepared from 40% (w/v) PLGA (A-C) and 40% (w/v) PLGA + MgCO3 (D-F). ............................................................................................................... 74 Figure 3.1 Scanning electron micrographs of microspheres prepared from PLHMGA 75/25 with 25 % w/w (A), 30 % w/w (B), 35 % w/w (C) polymer solution concentration, and PLHMGA 65/35 (D) and PLGA 50/50 (E) prepared from a 35 % w/w solution concentration. ............................................................................................................. 99
Figure 3.2 The pH sensitivity of confocal measurement of Lysosensor yellow/blue® dextran at concentration of 2 mg/ml (), 1.2 mg/ml () and 0.8 mg/ml (). The third-‐order polynomial curve fitting the data was Y = -‐0.0582 x3+0.7221 x2-‐2.5676 x+3.0213, where Y = I450nm/I520nm and x = pH, r2=0.999. .....................................................100
xiii
Figure 3.3 Processed confocal images of (A) PLHMGA 65/35, (B) PLHMGA 75/25 and (C) PLGA 50/50 microspheres during incubation in PBST at 37 °C for 4 weeks. Images were taken at 1 (A1-‐C1), 7 (A2-‐C2), 14 (A3-‐C3), 21 (A4-‐C4) and 28 (A5-‐C5) days……………………................................................................................................................................101 Figure 3.4 The μpH distribution kinetics of microsphere formulations during incubation at 37ºC in PBST for 1 day (), 7 days (), 14 days (), 21 days () and 28 days (). Microspheres were prepared from (A) PLHMGA 65/35, (B) PLHMGA 75/25 and (C) PLGA 50/50, and sieved to 20-‐45μm size for the confocal pH mapping study. ......................................................................................................................................102 Figure 3.5 Processed confocal images of PLHMGA 75/25 microspheres made from (A) 25% w/w (B) 30% w/w (C) 35% w/w of polymer concentration during incubation in PBST at 37 °C for 4 weeks. Images were taken at 1 (A1-‐C1), 7 (A2-‐C2), 14 (A3-‐C3), 21 (A4-‐C4), 28 (A5-‐C5) days. ......................................................................................103 Figure 3.6 The μpH distribution kinetics of microsphere formulations during incubation at 37ºC in PBST for 1 day (), 7 days (), 14 days (), 21 days (), and 28 days (). Microspheres were prepared from PLHMGA 75/25 of (A) 25 % w/w (B) 30 % w/w and (C) 35 % w/w of polymer concentration, and sieved to 20-‐45μm size for the confocal pH mapping study. ....................................................................................104 Figure 3.7 Comparison of PLHMGA and PLGA kinetics of total extracted water-‐soluble acid by titration (A) and pH in the erosion medium (B) recorded for PLHMGA 65/35 (), PLHMGA 75/25 (■) and PLGA 50/50 (▲) microspheres during incubation in PBST at 37 ºC for 4 weeks. The buffer was changed weekly for both experiments and the pH was measured before each buffer change. Symbols represent mean ± SD (n=3). ...........................................................................................................105 Figure 3.8 Representative CLSM micrographs of the 3-‐h developed fluorescent intensity gradients of bodipy in (A) PLHMGA 6535 (B) PLHMGA 7525 and (C) PLGA5050 microspheres, which had undergone 0 (A1-‐C1), 1 (A2-‐C2), 3 (A3-‐C3) and 7 (A4-‐C4) days of degradation under physiological conditions. The scale bar represents 20 µm. ........................................................................................................................................................106 Figure S3.1 Examples of measured and fitted probe concentration profiles inside (A) PLHMGA 6535 (R2=0.97), (B) PLHMGA 7525 (R2=0.99) and (C) PLGA 5050 microspheres (R2=0.98) after 3 hour probe uptake. Microspheres were pre-‐incubated in PBST at 37°C for 3 days. .........................................................................................108

xiv
Figure S3.2 μpH distribution kinetics of PLHMGA 75/25 microspheres during incubation at 37ºC in PBST for 1 day (), 7 days (), 14 days (), 21 days () and 28 days (). ...........................................................................................................................................109 Figure 4.1 Representative SEM micrograph of blank PLGA microspheres that were sieved for the size range of 45 to 63 μm. ...................................................................................139 Figure 4.2 HPLC chromatogram of water-‐soluble PLGA degradation products after conversion to bromophenol esters recovered from microspheres incubated in humid environment at 37°C for 2 weeks. Peak assignment: (1) solvent; (2) glycolic acid; (3) lactic acid; (4) lactoyllactic acid; (5) impurity; and (6) excess reagent of pBPB. .........................................................................................................................................................140 Figure 4.3 The fitted pseudo-‐first order kinetics of glycolic acid (), lactic acid (), and lactoyllactic acid () recovered from PLGA microspheres during degradation in humid environment at 37°C for 4 weeks. The fitted equation are y=0.0834x-‐7.4177, R2=0.995; y=0.0132x-‐5.6004, R2=0.868 and y=0.0790x-‐8.2066, R2=0.954, where y is the natural log of the concentration of acid in the polymer and x is the degradation time for glycolic acid, lactic acid and lactoyllactic acid, respectively. Symbols represent mean ± SD (n=3). ............................................................................................................141 Figure 4.4 Fraction of accumulative release of glycolic acid () lactic acid and () lactoyllactic acid () from pre-‐degraded PLGA microspheres during 24 hours incubation at 37°C in water. Symbols represent mean ± SD (n=3). ...............................142 Figure 4.5 Water-‐uptake kinetics in degrading PLGA microspheres incubated in PBST buffer at 37°C for 4 weeks. Symbols represent mean ± SD (n=3). .....................143 Figure 4.6 Simulated μpH distribution kinetics presented as (A) pH vs. radial position (r/R); and (B) pH vs. probability in PLGA microspheres after 7 days (red), 14 days (green), 21 days (yellow) and 28 days (blue) of degradation at 37 °C.........144 Figure 4.7 Processed confocal images of degrading PLGA microspheres containing fluorescent probe (Lysosensor Yellow/Blue® Dextran) during incubation in PBST buffer at 37 °C for 4 weeks. Images were taken after (A) 7; (B) 14; (C) 21; and (D) 28 days incubation. .............................................................................................................................145
Figure 4.8 μpH distribution kinetics in degrading PLGA microspheres after incubation at 37°C in PBST buffer for 7 day (), 14 days (), 21 days (), 28 days () measured by CLSM. ....................................................................................................................146

xv
Figure 4.9 Comparison of simulated μpH distribution inside degrading PLGA microspheres after 14 days incubation by varying the value of (A) the mean radius of microspheres (R) to 125 % of the experimental value (blue), the experimental value (green) and 75% of the experimental value (red); (B) the initial concentration
of water-‐soluble acids (
€
C0,i); C) the production rate constant of water-‐soluble acids
(
€
ki ); and D) the diffusion coefficient of water-‐soluble acids (
€
Di) to 200 % of the experimental value (blue), the experimental value (green) and 50 % of the experimental value (red). .................................................................................................................147 Figure S4.1 Fitting graphs of fraction of accumulative acid release vs. incubation time to eq 17 in pre-‐degraded PLGA microspheres incubated in water for 24 hours. The correlation coefficient R2 is 0.9968, 0.9445 and 0.9916 for glycolic acid, lactic acid and lactoyllactic acid, respectively. ....................................................................................150 Figure A.1 Kinetics of acid number of RG502H during incubation in PBS (○) (10 mM, pH 7.4) and HEPES (●) buffer (10mM, pH 7.4) at 37°C for 24 hours. .................170 Figure A.2 Kinetics of glycolic acid (●), lactic acid (■), and lactoyllactic acid () in incubation medium (PBS, 10 mM, pH=7.4) released from 300mg RG502H under incubation at 37 °C for 24 hours. ..................................................................................................171 Figure A.3 Kinetics of total carboxylic acids from 300mg RG502H incubated in PBS buffer (10 mM, pH=7.4) at 37ºC for 24 hours calculated from acid number in polymer and the amount of acids in incubation medium quantified by HPLC. ........172 Figure A.4 Sorption kinetics of (A) octreotide and (B) leuprolide to RG502H incubated in PBS (10 mM, pH=7.4) buffer at 37 °C. ..............................................................173 Figure A.5 Sorption kinetics of (A) octreotide and (B) leuprolide to RG502H after incubation in PBS (10 mM, pH=7.4) buffer for 1 h with and without prior removal of free water-‐soluble acids liberated by RG502H that were pre-‐incubated in PBS at 37°C. ...........................................................................................................................................................174 Figure SA.1 Kinetics of acid number of RG502H during incubation in PBS (○) (10 mM, pH=7.4) buffer at 37°C for 24 hours. .................................................................................175 Figure SA.2 Sorption kinetics of (A) octreotide and (B) leuprolide to RG502H incubated in PBS (10 ßmM, pH=7.4) buffer at 37 °C for 24 hours. ................................176

xvi
ABSTRACT
The microclimate inside microspheres prepared from biodegradable
polymers (e.g., poly(lactic-‐co-‐glycolic acid) PLGA) often becomes acidic owing to the
accumulation of water-‐soluble polymer degradation products, which can induce the
destablization of encapsulated therapeutic agents. The objective of this dissertation
was to quantitatively evaluate the microclimate pH (μpH) inside biodegradable
polymeric microspheres in order to facilitate the development of microsphere
formulations that control μpH and stabilize acid-‐labile drugs. Chapter 1 presents an
overview of the background of these studies with a focus on the most common
biodegradable polymer, PLGA. In Chapter 2, the μpH distribution inside protein-‐
encapsulated PLGA microspheres was accurately quantified using a ratiometric
method based on confocal laser scanning microscopy (CLSM). The fluorescent
response of Lysosensor yellow/blue® dextran used to map acidic µpH in PLGA was
influenced by the presence of encapsulated protein. A method for correction of the
interference of protein was developed and validated. The µpH kinetics in four
different PLGA microsphere formulations during incubation under physiological
conditions were determined to be roughly pH 4 to neutral pH depending on the
formulation. Based on previous literature findings of enhanced stability of

xvii
encapsulated proteins and peptides in hydrophilic and biodegradable poly(lactic-‐co-‐
hydroxymethyl glycolic acid) (PLHMGA) microspheres, the μpH distribution and
kinetics in the microspheres prepared from PLHMGAs were evaluated in Chapter 3
by CLSM and compared that with their PLGA counterparts. The PLHMGA
microspheres developed a far more neutral μpH than PLGA, which was linked to
more rapid diffusion of acidic degradation products out of the polymer. In the last
chapter, a mathematical model was developed to simulate the μpH kinetics and
spatial distribution inside degrading PLGA microspheres by considering the acid
production, mass transfer via diffusion and partition of water-‐soluble acids that
contribute to the development of μpH. Fundamental parameters in the PLGA
microspheres were determined from experiments to validate the model. The model
successfully predicted the kinetics of μpH development, whereas showing a small
difference in distribution compared to experimental results. Hence, these
mechanistic approaches may provide valuable experimental and theoretical tools to
control μpH inside the most commonly used biodegradable polymer for controlled
release of acid-‐labile therapeutics.

1
CHAPTER 1
Introduction
1.1 Biodegradable polymeric systems for controlled release
proteins
Therapeutic proteins currently represent a promising and fast growing
market globally. Sales for therapeutic proteins are increasing and their market share
is projected to reach around 30% of the industrial drug pipeline by 2017 [1].
However, the successful development of protein therapeutics is still facing
tremendous formulation challenges. Non-‐invasive routes of administration (e.g.,
oral, nasal, pulmonary) often result in poor absorption and low bioavailability.
Therefore, routine parenteral administration with a syringe and needle remains the
most common method to deliver therapeutic proteins [2]. However, frequent
injections are often needed due to the short in vivo half-‐lives of most proteins,
leading to poor patient compliance in addition to causing inconvenience and
psychological stress for patients. Hence, there is substantial need to develop new
and better methods for successful delivery of therapeutic proteins.

2
Among these methods, injectable biodegradable polymers that can provide
slow and continuous protein release over duration of weeks to months have
attracted tremendous research interest. Because of this sustained-‐release
approcach, the injection frequency of therapeutic proteins can be sharply reduced,
thus improving patient comfort and compliance. They can also protect proteins from
in vivo degradation, and reduce toxicity by controlling the drug’s blood
concentration [3]. The local sustained-‐release of growth factors and other
therapeutic proteins also has demonstrated the potential for clinical use in tissue
engineering, where local release of proteins at appropriate times promotes tissue
regeneration [4-‐6]. Moreover, application of controlled-‐release polymers to antigen
delivery presents great promises for their ability of enhancing immune response as
well as reducing the number of vaccinations [7, 8].
Various drug-‐carrying devices formulated from biodegradable polymers
have been reported, including: microspheres, microcapsules, nanoparticles, pellets,
implant, and films. Among these configurations, polymeric microspheres are the
most common dosage form for prolonged delivery of proteins and peptides. They
are usually administered as depot via subcutaneous or intramuscular injection, with
the size in the range of 1 to 250 μm (ideally less than 125 μm) [9]. Specific release
profiles of therapeutic drugs may be generated by manipulating the properties of
the polymer and microspheres such as polymer composition, molecular weight,
microsphere size, porosity, etc. Commercially available examples are the products of

3
human growth hormone (Nutropin Depot, Genetech), leuprolide acetate (Lupron
Depot, Takeda Chemical), and octreotide acetate (Sandostatin LAR Depot,
Novartis).
1.2 Poly(lactic-co-glycolic acid) (PLGA)
Following the entry of bioresorbable surgical sutures into the market,
poly(lactic-‐co-‐glycolic acid) (PLGA) emerged as the most investigated biodegradable
polymer during the past few decades for the purpose of sustained delivery of a
variety of drug classes such as vaccines, peptides, proteins, nucleic acids, etc. [8, 10-‐
15]. They degrade by bulk erosion via hydrolysis in physiological environment to
non-‐toxic products that are eventually safely eliminated by the body. Because of
their favorable biocompatibility, biodegradability and low immunogenicity; they are
one of only a few polymers widely used in US Food and Drug Administration (FDA)
approved pharmaceutical products and medical devices.
1.2.1 Physico-chemical properties of PLGA
PLGA copolymer is composed of monomers of lactic acid and glycolic acid,
whose structures are shown as follows:

4
Glycolic acid D-Lactic acid L-Lactic acid
Both lactic acid and glycolic acid are α-‐hydroxy acids with a pKa at 25°C of
3.86 and 3.83, respectively. Since lactic acid contains an asymmetric carbon atom, it
has two optical isomers: the L-‐ form and D-‐ form. Therefore, poly (lactic acid) (PLA)
exists in two optically active stereoregular forms: poly (D-‐lactic acid) (P(D)LA) and
poly (L-‐lactic acid)(P(L)LA) and an optically inactive racemic form poly (D,L-‐lactic
acid) (P(D,L)LA). PLGA generally stands for poly (D,L-‐lactic acid-‐co-‐glycolic acid)
where the D-‐ and L-‐ lactic acid forms are in equal ratio.
PLGA polymers can be synthesized either by direct polymerization from
monomers or by ring-‐opening polymerization from its cyclic dimers, i.e., lactide and
glycolide in the presence of catalyst. Due to the difficulty of removing water that
degrades the polymer, the first method is limited to moderate molecular weights
[16]. Therefore, ring-‐opening polymerization is typically employed for obtaining
high molecular weight polymers. The end groups of polymer chains are either free
carboxylic acid or terminated with an aliphatic alcohol via an ester linkage.
The physico-‐chemical properties of PLGA polymers, such as crystallinity,
hydrophobicity, solubility in organic solvents, molecular weight and polydispersity
play crucial roles in determining polymer water uptake, hydrolysis, drug release and

5
hence the performance of drug delivery systems manufactured from PLGA. These
PLGA properties can be manipulated via a number of variables, such as monomer
stereochemistry, monomer ratio, molecular weight, and end-‐group chemistry. Poly
(glycolic acid) (PGA) is highly crystalline due to the lack of any methyl side groups. It
is only soluble in the most aggressive solvents (e.g., hexafluroisopropanol), thereby
limiting its use. P(L)LA and P(D)LA are semicrystalline in nature and can be soluble
in methylene chloride but not in ethyl acetate or acetone. By contrast, P(D,L)LA and
PLGA are amorphous and can dissolve in a wide range of common solvents
including methylene chloride, acetone, ethyl acetate, chloroform and
tetrahydrofuron, hence increasing the possible conditions of drug encapsulation
[17]. Due to the introduction of methyl side groups, PLA is more hydrophobic than
PGA, so PLGA copolymers rich in lactide content are more hydrophobic. PLGAs with
free carboxylic acid end groups are more hydrophilic than those with capped end-‐
groups. Commercially available PLGA polymers are commonly characterized in
terms of intrinsic viscosity, as a direct indicator of molecular weight. The glass
transition temperature (Tg) of PLGA polymers are in the range of 40-‐60°C,
rendering their glassy state above the physiological temperature of 37 °C. Therefore,
they possess significant mechanical strength to be formulated into delivery devices
of various size and geometry.
1.2.2 PLGA degradation and erosion

6
It is well accepted that aliphatic polyesters like PLGA degrade via hydrolysis
of their ester linkage in vivo, producing both a primary alcohol and a carboxylic acid
[18]. The polymer degradation is catalyzed by the carboxyl end groups initially
present or produced upon ester bond cleavage, a phenomenon known as
autocatalysis effect [19]. The enzymatic activity is suggested not likely to be
involved in PLGA biodegradation [20]. PLGA devices degrade by bulk erosion
mechanism, meaning the degradation occurs throughout the system. It is often
characterized by a continuous decline in polymer molecular weight and lagging
mass loss of the matrices due to the dissolution and diffusion of degradation
products [21]. A number of factors can affect the rate of PLGA hydrolysis, and
therefore can be modulated to adjust the rate of drug release from PLGA matrix.
One important factor determining degradation rate is the polymer
composition [22]. Increasing the ratio of lactic acid to glycolic acid in PLGA
decreases the rate of degradation due to the higher hydrophobicity of lactic acid
relative to glycolic acid, which reduces the water uptake by polymer. Moreover, the
introduction of additional methyl group on the lactic acid monomer hinders the
water attack of ester bonds sterically. The morphology state (i.e. amorphous vs.
semi-‐crystalline) of polymers also plays a critical role in PLGA degradation. It is well
established that the amorphous regions in polymers are preferentially degraded due
to the accessibility of water penetration [19]. Compared to semi-‐crystalline poly (L-‐

7
lactide, the degradation time of amorphous poly (D,L-‐lactide) is much shorter [23].
Lower molecular weight polymers usually relate to faster degradation due to the
greater easiness of change in polymer from glassy to rubbery state [24]. The end
group chemistry of PLGA also affects its degradation. PLGA with free carboxylic acid
groups shows a more rapid degradation than that of end-‐capped PLGA, owning to
the increased hydrophilicity (thus higher water uptake) and increased autocatalysis
of ester bond hydrolysis by carboxylic acids [25]. In addition to the afore-‐mentioned
factors; polymer molecular weight distribution, the presence of additives, device
dimensions, glass transition temperature, the site of implant, etc., can all influence
PLGA hydrolytic behavior [20].
There are two mechanisms responsible for chain scission of polyesters:
random chain scission and chain-‐end scission [26]. Since the microclimate pH
inside PLGA matrix is determined by the concentration of total water-‐soluble acids
(see section 1.5.1), chain-‐end scission rate, which liberates one monomer per chain
cleavage is more important in terms of governing microclimate pH than random
chain scission rate, which does not necessarily yield a water-‐soluble acid for each
chain cleavage.
1.2.3 PLGA water-uptake kinetics

8
Polymer hydration represents a fundamental step of initiating and sustaining
the hydrolytic degradation and erosion of polymer matrices. After PLGA
microspheres are injected into the body or placed in incubation media, water will
rapidly penetrate the polymer by simple diffusion. The water absorbed by PLGA
microspheres can be divided in two parts, the water associated with the polymer
phase (bound water) and the water filling up the pores in the polymer matrix (bulk
water). The content of bound water is related to the hydrophilicity of the polymer,
which is dependent on polymer properties such as molecular weight, polydispersity,
end-‐group capping and glycolide/lactide ratio, etc. For PLGA RG503H (Mw 30,000
Da), it is reported to be less than 3% w/w of bound water during the first 21 days of
degradation. Being in the same phase as the polymer, the bound water acts as an
effective plasticizer, causing the decrease of glass transition temperature (Tg) of the
polymer [27]. Such plasticization effect increases polymer flexibility or mobility,
facilitating the transport of incorporated drug or polymer degradation products. It is
also suggested that the bound water results in similar polymer degradation as in
bulk water [27]. As PLGA erodes, the pores enlarge and coalesce with each other,
leading to increased water content. Moreover, the osmotic pressure created by the
dissolved encapsulated drug and/or excipents as well as the accumulation of water-‐
soluble polymer degradation products leads to additional water uptake. At late
stages of erosion, with the mass loss and changes in the physical state of the
9
polymer, the water pores would be closed or reduced in total volume so that the
water uptake may be ceased or even declined [28]
1.3 Microspheres preparation
Several methods have been reported and developed for preparation of
polymeric microspheres to date. The fabrication method can greatly influence the
characteristics of the microspheres, such as size, morphology, drug loading, drug
stability (particularly protein therapeutics) and drug release. Thus the choice of
preparation method for polymeric microspheres should be wisely made based on
the desired properties of microsphere formulation products. Ideally, the
microspheres should be manufactured in a way to achieve optimal size and drug
loading, high encapsulation efficiency, preserved stability of encapsulated drug, high
yield of microspheres, batch uniformity and reproducibility, and free flowing
property of microspheres [29]. Furthermore, it is desirable that the produced
polymeric microspheres are capable of sustained-‐release of encapsulated drugs for
a specified period with low initial burst release and minimal incomplete release
effect. The most widely used manufacturing techniques for polymeric microspheres
loaded with protein are: i) spray drying; ii) phase separation (coacervation); and iii)
emulsion solvent evaporation method.
i) Spray drying

10
In this process, the drug in solid form is dispersed in a polymer solution of a
volatile organic solvent, such as dimethylene chloride or acetone. The suspension is
then sprayed into a chamber supplied with heated air stream. As the organic solvent
evaporates instantaneously, the polymer solidifies around the drug forming
microspheres. The typical size of microspheres prepared from this method ranges
from 1 to 100 μm, which is dependent on the atomizing conditions that are related
to temperature, feed flow rate, etc [29]. The final microspheres are collected by a
cyclone separator. This method is very rapid, convenient, easy to scale-‐up and
provides good reproducibility. The particle size can be well controlled within a
narrow range and the encapsulation efficiency of drug is high [30-‐32].
Considerations on the use of this method should include the possible significant loss
of products during the process due to the adhesion of the microspheres to the inside
walls of the apparatus [33]. In addition, the encapsulated protein must be relatively
stable against high temperatures and lyophilization processes before dispersion.
ii) Phase-‐separation (coacervation)
In principle, protein in solid form or in aqueous solution is first dispersed in a
polymer solution of organic solvent. Then by mixing with another organic
nonsolvent, the polymer solubility in its solvent is gradually decreased, leading to
phase separation. Consequently, the polymer rich liquid phase (coacervate)
encapsulates the drug and the formed droplets are then transferred to a larger

11
volume of second organic nonsolvent to harden the microparticles [34-‐37]. DCM,
acetonitrile, and ethyl acetate are typically used to dissolve the polymer. The
nonsolvent added should be miscible with the polymer solvent while not dissolving
the polymer or the drug. Examples include silicone oil, vegetable oils, and light
liquid paraffin. Aliphatic hydrocarbons like hexane, heptane, and petroleum ether
are usually employed as the second nonsolvent [38]. In the process, factors
including polymer properties, polymer concentration, the stirring rate, the addition
rate and viscosity of first nonsolvent, the ratio between polymer solvent and first
nonsolvent can affect the coacervation process and thereby the characteristics of
final microsphere products [39]. This anhydrous method can circumvent the
problem of protein partitioning into the aqueous continuous phase, thereby
increasing the protein’s encapsulation efficiency. However, residual organic solvent
is a major concern for this method and particle agglomeration can be a frequent
problem due to the lack of emulsion stabilizer [38].
iii) Emulsion solvent evaporation
The water/oil/water (w/o/w) double emulsion method is most widely
employed for preparation of microspheres containing proteins and peptides. Briefly,
protein is dissolved in a buffered or plain aqueous medium and mixed with a
polymer solution in organic solvent (usually methylene choloride) under vigorous
stirring using a homogenizer or sonicator, thus creating the primary w/o emulsion

12
droplets. Then, a second aqueous phase containing a surfactant (e.g. poly(vinyl
alcohol), PVA) is gently added to the first emulsion followed by intensive mixing to
generate the second w/o/w emulsion. The organic solvent is removed by
transferring the formed emulsion to a large volume of water bath (with or without
surfactant), into which the organic solvent is diffused out and eventually evaporated
under constant stirring. Finally, the hardened microspheres are collected through
filtration or centrifugation, washed with water, sieved for size and lyophilized to the
final product. The properties of final microspheres in terms of size, porosity, drug
encapsulation efficiency and release depend on a number of formulation variables
including polymer type, polymer concentration, volume ratio of internal aqueous to
organic phase, homogenization speed, concentration of surfactant, solvent removal
rate, the incorporation of salts, etc [40-‐45]. This double emulsion method is
appropriate for numerous proteins, however, one issue often associated with this
process is the presence of various stresses on protein stability such as high
shear/cavitation force, water/organic interface, and elevated temperatures.
1.4 Instability of protein in PLGA delivery systems
Proteins are relatively large molecules with labile bonds, reactive side chains
and sophisticated secondary, tertiary and even quaternary structures. And they
have to maintain their specific, folded, three dimensional structures in order to
deliver proper function. However, unlike most small molecule drugs, proteins easily

13
lose chemical and structural integrity, resulting in loss of bioactivity and/or increase
of immunogenicity. Protein stabilization is, therefore, regarded as a principle
difficulty hindering successful development of PLGA based formulations for
sustained-‐release of therapeutic proteins [14].
1.4.1 Instability mechanisms
Generally, protein instability mechanisms can be divided into two classes:
chemical instability and physical instability [46]. The chemical instability involves
the covalent modification of amino acid groups on peptide chains. The reaction
includes hydrolysis, deamidation, racemization, oxidation, disulfide interchange and
β-‐elimination. Physical instability of protein refers to the disruption of proteins’
higher order (e.g. secondary, tertiary or quaternary) structures, including
denaturation (protein unfolding), aggregation, precipitation and adsorption to
surfaces. Detailed reviews on the protein degradation pathways can be found in
other literature [25, 47-‐49]
1.4.2 Stresses for protein instability
Proteins are exposed to a variety of damaging stresses over the entire life of
PLGA delivery systems, which can occur through different stages including:
encapsulation, lyophilization and storage, and long-‐term release [14, 50-‐52].

14
During encapsulation
During the loading process with emulsion method, proteins in an aqueous
solution are usually emulsified in a polymer organic solution. The presence of
water/organic solvent interfaces is a major cause of protein denaturation and
aggregation during the process [53-‐55]. Protein molecules tend to adsorb to the
interfaces, leading to unfolding with the exposure of their hydrophobic core to the
organic solvent and subsequently aggregation. Moreover, the high shear forces
generated by the emulsification process (e.g. homogenization, vortex) is another
common destabilizing factor [56]. Emulsification of protein solution by sonication
create cavitation stress that is detrimental to proteins because of local temperature
extremes and free radical formation [51]. Adsorption to solid surfaces, including
containers, solid excipients and homogenizer components, also play a detrimental
role in protein stability.
Microspheres prepared from anhydrous conditions (e.g. solid/oil/oil (s/o/o)
method) often exhibit better stability of encapsulated proteins than those involved
an aqueous medium [14], due to the higher stability of protein in solid state and the
elimination of the water/organic solvent interface. However, in order to obtain the
anhydrous powder, proteins usually undergo freeze-‐drying or spray drying first if a
reduced particle size is required, which can also potentially damage protein
integrity.

15
During lyophilization and storage
To remove the residual solvent in microspheres left from the preparation
process, lyophilization (freeze-‐drying) is most often used. However, proteins are
susceptible to a variety of stresses during the freezing and subsequent drying
process, leading to degradation (mainly by denaturation and aggregation) [57]. For
example, increased protein concentration and ionic strength, pH changes, and
formation of ice crystals during the freezing step can have deleterious effects on
maintaining a protein’s native state. In addition, the removal of the hydration shell
of a protein during the drying process can facilitate the protein-‐protein hydrophobic
interactions, causing protein aggregation [58].
During storage, proteins are not necessarily stable in the solid state [58-‐60].
The moisture level plays an important role in protein degradation. Moisture can
induce premature polymer hydrolysis, which will produce acidic monomers and
oligomers, lowering the microenvironment pH and potentially degrading the
protein. Moreover, moisture can also cause aggregation by providing a medium for
thiol-‐disulfide exchange [61] or induce formalinized antigen aggregation through
formaldehyde-‐mediated cross-‐linking [62]. Additionally, temperature and
interaction with excipients or PLGA can also lead to protein aggregation or chemical
degradation reactions.
During release

16
Generally, three principle stresses present in the microenvironment of PLGA
matrix are recognized to be responsible for protein instability during prolonged in
vivo release from PLGA matrix: moisture, acidic pH, and adsorption to PLGA surface
[50].
When PLGA microspheres are injected into the body, water will penetrate
into the polymer matrix and dissolve the encapsulated protein rapidly. Generally, it
is well accepted that proteins are most stable in their solid state [14, 50]. The
rehydration of protein will mobilize the protein and enhance its reactivity
significantly, resulting in destabilization.
Another important detrimental factor for protein stability is the microclimate
pH inside aqueous pores of the PLGA matrix. The presence of acid impurities (often
monomers and dimers of glycolic acid and lactic acid) plus the degrading products
of PLGA containing carboxylic acids create an acidic microenvironment, which could
be deleterious to acid labile proteins. Acid-‐induced instability mechanisms for
proteins include acid-‐catalyzed peptide bond hydrolysis, deamidation, aggregation,
and denaturation [48, 63]. For example, simulations of BSA in a very acidic
microclimate pH (pH=2) showed denaturation, peptide bond hydrolysis, and
noncovalent aggregation [64]. Evidence for acidification within degrading PLGA
microparticles has become increasingly notable recently, and will be discussed in
detail in section 1.5.

17
An additional cause of protein destabilization involves polymer surfaces.
Protein’s hydrophobic interior often has tendency to interact with the hydrophobic
polymer chain, resulting in adsorption and subsequently irreversible
conformational changes of protein [65]. Since there is large internal surface area
inside PLGA matrix due to its porous structure after degradation, the interaction
between polymer and protein can induce protein inactivation and incomplete
release.
1.5 Acidic Microenvironment in PLGA Microspheres
1.5.1 Physical-chemical description of microclimate pH (μpH)
The microclimate pH (μpH) refers to the pH in the aqueous pores inside the
PLGA delivery matrix. Ding et al.[28] described the physical-‐chemical basis of the
development of μpH and developed an equilibrium model to quantitatively predict
the μpH in PLGA films for the first time. Briefly, upon immersing the PLGA carriers
in a physiological buffer, water will be imbibed into the polymer matrix rapidly and
fill up the pores that are generated during the preparation process. During the
bioerosion period, the pores will close, open, grow in size and coalesce with the
degradation of polymer. Two separate phases are assumed to coexist within the
polymer matrix, the polymer phase and the aqueous phase. In the polymer phase,
the degradation of the polymer occurs after the brief hydration, producing acid

18
monomers and oligomers that could be either water-‐soluble or water-‐insoluble
depending on the chain length of the acid. The water-‐soluble ones can be released
out by diffusion through the polymer matrix and partitioning into the aqueous
pores, where dissociation takes place, producing protons that lower the μpH.
Besides the PLGA degradation products, the acidic impurities in the polymer that
are left from polymer synthesis and storage could also contribute to the
development of acidic μpH. In summary, the acidic microclimate stems from the
accumulation of water-‐soluble acids in PLGAs.
1.5.2 Factors affecting µpH
From the above discussed model, it can be concluded that a number of
factors from the physical-‐chemical processes could contribute to the development of
acidic microclimate, namely the water-‐soluble acid production rate, the water-‐
soluble acid liberation rate, acids partition between polymer phase and aqueous
phase, and the dissociation of water-‐soluble acids in the aqueous medium. Any
formulation and processing variables that affect these factors could directly or
indirectly impact the μpH distribution and kinetics in PLGAs. Therefore, it is crucial
to recognize the effect of different variables on μpH in order to wisely design and
develop the PLGA delivery systems with controlled μpH for the pH-‐sensitive
therapeutic substances.

19
Ding et al. reported that μpH inside PLGA microspheres is dependent upon
the molecular weight (MW) and the lactic/glycolic acid ratio of PLGA [66]. Lower
μpH was observed in microspheres made from higher MW PLGA after 2 weeks
incubation in phosphate buffer, which was explained by the reduction in polymer
permeability to water-‐soluble acids as the molecular weight increases. Increasing
the lactic acid content in PLGA, the μpH became less acidic during the first two
weeks incubation. This was attributed to the slower degradation rate for higher
lactic acid content polymers. However, the μpH developed in PLGA 85/15 and
100/0 microspheres were more acidic after two weeks than that in PLGA 50/50
formulations because the lower permeability to water-‐soluble acids in the high
lactic acid-‐content polymers impedes the liberation of pH-‐lowering acids.
The size of the microspheres also plays an important role in μpH kinetics. Li
et al. [67] reported that the larger the microspheres, the lower pH they displayed
due to the longer diffusion path for water-‐soluble acids to be released out. However,
Ding et al. [66] suggested that the effect of microsphere size on μpH distribution is
dependent on polymer materials. For lactic-‐rich polymers (e.g. PLGA 85/15 and
PLA), the size effects become insignificant because of both the low production rate
and low diffusion rate of water-‐soluble acids in such polymers.
Porosity of the microspheres is likely to be of great significance in
determining the acidity in PLGAs. It is anticipated that the more porous the inner
structure of particles, the more rapid the produced acids are transported out of the

20
polymer, since the diffusivity of water-‐soluble acids in water is many orders of
magnitude higher than that in the polymer. Furthermore, the buffer salts in the
incubation medium are more likely to diffuse into the aqueous pores, thereby
helping to neutralize the μpH.
The method of microsphere preparation could influence the μpH kinetics as
well. It is found that microspheres fabricated by the oil-‐in-‐oil emulsion method have
a lower acidic microenvironment than those made by water-‐oil-‐water double
emulsion method [66]. Possible reasons speculated were that the oil-‐in-‐oil
microspheres have higher porosity and amount of residual solvent, both of which
could lead to the facilitated release of water-‐soluble acids from the polymer matrix.
The protein encapsulated can also contribute to the pH of PLGA
microenvironment. The side chains on the amino acids of protein molecules can
participate in the acid-‐base equilibrium in the aqueous phase and act as a buffer to
neutralize the acidity.
1.5.3 Formulation strategies of controlling μpH
Several studies have shown success in controlling μpH and stabilizing
encapsulated proteins as a consequence. For example, introducing poorly soluble
bases such as Mg(OH)2 and MgCO3, can counteract the often acidic environment and
prevent the structural loss and aggregation of proteins [63, 67]. Blending PLGA
50/50 with 20% of polyethylene glycol (PEG) significantly increased the μpH to

21
above 5 during incubation up to 4 weeks, supporting the observed improved
stability of ovalbumin and bovine serum albumin (BSA) in PLGA/PEG microspheres
[68, 69]. The incorporation of PEG could increase the water uptake of the polymer
due to its high hydrophilicity and solubility, which would dilute the acid
concentration within the polymer system. In addition, PEG also enhanced the
polymer permeability to water-‐soluble acids by its plasticization effect, thus
promoting acid release. In another study, poly(ethylene glycol)-‐poly(L-‐histidine)
diblock polymer (PEG-‐PH) was added as an excipient to the PLGA microspheres
containing BSA [70]. This excipient formed ionic complex with BSA that stabilizes
the protein. A neutral microenvironment was observed inside these microspheres.
The poly (histidine) is a weak base that can neutralize the local acidity, and PEG can
reduce acid accumulation as previously discussed.
1.5.4 Evidence of acidic microclimate in PLGA
1.5.4.1 Indirect evidence
It has long been recognized that a low-‐pH microenvironment commonly
exists in the aqueous pores of PLGA delivery systems. The following are examples of
indirect evidence indicating the presence of acidic microclimate in PLGA devices.
Heterogeneous degradation in large (~1-‐2 mm dimensions) PLGA specimens was
observed where the degradation proceeded more rapidly in the center than at the
22
surface [23]. Since PLGA degradation is acid catalyzed, it was concluded that acidic
PLGA degradation products accumulated inside the matrix core, which created a
low-‐pH environment and accelerated ester bond cleavage. Shenderova et al. [71]
found that camptothecin was stabilized in its acid-‐stable (and active) lactone form
when encapsulated in PLGA microspheres, and later confirmed an acidic
microclimate inside the PLGA matrix. Insulin incubated under acidic conditions was
analyzed using HPLC by Uchida et al. [72] and found to share the same retention
time with the degradation products of insulin extracted from the microspheres,
indicating the existence of an acidic environment within PLGA. Furthermore, it was
proven that co-‐encapsulating antacids (e.g., Mg (OH)2, and MgCO3) in PLGAs could
improve the stability and release kinetics of encapsulated proteins due to the
inhibition of acid-‐catalyzed degradation of proteins, as demonstrated in studies with
bovine serum albumin [63], basic fibroblast growth factor (bFGF) [63], bone
morphogenetic protein-‐2 (BMP-‐2) [63], tetanus vaccine antigen (i.e., tetanus toxoid)
[73], and tissue plasminogen activator [74].
1.5.4.2 Techniques for direct measurement of μpH
To accurately measure, predict and control the µpH in PLGA delivery
systems, several techniques have been developed to directly quantify µpH. In one
study, 31P nuclear magnetic resonance (NMR) was employed to examine the
microenvironment in PLGA microspheres incubated in sheep serum [75], which

23
served as a model physiological fluid containing endogenous inorganic phosphate,
31P. The study was based on the hypothesis that under these conditions, phosphate
solutes diffuse into the microsphere from the outside medium, and the 31P chemical
shifts between internal and external phosphate populations indicate the pH change.
Results showed that pH stabilized around 6.4 over the course of 45 days. A major
pitfall associated with this study was that the author failed to discuss the extent of
penetration by phosphate ions into microsphere matrix interior. It is highly possible
that the phosphate ions only partitioned into the surface pores, since there was little
data on the permeability of phosphate ions in the polymer phase. Later on, the study
was modified by encapsulating phosphate-‐ and histidine-‐ containing porogen
excipients inside PLGA microspheres and then characterizing the internal
environment using 31P and 31C NMR spectroscopy [76]. Results indicated that the pH
was maintained below 4 but above the phosphoric acid pKa through the erosion
period of 14 days. This study addressed the issue of phosphate distribution within
microspheres and the results given by encapsulated solutes are representative of
the PLGA microenvironment proteins resides. However, it is limited by the ability of
only reporting a rough μpH range from recording the chemical shifts of 31P and 31C.
Electron paramagnetic resonance (EPR) was another technique developed to
measure the microenvironment, including µpH in PLGA implants in vivo [77] and
PLGA microspheres in vitro [78, 79] by incorporation of either free spin probes or
spin-‐labeled drugs. The hyperfine splitting constant of the probe is sensitive to the

24
pH changes of environment due to the changes in the protonation state of the
imidazolidine-‐derived structure of the probe, allowing the determination of pH after
calibration. It was reported that the pH in PLGA microspheres dropped to a value
equal or less than 4.7 within 13 hours. Measuring pH inside microspheres with EPR
is a non-‐invasive and continuous method. However, since this technique relies on
the mobility of spin probes, a reliable measurement is not possible in PLGA
microspheres after 50 hours of erosion in the study due to the increase of
microviscosity and decrease in signal to noise ratio causing changes in the spectral
shape.
Potentiometric measurement was reported as a rapid and reliable way of
determining μpH values in thin polymer films [80]. Briefly, standard glass pH
electrodes were coated with PLGA films, and the zero-‐current potential was
measured with respect to a reference electrode. This technique was developed
based on the assumption that after hydration of the PLGA film, an aqueous layer is
formed between the electrode and the PLGA coating that mimics the
microenvironment in the aqueous pores inside the polymer. The µpH was deduced
from the measured cell potential after correction of the diffusion and interfacial
potentials in the electrochemical cell. It was found that µpH in PLGA 50/50 films
with thickness of 30-‐100 µm declined to less than 3 after 1 day of incubation in a
physiological buffer at 37°C and remained acidic for 4 weeks. And the thickness of
PLGA films can influence the µpH development, as low pH (pH 2-‐3.5) was developed

25
for coatings with thickness above 30 µm while neutral pH (pH 6.5) was observed if
the coating was very thin (~7 µm) after 1 week of incubation. Although
potentiometric method is a simple and fast way for screening formulation strategies
with desired controlled μpH in PLGA polymer, the pH measured could not be
extrapolated to the μpH in smaller delivery devices such as microspheres and
nanospheres, due to the different geometry, structure and transport characteristics
inside such systems. Overall, the above-‐mentioned measurements all suffer from the
limitation of only providing an averaged, general picture of the microenvironment
pH inside PLGA matrix. It is highly likely that the μpH is unevenly distributed and
that some pores of extreme high acidity are present despite an overall neutral
measured pH, leading to the destabilization of entrapped proteins in those low-‐pH
regions.
Confocal microscope imaging techniques, on the other hand, can directly
visualize the spatial µpH distribution within microspheres or throughout a device
by encapsulation of pH-‐sensitive fluorescent probes. Shenderova et al. [71] first
employed confocal laser scanning microscope to monitor the μpH by correlating the
pH with fluorescent intensity. Fluorescein was encapsulated in microspheres, whose
emission intensity decreases with the decrease in pH. However, since dye
partitioned in the polymer and the measured fluorescence intensity was also
dependent on dye concentration, this method by itself was only semi-‐quantitative.
In order to eliminate the effect of poorly controlled dye concentration on

26
fluorescence, Fu et al. [81] improved this confocal microscopic imaging method by
co-‐encapsulating two fluorescent dye-‐dextran conjugates (SNARF-‐dextran and
NERF-‐dextran) in the microspheres and correlating their intensity ratios at two
respective emission wavelengths with pH. Hence, quantitative pH information that
is independent of dye concentration could be acquired from this ratiometric
method. The presence of acidic microenvironment with minimum pH as low as 1.5
was suggested and the formation of pH gradients within the microspheres were
demonstrated using this technique. Results also suggested that the µpH
development was dependent on the size of microspheres. However, since both dyes
emit in the green range (535 nm for NERF and 580nm for SNARF), the resolution of
images was very poor. Besides, the ratio images were not properly processed; giving
rise to high noise-‐to-‐signal ratio that undermines the assay’s accuracy. In addition,
the range of pH measurement was relatively narrow (pH from 1.5 to 3.5 in standard
curve), restricting its application to systems with less acidic pH.
Another quantitative ratiometric method based on confocal imaging was
developed by Li et al. by encapsulation of dextran-‐SNARF-‐1® conjugate as the
fluorescent probe [67]. The ratio of fluorescent intensities of the dye at two
emission wavelengths, typically 580 and 640 nm is responsive to pH change in the
neutral range (pH 5.8-‐8.0), thereby providing pixel-‐by-‐pixel neutral µpH maps
inside PLGA microspheres. This technique was applied to determine µpH in both
acid-‐neutralized and non-‐neutralized PLGA microspheres during extended

27
incubation in physiological buffer. The noise-‐to-‐signal ratio was significantly
reduced after performing a series of image processing steps. Hence, the accuracy of
this method was greatly improved. The measured pH in the neutral range may serve
well for formulation screening purposes; nevertheless, it is inadequate to provide
information on understanding the acidic µpH development in PLGA degrading
matrices.
Later, mapping of µpH in acidic pH range in PLGA microspheres was
reported using the same technique [66]. Lysosensor yellow/blue® dextran
conjugate was employed as the fluorescent dye to sense µpH over a broadly acidic
range (2.8<µpH<5.8) inside PLGA microspheres by relating pH to ratio of its
fluorescent intensities under two emission wavelengths. This method is accurate to
within ± 0.2 pH units, as found with dextran SNARF-‐1® in the neutral pH range. The
ratiometric method is advantageous in that it eliminates artifacts resulted from the
variations of dye concentration inside microspheres, including the leakage of the
dye, non-‐uniform distribution of dye within a microsphere and/or differences in dye
loading among populations of microspheres. The high molecular weight dye
conjugation prevents the dye from quickly releasing out of the microspheres. It also
localizes the dye within the aqueous pores of the microspheres, similar to the
partition behavior of proteins in the polymer.
Combining the above two pH mapping techniques using confocal laser
scanning microscopy (CLSM) could allow us to obtain accurate µpH distribution

28
over the entire useful pH range (2.8-‐8.0), which is beneficial to further our
understanding of µpH development and promote formulation designs for optimized
PLGA delivery of acid-‐labile bioactive drugs.
1.6 Thesis Overview
In this dissertation, the μpH inside biodegradable polymeric microspheres
was quantitatively evaluated. The overall objective of this dissertation is to employ
μpH mapping and related tools to further our mechanistic understanding of μpH
development and control in order to improve formulations of protein encapsulated
biodegradable microspheres.
Despite numerous studies on measuring μpH, accurate μpH mapping has not
been accomplished in the presence of protein. The purpose of Chapter 2 was to
develop a method to map the μpH using CLSM in protein-‐encapsulated PLGA
microspheres. Correction of the interference of encapsulated proteins on dye’s
fluorescent reporting of pH was performed based on the estimation of protein
concentration in PLGA pores. This technique was then applied in examining the μpH
distribution and kinetics in different PLGA microspheres formulations with the
incorporation of pH-‐modifying excipients or adjusting the formulation variables.
Chapter 3 presents the μpH mapping using CLSM in microspheres of a
hydrophilic biodegradable polymer, poly(lactide-‐co-‐hydroxymethyl glycolide)
(PLHMGA) that have previously displayed better stability of encapsulated

29
biomacromolecules than PLGAs with similar degradation time-‐scales. The transport
of a fluorescent probe, bodipy, in microspheres of PLHMGA and PLGA was studied to
illustrate the relevance of the faster diffusion of water-‐soluble acids in the
development of less acidic μpH.
Previous studies have implicated the role of water-‐soluble impurities and
degradation products in governing the μpH in large PLGA specimens, but
mathematical models for μpH prediction were equilibrium-‐based without
considering the concentration gradients of diffusing acids. In Chapter 4, a
mathematical model for the simulation of μpH distribution in more commonly used
PLGA microspheres as a function of degradation time was developed. The goal here
was to gain a better understanding of the physicochemical mechanisms of μpH
development and to evaluate the effect of different variables on μpH distribution
and kinetics. Key parameters in the model involving the mean size of microspheres,
the initial concentration of acids in polymer, acid production rate, and acid diffusion
rate in polymer matrix was estimated from independent experiments. The
simulated μpH was evaluated against μpH maps acquired from CLSM experiments.
In Chapter 5, the thesis concludes by proposing various studies that warrant
future investigation to build upon the μpH mapping and simulation studies
described herein.

30
Reference:
[1] Investor Insights. http://www.novartis.com/downloads/investors/shareholders-‐information/Investor-‐Insights-‐2.pdf: Novatis; 2012. [2] Brown LR. Commercial challenges of protein drug delivery. Expert opinion on drug delivery. 2005;2:29-‐42. [3] Uhrich KE, Cannizzaro SM, Langer RS, Shakesheff KM. Polymeric systems for controlled drug release. Chemical Reviews-‐Columbus. 1999;99:3181-‐98. [4] Chen RR, Mooney DJ. Polymeric growth factor delivery strategies for tissue engineering. Pharmaceutical research. 2003;20:1103-‐12. [5] Richardson TP, Peters MC, Ennett AB, Mooney DJ. Polymeric system for dual growth factor delivery. Nature biotechnology. 2001;19:1029-‐34. [6] Tessmar JK, Göpferich AM. Matrices and scaffolds for protein delivery in tissue engineering. Advanced drug delivery reviews. 2007;59:274-‐91. [7] O'hagan D, Jeffery H, Davis S. Long-‐term antibody responses in mice following subcutaneous immunization with ovalbumin entrapped in biodegradable microparticles. Vaccine. 1993;11:965-‐9. [8] Jiang W, Gupta RK, Deshpande MC, Schwendeman SP. Biodegradable poly (lactic-‐co-‐glycolic acid) microparticles for injectable delivery of vaccine antigens. Advanced drug delivery reviews. 2005;57:391-‐410. [9] Tice T, Tabibi E. Treatise on controlled drug delivery: fun-‐damentals optimization, appliccations. New York: Marcel Dekker; 1991. [10] Johnson OFL, Cleland JL, Lee HJ, Charnis M, Duenas E, Jaworowicz W, et al. A month–long effect from a single injection of microencapsulated human growth hormone. Nature medicine. 1996;2:795-‐9. [11] Okada H, Doken Y, Ogawa Y, Toguchi H. Preparation of three-‐month depot injectable microspheres of leuprorelin acetate using biodegradable polymers. Pharmaceutical research. 1994;11:1143-‐7. [12] Hutchinson F, Furr B. Biodegradable polymer systems for the sustained release of polypeptides. Journal of Controlled Release. 1990;13:279-‐94. [13] Cohen S, Yoshioka T, Lucarelli M, Hwang LH, Langer R. Controlled delivery systems for proteins based on poly (lactic/glycolic acid) microspheres. Pharmaceutical research. 1991;8:713-‐20. [14] Putney SD, Burke PA. Improving protein therapeutics with sustained-‐release formulations. Nature biotechnology. 1998;16:153-‐7. [15] Carrasquillo KG, Ricker JA, Rigas IK, Miller JW, Gragoudas ES, Adamis AP. Controlled delivery of the anti-‐VEGF aptamer EYE001 with poly (lactic-‐co-‐glycolic) acid microspheres. Investigative ophthalmology & visual science. 2003;44:290-‐9.

31
[16] Shenderova A. The microclimate in poly(lactide-‐co-‐glycolide) microspheres and its effect on the stability of encapsulated substances: The Ohio State University; 2000. [17] Makadia HK, Siegel SJ. Poly Lactic-‐co-‐Glycolic Acid (PLGA) as biodegradable controlled drug delivery carrier. Polymers. 2011;3:1377-‐97. [18] Li S, Vert M. Biodegradation of aliphatic polyesters. Degradable polymers: Principles and applications. 1995:43-‐87. [19] Li S. Hydrolytic degradation characteristics of aliphatic polyesters derived from lactic and glycolic acids. Journal of biomedical materials research. 1999;48:342-‐53. [20] Anderson JM, Shive MS. Biodegradation and biocompatibility of PLA and PLGA microspheres. Advanced drug delivery reviews. 2012. [21] Kenley RA, Lee MO, Mahoney TR, Sanders LM. Poly (lactide-‐co-‐glycolide) decomposition kinetics in vivo and in vitro. Macromolecules. 1987;20:2398-‐403. [22] Park TG. Degradation of poly (lactic-‐co-‐glycolic acid) microspheres: effect of copolymer composition. Biomaterials. 1995;16:1123-‐30. [23] Li S, Garreau H, Vert M. Structure-‐property relationships in the case of the degradation of massive poly (α-‐hydroxy acids) in aqueous media. Journal of Materials Science: Materials in Medicine. 1990;1:198-‐206. [24] Park TG. Degradation of poly(d,l-‐lactic acid) microspheres: effect of molecular weight. Journal of Controlled Release. 1994;30:161-‐73. [25] Houchin ML, Topp EM. Chemical degradation of peptides and proteins in PLGA: a review of reactions and mechanisms. Journal of pharmaceutical sciences. 2008;97:2395-‐404. [26] Batycky RP, Hanes J, Langer R, Edwards DA. A theoretical model of erosion and macromolecular drug release from biodegrading microspheres. Journal of pharmaceutical sciences. 1997;86:1464-‐77. [27] Blasi P, D'Souza SS, Selmin F, DeLuca PP. Plasticizing effect of water on poly (lactide-‐co-‐glycolide). Journal of controlled release. 2005;108:1-‐9. [28] Ding AG, Shenderova A, Schwendeman SP. Prediction of microclimate pH in poly (lactic-‐co-‐glycolic acid) films. Journal of the American Chemical Society. 2006;128:5384-‐90. [29] Sinha VR, Trehan A. Biodegradable microspheres for protein delivery. Journal of Controlled Release. 2003;90:261-‐80. [30] Wagenaar B, Müller B. Piroxicam release from spray-‐dried biodegradable microspheres. Biomaterials. 1994;15:49-‐54. [31] Takada S, Uda Y, Toguchi H, Ogawa Y. Application of a Spray Drying Technique in the Production of TRH-‐Containing Injectable Sustained-‐Release Microparticles of Biodegradable Polymers. PDA Journal of Pharmaceutical Science and Technology. 1995;49:180-‐4.

32
[32] Pavanetto F, Genta I, Giunchedi P, Conti B. Evaluation of spray drying as a method for polylactide and polylactide-‐co-‐glycolide microsphere preparation. Journal of microencapsulation. 1993;10:487-‐97. [33] Park J, Ye M, Park K. Biodegradable polymers for microencapsulation of drugs. Molecules. 2005;10:146-‐61. [34] Edelman R, Russell RG, Losonsky G, Tall BD, Tacket CO, Levine MM, et al. Immunization of rabbits with enterotoxigenic E. coli colonization factor antigen (CFA/I) encapsulated in biodegradable microspheres of poly (lactide-‐co-‐glycolide). Vaccine. 1993;11:155-‐8. [35] Ruiz J, Tissier B, Benoit J. Microencapsulation of peptide: a study of the phase separation of poly (D, L-‐lactic acid-‐co-‐glycolic acid) copolymers 50/50 by silicone oil. International journal of pharmaceutics. 1989;49:69-‐77. [36] Sanders L, Kent J, McRae G, Vickery B, Tice T, Lewis D. Controlled release of a luteinizing hormone-‐releasing hormone analogue from poly (d, l-‐lactide-‐co-‐glycolide) microspheres. Journal of pharmaceutical sciences. 1984;73:1294-‐7. [37] Johansen P, Moon L, Tamber H, Merkle HP, Gander B, Sesardic D. Immunogenicity of single-‐dose diphtheria vaccines based on PLA/PLGA microspheres in guinea pigs. Vaccine. 1999;18:209-‐15. [38] Jain RA. The manufacturing techniques of various drug loaded biodegradable poly (lactide-‐ co-‐glycolide)(PLGA) devices. Biomaterials. 2000;21:2475-‐90. [39] Nihant N, Grandfils C, Jérôme R, Teyssié P. Microencapsulation by coacervation of poly (lactide-‐co-‐glycolide) IV. Effect of the processing parameters on coacervation and encapsulation. Journal of controlled release. 1995;35:117-‐25. [40] Yang YY, Chung TS, Bai XL, Chan WK. Effect of preparation conditions on morphology and release profiles of biodegradable polymeric microspheres containing protein fabricated by double-‐emulsion method. Chemical Engineering Science. 2000;55:2223-‐36. [41] Yang YY, Chung TS, Ping Ng N. Morphology, drug distribution, and in vitro release profiles of biodegradable polymeric microspheres containing protein fabricated by double-‐emulsion solvent extraction/evaporation method. Biomaterials. 2001;22:231-‐41. [42] Pistel K, Kissel T. Effects of salt addition on the microencapsulation of proteins using W/O/W double emulsion technique. Journal of microencapsulation. 2000;17:467-‐83. [43] Jyothi NVN, Prasanna PM, Sakarkar SN, Prabha KS, Ramaiah PS, Srawan G. Microencapsulation techniques, factors influencing encapsulation efficiency. Journal of microencapsulation. 2010;27:187-‐97. [44] O'Donnell PB, McGinity JW. Preparation of microspheres by the solvent evaporation technique. Advanced Drug Delivery Reviews. 1997;28:25-‐42.

33
[45] Mao S, Xu J, Cai C, Germershaus O, Schaper A, Kissel T. Effect of WOW process parameters on morphology and burst release of FITC-‐dextran loaded PLGA microspheres. International journal of pharmaceutics. 2007;334:137-‐48. [46] Manning MC, Patel K, Borchardt RT. Stability of protein pharmaceuticals. Pharmaceutical research. 1989;6:903-‐18. [47] Chi EY, Krishnan S, Randolph TW, Carpenter JF. Physical stability of proteins in aqueous solution: mechanism and driving forces in nonnative protein aggregation. Pharmaceutical research. 2003;20:1325-‐36. [48] Manning MC, Chou DK, Murphy BM, Payne RW, Katayama DS. Stability of protein pharmaceuticals: an update. Pharmaceutical research. 2010;27:544-‐75. [49] Cleland JL, Powell MF, Shire SJ. The development of stable protein formulations: a close look at protein aggregation, deamidation, and oxidation. Critical reviews in therapeutic drug carrier systems. 1993;10:307. [50] Schwendeman SP. Recent advances in the stabilization of proteins encapsulated in injectable PLGA delivery systems. Critical reviews in therapeutic drug carrier systems. 2002;19:73. [51] van de Weert M, Hennink WE, Jiskoot W. Protein instability in poly (lactic-‐co-‐glycolic acid) microparticles. Pharmaceutical research. 2000;17:1159-‐67. [52] Schwendeman SP, Cardamone M, Brandon MR, Klibanov AM, Langer R. Stability of proteins and their delivery from biodegradable polymer microspheres. . In: Cohen S, Bernstein H, editors. Microparticulate systems for the delivery of proteins and peptides. New York: CRC; 1996. p. 1-‐49. [53] Sah H. Protein instability toward organic solvent/water emulsification: implications for protein microencapsulation into microspheres. PDA Journal of Pharmaceutical Science and Technology. 1999;53:3-‐10. [54] Sah H. Stabilization of proteins against methylene chloride/water interface-‐induced denaturation and aggregation. Journal of controlled release. 1999;58:143-‐51. [55] van de Weert M, Hoechstetter J, Hennink WE, Crommelin DJA. The effect of a water/organic solvent interface on the structural stability of lysozyme. Journal of controlled release. 2000;68:351-‐9. [56] Morlock M, Koll H, Winter G, Kissel T. Microencapsulation of rh-‐erythropoietin, using biodegradable poly (d, l-‐lactide-‐co-‐glycolide): protein stability and the effects of stabilizing excipients. European journal of pharmaceutics and biopharmaceutics. 1997;43:29-‐36. [57] Carpenter JF, Pikal MJ, Chang BS, Randolph TW. Rational design of stable lyophilized protein formulations: some practical advice. Pharmaceutical research. 1997;14:969-‐75. [58] Wang W. Lyophilization and development of solid protein pharmaceuticals. International journal of pharmaceutics. 2000;203:1-‐60.

34
[59] Lai M, Topp E. Solid-‐state chemical stability of proteins and peptides. Journal of pharmaceutical sciences. 1999;88:489-‐500. [60] Costantino HR, Langer R, Klibanov AM. Solid-‐phase aggregation of proteins under pharmaceutically relevant conditions. Journal of pharmaceutical sciences. 1994;83:1662-‐9. [61] Liu WR, Langer R, Klibanov AM. Moisture-‐induced aggregation of lyophilized proteins in the solid state. Biotechnology and bioengineering. 1991;37:177-‐84. [62] Schwendeman SP, Costantino HR, Gupta RK, Siber GR, Klibanov AM, Langer R. Stabilization of tetanus and diphtheria toxoids against moisture-‐induced aggregation. Proceedings of the National Academy of Sciences. 1995;92:11234-‐8. [63] Zhu G, Mallery SR, Schwendeman SP. Stabilization of proteins encapsulated in injectable poly (lactide-‐co-‐glycolide). Nature biotechnology. 2000;18:52-‐7. [64] Estey T, Kang J, Schwendeman SP, Carpenter JF. BSA degradation under acidic conditions: a model for protein instability during release from PLGA delivery systems. Journal of pharmaceutical sciences. 2006;95:1626-‐39. [65] Butler SM, Tracy MA, Tilton RD. Adsorption of serum albumin to thin films of poly (lactide-‐co-‐glycolide). Journal of Controlled release. 1999;58:335-‐47. [66] Ding AG, Schwendeman SP. Acidic microclimate pH distribution in PLGA microspheres monitored by confocal laser scanning microscopy. Pharmaceutical research. 2008;25:2041-‐52. [67] Li L, Schwendeman SP. Mapping neutral microclimate pH in PLGA microspheres. Journal of controlled release. 2005;101:163-‐73. [68] Lavelle E, Yeh MK, Coombes A, Davis S. The stability and immunogenicity of a protein antigen encapsulated in biodegradable microparticles based on blends of lactide polymers and polyethylene glycol. Vaccine. 1999;17:512-‐29. [69] Jiang W, Schwendeman SP. Stabilization and controlled release of bovine serum albumin encapsulated in poly (D, L-‐lactide) and poly (ethylene glycol) microsphere blends. Pharmaceutical research. 2001;18:878-‐85. [70] Kim JH, Taluja A, Knutson K, Han BY. Stability of bovine serum albumin complexed with PEG-‐poly (L-‐histidine) diblock copolymer in PLGA microspheres. Journal of controlled release: official journal of the Controlled Release Society. 2005;109:86-‐100. [71] Shenderova A, Burke TG, Schwendeman SP. The acidic microclimate in poly (lactide-‐co-‐glycolide) microspheres stabilizes camptothecins. Pharmaceutical research. 1999;16:241-‐8. [72] UCHIDA T, YAGI A, ODA Y, NAKADA Y, GOTO S. Instability of bovine insulin in poly (lactide-‐co-‐glycolide)(PLGA) microspheres. Chemical and pharmaceutical bulletin. 1996;44:235-‐6. [73] Jiang W, Schwendeman SP. Stabilization of tetanus toxoid encapsulated in PLGA microspheres. Molecular Pharmaceutics. 2008;5:808-‐17.

35
[74] Kang J, Schwendeman SP. Comparison of the effects of Mg (OH)2 and sucrose on the stability of bovine serum albumin encapsulated in injectable poly (d, l-‐lactide-‐co-‐glycolide) implants. Biomaterials. 2002;23:239-‐45. [75] Burke P. Determination of internal pH in PLGA microspheres using 31P NMR spectroscopy. Proc Inter Symp Controlled Release Bioactive Mater1996. p. 133-‐4. [76] Wong-‐Moon KC, Sun X, Nguyen XC, Quan BP, Shen K, Burke PA. NMR spectroscopic evaluation of the internal environment of PLGA microspheres. Molecular Pharmaceutics. 2008;5:654-‐64. [77] Mäder K, Gallez B, Liu K, Swartz H. Non-‐invasive in vivo characterization of release processes in biodegradable polymers by low-‐frequency electron paramagnetic resonance spectroscopy. Biomaterials. 1996;17:457-‐61. [78] Brunner A, Mäder K, Göpferich A. pH and Osmotic Pressure Inside Biodegradable Microspheres During Erosion1. Pharmaceutical research. 1999;16:847-‐53. [79] Mäder K, Bittner B, Li Y, Wohlauf W, Kissel T. Monitoring microviscosity and microacidity of the albumin microenvironment inside degrading microparticles from poly (lactide-‐co-‐glycolide)(PLG) or ABA-‐triblock polymers containing hydrophobic poly (lactide-‐co-‐glycolide) A blocks and hydrophilic poly (ethyleneoxide) B blocks. Pharmaceutical research. 1998;15:787-‐93. [80] Shenderova A, Ding AG, Schwendeman SP. Potentiometric method for determination of microclimate pH in poly (lactic-‐co-‐glycolic acid) films. Macromolecules. 2004;37:10052-‐8. [81] Fu K, Pack DW, Klibanov AM, Langer R. Visual evidence of acidic environment within degrading poly (lactic-‐co-‐glycolic acid)(PLGA) microspheres. Pharmaceutical research. 2000;17:100-‐6.

36
CHAPTER 2
Mapping Microclimate pH Distribution inside Protein-
encapsulated PLGA Microspheres Using Confocal Laser Scanning
Microscopy
2.1 Abstract
The pH in the aqueous pores of poly(lactide-‐co-‐glycolide) (PLGA) matrix, also
referred to microclimate pH (µpH), is often uncontrolled ranging from highly acidic
to neutral pH range. The µpH distribution inside protein-‐encapsulated PLGA
microspheres was quantitatively evaluated using confocal laser scanning
microscopy. The fluorescent response of Lysosensor yellow/blue® dextran used to
map µpH in PLGA was influenced by the presence of encapsulated protein. The non-‐
protonated form of the pyridyl group on the fluorescence probe at neutral pH was
responsible for the interference, which was dependent on the type and
concentration of protein. A method for correction of this interference based on
estimating protein concentration inside the microspheres was established and
validated. After correction for this influence, the µpH distribution and kinetics
inside microspheres was evaluated for different PLGA 50/50 microsphere

37
formulations under physiological conditions for 4 weeks. Generally, the µpH acidity
increased with the increasing of incubation time. The co-‐incorporation of a poorly
soluble base, magnesium carbonate, in the microspheres postponed the appearance
of detectable acidity for up to 3 weeks. Co-‐addition of an acetate buffer was able to
control the µpH over a slightly acidic range (around pH 4.7) after two weeks of
incubation. Microspheres prepared from a lower polymer concentration exhibited a
higher µpH, likely owing to reduced diffusional resistance to acidic degradation
products out of the microspheres. The stability of protein was enhanced by addition
of MgCO3, acetate buffer, or by reduced polymer concentration in the preparation, as
evidenced by more soluble protein recovered after incubation. Hence, the µpH
imaging technique developed can be employed in the future for optimization of
formulation strategies for controlling µpH and stabilizing encapsulated proteins.
KEY WORDS: microclimate pH; microspheres; confocal laser scanning microscopy;
poly(lactide-‐co-‐glycolide); pH distribution
2.2 Introduction
Poly(lactide-‐co-‐glycolide) (PLGA), as one of the most important classes of
biodegradable and biocompatible polymers, has long been the research focus of
controlled delivery of biomacromolecules, including peptides, proteins, and vaccines
[1-‐6]. Despite its excellent safety and versatility, a major drawback associated with

38
this polymer is the common acidification and lack of control of its
microenvironment inside the polymer matrix during erosion, as a result of acidic
polymer impurities and the build-‐up of acidic monomers and oligomers generated
from polymer hydrolysis. Consequently, the integrity of encapsulated acid-‐labile
proteins can be greatly compromised during release [7-‐9].
Several studies, using indirect methods, have shown evidence of an acidic
microclimate within degrading PLGA devices. For example, faster degradation in the
center of large PLGA specimens (~1-‐2 mm dimensions) was observed due to the
accelerated hydrolysis of ester bondage catalyzed by the acids accumulated at the
matrix core [10]. Additionally, Shenderova et al. [11] found that camptothecin was
stabilized in its acid-‐stable (and active) lactone form when encapsulated in PLGA
microspheres. Furthermore, co-‐incorporation of antacids, such as Mg(OH)2, MgCO3
and ZnCO3 in PLGAs could strongly inhibit protein structural losses and aggregation
for over one month, as demonstrated in studies with model as well as therapeutic
proteins [12-‐15].
Moreover, techniques have been developed to directly quantify µpH inside
PLGA delivery systems, including 31P nuclear magnetic resonance (NMR) [16],
electron paramagnetic resonance (EPR) [17], potentiometry [18], and confocal
microscopy imaging [19-‐21]. The first three methods are limited to providing an
averaged µpH. Confocal microscopy imaging, on the other hand, by encapsulating
39
fluorescent pH-‐sensitive probes, is capable of delineating a detailed µpH map
noninvasively within the polymer matrix.
After early attempts to develop a quantitative ratiometric method of µpH
measurement using confocal laser scanning microscopy [19], our group found that
SNARF-‐1® dextran [20] and Lysosensor yellow/blue® dextran [21], as fluorescent
probes encapsulated into PLGA microspheres, could sense pH changes from pH 5.8
to 8.0, and pH 2.8 to 5.8, respectively. Thus, after confocal image processing, an
accurate pixel-‐by-‐pixel µpH distribution map either in the neutral or acidic range
could be created [20, 21]. This ratiometric method is advantageous in that it
eliminates artifacts including photo bleaching, leakage of the dye probe, and non-‐
uniform distribution of dye within microspheres. The dextran-‐conjugated probes
employed are water-‐soluble macromolecules, thereby localizing themselves in the
aqueous pores where protein resides [19].
In the present study, µpH inside PLGA microspheres encapsulating both
protein and Lysosensor yellow/blue® dextran was accurately quantified using
confocal microscopy imaging. To accomplish this, significant interference of the dye
response from the presence of protein was corrected by estimating protein
concentration inside the PLGA pores to perform the measurement. The acquired
knowledge is beneficial to further our understanding of µpH development and
promote formulation designs for optimized delivery of pH-‐sensitive
biomacromolecules.

40
2.3 Materials and Method
2.3.1 Materials
Poly(D,L-‐lactide-‐co-‐glycolide), end capped, 50/50 with inherent viscosity
(i.v.) of 0.6 dl/g in hexafluoroisopropanol at 25 °C was purchased from Durect
Corporation (Birmingham, AL). The fluorescent pH sensitive probe, Lysosensor
yellow/blue® dextran (MW=10 kDa) was purchased from Invitrogen (Eugene, OR).
Bovine Serum Albumin (BSA, fraction V), was purchased from Sigma Chemical Co.
(St. Louis, MO). Polyvinyl alcohol (PVA, 80% hydrolyzed, MW 9-‐10 kDa) was
supplied by Polysciences Inc. (Warrington, PA). All other chemicals were of
analytical grade or higher were obtained from commercial suppliers.
2.3.2 Preparation of microspheres
Protein-‐encapsulated PLGA microspheres containing Lysosensor
yellow/blue® dextran as an acidic pH sensitive probe were prepared using the
w/o/w double emulsion-‐solvent evaporation method. Briefly, 100 µl of 300 mg/ml
BSA with 25 mg/ml dye in double distilled water was added to 1 ml of 400 mg/ml
PLGA solution (40% w/v) in methylene chloride. The mixture was then
homogenized using a Tempest IQ2 homogenizer (The VirTis Co., Gardiner, NY) at
7,500 rpm for 1 min to generate first w/o emulsion, followed by quickly adding 1 ml
of PVA solution (2% w/w). After vortexing for 20 s, the formed w/o/w emulsion

41
was poured slowly into 100 ml of PVA solution (0.5% w/w) and stirred at room
temperature for 3 hours to extract and evaporate the organic solvent. Then, the
hardened microspheres were harvested and sieved for 45-‐63 µm size. After washing
with double distilled water three times, the microspheres were freeze-‐dried on a
FreeZone 2.5 Liter Benchtop freeze dry system (Labconco, Kansas City, MO).
For microspheres containing BSA of a specific pH, 100 mg/ml BSA solution
was first titrated with HCl to pH 3, 4, and 5, respectively, followed by freeze-‐drying.
The lyophilized powder was then reconstituted with water and encapsulated with
dye in PLGA microspheres as described above. Microspheres containing magnesium
carbonate were prepared by suspending 3% (w/w) of the base to the polymer
solution with all other conditions as described above. To prepare microspheres
encapsulating acetate buffer, BSA and dye were dissolved in 100 µl of 0.1 M sodium
acetate buffer of pH 4.6 to make the water phase, with other conditions unchanged.
Microspheres with a lower polymer concentration (30% w/v) were also prepared
following the same procedures.
2.3.3 Confocal laser scanning microscopy for microspheres imaging
A ratiometric method based on a confocal microscopy imaging technique was
employed similarly as described by Ding et al. [21]. A Carl Zeiss LSM 510-‐META
laser scanning confocal microscope (LSCM, Carl Zeiss Microimaging, Inc.,
Thornwood, NY) was equipped with an Enterprise UV laser and a Carl Zeiss

42
Axiovert 100 M inverted microscope. The fluorescent dye that was encapsulated in
the microspheres was excited at 364 nm, and the emission at two wavelengths, 450
nm and 520 nm were recorded. All measurements were conducted using a C-‐
Apochromat 63X water immersion objectives lens with a numerical aperture of 1.2.
The detection gain was set at 650, and the pinhole was 328 µm, which resulted in
optical slice of thickness of 5 µm. The laser power was set at 40% of its full power.
The image size was 512x512 pixels and the images were scanned by 8 bit plane
mode at a scan speed of 6.40 μs/pixel.
2.3.4 Calibrating fluorescence intensity ratio vs. pH in the presence of protein
A set of universal buffers with pH ranging from 2.8 to 5.8 were prepared
using combined 0.1 M citric acid and 0.2 M Na2HPO4 solutions. A certain
concentration of protein solutions (BSA or lysozyme, e.g. 100 mg/ml) was prepared
by dissolving protein in the buffers and then titrating the solution to its original pH.
Lysosensor yellow/blue® dextran was then dissolved in the protein buffer solutions
with a concentration of 1.2 mg/ml.
Images of dye solution were obtained under confocal microscope at 450 nm
and 520 nm. The acquired images (n=8) were processed by frame averaging,
followed by neighborhood averaging, and applying a median filter as described by Li
et al. [20] using Image J software (developed by National Institutes of Health and
available on the internet at http://rsbweb.nih.gov/ij/) to eliminate the signal noise

43
and obtain accurate pixel value. The standard curves were established by plotting
the ratio of mean pixel intensity of the dye solutions at two emission wavelength,
450 nm and 520 nm vs. the pH of that solution.
2.3.5 Microclimate pH mapping inside microspheres
Microspheres (20–25 mg) were incubated in 1 ml phosphate buffer saline
(7.74 mM Na2HPO4, 2.26 mM NaH2PO4, 137 mM NaCl and 3 mM KCl) containing
0.02% tween 80 (PBST, 10mM, pH=7.4) at 37°C under mild agitation at 320 rpm by
a KS 130 basic shaker (IKA® Works Inc., Wilmington, NC). At pre-‐determined time
points, the release medium was replaced with fresh buffer and a small amount of
microspheres were collected and placed under confocal microscope while focusing
at the center of microspheres to obtain images (n=5). After image processing [20],
the ratio of fluorescence intensity I450nm/I520nm at each pixel having intensity above
the threshold value (indicating the fluorescence from release media) of the images
was calculated and assigned to a pH from the standard curves independent of dye
concentration. In the processed images, each pixel was converted to a color
corresponding to specific pH. When plotting the µpH distribution curves, the
probability of a specific pH inside microspheres was calculated by taking the
amount of pixels corresponding to that pH divided by the total pixels of the
microspheres. For intensity ratios exceeding the limit of standard curve, the pH was

44
assigned to either below 2.8 or above 5.8. In such cases, their percentage was
plotted as the boundaries of the distribution curves accordingly.
The µpH could be accurately mapped within ± 0.2 pH unit over pH from 2.8
to 5.8 (see Supporting Information 2.6.1 for statistical analysis).
2.3.6 Determination of protein loading and encapsulation efficiency
The amount of protein encapsulated in PLGA microspheres was determined
by direct recovery from the polymer matrix [13]. Eight mg of microspheres were
dissolved in 2 ml acetone. The mixture was vortexed and centrifuged at 8,000 rpm
for 10 min, followed by removal of the acetone. After repeating the above
procedures three times, the BSA pellet was air-‐dried and reconstituted in PBST and
incubated at 37°C for 1 h. The protein concentration was then determined using
Coomassie® Plus protein assay reagent. The working range in this study was from 25
µg/ml to 500 µg/ml (assay sensitivity is from 1 µg/ml to 1500 µg/ml) and not
interfered by reagents used in our experiments. Protein loading was calculated from
the amount of protein recovered divided by the mass of microspheres.
Encapsulation efficiency was obtained from the ratio of actual protein loading to the
theoretical protein loading. All measurements were performed in triplicate (n=3).
2.3.7 Release and stability of protein from microspheres
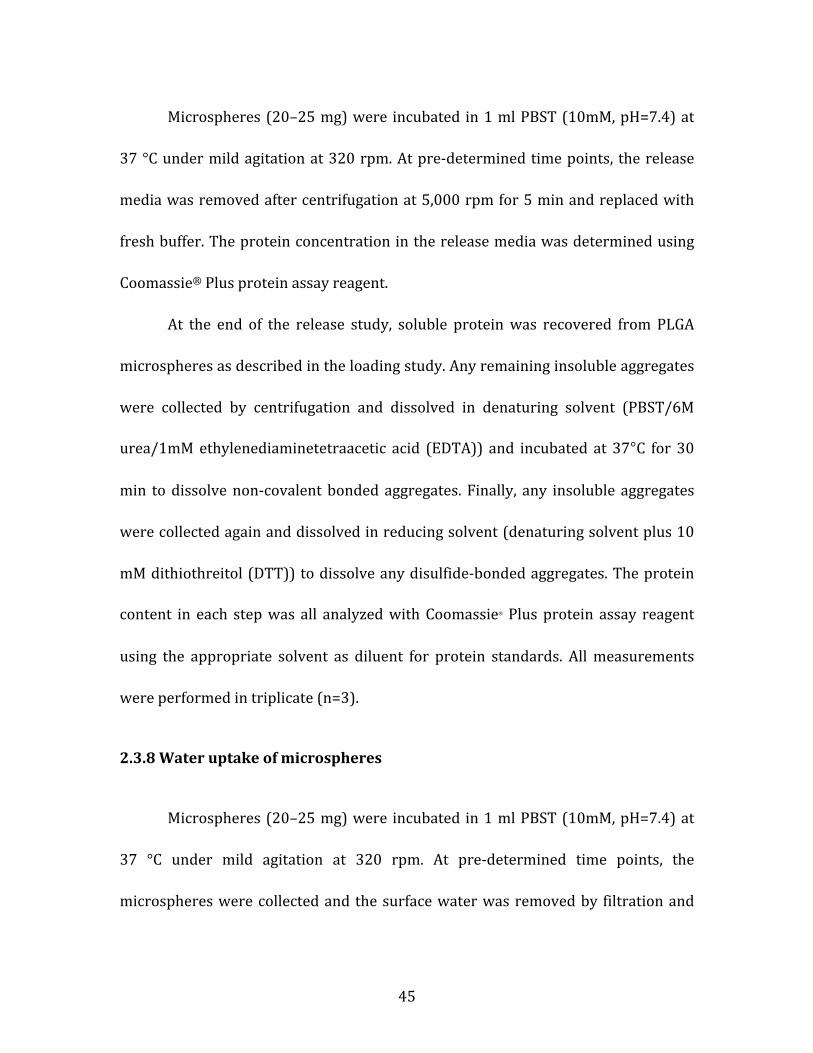
45
Microspheres (20–25 mg) were incubated in 1 ml PBST (10mM, pH=7.4) at
37 °C under mild agitation at 320 rpm. At pre-‐determined time points, the release
media was removed after centrifugation at 5,000 rpm for 5 min and replaced with
fresh buffer. The protein concentration in the release media was determined using
Coomassie® Plus protein assay reagent.
At the end of the release study, soluble protein was recovered from PLGA
microspheres as described in the loading study. Any remaining insoluble aggregates
were collected by centrifugation and dissolved in denaturing solvent (PBST/6M
urea/1mM ethylenediaminetetraacetic acid (EDTA)) and incubated at 37°C for 30
min to dissolve non-‐covalent bonded aggregates. Finally, any insoluble aggregates
were collected again and dissolved in reducing solvent (denaturing solvent plus 10
mM dithiothreitol (DTT)) to dissolve any disulfide-‐bonded aggregates. The protein
content in each step was all analyzed with Coomassie® Plus protein assay reagent
using the appropriate solvent as diluent for protein standards. All measurements
were performed in triplicate (n=3).
2.3.8 Water uptake of microspheres
Microspheres (20–25 mg) were incubated in 1 ml PBST (10mM, pH=7.4) at
37 °C under mild agitation at 320 rpm. At pre-‐determined time points, the
microspheres were collected and the surface water was removed by filtration and

46
the wet weight (W1) of the microspheres was recorded. The samples then were
dried under vacuum to a constant weight and the dry weight (W2) was recorded.
To correct for the interparticle water, dry microspheres were suspended in
PBST at room temperature and rapidly filtered and dried as described above.
Assuming little water uptake by the microparticles between suspension and
filtration, the weight differences between wet and dry particles accounted for the
portion of interparticle water (Wi ), as defined by
€
Wi ≡W1
' −W2'
W2' (1)
Where W1’ and W2’ are the weights of wet microspheres and dry
microspheres after immediate collection (t=0), respectively. The water uptake of
microspheres at time t (WP(t)) was estimated by:
€
WP (t) =W1 −W2 −W2 ×Wi
W2
(2)
Where W1 and W2 are the wet and dry microsphere weights at time t. Note
that in control experiments the interparticle water estimation did not significantly
depend on the temperature of water used, e.g. 4˚C, 25˚C and 37˚C (data not shown).
All measurements were performed in triplicate (n=3).
2.3.9 Correction of protein interference on μpH mapping

47
To account for the influence of protein on dye emission, corrections were
necessary to acquire an accurate estimation of the µpH in the presence of significant
BSA. The influence of lysozyme was significantly less, and therefore, its correction
was not considered further. Since protein concentration inside microspheres
changes during incubation due to the protein release and water uptake by the
polymer matrix, corrections were done for each time point of pH mapping. The
average protein concentration (Cp(t)) inside the microsphere aqueous pores at time
t can be estimated by the following equation:
€
Cp (t) =Mp
Vpores
=MP ,0 × l × (1− f (t)) × ρw
MP (t) ×WP (t) (3)
where Mp is the mass of protein in microspheres. Vpores is the volume of aqueous
pores. MP,0, MP(t) are the initial and time dependent mass of microspheres
respectively. l is the fraction of protein loaded. f(t) is the fraction of protein release
from microspheres. And ρw is the density of water.
When the estimated protein concentration was not the same as those in
known standard curves (Figure 2.1B), the corresponding fluorescence ratio vs. pH
curve was interpolated. (see Supporting Information 2.6.2)
2.4 Results and discussion
2.4.1 Interference of protein on fluorescent response of the dye

48
Lysosensor yellow/blue® dextran, which is sensitive to changes in acidity
from roughly pH 2.8 to 5.8, was selected as a fluorescence probe to investigate the
µpH inside PLGA microspheres, as previously reported [21]. Adding protein to the
dye solutions also provided a fluorescent intensity emission ratio (I450 nm/I520 nm) vs.
pH standard curve well fitted to a third-‐order polynomial function (r2=0.999) from
pH 2.8 to 5.8 (Figure S2.3). The pH sensitivity of the dye is concentration-‐
independent as well, which ensures the standard curve is not affected when the dye
concentration changes in microspheres during incubation. However, as protein
concentration was raised to elevated levels (e.g., >25 mg/ml of BSA), the fluorescent
response of the dye was significantly influenced by the presence of protein, and this
interference was dependent on the specific protein. For example, as shown in
Figure 2.1A, the pH sensitivity differed for dye solutions with or without presence of
protein, with the presence of BSA giving more pronounced changes in emission
intensity ratio compared to that of lysozyme. As expected from Figure 2.1A, the
fluorescence ratio was significantly affected by the protein concentration over wide
range. As shown in Figure 2.1B, the intensity ratio at a certain pH for BSA
concentration of 0 to 500 mg/ml rose as protein concentration was increased, with
little or no influence at pH 2.8 to an extensive effect at pH 5.8. The sensitivity of dye
at high pH corresponding to the presence of the non-‐protonated form of the dye’s
pyridyl group implicates this dye species as responsible for the protein interference.
Note that by 500 mg/ml BSA at highly acidic pH resulted in a gel formation,

49
consistent with the low pH unfolding of the protein [22] and noncovalent
aggregation of BSA in PLGA [12, 13], which was associated with an unexpected
increase in the intensity ratio at the pH of 2.8 (Figure 2.1B).
The mechanism of protein interference on the fluorescent response of the
non-‐protonated form of dye is not well understood, although it was demonstrated
that the presence of protein would quench the emission of dye at 520 nm and shift
the emission peak at 450 nm slightly to a shorter wavelength in the fluorescence
spectrum (Figure S2.4). Ground state interactions between dextran-‐dye and protein,
e.g., binding, was not likely to cause the interference, considering the emission ratio
did not depend on dye concentration in presence of either lysozyme or BSA (Figure
S2.3). Processes involving excited state of fluorophores, such as energy transfer or
collisional quenching induced by the protein, were more likely responsible for the
interference.
2.4.2 Correction of BSA effect on dye interference and BSA buffering capacity
As described in the Materials and Methods, we estimated the BSA
concentration in the microspheres to correct for the BSA interference on the µpH
reporting of the dye. Key assumptions involved estimates of interparticle water and
assuming uniform BSA concentration in the pores. In addition, for this polymer
molecular weight, very little water partitions in the polymer phase until late stages

50
of polymer erosion [23]. To validate our approach of correction, we compared the
µpH measured inside microspheres encapsulating BSA after 1 day incubation in
PBST at 37°C as a function of various pH of BSA solutions used to form the primary
emulsion during microsphere preparation. We hypothesized that after 1-‐day
incubation, a concentrated protein solution would be formed due to the water
penetration into the polymer matrix. Therefore, the µpH would be dictated by the
pH of the encapsulated protein solution in aqueous pores as significant degradation
of polymer is not expected at such an early time of incubation [23, 24]. Moreover,
from µpH measurement of microspheres without encapsulating protein, little acidity
was observed (See Figure 2.3B), indicating the lack of significant acid impurities.
Encapsulated BSA of different pH was prepared by titrating 100 mg/ml BSA solution
to a specific pH and then freeze-‐drying. The estimated protein concentration after 1-‐
day incubation inside polymer pores was roughly 500 mg/ml (within ±10%) for
each formulation, as calculated from (3). Thus, µpH values were estimated from
fluorescence ratio vs. pH standard curve with 500 mg/ml BSA. The processed
confocal images and µpH distribution curves are shown in Figure 2.2 & Figure 2.3,
respectively, and corresponding results are summarized in Table 2.1. The estimated
µpH after correction was very close (difference within 0.1 pH unit) to the pH of the
concentrated protein solution, strongly supporting the approach of correction.

51
Table 2.1 pH comparison of concentrated BSA solution and average µpH after 1 day incubation from confocal microscopy after correction of protein interference.
a The solution was made by reconstitution of lyophilized BSA power from 100 mg/ml solution of specific pH, as described in Materials and Methods. b The µpH was controlled by the inner water phase pH, as described in Materials and Methods.
A slight acidity was observed in PLGA microspheres encapsulating only dye
after the 1-‐day incubation (Figure 2.2A), which could be ascribed the existence of a
very low level of acidic impurities in the polymer. However, upon incorporation of
BSA, the pH in most aqueous pores were raised above 5.8, with more than 95% of
pixels out of detection limit compared to 80% in microspheres without protein
(Figure 2.3B), consistent with significant buffering capacity of the encapsulated BSA.
Moreover, the µpH was more homogenously distributed inside microspheres
encapsulating protein (Figure 2.2E).
2.4.3 Mapping µpH distribution and kinetics in degrading PLGA microspheres
After the successful test of the correction for BSA interference on µpH
measurement, µpH distribution and kinetics were examined and compared in
degrading PLGA microspheres prepared from different formulations during a one-‐
pH of 100 mg/ml BSA solution
pH of 500 mg/ml BSA solution a
Average µpH from confocal imaging b
3.0 3.2 3.2
4.0 4.1 4.2
5.0 5.1 5.0
7.0 7.0 >5.8

52
month incubation. The processed confocal images visualized the µpH distribution by
color, and the distribution curves provided a quantitative illustration. It should be
noted that the μpH mapped refers to the μpH distribution within the region of
optical slice of confocal imaging (5 μm under the condition of this experiment).
Presumably the fluorescence could only be observed in areas of aqueous pores;
however, since pores at different planes within this region do not vertically overlay
with each other, fluorescence could be observed through the entire image at the
beginning of incubation.
Little acidity was observed in microspheres made from polymer
concentration of 40% (w/v) at the beginning of incubation, as evidenced by more
than 95% of pixels in the images out of detectable limit of the dye (pH 5.8). As the
incubation progressed, the µpH decreased steadily until day 21 in accordance with
the accumulation of water-‐soluble acids generated by the degradation of the
polymer. After 21 days, the µpH maintained mostly in the range of 4 to 5.8 (Figure
2.5A), probably due to the onset of polymer erosion and liberation of water-‐soluble
acids out of the polymer to balance acid production rate. From the processed
confocal images (Figure 2.4A), the acidity was observed to be higher in the center of
microspheres than in the peripheral regions, consistent with development of an
expected diffusion/reaction mechanism governing polymer distribution of acidic
degradation products. The blank regions inside the microspheres indicate no

53
detectable fluorescence, corresponding to regions of free dye loading or extensive
dye release from the polymer.
Addition of magnesium carbonate delayed the appearance of detectable
acidity inside microspheres up to 3 weeks (Figure 2.4B & 2.5B) possibly by multiple
mechanisms, including: i) dissolution and direct neutralization of PLGA-‐produced
acids and ii) water uptake and pore formation imparted by the osmotic Mg-‐
carboxylate salts resulting from acid-‐base titration, which increases liberation of
sequestered acids. The minimization of the pH drop conferred by incorporation of
base in PLGAs was supported indirectly in a previous study from decreasing the
degradation rate of the polymer [12]. Moreover, this effect was further confirmed in
a quantitative way using a neutral pH sensitive dye [20]. In this study, the effect of
MgCO3 incorporation was examined by the changes in acidic pH in BSA-‐containing
PLGA 50/50 microspheres. Consistent with previous studies with larger
millicylidrical implants [13], elevated water uptake was observed in microspheres
upon incorporation of MgCO3 (Figure 2.6B), as a result of the osmotic pressure
generated by the Mg-‐carboxylate salts described above. Since more water channels
were created, encapsulated protein was released slightly faster than that of without
base (Figure 2.6A). The same trend was also expected for dye release in
microspheres with MgCO3. The rapid release of dye, therefore, was associated with a
higher fraction of blank regions in confocal images than in base-‐free formulations.
In addition, the decrease of the µpH by 28 days of incubation may have been caused

54
by the depletion of base from the polymer. Note that water uptake (Figure 2.6B) and
protein release kinetics (Figure 2.6A) were used to estimate protein concentration
kinetics inside polymer pores (Figure 2.6C) for correction of protein interference on
µpH mapping, as described in the Materials and Methods.
In order to control µpH over a moderate acidic range, water-‐soluble buffering
species were co-‐encapsulated with protein into PLGA microspheres. This was
achieved by adding to the protein inner water phase a buffer solution (0.1 M acetic
acid and sodium acetate, pH=4.6). During incubation, the aqueous pores inside
microspheres would be filled with buffering species with protein so long as these
species are retained in the polymer. From confocal images (Figure 2.4C) and µpH
distribution curves (Figure 2.5C), the µpH gradually dropped from neutral pH as
incubation progressed. After 14 days incubation, the average µpH was maintained
from 4.6 to 4.8. The relatively high pH during the initial stage of incubation was due
to the very high protein concentration in aqueous pores, which acted also as a
buffer, undermining the buffering capacity of acetate salts. As water imbibed into
and protein released out of polymer matrix, protein concentration decreased.
Meanwhile, despite the possible removal of acetic acid, water-‐soluble acids were
generated from polymer degradation, leading to µpH approach to the pH of acetate’s
maximal buffer capacity (pKa=4.7).
The effect of polymer concentration on µpH distribution kinetics was also
examined in our study. Microspheres were prepared from a lower polymer

55
concentration of 30% (w/v). Compared to that made of 40% (w/v), the µpH was
much less acidic upon 14 days incubation (Figure 2.4D & 2.5D). This could be
rationalized by the fact that microspheres made from solution of lower polymer
concentration usually possess more porous internal structure [25], which likely
caused a higher effective diffusivity of acidic degradation products through the
polymer matrix [26] and facilitated their liberation as a result. After 21 days
incubation, the effect of polymer concentration on µpH was not apparent, which was
presumably due to the changes in polymer properties, e.g. degradation rate, so that
the difference in diffusion rate of acids was not significant.
2.4.4 Assumptions for correction and anticipated error
The correction for BSA’s effect on the dye’s fluorescent response was based
on multiple assumptions. One important assumption for correction is that protein is
evenly distributed inside aqueous pores in microspheres. This was supported by
lysozyme’s homogeneous distribution inside PLGA microspheres prepared by
w/o/w double emulsion method, as observed by confocal laser scanning microscopy
and infrared microscopy [27]. In the confocal images recorded in this study (Figure
2.4), the fairly homogeneous distribution of dye (being a water-‐soluble
macromolecule as protein) was observed with the exception of formulations with
base added and at the very last time point of 28 days, indicating the similar behavior
of protein inside microspheres. Another assumption is that the protein

56
concentration in the cavities of microspheres was relatively uniform. In the case that
local protein concentration in some pores were higher than the estimated average
protein concentration, the µpH distribution curves would generally shift to a lower
pH.
Since the average protein concentration in PLGA pores at each point during
controlled release was based on estimation from equation (3), errors may be
associated with the deviation of estimation from the actual protein concentration,
affecting the µpH measurement. The kinetics of estimated protein concentration
inside microspheres during one month incubation are displayed in Figure 2.6C.
Among all the parameters used to calculate the averaged protein concentration, the
time dependent water uptake is most variable because the fraction of interparticle
water may be changing during incubation depending on the property of polymer.
Assuming there was 20% of error involved in experiments of estimating water
uptake of microspheres, the µpH kinetics corrected from protein concentration
accounting for this ± 20% of error (-‐17% to +25% of protein concentration) for
microspheres with or without encapsulating MgCO3 are shown in Figure S2.5. As
demonstrated, the resulted µpH was not significantly affected (within 0.2 pH unit).
Hence, the correction was only modestly influenced by small deviations based on
the interparticle water assumption.
2.4.5 Formulation effects on protein stability

57
Insoluble protein aggregation has been observed when encapsulated in
PLGAs, which has been linked to the acidic environment in PLGAs. For example, BSA
was found to become hydrolyzed and form noncovalent aggregates by hydrophobic
interactions when encapsulated in PLGA 50/50 millicylindrical implants [12, 13,
15]. Therefore, we analyzed the composition of residual protein inside PLGA
microspheres after 4 weeks incubation in terms of soluble and insoluble protein
[12] and the results were summarized in Table 2.2.
Table 2.2 Release and stability of various microsphere formulations after 28 days incubation.
a All data are reported as mean ± SD, n=3. b Determined after 28-‐day release. c Recovery (%) = released (%) + soluble residue (%) + insoluble residue (%).
Formulation Polymer conc. (w/v)/excipient
Loading (%)
Encapsulation efficiency (%)
Released (%)b
Soluble residue (%)b
Insoluble residue (non-‐
covalent) (%)b
Insoluble residue (covalent) (%)b
Recovery (%) b, c
40 % (w/v) 4.7 ± 0.2 a 68 ± 3 18.1 ±
0.2 9 ± 2 34 ± 5 8 ± 1 71
40 % (w/v) w/MgCO3
5.2 ± 0.1 75 ± 2 20.9 ±
0.3 44 ± 5 21 ± 2 4 ± 1 90
40 % (w/v) w/acetate buffer
4.9 ± 0.1 69 ± 1 17.1 ±
0.7 41 ± 2 16 ± 3 5 ± 1 79
30 % (w/v) 3.9 ± 0.1 62 ± 1 23.3 ±
0.4 46 ± 1 12 ± 2 2 ± 1 83

58
Incorporation of poorly soluble base (MgCO3) significantly improved protein
stability in terms of aggregation, as 44 ± 5 % of soluble residue remained after 28
days release relative to 9 ± 2 % in microspheres without any excipients. The
mechanism of stabilization is believed to occur primarily via raising the acidic µpH
in degrading PLGA matrix, as displayed in our confocal images and µpH distribution
curves. This stabilization effect conferred by antacids was also shown in other
therapeutic proteins [12, 15]. Some degree of aggregation persisting in these
formulations is consistent with our previous data with microspheres prepared with
the ester-‐end-‐capped PLGA 50/50 [12]. The 90% recovery in this formulation also
suggested reduced protein hydrolysis than the other samples (71-‐83% recovery), as
low recovery likely results from a lack of recognition of hydrolyzed protein by the
Coomassie® Plus protein assay reagent [28]. Note that higher water content and
slightly faster release (and thus, less remaining encapsulated protein to become
damaged) are also potential effects to decrease the 28-‐day aggregation values [13,
15].
Addition of acetate buffer also reduced protein aggregation inside PLGA
microspheres during one-‐month incubation. In this case, the pH profile was very
similar to that recorded in the most unstable preparation (prepared with 40% w/v
polymer concentration), albeit just slightly higher in the vicinity of the high
buffering capacity of the acetate buffer. This data suggests perhaps other factors
involved, e.g., the elevated water content and strongly reduced protein

59
concentration (see Figure 2.6) or the different ionic strength anticipated in the
microclimate of this formulation affecting protein’s stability. We also note that the
small changes in pH in the vicinity of the first unfolding transition of BSA [22] may
have been important.
Preparing microspheres from a lower polymer concentration also resulted in
enhanced protein stability. This can be attributed to a less acidic microclimate
developed in degrading PLGA specimen during the course of incubation. A more
porous internal structure can take more water, thereby increasing the effective
diffusion coefficient of the detrimental water-‐soluble acids in the polymer matrix
[26] and accelerating their release from the microspheres.
2.5 Conclusions
An uncontrolled and often acidic µpH is regarded as one of the most
deleterious factors responsible for the instability of encapsulated protein in PLGA
delivery systems. Therefore, it is important to develop methods of quantitative
description of the microenvironment in PLGA. In our study, we demonstrated that
µpH mapping in the polymer was affected by the presence of encapsulated protein,
whose interference on fluorescent response of dye depends on the type and
concentration of protein. µpH distribution in microspheres with protein and/or
excipients could be quantitatively evaluated using confocal laser scanning
microscopy after correction of the interference of protein. This µpH mapping

60
technique is presented as a valuable tool for the study of µpH development
mechanisms and design of formulation methodologies that control µpH with
stabilized biomacromolecules.
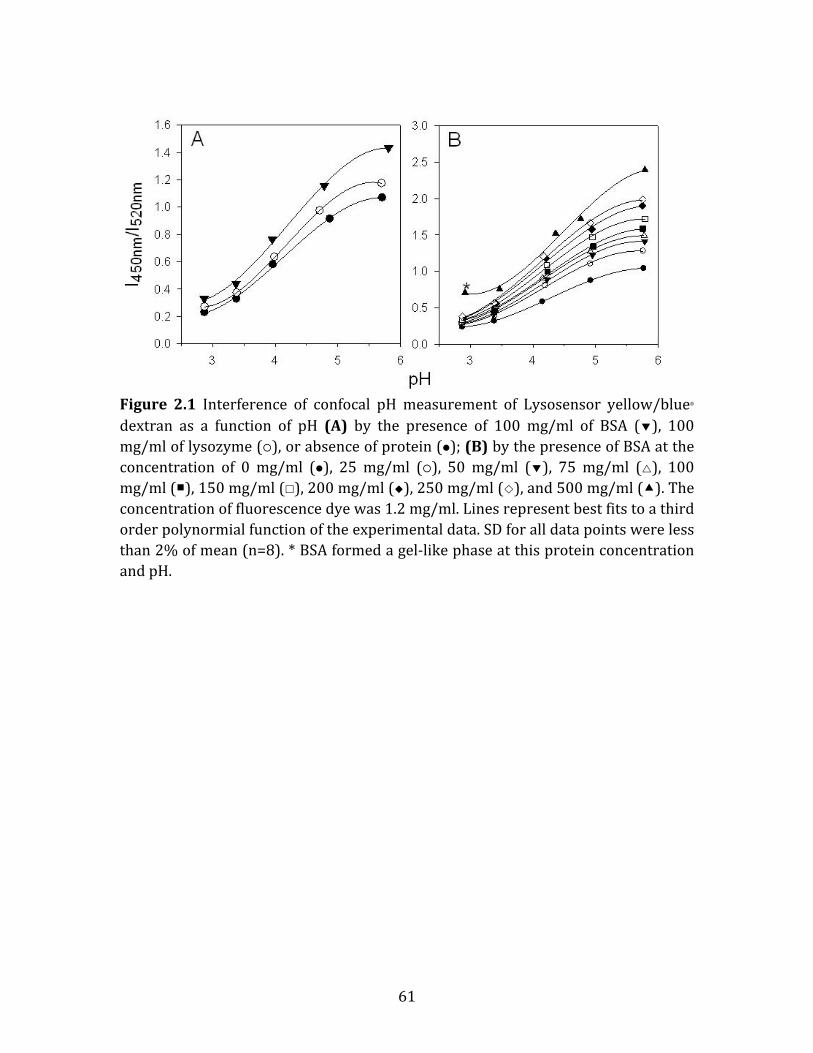
61
Figure 2.1 Interference of confocal pH measurement of Lysosensor yellow/blue dextran as a function of pH (A) by the presence of 100 mg/ml of BSA (), 100 mg/ml of lysozyme (), or absence of protein (); (B) by the presence of BSA at the concentration of 0 mg/ml (), 25 mg/ml (), 50 mg/ml (), 75 mg/ml (), 100 mg/ml (), 150 mg/ml (), 200 mg/ml (), 250 mg/ml (), and 500 mg/ml (). The concentration of fluorescence dye was 1.2 mg/ml. Lines represent best fits to a third order polynormial function of the experimental data. SD for all data points were less than 2% of mean (n=8). * BSA formed a gel-‐like phase at this protein concentration and pH.

62
Figure 2.2 Processed confocal images of microspheres encapsulating dye only (A); dye and BSA of pH of 3 (B); dye and BSA of pH of 4 (C); dye and BSA of pH of 5 (D); and dye and BSA of pH of 7 (E) after incubation at 37°C in PBST buffer for 1 day. The µpH was controlled by the inner water phase pH, as described in Materials and Methods.

63
Figure 2.3 µpH distribution kinetics of microspheres encapsulating (A) dye and BSA of pH of 3 (); dye and BSA of pH of 4 (); dye and BSA of pH of 5 (); and dye and BSA of pH of 7 () (B) dye only () and dye with BSA (pH of 7)() after incubation at 37°C in PBST buffer for 1 day. The µpH was controlled by the inner water phase pH, as described in Materials and Methods.

64
Figure 2.4 Processed confocal images of microsphere formulations during incubation in PBST at 37°C for 4 weeks. Microspheres were prepared from 40% (w/v) PLGA (A), 40% (w/v) PLGA + MgCO3 (B), 40% (w/v) PLGA + acetate buffer (C) and 30% (w/v) PLGA (D). Images were taken at 1 (A1-‐D1), 7 (A2-‐D2), 14 (A3-‐D3), 21 (A4-‐D4) and 28 (A5-‐D5) days.

65
Figure 2.5 µpH distribution kinetics of microsphere formulations during incubation in PBST at 37°C for 1 day (), 7 days (), 14 days (), 21 days (), and 28 days (). Microspheres were prepared from 40% (w/v) PLGA (A), 40% (w/v) PLGA + MgCO3 (B), 40% (w/v) PLGA + acetate buffer (C) and 30% (w/v) PLGA (D).

66
Figure 2.6 Kinetics of protein release (A), water uptake of microspheres (B), and estimated protein concentration in polymer pores (C) from PLGA microsphere formulations during incubation in PBST at 37°C for 4 weeks. Microspheres were prepared from 40% (w/v) PLGA (), 40% (w/v) PLGA + MgCO3 (), 40% (w/v) PLGA + acetate buffer () and 30% (w/v) PLGA (). Symbols represent mean ± SD, n=3 for A and B, SD is not applicable for C because the value is calculated from independent parameters from equation 3.

67
2.6 Supporting Information
2.6.1 Analysis of deviation in pH distribution from confocal images
To assess errors that may be caused from generating the pixel-‐by-‐pixel pH
map from confocal images, the following procedures were performed. First, the
acquired confocal images (n=8) of standard pH buffer solutions were processed as
reported previously [20]. The resulted image is a 512×512 matrix of pixel
intensities. Then, by taking the ratio of pixel intensities of processed image at two
emission wavelengths (I450nm/I520nm), a ratio matrix was generated. Next, each ratio
pixel was converted to a pH according to the standard curve of intensity ratio vs. pH.
After that, the probability density function of pH was fit with Gaussian function to
obtain mean and standard deviation of pH distribution.
Table S2.1 displayed the variability of pH distribution yielded from this
ratiometric measurement of confocal images. Except for the pH approaching
detection limit (pH 5.8), in presence or absence of protein, the mean of measured pH
was very closed to the actual pH. All pH distributions of standard solutions have a
narrow Gaussian distribution with reasonably low standard deviation. Therefore,
pH could be accurately mapped within the deviation range of ± 0.2 pH unit over pH
from 2.8 to 5.8.
68
Table S2.1 pH distribution of mapped image from standard pH solution
a pH of the standard buffer solutions used to establish the standard curve of intensity ratio vs. pH b mean pH and standard deviation were determined by fitting the pH distribution curve of standard pH solutions with Gaussian distribution function. Dye concentration in the standard solutions was 1.2 mg/ml.
2.6.2 Interpolation of standard curves from estimated protein concentrations
As shown in Figure S2.1, the fluorescence ratio increased with increasing the
BSA concentration at constant pH. For BSA concentration from 0 to 250 mg/ml, a
linear relationship of ratio vs. concentration could be assumed in the range of 0 to
25 mg/ml, 25 to 100 mg/ml, and 100 to 250 mg/ml. BSA concentration higher than
250 mg/ml is rare except after 1-‐day incubation, in that case, standard curves were
fitted from experimental data.
Equations for standard curves of known concentration from experiment:
BSA=0 mg/ml, y0=-‐0.0572x3+0.7352x2-‐2.7529x+3.4356
BSA=25 mg/ml, y1=-‐0.0731x3+0.911x2-‐3.2801x+3.91
BSA=100 mg/ml, y2=-‐0.0769x3+0.9682x2-‐3.4631x+4.1084
BSA=250 mg/ml, y3=-‐0.0935x3+1.1604x2-‐4.0344x+4.5951
Where x is the pH and y is the fluorescence ratio.
BSA Concentration
0 mg/ml 100 mg/ml
pH a 2.87 3.38 4.15 4.92 5.77 2.88 3.39 4.23 4.96 5.76 Mean pH b 2.92 3.36 4.13 4.91 5.60 2.91 3.31 4.20 4.90 5.61 SD b 0.10 0.04 0.04 0.07 0.17 0.04 0.03 0.01 0.07 0.15

69
If BSA concentration falls to the range of 25 to 100 mg/ml, the slope of
linearity between concentration and fluorescence ratio (k) is given by:
€
k =y2 − y1
100mg /ml − 25mg /ml
=(−0.0769x 3 + 0.9682x 2 − 3.4631x + 4.1084) − (−0.0731x 3 + 0.911x 2 − 3.2801x + 3.91)
75mg /ml
=−0.0038x 3 + 0.0572x 2 − 0.183x + 0.1984
75mg /ml
For a calculated concentration α mg/ml, the corresponding standard curve
can be predicted as:
€
y = y2 − k × (100mg /ml −αmg /ml)
For example, if α=75 mg/ml, then
€
y = (−0.0769x 3 + 0.9682x 2 − 3.4631x + 4.1084) − −0.0038x3 + 0.0572x 2 − 0.183x + 0.1984
75mg /ml×(100mg /ml − 75mg /ml)= −0.0756x 3 + 0.9491x 2 − 3.4021x + 4.0423
The predicted curve was well aligned to the experimental curve. (Figure S2.2).
Standard curves of concentrations fall within other ranges (0-‐25 mg/ml, 100-‐250
mg/ml) could be obtained similarly.

70
Figure S2.1 The BSA concentration dependency of fluorescence intensity ratio of Lysosensor yellow/blue® dextran at pH 2.8 (), 3.4 (), 4.2 (), 4.9 () and 5.7 (). The concentration of dye was 1.2 mg/ml.

71
Figure S2.2 The pH sensitivity curves of Lysosensor yellow/blue® dextran in presence of 75mg/ml BSA plotted from fitting experiment data (— solid line) and predicted equation (-‐-‐ dashed line).

72
Figure S2.3 The pH sensitivity of confocal pH measurement of Lysosensor yellow/blue® dextran at concentration of 0.8 mg/ml (), 1.2 mg/ml (), and 2.0 mg/ml () in presence of 100 mg/ml of BSA (A) and lysozyme (B). Lines represent best fits to a third order polynormial function of experimental data.

73
Figure S2.4 Fluorescence spectrum of Lysosensor yellow/blue® dextran in the absence (— solid line) and presence of 10 mg/ml BSA (-‐-‐dashed line) in PBST (pH=7.4). The concentration of dye was 1.0 mg/ml.

74
Figure S2.5 Comparison of µpH kinetics in microspheres estimated from protein concentration calculated from measured water uptake (), 120% of measured water uptake (), 80% of measured water uptake () at 1 day (A, D), 14 days (B, E) and 28 days (C, F). Microspheres were prepared from 40% (w/v) PLGA (A-C) and 40% (w/v) PLGA + MgCO3 (D-F).

75
References:
[1] Okada H. One-‐and three-‐month release injectable microspheres of the LH-‐RH superagonist leuprorelin acetate. Advanced drug delivery reviews. 1997;28:43-‐70. [2] Hutchinson F, Furr B. Biodegradable polymer systems for the sustained release of polypeptides. Journal of Controlled Release. 1990;13:279-‐94. [3] Putney SD, Burke PA. Improving protein therapeutics with sustained-‐release formulations. Nature biotechnology. 1998;16:153-‐7. [4] Cohen S, Yoshioka T, Lucarelli M, Hwang LH, Langer R. Controlled delivery systems for proteins based on poly (lactic/glycolic acid) microspheres. Pharmaceutical research. 1991;8:713-‐20. [5] Jiang W, Gupta RK, Deshpande MC, Schwendeman SP. Biodegradable poly (lactic-‐co-‐glycolic acid) microparticles for injectable delivery of vaccine antigens. Advanced drug delivery reviews. 2005;57:391-‐410. [6] Schwendeman SP, Costantino HR, Gupta RK, Langer R. protein, and vaccine delivery from implantable polymeric systems: progress and challenges. . In: Park K, editor. Controlled drug delivery: challenges and strategies Washington D.C.: The American Chemical Society; 1997. p. 229-‐67. [7] Schwendeman SP. Recent advances in the stabilization of proteins encapsulated in injectable PLGA delivery systems. Critical reviews in therapeutic drug carrier systems. 2002;19:73. [8] van de Weert M, Hennink WE, Jiskoot W. Protein instability in poly (lactic-‐co-‐glycolic acid) microparticles. Pharmaceutical research. 2000;17:1159-‐67. [9] Fu K, Klibanov A, Langer R. Protein stability in controlled-‐release systems. Nature Biotechnology. 2000;18:24-‐5. [10] Li S, Garreau H, Vert M. Structure-‐property relationships in the case of the degradation of massive poly (α-‐hydroxy acids) in aqueous media. Journal of Materials Science: Materials in Medicine. 1990;1:198-‐206. [11] Shenderova A, Burke TG, Schwendeman SP. The acidic microclimate in poly (lactide-‐co-‐glycolide) microspheres stabilizes camptothecins. Pharmaceutical research. 1999;16:241-‐8. [12] Zhu G, Mallery SR, Schwendeman SP. Stabilization of proteins encapsulated in injectable poly (lactide-‐co-‐glycolide). Nature biotechnology. 2000;18:52-‐7. [13] Zhu G, Schwendeman SP. Stabilization of proteins encapsulated in cylindrical poly (lactide-‐co-‐glycolide) implants: mechanism of stabilization by basic additives. Pharmaceutical research. 2000;17:351-‐7. [14] Jiang W, Schwendeman SP. Stabilization of tetanus toxoid encapsulated in PLGA microspheres. Molecular Pharmaceutics. 2008;5:808-‐17. [15] Kang J, Schwendeman SP. Comparison of the effects of Mg (OH)2 and sucrose on the stability of bovine serum albumin encapsulated in injectable poly (d, l-‐lactide-‐co-‐glycolide) implants. Biomaterials. 2002;23:239-‐45.

76
[16] Burke P. Determination of internal pH in PLGA microspheres using 31P NMR spectroscopy. Proc Inter Symp Controlled Release Bioactive Mater1996. p. 133-‐4. [17] Brunner A, Mäder K, Göpferich A. pH and Osmotic Pressure Inside Biodegradable Microspheres During Erosion1. Pharmaceutical research. 1999;16:847-‐53. [18] Shenderova A, Ding AG, Schwendeman SP. Potentiometric method for determination of microclimate pH in poly (lactic-‐co-‐glycolic acid) films. Macromolecules. 2004;37:10052-‐8. [19] Fu K, Pack DW, Klibanov AM, Langer R. Visual evidence of acidic environment within degrading poly (lactic-‐co-‐glycolic acid)(PLGA) microspheres. Pharmaceutical research. 2000;17:100-‐6. [20] Li L, Schwendeman SP. Mapping neutral microclimate pH in PLGA microspheres. Journal of controlled release. 2005;101:163-‐73. [21] Ding AG, Schwendeman SP. Acidic microclimate pH distribution in PLGA microspheres monitored by confocal laser scanning microscopy. Pharmaceutical research. 2008;25:2041-‐52. [22] Peters Jr T. All about albumin: biochemistry, genetics, and medical applications: Academic Press; 1995. [23] Ding AG, Shenderova A, Schwendeman SP. Prediction of microclimate pH in poly (lactic-‐co-‐glycolic acid) films. Journal of the American Chemical Society. 2006;128:5384-‐90. [24] Ding AG, Schwendeman SP. Determination of water-‐soluble acid distribution in poly (lactide-‐co-‐glycolide). Journal of pharmaceutical sciences. 2004;93:322-‐31. [25] Yang YY, Chung TS, Ping Ng N. Morphology, drug distribution, and in vitro release profiles of biodegradable polymeric microspheres containing protein fabricated by double-‐emulsion solvent extraction/evaporation method. Biomaterials. 2001;22:231-‐41. [26] Kang J, Schwendeman SP. Determination of diffusion coefficient of a small hydrophobic probe in poly (lactide-‐co-‐glycolide) microparticles by laser scanning confocal microscopy. Macromolecules. 2003;36:1324-‐30. [27] van de Weert M, van’t Hof R, van der Weerd J, Heeren R, Posthuma G, Hennink WE, et al. Lysozyme distribution and conformation in a biodegradable polymer matrix as determined by FTIR techniques. Journal of controlled release. 2000;68:31-‐40. [28] Kang J, Lambert O, Ausborn M, Schwendeman SP. Stability of proteins encapsulated in injectable and biodegradable poly (lactide-‐co-‐glycolide)-‐glucose millicylinders. International journal of pharmaceutics. 2008;357:235-‐43.

77
CHAPTER 3
Investigation of the Microclimate pH in Degrading Microspheres of
Hydrophilic Poly(D,L-lactide-co-hydroxymethyl glycolide) and
PLGA
3.1 Abstract
The microclimate pH (μpH) in biodegradable polymers, such as poly(D,L-‐
lactic-‐co-‐glycolic acid) (PLGA) 50/50, commonly falls to deleterious acidic levels
during biodegradation, resulting in instability of encapsulated acid-‐labile molecules.
The μpH distribution in microspheres of a more hydrophilic polyester, poly(D,L-‐
lactide-‐co-‐hydroxymethyl glycolide) (PLHMGA), was measured and compared to
that in PLGA 50/50 of similar molecular weight and degradation time scales. pH
mapping in the polymers was performed after incubation under physiological
conditions by using a previously validated ratiometric confocal laser scanning
microscopic (CLSM) method. Confocal μpH maps revealed that PLHMGA
microspheres, regardless of copolymer composition, developed a far less acidic μpH
during 4 weeks of incubation compared with microspheres from PLGA. A pH-‐
independent fluorescent probe marker of polymer matrix diffusion of μpH-‐

78
controlling water-‐soluble acid degradation products, bodipy, was observed by CLSM
to diffuse ~3-‐7 fold more rapidly in PLHMGA compared to PLGA microspheres,
consistent with much more rapid release of acids observed from the hydrophilic
polymer during bioerosion. Hence, PLHMGA microspheres are less susceptible to
acidification during degradation as compared to similar PLGA formulations, and
therefore, PLHMGA may be more suitable to deliver acid labile molecules such as
proteins.
KEY WORDS: microclimate pH; confocal laser scanning microscopy; hydrophilic
polyesters; microsphere; pH distribution; poly(lactic-‐co-‐glycolic acid)
3.2 Introduction
Poly(D,L-‐lactic-‐co-‐glycolic acid) (PLGA) is a biodegradable aliphatic polyester
that has been widely investigated for controlled delivery of peptides, proteins and
vaccine antigens [1-‐6]. PLGA degrades in aqueous medium via hydrolysis of ester
bounds connecting the monomer units in the polymer chain and the final
degradation products are lactic and glycolic acid [7]. A major drawback of PLGA
systems is the accumulation of acid degradation products inside degrading matrices,
which is associated with a drop in microclimate pH (μpH, i.e., the pH in the aqueous
pores of the polymer) [8-‐10] and unwanted instability of acid-‐labile PLGA-‐
encapsulated species [11, 12]. The use of poorly soluble bases such as magnesium

79
carbonate, magnesium hydroxide and zinc carbonate as well as blending PEG with
the PLGA has been investigated to minimize the drop of pH in protein-‐loaded PLGA
microspheres and to enhance protein stability and release [13-‐17]. Although co-‐
encapsulation of these additives has shown to improve protein stability and release
kinetics [18], the release of peptide/protein drugs from PLGA systems is still
commonly incomplete and/or difficult to control [19, 20].
Recently, polyesters with functional pendant hydroxyl groups have been
developed and showed attractive degradation and release properties for drug
delivery purposes [21-‐25]. Poly(D,L-‐lactide-‐co-‐hydroxymethyl glycolide) (PLHMGA)
in particular, showed tailorable degradation kinetics and release of proteins and
peptides from PLHMGA microspheres, which was governed by degradation of the
microspheres [22, 23, 25], and reduced aggregation of encapsulated lysozyme and
formation of less acylated peptide adducts compared to comparable PLGA
formulations [22, 25]. The introduction of hydroxyl groups in the backbone of the
PLHMGA copolymers makes the polymer more hydrophilic than PLGA and as a
consequence, PLHMGA microspheres have a higher water absorbing capacity than
their PLGA counterparts. This increase in hydrophilicity might facilitate the more
rapid release of the formed acid degrading products into the release medium, which
in turn could inhibit the drop of μpH and subsequently improve the stability of
encapsulated species. For example, increased µpH was observed inside PLGA/PEG
blend microspheres [10], which showed increased water uptake due to the
80
hydrophicility of PEG, and significantly improved stability of encapsulated
ovalbumin and BSA [17, 26].
In order to have a better insight into the μpH distribution of PLHMGA
microspheres, confocal laser scanning microscopy (CLSM), as a noninvasive tool
capable of providing detailed μpH mapping, was used to monitor μpH changes
during degradation of the microspheres. In the present study, the effects of PLHMGA
copolymer composition and polymer solution concentration used to prepare the
microspheres on μpH kinetics during polymer bioerosion were studied and
compared to that in PLGA 50/50 formulations. The underlying factors accounting
for the μpH differences were also explored.
3.3 Materials and Methods
3.3.1 Materials
Poly(D,L-‐lactide-‐co-‐hydroxymethyl glycolide)s with copolymer ratios of
65/35 and 75/25 were synthesized and characterized as described before [23, 24].
Poly(D,L-‐lactic-‐co-‐glycolic acid), end capped, 50/50 with an inherent viscosity (i.v.)
of 0.19 dl/g (Mw=19 kg/mol) was generously provided by Alkermes Inc.
(Cambridge, MA). Polyvinyl alcohol (PVA, MW 9-‐10 kDa, 80 % hydrolyzed) was from
Polysciences (Warrington, PA). The fluorescent probes, Lysosensor yellow/blue®
dextran (MW=10,000 kDa) and BODIPY®, FL (MW 292.1) was purchased from

81
Invitrogen (Eugene, OR). Unless otherwise stated, all chemicals were analytical
grade or higher and used as received.
3.3.2 Preparation of microspheres
Lysosensor yellow/blue® dextran as an acidic pH-‐sensitive fluorescent probe
was encapsulated in PLHMGA and PLGA microspheres by a double emulsion
evaporation technique, as described previously [22]. Briefly, 125 μl of dye solution
(12 mg/ml) was added to a polymer solution with 350 mg of copolymers/PLGA in
500 μl methylene chloride (35 % w/w). The mixture was homogenized with
Tempest IQ2 homogenizer (The VirTis Co., Gardiner, NY) at 20,000 rpm for 30 s to
form the w/o emulsion. Next, 500 μl of an aqueous PVA solution (1 % w/w) was
slowly added to the first emulsion and a w/o/w was formed by homogenizing the
mixture at 20,000 rpm for 30s. The prepared w/o/w was slowly transferred into 5
ml of an aqueous PVA solution (0.5 % w/w) and stirred at room temperature for 2 h
to extract and evaporate methylene chloride. The formed microspheres were sieved
for 20-‐45 μm size (USA standard test sieve, sieve No.325 and 635, Newark Wire
Cloth Co, Newark, NJ) and washed three times with 100 ml double distilled water
and thereafter freeze dried on a FreeZone 2.5 Liter Benchtop freeze dry system
(Labconco, Kansas City, MO). Microspheres of copolymer PLHMGA 75/25 from three
different polymer concentrations (25, 30 and 35 % w/w) were also prepared
followed the same procedure.

82
3.3.3 Microspheres morphology
The morphology of the microspheres was studied using a Hitachi S3200
scanning electron microscope (SEM, Hitachi Ltd., Tokyo, Japan). Approximately 1-‐2
mg of lyophilized microspheres was evenly sprinkled onto a brass stub with double-‐
adhesive conductive tape. Samples were sputter coated with gold under vacuum
using DESK II sputter coater (Denton Vacuum LLC, Moorestown, NJ). The images of
microspheres were taken at an excitation voltage of 15.0 kV.
3.3.4 Confocal laser scanning microscopy for microspheres imaging
A ratiometric method was employed as essentially described by Ding et al.
[10] to map microclimate pH distribution inside microspheres using Zeiss LSM 510-‐
META confocal laser scanning microscope (Carl Zeiss Microimaging, Inc.,
Thornwood, NY). This instrument was equipped with four laser systems and a Zeiss
Axiovert 100M inverted microscope. Lysosensor yellow/blue® dextran was excited
at 364 nm by an Enterprise UV laser and two filters (450 nm and 520 nm) were
used to build images. For assessing bodipy diffusion in the microspheres, bodipy
was excited at 488 nm by an Argon laser and LP 505 filter was used to construct
images, as described by Kang et al. [27]. Other instrumental parameters were set up
as stated elsewhere [10, 27]. All measurements were conducted using a C-‐
Apochromat 63X water immersion objectives lens with numerical aperture of 1.2.

83
3.3.5 Standard curve of fluorescent intensity ratio vs. pH
Buffers of pH from 2.8 to 5.8 were prepared using combined 0.1 M citric acid
solutions and 0.2 M Na2HPO4 solutions. Lysosensor yellow/blue® dextran was
dissolved in buffer solutions with concentration of 0.8, 1.2, and 2.0 mg/ml. The
standard dye solutions were scanned by CLSM. The acquired confocal images were
first processed by frame averaging, followed by neighborhood averaging, and
applying a median filter as described by Li et al. [28] using Image J software
(developed by National Institutes of Health and available on the internet at
http://rsbweb.nih.gov/ij/) to eliminate signal noise. The standard curve was
established by plotting the ratio of mean fluorescent intensities of the dye solutions
under two emission wavelengths, 450 nm and 520 nm, versus pH of that solution.
3.3.6 Microclimate pH distribution kinetics inside microspheres
Roughly 15 mg microspheres were suspended into 1 ml phosphate buffer
saline (7.74 mM Na2HPO4, 2.26 mM NaH2PO4, 137 mM NaCl and 3 mM KCl)
containing 0.02 % Tween 80 (pH 7.4) (PBST) and incubated in a Glas-‐Col® vial
rotator (Glas-‐Col LLC, Terre Haute, IN) at 40 rpm at 37 °C. At predetermined time
points, a small amount of microspheres was separated for confocal imaging study.
The release media was also removed for pH measurement using a Corning 430 pH
meter (Corning, NY), followed by replacing with fresh media. The ratio of

84
fluorescent intensities of each pixel having intensity above the threshold value
(indicating the fluorescence from release media) at two emission wavelengths (450
nm and 520 nm) was then calculated and related to a pH from the standard curve. In
the processed images, each pixel was converted to a color corresponding to pH. The
probability of specific pH value inside microspheres was obtained by dividing the
amount of pixels corresponding to a specific pH to the total pixels in the images.
Pixel ratios that exceeded the limit of standard curve range referred to a pH of either
above 5.8 or below 2.8. In such cases, the percentages were plotted as the
boundaries of the µpH distribution curves.
3.3.7 Quantification of water-soluble acids inside PLHMGAs and PLGA
Microspheres (80-‐90 mg) were incubated in PBST buffer under mild
agitation at 320 rpm by a KS 130 basic shaker (IKA® Works Inc., Wilmington, NC) at
37 °C for pre-‐determined times. After incubation, the microspheres were separated
from PBST by a brief centrifugation, followed by washing with double distilled
water three times. Then, the microspheres were freeze-‐dried.
Eighty mg of PLHMGA and PLGA copolymers or dried microspheres were
dissolved in 0.5 ml chloroform before adding 3 ml of double distilled water. After a
mild vortex mixing, the biphasic solution was left for 10 min and then was
centrifuged at 4°C at 4,000 rpm for 5 min. The upper water layer was then quickly

85
removed. The extraction was repeated for 4 times, and finally the water phases
were combined.
The water phase was then titrated with 0.1 M NaOH solution to determine
the amount of total water-‐soluble acids. The electromotive force (EMF) was
recorded as a function of the moles of titrant added using a pH meter. The quantity
of acid was determined by the total added titrant at the end point, which
corresponds to the inflection point of the first derivative of potentiometric titration
curve. All measurements were performed in triplicate (n=3).
3.3.8 Determination of bodipy diffusivity in PLHMGA and PLGA microspheres
About 1 mg of PLHMGA and PLGA microspheres were suspended in 1 ml of
PBST and incubated at 37°C under mild agitation for pre-‐determined times. After
incubation, the microspheres were separated from PBST by a brief centrifugation,
followed by adding 1 ml of bodipy in PBST (5 µg/ml), which was pre-‐incubated at
37°C. After incubating the mixture at 37°C for 3 hours, a small amount of
microspheres was separated for CLSM observation.
Monitoring bodipy uptake in PLHMGA and PLGA microspheres by CLSM and
image and data analysis were carried out following procedures reported by Kang et
al. [27]. Briefly, the acquired images were analyzed using Image J software to extract
intensity profiles along the diameter. The pixel intensity (I)-‐position (r) data pairs
were then normalized by the surface intensity (I0) and radius (a) of the

86
microsphere, respectively. Because of the linear relationship between fluorescence
intensity and probe concentration, the normalized intensity (I/I0)-‐position (r/a)
data pairs were then fit to the following solution to Fick’s second law of diffusion to
obtain the effective diffusion coefficient (D) of bodipy in the polymer matrix:
!
C
C0
=1
r /a(erfc
(2n +1) " r /a
2 Dt /a2
n= 0
#
$ " erfc(2n +1) + r /a
2 Dt /a2)
(1)
where t is the diffusion time. The fitting was done according to a least-‐squares
nonlinear regression using n=12 by DataFit software (Oakdale Engineering,
Oakdale, PA). All measurements were performed in eight replicates (n=8).
3.4 Results
3.4.1 Characteristics of PLHMGA copolymers
In Table 3.1, the characteristics of the protected poly(D,L-‐lactic acid-‐ran-‐
benzyloxymethyl glycolic acid) (PLBMGA) and deprotected PLHMGA are displayed.
The molecular weight and thermal behavior of the copolymers were measured and
the characteristics are comparable with those reported in previous studies [22, 23,
29].

87
Table 3.1 Characteristics of PLBMGA and PLHMGA copolymers
polymer feed ratio D,La/Mb
copolymer composition (NMR)
Mn (kg/mol)
Mw (kg/mol)
Tg (°C)
75/25 78/22 16 35 36 PLBMGA
65/35 70/30 24 51 41
75/25 80/20 13 30 49 PLHMGA
65/35 69/31 22 45 47 aD,L = D,L-‐lactide bM = BMMG (benzyloxymethyl methyl glycolide)
3.4.2 Preparation of microspheres loaded with an acidic pH sensitive probe
Microspheres were prepared from PLHMGA with different copolymer
compositions (65/35 and 75/25) and PLGA 50/50 using a w/o/w double emulsion-‐
solvent evaporation method. Additionally, for PLHMGA 75/25, solutions with
different polymer concentrations were employed to prepare microspheres. Since
the development of microclimate pH depends on the size of microspheres [10], the
microspheres used for confocal microscopy imaging were sieved to yield particles
with a similarly narrow size distribution of 20-‐45 µm. As can be seen from the
scanning electron micrographs (Figure 3.1), all microspheres displayed spherical
shape and a non-‐porous surface.
3.4.3 Microclimate pH distribution inside degrading PLHMGA and PLGA
microspheres
88
The microclimate pH distribution inside degrading PLHMGA and PLGA
microspheres during incubation under physiologically conditions for one-‐month
was monitored using a CLSM imaging technique. The encapsulated fluorescent
dextran-‐conjugated probe, Lysosensor yellow/blue® dextran, is sensitive to pH
change from 2.8 to 5.8, and this dextran conjugate dye partitions into aqueous pores
in polymer similar to encapsulated proteins [8, 10]. A standard curve of the dye
correlating its fluorescence intensity ratio at wavelength of 450 nm and 520 nm and
pH from 2.8 to 5.8 was established and fitted to a third order polynomial function
(r2=0.999) (Figure 3.2). This figure shows that the pH sensitivity of the dye is
concentration independent as previously reported [10], which ensures that the
standard curve is not affected even though the dye concentration changes during
incubation. Some important instrument parameters (e.g., detection gain, pinhole,
laser power) were adjusted so that within the concentration range from 0.8 mg/ml
to 2.0 mg/ml, the images of dye solutions gave fluorescence intensity from 10 to 255
(units of the instrument). In the microspheres images, any value below 10 was
regarded as background and the value exceeding 255 was considered saturated.
Intensities within the range of 10 to 255 indicated the existence of entrapped dye.
The blank regions in the processed images suggested either dye-‐free pores or a pure
polymer phase.
3.4.3.1 Effect of polymer composition on μpH distribution kinetics

89
μpH changes were compared in degrading microspheres prepared from
PLHMGA of different compositions (65/35 and 75/25) and PLGA 50/50 during
incubation in PBST at 37 °C for four weeks, as shown in processed confocal images
(Figure 3.3) and μpH distribution curves (Figure 3.4). Within four weeks incubation
of microspheres prepared from PLHMGA 65/35, more than 95 % of pixels in the
images gave a fluorescence ratio corresponding to pH out of detection range
(pH>5.8), indicating these microspheres did not develop any detectable acidity
during that time (Figure 3.4A). For PLHMGA 75/25 microspheres, acidity in most
aqueous pores with an average pH of 4.8 was observed after one-‐day incubation,
indicative of some acidic impurities in the polymer, although the acidity decreased
rapidly with increasing incubation time and almost disappeared by 14 days
incubation (Figure 3.4B). By contrast, PLGA microspheres developed μpH as low as
4 during 28 days of study and maintained at an acidic μpH as the degradation of the
microspheres continued. The μpH was most acidic after one day of incubation, with
around 55 % of pixel domains giving a pH below 5.8. The µpH rose until 2 weeks of
incubation before decreasing again. Also note that microspheres made from
PLHMGAs were observed to be larger than PLGA ones especially at the later stage of
incubation, indicative of the higher water-‐absorbing capacity of PLHMGAs.
3.4.3.2 Effect of polymer concentration used for preparation of microspheres
on μpH distribution kinetics

90
To investigate the effect of polymer concentration used during microsphere
preparation on μpH distribution kinetics, microspheres were prepared using
methylene chloride solutions of PLHMGA 75/25 of three different polymer
concentrations (25, 30 and 35 % w/w). As shown in the processed confocal images
(Figure 3.5) and μpH distribution curves (Figure 3.6), increasing the polymer
concentration decreased the initial μpH after one day of incubation. As the
incubation continued, the acidity inside of the microspheres decreased and
disappeared completely after 2 weeks. The μpH is typically found to be more acidic
in the center of microspheres than the peripheral regions, due to the relatively
shorter diffusion length of formed acid degradation products in polymer regions
near the microsphere surface.
3.4.4 Quantification of water-soluble acids in PLHMGAs and PLGA
The water-‐soluble acids were extracted from PLHMGA and PLGA raw
polymers as well as microspheres and quantified, as the total concentration of these
species in the polymer pores is predictive of μpH [30]. The water-‐soluble acids
existing in the raw polymer of PLHMGAs and PLGA are attributed to the acid
impurities from synthesis and storage, whose quantities were comparable among
three polymers (Figure 3.7A). The amount of acids in microspheres, on the other
hand, were much less than in the raw polymers, consistent with anticipated
diffusion out of acids into the outer water phase during the in-‐liquid hardening of

91
microspheres preparation process. However, the quantity of acids extracted from
PLHMGA microspheres after incubation in PBST at 37°C was too negligible to be
accurately determined, in contrast to PLGA showing the presence of water-‐soluble
acids throughout the incubation period (Figure 3.7A). Since this study was
conducted using a different batch of polymer from µpH mapping, it did not show
detectable acids in PLHMGA 75/25 microspheres during initial incubation, as
expected from the mild acidity recorded by CLSM after 1 day of incubation in Fig.
4B. Nevertheless, it is consistent with the µpH measured using CLSM, which
demonstrated non-‐detectable acidity (pH>5.8) in PLHMGA 65/35 microspheres but
an acidic environment in PLGA counterparts during one-‐month incubation.
3.4.5 pH kinetics in the release media
The pH in the erosion media of microspheres made from different polymers
was monitored at the same time point of each µpH mapping, with the buffer being
changed weekly. Generally, the pH maintained relatively constant for the release
medium of PLGA microspheres. By comparison, the pH declined with the
progression of incubation for PLHMGA polymers, with pH of the release medium
containing PLHMGA 65/35 lower than that of PLHMGA 75/25 (Figure 3.7B).
3.4.6 Determination of diffusion coefficient of bodipy in PLHMGA and PLGA
microspheres

92
In order to test the hypothesis that acid diffusion out of the polymer was
responsible for higher µpH in PLHMGA polymer compared to PLGA, the diffusivity of
a small hydrophobic fluorescent probe, bodipy inside PLHMGA and PLGA polymer
microspheres was determined using CLSM as previously reported [27]. The probe is
similar in molecular weight and polymer/water partition coefficient to the trimer of
lactic acid [27, 30]. As a result, its diffusion behavior is expected to be a relative
indicator of the diffusion of the acid degradation products. The confocal
micrographs of bodipy uptake in different polymer microspheres are displayed in
Figure 3.8. The dark regions signified the aqueous pores in the microspheres, as the
probe concentration in the polymer phase is much higher [27]. The bodipy
concentration gradient inside individual microspheres was accurately fit by the
solution to Fick’s second law of diffusion. (R2 invariably >0.90, see Supporting
Information Figure S3.1). The determined diffusion coefficients (D) of bodipy in
degraded microspheres are summarized in Table 3.2. The diffusivity of bodipy for
each polymer maintained relatively constant during the early state of microsphere
incubation (≤3 days). After one week of degradation, the PLHMGA microspheres
became porous and the consequent heterogeneous probe distribution caused a poor
fit of the confocal images to the solution of the diffusion equation. The diffusion
coefficient of bodipy was highest in PLHMGA microspheres made from PLHMGA
65/35, followed by PLHMGA 75/25 microspheres, and lowest in PLGA
microspheres.

93
Table 3.2 Diffusion coefficient of bodipy in degraded microspheres after 3 hours incubation in bodipy solution.
Pre-‐incubation time (day)
PLHMGA65/35 D (×10-‐12 cm2/s)
PLHMGA75/25 D (×10-‐12 cm2/s)
PLGA50/50 D (×10-‐12 cm2/s)
0 2.6 ± 0.6a 1.6 ± 0.6 0.40 ± 0.05
1 2.8 ± 0.4 1.6 ± 0.3 0.5 ± 0.1
3 2.6 ± 0.8 1.6 ± 0.4 0.46 ± 0.12
7 -‐-‐b -‐-‐b 0.5 ± 0.10
a: values represent mean ± SD, n=8. b: poor fit of D (R2<0.90) due to the increased aqueous pores and a consequent heterogeneous probe distribution.
3.5 Discussion
The acidic microenvironment is often regarded as one of most deleterious
factors responsible protein instability inside PLGA delivery systems, particularly
rapidly degrading PLGA 50/50. The µpH depends on the concentration of water-‐
soluble acids in the aqueous cavities of polymer matrix. According to the
equilibrium model for prediction of µpH developed by Ding et al. [30], a number of
factors may contribute to the development of µpH, including: the amount of acidic
impurities, the production rate of water-‐soluble acids, the liberation rate of water-‐
soluble acids out of polymer, the partition coefficient of acids between polymer and
aqueous phases, and the acids’ dissociation constant (pKa).
In the present study, we observed that PLHMGA microspheres developed a
less acidic microclimate than that of PLGA 50/50 during one-‐month incubation

94
under physiological conditions as monitored by CLSM. Since the pKa of monomer
acids of PLHMGA and PLGA are very close, (3.86, 3.82 and 3.53 for lactic acid,
glycolic acid and hydroxymethyl glycolic acid, respectively), the pKa contribution to
the µpH differences is negligible. As compared to PLGA, PLHMGAs are more
hydrophilic due to the pendant hydroxyl groups on polymer backbone. Because of
this more hydrophilic characteristic, monomer acids likely partition more favorably
in the water phase of PLHMGA as compared to PLGA. Moreover, since the
degradation times of this hydrophilic polyester were shorter than those of PLGA
[29], the production of water-‐soluble acids in PLHMGA is expected to be faster.
Therefore, we hypothesized that the μpH-‐determining water-‐soluble acid
degradation products should be released faster from the more hydrated PLHMGA
microspheres in order to counteract the above-‐mentioned unfavorable factors
causing higher acidity in the polymer pores. One important piece of evidence was
the lower pH observed in the release media of PLHMGA microspheres (Figure 3.7B).
Since those acids were quickly released, they did not accumulate in the polymer,
leading to an overall less acidic microenvironment in PLHMGAs than in PLGA.
To test our hypothesis, we examined and compared the diffusivity of a small
hydrophobic fluorescent probe, bodipy inside PLHMGA and PLGA polymer matrix at
the early period of polymer incubation. Bodipy is a good candidate to investigate the
transport behavior of small molecules, because i) it is pH-‐insensitive over the pH

95
range of 2 to 10; ii) its transport through PLGA is typically limited by transport
through the polymer phase; and iii) it displayed a linearity of emission intensity-‐
concentration relationship under our experimental conditions [27]. The effective
diffusion coefficient (D) of bodipy in the polymer matrix was determined after
incubating degraded microspheres in bodipy solution for 3 hours and then fitting
the concentration gradients inside individual microspheres to the solution of Fick’s
second law of diffusion. This method was confirmed by the fact that i) the bodipy
uptake time did not change the value of D (see Supporting Information Table S1),
which is consistent with our previous data [27] and ii) the excellent fit of
experimental data to equation (1). Since the liberation of water-‐soluble acids was
controlled mainly by polymer diffusion at initial stage of polymer erosion when the
pore connectivity in the polymer matrix was still low [27], the higher mobility of
bodipy in PLHMGAs should indicate a similar trend in the transport behavior of
water-‐soluble acids (Table 3.2).
The high permeability of PLHMGAs to water-‐soluble acids relative to PLGA
could be explained as follows. First, due to the introduction of pendant hydroxyl
group on PLHMGA’s backbone, an elevated amount of water is expected to associate
with the polymer phase upon microsphere incubation, which could act as a strong
plasticizer [31], leading to the relaxation of polymer chains, thereby increasing the
diffusivity of degraded acids through polymer phase. Moreover, the more porous

96
internal structure in PLHMGA microspheres appearing with the progression of
incubation, suggested by more isolated dark spots in Figure 3.8, caused a higher
effective diffusivity of acidic degradation products through the polymer matrix, as
the diffusion across the aqueous pores is several orders of magnitude higher than
diffusion in the polymer phase.
Increasing the ratio of hydroxymethyl glycolic acid from 25 % to 35 %
increases the hydrophilicity of PLHMGA. Despite the hydrolysis rate of the polymer
is raised [23], the diffusion of acid degradation products out of the polymer was
further facilitated, causing an even more neutral μpH inside PLHMGA 65/35
microspheres than in PLHMGA 75/25. This was supported by the higher diffusion
coefficient of bodipy measured in PLHMGA 65/35 microspheres than in that of
PLHMGA 75/25 (Table 3.2) and the more acidic pH in the corresponding release
media (Figure 3.7B).
The mild acidity in PLHMGA 75/25 microspheres recorded after one-‐day
incubation described in Figure 3.4 and Figure 3.6 was likely due to the acid
impurities existing in the polymer following polymer synthesis, purification and
storage. However, as the incubation proceeds, those acids were gradually released,
giving rise to a μpH increase and a neutral microenvironment after 2 weeks. Using
polymer from a different batch, acidity was not observed during the entire course of
incubation, (see Support Information Figure S3.2), suggesting the role of acid

97
impurities playing in initial low µpH. Increasing the polymer concentration in
methylene chloride when fabricating microspheres decreased the initial μpH after
one-‐day incubation. This can be rationalized by the fact that microspheres made
from solutions with higher polymer concentration possessed more acidic impurities.
Additionally, such microspheres usually have denser structures [32], which impede
the liberation of these water-‐soluble acids at initial incubation. However, because of
the higher permeability of PLHMGA copolymer, the effect of polymer concentration
had no significant influence on µpH kinetics as the incubation continued. Therefore,
the µpH inside of the microspheres all increased to neutral range (above 5.8)
consistent with the release of acid impurities as well as degradation products into
the incubation medium.
3.6 Conclusion
The microclimate pH (μpH) inside degrading microspheres prepared from a
novel hydroxylated aliphatic polyester; poly(lactic-‐co-‐hydroxymethyl glycolic acid)
(PLHMGA) was quantitatively mapped by confocal laser scanning microscopy
during incubation under physiological conditions. Consistent with previous data of
improved stability of PLHMGA encapsulated proteins/peptides, we observed a
reduced μpH in PLHMGA microspheres made from copolymer 65/35 and 75/25
during one-‐month incubation relative to comparable PLGA formulations. The μpH
inside PLHMGA microspheres made from copolymer 75/25 during the first two

98
weeks incubation decreased with increasing the polymer concentration. By
comparing the pH of release media of PLHMGA and PLGA microspheres and the
effective diffusivity of a small fluorescent probe, the data strongly suggests the
faster liberation of water-‐soluble acids in PLHMGA was responsible for its more
neutral microenvironment. This study shows that PLHMGA microspheres are
potential carriers for controlled delivery of acid-‐labile biomacromolecules.

99
Figure 3.1 Scanning electron micrographs of microspheres prepared from PLHMGA 75/25 with 25 % w/w (A), 30 % w/w (B), 35 % w/w (C) polymer solution concentration, and PLHMGA 65/35 (D) and PLGA 50/50 (E) prepared from a 35 % w/w solution concentration.

100
Figure 3.2 The pH sensitivity of confocal measurement of Lysosensor yellow/blue® dextran at concentration of 2 mg/ml (), 1.2 mg/ml () and 0.8 mg/ml (). The third-‐order polynomial curve fitting the data was Y = -‐0.0582 x3+0.7221 x2-‐2.5676 x+3.0213, where Y = I450nm/I520nm and x = pH, r2=0.999.

101
Figure 3.3 Processed confocal images of (A) PLHMGA 65/35, (B) PLHMGA 75/25 and (C) PLGA 50/50 microspheres during incubation in PBST at 37 °C for 4 weeks. Images were taken at 1 (A1-‐C1), 7 (A2-‐C2), 14 (A3-‐C3), 21 (A4-‐C4) and 28 (A5-‐C5) days.

102
Figure 3.4 The μpH distribution kinetics of microsphere formulations during incubation at 37ºC in PBST for 1 day (), 7 days (), 14 days (), 21 days () and 28 days (). Microspheres were prepared from (A) PLHMGA 65/35, (B) PLHMGA 75/25 and (C) PLGA 50/50, and sieved to 20-‐45μm size for the confocal pH mapping study.

103
Figure 3.5 Processed confocal images of PLHMGA 75/25 microspheres made from (A) 25% w/w (B) 30% w/w (C) 35% w/w of polymer concentration during incubation in PBST at 37 °C for 4 weeks. Images were taken at 1 (A1-‐C1), 7 (A2-‐C2), 14 (A3-‐C3), 21 (A4-‐C4), 28 (A5-‐C5) days.

104
Figure 3.6 The μpH distribution kinetics of microsphere formulations during incubation at 37ºC in PBST for 1 day (), 7 days (), 14 days (), 21 days (), and 28 days (). Microspheres were prepared from PLHMGA 75/25 of (A) 25 % w/w (B) 30 % w/w and (C) 35 % w/w of polymer concentration, and sieved to 20-‐45μm size for the confocal pH mapping study.

105
Figure 3.7 Comparison of PLHMGA and PLGA kinetics of total extracted water-‐soluble acid by titration (A) and pH in the erosion medium (B) recorded for PLHMGA 65/35 (), PLHMGA 75/25 (■) and PLGA 50/50 (▲) microspheres during incubation in PBST at 37 ºC for 4 weeks. The buffer was changed weekly for both experiments and the pH was measured before each buffer change. Symbols represent mean ± SD (n=3). * Acid content in PLHMGAs was below the limit of detection (<0.002 µmol/mg) (Figure 3.7A) throughout the incubation period.

106
Figure 3.8 Representative CLSM micrographs of the 3-‐h developed fluorescent intensity gradients of bodipy in (A) PLHMGA 6535 (B) PLHMGA 7525 and (C) PLGA5050 microspheres, which had undergone 0 (A1-‐C1), 1 (A2-‐C2), 3 (A3-‐C3) and 7 (A4-‐C4) days of degradation under physiological conditions. The scale bar represents 20 µm.

107
3.7 Supporting Information Table S3.1 Diffusion coefficient of bodipy in PLGA 50/50 microspheres a after incubating with bodipy solution in PBST at 37°C for various times.
a: microspheres were not pre-‐incubated. b: values represent mean ± SD, n=8.
Time of bodipy uptake (h) 3 7 50 D (×10-‐13 cm2/s) 3.9±0.6 b 3.6±0.6 3.3±0.3

108
Figure S3.1 Examples of measured and fitted probe concentration profiles inside (A) PLHMGA 6535 (R2=0.97), (B) PLHMGA 7525 (R2=0.99) and (C) PLGA 5050 microspheres (R2=0.98) after 3 hour probe uptake. Microspheres were pre-‐incubated in PBST at 37°C for 3 days.

109
Figure S3.2 μpH distribution kinetics of PLHMGA 75/25 microspheres during incubation at 37ºC in PBST for 1 day (), 7 days (), 14 days (), 21 days () and 28 days ().

110
Reference:
[1] Hiroaki O, Masaki Y, Toshiro H, Yayoi I, Shigeru K, Yasuaki O, et al. Drug delivery using biodegradable microspheres. Journal of controlled release. 1994;28:121-‐9. [2] Mehta RC, Jeyanthi R, Calls S, Thanoo BC, Burton KW, DeLuca PP. Biodegradable microspheres as depot system for patenteral delivery of peptide drugs. Journal of controlled release. 1994;29:375-‐84. [3] Johnson OFL, Cleland JL, Lee HJ, Charnis M, Duenas E, Jaworowicz W, et al. A month–long effect from a single injection of microencapsulated human growth hormone. Nature medicine. 1996;2:795-‐9. [4] Putney SD, Burke PA. Improving protein therapeutics with sustained-‐release formulations. Nature biotechnology. 1998;16:153-‐7. [5] Jiang W, Gupta RK, Deshpande MC, Schwendeman SP. Biodegradable poly (lactic-‐co-‐glycolic acid) microparticles for injectable delivery of vaccine antigens. Advanced drug delivery reviews. 2005;57:391-‐410. [6] Slütter B, Bal S, Keijzer C, Mallants R, Hagenaars N, Que I, et al. Nasal vaccination with N-‐trimethyl chitosan and PLGA based nanoparticles: nanoparticle characteristics determine quality and strength of the antibody response in mice against the encapsulated antigen. Vaccine. 2010;28:6282-‐91. [7] Vert M, Schwach G, Engel R, Coudane J. Something new in the field of PLA/GA bioresorbable polymers? Journal of controlled release. 1998;53:85-‐92. [8] Fu K, Pack DW, Klibanov AM, Langer R. Visual evidence of acidic environment within degrading poly (lactic-‐co-‐glycolic acid)(PLGA) microspheres. Pharmaceutical research. 2000;17:100-‐6. [9] Shenderova A, Burke TG, Schwendeman SP. The acidic microclimate in poly (lactide-‐co-‐glycolide) microspheres stabilizes camptothecins. Pharmaceutical research. 1999;16:241-‐8. [10] Ding AG, Schwendeman SP. Acidic microclimate pH distribution in PLGA microspheres monitored by confocal laser scanning microscopy. Pharmaceutical research. 2008;25:2041-‐52. [11] Schwendeman SP. Recent advances in the stabilization of proteins encapsulated in injectable PLGA delivery systems. Critical reviews in therapeutic drug carrier systems. 2002;19:73. [12] van de Weert M, Hennink WE, Jiskoot W. Protein instability in poly (lactic-‐co-‐glycolic acid) microparticles. Pharmaceutical research. 2000;17:1159-‐67. [13] Zhu G, Schwendeman SP. Stabilization of proteins encapsulated in cylindrical poly (lactide-‐co-‐glycolide) implants: mechanism of stabilization by basic additives. Pharmaceutical research. 2000;17:351-‐7.

111
[14] Kang J, Schwendeman SP. Comparison of the effects of Mg (OH)2 and sucrose on the stability of bovine serum albumin encapsulated in injectable poly (d, l-‐lactide-‐co-‐glycolide) implants. Biomaterials. 2002;23:239-‐45. [15] Zhu G, Mallery SR, Schwendeman SP. Stabilization of proteins encapsulated in injectable poly (lactide-‐co-‐glycolide). Nature biotechnology. 2000;18:52-‐7. [16] Jiang W, Schwendeman SP. Stabilization of tetanus toxoid encapsulated in PLGA microspheres. Molecular Pharmaceutics. 2008;5:808-‐17. [17] Jiang W, Schwendeman SP. Stabilization and controlled release of bovine serum albumin encapsulated in poly (D, L-‐lactide) and poly (ethylene glycol) microsphere blends. Pharmaceutical research. 2001;18:878-‐85. [18] Kang J, Lambert O, Ausborn M, Schwendeman SP. Stability of proteins encapsulated in injectable and biodegradable poly (lactide-‐co-‐glycolide)-‐glucose millicylinders. International journal of pharmaceutics. 2008;357:235-‐43. [19] Jiang G, Woo BH, Kang F, Singh J, DeLuca PP. Assessment of protein release kinetics, stability and protein polymer interaction of lysozyme encapsulated poly (D, L-‐lactide-‐co-‐glycolide) microspheres. Journal of controlled release. 2002;79:137-‐45. [20] Kim HK, Park TG. Microencapsulation of dissociable human growth hormone aggregates within poly (d, l-‐lactic-‐co-‐glycolic acid) microparticles for sustained release. International journal of pharmaceutics. 2001;229:107-‐16. [21] Noga DE, Petrie TA, Kumar A, Weck M, García AsJ, Collard DM. Synthesis and modification of functional poly (lactide) copolymers: Toward biofunctional materials. Biomacromolecules. 2008;9:2056-‐62. [22] Ghassemi AH, Van Steenbergen MJ, Talsma H, van Nostrum CF, Jiskoot W, Crommelin DJA, et al. Preparation and characterization of protein loaded microspheres based on a hydroxylated aliphatic polyester, poly (lactic-‐co-‐hydroxymethyl glycolic acid). Journal of Controlled Release. 2009;138:57-‐63. [23] Ghassemi AH, van Steenbergen MJ, Talsma H, van Nostrum CF, Crommelin DJA, Hennink WE. Hydrophilic polyester microspheres: effect of molecular weight and copolymer composition on release of BSA. Pharmaceutical research. 2010;27:2008-‐17. [24] Leemhuis M, Van Nostrum CF, Kruijtzer JAW, Zhong ZY, Ten Breteler MR, Dijkstra PJ, et al. Functionalized poly (α-‐hydroxy acid) s via ring-‐opening polymerization: Toward hydrophilic polyesters with pendant hydroxyl groups. Macromolecules. 2006;39:3500-‐8. [25] Ghassemi AH, van Steenbergen MJ, Barendregt A, Talsma H, Kok RJ, van Nostrum CF, et al. Controlled Release of Octreotide and Assessment of Peptide Acylation from Poly (D, L-‐lactide-‐co-‐hydroxymethyl glycolide) Compared to PLGA Microspheres. Pharmaceutical research. 2012;29:110-‐20. [26] Lavelle E, Yeh MK, Coombes A, Davis S. The stability and immunogenicity of a protein antigen encapsulated in biodegradable microparticles based on blends of lactide polymers and polyethylene glycol. Vaccine. 1999;17:512-‐29.

112
[27] Kang J, Schwendeman SP. Determination of diffusion coefficient of a small hydrophobic probe in poly (lactide-‐co-‐glycolide) microparticles by laser scanning confocal microscopy. Macromolecules. 2003;36:1324-‐30. [28] Li L, Schwendeman SP. Mapping neutral microclimate pH in PLGA microspheres. Journal of controlled release. 2005;101:163-‐73. [29] Leemhuis M, Kruijtzer JAW, van Nostrum CF, Hennink WE. In vitro hydrolytic degradation of hydroxyl-‐functionalized poly (α-‐hydroxy acid) s. Biomacromolecules. 2007;8:2943-‐9. [30] Ding AG, Shenderova A, Schwendeman SP. Prediction of microclimate pH in poly (lactic-‐co-‐glycolic acid) films. Journal of the American Chemical Society. 2006;128:5384-‐90. [31] Blasi P, D'Souza SS, Selmin F, DeLuca PP. Plasticizing effect of water on poly (lactide-‐co-‐glycolide). Journal of controlled release. 2005;108:1-‐9. [32] Yang YY, Chung TS, Ping Ng N. Morphology, drug distribution, and in vitro release profiles of biodegradable polymeric microspheres containing protein fabricated by double-‐emulsion solvent extraction/evaporation method. Biomaterials. 2001;22:231-‐41.

113
CHAPTER 4
Simulation of Microclimate pH Distribution and Kinetics inside
Degrading PLGA Microspheres
4.1 Abstract
The implications of an acidic microenvironment inside poly(D,L-‐lactic-‐co-‐
glycolic acid) PLGA delivery systems on the stability of encapsulated species has
gained increasing recognition in recent years. The aim of this chapter is to
quantitatively simulate the microclimate pH (μpH) distribution and kinetics inside
degrading PLGA microspheres using theoretical tools. A mathematical model based
on the production, liberation and partition of the μpH-‐determining water-‐soluble
acids in spherical geometry was developed. To evaluate the model, fundamental
parameters including the size of microspheres, the initial concentration of water-‐
soluble acids in polymer matrix, the production rate constant, and the diffusion
coefficient of the water-‐soluble acids in PLGA microspheres were determined from
experiments. This model successfully predicted the μpH development kinetics while
showing a small deviation (within 0.5-‐0.8 pH units) in µpH distribution from

114
confocal microscopic imaging results, providing us a valuable tool for studying and
controlling the μpH in PLGA microsphere formulations.
KEY WORDS microclimate pH distribution; poly(lactic-‐co-‐glycolic acid);
microspheres; water-‐soluble acids
4.2 Introduction
Over the past few decades, poly (lactic-‐co-‐glycolic acid) (PLGA) is one of the
most investigated biodegradable polymers for use in pharmaceutical products and
medical devices approved by U.S. Food and Drug Administration [1-‐6]. Delivery
systems (e.g. microspheres, nanoparticles, implant, coated-‐stent, and others)
formulated from this polymer can provide slow and continuous release of bioactive
substances over duration of weeks to months during simultaneous biodegradation
and erosion of the polymer. However, a major issue associated with this polymer is
that an acidic microclimate is commonly formed in the degrading PLGA matrix,
which poses a deleterious environment for the stability of encapsulated pH-‐
sensitive biomacromolecules (e.g. peptides and proteins) and drugs [7-‐11]
The acidic microenvironment has been shown to be a consequence of the
accumulation of water-‐soluble acids in polymer matrix [12], which are present as
impurities (e.g., from residual lactide) and during biodegradation. Briefly, upon
immersing the PLGA carriers in the physiological buffer, water penetrates into the

115
polymer matrix rapidly and fills up the pores that are generated during the
processing and/or during swelling of the polymer matrix. During the bioerosion
period, the microstructure of the polymer can change in a variety of ways with pores
often opening and growing in size (e.g., via osmotic forces) or closing and coalescing
(e.g., via polymer healing) during the degradation of polymer. Two separate phases
are assumed to coexist in the polymer matrix with end-‐capped PLGAs, which are the
polymer phase and aqueous phase. The microclimate pH (μpH) is defined as the pH
in the aqueous phase where biomacromolecules reside. In the polymer phase, the
degradation of polymer yields acid monomers and oligomers that are either water-‐
soluble or water-‐insoluble depending on the chain length of the acid. The water-‐
soluble acids will: i) be released out of the polymer matrix by mass transfer, and ii)
partition in the aqueous pores, where dissociation occurs producing protons that
lower the μpH. Besides the PLGA degradation products, the acidic impurities in the
polymer remaining from polymer synthesis, processing and storage can also
contribute to the development of acidic μpH. Based on such physical-‐chemical
processes, an equilibrium mathematical model has been developed by our group
previously and tested to be able to accurately predict the microclimate pH in thin
PLGA films based on measured content water-‐soluble acid [12].
The purpose of this study is to build on the previous mathematical model in
order to quantitatively predict the μpH distribution and kinetics in small spherical
geometry of injectable PLGA (i.e., microspheres) by considering additionally the

116
kinetics of water-‐soluble acid production and mass transfer via diffusion through
the polymer matrix. The ultimate goal would be to further our understanding of μpH
development and facilitate the formulation design of optimal PLGA systems with
controlled μpH for sustained-‐delivery of stabilized acid-‐labile therapeutics.
4.3 Theoretical Section
4.3.1 Basic assumptions
The basic assumptions follow our previous treatment [12], as follows: 1.
Rapid equilibrium exists between the polymer and aqueous pore solution allowing
the maintenance of two separate phases. 2. The penetration of external buffer ions
into polymer matrix is minimal, preventing them from interfering with the pore
acid-‐base equilibrium. 3. Negligible water is associated with the polymer phase so
that all water-‐uptake by polymer matrix is localized in aqueous pores. 4. The ionic
strength in aqueous pores is relatively low. However, here we make the additional
assumptions to accommodate acid production and release from polymer
microspheres as follows: 1. After the initial burst release, the water-‐soluble acids
are released from the polymer matrix primarily by diffusion through the polymer
matrix, which is limited predominantly by diffusion through the polymer phase. In
addition, this diffusivity is assumed to be a constant value. For example, the dye
bodipy, which is similar in molecular size (292 Da vs. 234 Da) and polymer/water

117
partition coefficient (P of 20 vs. 30) to a trimer of lactic acid, had a relatively
constant effective diffusion coefficient of in end-‐capped PLGA 50/50 microspheres
over 28 days [12, 13]. 2. We assume that the production rate of each acid follows
pseudo-‐first order kinetics owing to the general acid auto-‐catalysis [14, 15].
4.3.2 Quantitative treatment
Considering the factors of acid liberation, production and partitioning to
aqueous pores contributing to the μpH development, the spatial distribution of the
ith of water-‐soluble acids in the polymer matrix as a function of time can be written
as the following partial differential equation:
€
∂CHAiP
∂t=Di
r2∂∂r(r2
∂CHAiP
∂r) + kiCHAi
P + rHAi (1)
where
€
CHAiP is the concentration of the ith water-‐soluble acid in the polymer phase, t
is the degrading time of microspheres,
€
Di is the diffusion coefficient of the ith water-‐
soluble acid, r is the radial position of water-‐soluble acid to the center of
microsphere, and
€
ki is an assumed pseudo-‐first order production rate constant of
the ith water-‐soluble acid in the polymer phase,
€
rHAi accounts for the loss of ith
water-‐soluble acid from the polymer phase due to the partitioning of each water-‐
soluble acid into the aqueous phase.

118
To obtain the mathematical expression for
€
rHAi , the relationship between the
concentration of ith water-‐soluble acid in the polymer phase and aqueous pores
phase is considered as follows:
€
nHAi = CHAiP VP +CHAi
w Vw +CAi−
w Vw (2)
where
€
nHAi is the total mole of the ith water-‐soluble acid in the polymer matrix at
any time,
€
CHAiw is the concentration of ith water-‐soluble acid in the aqueous pores,
€
CAi−
w is the concentration of the conjugate base of ith water-‐soluble acid,
€
VP is the
volume of polymer phase, and
€
Vw is the volume of aqueous pores phase.
At steady state,
€
∂nHAi∂t
= 0 , therefore making derivative of eq 2 gives
€
∂CHAiP
∂tVP +
∂CHAiw
∂tVw +
∂CAi−
w
∂tVw = 0 (3)
Due to the negligible water uptake by the polymer phase [16], the volume of
polymer and aqueous phase can be related to the mass of dry microspheres (
€
Mp )
and hydrated microspheres (
€
(φw +1)MP ):
€
VP =Mp
ρP (4)
€
Vw =MPφwρw
(5)
where
€
φw is water uptake (i.e. ratio of water to dry microsphere masses), and
€
ρP
and
€
ρw are the densities of the polymer phase and pore water, respectively.
We note that the polymer/water partition coefficient of the ith water-‐soluble acid
(
€
Pi) is defined as follows:

119
€
Pi ≡CHAi
P
CHAiw (6)
Therefore, the concentration of the ith water-‐soluble acid in the aqueous pores
(
€
CHAiw ) is estimated by:
€
CHAiw =
CHAiP
Pi (7)
Considering the dissociation constant of ith water-‐soluble acid
€
Kai gives
€
CAi−
w =CHAi
w Kai
CH +
(8)
Inserting eq 4,5,7,8 into eq 3 gives
€
∂CHAiP
∂t= −
∂CAi−
w
∂t( ρwρPφw
+1Pi) (9)
Inserting eq 7 to 8 gives
€
CAi−
w =CHAi
P Kai
PiCH +
(10)
Making derivative of eq 10 gives
€
∂CAi−
w
∂t=Kai
Pi
∂(CHAiP C
H + )∂t
(11)
Inserting eq 11 to eq 9 gives
€
∂CHAiP
∂t, which corresponds to the term
€
rHAi
€
∂CHAiP
∂t= −
Kai
( ρwPiρPφw
+1)
∂(CHAiP /CH + )∂t
(12)
Inserting eq 12 to eq 1 as follows:

120
€
∂CHAiP
∂t=Di
r2∂∂r(r2
∂CHAiP
∂r) + kiCHAi
P −Kai
( ρwPiρPφw
+1)
∂(CHAiP C
H + )∂t (13)
Considering the charge balance in aqueous pores as follows:
€
CH + = C
Ai−
w∑ (14)
Inserting eq 7, 8 into eq 14 gives
€
CH + =
Kai
Pi∑ CHAi
P
(15)
Inserting eq 15 into eq 13 gives the final partial differential equation describing the
distribution of ith water-‐soluble acid in the polymer matrix as a function of time:
€
∂CHAiP
∂t=Di
r2∂∂r(r2
∂CHAiP
∂r) + kiCHAi
P −Kai
( ρwPiρPφw
+1)
∂(CHAiP /
Kai
PiCHAi
P∑ )
∂t (16)
The above equation was integrated following a finite difference method
(explicit midpoint) using Matlab software (see Appendix for Matlab code) to give
€
CHAiP as a function of r at different time t, which was then substituted into eq 15 to
acquire
€
CH + . Finally, μpH was calculated according to the definition of pH
(
€
µpH = −log(CH + ) as a function of r at specified time t. In obtaining the solution, it is
assumed that at time 0, the water-‐soluble acids exhibit a uniform distribution within
the microsphere (
€
CHAiP (r,0) = C0,i), where
€
C0,i is the initial concentration of water-‐
soluble acid in the polymer phase; and the concentration of water-‐soluble acid at the
surface of microsphere is 0 (
€
CHAiP (R,t) = 0), where R is the radius of the microsphere.

121
In addition, the polymer matrix is assumed a homogenous medium with effective
diffusion coefficients.
4.4 Experimental Section
4.4.1 Materials
Poly(D,L-‐lactic-‐co-‐glycolic acid), end capped, 50/50 with inherent viscosity
(i.v.) of 0.6 dl/g in hexafluoroisopropanol at 25 °C was purchased from Durect
Corporation (Birmingham, AL). Polyvinyl alcohol (PVA, 80% hydrolyzed, MW 9-‐10
kDa) was supplied by Polysciences Inc. (Warrington, PA). The fluorescent probe,
Lysosensor yellow/blue® dextran (MW=10 kDa) was purchased from Invitrogen
(Eugene, OR). All other reagents were of analytical grade or higher and obtained
from commercial suppliers.
4.4.2 Preparation of PLGA microspheres
Blank PLGA microspheres were prepared by using the w/o/w double
emulsion-‐solvent evaporation method. Briefly, 100 µl double distilled water was
added to 400 mg/ml PLGA solution in methylene chloride, followed by
homogenization at 7,500 rpm for 1 min using a Tempest IQ2 homogenizer (The
VirTis Co., Gardiner, NY) to generate the first w/o emulsion. Then, 1 ml of PVA
solution in water (2% w/w) was quickly added to the emulsion and mixed by

122
votexing for 20s. The formed w/o/w emulsion was then transferred slowly to 100
ml of PVA solution (0.5% w/w), which was constantly stirred at room temperature
for 3 hours to extract and evaporate the organic solvent. Finally, the hardened
microspheres were harvested and sieved for size of 45-‐63 µm (USA standard test
sieve, sieve No.325 and 635, Newark Wire Cloth Co., Newark, NJ). After washing
with double-‐distilled water for three times, the microspheres were freeze-‐dried on a
FreeZone 2.5 Liter Benchtop freeze dry system (Labconco, Kansas City, MO).
For preparation of PLGA microspheres encapsulating the fluorescence probe
for μpH mapping, 100 µl of 25 mg/ml Lysosensor yellow/blue® dextran solution in
double distilled water was used an internal water phase with all other conditions
unchanged.
4.4.3 Mean microsphere size determination
The mean microsphere radius (R) was estimated by averaging the size of 50
microspheres in micrographs taken by a Hitachi S3200 scanning electron
microscope (SEM, Hitachi Ltd., Tokyo, Japan). Approximately 1-‐2 mg of lyophilized
microspheres was evenly sprinkled onto a brass stub with double-‐adhesive
conductive tape. Samples were sputter coated with gold under vacuum using DESK
II sputter coater (Denton Vacuum LLC, Moorestown, NJ). The excitation voltage was
set at 15.0 kV.

123
4.4.4 Separation and quantification of water-soluble acids
The water-‐soluble acids recovered from PLGA microspheres were separated
and quantified following a chromatographic method developed earlier [17]. The
dried acids were first dissolved in acetonitrile, followed by adding 2-‐fold or greater
mole excess of triethylamine (TEA) and bromophenacyl bromide (pBPB) solution in
acetonitrile. The reaction was carried out at 50°C in amber glass threaded vials in an
oven for 5 h to convert the acids to stable bromophenacyl esters, which was then
quantified by reversed phase high performance liquid chromatography (RP-‐HPLC,
Waters Alliance, Midford, MA). The resulting solution was loaded to a 5 μm
Symmetry® C-‐18 column (2.5 cm×4.6 mm i.d.; Waters) with mixture of acetonitrile
and water as mobile phase at the flow rate 1.0 ml/min. A linear gradient of 70% to
80% of acetonitrile in 5 min was used, and a UV detector at 254 nm detected the
eluent absorbance. Identification of each water-‐soluble acid was done by comparing
a) the retention time of relevant peaks of the analytes with b) the retention times of
peaks of the corresponding standards injected separately. Quantification was
carried out by integration of peak areas, using the external standardization method.
All measurements were performed in triplicates (n=3).
4.4.5 Estimation of initial concentration of water-soluble acids in polymer for
μpH simulation

124
50 mg of blank PLGA microspheres were incubated in 1 ml of phosphate
buffer saline (7.74 mM Na2HPO4, 2.26 mM NaH2PO4, 137 mM NaCl and 3 mM KCl)
containing 0.02 % Tween 80 (pH 7.4) (PBST) at 37°C under mild agitation by a KS
130 basic shaker (IKA® Works Inc., Wilmington, NC) for 4 days to remove the acids
lost during the initial burst phase. After that, the microspheres were separated from
incubation medium by a brief centrifugation, followed by washing with double-‐
distilled water for 5 times to remove the salts before lyophilization.
The water-‐soluble acids in the PLGA microspheres were recovered by
following procedures. Firstly, the dried microspheres were dissolved in 1 ml of
chloroform, followed by adding 1 ml of double distilled-‐water and mixing by mild
vortexing for 1 min. Then, the biphasic solution was left for 10 min and then
centrifuged at 4°C at 4,000 rpm for 5 min. The upper water layer was then
removed. The extraction was repeated for 3 times, and all water phases were
combined. Finally, the water phases containing water-‐soluble acids were
concentrated using a vacuum centrifugal concentrator (Labconco, Kansas City, MO)
at 50°C using heat mode, and the dried extracts were analyzed by the pre-‐
derivatization HPLC method as described above. All measurements were performed
in triplicates (n=3).
4.4.6 Production kinetics of water-soluble acids in PLGA microspheres

125
To estimate the rate of production of acids without release, 50 mg of blank
PLGA microspheres were placed in a 97% relative humidity environment (created
by saturated solution of potassium sulfate) at 37°C. At pre-‐determined time points,
the microspheres were obtained and freeze-‐dried. The dried microspheres were
then dissolved in chloroform and the water-‐soluble acids were recovered after
repeated CHCl3/H2O extraction, which were then derivatized and quantified by RP-‐
HPLC as described above. All measurements were performed in triplicate (n=3).
4.4.7 Estimation of the effective diffusion coefficient of water-soluble acids in
PLGA microspheres
50 mg of blank PLGA microspheres were first incubated at 97% relative
humidity environment at 37°C for one week for degradation. Then, the
microspheres were transferred to 1 ml of double-‐distilled water and incubated at
37°C under mild shaking at 240 rpm. At pre-‐determined time points over a short
time scale, 0.9 ml of release medium was removed, which was then concentrated by
vacuum centrifugal concentrator and the composition of water-‐soluble acids was
analyzed using the pre-‐derivarization HPLC method as described above. Meanwhile,
equal amount of fresh water was added to the medium to maintain the sink
conditions. All measurements were performed in triplicate (n=3).
The mean cumulative released water-‐soluble acid vs. time was fitted to
Crank’s solution for drug release from a monolithic solution in the matrix of

126
spherical geometry to obtain the effective diffusion coefficient (D) of the water-‐
soluble acid in the polymer matrix, which is described as follows (as has been
accomplished for the release of bodipy [13]):
€
Mt
M∞
=1−6π 2
1n2n=1
∞
∑ exp(−Dn2π 2t /a2) (17)
where Mt/M∞ is the fraction of released acid relative to the total amount of acid in
the microspheres, t is the diffusion time and a is the radius of microsphere. For this
study, the average radius of microspheres was used as determined above. The fitting
was done according to a least-‐squares nonlinear regression using n=40 by DataFit
software (Oakdale Engineering, Oakdale, PA). Using values larger than n=40 did not
change the fitted value of D.
4.4.8 Water-uptake in degrading PLGA microspheres
Microspheres (20–25 mg) were incubated in 1 ml PBST (10mM, pH=7.4)
buffer at 37 °C under mild agitation at 320 rpm. At pre-‐determined time points, the
microspheres were collected and the surface water was removed by filtration and
the wet weight (W1) of the microspheres was recorded. The samples then were
dried under vacuum to a constant weight and the dry weight (W2) was recorded.
To correct for the interparticle water, dry microspheres were suspended in
PBST at room temperature and rapidly filtered and dried as described above.
Assuming little water uptake by the microparticles between suspension and

127
filtration, the weight differences between wet and dry particles accounted for the
portion of interparticle water (Wi ), as defined by
€
Wi ≡W1
' −W2'
W2'
(18)
Where W1’ and W2’ are the weights of wet microspheres and dry microspheres after
immediate collection (t=0), respectively. The water uptake of microspheres at time
t (WP(t)) was estimated by:
€
WP (t) =W1 −W2 −W2 ×Wi
W2 (19)
Where W1 and W2 are the wet and dry microsphere weights at time t. All
measurements were performed in triplicate (n=3).
4.4.9 μpH mapping of degrading PLGA microspheres using confocal laser
scanning microscopy (CLSM)
The μpH distribution inside degrading PLGA microspheres was monitored
using a ratiometric method based on CLSM as reported previously [10, 18, 19].
Briefly, 40 mg of microspheres encapsulating fluorescence dye were incubated in 1
ml of PBST buffer (10mM, pH=7.4) under mild agitation at 320 rpm with the
incubation medium replaced once a week. At predetermined time points, a small
amount of microspheres were collected and placed under confocal microscope

128
while focusing at the center to obtain images at two emission wavelengths (450 nm
and 520 nm). The setting for confocal microscope and the method for processing the
confocal images were the same as reported previously [19]. Meanwhile, standard
curve for calibrating the fluorescent ratio (I450nm/I520nm) of dye vs. pH was
established following the same procedure [19].
4.5 Results
4.5.1 Microsphere size and morphology
Since the size of microspheres could affect the μpH development, the
prepared microspheres were screened using sieves to a narrow size range of 45 to
63 μm. In Figure 4.1, the morphology and size distribution of blank PLGA
microspheres are displayed. Microspheres were all well formed with spherical
shape and narrowly distributed size. The mean radius of microspheres (R) was
estimated by averaging 50 microspheres on the SEM micrographs, giving value of 25
± 3 cm (n=50).
4.5.2 Estimation of the initial concentration of water-soluble acids (
€
C0,i) in
PLGA microspheres for μpH simulation
The initial concentration of water-‐soluble acids for μpH prediction should
ideally be determined from the concentration of acids in microspheres before

129
degradation. However, there is an issue with the burst release of encapsulated
species from PLGA microspheres present a rapid mass transfer phase, which has
significant contributions from pore diffusion before the erosion phase begins.
Therefore, microspheres were incubated in phosphate buffer for 4 days to liberate
the acids during this initial burst phase, in order to allow more accurate use of the
diffusion-‐limited assumption to the microspheres. The remaining water-‐soluble
acids in the microspheres after initial incubation were then recovered. It should be
noted that the amount of water-‐soluble acids recovered from the experiment
includes the sum of
€
HAi in the polymer phase,
€
HAi and conjugate base
€
Ai− in the
aqueous pores. Calculations were made to deduct the concentration of
€
HAi in the
polymer phase for the simulation (see Supporting Information), which was treated
as the starting concentration of water-‐soluble acids in the polymer phase at time
zero. Consequently, simulation of μpH on 7, 14, 21 and 28 days was performed using
t=3, 10, 17, and 24, respectively.
4.5.3 Determination of the production rate constant of water-soluble acids
(
€
ki) in degrading PLGA microspheres
Water-‐soluble acid production kinetics were determined by placing the blank
PLGA microspheres in a humid environment (97% relative humidity) at 37°C. It was
reported that PLGA exposing to water vapor or aqueous medium results in same
degradation behavior [16]. More importantly, no loss of acid by transport out of the

130
polymer occurs under such a condition. At pre-‐selected time points of erosion, the
water-‐soluble acids in microspheres were recovered after repeated
chloroform/water extraction (>95% recovery rate, data not shown) and the
composition was measured by pre-‐derivatization HPLC. By converting acids into
UV-‐sensitive derivatives, the water-‐soluble degradation products could be well
separated and accurately quantified using this method (Figure 4.2). The principal
acids in the microspheres during degradation are glycolic acid, lactic acid, and a
linear dimer of lactic acid, lactoyllactic acid, by comparing the retention time of
relevant peaks of acid extracts with corresponding standards, consistent with the
results of degradation products in PLGA films during incubation in phosphate buffer
[17].
The production rate of monomer and oligomer acids is assumed to adhere to
the pseudo-‐first order kinetics due to the acid auto-‐catalytic effect [14]. As shown in
Figure 4.3, the natural log of the concentration of each acid in polymer matrix vs.
degradation time could be well fitted into a linear relationship, the slope of which
gave us the production rate constant
€
ki .
4.5.4 Estimation of the effective diffusion coefficient of water-soluble acids
(
€
Di) in degraded PLGA microspheres
Water-‐soluble acids were first accumulated in blank PLGA microspheres
degraded in a humid environment for one week where no acid lost was expected.

131
From a previous study, it was shown that the diffusion coefficient of a small
fluorescent molecule, bodipy, having similar molecular weight and polymer/water
partition coefficient with trimer of lactic acid, in blank PLGA microspheres did not
vary appreciably over the erosion period of 28 days [13]. Therefore, it was expected
the influence of polymer erosion time on the diffusivity of water-‐soluble acids over
the same time was insignificant. The release profiles of the accumulated water-‐
soluble acids from such degraded PLGA microspheres were studied during 24 hours
incubation in water (Figure 4.4). Within such a small time frame, the acids
produced relative to the initial quantity was insignificant, as calculated from the acid
production rate (Figure 4.3). The release of acids can be regarded as drug release
from a monolithic solution due to the low concentration of water-‐soluble acids in
the PLGA matrix (i.e. below the solubility of water-‐soluble acid in polymer phase). In
addition, the transport of water-‐soluble acids in the polymer matrix is diffusion-‐
controlled before extensive polymer erosion occurs. Therefore, Crank’s solution for
the drug release from spherical geometry can describe the acid diffusion behavior in
microspheres. Fitting the fraction of cumulative acid release vs. release time to eq 17
gave the effective diffusion coefficient of acid (
€
Di), and excellent fits was observed
for each acid (R2=0.9968, 0.9445 and 0.9916 for glycolic acid, lactic acid and
lactoyllactic acid respectively, fitting graph in Figure S4.1). Basically, the glycolic
acid diffused faster compared with lactic acid in the PLGA polymer matrix,
consistent with results of previous studies [21, 22]. This was possibly ascribed to

132
the higher hydrophobicity of lactic acid relative to glycolic acid, which imposes a
stronger interaction between the acid and hydrophobic polymer chains, slowing
down its effective diffusivity.
4.5.5 Simulation of μpH distribution and kinetics in degrading PLGA
microspheres
According to eq 16 and its boundary conditions, the parameters for μpH
simulation were summarized in Table 1, in which R,
€
C0,i ,
€
Di and
€
ki were obtained
from experiments and
€
Pi and
€
Kai were acquired from literature [12]. At different
time points of the simulation, the corresponding value of
€
φw was used (Figure 4.5).
PLGA density was obtained from the manufacturer (
€
ρP=1.34 g/mL) and
€
ρw=1.0
g/mL.
Table 4.1 Summary of parameters used for simulation of μpH distribution and kinetics in degrading PLGA microspheres.
Parameters Glycolic acid Lactic acid Lactoyllactic acid
R (cm) 0.0025
C0,i (mol/L) 2.0*10^(-‐5) 4.0*10^(-‐5) 4.3*10^(-‐5)
Di (cm2/s) 9.9*10^(-‐13) 2.9*10^(-‐13) 1.7*10^(-‐13)
ki (day-‐1) 0.083 0.013 0.079
Pi 6.3 9.5 21
Ka,i 3.84 3.82 3.1

133
In simulation results, the μpH, particularly at later stages of degradation (e.g.
21 days and 28 days), generally increases along the radius of PLGA microspheres
(Figure 4.5A). This agrees with our observation from processed confocal images
(Figure 4.6) that μpH was higher at the peripheral regions of microspheres and
consistent with the anticipation that acids at the center of microspheres are more
likely to be accumulated due to the longer diffusion path to be released out [10, 19].
Also, the simulated μpH decreased with the progress of incubation, in agreement
with the kinetic trend of μpH development from experiments. However, a small
discrepancy still exists between the experimental and predicted results in that the
simulated μpH (Figure 4.5B) has a much narrower distribution compared to the
measured one (Figure 4.7). In addition, the mean μpH was 0.5 to 0.8 units higher
over 4 weeks erosion suggested from experiments compared to simulated results.
4.5.6 Effect of varying model parameters on simulated μpH
Since the simulated μpH was dependent on several parameters, and the ones
acquired from experiments (i.e., R,
€
C0,i ,
€
Di and
€
ki ) may associate with errors, the
effect of varying model parameters on simulated μpH was analyzed and the results
are displayed in Figure 4.9. Because microspheres were pre-‐screened to a narrow
size range (45-‐63 μm), μpH prediction from R of a variation of ± 25 % in
experimental value was performed. For the other parameters, a variation of + 100 %
and -‐ 50 % in experimental value was employed. These results can also be
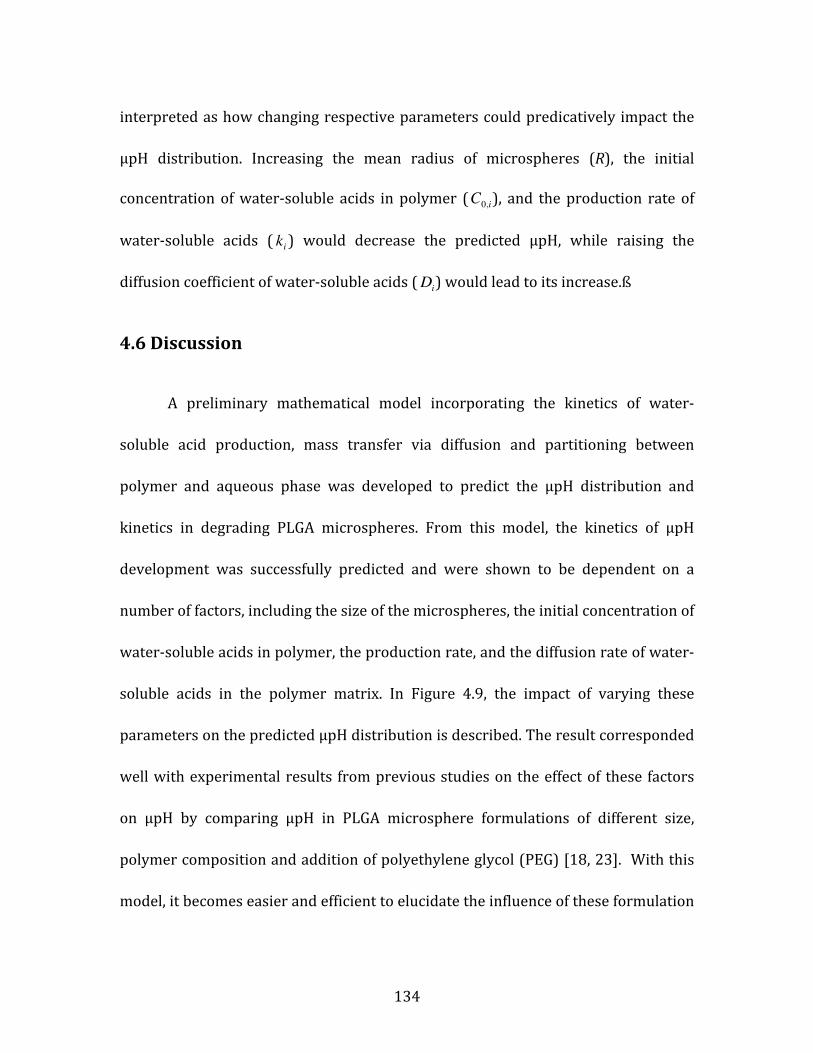
134
interpreted as how changing respective parameters could predicatively impact the
μpH distribution. Increasing the mean radius of microspheres (R), the initial
concentration of water-‐soluble acids in polymer (
€
C0,i), and the production rate of
water-‐soluble acids (
€
ki ) would decrease the predicted μpH, while raising the
diffusion coefficient of water-‐soluble acids (
€
Di) would lead to its increase.ß
4.6 Discussion
A preliminary mathematical model incorporating the kinetics of water-‐
soluble acid production, mass transfer via diffusion and partitioning between
polymer and aqueous phase was developed to predict the μpH distribution and
kinetics in degrading PLGA microspheres. From this model, the kinetics of μpH
development was successfully predicted and were shown to be dependent on a
number of factors, including the size of the microspheres, the initial concentration of
water-‐soluble acids in polymer, the production rate, and the diffusion rate of water-‐
soluble acids in the polymer matrix. In Figure 4.9, the impact of varying these
parameters on the predicted μpH distribution is described. The result corresponded
well with experimental results from previous studies on the effect of these factors
on μpH by comparing μpH in PLGA microsphere formulations of different size,
polymer composition and addition of polyethylene glycol (PEG) [18, 23]. With this
model, it becomes easier and efficient to elucidate the influence of these formulation

135
variables on μpH in PLGA microspheres, thus facilitating the rational design of PLGA
delivery systems for acid-‐labile therapeutics.
However, some differences between predicted and experimental results in
present study should be noted. The relative broader μpH distribution in
experimental results can be partially explained by the limitation of confocal imaging
technique used in this study. It was suggested that the pH of standard pH solutions
measured by this technique associate with deviation of ± 0.2 pH unit [10]. Despite
that, the current model still suffers from inadequacy in providing an accurate
prediction of μpH distribution inside degrading PLGA microspheres.
Firstly, the model did not account for the factor of initial distribution of
water-‐soluble acids in polymer matrix when predicting μpH development. The
narrower μpH distribution reported from simulation can be ascribed to the
assumption of uniform distribution of water-‐soluble acids throughout the polymer
phase at beginning of erosion (
€
CHAiP (r,0) = C0,i). However, it is more likely that a
varied distribution of water-‐soluble acids in the polymer is present at initial period.
Although the differential distribution of acids on the surface vs. body of
microspheres was considered and measures were taken by incubating microspheres
for four days to remove the excessive acids on surface, other factors may also play
roles in determining acids distribution. For example, upon immersing microspheres
in the incubation medium, water will penetrate into the polymer matrix and
consequently lower the glass transition temperature of the polymer [16]. With the

136
change of polymer from glassy to rubbery state at incubation temperature of 37°C,
the polymer chains would become mobile and flexible, leading to the re-‐distribution
of water-‐soluble acids.
Secondly, the role of pores within polymer matrix on the distribution of
water-‐soluble acids was neglected. The hydration of pores after microspheres
imbibing in water could alter the distribution of acids because of the different
partition of water-‐soluble acids between polymer phase and aqueous phase in
pores. And the distribution of pores would consequently influence the distribution
of water-‐soluble acids in polymer. From the processed confocal images (Figure 4.6),
the uneven distribution of acids could be noted, as there were some neutral pH
regions and some “hot spots” with acidic pH after 7 days incubation. The effect of
pores on μpH distribution and development should be considered beyond the initial
period. As the porosity, pore size and the opening/closing state constantly change
during polymer erosion [24] , the acid distribution would be further altered. Since
μpH is projected to be higher in the peripheral regions, in the case that pores are
predominantly distributed in these regions, the μpH would be higher than the
current predicted results. Additionally, acids in the open pores that connect to the
surface could be rapidly released out during incubation, giving rise to the higher pH
(even some neutral pores) in recorded μpH maps.
Another factor the current model may have overlooked is the heterogeneous
bulk degradation in PLGA microspheres. The autocatalytic effect of the accumulated

137
water-‐soluble acids would lead to accelerated degradation in regions with higher
concentration of acids. In addition, the formation of crystallized domains during
PLGA degradation as suggested by literatures [25, 26] would impede polymer
degradation in these domains. This different rate of acids production throughout
microspheres thus may contribute to the relative broad distribution of μpH
observed from CLSM results. Nevertheless, a different degradation rate between the
bulk polymer and that locates at the interface between polymer and aqueous pores
is not likely, since it was suggested that the bulk water (in aqueous pores) and
bound water (associated with pure polymer) could result in similar degradation
behavior [16].
In this model, an averaged radius (R) of microspheres was employed to
simulate the μpH inside PLGA microspheres. However, it is possible that the size
distribution of a microsphere population is not centered on that radius. Therefore, it
would be more accurate if the mathematical model takes into account the factor of
size distribution of microspheres instead of mean radius for μpH prediction.
4.7 Conclusion
In this study, a mathematical model for predicting the μpH distribution and
kinetics in degrading PLGA microspheres was developed, which can be used to
evaluate the contribution of several formulation variables to μpH development,
including the size of microspheres, the initial concentration of water-‐soluble acids in

138
polymer matrix, the production rate and the liberation rate of water-‐soluble acids
from polymer during degradation. To test this model, the production rate constant
and the diffusion coefficient of three principal water-‐soluble acids (i.e., glycolic acid,
lactic acid, lactoyllactic acid) in degrading PLGA microspheres were experimentally
determined for the first time. This model successfully predicted the μpH
development kinetics while showing a small deviation (within 0.5-‐0.8 pH units)
from experimental results in μpH distribution. Future studies could involve
incorporating factors such as the initial water-‐soluble acids distribution, the
distribution and kinetics of porosity, the heterogeneous degradation of polymer,
and the size distribution of microspheres into the model to improve its accuracy for
μpH prediction.

139
Figure 4.1 Representative SEM micrograph of blank PLGA microspheres that were sieved for the size range of 45 to 63 μm.
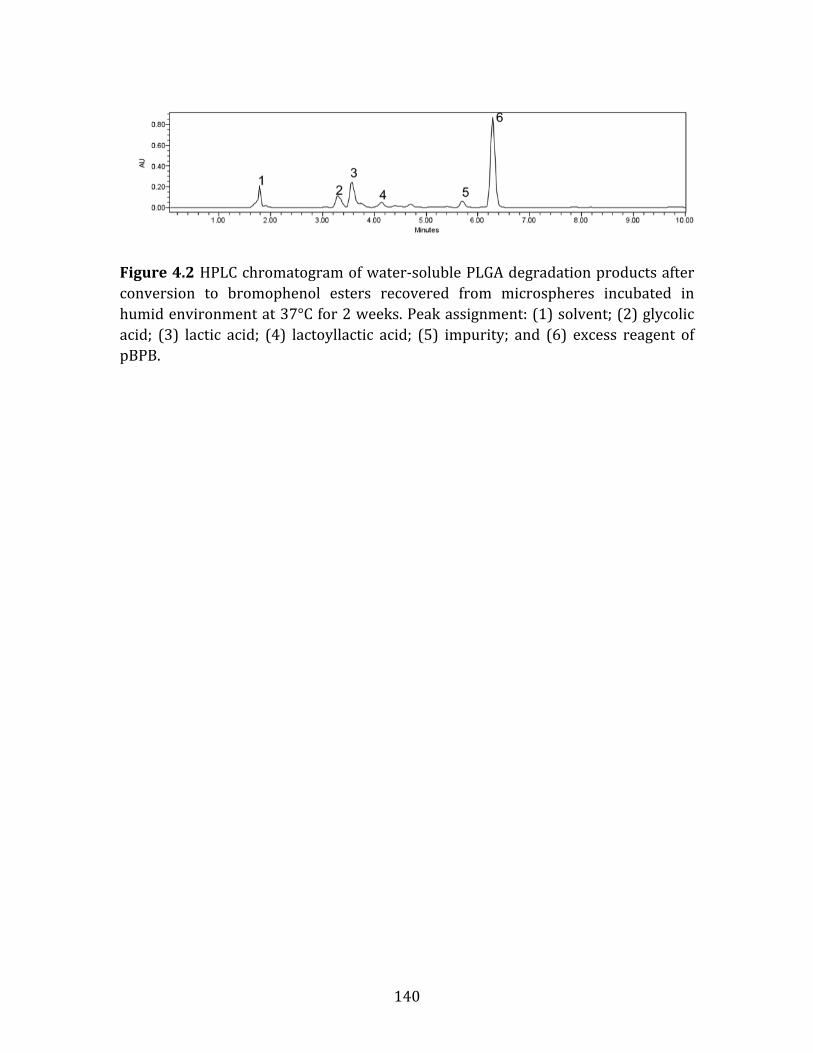
140
Figure 4.2 HPLC chromatogram of water-‐soluble PLGA degradation products after conversion to bromophenol esters recovered from microspheres incubated in humid environment at 37°C for 2 weeks. Peak assignment: (1) solvent; (2) glycolic acid; (3) lactic acid; (4) lactoyllactic acid; (5) impurity; and (6) excess reagent of pBPB.

141
Figure 4.3 The fitted pseudo-‐first order kinetics of glycolic acid (), lactic acid (), and lactoyllactic acid () recovered from PLGA microspheres during degradation in humid environment at 37°C for 4 weeks. The fitted equation are y=0.0834x-‐7.4177, R2=0.995; y=0.0132x-‐5.6004, R2=0.868 and y=0.0790x-‐8.2066, R2=0.954, where y is the natural log of the concentration of acid in the polymer and x is the degradation time for glycolic acid, lactic acid and lactoyllactic acid, respectively. Symbols represent mean ± SD (n=3).

142
Figure 4.4 Fraction of accumulative release of glycolic acid () lactic acid and () lactoyllactic acid () from pre-‐degraded PLGA microspheres during 24 hours incubation at 37°C in water. Symbols represent mean ± SD (n=3).

143
Figure 4.5 Water-‐uptake kinetics in degrading PLGA microspheres incubated in PBST buffer at 37°C for 4 weeks. Symbols represent mean ± SD (n=3).

144
Figure 4.6 Simulated μpH distribution kinetics presented as (A) pH vs. radial position (r/R); and (B) pH vs. probability in degrading PLGA microspheres after 7 days (red), 14 days (green), 21 days (yellow) and 28 days (blue) of degradation at 37 °C.

145
Figure 4.7 Processed confocal images of degrading PLGA microspheres containing fluorescent probe (Lysosensor Yellow/Blue® Dextran) during incubation in PBST buffer at 37 °C for 4 weeks. Images were taken after (A) 7; (B) 14; (C) 21; and (D) 28 days incubation.

146
Figure 4.8 μpH distribution kinetics in degrading PLGA microspheres after incubation at 37°C in PBST buffer for 7 days (), 14 days (), 21 days (), 28 days () measured by CLSM.

147
Figure 4.9 Comparison of simulated μpH distribution inside degrading PLGA microspheres after 14 days incubation by varying the value of (A) the mean radius of microspheres (R) to 125 % of the experimental value (blue), the experimental value (green) and 75% of the experimental value (red); (B) the initial concentration
of water-‐soluble acids (
€
C0,i); C) the production rate constant of water-‐soluble acids
(
€
ki ); and D) the diffusion coefficient of water-‐soluble acids (
€
Di) to 200 % of the experimental value (blue), the experimental value (green) and 50 % of the experimental value (red).

148
4.8 Supporting Information
4.8.1 Correction of the concentration of the ith water-soluble acid in the
polymer phase after 4 days incubation
The moles of the ith water-‐soluble acid (
€
nHAi ) recovered from the polymer
matrix equals to the sum of moles of
€
HAi in the polymer phase and
€
HAi and its
conjugate base
€
Ai− in the aqueous phase, which can be written as a function of the
corresponding molar concentrations (
€
CHAiP ,
€
CHAiw ,
€
CAi−
w ) and volume of the polymer
phase (
€
VP ) and aqueous pore phase (
€
Vw), respectively:
€
nHAi = CHAiP VP + (CHAi
w +CAi−
w )Vw (1)
Consider the dissociation constant of ith water-‐soluble acids gives,
€
CAi−
w =CHAi
w Kai
CH +
(2)
The volume of polymer phase (
€
VP ) and aqueous pore phase (
€
Vw) can be calculated
as follows:
€
VP =MP
ρP (3)
€
Vw =MPφwρw
(4)
where
€
MP is the dry weight of microspheres,
€
φw is the water-‐uptake by
microspheres,
€
ρP and
€
ρw are the density of PLGA polymer and water, respectively.

149
Consider the definition of polymer/water partition coefficient of the ith water-‐
soluble acid (
€
Pi) gives:
€
CHAiw =
CHAiP
Pi (5)
Inserting eq 2-‐5 to eq 1 gives
€
nHAi = CHAiP MP (
1ρP
+φwρwPi
(1+Kai
CH +
)) (6)
Normalize eq 6 for
€
MP gives the water-‐soluble acid content per unit mass of
microspheres, which corresponds to the value obtained from experiment
€
nHAiMP
= CHAiP ( 1
ρP+φwρwPi
(1+10µpH − pKai )) (7)
After 4 days incubation, the
€
φw was approximately to be 0.1 from experiment
(Figure 4.8). From confocal microscopic imaging results after 4 days degradation,
the average μpH was estimated to be 5.
€
Kaiand
€
Pi can be obtained from the
literature [12]. PLGA density was obtained from the manufacturer (
€
ρP=1.37 g/mL)
and
€
ρw=1.0 g/mL. Hence, according to eq 7, the ith water-‐soluble acid concentration
in polymer phase
€
CHAiP in PLGA microspheres after 4 days incubation can be
calculated from experimental value
€
nHAiMP .

150
Figure S4.1 Fitting graphs of fraction of accumulative acid release vs. incubation time to eq 17 in pre-‐degraded PLGA microspheres incubated in water for 24 hours. The correlation coefficient R2 is 0.9968, 0.9445 and 0.9916 for glycolic acid, lactic acid and lactoyllactic acid, respectively.

151
Appendix
Matlab code for solving eq 16 to give
€
CHAiP as a function of r at different time t
File 1: RK2.m % Compute the concentrations c on a uniform grid with N grid cells r. % Integrate the reaction-‐diffusion equations to t=tfinal using RK2 (explicit midpoint method). function [r,c]=RK2(N,tfinal) clear all; global D k A a % Define parameters D=[8.55*10^(-‐8) 2.5*10^(-‐8) 1.47*10^(-‐8)]; % Diffusion coefficient, cm2/day k=[0.083 0.013 0.079];% production rate constant, day-‐1 A=[10^(-‐3.82)/47 10^(-‐3.84)/70 10^(-‐3.1)/154]; % A=Ka/(ρw*P/(ρP*ϕw)+1) a=[10^(-‐3.82)/6.3 10^(-‐3.84)/9.5 10^(-‐3.1)/21]; % a=Ka/P % Radius of microsphere (cm) R=0.0025; % Grid spacing and grid points dr=R/N; r=linspace(0,R,N+1); % Define vector space for concentrations c=zeros(3,N+1); c1=zeros(3,N+1); % Set initial conditions for j=1:N c(1,j)=.000020; c(2,j)=.000040; c(3,j)=.000043; end
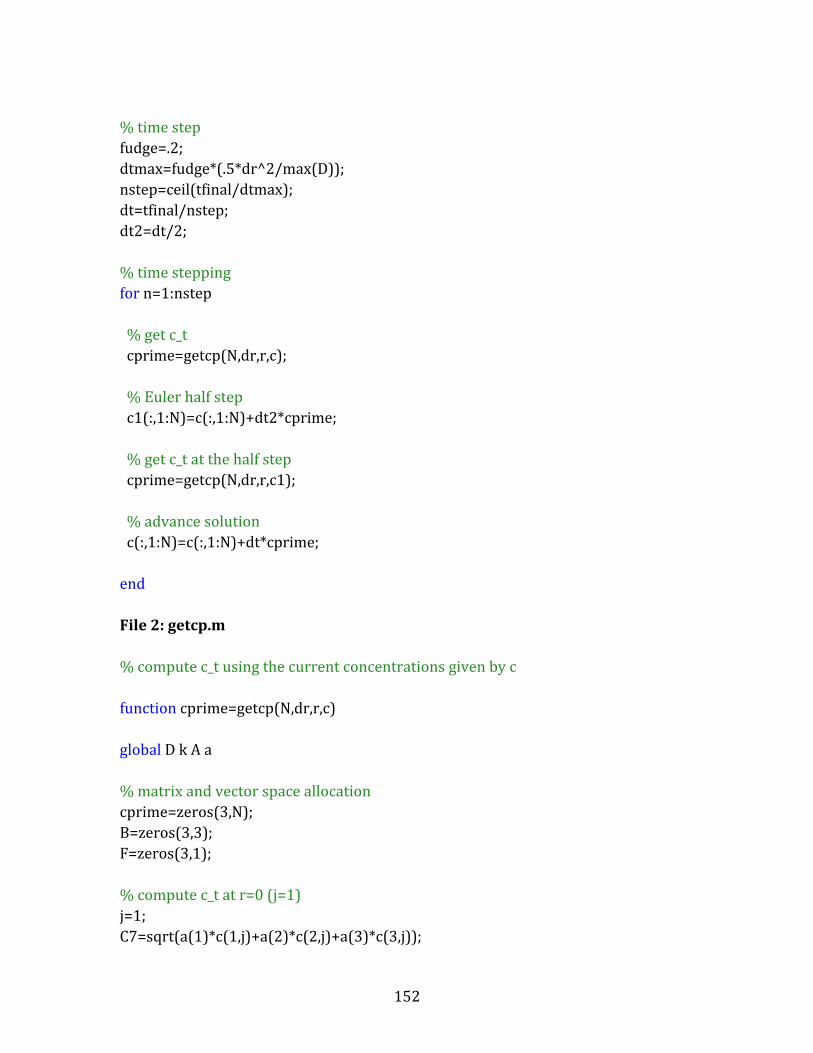
152
% time step fudge=.2; dtmax=fudge*(.5*dr^2/max(D)); nstep=ceil(tfinal/dtmax); dt=tfinal/nstep; dt2=dt/2; % time stepping for n=1:nstep % get c_t cprime=getcp(N,dr,r,c); % Euler half step c1(:,1:N)=c(:,1:N)+dt2*cprime; % get c_t at the half step cprime=getcp(N,dr,r,c1); % advance solution c(:,1:N)=c(:,1:N)+dt*cprime; end File 2: getcp.m % compute c_t using the current concentrations given by c function cprime=getcp(N,dr,r,c) global D k A a % matrix and vector space allocation cprime=zeros(3,N); B=zeros(3,3); F=zeros(3,1); % compute c_t at r=0 (j=1) j=1; C7=sqrt(a(1)*c(1,j)+a(2)*c(2,j)+a(3)*c(3,j));

153
for i=1:3 % evaluate diffusion+reaction terms (r=0) F(i)=6*D(i)*(c(i,j+1)-‐c(i,j))/dr^2 + k(i)*c(i,j); % row of coefficient matrix factor=-‐A(i)*c(i,j)/(2*C7^3); B(i,:)=factor*a; end % diagonal contribution to coefficient matrix B=B+diag(1+A/C7); % compute c_t cprime(:,j)=B\F; % compute c_t for r>0 (j=2:N) for j=2:N C7=sqrt(a(1)*c(1,j)+a(2)*c(2,j)+a(3)*c(3,j)); for i=1:3 % evaluate diffusion+reaction terms (r>0) F(i)=D(i)*((c(i,j+1)-‐2*c(i,j)+c(i,j-‐1))/dr^2+2*(c(i,j+1)-‐c(i,j-‐1))/(r(j)*dr))+k(i)*c(i,j); % row of coefficient matrix factor=-‐A(i)*c(i,j)/(2*C7^3); B(i,:)=factor*a; end % diagonal contribution to coefficient matrix B=B+diag(1+A/C7); % compute c_t cprime(:,j)=B\F; end

154
Reference:
[1] Okada H, Doken Y, Ogawa Y, Toguchi H. Preparation of three-‐month depot injectable microspheres of leuprorelin acetate using biodegradable polymers. Pharmaceutical research. 1994;11:1143-‐7. [2] Johnson OFL, Cleland JL, Lee HJ, Charnis M, Duenas E, Jaworowicz W, et al. A month–long effect from a single injection of microencapsulated human growth hormone. Nature medicine. 1996;2:795-‐9. [3] Hutchinson F, Furr B. Biodegradable polymer systems for the sustained release of polypeptides. Journal of Controlled Release. 1990;13:279-‐94. [4] Cohen S, Yoshioka T, Lucarelli M, Hwang LH, Langer R. Controlled delivery systems for proteins based on poly (lactic/glycolic acid) microspheres. Pharmaceutical research. 1991;8:713-‐20. [5] Putney SD, Burke PA. Improving protein therapeutics with sustained-‐release formulations. Nature biotechnology. 1998;16:153-‐7. [6] Jiang W, Gupta RK, Deshpande MC, Schwendeman SP. Biodegradable poly (lactic-‐co-‐glycolic acid) microparticles for injectable delivery of vaccine antigens. Advanced drug delivery reviews. 2005;57:391-‐410. [7] Schwendeman SP. Recent advances in the stabilization of proteins encapsulated in injectable PLGA delivery systems. Critical reviews in therapeutic drug carrier systems. 2002;19:73. [8] Zhu G, Mallery SR, Schwendeman SP. Stabilization of proteins encapsulated in injectable poly (lactide-‐co-‐glycolide). Nature biotechnology. 2000;18:52-‐7. [9] van de Weert M, Hennink WE, Jiskoot W. Protein instability in poly (lactic-‐co-‐glycolic acid) microparticles. Pharmaceutical research. 2000;17:1159-‐67. [10] Liu Y, Schwendeman SP. Mapping Microclimate pH Distribution inside Protein-‐Encapsulated PLGA Microspheres Using Confocal Laser Scanning Microscopy. Molecular Pharmaceutics. 2012;9:1342-‐50. [11] Marinina J, Shenderova A, Mallery SR, Schwendeman SP. Stabilization of vinca alkaloids encapsulated in poly (lactide-‐co-‐glycolide) microspheres. Pharmaceutical research. 2000;17:677-‐83. [12] Ding AG, Shenderova A, Schwendeman SP. Prediction of microclimate pH in poly (lactic-‐co-‐glycolic acid) films. Journal of the American Chemical Society. 2006;128:5384-‐90. [13] Kang J, Schwendeman SP. Determination of diffusion coefficient of a small hydrophobic probe in poly (lactide-‐co-‐glycolide) microparticles by laser scanning confocal microscopy. Macromolecules. 2003;36:1324-‐30. [14] Pitt CG, Chasalow FI, Hibionada YM, Klimas DM, Schindler A. Aliphatic polyesters. I. The degradation of poly (ϵ-‐caprolactone) in vivo. Journal of Applied Polymer Science. 1981;26:3779-‐87.

155
[15] Kenley RA, Lee MO, Mahoney TR, Sanders LM. Poly (lactide-‐co-‐glycolide) decomposition kinetics in vivo and in vitro. Macromolecules. 1987;20:2398-‐403. [16] Blasi P, D'Souza SS, Selmin F, DeLuca PP. Plasticizing effect of water on poly (lactide-‐co-‐glycolide). Journal of controlled release. 2005;108:1-‐9. [17] Ding AG, Schwendeman SP. Determination of water-‐soluble acid distribution in poly (lactide-‐co-‐glycolide). Journal of pharmaceutical sciences. 2004;93:322-‐31. [18] Ding AG, Schwendeman SP. Acidic microclimate pH distribution in PLGA microspheres monitored by confocal laser scanning microscopy. Pharmaceutical research. 2008;25:2041-‐52. [19] Liu Y, Ghassemi AH, Hennink WE, Schwendeman SP. The microclimate pH in poly (d, l-‐lactide-‐co-‐hydroxymethyl glycolide) microspheres during biodegradation. Biomaterials. 2012:7584-‐93. [20] Batycky RP, Hanes J, Langer R, Edwards DA. A theoretical model of erosion and macromolecular drug release from biodegrading microspheres. Journal of pharmaceutical sciences. 1997;86:1464-‐77. [21] Giunchedi P, Conti B, Scalia S, Conte U. In vitro degradation study of polyester microspheres by a new HPLC method for monomer release determination. Journal of controlled release. 1998;56:53-‐62. [22] Ding AG. Mechanistic evaluation of acidic microclimate pH development in biodegradable poly(lactic-‐co-‐glycolic acid) delivery systems: The University of Michigan 2005. [23] Li L, Schwendeman SP. Mapping neutral microclimate pH in PLGA microspheres. Journal of controlled release. 2005;101:163-‐73. [24] Kang J, Schwendeman SP. Pore closing and opening in biodegradable polymers and their effect on the controlled release of proteins. Molecular pharmaceutics. 2007;4:104-‐18. [25] Park TG. Degradation of poly (lactic-‐co-‐glycolic acid) microspheres: effect of copolymer composition. Biomaterials. 1995;16:1123-‐30. [26] Zolnik BS, Burgess DJ. Effect of acidic pH on PLGA microsphere degradation and release. Journal of Controlled Release. 2007;122:338-‐44.

156
CHAPTER 5
Future Directions
Confocal laser scanning microscopy proved to be a useful technique to
quantitatively investigate the μpH distribution details in biodegradable polymeric
microspheres in this dissertation. The μpH mapping was accomplished in the
presence of protein, the reduced acidity of a new biodegradable polymer was
demonstrated, and the μpH map of degrading microspheres was simulated and
found to be close to measured values. However, μpH was only mapped within an
acidic range (pH 2.8 to 5.8). For microspheres that developed neutral pH (e.g.,
PLHMGA microspheres or PLGA microspheres with incorporation of antiacids),
employing a fluorescent probe that senses pH changes in the neutral range in the
future might provide more detailed information regarding the μpH distribution. For
example, it was shown that the ratio of fluorescent intensities of the dextran-‐
SNARF-‐1® conjugate at emission wavelengths, 580 nm and 640 nm, is responsive to
pH change in the neutral range (pH 5.8-‐8.0) [1].
Future studies might also involve finding specific formulation approaches
that control µpH in PLGA microspheres within several specific and narrow pH

157
ranges. Different formulations strategies could be evaluated for their ability of
controlling μpH in degrading PLGA microspheres. Such strategies might include co-‐
incorporating basic salts other than magnesium carbonate (e.g., Mg(OH)2, ZnCO3),
adding plasticizers (e.g., PEG, triethylcitrite) to facilitate the release of water-‐soluble
acids, adding buffer salts (e.g., ammonium acetate) that could control μpH around
the maximum buffering capacity of the salts, and encapsulating basic amines (e.g.,
proton sponge) that are preferentially protonated in the acidic microenvironment.
Mathematical models of higher complexity that address the participation of
encapsulated species (excipients and drugs) in the acid-‐base equilibrium, ionic
strength, and water activity in PLGA pores could be developed in order to more
accurately predict the μpH in PLGA microsphere formulations containing multiple
components. In that way desired function for pH control of future excipients could
be simulated. Ultimately, coupling a microclimate pH model with models for protein
release would be very powerful, as the addition of excipients to influence both
processes can affect each other.
Finally, employing both a) the ability to map μpH in protein-‐encapsulated
biodegradable microspheres according to the method developed in Chapter 2 and b)
the acquired knowledge from the μpH simulation, the design of rational PLGA
microsphere formulations for clinically relevant therapeutic proteins could be
accomplished based on the specific pH requirements of encapsulated proteins.

158
Reference:
[1] Li L, Schwendeman SP. Mapping neutral microclimate pH in PLGA microspheres. Journal of controlled release. 2005;101:163-‐73.

159
APPENDIX
Examination of the Influence of Water-soluble Acids in Carboxylic
Acid-terminated PLGA on Peptide-PLGA Sorption
A.1 Abstract
The aim of this study is to investigate the effect of water-‐soluble acids (i.e.
monomers and oligomers) present in free acid-‐terminated poly(D,L-‐lactic-‐co-‐
glycolic acid) (PLGA) on peptide sorption. RESOMER RG502H was incubated as
received at 37 °C in PBS or HEPES buffer for 24 hours in the presence or absence of
octreotide or leuprolide acetate salts. The kinetics and distribution of water-‐soluble
acids in incubation medium was analyzed by a pre-‐derivatization HPLC method and
PLGA acid number was determined by potentiometric titration with
phenolphthalein indicator. Peptide sorption was determined by loss of peptide from
solution, monitored by HPLC. The effect of water-‐soluble acids was determined by
comparing the peptide sorption to polymer with and without prior removal of free
acids liberated by PLGA. The results showed that in the absence of peptide, the
RG502H acid number rapidly decreased after 1 h reaching a quasi-‐equilibrium
(~50% of the initial value) by 3 h irrespective of the buffer used. Over the same
160
interval, lactic and lactoyllactic acids accumulated in the incubation medium with no
detectable glycolic acid, accounting for the acids lost by the polymer. Both peptides
sorbed substantially to the RG502H with 25% and 10% loss from octreotide and
leuprolide solutions at 1 h, respectively. Interestingly, removal of acids after pre-‐
incubation of PLGA led to strong inhibition of octreotide sorption whereas weak
inhibition for leuprolide solutions. In conclusion, the principal water-‐soluble acids
released initially from RG502H are lactic and lactoyllactic acids, which can have
strong or weak effects on peptide sorption. These data may provide further insight
into the mechanism of peptide sorption and acylation in carboxylic acid-‐terminated
PLGAs.
KEY WORDS: water-‐soluble acids; peptide sorption; free acid-‐terminated PLGA;
acylation
A.2 Introduction
Injectable microspheres and implants made of biodegradable poly(D,L-‐lactic
acid) (PLA) and poly (D,L-‐lactic-‐co-‐glycolic acid) (PLGA) are among the most
investigated delivery systems for controlled-‐release of peptides and proteins [1-‐6].
However, a significant challenge hindering the successful development of such
systems is the instability of encapsulated species [7, 8]. The microenvironment
inside PLGA aqueous pores where peptide/protein reside often becomes acidic due

161
to the presence of acidic impurities and the accumulation of degradation products
[9-‐11], which can induce aggregation of encapsulated proteins or trigger
unfavorable chemical reactions of peptide/proteins [12, 13]. Apart from that, the
presence of moisture inside PLGA matrix [14], and the hydrophobic polymer surface
[15] are also recognized deleterious stresses for encapsulated bioactive substances
during release and storage.
Recently, acylation has been proposed and proven as an instability
mechanism for peptides encapsulated in PLGAs [16-‐19]. Primary amine groups such
as N-‐terminus and lysine side chain on the peptide can interact with carboxyl
groups of PLGA to form acylated peptide impurities, which can potentially result in
loss of activity, change of immunogenicity and toxicity. The electrostatically-‐driven
peptide sorption to PLGA is believed to be a critical precursor of acylation [20].
PEGylation of N-‐terminal of peptide [20] and incorporation of divalent cation salts
into PLGA delivery systems [21-‐23] both demonstrated significant inhibition of
peptide acylation via disrupting peptide sorption to PLGA.
Typically, PLGAs from commercial suppliers possess a certain level of
residual products from polymer synthesis [24], namely water-‐soluble monomers
and oligomers of glycolic acid and lactic acid, which can also be generated from the
degradation of polymer. This study focused on the mechanistic study of the effect of
water-‐soluble acids present in free-‐acid terminated PLGA on peptide sorption to the
polymer. An understanding of the role of water-‐soluble acids on peptide-‐PLGA

162
interaction will shed light on the understanding of peptide sorption mechanism and
the design of formulations with stabilized therapeutic peptide against acylation.
A.3 Materials and Methods
A.3.1 Materials
Octreotide acetate was provided by Novatis Pharmaceutical Corp. (Basel,
Switzerland). Leuprolide acetate was purchased from Shanghai Shjnj Modern
Pharmaceutical Technology Co., Ltd (Shanghai, China). PLGA 50/50 (Resomer®
RG502H, i.v. 0.2 dl/g) was purchased from Boehringer Ingelheim (Ingelheim,
Germany). (Hydroxyethyl)-‐piperazine-‐(ethanesulfonic acid) (HEPES) and sodium
phosphate was purchased from Sigma-‐Aldrich Chemical Co. (St. Louis, MO). All other
reagents were of analytical grade or higher and obtained from commercial
suppliers.
A.3.2 Kinetics of acid content of RG502H during incubation
100 mg of free-‐acid terminated RG502H was incubated as received in 10 ml
phosphate buffer saline (7.74 mM Na2HPO4, 2.26 mM NaH2PO4, 137 mM NaCl and 3
mM KCl) (PBS, 10mM, pH 7.4) and HEPES buffer (10mM, pH 7,4) respectively at 37
°C under continuous agitation at 320 rpm by a KS 130 basic shaker (IKA® Works
Inc., Wilmington, NC). At pre-‐determined times, the sample was centrifuged and the
163
supernatant was removed. The remaining polymer was washed with double
distilled water for three times, before freeze-‐dried on a FreeZone 2.5 Liter Benchtop
freeze dry system (Labconco, Kansas City, MO) for 24 hours.
The acid content of the polymer was determined using a non-‐aqueous
titration method as reported by Zhang et al. [22]. Briefly, the dried polymer was
dissolved in 20 ml organic solvent (acetone/THF=1:1), followed by titration with
0.01M potassium hydroxide in methanol using phenolphthalein methanol solution
(0.1 wt %) as an indicator to a stable pink end point. 20 ml of actetone/THF (1:1)
mixture without polymer was used as a control.
A.3.3 Kinetics of water-soluble acids in incubation medium
300 mg RG502H polymer was incubated in 30 ml PBS buffer (10 mg/ml) at
37°C under continuous agitation at 320 rpm. At pre-‐determined times, the
incubation medium was separated by centrifugation followed by freeze-‐drying. The
amount of water-‐soluble acids in the incubation medium after lyophilization was
determined using a pre-‐derivatization method as described by Ding et al. [25].
Briefly, the dried acids were dissolved in dimethyl sulfoxide (DMSO) followed by
adding 2-‐fold or greater mole excess of triethylamine (TEA) and bromophenacyl
bromide (pBPB) solution in acetonitrile. The reaction was carried out at 50°C in
amber glass threaded vials in an oven for 5 h to convert the acids to bromophenacyl
esters, which was then quantified by reversed phase high performance liquid

164
chromatography (RP-‐HPLC, Waters Alliance, Midford, MA). The resulting solution
was loaded to a 5 μm Symmetry® C-‐18 column (2.5 cm×4.6 mm i.d.; Waters) with
mixture of acetonitrile and water as mobile phase at the flow rate 1.0 ml/min. A
linear gradient of 60% to 70% of acetonitrile in 15 min was used, and the eluent
absorbance was detected by UV detector at 254 nm.
A.3.4 Peptide sorption kinetics to RG502H
1 ml of peptide solutions (octreotide acetate or leuprolide acetate) in PBS of
concentration of 1 mg/ml was added to 10 mg RG502H and incubated at 37°C under
constant agitation at 320 rpm. At predetermined times, the samples were removed
from the incubator, centrifuged and the amount of peptide sorbed to polymer was
determined by the loss of peptide from solution. The supernatant was analyzed
using RP-‐HPLC for peptide quantification. Specifically, a Nova Pak C-‐18 column
(3.9×150 mm, Waters) was used with mixture of 0.1% TFA in acetonitrile and 0.1%
TFA in water as mobile phase. The samples were eluted at a linear gradient of 25%
to 35% of acetonitrile in 10 min with the flow rate is 1.0 ml/min and the detection
was carried out by UV detector at 280 nm.
A.4 Results and Discussion
A.4.1 Evidence of free water-soluble acids in PLGA RG502H

165
When raw PLGA RG502H particles were placed in the incubation medium,
free water-‐soluble acid monomers and oligomers would be expected to diffuse out
of the polymer and into the release medium. PLGA acid number, as a measure of the
acid content directly related to the number of free carboxylic acid functionalities in
the polymer, was determined by non-‐aqueous potentiometric titration of the
incubated polymer. As shown in Figure A.1, the PLGA acid number (11.7 ± 0.1,
mean ± SD, n=3) rapidly decreased after 1 h reaching a quasi-‐equilibrium (~50% of
the initial value) by 3 h irrespective of the buffer used. Since polymer degradation is
not expected at such early polymer hydration phase, the results suggest the
presence of free water-‐soluble acids in the polymer. However, it should be noted
that the amount of water-‐soluble acids may be varied depending on the batch of
polymer tested due to the discrepancies in manufacturing process and storage
conditions. From the same study of another batch of RG502H in phosphate buffer,
the acid number only dropped to 96% of the original value after 1 h incubation,
exhibiting very small amount free acid residuals. (Supplemental Figure SA.1)
A.4.2 Composition of water-soluble acids in release medium
The composition of free acids released in the incubation medium over the
same time interval was analyzed and quantified using a previous reported pre-‐
deriverization HPLC method. In Figure A.2, only lactic acid and lactoyllactic acid
were accumulated in the incubation medium with no detectable glycolic acid during

166
the first 3 h incubation, consistent with the fact that lactic acid monomers and
dimers consisting the major impurities found in raw RG502H originating from
synthesizing residuals [24]. Notably, the amount of acids in the release medium
during the first 3 h incubation accounted for the lost of acids from the polymer, as
seen from the comparable value between the total amount of acids from the
polymer (as calculated from the acid number of polymer) and the acids released in
the medium and the amount of acids in the raw polymer without incubation (i.e.,
107.1% and 107.2% mass balance at 1 and 3 h) (Figure A.3). However, significant
glycolic acid appeared after 24 h, and the amount of lactic acid continued to rise,
helping to increase the total number of acids from the polymer and release media by
~ 68% of original. This can be possibly due to the onset of polymer degradation
after initial hydration, which produces both lactic acid and glycolic acid.
A.4.3 Sorption kinetics of peptides to RG502H
The sorption kinetics of two model peptides, leuprolide and octreotide,
which have different primary structures, net charges and conformational flexibility,
to RG502H was firstly investigated. Peptide sorption was determined by the loss of
peptide from solution, which was validated by previous study [21]. As shown in
Figure A.4, both peptides sorbed substantially to the RG502H with 25% and 10%
loss from octreotide and leuprolide solutions at 1 h, respectively. And the sorption
continued to increase with respect to increasing incubation time. However, in a

167
sorption kinetics study of another batch of RG502H, only negligible peptide loss
(2%) were recorded from both octrotide and leuprolide solutions after 1 h
incubation (Supplemental Figure SA.2).
A.4.4 Effect of water-soluble acids on peptide-PLGA sorption
To study the effect of water-‐soluble acids in RG502H on peptide sorption,
peptides were incubated with polymer for 1 h that underwent pre-‐incubation and
removal of acids released in the incubation medium and compared with that with
polymer without pre-‐incubation. The sorption of octreotide was found to be greatly
inhibited to polymer with 1 and 3 h pre-‐incubation compared with control (e.g.,
7.8%±1.8% and 6.2%±0.3% loss vs. 25.0%±2.3% control), while far less significant
change was observed for the sorption behavior of leuprolide (e.g., 8.8%±0.6% and
7.4%±0.1% loss vs. 10.0%±0.8% control) (Figure A.5).
The different effect of water-‐soluble acids on the sorption behavior of
different peptides is still unclear. It is hypothesized that peptide sorption to free
carboxylic acids in PLGA could occur either to the free water-‐soluble acids or to
carboxylic acid end groups on the backbone of PLGA chains. In the case of
octreotide, strong inhibition of peptide sorption by removal of water-‐soluble acids
in polymer suggests the majority of electrostatically interaction occurs between
peptide and free water-‐soluble acids present in RG502H. In contrast, leuprolide
mainly interacts with acids on the backbone of polymer as indicated by the weak

168
inhibition of removal of water-‐soluble acids. From peptide sorption study of another
batch of RG502H, which does not possess significant level of water-‐soluble acids, the
loss of octreotide from solution greatly decreased to only 2% ± 0.1% (vs.
25.0%±2.3% control) after 1 h incubation, supporting the hypothesis that free
water-‐soluble acids play an major role in the sorption of octreotide to PLGA.
The peptide-‐PLGA interaction is a complicated process and not fully
understood yet. The binding affinity and kinetics between peptide and PLGA surface
depends on a number of factors, including the surface charge, conformation and
orientation of peptides and mass-‐transport rate of peptides to polymer surface, etc
[21]. Further studies are needed to elucidate more on the mechanism of peptide
interaction with carboxylic acid groups of PLGA.
Due to the crucial role of peptide sorption to PLGA as the initial step in
peptide acylation pathway, the study of the mechanism of peptide sorption,
specifically the role of free water-‐soluble acids on peptide-‐PLGA interaction, may
facilitate the design of rational formulation strategies that minimize peptide (e.g.,
octreotide) acylation in PLGA delivery systems. For instance, by controlling the level
of water-‐soluble acid residuals in PLGA before formulation, by adding excipients
that promote the diffusion of detrimental acids (e.g., PEG) [26, 27] or by
incorporation antacids reagents (e.g., Mg(OH)2, MgCO3) to counteract acids
produced during degradation [28, 29], the sorption of peptide to the polymer could

169
be significantly inhibited, thereby peptides could be stabilized against acylation
during release.
A.5 Conclusions
Depending on manufacture and storage, the amount of water-‐soluble acids in
carboxylic acid-‐terminated PLGAs may vary. The principal water-‐soluble acids
released initially from RG502H are lactic and lactoyllactic acids, which can have
strong or weak effects on peptide sorption. These data may provide further insight
into the mechanism of peptide sorption and acylation in carboxylic acid-‐terminated
PLGA carriers and promote the development of formulation strategies for delivery
of stabilized peptides.

170
Figure A.1 Kinetics of acid number of RG502H during incubation in PBS (○) (10 mM, pH 7.4) and HEPES (●) buffer (10mM, pH 7.4) at 37°C for 24 hours.

171
Figure A.2 Kinetics of glycolic acid (●), lactic acid (■), and lactoyllactic acid () in incubation medium (PBS, 10 mM, pH=7.4) released from 300mg RG502H under incubation at 37 °C for 24 hours.

172
Figure A.3 Kinetics of total carboxylic acids from 300mg RG502H incubated in PBS buffer (10 mM, pH=7.4) at 37ºC for 24 hours calculated from acid number in polymer and the amount of acids in incubation medium quantified by HPLC.

173
Figure A.4 Sorption kinetics of (A) octreotide and (B) leuprolide to RG502H incubated in PBS (10 mM, pH=7.4) buffer at 37 °C.

174
Figure A.5 Sorption kinetics of (A) octreotide and (B) leuprolide to RG502H after incubation in PBS (10 mM, pH=7,4) buffer for 1 h with and without prior removal of free water-‐soluble acids liberated by RG502H that were pre-‐incubated in PBS at 37 °C.
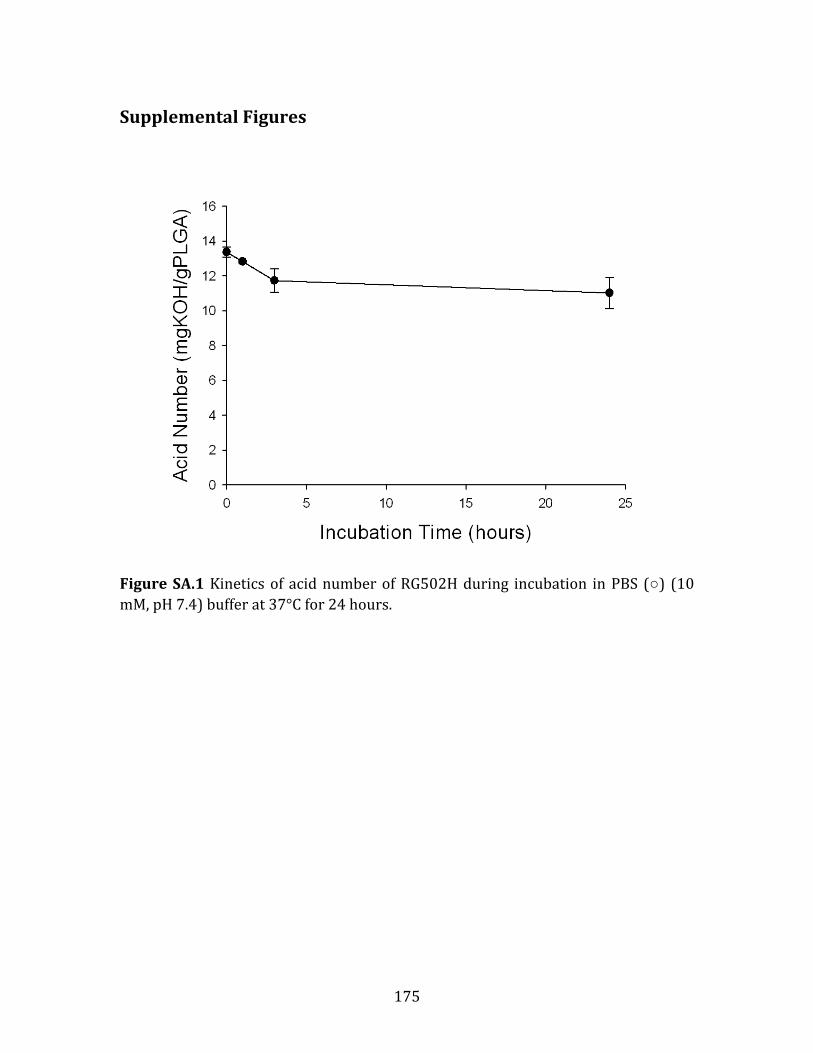
175
Supplemental Figures
Figure SA.1 Kinetics of acid number of RG502H during incubation in PBS (○) (10 mM, pH 7.4) buffer at 37°C for 24 hours.

176
Figure SA.2 Sorption kinetics of (A) octreotide and (B) leuprolide to RG502H incubated in PBS (10mM, pH=7.4) buffer at 37 °C for 24 hours.

177
Reference: [1] Cohen S, Yoshioka T, Lucarelli M, Hwang LH, Langer R. Controlled delivery systems for proteins based on poly (lactic/glycolic acid) microspheres. Pharmaceutical research. 1991;8:713-‐20. [2] Hutchinson F, Furr B. Biodegradable polymer systems for the sustained release of polypeptides. Journal of Controlled Release. 1990;13:279-‐94. [3] Putney SD, Burke PA. Improving protein therapeutics with sustained-‐release formulations. Nature biotechnology. 1998;16:153-‐7. [4] Okada H, Doken Y, Ogawa Y, Toguchi H. Preparation of three-‐month depot injectable microspheres of leuprorelin acetate using biodegradable polymers. Pharmaceutical research. 1994;11:1143-‐7. [5] Johnson OFL, Cleland JL, Lee HJ, Charnis M, Duenas E, Jaworowicz W, et al. A month–long effect from a single injection of microencapsulated human growth hormone. Nature medicine. 1996;2:795-‐9. [6] Jiang W, Gupta RK, Deshpande MC, Schwendeman SP. Biodegradable poly (lactic-‐co-‐glycolic acid) microparticles for injectable delivery of vaccine antigens. Advanced drug delivery reviews. 2005;57:391-‐410. [7] Fu K, Klibanov A, Langer R. Protein stability in controlled-‐release systems. Nature Biotechnology. 2000;18:24-‐5. [8] van de Weert M, Hennink WE, Jiskoot W. Protein instability in poly (lactic-‐co-‐glycolic acid) microparticles. Pharmaceutical research. 2000;17:1159-‐67. [9] Fu K, Pack DW, Klibanov AM, Langer R. Visual evidence of acidic environment within degrading poly (lactic-‐co-‐glycolic acid)(PLGA) microspheres. Pharmaceutical research. 2000;17:100-‐6. [10] Liu Y, Schwendeman SP. Mapping Microclimate pH Distribution inside Protein-‐Encapsulated PLGA Microspheres Using Confocal Laser Scanning Microscopy. Molecular Pharmaceutics. 2012;9:1342-‐50. [11] Ding AG, Shenderova A, Schwendeman SP. Prediction of microclimate pH in poly (lactic-‐co-‐glycolic acid) films. Journal of the American Chemical Society. 2006;128:5384-‐90. [12] Schwendeman SP. Recent advances in the stabilization of proteins encapsulated in injectable PLGA delivery systems. Critical reviews in therapeutic drug carrier systems. 2002;19:73. [13] Houchin ML, Topp EM. Chemical degradation of peptides and proteins in PLGA: a review of reactions and mechanisms. Journal of pharmaceutical sciences. 2008;97:2395-‐404. [14] Schwendeman SP, Costantino HR, Gupta RK, Siber GR, Klibanov AM, Langer R. Stabilization of tetanus and diphtheria toxoids against moisture-‐induced aggregation. Proceedings of the National Academy of Sciences. 1995;92:11234-‐8.

178
[15] Calis S, Jeyanthi R, Tsai T, Mehta RC, DeLuca PP. Adsorption of salmon calcitonin to PLGA microspheres. Pharmaceutical research. 1995;12:1072-‐6. [16] Lucke A, Kiermaier J, Göpferich A. Peptide acylation by poly (α-‐hydroxy esters). Pharmaceutical research. 2002;19:175-‐81. [17] Rothen-‐Weinhold A, Oudry N, Schwach-‐Abdellaoui K, Frutiger-‐Hughes S, Hughes G, Jeannerat D, et al. Formation of peptide impurities in polyester matrices during implant manufacturing. European Journal of Pharmaceutics and Biopharmaceutics. 2000;49:253-‐7. [18] Na DH, Youn YS, Lee SD, Son M-‐W, Kim W-‐B, DeLuca PP, et al. Monitoring of peptide acylation inside degrading PLGA microspheres by capillary electrophoresis and MALDI-‐TOF mass spectrometry. Journal of controlled release. 2003;92:291-‐9. [19] Murty SB, Thanoo B, Wei Q, DeLuca PP. Impurity formation studies with peptide-‐loaded polymeric microspheres: Part I. In vivo evaluation. International journal of pharmaceutics. 2005;297:50-‐61. [20] Na DH, DeLuca PP. PEGylation of octreotide: I. Separation of positional isomers and stability against acylation by poly (D, L-‐lactide-‐co-‐glycolide). Pharmaceutical research. 2005;22:736-‐42. [21] Sophocleous AM. Mechanistic investigation of peptide sorption and acylation in poly (lactic-‐co-‐glycolic acid) The University of Michigan; 2009. [22] Zhang Y, Sophocleous AM, Schwendeman SP. Inhibition of peptide acylation in PLGA microspheres with water-‐soluble divalent cationic salts. Pharmaceutical research. 2009;26:1986-‐94. [23] Zhang Y, Schwendeman SP. Minimizing acylation of peptides in PLGA microspheres. Journal of Controlled Release. 2012. [24] Schwach G, Oudry N, Delhomme S, Lück M, Lindner H, Gurny R. Biodegradable microparticles for sustained release of a new GnRH antagonist–part I: screening commercial PLGA and formulation technologies. European journal of pharmaceutics and biopharmaceutics. 2003;56:327-‐36. [25] Ding AG, Schwendeman SP. Determination of water-‐soluble acid distribution in poly (lactide-‐co-‐glycolide). Journal of pharmaceutical sciences. 2004;93:322-‐31. [26] Jiang W, Schwendeman SP. Stabilization and controlled release of bovine serum albumin encapsulated in poly (D, L-‐lactide) and poly (ethylene glycol) microsphere blends. Pharmaceutical research. 2001;18:878-‐85. [27] Ding AG, Schwendeman SP. Acidic microclimate pH distribution in PLGA microspheres monitored by confocal laser scanning microscopy. Pharmaceutical research. 2008;25:2041-‐52. [28] Zhu G, Mallery SR, Schwendeman SP. Stabilization of proteins encapsulated in injectable poly (lactide-‐co-‐glycolide). Nature biotechnology. 2000;18:52-‐7. [29] Jiang W, Schwendeman SP. Stabilization of tetanus toxoid encapsulated in PLGA microspheres. Molecular Pharmaceutics. 2008;5:808-‐17.