dissertation - e-pub.uni-weimar.dedissertation_nayono+weimar_print... · pucanganom, gunung kidul-...
TRANSCRIPT
Dissertation
Development of a Sustainability-based Sanitation Planning Tool (SusTA) for Developing Countries
Case Study: Integrated Water Resources Management (IWRM) Project, Gunung Kidul, Indonesia
vorgelegt von
Suwartanti Nayono, M.Sc. aus Yogyakarta, Indonesien
zur Erlangung des akademischen Grades
Doktor der Ingenieurwissenschaften - Dr.-Ing.-
Gutachter: Prof. Dr.-Ing. Jörg Londong
Prof. Dr.rer.nat. Armin Grunwald Prof. Dr.-Ing.habil. Ulrike Weiland
Tag der Disputation: 16.06.2014
Weimar

ii
Nowhere has this push for integrated research been more
important than in the field of sustainability research
(Hadorn et al., 2006)

iii
List of Publications:
This dissertation presents the most important results of my doctoral work, which partly have been published as journal and proceeding manuscripts. These manuscripts are:
Nayono, S., Lehn, H., Kopfmüller, J. and Singer, M. (2010). Sustainable Sanitation as a Part of IWRM in the Karst Area of Gunung Sewu: Community Acceptance and Opinion. Water Practice and Technology 4(2010)5, S. 104 DOI 10.2166/wpt.2010.104
Nayono, S., Lehn, H., Kopfmüller, J. and Londong, J. (2011). Options for Decentralized Wastewater Treatment in Rural Karst Area of Gunung Kidul: Social Acceptance. Proceeding of Asian Trans-Disciplinary Karst Conference. January 7-10, 2011. Yogyakarta, Indonesia. ISBN 978-602-8487-17-7
Nayono, S., Lehn, H.; Kopfmüller, J., Londong, J. (2011). Baseline Indicators to Support Decision Making in Sanitation, Case Study: Integrated Water Resources Management Project in Rural Karst Area of Gunung Kidul, Java, Indonesia. Proceeding of Integrated Water Resources Management Conference. October 12-13, 2011. Dresden, Germany .
Nayono, S., Lehn, H., Kopfmüller, J., Londong, J. and Lehmann, A. (2012). Development of a Tool to Analyze Wastewater Treatment Sustainability: Indicators to Assess Technologies for Rural Areas in Developing Countries. In: Steusloff, H. (Hrsg.): Conference Proceedings IWRM (Integrated Water Resources Management), Karlsruhe, Germany, November 21-22, 2012: Interactions of Water with Energy and Materials in Urban Areas and Agriculture. Stuttgart: Fraunhofer, p. 283-289 . ISBN 978-3-8396-0478-6

iv
Acknowledgement First of all I would like to express my gratitude to God, who allows me to complete my dissertation. This dissertation is a challenging research involving two countries with two perspectives: Indonesia and Germany. I owe my thanks to everyone who supports me in Indonesia and Germany during my five year journey.
My gratitude go to my two professors: Prof. Dr.-Ing. Jörg Londong from Department of Environmental and Sanitary Engineering, Bauhaus-Universität Weimar and Prof. Dr.rer.nat. Armin Grunwald from Institute of Technology Assessment and Systems Analysis (ITAS), Karlsruhe Institute of Technology. I appreciate their valuable comments, guidance and cross-disciplinary discussions during various stages of the dissertation. I would like to thank Prof. Dr.-Ing.habil. Ulrike Weiland from Department of Urban Ecology, Faculty of Geography, Universität Leipzig as my third examiner for giving me valuable inputs.
This dissertation would have never been finished, if I had not given a chance to join the Integrated Water Resorces Management (IWRM) Project- Indonesia. Therefore I would like to thank my project supervisors: Dr.rer.nat. Helmut Lehn and Dipl.-Volksw. Jürgen Kopfmüller. I thank them for giving me the trust to explore my ideas for the project and dissertation, and shaping my scientific works through their constructive comments. I am also grateful to the German Ministry for Education and Research (BMBF) for their financial support and also IWRM sub-projects for all data exchanges and assistance.
I would like to thank ITAS colleagues, particulary Susanne Veith- who always organizes the administrative side of things and Gerhard Sardemann- who is always helpful in setting up my internet program connection. I owe a special thank you to my colleagues at Department of Environmental and Sanitary Engineering, Bauhaus-Universität Weimar, who have supported me in many ways- and particularly Grit Rost, who assists me with valuable feedbacks and information. The long-distance works would not be possible without their arrangements. Many thanks to my friends Muhammad Ikhwan and Herlina for their hospitality and various kind of support whenever I am in Karlsruhe.
I would like to acknowledge several people who assisted me during the field works in Gunung Kidul, Indonesia. A special thank is dedicated to Bege Marjianto for all fruitfull discussions about the project and life as well. Many thanks go to a group of sixteen students (Sofie, Rina, Ndaru and colleagues) from Faculty of Geography, Gadjah Mada University, Indonesia who has assisted me conducting the questionnaires; Rajib K.A for the data processing and mapping; and Andreas Heckmann, who has accompanied me to explore the catchment areas of Bribin. My sincere thanks for the people of Pucanganom, Gunung Kidul- particularly Mr. Suprapto, Mr. Tuyana and Mr. Karlim who have thought me many local wisdoms.
Writing the dissertation in foreign languages will not be so smooth without the assistance of my proofreaders. I thank all my friends and colleagues in Germany and U.S.A: Kay Dittner, Amber Mahoney, Adeel Malik, Miriam Miklitz, Sylke Wintzer and Sebastian Eberhard for their assistance in correcting both my english and german.
This dissertation is a truly ‘family project’. I would not be able to reach my dream without my family’s support. Therefore I would like to thank all the wind beneath my wings: my lovely children, Carla and Hadrian for their understanding and patience during these past years; and my husband, Satoto- for his encouragement, cooperation and critical reviews. My deepest appreciation goes to my parents, Warsiati and Suharjoto- who always help me to take care of the children whenever I am away.
Finally, I realize that despite the five-year journey, this dissertation and previous publications cannot accommodate all my ideas, thoughts and concerns regarding sanitation planning in developing countries. There are still many open questions remain for the improvement of the proposed tool. Although the tool cannot give a prescriptive solution to solve sanitation problems in developing countries, I hope that it can be a contribution to the planners to view the problems and provide solutions in a sustainable manner.

v
Summary Background and Research Goal Despite all the efforts in the sanitation sector, it is acknowledged that the world is not on track to meet the MDG sanitation target to reduce the number of people without access to sanitation by 2015. Furthermore, a large number of existing sanitation facilities in developing countries is out of order. This leads to the conclusion that, besides technical failures, the planning process in the sanitation sector was ineffective. This ineffectiveness may be attributed to the lack of knowledge of the sanitation planners about the local conditions of the sanitation project. In addition, sustainability of a technology is often approached from a fragmented perspective that often leads to an unsustainable solution. The dissertation is conducted within the framework of the Integrated Water Resources Management (IWRM) Indonesia project. The goal of this work is to contribute to the development of a methodology of a planning tool for sustainable sanitation technology. The tool is designed for sanitation planners in developing countries, where a top-down planning approach is common practice. The proposed tool enables comprehensive sustainability assessments (using the Helmholtz Concept of Sustainability as reference), taking into account local conditions. State of the Science In the planning practice, many sanitation planning tools focus on technology selection. However, it has become evident that the selection criteria for sustainable technologies are not always considered in the tools’ framework. In other cases, when the criteria are provided by the tool, there is no clear indication of the conditions to be fulfilled in order to meet these criteria. Specifically, there is no reference to what is meant by sustainable technology in a particular context and how to comprehensively assess the sustainability of different technology options. Research Methodology Developing a planning tool is an empirical process, combining theory and practical experience. Hence, the development process of such a tool requires extensive observations, particularly on the interaction between stakeholders in the sanitation sector as well as between technology and its environment. For this purpose, a case study within the project area was carried out. Pucanganom, a village representing common strategic problems in developing countries (e.g. top-down planning approaches, lack of involvement of beneficiaries in the planning process, lack of sustainability assessments) was finally selected as the case study area. After the in-depth case study, an analytical generalisation was developed to enable the tool’s application to a broader context. Results The result of this research is a new tool – the Sustainability-based Sanitation Planning Tool (SusTA). SusTA enables comprehensive sustainability assessment in its five generic steps, namely: (1) analysis of stakeholders and sanitation policy in the region, (2) distance-to-target analysis on sanitation conditions in the region, (3) examination of physical and socio-economic conditions in the project area, (4) contextualisation of the technology assessment process in the project area, and (5) sustainability-oriented technology assessment at the project level. These steps are conducted at two levels of planning – the region and the project area – in order to identify the specific problems and interests which influence the selection of a sanitation system. Each planning step is equipped with tool elements (e.g. set of indicators, household questionnaires, technology assessment matrices) to support the analysis. From the development of SusTA, it can be concluded that four elements are required for an effective and widely applicable sanitation planning tool: sustainability concept, participatory approach, contextualisation framework and modification framework. SusTA provides both a theoretical and a practical basis for assessing the sustainability of sanitation technologies in developing countries. The tool’s main advantages for decision makers in these countries are: It is simple and transparent in its
steps, does not require vast amounts of data and does not need a sophisticated computer program. Keywords: sanitation planning, sustainable technology, sustainability assessment

vi
Zusammenfassung Problemstellung und Zielsetzung der Arbeit: Trotz aller Anstrengungen im Abwassersektor wird eingeräumt, dass das Millennium-Entwicklungsziel, die Zahl der Menschen ohne sanitäre Anlagen bis zum Jahr 2015 zu reduzieren, nicht erreicht wird. Hinzu kommt, dass viele der vorhandenen sanitären Anlagen in Entwicklungsländern nicht mehr funktionieren. Dies führt zu dem Schluss, dass neben den technischen Ausfällen der Planungsprozess ungeignet und die Maßnahmen unwirksam waren. Diese Ineffizienz kann eine Folge der Unkenntnis der Planer der örtlichen Gegebenheiten eines Abwasserprojekts sein. Darüber hinaus werden Technologien häufig nur fragmentiert betrachtet und nicht systemisch verknüpft, was oft zu einer nicht nachhaltigen Lösung führt. Die Dissertation wurde im Rahmen des Projekts Integriertes Wasserressourcen-Management (IWRM) in Indonesien durchgeführt. Das Ziel dieser Arbeit ist, einen Beitrag zur Entwicklung einer Methodik für ein Planungstool für nachhaltige Abwassertechnologien zu leisten. Das Tool ist für Sanitärplaner in Entwicklungsländern konzipiert, in denen ein Top-Down-Planungsansatz gängige Praxis ist. Das vorgeschlagene Tool soll eine umfassende Nachhaltigkeitsanalyse (basierend auf dem Nachhaltigkeitskonzept der Helmholtz-Gemeinschaft) unter Berücksichtigung lokaler Gegebenheiten ermöglichen.
Stand der Wissenschaft: In der Planungspraxis sind viele Sanitärplanungswerkzeuge auf die Technologieauswahl konzentriert. Es hat sich jedoch gezeigt, dass bisweilen keine Auswahlkriterien für Nachhaltigkeit existieren. In anderen Fällen, in denen die Kriterien durch ein Tool vorgegeben sind, bleibt wiederum unklar, welche Bedingungen einzuhalten sind, um die genannten Kriterien zu erfüllen. Insbesondere fehlt oft ein Hinweis darauf, was nachhaltige Technologie in einem bestimmten Kontext bedeutet und wie die Nachhaltigkeit verschiedener Technologieoptionen umfassend beurteilt werden kann.
Forschungsmethodik: Die Entwicklung eines Planungstools ist ein empirischer Prozess und eine Kombination aus Theorie und praktischen Erfahrungen. Die Entwicklung des Tools erfordert daher umfangreiche Beobachtungen, insbesondere zur Interaktion zwischen verschiedenen Interessengruppen im Abwassersektor sowie zwischen Technologien und ihrem Umfeld. Zu diesem Zweck wurde eine Fallstudie durchgeführt. Als Projektgebiet wurde Pucanganom ausgewählt, ein Dorf, das typische strategische Probleme der Entwicklungsländer aufweist (z. B. Top-Down-Planungsansatz, mangelnde Einbindung betroffener Akteure in den Planungsprozess, das Fehlen von Nachhaltigkeitsbewertungen). Im Anschluss an die detaillierte Fallstudie wurde eine analytische Verallgemeinerung der Ergebnisse vorgenommen, um die Anwendung des Tools in einem breiteren Kontext zu ermöglichen.
Ergebnisse: Das Ergebnis dieser Forschung ist ein Sustainability-based Sanitation Planning Tool (SusTA). SusTA ermöglicht eine umfassende Nachhaltigkeitsanalyse in fünf generischen Schritten: (1) Analyse der Akteure und Sanitärpolitik in der Region, (2) Distance-to-Target-Analyse der Abwassersituation in der Region, (3) Analyse der physischen und sozioökonomischen Bedingungen im Projektgebiet, (4) Kontextualisierung des Prozesses der Technikfolgenabschätzung im Projektgebiet und (5) nachhaltigkeitsorientierte Technikfolgenabschätzung auf Projektebene. Diese Schritte werden auf zwei Planungsebenen – der Region und dem Projektgebiet – durchgeführt, um die jeweiligen Probleme und Interessen, die die Auswahl eines Abwassersystems beeinflussen, zu identifizieren. In jedem Planungsschritt werden Tool-Elements (z. B. Indikatoren, Haushaltsfragebögen, Technologiebewertungsmatrizen) eingesetzt, um die Analyse zu unterstützen. Die Entwicklung von SusTA hat gezeigt, dass für ein effektives und breit anwendbares Sanitärplanungstool vier Elemente erforderlich sind: Nachhaltigkeitskonzept, partizipativer Ansatz, Kontextualisierungsrahmen und Änderungsrahmen. SusTA bietet sowohl eine theoretische als auch eine praktische Grundlage zur Beurteilung der Nachhaltigkeit von Sanitärtechnologien in Entwicklungsländern. Wesentliche Vorzüge des Tools für Entscheidungsträger in Entwicklungsländern sind: Es ist einfach und transparent in seinen Schritten, erfordert keine großen Datenmengen und kein kompliziertes Rechenprogramm.
Stichworte: Sanitärplanung , nachhaltige Technologie, Nachhaltigkeitsanalyse

vii
Table of Content List of Publications .............................................................................................................................. iii
Acknowledgement ................................................................................................................................ iv
Summary ................................................................................................................................................ v
Zusammenfassung................................................................................................................................ vi
Table of Content .................................................................................................................................. vii
List of Tables ........................................................................................................................................ xi
List of Figures ..................................................................................................................................... xiii
1. Introduction .................................................................................................................................. 1 1.1. Background Problem at the Global Level ............................................................................... 1 1.2. Background Problem at the Case Study Level ........................................................................ 2 1.3. Goal, Scope and Limitation of the Dissertation....................................................................... 5
1.3.1. Goal ................................................................................................................................. 5 1.3.2. Scope and Limitation ...................................................................................................... 5
1.4. Dissertation Approach ............................................................................................................. 6 1.5. Dissertation Outline ................................................................................................................. 7
2. Research Methodology ................................................................................................................. 9 2.1. Research Stages ....................................................................................................................... 9 2.2. Primary Data Collection Methods ........................................................................................... 9
2.2.1. Interview ....................................................................................................................... 10 2.2.2. Questionnaire ................................................................................................................ 11 2.2.3. Direct Observation in the Study Area ........................................................................... 12 2.2.4. Direct Observation in Treatment Plants ........................................................................ 13 2.2.5. Data Management and Interpretation ............................................................................ 14
3. Theoretical Background ............................................................................................................ 16 3.1. Sanitation Planning Tools ...................................................................................................... 16
3.1.1. Open Planning of Sanitation Systems (Open Planning) ............................................... 17 3.1.2. Household-Centered Environmental Sanitation (HCES) .............................................. 18 3.1.3. Sanitation 21 ................................................................................................................. 20 3.1.4. Community-Led Urban Environmental Sanitation (CLUES) ....................................... 21
3.2. Sustainability-based Technology Assessment: Shaping Technology with Respect to Sustainability Principles ........................................................................................................ 24
3.2.1. Material Flow Analysis (MFA) ..................................................................................... 26 3.2.2. Economic Analysis ....................................................................................................... 26 3.2.3. Life Cycle Assessment (LCA) ...................................................................................... 26 3.2.4. Multi-Criteria Analysis ................................................................................................. 27 3.2.5. System Analysis ............................................................................................................ 27
3.3. Helmholtz Concept of Sustainability: A Guidance for Sustainability Assessment ............... 28 3.3.1. Securing Human’s Existence ........................................................................................ 30 3.3.2. Maintaining Society’s Productive Potential .................................................................. 31 3.3.3. Preserving Society’s Options for Development and Action ......................................... 31
3.4. Indicators’ Requirements and Applicabilities ....................................................................... 32 3.4.1. Sustainability Assessment Indicators ............................................................................ 32 3.4.2. Sustainability-based Technology Assessment Indicators ............................................. 33
4. Sustainability-based Sanitation Planning Tool ........................................................................ 39 4.1. Introduction to SusTA ........................................................................................................... 39 4.2. The Generic Steps of SusTA ................................................................................................. 39

viii
5. Selection of A Study Area .......................................................................................................... 43 5.1. Methods for Selection of a Study Area ................................................................................. 43 5.2. Karst Gunung Sewu ............................................................................................................... 44
5.2.1. Zone Gunung Baturagung in the North ......................................................................... 44 5.2.2. Zone Wonosari Plateau in the Central Part ................................................................... 45 5.2.3. Zone Gunung Sewu in the South and East .................................................................... 45
5.3. Bribin Catchment Area .......................................................................................................... 49 5.4. Field Study and Findings ....................................................................................................... 50 5.5. Karst Vulnerability Study and Findings ................................................................................ 51 5.6. Tracer Test and Findings ....................................................................................................... 54 5.7. Introducing Planning Domains in the Study Area ................................................................. 55
6. Step 1 of SusTA: Sanitation Policy and Stakeholders Identification .................................... 58 6.1. Review of Sanitation Policy and Financial Scheme in Indonesia (Application of Step 1.a) . 58 6.2. Identification of Planning Domains (Application of Step 1.b) .............................................. 61 6.3. Stakeholders Identification (Application of step 1.c) ............................................................ 62
6.3.1. Household ..................................................................................................................... 64 6.3.2. Village ........................................................................................................................... 64 6.3.3. Regency/ local government ........................................................................................... 66
6.3.3.1. Local Planning Agency (Bappeda: Badan Perencanaan Pembangunan Daerah) ... 66 6.3.3.2. Department of Public Works (DPU: Dinas Pekerjaan Umum) .............................. 66 6.3.3.3. Department of Health (Dinas Kesehatan) .............................................................. 67 6.3.3.4. Office of Environmental Impact Control (Kapedal: Kantor Pengendalian Dampak
Lingkungan) ........................................................................................................... 67 6.3.3.5. Overlapping Tasks and Uncovered Responsibilities in Institutional Level ........... 68 6.3.3.6. Other Stakeholders in Local Level ......................................................................... 69
6.4. Identification of the Most Important and Influencing Stakeholders (Result of Step 1.c) ...... 70
7. Step 2 of SusTA: Distance-to-Target Analysis to Support Decision Making in Sanitation ....................................................................................................................................................... 71
7.1. Designing indicators based on the Integrative Sustainability Concept developed by the Helmholtz Association of German Research Centers (Development of Tool for Step 2.a and 2.b) ......................................................................................................................................... 71
7.2. Background Indicators, Their Values and Distance-to-Target Analysis (Application of Step 2.a and 2.b) ............................................................................................................................ 73
1. First Goal: Securing human existence ...................................................................................... 73 2. Second Goal: Maintaining society’s productive potential ........................................................ 81 3. Third Goal: Preserving society’s options for development and action .................................... 83
8. Step 3 of SusTA: Examination of Socio-Economic and Physical Condition of the Southern Bribin Catchment Area ............................................................................................................ 86
8.1. Collecting Physical and Socio-Economic Data for Sanitation Planning (Application of Step 3.a) ......................................................................................................................................... 86
8.1.1. Social Preference........................................................................................................... 86 8.1.2. Main Problems in Conducting Households Questionnaires .......................................... 87
8.2. Examination of the Physical and Socio-Economic Conditions (Application of Step 3.b) .... 90 8.2.1. Socio- Economic Conditions Related to Water ............................................................ 90 8.2.2. Water Consumption ...................................................................................................... 92 8.2.3. Current Wastewater and Solid Waste Treatment and Their Future Perspectives.......... 94
8.2.3.1. Simple Pit Latrine (SPL) ........................................................................................ 94 8.2.3.2. Siphon toilet connected to a septic tank ................................................................. 95 8.2.3.3. Greywater treatment ............................................................................................... 96 8.2.3.4. Solid waste management ........................................................................................ 97
8.2.4. Nutrients and Energy Issues .......................................................................................... 98 8.3. Technologies with Possibility for Resources Recovery: Social Preference and Future
Perspectives (Application of Step 3.b) ................................................................................. 99

ix
8.3.1. Composting and Urine Diverting Toilet ....................................................................... 99 8.3.2. Biogas digester ............................................................................................................ 100 8.3.3. Public sanitation facility .............................................................................................. 101
9. Step 4 of SusTA: Contextualization of the Technology Assessment Process ..................... 102 9.1. Development of a Set of Sustainability-Based Technology Assessment Indicators
(Designing Tool for Step 4.a) ............................................................................................. 102 9.2. Defining Stakeholders’ Priority Concerning Indicators (Application of Step 4.a) .............. 104
9.2.1. Model I: Equal Influence Assumption ........................................................................ 107 9.2.2. Model II: Project Perspective ...................................................................................... 108 9.2.3. Model III: Long-term Perspective ............................................................................... 108
9.3. Development of Indicators’ Rating Scale (Application of Step 4.b) ................................. 110 9.3.1. Investment cost ........................................................................................................... 115 9.3.2. Operational and maintenance (OM) cost .................................................................... 115 9.3.3. Public preference on technology ................................................................................. 115 9.3.4. Technical skills required to operate and maintain the system ..................................... 116 9.3.5. Possibility of minor problems to be fixed within reasonable repair time ................... 116 9.3.6. Total Suspended Solid (TSS) removal ........................................................................ 118 9.3.7. Biochemical Oxygen Demand (BOD) removal .......................................................... 118 9.3.8. Land availability for the plant ..................................................................................... 119 9.3.9. Water consumption to operate the whole system ........................................................ 119 9.3.10. Energy (electricity, fossil fuels) required to operate the system ................................. 120 9.3.11. Compatibility with the existing system ....................................................................... 120 9.3.12. Health risks caused by the system ............................................................................... 120 9.3.13. Potential nutrient recovery .......................................................................................... 121 9.3.14. Potential energy recovery ............................................................................................ 121
10. Step 5 of SusTA: Sustainability-based Technology Assessment .......................................... 123 10.1. Basic Requirements for a Sanitation System in Pucanganom (Application of Step 5.a) .... 123
10.1.1. Decentralized System .................................................................................................. 124 10.1.2. Anaerobic Treatment Process ..................................................................................... 126 10.1.3. Sanitation System with Several Technologies and Sub-Systems................................ 126
10.2. Part of a Sanitation System: User Interface (Application of Step 5.b) ................................ 127 10.2.1. Blackwater Collection: Pour-Flush Toilet .................................................................. 127 10.2.2. Greywater Collection: Kitchen Sink and Bathroom ................................................... 127
10.3. Part of Sanitation System: On-site Treatment (Application of Step 5.b) ............................ 128 10.3.1. Septic Tank with Anaerobic Filter .............................................................................. 128 10.3.2. Biogas digester ............................................................................................................ 130
10.4. Part of Sanitation System: Semi Off-site Treatment (Application of Step 5.b) .................. 134 10.4.1. Conveyance ................................................................................................................. 134 10.4.2. Anaerobic Baffled Reactor .......................................................................................... 134
10.5. Part of Sanitation System: End Product (Application of Step 5.b) ..................................... 135 10.5.1. Effluent Treatment: Horizontal- Flow Planted Filter .................................................. 135 10.5.2. Effluent Disposal: Infiltration pit ................................................................................ 136 10.5.3. Faecal Sludge Handling: Desludging Truck ............................................................... 137
10.6. Options of Sanitation Systems in Pucanganom (Application of Step 5.b) ......................... 138 10.6.1. System I: Cluster Digester and Cluster HFPF ............................................................. 138 10.6.2. System II: Private Digester and Communal ABR ....................................................... 139 10.6.3. System III: Private Digester and Cluster Septic Tank-AF .......................................... 140
10.7. System Analysis of Sanitation Systems in Pucanganom (Application of Step 5.c and 5.d) 141 10.7.1. Analysis of System I: Cluster Digester and Cluster HFPF ......................................... 144 10.7.2. Analysis of System II: Private Digester and Communal ABR ................................... 145 10.7.3. Analysis of System III: Private Digester and Cluster Septic Tank-AF ....................... 145

x
11. Summary and Future Research Perspectives ........................................................................ 147 11.1. Summary of the Research .................................................................................................... 147 11.2. Future Research Perspectives .............................................................................................. 150
References .......................................................................................................................................... 154
List of Interviews ............................................................................................................................... 163
Appendix 1 ......................................................................................................................................... 165
Appendix 2 ......................................................................................................................................... 181
Appendix 3 ......................................................................................................................................... 187
xi
List of Tables
Table 1.1 Dissertation characteristic as an interdisciplinary research .................................................... 6 Table 1.2 Dissertation outline ................................................................................................................ 8 Table 2.1 Types and characteristics of interviews................................................................................ 10 Table 2.2 Information sources (interviewees), type of information and type of interviews ................ 10 Table 2.3 Data collection, management and interpretation methods ................................................... 14 Table 3.1 Summary of Open Planning, HCES, Sanitation 21 and CLUES ......................................... 23 Table 3.2 Definition of technology assessment .................................................................................... 25 Table 3.3 Helmholtz Concept of Sustainability ................................................................................... 30 Table 3.4 Substantial sustainability principles related with the general sustainability objective
“Securing human existence” ............................................................................................... 31 Table 3.5 Substantial sustainability principles related with the general sustainability objective
“Maintaining society’s productive potential” ..................................................................... 31 Table 3.6 Substantial sustainability principles related with the general sustainability objective
“Preserving society’s options for development and action” ............................................... 32 Table 3.7 Previous studies on sustainable sanitation technology assessment indicators ..................... 35 Table 4.1 SusTA with generic steps and tool kits ................................................................. ............. .41 Table 5.1 Criteria for selecting a study area ......................................................................................... 43 Table 5.2 Demography data of Gunung Kidul’s geomorphological unit.............................................. 46 Table 5.3 Fulfillment of Pucanganom Village to selection criteria ...................................................... 51 Table 6.1 Comparison of sanitation development in Indonesia, before 2001 (centralized) and after
2001 (decentralized) ............................................................................................................ 59 Table 6.2 Stakeholder assessment in household level .......................................................................... 64 Table 6.3 Stakeholder assessment in village level ............................................................................... 65 Table 6.4 Institutional stakeholders identification ............................................................................... 69 Table 6.5 Roles and interests of a project facilitator and a technical consultant .................................. 69 Table 6.6 Stakeholders degree of importance and influence in village Pucanganom .......................... 70 Table 7.1 Indicators for the protection of human health ...................................................................... 73 Table 7.2 Indicators for satisfaction of basic needs ............................................................................. 76 Table 7.3 Summary of requirements for water service level to promote health .................................. 76 Table 7.4 Recommended minimum sample number for faecal indicator testing in a distribution
system ................................................................................................................................. 78 Table 7.5 Indicators on autonomous subsistence based on own income.............................................. 80 Table 7.6 Indicators for sustainable use of renewable resources ......................................................... 81 Table 7.7 Indicators for sustainable use of the environment as sink .................................................... 82 Table 7.8 Indicators for participation in social decision making processes ......................................... 83 Table 7.9 Summary from the distance-to-target analysis ..................................................................... 84 Table 8.1 Problems and approaches in collecting quantitative data ..................................................... 88 Table 8.2 Water supply condition related to water expenditure ........................................................... 92 Table 8.3 Acceptance of respondents on CUDT ................................................................................ 100 Table 9.1 Selected rules and indicators developed based on the Helmholtz concep.......................... 103 Table 9.2 Stakeholders’ interest concerning technology .................................................................... 105 Table 9.3 Stakeholders ranking on indicators, based on equal influence ........................................... 107 Table 9.4 Conversion from ranking into score ................................................................................... 108 Table 9.5 Stakeholders’ ranking on indicators, based on project perspective .................................... 108 Table 9.6 Stakeholders’ ranking on indicators, based on long-term perspective ............................... 109 Table 9.7 Technology assessment indicators with rating scale 1-3 .................................................... 111 Table 9.8 Availability of material and service for Pucanganom ........................................................ 117 Table 9.9 Water consumption in Pucanganom ................................................................................... 120 Table 9.10 Sanitation system and possible exposure ......................................................................... 121 Table 10.1 Advantages and disadvantages of an anaerobic process .................................................. 126 Table 10.2 Comparison of fixed-dome and floating roof digesters .................................................... 133

xii
Table 10.3 Characteristic of System I in Pucanganom....................................................................... 138 Table 10.4 Characteristic of System II in Pucanganom ..................................................................... 139 Table 10.5 Characteristic of System III in Pucanganom .................................................................... 140 Table 10.6 Scoring tabulation of System 1-3 ..................................................................................... 142 Table 11.1 Characteristics of project area for SusTA test case .......................................................... 153

xiii
List of Figures
Figure 1.1 Worldwide use of improved sanitation facilities in 2010 ..................................................... 1 Figure 1.2 Trend in use of improved sanitation 1990-2008 and the projection for 2015 ...................... 2 Figure 1.3 Bribin Sindon underground river dam .................................................................................. 3 Figure 1.4 Blocked outlet of the digester ............................................................................................... 4 Figure 1.5 Slurry drying bed as fish pond .............................................................................................. 4 Figure 2.1 Administering a household questionnaire........................................................................... 12 Figure 2.2 Observation of daily activity in at public stand post .......................................................... 13 Figure 2.3 Centralized wastewater treatment plant in Bantul .............................................................. 14 Figure 3.1 HCES Model ....................................................................................................................... 19 Figure 3.2 Architecture of the Helmholtz integrative sustainability concept ....................................... 29 Figure 5.1 Selection process of a study area ........................................................................................ 44 Figure 5.2 Three geomorphological structure and location of the IWRM project in Gunung Sewu ... 44 Figure 5.3 Water source managed by the community in the northern part of Baturagung................... 45 Figure 5.4 A karst spring in the border of the Wonosari Plateau and Gunung Sewu ........................... 45 Figure 5.5 A ponded depression (telaga) in Gunung Sewu .................................................................. 46 Figure 5.6 Distribution of annual precipitation Gunung Kidul 1952-2009 .......................................... 47 Figure 5.7 A newly-formed sinkhole .................................................................................................... 47 Figure 5.8 Possible pollution spread in karst system ........................................................................... 48 Figure 5.9 Comparison of catchment area in surface drainage (top picture) and unknown catchment in
sub-surface drainage ......................................................................................................... 49 Figure 5.10 Bribin catchment area by Faculty of Forestry, Gadjah Mada University ......................... 50 Figure 5.11 Specific vulnerability map for feces ................................................................................. 53 Figure 5.12 Waste along the waterway to Kalen sinkhole ................................................................... 54 Figure 5.13 Kalen Sinkhole and ten observation points in the tracer test .......................................... 55 Figure 5.14 Map of Pucanganom in relation to catchment area and region Gunung Kidul ................. 56 Figure 5.15 Planning domains in the study area .................................................................................. 57 Figure 6.1 Hierarchy of Indonesia administrative division .................................................................. 58 Figure 6.2 Share of budget in Sanimas program .................................................................................. 60 Figure 6.3 The administrative structure of Indonesia (left) and planning domains in the study area,
village Pucanganom ............................................................................................................ 62 Figure 7.1 Development of background indicators .............................................................................. 72 Figure 7.2 Water supply ladder ............................................................................................................ 77 Figure 7.3 Sanitation practice ladder ................................................................................................... 79 Figure 8.1 Administrative map of the research area ............................................................................ 87 Figure 8.2 Water sources in the survey area (household level)............................................................ 91 Figure 8.3 Rain water cistern ............................................................................................................... 91 Figure 8.4 Water storage as settlement tank ........................................................................................ 91 Figure 8.5 Measurement device for pipeline water .............................................................................. 91 Figure 8.6 Water consumption (liters/capita.day) in four villages ....................................................... 93 Figure 8.7 Daily household water consumption and its usages (liters/household.day) ....................... 93 Figure 8.8 Simple pit latrine ................................................................................................................ 95 Figure 8.9 Follow up after SPL is full .................................................................................................. 95 Figure 8.10 Advanced infiltration pit ................................................................................................... 96 Figure 8.11 Material for septic tank construction ................................................................................ 96 Figure 8.12 Existing grey water discharge ........................................................................................... 97 Figure 8.13 Purposes of reusing treated greywater ............................................................................. 97 Figure 8.14 Biodegradable organic waste handling ............................................................................ 98 Figure 8.15 Non-biodegradable waste handling .................................................................................. 98 Figure 8.16 Spreading organic fertilizer on the field ........................................................................... 98 Figure 8.17 Biomass for cooking ......................................................................................................... 98 Figure 8.18 Squatting urine diverter .................................................................................................. 100

xiv
Figure 8.19 Reasons for not using composting UDT ......................................................................... 100 Figure 9.1 Stakeholders ranking on indicators based on Model I. Equal influence’s assumption ..... 107 Figure 9.2 Comparison of stakeholders ranking on indicators based on three models ...................... 110 Figure 9.3 Map of Pucanganom and several bigger cities in the province ........................................ 117 Figure 10.1 Sanitation system requirements for Pucanganom ........................................................... 123 Figure 10.2 Visualitation of centralized and decentralized treatment ................................................ 125 Figure 10.3 Pour flush toilette ............................................................................................................ 127 Figure 10.4 Grease trap prior to further treatment ............................................................................. 128 Figure 10.5 Two-chamber septic tank ............................................................................................... 129 Figure 10.6 Septic tank with anaerobic filter ..................................................................................... 129 Figure 10.7 Floating roof digester ...................................................................................................... 132 Figure 10.8 Fixed dome digester ........................................................................................................ 132 Figure 10.9 Anaerobic baffled reactor ............................................................................................... 135 Figure 10.10 Horizontal-flow planted filter ....................................................................................... 136 Figure 10.11 Infiltration pit ............................................................................................................... 137 Figure 10.12 Desludging truck ........................................................................................................... 137 Figure 10.13 Schematic diagram of System I .................................................................................... 139 Figure 10.14 Schematic diagram of System II ................................................................................... 140 Figure 10.15 Schematic diagram of System III ................................................................................. 141 Figure 10.16 Rose-chart diagram of the systems ............................................................................... 143 Figure 10.17 Fulfillment comparison of each indicator of System I, II and III ................................. 144 Figure 11.1 Stakeholders’ level of involvement ................................................................................ 148 Figure 11.2 Level of stakeholders’ participation in SusTA, case study Pucanganom ....................... 149 Figure 11.3 Four essentials elements to be included in SusTA ......................................................... 150

Introduction
1
1. Introduction Chapter 1 discusses the background problems on a global-and local scale which motivate the development of a sanitation planning tool in this dissertation. The global scale in this context refers to developing countries, while the local scale refers to the project area- Gunung Kidul, Java, Indonesia. This chapter also outlines the goal, approach and the structure of the dissertation.
1.1. Background Problem at the Global Level The importance of having proper sanitation1 facilities has been addressed worldwide due to its significant effect on the quality of life. Lack of proper sanitation has been linked to significant negative impacts on health, economy, environment and social life. Diarrhoea diseases, resulting from poor sanitation and hygiene, have become the leading cause of child morbidity and mortality in the world, leading to the death of 1.5 million children a year (WHO, 2013).
The need to improve sanitation conditions was emphasized in the World Summit on Sustainable Development in Johannesburg in 2002. During this summit, the Millennium Development Goals (MDGs) were originally set to halve the proportion of the population without access to safe drinking water, as well as to halve the proportion of the world population without access to improved sanitation2 by 2015 (United Nation, 2003).
The MDGs emphasize the need for developing countries to accelerate their efforts to improve sanitation conditions. Currently, developing countries, especially in Sub-Saharan Africa and South Eastern Asia, have the biggest share of population without improved sanitation facilities (WHO and UNICEF, 2012), as depicted in Figure 1.1.
Figure 1.1 Worldwide use of improved sanitation facilities in 2010 (Source: WHO and UNICEF, 2012)
1 Sanitation is defined as access to, and use of excreta and wastewater facilities and services that, ensure privacy and dignity, ensuring a clean and healthy living environment for all (COHRE, 2008). Facilities and services include the collection, transportation, treatment, and disposal of human excreta and domestic wastewater. Sanitation is a system consisting of this complete chain, not only the part of user interface. 2 WHO and UNICEF (2008) define improved sanitation facilities as facilities that ensure hygienic separation of human excreta from human contact. They include: flush or pour-flush toilet/latrines connected to a piped sewer system, septic tanks and pit latrines; ventilated improved pit (VIP) latrines; pit latrines with slab and composting toilets. For further explanation on the definition refer to section 7.2.

Introduction____________________________________________________________________
2
Despite all the efforts, the WHO and UNICEF (2012) reported that in 2010 around 37% of the world’s population, or around 2.5 billion people, still lack improved sanitation facilities.
This includes 1.2 billion who have no facilities at all. These figures show that the world is not on track to meet the MDG sanitation target and is unlikely to do so by 2015. In 2015 36% of the world population is projected to live without improved sanitation, substantially worse compared to the 23% target in the MDG (Figure 1.2).
Figure 1.2 Trend in use of improved sanitation 1990-2008 and the projection for 2015
(Source: WHO and UNICEF, 2010)
Many constraints, such as a society’s particular mindset, financial restrictions, specific geographical conditions, concerns about energy supply and the country’s development
priorities place sanitation development at a lower priority. Compared to securing water supply, sanitation development is also less prioritized.
Besides the aforementioned problems, sanitation coverage is not optimal due to many inoperative sanitation facilities. In many developing countries where the water supply and sanitation facilities have already been installed, it is estimated that 30%–60% of existing rural systems are inoperative at any given time. This causes more than 2 billion people worldwide to live without access to any type of improved sanitation (Brikké and Bredero, 2003).
1.2. Background Problem at the Case Study Level This dissertation is conducted in the frame of the Integrated Water Resources Management (IWRM) Project in Indonesia. The project aimed to overcome water scarcity in a rural karst area with a monsoon climate in Gunung Kidul, Yogyakarta, Indonesia. As a solution offered by Karlsruhe Institute of Technology (KIT), Germany, water from an underground river in Bribin Sindon is pumped and distributed to the people (Figure 1.3).

Introduction
3
Figure 1.3 Bribin Sindon underground river dam (Source: IWG, 2005)
Since karst underground water is often considered to be highly vulnerable to contamination from human activities, potential problems caused by current sanitation and hygiene practices in the catchment area must be anticipated. About 90% of the people in the recharge area use pour flush siphon toilets with poorly designed septic tanks and the rest have simple pit latrines. However, the existing septic tanks are very poorly designed and are actually only improved infiltration pits (Nayono et al., 2010). With traditional agriculture as the main living source, many households in the area also have cattle. Unfortunately the dung is not properly managed. During the rainy season the dung flows in the sinkholes/dolines and enters the underground system. Due to this urgent need to protect the underground river water, the IWRM Indonesia Project puts efforts in managing the domestic wastewater in Bribin catchment area.
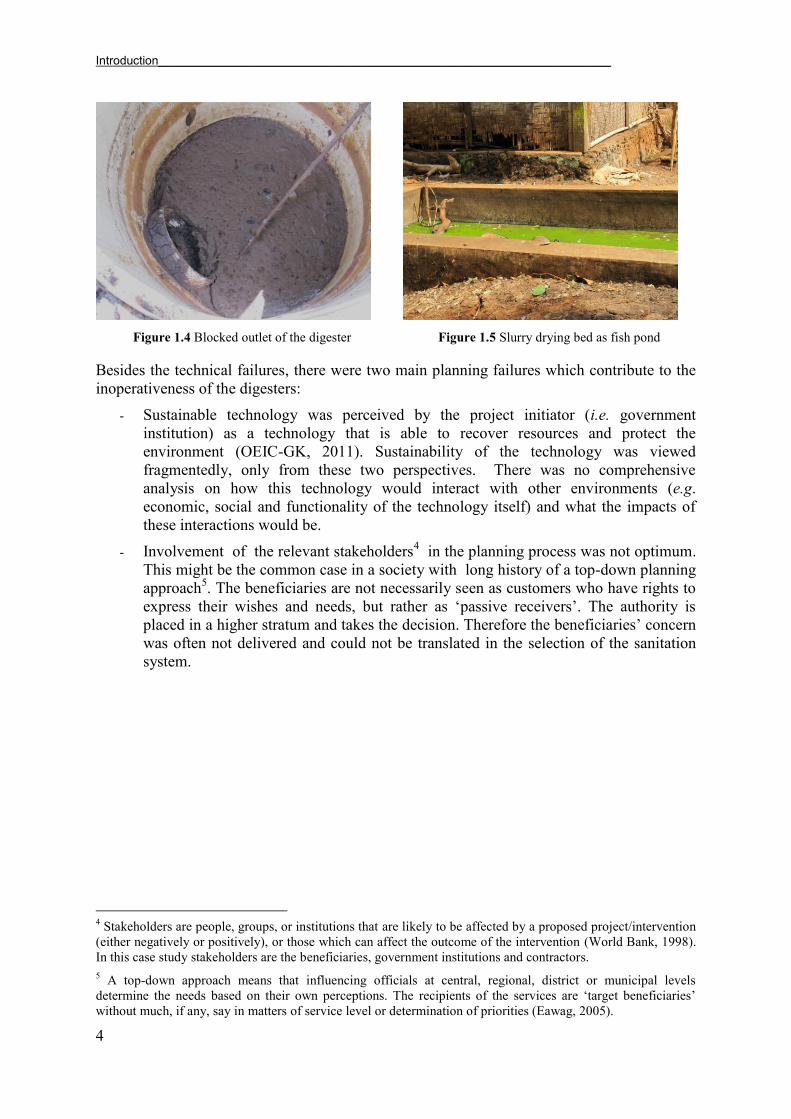
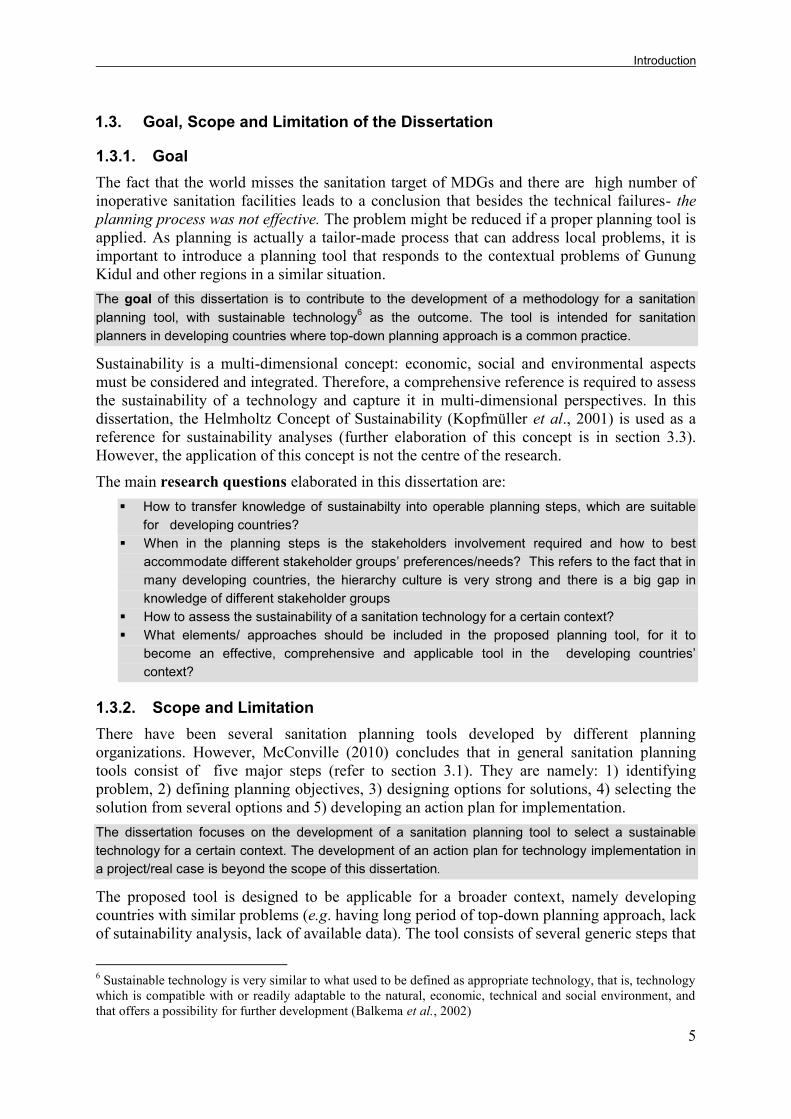
On the other hand several sanitation facilities constructed in Bribin catchment area are currently inoperative3. Two examples of such facilities are different biodigesters to treat cattle dung in village Pucanganom, Gunung Kidul. These digesters were part of a mass program conducted by government institutions and were constructed by appointed contractors. The first digester (Figure 1.4) produced such a small amount of biogas that the beneficiary decided to discontinue its operation after four months of use. According to the beneficiary the operational cost of the digester (water and labour cost) was higher than the economic benefit gained from the use of biogas. The second digester (Figure 1.5) did not function, right from the beginning of its construction. The beneficiary was not well informed about operating a biodigester and felt the technology was an extra burden (time and manpower consumed).
3 There is no statistical data on the number of sanitation facilities which are still operating or not operating. The institutions often do not monitor the facilities after the construction phase is finished.
Introduction____________________________________________________________________
4
Figure 1.4 Blocked outlet of the digester
Figure 1.5 Slurry drying bed as fish pond
Besides the technical failures, there were two main planning failures which contribute to the inoperativeness of the digesters:
- Sustainable technology was perceived by the project initiator (i.e. government institution) as a technology that is able to recover resources and protect the environment (OEIC-GK, 2011). Sustainability of the technology was viewed fragmentedly, only from these two perspectives. There was no comprehensive analysis on how this technology would interact with other environments (e.g. economic, social and functionality of the technology itself) and what the impacts of these interactions would be.
- Involvement of the relevant stakeholders4 in the planning process was not optimum. This might be the common case in a society with long history of a top-down planning approach5. The beneficiaries are not necessarily seen as customers who have rights to express their wishes and needs, but rather as ‘passive receivers’. The authority is
placed in a higher stratum and takes the decision. Therefore the beneficiaries’ concern was often not delivered and could not be translated in the selection of the sanitation system.
4 Stakeholders are people, groups, or institutions that are likely to be affected by a proposed project/intervention (either negatively or positively), or those which can affect the outcome of the intervention (World Bank, 1998). In this case study stakeholders are the beneficiaries, government institutions and contractors. 5 A top-down approach means that influencing officials at central, regional, district or municipal levels determine the needs based on their own perceptions. The recipients of the services are ‘target beneficiaries’
without much, if any, say in matters of service level or determination of priorities (Eawag, 2005).
Introduction
5
1.3. Goal, Scope and Limitation of the Dissertation
1.3.1. Goal The fact that the world misses the sanitation target of MDGs and there are high number of inoperative sanitation facilities leads to a conclusion that besides the technical failures- the planning process was not effective. The problem might be reduced if a proper planning tool is applied. As planning is actually a tailor-made process that can address local problems, it is important to introduce a planning tool that responds to the contextual problems of Gunung Kidul and other regions in a similar situation. The goal of this dissertation is to contribute to the development of a methodology for a sanitation planning tool, with sustainable technology6 as the outcome. The tool is intended for sanitation planners in developing countries where top-down planning approach is a common practice.
Sustainability is a multi-dimensional concept: economic, social and environmental aspects must be considered and integrated. Therefore, a comprehensive reference is required to assess the sustainability of a technology and capture it in multi-dimensional perspectives. In this dissertation, the Helmholtz Concept of Sustainability (Kopfmüller et al., 2001) is used as a reference for sustainability analyses (further elaboration of this concept is in section 3.3). However, the application of this concept is not the centre of the research.
The main research questions elaborated in this dissertation are: How to transfer knowledge of sustainabilty into operable planning steps, which are suitable
for developing countries? When in the planning steps is the stakeholders involvement required and how to best
accommodate different stakeholder groups’ preferences/needs? This refers to the fact that in many developing countries, the hierarchy culture is very strong and there is a big gap in knowledge of different stakeholder groups
How to assess the sustainability of a sanitation technology for a certain context? What elements/ approaches should be included in the proposed planning tool, for it to
become an effective, comprehensive and applicable tool in the developing countries’
context?
1.3.2. Scope and Limitation There have been several sanitation planning tools developed by different planning organizations. However, McConville (2010) concludes that in general sanitation planning tools consist of five major steps (refer to section 3.1). They are namely: 1) identifying problem, 2) defining planning objectives, 3) designing options for solutions, 4) selecting the solution from several options and 5) developing an action plan for implementation. The dissertation focuses on the development of a sanitation planning tool to select a sustainable technology for a certain context. The development of an action plan for technology implementation in a project/real case is beyond the scope of this dissertation.
The proposed tool is designed to be applicable for a broader context, namely developing countries with similar problems (e.g. having long period of top-down planning approach, lack of sutainability analysis, lack of available data). The tool consists of several generic steps that
6 Sustainable technology is very similar to what used to be defined as appropriate technology, that is, technology which is compatible with or readily adaptable to the natural, economic, technical and social environment, and that offers a possibility for further development (Balkema et al., 2002)

Introduction____________________________________________________________________
6
are applicable to other regions with a similar situation as Gunung Kidul. However, there is a strong need to look at the importance of the local context, when assessing the sustainability of a specific wastewater solution. Therefore each of these generic steps will be equipped with a modifiable ‘tool kit’ to conduct the analysis. These tool kits (e.g. indicators, questionnaires) take into account the local context, yet provide space for modification to other contexts. The proposed tool with its generic steps is designed to be applicable to other regions with a similar situation. Due to the need of taking into account the local context in the assessment, several of the generic steps will be equipped with a modifiable tool kit for different contexts.
Developing a planning tool is an empirical process by nature. It requires many observations on the interaction between sanitation-related stakeholders, technology and environment- as well as requires inputs from practical experience. For this reason, a study area which represents common problems mentioned in the research background was needed. Pucanganom village in Gunung Kidul, Java, Indonesia was selected as case study area (the selection criteria is described in section 5.5). This village is located in the Bribin catchment area and represents a village where the top-down planning approach with lack of sustainability assessment is common. After focusing on the in-depth study of Pucanganom, an analytical generalization regarding the tool’s application to a broader context is developed. There is an understanding that the countries’ differences (e.g. institutional and administrative structure, culture, religion and physical conditions) might influence the applicability of the tool and the result of the analysis. However, further analysis on these topics are beyond the scope of this dissertation. As the development of a planning tool needs empirical evidences, a case study is required. After focusing on the in-depth study of Pucanganom, an analytical generalization regarding the tool’s
application for a broader context is developed.
1.4. Dissertation Approach As mentioned, the research tries to contribute to solving the real sanitation planning problems in the study area by incorporating the sustainability concept. Sustainability science is integrated in this research. It is evident that in the field of sustainability studies, no single approach is able to solve the complexities of such issue (Luks and Siebenhüner, 2007). The development of this planning tool integrates knowledge from several disciplines namely sanitary engineering, social study, planning study and geography. This research can be catagorized as an interdisciplinary research, with characteristic as depicted in Table 1.1.
Table 1.1 Dissertation characteristic as an interdisciplinary research (modified from Stock and Burton, 2011)
Characteristics of interdisciplinary research Application in the dissertation
Involve multiple disciplines and knowledge shared between disciplines
The dissertation involves and shares knowledge from several disciplines, namely: - sanitary engineering: applied for wastewater technology
assessment - social study: adopted for data collection methods - planning study: required for the development of the sanitation
planning tool - geography: employed during field observation in an attempt to
understand the karst system Thematically- based with problem solving focus
The research is based on empirical evidence gained from the observations and working experience within the Integrated Water Resources Management Project Indonesia. It tries to solve the problem

Introduction
7
Characteristics of interdisciplinary research Application in the dissertation
in the real world of sanitation planning within the project frame.
Iterative research process The development of sanitation planning tool is an iterative process. Research questions, findings and contextualization are developed simultaneously within the research.
Involve stakeholders in research process
The stakeholders in wastewater sector (institutions, practitioners, plant operators, village authority and beneficiaries) were involved during the development process of the tool through interviews, discussions and questionnaires.
1.5. Dissertation Outline Chapter 2 outlines the research stages and methods of this dissertation. Having derived empirical evidence from the IWRM project experiences, data collection and data interpretation method become the prime concerns and will be elaborated in this chapter. Other methods beside data collection will be outlined in the next chapters.
Chapter 3 deals with the theoretical background of this dissertation. It provides an analysis on state-of-the-art, advantages/benefits and drawbacks of sanitation planning tools (practical framework) and methods for technology assessment (theoretical framework). Several planning tools (Open Planning of Sanitation Systems, Household-Centered Environmental Sanitation, CLUES and Sanitation 21) and technology assessment methods (Life Cycle Analysis, Economic-Based Analysis, System Analysis and Multi-Criteria Analysis) are reviewed to provide the framework for further analysis. The Helmholtz Concept of Sustainability as a reference for sustainability analysis and its application are discussed as well.
Chapter 4 delivers the results of the dissertation: the proposed sanitation planning tool. Complete steps of the tool will be presented in a table. The planning tool is equipped with several ‘tool kits’ such as one set of indicators for assessing sustainability of sanitation
development, one set of household questionnaires and one set of sustainability-based technology assessment indicators.
Chapter 5 provides insight on special characteristic of karst area and vulnerability analysis in Bribin’s catchment area. It also outlines the criteria for selecting the case study area and the arguments for selecting Pucanganom village as the case study area.
Chapter 6 to 10 comprise the detail steps of the planning tool and the implementation in the case study level. Chapter 6 outlines the first step of the tool: stakeholders and policy analysis. The second step, distance-to-target analysis will be discussed in Chapter 7. Chapter 8 elaborates the result of the examination of physical and socio-economic conditions in the study area. Chapter 9 discusses the next step: contextualization of the technology assessment indicators for the case study. Chapter 10 comprises of the sustainability-based technology assessment with its application.
Chapter 11 delivers a conclusion, which summarizes the outcomes of the dissertation and future research perspectives.
Table 1.2 provides the outline of the dissertation.

Introduction____________________________________________________________________
8
Table 1.2 Dissertation outline
Chapter 1 Problem definition Goal, scope and dissertation’s
limitation Dissertation approach
Chapter 2 Research stages Research methodology
Chapter 3 Theoretical background
Sanitation planning tools
Sustainability-based technology assessment
The Helmholtz Concept of Sustainability
Indicators: requirements and applicabilities
Results
Chapter 4 Introduction to the new planning tool: SusTA The 5 generic steps and toolkits of SusTA
Detail steps of SusTA in its application in the case study of Pucanganom
Chapter 5 Considerations and criteria in selecting a study area (for SusTA development process and application)
Overview of the study area: Pucanganom village
Chapter 6 Step 1 of SusTA: Stakeholders and policy analysis in the region
Chapter 7 Step 2 of SusTA: Distance- to- target analysis in the region
Chapter 8 Step 3 of SusTA: Examination of physical and socio-economic conditions in the project area
Chapter 9 Step 4 of SusTA: Contextualization of technology assessment process in the project area
Chapter 10 Step 5 of SusTA: Sustainability-based technology assessment in the project area
Chapter 11 Summary of the research Future research perspectives

Research Methodology
9
2. Research Methodology Chapter 2 presents the research stages and methodological framework applied for the development of the sanitation planning tool. The methodology described in this chapter is limited to the data collection methods. Other specific methods such as the selection of a study area are described in Chapter 5 and the methods for selection of indicators are elaborated in Chapter 7 and 9.
2.1. Research Stages Developing a sanitation planning tool is an explorative research. There are no fixed stages and standardized methods for this exploration. For this dissertation, the exploration was conducted in several stages as explained below. However, the numbering under each stage does not firmly represent the order of activities. It is an iterative process- and therefore some activities, particularly in the second stage, were conducted parallelly.
First stage. Problem definition and formulation of research questions: 1. Problem identification in sanitation sector at the global- and local scale 2. Critical review of the existing sanitation planning tools: their applicability, strengths
and weaknesses 3. Comparison of different methods of sustainability assessment (e.g. multi-criteria,
single-criteria analysis) 4. Synthesizing sustainability-based technology assessment indicators from scientific
publications
Second stage. Development of the sanitation planning tool: 1. Selection of a case study area 2. Data collection and analysis at the case study level 3. Identifying stakeholders’ roles and their level of involvement in decision making
processes 4. Developing background indicators for distance-to-target analysis 5. Developing indicators for sustainability-based technology assessment 6. Integrating stakeholders in the decision making tool 7. Developing a complete sanitation planning tool
Third stage. Application of the sanitation planning tool to the case study:
1. Contextualization of the sanitation planning tool for Pucanganom case 2. Providing analytical generalization of the tool for cases with conditions similar to
Pucanganom 3. Analysis of the applicability, strength and weaknesses of the tool after its application
in the Pucanganom case
2.2. Primary Data Collection Methods Empirical evidences or the records of researcher’s direct observation and experience became the main data source of the research. Therefore, data collection and interpretation methods were crucial steps and will be elaborated in this chapter.

Research Methodology _______________________________________________________________________
10
Two types of data are used in this research (Walliman, 2006):
- Primary data: data that has been observed, experienced or recorded close to the sources
- Secondary data: data from written sources that interprets or records primary data
Due to the wide variety of information to be obtained, several types of primary data collection were employed in this research.
2.2.1. Interview Interview was selected as one of the primary data collection methods because its flexiblity and usefulness in obtaining information and opinions from a wide variety of sources. There were various types of interviews employed in order to develop the sanitation planning tool, as summarized in Table 2.1.
Table 2.1 Types and characteristics of interviews
Type of interviews Characteristics
Structured interview - Most prefered type for quantitative data - Using standardized questions which are read out loud by the
interviewer, according to an interview schedule - The answers may be in closed-format - Usually scheduled in advance at a designated time and location
outside of everyday events.
Unstructured interview - No interview can truly be considered unstructured; however, some are relatively unstructured and are more or less equivalent to guided conversations
- Using a flexible format, usually based on a question guide - The format remains the choice of the interviewer, who can allow
the interview to ‘ramble’ in order to get insights into the attitudes
of the interviewee - No closed-format questions are used
Semi-structured interview - Often the sole data source for a qualitative research project - Contains structured and unstructured sections with standardized
and open-format questions - Usually scheduled in advance at a designated time and location
outside of everyday events.
Modified from: Walliman (2006), DiCicco-Bloom and Crabtree (2006) These types of interviews were employed to obtain different types of information from various stakeholders as depicted in Table 2.2.
Depending on the interviewees’ knowledge and position in the society/institutions, the same
topic of interview can be conducted with different methods. The complete list of interviews is provided in page 163-164.
Table 2.2 Information sources (interviewees), type of information and type of interviews
Information sources Type of information Type of interview
Government institutions Institutions’ roles and interests in sanitation
development Institutions’ vision on sanitation development in
the region The meaning of sustainable technology from
institution’s perspectives
Semi-structured
Unstructured
Structuredi

Research Methodology
11
Information sources Type of information Type of interview Wastewater technology practitioners
Assessment on technologies based on practitioners’ opinion
The meaning of sustainable technology from practitioners’ perspectives
Unstructured Structuredi
Users The meaning of sustainable technology from users’ perspectives
Users’ wishes on a sanitation technology
Semi-structuredii Unstructured
Plants operators Assessment on technologies based on operators’
experience in dealing with such systems The meaning of sustainable technology from
operators’ perspectives Operators’ wishes on a sanitation technology
Unstructured Semi-structuredii Unstructured
Key person7 in the village
Framework conditions for the applicability of technologies in rural community
Unstructured
i Institutions and practitioners have better knowledge and are more familiar to the content of the discussion. They can understand the questions and express their opinion clearly. Related to their formal position in the institutions/ agency, they prefer to have interviews in formal situations (e.g. situated in the office, being tape-recorded). Considering above-mentioned facts, structured interviews were applied to obtain the information.
ii Due to their level of knowledge, users and operators need more explanation and paraphrases to understand the topic (see Appendix 2). They feel more comfortable to express their opinion in a less-formal situation (e.g. situated at home or in the plant, not being tape-recorded). Therefore semi-structured interviews were employed.
2.2.2. Questionnaire In order to have a comprehensive picture of the study area, household questionnaires were conducted in this research. The design of the questionnaire can be found in the Appendix 1 and the result of it is presented in Chapter 8. The questionnaires were used to gain insight into the following information:
- social and economic condition, - water supply condition, - current sanitation and solid waste management, - agriculture and fertilizer demand - environmental awareness
In the early stage of the research, the study area was not yet defined. Therefore the questionnaires were conducted in four villages in the southern part of Bribin catchment area: Dadapayu, Pucanganom, Bedoyo and Gombang villages. The results of these questionnaires contributed to the selection of the study area.
Due to the large number of households in the area, 355 respondents were selected from a total of 4,657 households to represent the patterns of the target population at large. The sampling method used in this research was cluster sampling. Also known as area sampling, cluster sampling is used when the population is large and spread over a large area, as is the case of the southern part of the Bribin catchment area. Rather than enumerating the whole population, it is divided into segments, and then several samples from each segments are chosen at random. According to Walliman (2006) the advantages of the cluster method are time and cost savings. However, there is a risk of missing important sub-groups and not
7 Key person is an individual who plays an important role in the community and whose voice can influence public opinion. Typically, the key persons are the village authority (head of the village and secretary of the village) or respected person in the village

Research Methodology _______________________________________________________________________
12
having complete representation of the target population. Within each village, three segments were defined and represented:
- areas with good access to water (water is available daily) - areas with medium access to water (water is available 2-3 times/week) - areas with difficult access to water (water availability is uncertain)
The questionnaires were designed to gain quantitative (e.g. water consumption, cowdung production) and qualitative data (e.g. degree of satisfaction with water provision). Therefore two types of format questions were applied:
- closed-format questions: the respondents must choose from a choice of given answers. - open-format questions: the respondents may answer in their own words and style.
Before conducting the actual questionnaires, questionnaire pre-tests were conducted using only 18 respondents (5% of the total respondents). The questionnaire was revised and adjusted based on the findings during the pre-test.
Figure 2.1 Administering a household questionnaire
The questionnaires were conducted mostly in Javanese, the mother tongue of the respondents, and partly in Indonesian, the national/formal language. They were carried out in the houses of the respondents so that the respondents would feel more comfortable, expressing their opinions. All questionnaires were conducted at the end of the rainy season (April-May) due to several reasons:
- It is the end of harvesting time. Many people do not spend much time in the field and have enough time to be interviewed.
- This period marks change of the seasons. People still have a good memory about their water situation in the rainy season, but are also prepared for the worst water situation in the dry season. Their answers to the questionnaire would reflect the annual water availability.
2.2.3. Direct Observation in the Study Area Direct observation is a supporting method to cross-check the results of questionnaires and interviews. Cross-checking is important for several reasons:

Research Methodology
13
- Sanitation is not always an easy topic to discuss. During key person interviews and household questionnaires, a barrier between the interviewer and interviewee may exist, due to which the respondents sometimes have difficulty expressing their thoughts.
- Some respondents demonstrate their understanding of a certain topic better through their actions rather than verbal communication.
In this case, observation can verify whether people act differently from what they claim or intend. Considering that Javanese people (the ethnic group of the observed) are very open to people who intend to assimilate or share experiences with them, the participant-as-observer approach was chosen for the research. In the participant-as-observer approach, the researcher engages fully in the life and activities of the observed, who is aware of his/her role (Walliman, 2006). This approach requires researchers to stay in the observed community for a certain period in order to gain the trust of the participants. In this research one month stay in the village was required.
Figure 2.2 Observation of daily activity at public stand post
During the stay, the daily life of the villagers (farmers, mothers, fathers and young people) at home and in the field were observed. This included daily activities and rhytm (Figure 2.2) related to sanitation, as well as the villagers’ perceptions on such matters. Observations were also conducted during village meetings and project workshops, in order to understand how each stakeholder group behaves and what position they take in the planning process.
2.2.4. Direct Observation in Treatment Plants During the research eight wastewater treatment plants in Yogyakarta, Bantul (Figure 2.3) and Gunung Kidul were observed. Interviews with users and operators were conducted at the sites as well. The purpose of these observations and interviews was to conduct a comparative analysis on the existing conditions of the plants, such as: plant characteristics, plant operation and maintenance related to the skill required and treatment’s effect on the surroundings (noise, odor, cleaness etc).

Research Methodology _______________________________________________________________________
14
Figure 2.3 Centralized wastewater treatment plant in Bantul
2.2.5. Data Management and Interpretation During the data collecting process, the data was documented in various ways before it was interpreted qualitatively or quantitatively. Table 2.3 summarizes the data management and interpretation methods.
Table 2.3 Data collection, management and interpretation methods
Data collection method Data management Data interpretation
Interviews During interviews, tape recorder was occasionally used (for formal, structured interviews).
In the case where the interviews were not recorded, extensive note was taken.
A standard form has been designed to record the result of the interviews.
Transcription was immediately conducted after the interviews, in order not to loose/forget the information.
Transcription was provided in the form of Microsoft Word files. It was interpreted using coding paradigmi as starting points to answer the questions related to: - Conditions: what has led to the
situation, why? - Interaction among actors: who
acted? What happened? - Strategies and tactics: which ways
of handling the situations? - Consequences: what changed?
Questionnaires After the questionnaires were conducted, all the questionnaire forms were digitalized.
Picture of the respondent and GPS coordinate of the respondent were attached in the digitalized questionnaire form.
Data was processed using statistic software SPSS and Microsoft Excel.
Direct observation in the field and the treatment plants
A field work journalii was used to record the daily observation of the researcher during one month stay in the village and during the observation in the treatment plants.
Field work journal was presented as memo-writing.

Research Methodology
15
Data collection method Data management Data interpretation
The journal contains findings, experiences and problems that arise during the field work and observations. It records ideas for cross-checking, comparison and refinement.
i after Spradley (1980) in Flick (2002)
ii after Strauss (1987) in Flick (2002)

Theoretical Background____________________________________________________________________
16
3. Theoretical Background This chapter consists of theoretical background of the research. The first part outlines state of the art of sanitation planning tools developed by several organizations/agencies, which put their emphasize on selection of sanitation technology. The second part reviews several methods applied for sustainability-based technology assessment which have been applied for water and wastewater technology. The third part discusses the applicability of Helmholtz Concept for sustainability assessment. The last part reviews water and wastewater technology assessment indicators with their application and limitation.
3.1. Sanitation Planning Tools In the real world of planning, a project implementer needs a planning tool to realize the project. Several organizations/agencies that are involved in the sanitation sector have developed planning tools, depending on their focus. Some planning tools put emphasize on changing community’s behaviour related to sanitation rather than applying sanitation technology or vice versa. Other planning tools focus on both behaviour and technology. Despite of the focus of the sanitation planning tools, in general they consist of five basic steps as concluded by McConville (2010):
Step 1: Problem Identification This step defines the context of the current situation and the scope of the problem to be addressed. It is the core of the first question in strategic planning, “Where are we now?” and identifies external and internal
factors affecting the existing sanitation structures as well as stakeholder priorities and institutional realities.
Step 2: Define Objectives This step defines a vision of the future by answering the question “Where do we want to go?” Participatory
approaches are often recommended to identify the interests and priorities of the various stakeholders, while at the same time recognizing potential conflicts and competing priorities between interest groups. The outcome of this step is generally a statement of the problem to be solved and visions of an improved future. In practice, steps 1-2 are often done together as part of the context evaluation.
Step 3: Design Options The next three steps work to answer the question of “How do we get there?” The first part of this is to
identify possible solutions. Designing options is generally a process of both brainstorming and evaluation. A wide range of ideas may be generated but the field of possible options is then narrowed down to a limited number that can be compared in the selection process.
Step 4: Selection process The selection process includes feasibility studies and a critical comparison of the potential solutions. The selection of the final solution is generally based on how well it fulfills a number of objectives related to the technical functionality, affordability and/or managerial capacities. The selection process may or may not be participatory in nature, including stakeholder input.
Step 5: Action plan for implementation This step is not explicitly stated in all planning frameworks, however it is the core outcome of the previous steps as it translates the decision process into a direct plan on how to reach the agreed objectives. The action plan is the actual planning document which details how to implement the chosen technologies and supporting capacity building exercises, including timeframes and roles and responsibilities of the stakeholders.

Theoretical Background
17
In this chapter, four sanitation planning tools which emphasize on technology selection will be reviewed based on the following questions:
What is the development’s background of such planning tool? What is the main focus of such a planning tool? How is the stakeholders involvement in this planning framework? How is the technology assessment conducted within the tool? Which criteria are
used to select the technology?
3.1.1. Open Planning of Sanitation Systems (Open Planning) Background: This planning tool was developed in 2004 by Stockholm Environment Institute funded by the EcoSanRes programme. It is intended to create and support an open and democratic sanitation planning process and is aimed at planners and implementers at project level. The Open Planning of Sanitation Systems framework is based on the Open Comparative Consequence Analysis (OCCA), developed by WRS Uppsala AB in 2000. OCCA planning is the recognition that the desired result, sustainable household sanitation, can be achieved by the utilization of different sanitation technologies. Ultimately, all factors influencing the sustainability of a sanitation system, such as local conditions, applicable regulations and user preference must guide the choice of a sanitation solution.
Focus: The Open Planning of Sanitation Systems attempts to have a cross-cutting approach in its five steps. It is important that problem identification and planning are made in a cross-cutting way, taking into consideration the opinions of as many stakeholders as possible and as early on as possible. Instead of purely focusing on technical solutions to sanitation, the tool focuses on the functionality of a sanitation system in order to supply a sustainable sanitation system.
Steps: Open Planning consists of five planning steps (Kvarnström and af Petersens 2004; Kvarnström and McConville, 2007): 1) problem identification, 2) identification and investigation of the boundary conditions for the project, 3) setting the Terms of Requirement (ToR) for a technology, 4) analysis of possible solutions and 5) selection of the most appropriate solution.
Stakeholders’ involvement:
Identification of the boundary conditions should define the technical limits of the sanitation system (geographical limits, communities served, links to water supply and agriculture), but also potentially limiting socio-economic patterns, natural environments, and political conditions. The system boundary definition is important for cost calculations, the definition of responsibilities, and for selecting a sampling point for outgoing wastewater. This step requires identification of the stakeholder groups and their roles. The development of the Terms of Requirement (ToR) and selection of technology also involves stakeholders.
Technology assessment: Similar to OCCA approach, the Open Planning framework also allows the promotion of new and innovative sanitation techniques, which is in accordance with the BAT (Best Available Technique) principle that is a part of the environmental legislation in many countries (Ridderstolpe, 2000).
Theoretical Background____________________________________________________________________
18
The terms of requirement (ToR) are used for assessing sanitation alternatives. ToR are usually set by the project facilitator together with the stakeholders, involving the local government to ensure compliance with regulations. The ToR should be comprehensive and include factors as follows:
- hygiene and disease control: the system should not cause unsanitary conditions or nuisances such as odours or insect breeding in any part of the system.
- water protection: surface water (ditches, ponds, rivers, lakes) and groundwater should be protected from nutrients, organic matter and pathogens originating from toilets and greywater/ wastewater as far as possible.
- natural resources: the consumption of natural resources (water, nutrients, land requirement and energy) should be considered
- economy: the sanitary solution chosen should be economically reasonable with regards to capital as well as recurrent costs
- reliability: the basic function requirement is that the system is technically reliable.
- user aspects: the system should fulfil basic user requirements concerning affordability, user friendliness, maintenance, reliability, comfort, privacy, and status.
- responsibility and control: operation and maintenance of a sanitation system should be organized in acceptable ways
A context-specific ToR must be identified for each setting together with the relevant stakeholders. The analysis of possible solutions is then based on how well potential technologies meet the ToR. At least three options should be presented to the stakeholders for evaluation and selection of the most appropriate solution (Kvarnström and McConville, 2007).
Open Planning:
emphasizes on cross-cutting approach, democratic planning, by involving different stakeholders in the planning process
highlights the importance of identifying the problems together with the stakeholders
underlines that the sustainability of the technology depends on the context, therefore a context-specific ToR must be indentified together with relevant stakeholders
3.1.2. Household-Centered Environmental Sanitation (HCES) Background: The Environmental Sanitation Working Group of the Water Supply and Sanitation Collaborative Council (WSSCC) developed the Household-Centred Environmental Sanitation (HCES) in 2005 as an effort towards the planning approach based on the Bellagio Principle. Lüthi (2012) stated that the Bellagio Principles were agreed upon in the year 2000 by sector experts and define that diverse stakeholders making strategic choices and decisions must be involved, that the export of waste should be minimized, that sewage and waste should be considered a resource, and that sanitation should equally pursue human dignity, human health, and the protection of the environment.
Focus: HCES is developed for an urban setting. It places the household and its neighbourhood or the community at the core of the planning process. It is designed to respond to household needs

Theoretical Background
19
and priorities, since the household is the level at which decisions on investments are made and where behavioural changes begin.
Figure 3.1 HCES Model (Source: Lüthi, 2012)
HCES considers spatial, institutional and decision-making “domains” necessary for planning
(Eawag, 2005). It recognises five organisational and geographical delimitations or domains/zones: (i) household, (ii) peri-domestic or community, (iii) ward, (iv) city, and(v) city fringe (Table 3.1). Each domain is used as the basis for analysis of stakeholder interests and factors that influence the identification of appropriate sanitation systems. Steps: The ten-step process focuses attention on issues of human dignity, local participation, holistic waste management, and solving sanitation problems close to the source (Eawag, 2005; Schertenleib, 2008). Those ten steps are: 1) request for assistance, 2) launch of the planning and consultative process, 3) assessment of current status, 4) assessment of user priorities, 5) identification of options, 6) evaluation of feasible service combinations, 7) consolidated sanitation service plans for the study area, 8) finalising consolidated sanitation service plans, 9) monitoring, internal evaluation and feedback ; and 10) implementation.
Stakeholders’ involvement:
In its ten step approach, HCES works towards the empowerment of communities to organise themselves and participate in development interventions. The workshops, focus group discussions and stakeholder meetings are accompanied by exposure activities (e.g. construction of pilot facilities or sanitation bazaars) and capacity development interventions to enable community organisations or private sector service providers to absorb and utilize future infrastructure improvements (Lüthi, 2012).
Technology assessment: HCES recommends the project implementers to review the potential and the limitations of existing technical alternatives, with special emphasis on decentralised systems at household and community levels. HCES proposed assessment criteria described as follows (Eawag, 2005):

Theoretical Background____________________________________________________________________
20
- user friendliness - environmental friendliness (including the fate of pathogens and micro-pollutants) - saving of natural resources (e.g. closing nutrient and water cycles) - removal efficiencies for different kinds of pollutants - financial requirements (capital and operational and maintenance costs) - institutional requirements - requirements for skilled labour (education and training)
HCES: Based on the concept of ‘zones’ and solving problems within the ‘zone’ nearest to where
the problems arise Emphasizes multi-actor involvement: stakeholders at households levels to municipality’s
levels, and multi-sector approach (water supply, solid waste, etc) Offers a sustainable sanitation solution by integrating the proposed solution in the lower
level (e.g. household) with the existing system in higher domain ( e.g. municipality)
3.1.3. Sanitation 21 Background: In 2006 the International Water Association (IWA) developed the Sanitation 21 tool to assist professionals in sanitation sector. The framework addresses some key failings in current approaches which result in a mismatch between the stated objectives of investments and the outcomes. The tool is specifically applied for excreta management: how could that be planned better, so that investments are more likely to generate the needed health and environmental benefits. The suggested tool is intended to be used as a starting point for recognising the complexity of the challenge in developing tailored-solution for sanitation and answering the questions of “ will it work? “ and “does it fit the purposes?” Focus: Sanitation 21 focuses on dense settlements with multi-layered sanitation needs (e.g. urban utility settings, towns and small urban settlements), rather than rural communities. It promotes an analysis of the objectives of a sanitation system across all domains of the city, including the household (other domains include the neighbourhood, city and beyond the city). This “cross-domain analysis” covers the impact behaviour of each domain, the technical
option which matches the system in domains and required management of domains- if a certain system is implemented.
Steps: Sanitation 21 has three main steps (IWA, 2006; Kvarnström and McConville, 2007): 1) defining the context, 2) identifying technical options, and 3) determining the feasibility of the options.
Stakeholders’ involvement:
Analysis of the context recognizes that different domains exist within a city. There is a recognition that the stakeholders in each of these domains will have different objectives with regards to sanitation. Stakeholders play an important role in this planning framework, since the key step in the framework is finally to select a system based on its ability to meet the objectives and management capacity defined by the stakeholders. At this stage the important questions are to determine if the management requirements match the community capacity and whether the system will work (Kvarnström and McConville, 2007).

Theoretical Background
21
Technological aspects: Sanitation 21 does not suggest a list of criteria or assessment tools to select technology, but identifies eight generalised system types as options (IWA, 2006):
- On-site dry - On-site dry with (semi-) centralised treatment - On-site dry with urine diversion - On-site semi wet (pour-flush) - On-site wet with (semi) centralised treatment - Waterborne with (pre) treatment and (semi) centralized treatment - Waterborne with (semi) centralized treatment - Waterborne with centralized treatment
Sanitation 21: Promotes an analysis of the objectives of a sanitation system across all domains of the
city
Highlights the importance of the compatibility of the technology across domains for sustainability
The key step in the framework is finally to select a system based on its ability to meet the objectives and management capacity defined by the stakeholders
3.1.4. Community-Led Urban Environmental Sanitation (CLUES) Background: CLUES is a further development of the HCES (Eawag, 2005) and is based on extensive field-level validation in seven sites around the world. Unlike HCES, the new CLUES planning approach now features a seven step participatory planning process – responding to the criticism that HCES with its ten steps was too lengthy and time-consuming. The change in terminology from household to community, reflects the importance of sanitation as a public good where communities need to be involved in selecting area-wide environmental sanitation solutions. The new approach is geared towards the community level and is meant to complement city-wide infrastructure planning approaches, e.g. Sanitation 21 by IWA (Lüthi, 2012).
Focus: CLUES has a priority on community level of urban sanitation planning for the entire sanitation value chain (toilet, storage, transport, treatment and disposal or re-use). The main characteristics of CLUES stay the same with HCES: a multi-sector and multi-actor approach accounting for water supply, sanitation, solid waste management and storm drainage and emphasizing the participation of all stakeholders from an early stage in the planning process (Lüthi et al., 2011).
Steps: CLUES consists of seven planning steps: 1) process ignition and demand creation, 2) launch of the planning process, 3) detailed assessment of the current situation, 4) prioritisation of the community problems and validation, 5) identification of service options, 6) development of an action plan and 7) implementation of the action plan.
Theoretical Background____________________________________________________________________
22
Stakeholders’ involvement: Stakeholders are involved almost in all steps of CLUES, particularly in the launching of the planning process, identifying the current problems, defining users priorities and during project implementation. Community is significantly involved in decision-making and has a high degree of control over project outcomes and design the decisions (Eawag, 2005).
Technological aspects: The selection of technology is based on consultation with experts and key stakeholders, using an informed- choice catalogue as its basis (Tilley et al., 2008). CLUES does not provide particular criteria selection for the proposed technology in its framework. It emphasizes the importance of reaching an agreement between community and local authority regarding the financial and management implications of the selected system.
CLUES: Reflects the importance of sanitation as public good, by involving community in the planning
stages together with experts The seven steps offer an effective planning process, compared to HCES Technology selection based on its financial and management implications for the community
The comparison between four sanitation planning tools is summarized in Table 3.1.
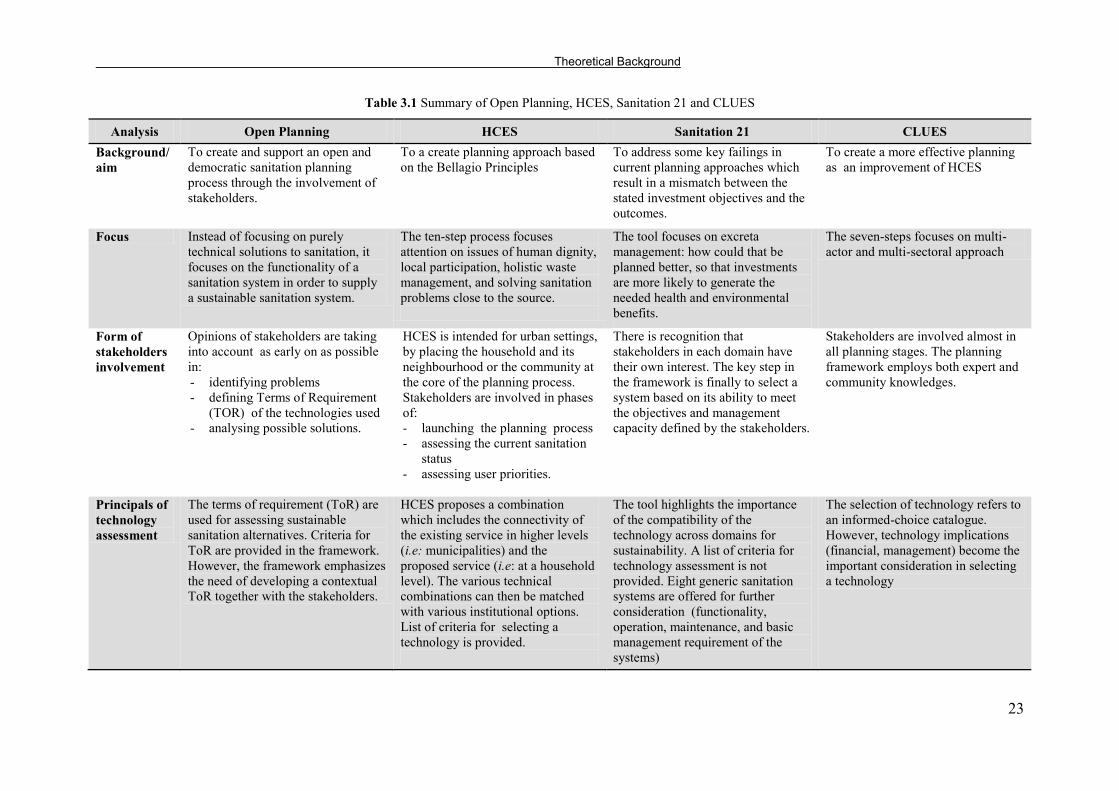
Theoretical Background
23
Table 3.1 Summary of Open Planning, HCES, Sanitation 21 and CLUES
Analysis Open Planning HCES Sanitation 21 CLUES Background/aim
To create and support an open and democratic sanitation planning process through the involvement of stakeholders.
To a create planning approach based on the Bellagio Principles
To address some key failings in current planning approaches which result in a mismatch between the stated investment objectives and the outcomes.
To create a more effective planning as an improvement of HCES
Focus Instead of focusing on purely technical solutions to sanitation, it focuses on the functionality of a sanitation system in order to supply a sustainable sanitation system.
The ten-step process focuses attention on issues of human dignity, local participation, holistic waste management, and solving sanitation problems close to the source.
The tool focuses on excreta management: how could that be planned better, so that investments are more likely to generate the needed health and environmental benefits.
The seven-steps focuses on multi-actor and multi-sectoral approach
Form of stakeholders involvement
Opinions of stakeholders are taking into account as early on as possible in: - identifying problems - defining Terms of Requirement
(TOR) of the technologies used - analysing possible solutions.
HCES is intended for urban settings, by placing the household and its neighbourhood or the community at the core of the planning process. Stakeholders are involved in phases of: - launching the planning process - assessing the current sanitation
status - assessing user priorities.
There is recognition that stakeholders in each domain have their own interest. The key step in the framework is finally to select a system based on its ability to meet the objectives and management capacity defined by the stakeholders.
Stakeholders are involved almost in all planning stages. The planning framework employs both expert and community knowledges.
Principals of technology assessment
The terms of requirement (ToR) are used for assessing sustainable sanitation alternatives. Criteria for ToR are provided in the framework. However, the framework emphasizes the need of developing a contextual ToR together with the stakeholders.
HCES proposes a combination which includes the connectivity of the existing service in higher levels (i.e: municipalities) and the proposed service (i.e: at a household level). The various technical combinations can then be matched with various institutional options. List of criteria for selecting a technology is provided.
The tool highlights the importance of the compatibility of the technology across domains for sustainability. A list of criteria for technology assessment is not provided. Eight generic sanitation systems are offered for further consideration (functionality, operation, maintenance, and basic management requirement of the systems)
The selection of technology refers to an informed-choice catalogue. However, technology implications (financial, management) become the important consideration in selecting a technology

Theoretical Background____________________________________________________________________
24
The result of this comparison reveals that all reviewed planning tools cover five basic steps (McCoville, 2010): problem identification, define objectives, design options, selection process, action plan for implementation. The main differences between the frameworks lie in the emphasis of each step and whether or not the planning framework includes action planning after the selection of technology.
In this dissertation, the proposed planning tool covers step 1-4. The proposed steps are designed to be applicable for other context (generic steps). Each step is equipped with a ’tool kit’ to
conduct the analysis.
All four sanitation planning tools acknowledge the importance of involving stakeholders, particularly beneficiaries in the decision making process. However, the level of stakeholders’ involvement varies
from one planning framework to another.
In this dissertation, stakeholders involvement is designed by taking into account the local culture, local planning approach, roles and capability of each stakeholder group. HCES approach which considers spatial, institutional and decision-making “domains” necessary for planning is adopted
in the proposed tool.
The four planning tools provide different framework to select a technology. Open Planning and HCES are equipped with a list of technology selection criteria- and Sanitation 21 and CLUES prescribe generic analysis on several sanitation systems to assist the decision makers. Although the technology selection criteria are provided by some tools, there is no clear indication of the conditions to be fulfilled in order to meet these criteria. Specifically, there is no reference to what is meant by sustainable technology in a particular context and how to comprehensively assess the sustainability of different technology options.
This dissertation offers a set of technology assessment indicators to guide the decision makers in selecting the most sustainable technology for their specific context. This indicator set (as one of the ‘tool element’) is integrated in the proposed planning tool. Each indicator is equipped with a clear indication of the conditions to be fulfilled to meet the criteria, using three scales: low-medium-high fulfillment.
3.2. Sustainability-based Technology Assessment: Shaping Technology with Respect to Sustainability Principles
The definition of Sustainable development is often quoted from the Brundtland Report (WCED, 1987): ‘development that meets the needs of the present generation without
compromising the ability of future generations to meet their own needs’. There is an overall
consensus on the following core sustainability rule (Ludwig, 1997):
- the exploitation rate of renewable resources must not be greater than their regeneration rate,
- the environmental load should not exceed the loading capacity of ecosystems, - the exploitation of non-renewable resources is to be permitted only if future
generations will not be concerned.
The U.S. National Research Council (1999) identifies three areas to be sustained, namely nature, life-support systems and community. The group furthermore highlights the three ideas that need to be developed: people, society and economy. Technology is one component used to develop people, society and economy. However, the role of technology in sustainable development is considered as ambivalent (Weaver et.al, 2000; Fleischer and Grunwald, 2002). On the one hand, technology is regarded as a problem for sustainability and as cause

Theoretical Background
25
of numerous problems of sustainability. Technology determines to a large extent the demand for raw materials and energy, accounts for transport and infrastructure, mass flows of materials, emissions as well as amount and composition of waste. On the other hand, it is also and directly considered as a solution or at least one aspect of the solution of sustainability problems. Technology is a key factor of the innovation system and influences prosperity, consumption patterns, lifestyles, social relations, and cultural developments (Fleischer and Grunwald, 2002; Grunwald, 2012). Considering this ambiguity, there is a strong need to shape technology with respect to sustainability principles in order to proof its compatibility with the society and avoid the negative effect on the society. This led to the emergence of technology assessment.
The concept of technology assessment (TA) was first introduced in the United States in the late 1960s and the Office of Technology Assessment (OTA) was established in 1969–1972.
The TA has been developed as an approach:
- to explore possible unintended and negative side-effects of technology, - to elaborate strategies for dealing with them and to provide policy advice/early
warning (Grunwald, 2012). - to develop appropriate technology to sustain future development (Ludwig, 1997)
Technology Assessment (TA) as a study has been defined by several authors as presented in Table 3.2.
Table 3.2 Definition of technology assessment
Authors Definition
Ludwig (1997) TA is a strategy that has to provide information and knowledge on technical systems. This knowledge encompasses development and application of technical systems and the connections between economic, social and political systems, and impacts on the environment.
Eriksson and Frostell (2001)
TA is the evaluation of an object, function, or sequence of functions –created by human society to assist in achieving a goal – with respect to sustainability in comparison of other solutions providing the same function(s).
Coates (2001) in Tran and Daim (2008)
TA is a policy study designed to better understand the consequences across society of the extension of the existing technology or the introduction of a new technology with emphasis on the effects that would normally be unplanned and unanticipated.
Fleischer and Grunwald (2008)
TA aims at providing knowledge and orientation for acting and decision-making concerning technology and its implementation in society. TA is mostly regarded as a contribution to shaping technology not at the level of engineering but at the level of shaping societal framework conditions for technology development like public funding of new technologies, influencing the conditions of successful diffusion of innovations, and regulatory issues.
It can be concluded that TA in the classical sense aims at comprehensiveness with regard to the consequences of the technology to be studied. The hope is that a complete record of the effects of a technology will help society to avoid unpleasant surprises during its introduction and in the automation of processes (Grunwald, 2009). There is a strong need to shape technology with respect to sustainability principles in order to proof its compatibility with the society and avoid the negative effect on the society. This led to the emergence of technology assessment. TA is aimed to provide an insight on the effects of a technology and avoid unpleasant surprises in the society.

Theoretical Background____________________________________________________________________
26
TA has been a growing field of management study for the past four decades. An increasing number of studies have been carried out over the years and research methods are developed in disciplines pertaining to the sciences and humanities. They are applied to TA problems in order to collect data, to facilitate predictions, to do quantitative risk assessment, to allow for the identification of economic consequences, to investigate social values or acceptance problems and to do eco-balancing (Grunwald, 2009).
With more complexities in the interaction of technology and sustainable development, there is a strong need to integrate a sustainability concept into TA. Some methods attempt to evaluate the sustainability of a technology in a single perspective such as Material Flow Analysis (MFA), Economic Analysis and Life Cycle Assessment (LCA).
3.2.1. Material Flow Analysis (MFA) Material Flow Analysis (MFA) is an analytical method of quantifying flows and stocks of materials or substances in a well-defined (temporal and spatial) system. The approach is based on the law of mass conservation. MFA refers to accounts in physical units- usually in terms of mass- comprising the extraction of, production, transformation, consumption, recycling and disposal of materials (e.g. substances, raw materials, base materials, products, manufactures, wastes, emissions to air, water or soil). For instance, in application for urban water system MFA includes wastewater, storm water and drinking water in one general framework where the effects of other associated systems, such as solid waste handling, may also be included when necessary (Jeppsson and Hellström, 2002). Material flow analysis provides information on the inter-linkages of different flows and their interdependencies with human activities. However, the analysis is one-dimensional in terms of evaluating sustainability since it only evaluates environmental stressors in a quantitative way. MFA does not capture other elements of environmental sustainability of a more qualitative nature, such as the changes in the environmental quality of ecosystems, loss of biodiversity and other impairments of ecological services (Pintér et al., 2005).
3.2.2. Economic Analysis Economic analysis is a one-dimensional technique incorporating only financial costs and benefits. The obvious drawback of this one dimensional is that most social and environmental costs are difficult to quantify. Indicating sustainability in monetary values has the advantage that indicators are easier to handle in decision-making. However, translating environmental and social-cultural indicators into monetary values is a part of the decision-making process as well, since it includes normative choices as determining values and weighing different indicators (Balkema, 2003).
The most common economic analysis is Cost Benefit Analysis (CBA). CBA is a systematic process for calculating and comparing benefits and costs of a technology to determine if it is a sound investment/decision and to provide a basis for comparing technologies. It involves comparing the total expected cost of each option against the total expected benefits, to see whether the benefits outweigh the costs. In order to quantify the environmental impact, Molinos-Senante et al. (2012) suggest that in applying CBA for wastewater technology assessment, the cost of a technology should include internal and external costs and benefits can be associated with the environmental damage avoided.
3.2.3. Life Cycle Assessment (LCA) Lundin and Morisson (2002) refer that Life Cycle Assessment (LCA) is an alternative approach, increasingly used in industry, is designed to evaluate and where possible reduce

Theoretical Background
27
the environmental impact for the entire life cycle of a product, process or service. An advantage with LCA is that it is a well-established, standardised method which also includes an impact assessment phase (LCIA) where potential impacts are aggregated and quantified (Lundin and Morisson, 2002; Balkema, 2003). LCA has been used for estimating environmental loads from urban water systems, usually wastewater systems (Lundin, et al., 2000). Selected LCA studies on urban water systems have revealed the importance of nutrient recycling and energy recovery (Tillman et al., 1998; Lundin et al., 2000) which are often overlooked in the general discussion on the environmental sustainability of urban water systems. LCA results provide information for decisions regarding product development and ecodesign, production system improvements, and product choice at the consumer level (Ness et al., 2007). A drawback with LCA is that it is a complex and time-consuming method. Furthermore, additional indicators are needed to indicate sustainability as LCA limits itself to environmental aspects (Balkema, 2003). A single-dimension analysis, such as: Material Flow Analysis, Economic Analysis and Life Cycle Assessment provide knowledge on a technology regarding its specific impact on energy efficiency, finance or environment. The comprehensive insight of a technology cannot be captured with these methods. However, the methods are well-established and standardised, making a comparison using the same method easier.
Despite all these single-dimension analysis, it has been observed that new technologies affect all the dimensions of sustainable development through their influence on the natural environment and on social and economic development (Huber, 2004). In addition, sustainability is context-specific and may ultimately be determined by the needs and opportunities in a given region as part of a broader spatial system. Therefore, methods that include several dimensions of sustainability, such as Multi- Criteria Analysis and System Analysis are developed.
3.2.4. Multi-Criteria Analysis Multi-Criteria Analysis (MCA) is used for assessments in situations when there are competing evaluation criteria (Ness et al., 2007). In general, MCA identifies goals or objectives and then seeks to spot the trade-offs between them; the ultimate goal is to identify the optimal policy. This approach has the advantage of incorporating both qualitative and quantitative data into the process (Wrisberg et al., 2002). Due to the fact that most technological decision-making involves multiple and conflicting objectives (e.g. minimizing risk and cost, maximizing benefit, and maximizing stakeholder preferences), MCA has the advantage of allowing the integration of several considerations (Betrie et al., 2013). The MCA methods require input data such as weights of criteria and preference of alternatives with respect to each criterion provided by decision makers. However, these data might have uncertainties because of decision makers’ judgment and subjectivity. Before informed
decisions can be made, this uncertainty must be quantified through the application of available techniques (Betrie et al., 2013).
3.2.5. System Analysis System analysis can be defined as focussing on the comparison of whole systems in a certain context/case. In the case of domestic water systems, system analysis means including water supply, use and wastewater treatment, often incorporating larger numbers of alternatives, and using a multi-dimensional set of sustainability indicators. Balkema (2003) stresses the importance of both looking at whole systems and using a multi-dimensional set of indicators for assessing sustainability. Looking at the whole system one can find integrated solutions
Theoretical Background____________________________________________________________________
28
that may not be visible when looking at smaller parts of the system. Similarly, optimising in one dimension, for instance in environmental issues, will improve this aspect of the system but may have unexpected effects in other dimensions, for instance the system may become unaffordable. By nature, system analysis is a ‘tailor-made’ method. Therefore different
system analyses are difficult to compare because the goals and scopes as well as the assumptions differ per study (Balkema, 2003). Multi-dimensional sustainability technology assessment such as Multi Criteria Analysis and System Analysis can provide a comprehensive picture of a technology by integrating several assessment methods from different fields of knowledge. Due to its nature as a ‘tailor-made’ method; the concept,
goals, scopes and assumption might vary per study, which make it hard to compare.
In this dissertation, multi-dimensional sustainability assessment is adopted. Due to the fact that a technology will affect all dimensions of sustainable development, this method becomes more suitable compared to a single-dimension analysis.
3.3. Helmholtz Concept of Sustainability: A Guidance for Sustainability Assessment
As mentioned, multi-dimensional sustainability assessments often vary from one study to another due to different concept, goals and scopes. There are many different perceptions of sustainability concepts, but they are seldom formulated or assessed very explicitly (Jennsen et al., 1997 in Hoffmann et al., 2000). In addition to that, the problem in assessing sustainability is the “missing” reference (normative basis for justification) on how to assess sustainability and which condition is considered as sustainable. Grunwald (2012) stated that there is considerable need for orientation knowledge on how to fill the guidance of sustainable development with substance conclusively as soon as it is expected to guide the transformation of societal systems. To gain practical relevance some essential criteria have to be fulfilled (Grunwald and Rösch, 2011; Grunwald, 2012):
- a clear object relation: by definition it must be clear what the term applies to and what not, and which are the subjects to which assessments should be ascribed;
- the power of differentiation: clear and comprehensible differentiations between ‘sustainable’ and ‘non- or less sustainable’ must be possible and concrete ascriptions
of these judgements to societal circumstances or developments have to be made possible beyond arbitrariness;
- the possibility to operationalize: the definition has to be substantial enough to define sustainability indicators, to determine target values for them and to allow for empirical ‘measurements’ of sustainability.
The integrative concept of sustainable development claims to meet these criteria. This concept has been developed by Kopfmüller et al. (2001) between 1997 and 1999 at the Institute for Technology Assessment and System Analysis at the Karlsruhe Research Centre which is part of the Helmholtz Association. It provides a theoretically well-founded approach to operationalize the guidance and an operable analytical tool for sustainability analyses both being applied so far in various research projects (Kopfmüller, 2006). Based on the Brundtland report with its well-known sustainability definition and on essential documents of the sustainability debate, such as the Rio Declaration or the Agenda 21, the starting point of this concept is not the several dimensions of sustainability, but three constitutive elements.

Theoretical Background
29
These three elements are (Kopfmüller et al., 2001):
- inter- and intergenerational justice, equal in weight; - the global perspective regarding goals and action strategies; and - an enlightened anthropocentric approach in the sense of the obligation of mankind to
interact cautiously with nature out of a well-understood self-interest, referring for instance to long-term preservation of nature.
These constitutive elements are operationalized further in two steps (Grunwald, 2012). First, they were “translated” into the three general goals of sustainable development:
1. securing human existence, 2. maintaining society’s productive potential (comprising natural, man-made, human,
and knowledge capital), and 3. preserving society’s options for development and action.
In a second step, these goals are concretized by sustainability principles/ rules, which apply to various societal areas or to certain aspects in the relationship between society and nature. The concept distinguishes between substantial principles, identifying minimum conditions for sustainable development that ought to be assured for all people living in present and future generations and instrumental principles, describing necessary framework conditions for the realization of the substantial minimum conditions.
On the one hand, these principles – to be further concretized by suitable indicators – unfold the normative aspects of sustainability as goal orientation for future development and as guidelines for action; on the other hand they provide criteria to assess the sustainability performance of particular societal sectors, spatial entities, technologies, policies, etc (Figure 3.2). Altogether the rules constitute the normative basis and orientation for learning processes in society as regards to sustainable development.
Figure 3.2 Architecture of the Helmholtz integrative sustainability concept (Source: Bräutigam and Gonzales, 2006, after Kopfmüller et al., 2001)
Helmholtz Concept meets the criteria as guidance for sustainable development. However, regarding its applicability for technology assessment’s guidance: Grunwald and Rösch
(2011) and Grunwald (2012) stated that the integrative sustainability concept has not been specifically developed as an instrument for technology assessment but refers to the development of society as a whole from a global perspective. In this case, technology is just
Constitutive elements
General goals
Rules
Criteria and Indicators
Local problem
operationalisation
contextualisation
Top-down approach (normative deduction)
Bottom-up approach (problem) orientation)

Theoretical Background____________________________________________________________________
30
one component of societal relations and development. Sustainability rules cannot be directly transferred into guidelines for technology design or even performance characteristics for technology. They do not refer to technological requirements but to aspects of a society’s
economy where technology is just one aspect among others. If the consequences for technology are in focus, the context has to be taken into consideration. The questions that need to be asked are:
- What are the problems relevant for sustainability in the respective field? - Which technological and societal conditions apply? - How are they connected? - How does the whole (and often quite complex) structure relate to the approach
of the whole system of sustainability rules?
Therefore sustainability rules do not have a prescriptive character for technology design (Grunwald and Rösch, 2011). The Helmholtz Concept of Sustainability is presented in Table 3.3.
Table 3.3 Helmholtz Concept of Sustainability
Goals/rules 1. Securing human existence
2. Maintaining society’s productive potential
3. Preserving society’s options for development
and action 1.1 Protection of human
health 2.1 Sustainable use of renewable resources
3.1 Equal access for all people to information, education, occupation
1.2 Ensuring satisfaction of basic needs
2.2 Sustainable use of non-renewable resources
3.2 Participation in social decision-making processes
1.3 Autonomous subsistence based on own income
2.3 Sustainable use of the environment as a sink
3.3 Conservation of the cultural heritage and diversity
1.4 Just distribution of chances for using natural resources
2.4 Avoiding technical risks with potentially catastrophic impacts
3.4 Conservation of the cultural function of nature
1.5 Reduction of extreme income and wealth inequalities
2.5 Sustainable development of man-made, human and knowledge capital
3.5 Conservation of social resources (tolerance, solidarity, etc.)
Source: Kopfmüller et al (2001)
Grunwald (2012) described the goals and rules of the Helmholtz concept (translated from Kopfmüller et al., 2001) as summarized below:
3.3.1. Securing Human’s Existence The prime necessity which can be derived from the postulate of justice is, without doubt, that the present generation shouldn’t destroy the basis of its own subsistence and that of future
generations. Fundamental preconditions for this aim are as follows:

Theoretical Background
31
Table 3.4 Substantial sustainability principles related with the general sustainability objective “Securing human existence”
Nr. Short titles Principles 1.1 Protection of human health Hazards and unacceptable risks to human health due to
anthropogenic environmental burdening must be avoided
1.2 Ensuring satisfaction of basic needs Every member of society must be assured a minimum of basic supplies (housing, food, clothing, health care) and protection against fundamental risks to life (sickness, disability).
1.3 Autonomous subsistence based on own income
All members of society must be given the possibility of securing their existence by voluntarily undertaken activities (including education of children and care of the elderly).
1.4 Just distribution of chances for using natural resources
Utilization of natural and environmental resources must be distributed according to the principles of justice and a fair participation of all persons affected.
1.5 Reduction of extreme income and wealth inequalities
Extreme inequalities in the distribution of income and wealth must be reduced.
Source: Grunwald (2012)
3.3.2. Maintaining Society’s Productive Potential Future generations should find comparable possibilities of satisfying their needs which mustn’t necessarily be identical to those of the present generation. Regarding the material needs, one can derive from this postulate the requirement that the productive capacity of (global) society has to be upheld through time – in a quite general sense – as a generic goal of sustainable development. Every generation disposes over a certain productive potential, which is made up of various factors (natural capital, real capital, human capital, knowledge capital). The minimum prerequisites for attaining this goal would be (Table 3.5):
Table 3.5 Substantial sustainability principles related with the general sustainability objective “Maintaining society’s productive potential”
Nr. Short titles Principles 2.1 Sustainable use of renewable resources The rate of utilizing renewable resources is not to exceed
the regeneration rate or endanger the ecosystems’ capability to perform and function
2.2 Sustainable use of non-renewable resources
The range of proved non-renewable resources must be maintained.
2.3 Sustainable use of the environment as a sink
The release of substances is not to exceed the absorption capacity of the environmental media and ecosystems.
2.4 Avoiding technical risks with potentially catastrophic impacts
Technical risks with potentially catastrophic impacts on humanity and the environment must be avoided.
2.5 Sustainable development of man-made, human and knowledge capital
Man-made, human, and knowledge capital must be developed in order to maintain or improve the economy’s performance.
Source: Grunwald (2012)
3.3.3. Preserving Society’s Options for Development and Action The precept of not endangering the satisfaction of future generations’ needs can, however,
not be limited to material necessities but has to include immaterial needs as well. For human existence, immaterial aspects such as integration in social and cultural relationships,

Theoretical Background____________________________________________________________________
32
communication, education, contemplation, aesthetic experiences, leisure, and recreation are just as indispensable as the material bases of subsistence and just as important. Only when these needs have also been satisfied can one speak of a stable and acceptable level of human existence. The minimum prerequisites for attaining this goal would be:
Table 3.6 Substantial sustainability principles related with the general sustainability objective “Preserving society’s options for development and action”
Nr. Short titles Principles 3.1 Equal access for all people to information,
education, occupation All members of society must have equal chances to access education, occupation, information, and public functions as well as social, political, and economic positions.
3.2 Participation in social decision-making processes
Every member of society should be given the opportunity to participate in relevant decision-making processes
3.3 Conservation of the cultural heritage and diversity
Human cultural heritage and cultural diversity must be preserved
3.4 Conservation of the cultural function of nature
Cultivated and natural landscapes or areas of special uniqueness and beauty have to be preserved
3.5 Conservation of social resources (tolerance, solidarity, etc.)
To ensure societal cohesion, the sense of legal rights and justice, tolerance, solidarity, and perception of common welfare as well as the possibility of non-violent conflict settlement must be enhanced
Source: Grunwald (2012)
The integrative approach tries to understand sustainability per definition without reducing it to merely ecological aspects and has proven the richness of the spectrum of aspects of sustainability. Due to its richness of spectrum, the concept can be applied to assess different performances of sustainability (Grunwald, 2012).
In this dissertation Helmholtz Concept of Sustainability is taken as reference for sustainability assessment. This concept is integrated in the proposed tool to assess the sustainability of sanitation-related conditions (Chapter 7) and to conduct technology assessment (Chapter 9).
3.4. Indicators’ Requirements and Applicabilities Sustainability is a multi-dimensional concept: economic, social and environmental aspects must be considered and integrated. Therefore, a comprehensive method is required to assess sustainability to be able to capture the sustainability in multi-dimensional perspectives. Among several sustainability assessment methods, indicators set is an appropriate instrument for a multi-dimensional representation.
3.4.1. Sustainability Assessment Indicators According to Ness et al. (2007) a suitable set of indicators becomes a common integral part of an assessment methodology to be used for the purposes of measuring sustainability. In order to be able to reflect the real concerns, UNDPCSD (1995) argues that sustainability indicators in general should fulfil several criteria, namely:
- based on a sound scientific basis and widely acknowledged by the scientific community
- transparent: their selection, calculation and meaning must be obvious even to non-experts
Theoretical Background
33
- relevant: they must cover crucial aspects of sustainable development - quantifiable: they should be based on existing data and/or data that is easy to gather
and to update - limited in number according to their purposes they are being used for - refer to specific targets chosen - able to indicate the success or lack of it in approaching them, and - sensitive and robust in their construction.
In the application in a real case, sustainability indicators can be used for various purposes. The most common use is to help organisations and governmental institutions track progress towards or away from sustainability (monitoring) and to set policies that will aid progress (Milman and Short, 2008). In the sense of monitoring- although absolute values may not entirely matter- a notion of what is acceptable is needed. The simplest reference point is a baseline. Baselines are starting points for measuring change from a certain state or date (ten Brink, 2007). A target is set when policy makers agree upon a specific target(s) for an issue. A meaningful reference value, a target, to measure distance from a baseline may be a standard or norm, or it can be a threshold value for something like irreversibility or the instability of a system (Rickard et al., 2007 in Moldan et al., 2011). A set of background indicators explains the sanitation-related conditions in the area. The baseline values of these indicators can help to determine where we are now and what the problems are. This information can help the decison makers decide on priorities and define specific targets. Once the baseline and target values are defined, a distance-to-target analysis can be conducted to detect the gap between baseline and target values.
The dissertation employs distance-to-target analysis as problem identification method (Step1) in the proposed sanitation planning tool. Indicators (as ‘tool kit’) are used to describe the baseline
and target values of sanitation-related conditions in the study area (see Chapter 7).
3.4.2. Sustainability-based Technology Assessment Indicators Besides monitoring the progress towards or away from sustainability, indicators can be applied for sustainability-based technology assessment. Lundin et al., (1999) pose six criteria for this type of indicators, namely:
- able to demonstrate a move towards or away from sustainability, - applicable to a broad range (type and scale) of technological systems, - have the ability to provide warning of potential problems, - amenable to existing data, - comprehensive and - cost-effective.
Balkema et al. (2002) applied sustainable indicators for assessing a wastewater treatment system and differentiated indicators into several categories:
- Functional indicators: they define the minimal technical requirements of the solution. For instance, for wastewater treatment this may be the minimal required effluent quality. Additional indicators may be adaptability (possibility to extend the system in capacity, or with additional treatment), durability (lifetime), robustness (ability to cope with fluctuations in the effluent)

Theoretical Background____________________________________________________________________
34
- Economic indicators: commonly used indicators are costs of investment, operation, and maintenance. Derived indicators are for instance affordability, cost effectiveness, and labour.
- Environmental indicators: optimal resource utilisation is the most common indicator particularly addressing water, nutrients and energy. In addition to that, required land area, land fertility, and biodiversity are several common indicators.
- Social–cultural indicators: both social and cultural indicators are hard to quantify and are therefore often not addressed, although they are proven to be important. The most common indicators are social acceptance and institutional requirement.
In assessing the sustainability of a technology, two types of data are used: quantitative and qualitative. Quantitative data have measurable features and units. The feature indicates the magnitude (how much) and the unit gives the feature its meaning (what). Since it deals with numbers, mathematical procedures can be applied to analyse the data (Walliman, 2006). Quantitative data are expressed in quantitative indicators, such as Total Suspended Solid (TSS) removal efficiency (%), investment cost (USD/household), and land requirement (m2/household). While some useful information can be obtained quantitatively or from “objective performance indices”, several important aspects of technology cannot be captured
in numbers. Although removal efficiency (%) is a useful indicator to express technology performance, the possibility for technological problems to be repaired within reasonable time also contributes to the performance. If the assessment only focuses on objective “numbers”,
other aspects of performance will be neglected, resulting in an incomplete picture of technology performance. On the other hand, unlike the quantitative indicators, qualitative indicators cannot be accurately measured or estimated. According to Whetzel and Weaton (1997), in order to reduce the subjectivity and to be comparable over time, qualitative indicators should be condensed into a rating scale. An example of rating scale is: high-moderate-low. By applying this rating scale, the qualitative measurements become semi-quantitative and can be combined with quantitative measurements in an assessment matrix. The crucial point with this rating scale is to give a clear description of each scale: how to describe what is meant by high fulfillment and low fulfillment? This clear description is important in order to give the decision makers a guideline to compare technologies with the same basis. Nevertheless, although description is provided, rating error might still occur due to the fact that the rating relies on human judgement (Whetzel and Weaton, 1997).
In assessing the sustainability of a technology, both ‘tailor-made’ qualitative and quantitative
indicators are proposed. The main problem with a set of ‘tailor-made’ indicators is that those
indicators are commonly unstandardized and incomparable (see section 3.2.4 and 3.2.5). To reduce the subjectivity, to measure the indicators accurately, and to make them comparable for other context- both types of indicators will be equipped with clear rating scales (1-3). A 1-3 scale can express technology’s degree of fulfillment to a certain indicator (low-moderate-high fulfillment). This scaling system should be transparent and robust for wastewater technology with different sizes and management scales.
In the field of wastewater technology assessment, there has been a variety of research developing sustainability assesment using indicators. They have tried to describe sustainability from different perspectives/dimensions and in different scopes, contextual or wide ranges as summarized in Table 3.7.
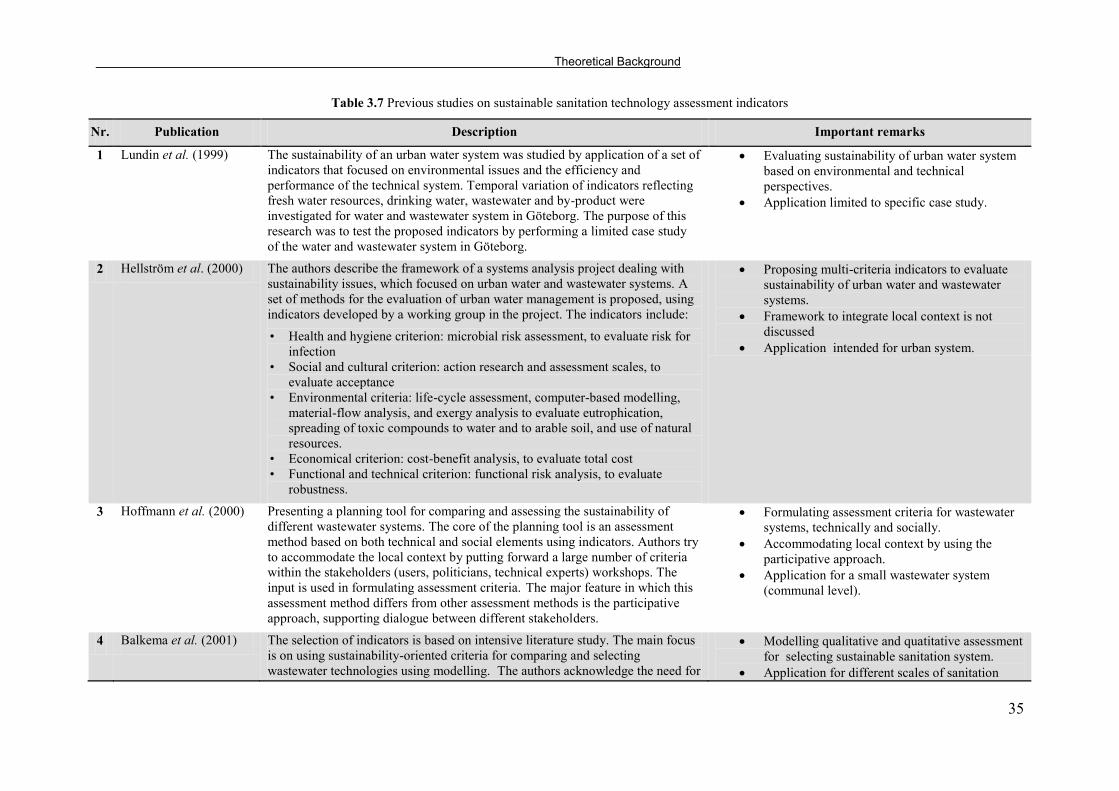
Theoretical Background
35
Table 3.7 Previous studies on sustainable sanitation technology assessment indicators
Nr. Publication Description Important remarks
1 Lundin et al. (1999) The sustainability of an urban water system was studied by application of a set of indicators that focused on environmental issues and the efficiency and performance of the technical system. Temporal variation of indicators reflecting fresh water resources, drinking water, wastewater and by-product were investigated for water and wastewater system in Göteborg. The purpose of this research was to test the proposed indicators by performing a limited case study of the water and wastewater system in Göteborg.
Evaluating sustainability of urban water system based on environmental and technical perspectives.
Application limited to specific case study.
2 Hellström et al. (2000) The authors describe the framework of a systems analysis project dealing with sustainability issues, which focused on urban water and wastewater systems. A set of methods for the evaluation of urban water management is proposed, using indicators developed by a working group in the project. The indicators include:
• Health and hygiene criterion: microbial risk assessment, to evaluate risk for infection
• Social and cultural criterion: action research and assessment scales, to evaluate acceptance
• Environmental criteria: life-cycle assessment, computer-based modelling, material-flow analysis, and exergy analysis to evaluate eutrophication, spreading of toxic compounds to water and to arable soil, and use of natural resources.
• Economical criterion: cost-benefit analysis, to evaluate total cost • Functional and technical criterion: functional risk analysis, to evaluate
robustness.
Proposing multi-criteria indicators to evaluate sustainability of urban water and wastewater systems.
Framework to integrate local context is not discussed
Application intended for urban system.
3 Hoffmann et al. (2000) Presenting a planning tool for comparing and assessing the sustainability of different wastewater systems. The core of the planning tool is an assessment method based on both technical and social elements using indicators. Authors try to accommodate the local context by putting forward a large number of criteria within the stakeholders (users, politicians, technical experts) workshops. The input is used in formulating assessment criteria. The major feature in which this assessment method differs from other assessment methods is the participative approach, supporting dialogue between different stakeholders.
Formulating assessment criteria for wastewater systems, technically and socially.
Accommodating local context by using the participative approach.
Application for a small wastewater system (communal level).
4 Balkema et al. (2001) The selection of indicators is based on intensive literature study. The main focus is on using sustainability-oriented criteria for comparing and selecting wastewater technologies using modelling. The authors acknowledge the need for
Modelling qualitative and quatitative assessment for selecting sustainable sanitation system.
Application for different scales of sanitation

Theoretical Background____________________________________________________________________
36
Nr. Publication Description Important remarks
context-specific criteria (knock-out criteria). A framework for formulating the knock-out criteria is not provided. The criteria include economic, environmental, technolog/functional, health, and sociocultural/institutional issues. In the analysis, the sustainability indicators are quantified through mass and energy balances, cost benefit analysis, and actor analysis, or indicated qualitatively. Balkema et al. (2000) questioned the applicability of Life Cycle Assessment (LCA) when analysing the sustainability of a wastewater treatment by end users and planners. According to the authors, this methodology includes some subjectivity, as there is no full consensus on the environmental impact categories.
systems. Knock-out criteria for specific context is not
provided.
5 Bracken et al. (2004) Focus mainly on using sustainability-oriented criteria for comparing and selecting sanitation technologies. The authors also acknowledge the need for context-specific criteria, which is not provided in the analysis. The criteria include economic, environmental, technology/functional, health and sociocultural/institutional issues, which later on was further developed by NETSSAF (2006).
Proposing multi-criteria analysis for sustainability assessment of sanitation technologies.
Knock-out framework is not yet proposed.
6 Palme et al. (2005) Present a study concerning sustainable development indicators (SDIs) for sludge handling and wastewater treatment systems. The study involves the indicator users (company staff and one member of the board) and researchers, in order to provide indicators that meet the needs of the company to indicate its contribution to a sustainable development. Results from a life cycle assessment, a risk assessment, an economic assessment and an uncertainty assessment were used as inputs for ranking technical options of sludge handling by use of multi-criteria analysis (MCA). The MCA included assessment of the different technical options, and aspects of sustainability and weighting. The resulting SDIs reflected
economic, environmental, technical and social aspects of sustainable development of sludge handling systems. In this case “indicator users” only
included Stockholm Water Company, as the SDIs were intended mainly for internal applications: as support for internal decision making and for management by objectives.
Using multi-criteria analysis to evaluate sludge handling and wastewater systems with weighing in the end.
Indicators selection involves intended stakeholders.
Application of indicators is for internal decicion making.
7 NETSSAF (2006) The criteria presented here were the outcome of a series of consultations and meetings of a working group in NETSSAF and are drawn from the works of various authors, with a huge emphasis on the criteria developed by Bracken et al. (2004). The criteria enable households/authorities to decide which sanitation option is most suitable given the profile of their communities. It has to be
Multi- criteria are provided to analyze sanitation technologies.
Contextualization was done by merging the criteria with information concerning framework conditions of typical settlements for a given

Theoretical Background
37
Nr. Publication Description Important remarks
emphasised that the criteria given is a non-context list of criteria. For any given situation locally relevant criteria would have to be identified from this general list. The merge of these non-context criteria with the framework conditions of typical settlements will be done after a complete list of feasible sanitation systems for the given conditions is developed.
condition. Application is intended for developing
countries, particularly Africa.
8 Muga and Mihelcic (2008)
A set of indicators that incorporate environmental, societal, and economic sustainability were developed and used to investigate the sustainability of different wastewater treatment technologies, for plant capacities of less than 5 million gallons per day (MGD), or 18.9 x 10³ m3/day.
Economic indicators selected were capital, operation and management, and user costs
Environmental indicators include energy use, because it indirectly measures resource utilization, and performance of the technology in removing conventional wastewater constituents
Societal indicators capture cultural acceptance of the technology through public participation, as well as measure whether there is improvement in the community from the specific technology through increased job opportunities, better education, or an improved local environment.
While selection of a set of indicators is dependent on the geographic and demographic context of a particular community, the overall results of this study show that there are varying degrees of sustainability with each treatment technology
Multi-criteria indicators are proposed to analyze sustainability of wastewater technologies.
Acknowledges that selection of indicators is dependent on society’s context, although each
technology already shows its different degree of sustainability.
Application is for plant capacity of less than 18.9 x 10³ m3/day.
9 Singhirunnusorn and Stenstrom (2009)
Present a comprehensive approach with factors to select appropriate wastewater treatment systems in developing countries, Thailand in particular. The study integrates the social, economic, and environmental concerns to develop a set of criteria and indicators useful for evaluating appropriate system alternatives. The authors identify seven elements crucial for technical selection: reliability, simplicity, efficiency, land requirement, affordability, social acceptability, and sustainability. Variables are organized into three hierarchical elements, namely: principles, criteria, and indicators. The study utilizes a mail survey to obtain information from Thai experts, including academicians, practitioners, and government officials, to evaluate the criteria and indicators list.
Proposing seven crucial elements to evaluate sanitation systems.
Criteria and indicators selection is based on mail surveys.
Application is for developing countries, particularly Thailand.
Theoretical Background____________________________________________________________________
38
From these literature reviews several problems related to the sustainability assessment in wastewater-related topics are captured:
- In several studies the set of indicators are very contextual and applicable only for the particular case study (Murray et al., 2009). Due to site-specific environmental, social,
and economic landscapes, indicators with the same value may have different implications in different regions. For example, it is not sufficient to measure and
compare the percentage of BOD or nutrients removed. From one watershed to another, there can be dramatic differences in the influent concentrations and in the
impact that organic and nutrient discharges have on ecosystems based on the receiving water’s assimilation capacity.
- There seems to be a general understanding that some techniques are sustainable while others are not, and that the task of researchers and technicians is to evaluate and compare different techniques. Sometimes this approach overlooks the importance of the local context, which has to be taken into account when assessing the sustainability of a specific wastewater solution (Hoffmann et al., 2000).
There is no set of indicators that are applicable for all cases. In several studies, the set of indicators are very contextual and only applicable for a particular study. In this proposed planning tool, technology assessment becomes one of its steps. The techology
assessment indicators are designed to be modifiable for other context. A reference for modification is attached to each indicator.
The general understanding regarding the sustainability of a certain type technology makes the researcher overlook the importance of taking into account the local context in the assessment. To avoid that, integrating the local context become one of the steps in the proposed tool. This
integration is expressed in the form of indicators ranking and rating scales, which are determined by local stakeholders. The ranking represents the priority of the related stakeholders, and the rating scales (i.e. indications of fulfillment) represent the expected relation of a technology with its local environments.
Sustainability-based Sanitation Planning Tool
39
4. Sustainability-based Sanitation Planning Tool This chapter presents the result of the dissertation: the sustainability-based sanitation planning tool (SusTA). A table describing the sequences of the tool is presented in this chapter, while the detailed steps of the tool and its application in the case study are described in Chapters 6 to 10.
4.1. Introduction to SusTA To overcome the researches gap (Chapter 3) and answer the research questions (Chapter 1), a methodology for a sanitation planning tool was proposed. The Sustainability-based Sanitation Planning Tool (SusTA) was developed based on the empirical evidences collected in the course of the works within the IWRM Indonesia Project. The tool is designed to assist sanitation planners/project implementers/decision makers in the developing countries to select the most sustainable sanitation technology for a given context.
The basic characteristics of SusTA are described as follows:
It puts emphasis on solving the problem comprehensively. Therefore links between planning domains (e.g. households, village, region) are analyzed in order to have a complete picture in viewing a sanitation problem. Having a complete picture is important as a basis to provide suitable measurements.
SusTA integrates the sustainability concept into the decision making process. Two sets of indicators, namely background indicators and technology assessment indicators are derived from the Helmholtz Concept of Sustainability. The first set of indicators helps to identify the problems and becomes the reference in assessing the sustainability of sanitation conditions in the region. The second set provides guidance in selecting the most sustainable technology for a certain context. By using these references, it is expected that the decision makers can take the decision based on a comprehensive perspective, not a fragmented view of sustainability.
The tool facilitates relevant stakeholders’ participation in the decision making at their best degree of involvement. Their types of involvement are proposed based on their roles, capability, and knowledge.
SusTA provides a framework for contextualization in order to achieve a sustainable sanitation system for a particular context.
SusTA has several advantages for decision makers in developing countries: it is simple and transparent in its steps, does not require a mass of data and does not need a sophisticated computational program.
4.2. The Generic Steps of SusTA This planning tool consists of five generic steps and is equipped with five modifiable tool elements (T) as depicted in Table 4.1. The five generic steps include: 1. Stakeholders and Sanitation Policy Analysis in the Region (SHA step) 2. Distance-to-target Analysis on Sustainability of Sanitation Situation in the Region (DTT step) 3. Examination of Physical and Socio-economic Conditions in the Project Area (PSE step) 4. Contextualization of Technology Assessment Process (CTX step) 5. Sustainability-based Technology Assessment (STA step)

Sustainability-based Sanitation Planning Tool______________________________________________________
40
There are two levels of analysis in the tool:
Regional-level analysis: The first and second steps (SHA and DTT steps) focus on the regional-level analysis. The scope of a ‘region’ can be interpreted differently, due to
different administrative boundaries in a country (see section 6.2). Region in this context means a higher planning domain than the project area, which influences the sanitation-related conditions (including decision making) in the project area. Due to different tasks in planning, the DTT step might become the task of a governmental planning agency (conceptor), not the task of the project implementer (refer to section 6.3.3).
Project-level analysis: The steps three to five are dealing with operational planning in the project area. All these steps (and the first step) become the main tasks of the sanitation planner or project implementer.
The details of SusTA’s generic steps and tool kits with their application will be discussed in
the next chapters (6-10).

Sustainability-based Sanitation Planning Tool
41
Table 4.1 SusTA with generic steps and tool elements R
egio
nal-l
evel
Ana
lysi
s
Prob
lem
id
entif
icat
ion 1 Stakeholders and Sanitation Policy Analysis in the Region (SHA step)
1.a Review sanitation policy and financial scheme which affect the selection of a sanitation system in the project.
1.b Identify all planning domains which relate to the project-level area.
1.c Identify the most important and influencing stakeholders which contribute to the decision making process.
Prob
lem
iden
tific
atio
n,
defin
ition
of o
bjec
tives
2 Distance-to-target Analysis on Sustainability of Sanitation Situation in the Region (DTT step)
2.a Determine the baseline and target values of the background indicators together with the relevant stakeholders identified in step 1.c.
T A set of background indicators for step 2.a is provided. The indicators describe the state of the art and targets of sanitation development in the region. *Data collection method for indicators’ values: institutional interviews and literature reviews
2.b Conduct a distance-to-target analysis. Based on this analysis, identify sustainability deficits and the problems in sanitation development in the region. The results of this identification should be considered for defining the measurements- including sanitation technology in the project area (step 5.a).
Proj
ect –
leve
l Ana
lysi
s
Des
igni
ng o
ptio
ns
3 Examination of Physical and Socio-economic Conditions in the Project Area (PSE step)
3.a Collect physical and socio-economic data which are important for sanitation planning (particularly data from intended sanitation system users, identified in 1.c).
T
A household questionnaire is one of the methods for data collection. Beneficiaries/users and key persons are involved as respondents of the questionnaires. A household questionnaire for data collection (step 3.a) is provided in Attachment 1. *Before being interviewed, respondents should receive adequate information regarding basic characteristics of technologies (e.g. through workshop or informed technologies catalog).
3.b Examine the physical and socio-economic conditions. Based on this examination, identify the technology criteria which are suitable for the area.
4 Contextualization of Technology Assessment Process (CTX step)
4.a Rank 13 technology assessment indicators based on stakeholder groups’ priorities. *Relevant stakeholders can be institutions, practitioners, beneficiaries- based on the result of step 1.c. Method for indicators ranking: separate discussion with each stakeholder group
T A set of sustainability-based technology assessment indicators (for step 4.a, 4.b, and 5.c) is provided. The set consists of 13 indicators.

Sustainability-based Sanitation Planning Tool______________________________________________________
42
4.b Develop the criteria for indicators’ rating scale together with the relevant stakeholders (identified from 1.c). The criteria describe what is meant by ‘low-medium-high fulfillment’.
T Each indicator has a rating scale (low-medium-high) to correspond to the technology’s degree of fulfillment of the indicator. However, each project area has different criteria on what is meant by ‘low-medium-high fulfillment’. References to modify these criteria (based on analytical generalization) are provided.
Sele
ctio
n pr
oces
s
5 Sustainability-based Technology Assessment (STA step)
5.a Develop a criteria to screen the suitable technologies, based on the results of analysis 2.b (distance-to-target analysis) and 3.b (examination of physical and socio-economic conditions)
T An example of technology criteria for technology pre-selection is provided (see section 10.1).
5.b Define the possible technology options and sanitation system (technology and management) for the area, based on the criteria developed in 5.a
5.c Compare (in matrixes) those sanitation system options by considering the 13 sustainability-based technology assessment indicators.
5.d Select the most sustainable sanitation system for the given context.
Remarks:
Sustainability assessment is conducted in this step Stakeholders are actively involved in this step
T Tool element is provided for this step of analysis

Selection of a Study Area
43
5. Selection of a Study Area As mentioned in Chapter 1, the aim of this dissertation is to develop a methodology for a sanitation planning tool. The development of a planning tool is an iterative process. Therefore, a real case is needed to obtain the necessary data and iterate the proposed methods. After the tool is designed, a case study serves as a real example of the application of the tool. The selection of a case study presented in Chapter 5 is not a part of the tool. This chapter provides insight on the selection method and describes the geomorphological conditions of the study area, where the tool was developed and tested.
5.1. Methods for Selection of a Study Area In the first step, selection criteria were developed (Table 5.1) in the frame of this dissertation, and further on discussed with IWRM sub projects.
Table 5.1 Criteria for selecting a study area
Criteria Considerations/remarks Geography The study area should be located in the catchment area of Bribin (IWRM
Indonesia Project), in line with the effort to protect the Bribin source. It should also be located in the service area of Bribin, in order to motivate the people to protect their water source for their own benefit. Therefore, this study area should lay in overlap/ convergence between catchment and service areas of Bribin.
Water-related conditions An area with poor sanitation and water provision is recommended, especially for the project implementation stage.
Demography The study area should be an area with relatively high population density and positive growth rate. This shows the urgency of having sanitation improvement in the future.
Cooperativeness and engagement
Developing a sanitation planning tool will require plenty of data and an iterative process. For these reasons, stakeholders’ cooperation becomes an
important factor in selecting an area. Further on, their engagement becomes a crucial factor in the implementation stage of the project as well.
Vulnerability An area with intrinsic (natural) and extrinsic (anthropogenic) vulnerability (section 5.5) is prioritized in order to optimize the protection to Bribin source.
After the criteria were defined, a field survey, done parallel with household questionnaires, was conducted in the frame of this dissertation. This intensive field survey was aimed to narrow down the options of an area to be selected, and determine a preliminary area. Further on, as validation to this preliminary selection, a vulnerability analysis (see section 5.5) and tracer test (refer to section 5.6) were conducted to determine the final decision. The process is illustrated in Figure 5.1.

Selection of a Study Area ____________________________________________________________________
44
Figure 5.1 Selection process of a study area
5.2. Karst Gunung Sewu Gunung Kidul is a regency (see section 6.1, 6.2) within the Special Province of Yogyakarta, Java, Indonesia. The water condition in this region differs from north to south. The hydrological difference is strongly influenced by the geomorphological structure of each area. According to the report by Mac Donald and Partners (1984), Gunung Kidul Regency is distinguished by three geomorphological units (Figure 5.2):
Figure 5.2 Three geomorphological structure and location of the IWRM project in Gunung Sewu (Source: IWG, 2005).
5.2.1. Zone Gunung Baturagung in the North This zone is a long, curved range at an altitude of 200 to 700 metres. The volcanic material of this hilly area mainly originated from the tertiary. To a large degree it consists of interbedded breccias, shales and tuffs, although beds of sandstones are evident in many areas. The main water sources are springs, perennial wells (6-12 m depth) and surface water (Local Planning Agency-Gunung Kidul, 2008). The relative abundance of wells indicates that within the main rock formations there is a horizon of sandstones that is either water-bearing or collecting water at the contact of the two materials. Some of the sources are already exploited by the state water enterprise and distributed through a pipeline. Nevertheless, surface water cannot supply water permanently throughout the year. Baturagung is a hilly topographic area with its
First step Second step Third step
Development of criteria for selecting a study area
Field survey to narrow down options and select a preliminary area
Vulnerability analysis and tracer test as validation of the selected area

Selection of a Study Area
45
scattered settlement structure. Due to the elevation and remoteness, villages in the north do not get any water supply from the pipeline. The main water sources are public wells and privately dug wells. Most water sources are managed independently by the people (ITAS-KIT and ASC, 2009).
Figure 5.3 Water source managed by the community in the northern part of Baturagung
5.2.2. Zone Wonosari Plateau in the Central Part This zone is rather flat (150 - 200 metres). This depression, which is crossed by the river Kali Oyo, is a karst area (lagoonal limestone) but with fewer signs of erosion compared to the related region of the Gunung Sewu. The main water sources are springs (Figure 5.4), wells (ranging from 15 - 25 meters) and surface water. The area is well-supplied by seven water sources managed by the regional water enterprise. The Wonosari Plateau has a relatively flat topography compared to area in the north and south. The settlements are more concentrated and many households already have their own private wells as the main source.
Figure 5.4 A karst spring in the border of the Wonosari Plateau and Gunung Sewu
5.2.3. Zone Gunung Sewu in the South and East Gunung Sewu (in Javanese, “A Thousand Hills”) refers to the uncountable conical hillocks (30-70 metres high, 200 metres in diameter) that resulted from the erosion of the hard reef-

Selection of a Study Area ____________________________________________________________________
46
limestone complex after the uplift of this area in the mid-Pleistocene epoch. Gunung Sewu, an area of 646 km2, administratively streches from Yogyakarta Province (Gunung Kidul Regency), Central Java Province (Wonogiri Regency) and Eastern Java Province (Pacitan Regency). Due to the limestone bedrock, water penetrates rapidly through the ground and forms underground rivers in this zone. Surface water is confined to short streamcourses active only in the wet season and feeds into sinkholes or ponded depressions locally known as telaga (Figure 5.5). This area has a hilly topography, but the settlement structure is more concentrated.
Figure 5.5 A ponded depression (telaga) in Gunung Sewu
Statistic Bureau-Gunung Kidul (2006) recorded that the total population of Gunung Kidul region is 756,025. Among this number, 63% of them live in Baturagung and Wonosari Plateau (Local Planning Agency-Gunung Kidul, 2008). The water situation in both areas are considered better than in Gunung Sewu. The demography data of the three geomorphological units is presented in Table 5.2
Table 5.2 Demography data of Gunung Kidul’s geomorphological unit
Geomorphological units
Number of villages
Area (km2) Population Population density
(inh/km2)
Growth rate (%/year)
Baturagung 44 414.79 214,624 619 0.61
Wonosari Plateau 44 310.54 265,471 960 0.97
Karst Gunung Sewu 56 698.43 270,89 388 0.54
Total 144 1485.6 756,025 602 0.66
Source: Local Planning Agency-Gunung Kidul, 2008
The annual rainfall distribution in Gunung Kidul reflects the monsoon climate with its separation into rainy and dry season (Figure 5.6). The rainy season lasts from November until April, with average monthly precipitation higher than 150 mm. The highest precipitation occurs in January, with 349 mm. Boerama (1927) in Brunsch et al. (2011) refers these months to west monsoon, which brings moist air from the sea. The dry season (May to October) refers to east monsoon, which brings dry air from Australia. The average precipitation of these months is less than 150 mm, with the lowest precipitation in August (24

Selection of a Study Area
47
mm). Despite high precipitation in Gunung Kidul, the south-eastern part of Gunung Kidul- Gunung Sewu suffers from seasonal water scarcity due to its karts structure. Precipitation rapidly infiltrates the soil and rock due to the nature of the limestones.
Figure 5.6 Distribution of annual precipitation Gunung Kidul 1952-2009
(Source: Brunsch et al., 2011)
According to Kaçaroğlu (1999), karst areas have some distinctive features: - a general lack of permanent surface streams - the existence of swallow holes/sinkholes into which surface streams sink (Figure 5.7) - the presence of underground channels (conduits or drains) in which rapid water flow
occurs, but where the boundaries are difficult to determine - the occurrence of large springs.
Figure 5.7 A newly-formed sinkhole
Therefore, surface streams are rare since the significant flow occurs underground. For this reason, a karst is always associated with underground rivers.

Selection of a Study Area ____________________________________________________________________
48
To overcome the water scarcity in Gunung Sewu, water that flows through the underground river is pumped and distributed to the people. One of the water supply projects that exploits an underground river in this area is the Bribin cave project. The first Bribin project was initiated in 1985, using a diesel pump. Due to high operational costs, the pump cannot be operated for 24 hours nor can it supply large coverage. The second Bribin project Bribin Sindon, named after its location, uses microhydro power. This project is expected to improve the water supply condition for approximately 70,000 inhabitants in the area (IfG, 2004).
The increase in the amount of water supplied in the region will lead to the increase of wastewater as well. Karst aquifers are particularly vulnerable to contamination. Due to thin soils, flow concentration in the epikarst8, and point catchment via swallow holes, contaminants can easily reach the groundwater, where they may be transported rapidly in karst conduits over large distances. The occupation time of contaminants are often short, therefore processes of contaminant attenuation are usually not effective in karst systems (
Figure 5.8). Consequently, karst aquifers need special protection (Andreo et al., 2005).
Figure 5.8 Possible pollution spread in karst system
(Source: http://mostateparks.com/page/54996/general-information)
Due to the fact that water from the underground river in Bribin is extracted and distributed to many people in its service area, there is an urgent need to protect the source in order to deliver a good water quality. Protection should start in the catchment area of Bribin, where the water enters the underground river system. For this reason, the field research within the dissertation was concentrated in the catchment area.
8 The epikarst (also known as the subcutaneous zone) comprises highly weathered carbonate bedrock immediately beneath the surface or beneath the soil (when present) or exposed at the surface (Williams, 2008)

Selection of a Study Area
49
5.3. Bribin Catchment Area In contrast to non-karst hydrology with surface rivers that have readily definable catchment boundaries and catchment areas, the catchment boundaries of the karst area are difficult to determine (Jenning, 1985 in Sunkar, 2008). The comparison between catchment area in surface and sub-surface drainage is presented in Figure 5.9.
Figure 5.9 Comparison of catchment area in surface drainage (top picture) and unknown catchment in sub-
surface drainage (Source: Adji and Sudarmadji, 2008)
The study to determine the Bribin catchment area boundary was conducted by the Faculty of Forestry, Gadjah Mada University, in 1993 (Adji and Sudarmadji, 2008). Based on this study,

Selection of a Study Area ____________________________________________________________________
50
the catchment area was defined. It is approximately 143 km2 and administratively lies in Yogyakarta Province and Central Java Province, within three geomorphological structures (Baturagung, Wonosari Plateau and Gunung Sewu). The research was initially aimed to give perspective related to the conservation of the Bribin surface catchment area, in terms of re-vegetation action. Consequently, the team decided to first introduce the exact area of the watershed since this research required the total area for plantation in km2. A geomorphological approach was later conducted to define the boundary of the watershed, as illustrated in Figure 5.10. In addition, this research investigated the underground river system that connects to the main Bribin River. Thirty-nine caves were mapped and tracer techniques were also carried out.
Figure 5.10 Bribin catchment area by Faculty of Forestry, Gadjah Mada University
(Source: Adji and Sudarmadji, 2008)
5.4. Field Study and Findings In the frame of this dissertation, a field study was conducted in the overlap of the Bribin catchment and service areas. It was identified that some areas within two administrative villages- Dadapayu and Pucanganom, are located in this overlap. Based on its fulfillment to the selection area criteria, village Pucanganom was preliminarily selected to be the study area as depicted in Table 5.3.

Selection of a Study Area
51
Table 5.3 Fulfillment of Pucanganom Village to selection criteria
Criteria Fulfillment
Geography Located in the catchment and service area of Bribin
Water-related conditions
Wastewater and waste are poorly managed. Blackwater is partially pre-treated and greywater is discharged freely to the environment. Cowdung and solid waste are not properly managed, washed by heavy rainfall to a sinkhole nearby.
Demography Characterized by high density settlements, with a population density of 363 inhabitants/km2
Cooperativeness and engagement
The stakeholders are very cooperative and engaged. They are willing to share any kind of information and assist in the data gathering process.
Vulnerability A sinkhole is located in the middle of the settlements, in effect an entry point of the waste and wastewater to the underground system.
Other remark Pucanganom represents a society with a top-down planning approach. The authority from higher administrative level and village leaders are very dominant in decision making. From surveys, it was found that many sanitation facilities in the village, which were constructed by the government, became inoperative after a certain period. This demonstrates the necessity of having a proper planning tool in the region.
For further validation of this finding, karst vulnerability study and tracer test were conducted in the village.
5.5. Karst Vulnerability Study and Findings Karst areas are often very large. It is thus impossible to demand maximum protection for the entire system since the resulting land-use restrictions would not be acceptable in many cases. It is consequently essential to protect at least those areas which are especially vulnerable to contamination. Goldschneider (2002) concludes that protection zoning for karsts is more complicated than for granular aquifers due to their highly heterogeneous conditions. Karst catchments may cover large areas (often more than 100 km2) and karst groundwater is characterised by high flow velocities (10-500 m/h). If the same criteria of groundwater protection that are applied for granular aquifers (i.e:. 50-day-line of travel time) were used for karst aquifers, the protection zones would consequently cover enormous areas. As a consequence, it is essential to protect at least those areas within a karst system where contaminants can easily reach the groundwater. In other words, the protection should be prioritized in areas which are more vulnerable to contamination than others.
The vulnerability of a given system depends on the degree of the effects exerted by the exposure to a certain type of hazard (extrinsic factor). In the context of groundwater contamination, a hazard is defined as a potential source of contamination resulting from human activities taking place mainly on the land surface (Mimi and Assi, 2009). Karst aquifer vulnerability represents a function of soil and overlying formations (natural properties) or of the aquifer’s unsaturated zone (Doerfliger et al., 1999) which can facilitate groundwater contamination with pollutants at a given moment. This is known as intrinsic karst vulnerability. Intrinsic vulnerability describes geological, hydrogeological and morphological characteristics that determine the groundwater’s permissiveness to pollution,
closely linked with human activities.
In order to find an area that is more vulnerable to domestic wastewater contamination, a vulnerability analysis was conducted by the Institute for Technology Assessment and System Analysis (Sub Project 10) within IWRM Indonesia Project. The study was conducted in the

Selection of a Study Area ____________________________________________________________________
52
overlap area between Bribin’s service area and Bribin’s catchment area, with a total area of
46 km2. This vulnerability analysis was based on three approaches:
- COP method : (C) concentration of flow, (O) overlying layers, (P) precipitation (Vías, 2006) to formulate and synchronise the physical parameters that are indicated in the study field
- a laboratory test on water samples to detect the presence of E. Coli bacteria as an indicator of fecal contamination
- a field study to identify areas with high domestic wastewater exposure
The study resulted in a specific vulnerability map for feces (Figure 5.11). Based on this vulnerability assessment, Pucanganom village was identified as a very vulnerable area for feces contamination (Heckmann, 2011).
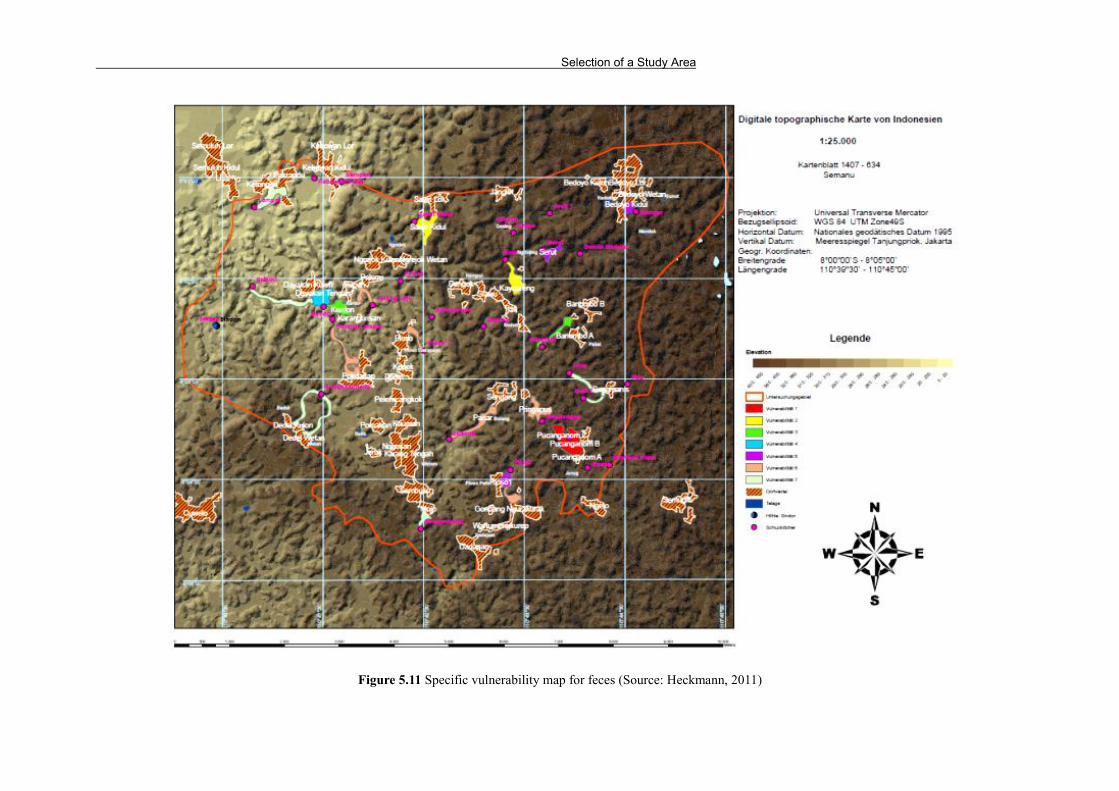
Selection of a Study Area
Figure 5.11 Specific vulnerability map for feces (Source: Heckmann, 2011)

Selection of a Study Area ____________________________________________________________________
54
5.6. Tracer Test and Findings The result of the vulnerability study was further validated by a tracer test. In village Pucanganom there is a sinkhole located in the middle of the settlements known as Kalen, or in the local language, Luweng Kalen. Surrounded by settlements in higher elevation, the sinkhole becomes an entrance point of pollutants, which are flushed to the sinkhole by heavy rainfall. The surrounding situation of the sinkhole is depicted in Figure 5.12.
Figure 5.12 Waste along the waterway to Kalen sinkhole
A tracer test was conducted by the Institute of Mineralogy and Geochemistry (Sub Project 3) supported by the ASC (speleology9 club) within the framework of the IWRM Project. It aimed to investigate the connection between Kalen sinkhole and Bribin source. The result revealed that Kalen sinkhole is connected to the Bribin Sindon source. The tracer test used a fluorescent-tracer material, uranine, which is safe for human health. Uranine can be detected at very low concentrations in the water samples using a fluorescence spectroscopy device. For practical reasons, instead of taking water samples continuously every few minutes and later analysing them in the lab with fluorescence spectroscopy, a field fluorometer device was installed in Bribin Sindon (close to the underground dam). The fluorometer is able to detect the occurence of fluorescent dye continuosly. Therefore, the temporal information is precisely recorded. At the beginning of the test, uranine was poured into a water paddle shortly after the entrance of Kalen sinkhole. Besides Bribin Sindon, there were nine other observation points as depicted in Figure 5.13.
One day later, a heavy rainfall washed the tracer into the underground stream system. The tracer was detected in Bribin Sindon source after approximately 72 hours. However, these 72 hours were measured between the entry of tracer in Kalen sinkhole and its arrival in Bribin Sindon. The actual travel period of the tracer might be shorter (Eiche et al., 2013).
9 Speleology is the scientific study or exploration of caves.
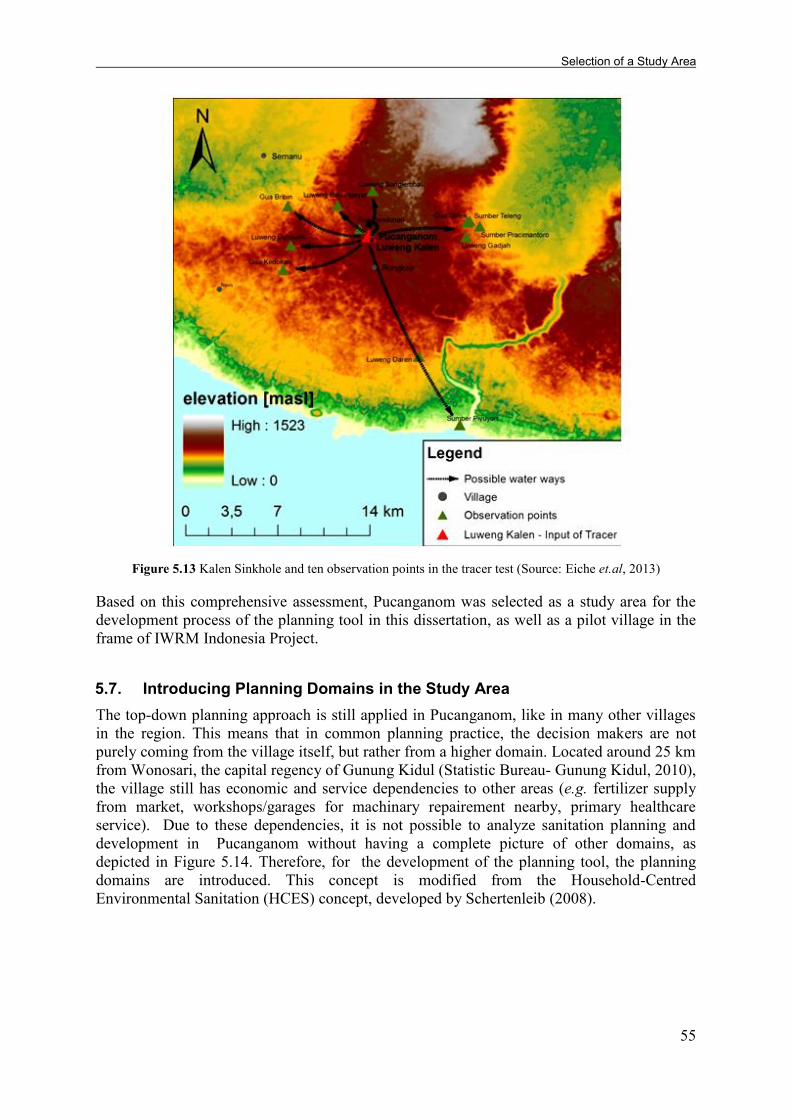
Selection of a Study Area
55
Figure 5.13 Kalen Sinkhole and ten observation points in the tracer test (Source: Eiche et.al, 2013)
Based on this comprehensive assessment, Pucanganom was selected as a study area for the development process of the planning tool in this dissertation, as well as a pilot village in the frame of IWRM Indonesia Project.
5.7. Introducing Planning Domains in the Study Area The top-down planning approach is still applied in Pucanganom, like in many other villages in the region. This means that in common planning practice, the decision makers are not purely coming from the village itself, but rather from a higher domain. Located around 25 km from Wonosari, the capital regency of Gunung Kidul (Statistic Bureau- Gunung Kidul, 2010), the village still has economic and service dependencies to other areas (e.g. fertilizer supply from market, workshops/garages for machinary repairement nearby, primary healthcare service). Due to these dependencies, it is not possible to analyze sanitation planning and development in Pucanganom without having a complete picture of other domains, as depicted in Figure 5.14. Therefore, for the development of the planning tool, the planning domains are introduced. This concept is modified from the Household-Centred Environmental Sanitation (HCES) concept, developed by Schertenleib (2008).
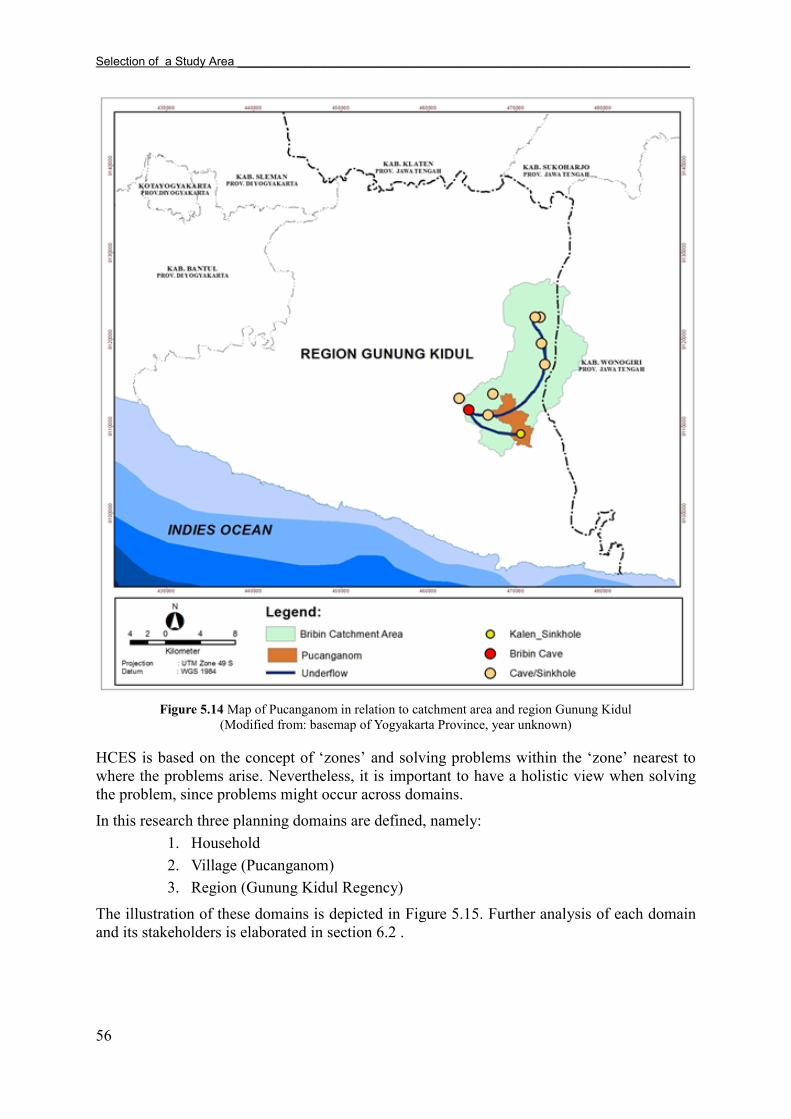
Selection of a Study Area ____________________________________________________________________
56
Figure 5.14 Map of Pucanganom in relation to catchment area and region Gunung Kidul
(Modified from: basemap of Yogyakarta Province, year unknown)
HCES is based on the concept of ‘zones’ and solving problems within the ‘zone’ nearest to
where the problems arise. Nevertheless, it is important to have a holistic view when solving the problem, since problems might occur across domains.
In this research three planning domains are defined, namely: 1. Household 2. Village (Pucanganom) 3. Region (Gunung Kidul Regency)
The illustration of these domains is depicted in Figure 5.15. Further analysis of each domain and its stakeholders is elaborated in section 6.2 .

Selection of a Study Area
57
Figure 5.15 Planning domains in the study area
In the examination of physical and socio-economic conditions (Chapter 8), three other neighboring villages: Dadapayu, Gombang, Bedoyo were included in the analysis in order to have a comprehensive picture of the situation in catchment area.
Gunung Kidul
regency
Bribin catchment area
Pucanganom
Kalen sinkhole Bribin cave Bribin Underground River
Household

Step 1 of SusTA: Sanitation Policy and Stakeholders Identification_____________________________________
58
6. Step 1 of SusTA: Sanitation Policy and Stakeholders Identification
Chapter 6 demonstrates the application of the first step of SusTA (see the box below). The first part of this chapter (6.1) briefly describes the step 1.a of the tool. The second part of this chapter (6.2) investigates the stakeholders in three planning domains: household, village and regional level, as realization of step 1.b. The last sections (6.3-6.4) identify stakeholders who play important roles in decision-making process, as decribed in step 1.c.
Step 1 Stakeholders and Sanitation Policy Analysis in the Region (SHA step) 1.a Review sanitation policy and financial scheme which affect the selection of a sanitation
system in the project. 1.b Identify all planning domains which relate to the project-level area. 1.c Identify the most important and influencing stakeholders which contribute to the decision
making process
6.1. Review of Sanitation Policy and Financial Scheme in Indonesia (Application of Step 1.a)
The Republic of Indonesia, headed by a five-year elected president, is divided into 34 provinces (provinsi). Provinces are made up of regencies (kabupaten) and cities (kota). Province, regencies, and cities have their own local governments and parliamentary bodies. A province is headed by a governor and has its own legislative body. Governors and representative members are elected by popular vote for five-year terms.
Each regency or municipality is divided into sub-districts (kecamatan). Each sub-district consits of several desa (village) or kelurahan. In Indonesia, village (desa) has a rural connotation. It is headed by "Head of Village" (kepala Desa), who is elected by popular vote. A village consists of several hamlets (dusun), and the “Head of Hamlet” (kepala dusun) is appointed by the head of sub-district and the head of village. The hierarchy of Indonesian administrative division is presented in Figure 6.1.
Figure 6.1 Hierarchy of Indonesia administrative division

Step 1 of SusTA: Sanitation Policy and Stakeholders Identification
59
For many years, Indonesia had been practising a centralized governmental system. The central government (i.e. national level), through its control of several ministries, took almost complete control over infrastructure planning, development and financing. However, after the infrastructure was constructed, its operation and maintenance were assigned to local governments (i.e. province, regency or municipality). This stark separation of responsibilities for investment and for service delivery did not foster accountability and capacity development at the local level, and, as a result, the sector experienced declining technical and financial performance despite increased capital expenditure from the late 1990s onwards (Water and Sanitation Program, 2009).
Indonesia started its policy reformation with the enactment of Law Number 22 Year 1999, by shifting from centralized to decentralized system. In 2001 the government embarked on a rapid and far-reaching decentralization process, including in the sanitation sector. The comparison of centralized and decentralized systems in the sanitation sector are summarized in Table 6.1.
Table 6.1 Comparison of sanitation development in Indonesia, before 2001 (centralized) and after 2001 (decentralized)
Aspect of sanitation development Before 2001 (centralized) After 2001 (decentralized)
Main focus Water supply only Sanitation, particularly wastewater-related issues and planning, is starting to be recognized
Perspective on sanitation
Sanitation was considered as private matter
Government takes part in sanitation development
Responsibility in planning
Highly centralized planning and development at the national level
(Full) responsibility of the local governments
Responsibility in operation and maintenance
Local governments (regency) contributed small amounts as counter-part funds for investment, but took full responsibility for operation and maintenance Lack of ownership, accountability, and capacity development
Community-based services are proven to be the most effective in rural and peri-urban areas
Consequences Inoperative facilities due to decline of technical and financial performance
Sanitation is still seen from a technical aspect only. The problem is solved partially instead of holistically
Modified after: Wibowo and Legowo (2010)
Although there are changes in the sanitation sector, Water and Sanitation Program (2009) argues that the effect of decentralization in the sanitation sector was not remarkable. After decentralization, the local government (regency and municipality) received more power from the national government. But decentralization fails to define the role of provincial and sub-district governments in sanitation development. Due to the fact that the provincial and sub-district governments do not have a significant role in sanitation program implementation, the stakeholder analysis (section 6.3) will focus on the local government (in regency-level) and stakeholders involved.
Regarding sanitation funding, the government allocates funds for community-based sanitation programs known as Sanimas. In this scheme communities are offered three models for sanitation improvement (Water and Sanitation Program, 2009; Ministry of Public Works- Republic of Indonesia, 2010):

Step 1 of SusTA: Sanitation Policy and Stakeholders Identification_____________________________________
60
- Shared (communal) septic tanks for groups of 4-5 households in a cluster. This model is designed for high density settlements with low space availabilty. In this model, the household has to build its own toilet and connect it to the septic tank;
- Enhanced communal bathing, washing and toilet block facilities for 100-200 households, including biogas capture and reuse; or
- A shallow sewer leading to a communal sewage treatment facility (usually a baffled reactor). This facility is intended for 100-200 households. For this option, the individual household provides its own toilet and connection to the sewer.
The option of models may depend on the specific conditions of the respective locations and other social or cultural preferences. In some cases, the technology option also includes biogas digester for human feces and cattle dung. The communities are guided in the selection of their preferred option. According to Water and Sanitation Program (2009) since year 2009 each of these options costs about IDR 3 million (USD 310) per household. For a typical community of 100 households, the national government of Indonesia grants the local government IDR 100 million (USD 10,300), or one third of the cost. The local government invests the balance of IDR 200 million (USD 20,700). However, the community should always invest an equivalent 2–4% (in ‘in kind’ labor) contribution to build the facilities. Non-governmental organization or donor agency contributes around 16% of the total budget. The share of budget is presented in Figure 6.2.
Figure 6.2 Share of budget in Sanimas program (Source: Mungkasa, 2010)
With the rise of sanitation awareness at the national level, the government has increased its budget allocation for sanitation in the National Mid-Term Development Plan. The budget for 2010-2014 increased 600% from the previous midterm development plan (2004-2009). The government also allocates a special budget for sanitation (Dana Alokasi Khusus), with 90% of the budget for sanitation is provided by the national government while 10% is provided by the local government (Mungkasa, 2010). Ministry of Public Works, Republic of Indonesia (2013) increases the Sanimas 2013 budget until IDR 425 million (USD 43,800) for 50-100 households. However, this is not enough to cover 49% of the Indonesian population living
Step 1 of SusTA: Sanitation Policy and Stakeholders Identification
61
without improved sanitation. Due to this budget limitation, Sanimas is prioritized for areas with specific conditions as follows (Ministry of Public Works, Republic of Indonesia 2010):
- High density urban settlement (> 700 inhabitants/km2) - Low income community - Poor infrastructures - Vulnerable (e.g. area with high cases of diarrhoea) - Recognized by institutions as an area with an urgent need for sanitation intervention - Existence of community interest to improve their sanitation condition
According to Local Planning Agency-Gunung Kidul (2010), Gunung Kidul Regency does not have a local regulation and master plan concerning wastewater treatment in the region. The regulation applied for the region refers to provincial and national-level regulation. Due to its hilly topography and scattered settlements, Local Planning Agency considered centralized treatment inappropriate for the region. Therefore the development of decentralized treatment under a Sanimas scheme is prioritized. Sanitation development in Indonesia is a relatively new issue. The paradigm-shift from “sanitation as
a private matter” to “sanitation is a government responsibility” just begun in 2001. The priority for
sanitation development is currently given to low-income urban areas with high population density (>700 inhabitants/km2).
From the national policy review, it is clear that after implementing a decentralized system, sanitation development has shifted from single control to a distribution of responsibility, which requires involvement of stakeholders in different planning domains.
6.2. Identification of Planning Domains (Application of Step 1.b) Adopting the approach of Household-Centered Environmental Sanitation (Schertenleib, 2008) the stakeholders identification in this study is conducted in three planning zones/domains: local (regency), village and household. These three domains are the most influencing and influenced domains in sanitation development. The simplification of the administrative hierarchy into planning domain in sanitation development is presented in Figure 6.3.
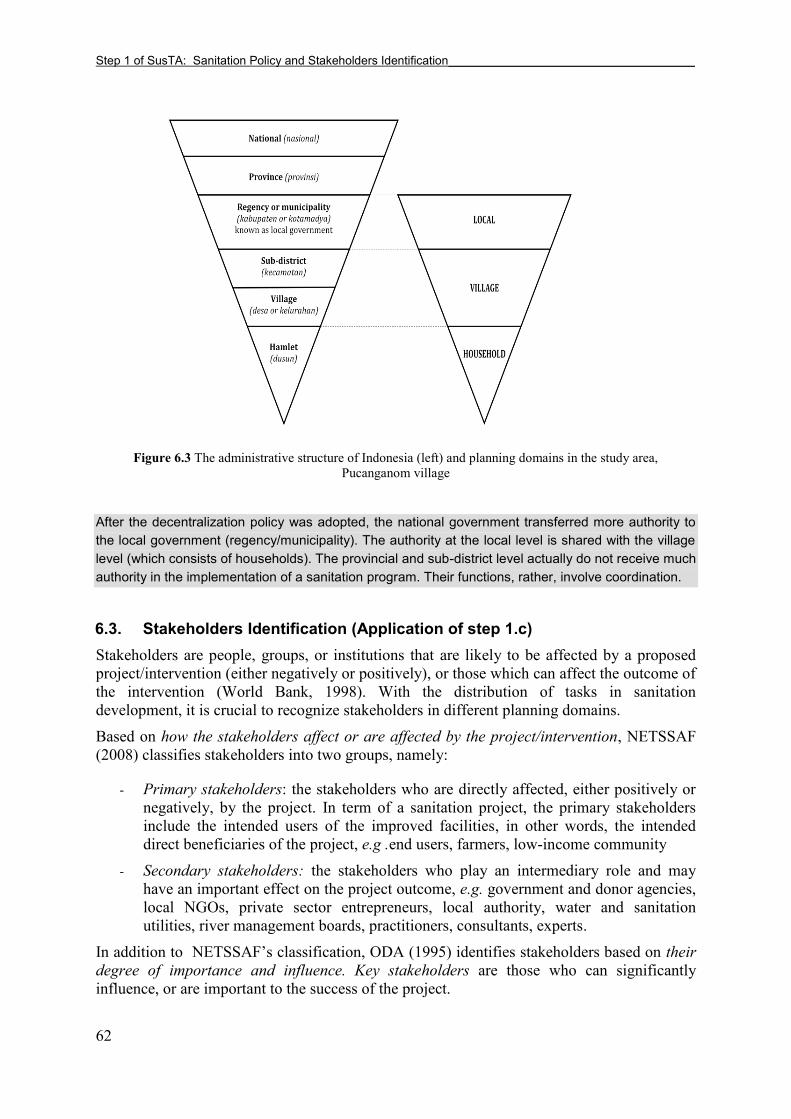
Step 1 of SusTA: Sanitation Policy and Stakeholders Identification_____________________________________
62
Figure 6.3 The administrative structure of Indonesia (left) and planning domains in the study area,
Pucanganom village
After the decentralization policy was adopted, the national government transferred more authority to the local government (regency/municipality). The authority at the local level is shared with the village level (which consists of households). The provincial and sub-district level actually do not receive much authority in the implementation of a sanitation program. Their functions, rather, involve coordination.
6.3. Stakeholders Identification (Application of step 1.c) Stakeholders are people, groups, or institutions that are likely to be affected by a proposed project/intervention (either negatively or positively), or those which can affect the outcome of the intervention (World Bank, 1998). With the distribution of tasks in sanitation development, it is crucial to recognize stakeholders in different planning domains.
Based on how the stakeholders affect or are affected by the project/intervention, NETSSAF (2008) classifies stakeholders into two groups, namely:
- Primary stakeholders: the stakeholders who are directly affected, either positively or negatively, by the project. In term of a sanitation project, the primary stakeholders include the intended users of the improved facilities, in other words, the intended direct beneficiaries of the project, e.g .end users, farmers, low-income community
- Secondary stakeholders: the stakeholders who play an intermediary role and may have an important effect on the project outcome, e.g. government and donor agencies, local NGOs, private sector entrepreneurs, local authority, water and sanitation utilities, river management boards, practitioners, consultants, experts.
In addition to NETSSAF’s classification, ODA (1995) identifies stakeholders based on their degree of importance and influence. Key stakeholders are those who can significantly influence, or are important to the success of the project.

Step 1 of SusTA: Sanitation Policy and Stakeholders Identification
63
- Influence refers to how powerful a stakeholder in decision-making is.
“Influence is the power which stakeholders have over a project - to control what decisions are made, facilitate its implementation, or exert influence which affects the project negatively. Power may derive from the nature of a stakeholder's organisation, or their position in relation to other stakeholders (e.g. line ministries which control budgets and other departments). Other forms of influence may be more informal (e.g. personal connections to ruling politicians).”
- Importance refers to those stakeholders whose problems, needs and interests are the priority of a sanitation project.
“Importance is distinct from influence. There will often be stakeholders, especially unorganised primary stakeholders, upon which the project places great priority (e.g. women, resource poor farmers, slum dwellers, ethnic minorities etc). These stakeholders may have weak capacity to participate in the project, and limited power to influence key decisions.”
The identification of stakeholders in a sanitation project is crucial in order to find the key actors, beneficiaries, their roles and interests, and the relations between stakeholders. The identification will have to answer the following questions (adapted after Conradin et al., 2010):
Who are the people/ groups/ institutions that are interested in sanitation improvement?
What are their roles (e.g. beneficiaries, polluter, regulator, consumers)? Who may impact or be impacted by sanitation improvement? What are their interest and concerns regarding the sanitation system10? Who has the power to influence other stakeholders or decision-makers in the
sanitation improvement project? The stakeholders identification in this analysis was based on literature review and institutional interviews. Government regulation on institutions and national policy on sanitation were reviewed in order to identify the responsible wastewater institutions. Institutional interviews were conducted in order to:
- compare what are described as tasks in the statutes, and the implementation of these tasks in the real world of planning,
- find out the roles, concerns and interests of stakeholders, - assess the relations between stakeholders and estimate their power to influence other
stakeholders
The results of stakeholders identification in the case study is summarized as follows:
10A full sanitation system is composed of the user interface of the system, the collection, on-site treatment, transport, off-site treatment and end management of human excreta, greywater, stormwater, industrial wastewater and solid waste
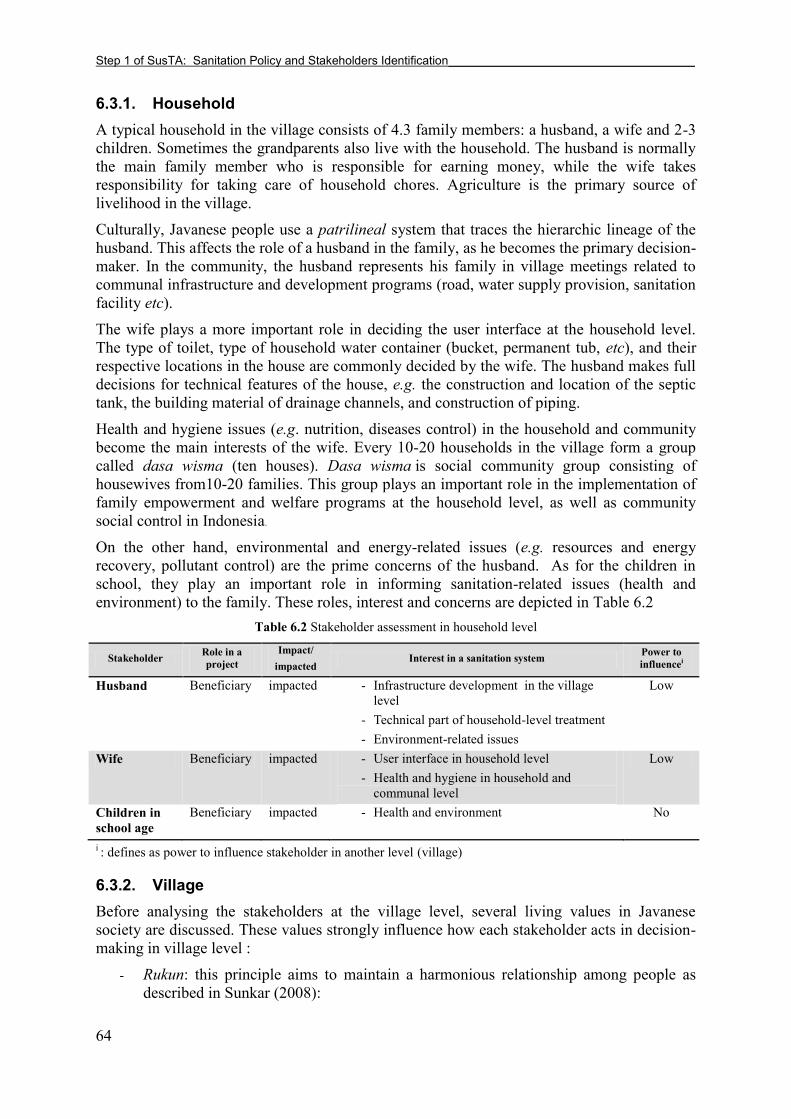
Step 1 of SusTA: Sanitation Policy and Stakeholders Identification_____________________________________
64
6.3.1. Household A typical household in the village consists of 4.3 family members: a husband, a wife and 2-3 children. Sometimes the grandparents also live with the household. The husband is normally the main family member who is responsible for earning money, while the wife takes responsibility for taking care of household chores. Agriculture is the primary source of livelihood in the village.
Culturally, Javanese people use a patrilineal system that traces the hierarchic lineage of the husband. This affects the role of a husband in the family, as he becomes the primary decision-maker. In the community, the husband represents his family in village meetings related to communal infrastructure and development programs (road, water supply provision, sanitation facility etc).
The wife plays a more important role in deciding the user interface at the household level. The type of toilet, type of household water container (bucket, permanent tub, etc), and their respective locations in the house are commonly decided by the wife. The husband makes full decisions for technical features of the house, e.g. the construction and location of the septic tank, the building material of drainage channels, and construction of piping. Health and hygiene issues (e.g. nutrition, diseases control) in the household and community become the main interests of the wife. Every 10-20 households in the village form a group called dasa wisma (ten houses). Dasa wisma is social community group consisting of housewives from10-20 families. This group plays an important role in the implementation of family empowerment and welfare programs at the household level, as well as community social control in Indonesia.
On the other hand, environmental and energy-related issues (e.g. resources and energy recovery, pollutant control) are the prime concerns of the husband. As for the children in school, they play an important role in informing sanitation-related issues (health and environment) to the family. These roles, interest and concerns are depicted in Table 6.2
Table 6.2 Stakeholder assessment in household level
Stakeholder Role in a project
Impact/ impacted
Interest in a sanitation system Power to influencei
Husband Beneficiary impacted - Infrastructure development in the village level
- Technical part of household-level treatment - Environment-related issues
Low
Wife Beneficiary impacted - User interface in household level - Health and hygiene in household and
communal level
Low
Children in school age
Beneficiary impacted - Health and environment No
i : defines as power to influence stakeholder in another level (village)
6.3.2. Village Before analysing the stakeholders at the village level, several living values in Javanese society are discussed. These values strongly influence how each stakeholder acts in decision-making in village level :
- Rukun: this principle aims to maintain a harmonious relationship among people as described in Sunkar (2008):

Step 1 of SusTA: Sanitation Policy and Stakeholders Identification
65
“Rukun means harmony, peace and quiet, without argument and unity for mutual assistance. This occurs where all parties are in harmony with each other, help each other, and accept each other with no arguments. Rukun is an ideal situation that must be maintained in all social relationships, within the family, within the community, in the village and in other organizations.”
- Ngrumangsani lan ngajeni: this principle explains that an individual must recognize his/her status in the society and behave according to his/her position (ngrumangsani). In addition, one should respect others of higher rank or status (ngajeni). Sunkar (2008) describes that this principle should avoid ambition, competition, impolite behavior, and the urge to acquire self-centered material benefits and power, which are considered to be the source of contradiction and can lead to a non-harmonious environment.
In a typical Javanese village, including the case of Pucanganom, these principles are strongly reflected in the decision-making process. In the institutional structure of the village, kepala desa (head of village) is the formal leader of the village. According to Sunkar, (2008), those who are chosen as head of village generally have a better educational background, and are often civil servants, working as teachers in the local public school or in a government office. Because they have a higher level of education and are civil servants, they have higher status. This also applies to those who work or have worked in cities, because municipality people are considered rich and of higher rank based on their economic status. As Javanese people still have a strong concept of ngajeni (to give respect), the head of the village has strong power to influence his/her people in the decision-making.
Apart from the institutional structure of the village, sesepuh desa and pak kaum are considered to have strong influence in decision-making as well. Sesepuh desa (old-wise man in the village) is normally a man who has lived in the village since he was born, knows much about the surrounding (e.g. existence of caves, springs, fertile soil) and witnesses significant events in the village (e.g. wars, nature catastrophes). He is considered to be the wisest man in the village, respected and often consulted by the villagers, including the head of the village. Since sesepuh desa has lived in the village for a long period, he tends to preserve the environment and cultural values. Pak kaum is the moslem leader in the village and is considered to have advanced knowledge in the religion. He normally leads people in prayer during special occasions, e.g. in ceremonies, weddings, giving birth. Apart from his religious duty in the society, he is one of the informal decision-makers in the village, particularly regarding issues of norms and ethics.
The roles of each stakeholder is summarized in Table 6.3. Table 6.3 Stakeholder assessment in village level
Stakeholder Role in a project
Impact/ impacted
Interest in sanitation program Power to influencei
Head of the village* (supported by secretary and head of village development section)
Official/ formal decision-maker
Impact - Assuring that his people receive maximum benefit of a sanitation program offered by the donor agency
- Assuring that the aid is equally distributed and will not raise any conflict among users
- Assuring that the technology is manageable by the people and controllable by village administrators
Strong
Sesepuh desa Informal decision-
Impact - Assuring that the principle of rukun is applied in the society during the planning
Strong

Step 1 of SusTA: Sanitation Policy and Stakeholders Identification_____________________________________
66
Stakeholder Role in a project
Impact/ impacted
Interest in sanitation program Power to influencei
maker and implementation of a sanitation project - Balancing “modern” development with
cultural values and nature conservation Pak Kaum Informal
decision- maker
Impact - Assuring that the implementation of technology and its social effect do not violate the religion
Moderate
Household* (represented by the husband)
Beneficiary Impacted - Assuring that his household and neighbouring households are selected to receive the aid
Low
i : defines as power to influence stakeholder in the same level (village) *: identified as main stakeholders in a sanitation infrastructure development project, particularly in the selection
of a technology
6.3.3. Regency/ local government At the local level (Gunung Kidul Regency) there are several institutions responsible for sanitation. However, the “institutional home” for sanitation is lacking. This is mainly because
of its multi-disciplinary and trans-sectoral character. Governments commonly deal with different aspects of sanitation systems in several ministries, and this hampers coordination, strategic planning and financing of capacity development (von Münch et al., 2012).
This institutional analysis tries to summarize the roles and interest of each governmental institution, based on interviews and regulation review. The result of this identification will be used in Chapter 7. The sanitation-related institutions in Gunung Kidul are identified as follows:
6.3.3.1. Local Planning Agency (Bappeda: Badan Perencanaan Pembangu-nan Daerah)
The tasks of the Local Planning Agency are not directly connected to implementation of water supply and wastewater-related projects. However its role cannot be neglected since this institution is responsible for the spatial planning, including water supply and wastewater infrastructure and development (Puspitasari, 2009). This institution (as regulated in Regional Act Nr. 12 Year 2008) is resposible for strategic planning, including the design, implementation, monitoring and evaluation of regional development programs. Management of research, statistics and data base on regional development becomes one of its main tasks. The institution plays an important role as a program coordinator, and acts as mediator between governmental institutions. It should synchronize all development programs proposed by different institutions. Musrenbang, which refers to the process of community discussion on local development needs, is conducted in the beginning of the year to synchronize the development of the region. Musrenbang involves governmental institutions at the local level and the stakeholders beneath.
6.3.3.2. Department of Public Works (DPU: Dinas Pekerjaan Umum) The Department of Public Works is responsible for the strategic and operational planning of physical infrastructures and their management. The department is divided into three service divisions based on the field covered:
- Irrigation Division (Bidang Pengairan) is responsible for the construction, operation and maintenance of irrigation infrastructures

Step 1 of SusTA: Sanitation Policy and Stakeholders Identification
67
- Spatial Planning and Infrastructure Division(Bidang Cipta Karya) is responsible for spatial planning of settlements and their supporting infrastructures, including water supply, solid waste and wastewater
- Road/highway Division(Bidang Bina Marga) takes the responsibility to construct, maintain and operate inland transportation infrastructures(road, highway, and bridges, excluding railway)
In the sanitation sector, Bidang Cipta Karya plays an important role in:
- The strategic planning concerning development of regulations for environmental hygiene, which includes domestic wastewater and solid waste management in the region, and a community empowerment strategy in the sanitation sector
- The operational planning concerning design, implementation, major operational and maintenance of sanitation physical infrastructure. This includes wastewater technology installed as centralized and decentralized systems and urban drainage channel.
6.3.3.3. Department of Health (Dinas Kesehatan) The Department of Health is responsible for community health and hygiene. Their tasks include disease prevention, community health service and health education (regulated by Local Act Number 11 Year 2008).
Concerning tasks related to the water sector, this department is responsible for monitoring the quality of water consumed by the people. This includes all sources of water, with a main focus on household level sources (e.g. tap water, dug well). The results of this monitoring activity will be used to control the community health status that enable the Department of Health to take appropriate action to maintain the community health. The Department of Health also delivers the result to the Local Planning Agency (Bappeda) and the Local Water Enterprise (PDAM), although it has no authority to ensure that its input is taken into consideration (Puspitasari, 2009).
In sanitation sector, the Department of Health, through their staff in Public Health Care Service (Pusat Kesehatan Masyarakat) at the sub-district and village levels, controls the sanitation and hygiene of the community. The staff (midwife and sanitarian) check the housings conditions regularly. This includes the water supply, wastewater and solid waste facility, and management at the households level. Public Health Care Service delivers health and environmental information to the community via a social community group (dasa wisma).
6.3.3.4. Office of Environmental Impact Control (Kapedal: Kantor Pengen-dalian Dampak Lingkungan)
The Office of Environmental Impact Control is an institution that is responsible for preventing, controlling, and recovering environment damages. The office monitors the quality of air (e.g. vehicle emission), water supply, domestic and industrial wastewater, sea water and soil (Marjianto, 2010). It concentrates its tasks on preventing and taking measurements of environmentally high-impact activities, e.g. industrial and farming activities. The Office of Environmental Impact Control is responsible for setting the regulation of wastewater/effluent quality standard.
In water quality monitoring, the Office of Environmental Impact Control focuses on public sources monitoring, such as open water bodies (springs, river, lakes) and public wells, while

Step 1 of SusTA: Sanitation Policy and Stakeholders Identification_____________________________________
68
the Department of Health emphasizes more on sources at the household and communal level (OEIC-GK, 2011; Department of Health -Gunung Kidul, 2011).
Regarding wastewater monitoring, the office stresses its task on industrial wastewater management and particular domestic wastewater that have been proven/identified to pollute the environment. Industries that potentially pollute the environment are obligated to deliver the report on their effluent quality every six months. Instead of evaluating, controlling and inspecting the effluent, the office “delegates” its responsibility to the industries to examine their own effluent. There is no law enforcement, however, for industries that do not provide a report or for those with effluent that exceeds the effluent quality standard (OEIC-GK, 2011; Marjianto, 2010).
6.3.3.5. Overlapping Tasks and Uncovered Responsibilities in Institutional Level
From the institutional analysis, it can be concluded that there are three main institutions responsible for sanitation development: - The Department of Public Works manages the physical development of sanitation infrastructures
- The Department of Health is involved in the capacity building of sanitation development at the community level
- The Office of Environmental Impact Control regulates wastewater in a broader scale (quality of open water body and effluent from industrial/farming activities).
However, according to Damayanti (2009), in reality many sanitation development are project-based, not long-term planning programs. Institutions can apply for a special budget allocation for a project, whenever needed. This project-based activity can cause task overlaps, but can also lead to uncovered tasks, especially in post-construction phase. For example:
- According to the regulation, Department of Public Works is responsible for constructing wastewater infrastructures. In practice, there are several wastewater treatments in Gunung Kidul constructed by different institutions under a project scheme. After the construction ends, the institution does not provide any assistance for the users (post-service, maintenance). On the other hand, Department of Public Work is responsible for maintaining only their own-built infrastructures.
- Concerning wastewater/effluent monitoring: the Department of Health concentrates its work on monitoring the sanitation facility (i.e. user interface) at the households-level. The department checks whether the facility meets the health and hygiene standard (e.g. clean, odourless, free from insect). The Office of Environmental Impact Control monitors the open water bodies and handles cases with high impact to the environment (e.g. farms and industries). Both departments will conduct the monitoring, when the budget is available. The Department of Public Work together with NGOs to control the effluent quality of the communal treatment plants they have constructed under Community-Led Total Sanitation (Sanimas) scheme. None of the institutions assure that the household-level treatment facility (septic tank) meets the national technical standard and its effluent meets the standard quality. On the other side, the region depends strongly on this household-level treatment, as this becomes the most common treatment in Indonesia.
The summary of institutional stakeholders identification is presented in Table 6.4.

Step 1 of SusTA: Sanitation Policy and Stakeholders Identification
69
Table 6.4 Institutional stakeholders identification
Stakeholder Role in the regional
level, related to sanitation
Impact/ impacted
Interest in sanitation program Power to influencei
Local Planning Agency
Coordinate sanitation-related institutions
Impact - Coherency of sanitation development with development of other sectors
Strong influence among institutions
Dept. of Public Works*
Manage the physical development of sanitation infrastructures
Impact - Sanitation development should be able to cover more people without access to sanitation
- Assuring that the public and communal treatment functions and delivers the best technical performance
Strong influence in deciding the technology options (sanitation infrastructure)
Dept. of Health Manage the capacity building of sanitation development
Impact - Sanitation development should be able to increase the health quality of the community (e.g.less water-related diseases)
- Assuring that sanitation facilities meets the health and hygiene standard
Strong influence in community empowerment (behaviour change)
Office of Environmental Impact Control
Regulate effluent quality and protect the environment in a broader sense
Impact - Sanitation development should be able to increase the effluent quality thati s discharged to open water body
Weak to medium influence in law enforcement for polluters
i : defines as power to influence stakeholder in the lower planning domain (village and households) *: identified as main stakeholders in a sanitation infrastructure development project, particularly in the selection
of a technology
6.3.3.6. Other Stakeholders in Local Level Besides the institutional stakeholders, there are other important stakeholders at the local level. During the planning and implementation stages of a sanitation program, the Department of Public Works is assisted by:
- Project facilitators: the facilitators play an important role in conducting behaviour changes before, during, and after project implementation (e.g. changing community mind-set towards sanitation issues, demand creation, community empowerment, community and operator training). A facilitator is commonly a trained-staff from an NGO or is private/self-employed
- Technical consultants/ practitioners: the consultants provide technical asssistance for the Department of Public Works during the planning and implementation stages of a sanitation project. Consultants can be wastewater technology experts, NGO staffs, or academics. They play an important role in selecting the most appropriate technology.
The roles and interest of both stakeholders are depicted in Table 6.5 Table 6.5 Roles and interests of a project facilitator and a technical consultant
Stakeholder Role in the local level, related to
sanitation
Impact/ impacted
Interest in sanitation program Power to influencei
Project facilitators
Responsible for behaviour changes
Impact - Enable to empower the community in developing and maintaining their own system
- Sanitation system should be
Strong influence in empowering the community, moderate influence in

Step 1 of SusTA: Sanitation Policy and Stakeholders Identification_____________________________________
70
Stakeholder Role in the local level, related to
sanitation
Impact/ impacted
Interest in sanitation program Power to influencei
manageable by the community determining the appropriate system
Technical consultants/ practitioners*
Responsible for technical design and implementation of wastewater technology
Impact - Assuring that the technology functions and delivers the best technical performance (e.g. high removal efficiency, high durability and reliable)
Strong influence in deciding the technology options
*: identified as main stakeholders in a sanitation infrastructure development project, particularly in the selection of a technology
6.4. Identification of the Most Important and Influencing Stakeholders (Result of Step 1.c)
From the previous analysis, it is identified that there are four main stakeholders which play important roles in selecting a sanitation technology, namely: the Depertment of Public Work, technical consultants/practitioners, head of the village with his administration staffs and the households. Each group has its own interests, role and power to influence other stakeholder group. From Table 6.6 it can be concluded that although a certain stakeholder group is considered most important to be heard in the decision making process, it does not mean that this group of stakeholder has the highest degree of influence.
Table 6.6 Stakeholders degree of importance and influence in Pucanganom village
Level Stakeholders Degree of importance to
be accommodated in selecting a technology
Degree of influence in selecting a technology
Local Dept. of Public Work Moderate High
Technical consultants/ practitioners Low High
Village Head of the village with his administrators High Moderate
Households (represent by the husbands)
High Low
In a rural-sanitation project scheme in Indonesia, commonly the Department of Public Work represents the funding institution, while the practitioners act as the project executor. The head of the village, together with the households represent the beneficiaries. In a communal-scale (20-70 households) wastewater treatment plant, normally there is an appointed operator which takes care of the plant. This operator is also the user of the system. Hence, for further analysis in the decision making process (refer to section 9.1) the stakeholders are grouped as follows:
- institutions (authority, governmental agency),
- practitioners (non-governmental organization, consultants) and
- users/beneficiaries (common users and users who also serve as community/ village administrators, and operators).

Step 2 of SusTA: Distance-to-Target Analysis to Support Decision Making in Sanitation
71
7. Step 2 of SusTA: Distance-to-Target Analysis to Support Decision Making in Sanitation
Chapter 7 demonstrates a problem identification step in regional level, using one set of sanitation-related background indicator. The first part (section 7.1) discusses the development process of the background indicators. The determination of baseline and target values (step 2.a of SusTA) and the distance-to-target analysis (step 2.b) are described in section 7.2. The last section, 7.3 summarizes the results of the analysis.
2 Distance-to-target Analysis on Sustainability of Sanitation Situation in the Region (DTT step)
2.a Determine the baseline and target values of the background indicators together with the relevant stakeholders identified in step 1.c.
T
A set of background indicators for step 2.a is provided. The indicators describe the state of the art and targets of sanitation development in the region. *Data collection method for indicators’ values: institutional interviews and literature reviews
2.b Conduct a distance-to-target analysis. Based on this analysis, identify sustainability deficits and the problems in sanitation development in the region. The results of this identification should be considered for defining the measurements- including sanitation technology in the project area (step 5.a).
7.1. Designing indicators based on the Integrative Sustainability Concept developed by the Helmholtz Association of German Research Centers (Development of Tool for Step 2.a and 2.b)
Based on selected rules from the Helmholtz concept, a set of background indicators were developed. These indicate the situations that should actually be measured to describe the situations in Gunung Kidul. Since the indicators are designed to be applicable for decision supports, several highlights related to indicators should be discussed with the stakeholders - in this case government insitutions (refer to section 6.3.3) as one of sanitation stakeholder group:
- do the designed indicators reflect the regional’s issues related to sanitation? - have these indicators been monitored in the region? - are data series for such indicators available? - in case the designed indicators are not yet monitored and data series are unavailable,
what indicators might substitute the designed indicators? Based on intensive literature study and institutional interviews, there were several important findings:
- data archieving is lacking. Several institutions do not have a well-organized data archieving or data compilation. It is therefore difficult to find a reliable data series as every single data is scattered in several reports or even in other institutions’ report.
- many data series are unavailable due to the discontinuous monitoring. This problem occurs due to overlaped and uncovered tasks in institutional level (refers to section 6.3.3.5).

Step 2 of SusTA: Distance-to-Target Analysis to Support Decision Making in Sanitation____________________
72
- there is wide range of data due to different data collection methods. In some cases several institutions publish exactly the same data but with different values. This can happen due to the fact that not all these institutions have the same concept on what and how to measure. For example: the amount of population with “improved
sanitation facility” is measured by two different institutions. But both institutions do
not have the same perception of an “improved sanitation facility”. Therefore, they measure it differently (Department of Health- Gunung Kidul, 2011 and Statistic Bureau of Gunung Kidul, 2008).
From the discussions with several institutions, it is concluded that many crucial sanitation-related issues have not been monitored and several “ideal” indicators are not applicable for
Gunung Kidul’s context. In order to be applicable with the local context, these indicators
should be modified. The process is described in Figure 7.1. - the “ideal” indicators, which are currently not the main concerns of the institutions can be
considered as reference to monitor the progress or decline of sanitation development in the region.
- the modified indicators can be seen as sanitation background indicators mainly considering data availability and data quality in Gunung Kidul.
Does it reflect the problem?Is it monitored?
Is data available?
Derive rules from Helmholtz Concept os Sustainability
Develop ideal indicators
Check applicability
withinstitutions
Apply
Yes
Check alternative data availability and their
reliability
Develop modified indicators
No
Figure 7.1 Development of background indicators
After selection of the most representatives indicators, baseline and target values of indicators were obtained with the hierarchy as follows:
a. the values were gained from interviews/discussions with relevant stakeholders working in the responsible institutions;
b. if a) was not possible, substituting data were gained from household questionnaires (see section 8.2)

Step 2 of SusTA: Distance-to-Target Analysis to Support Decision Making in Sanitation
73
c. if b) was not representative enough, values were obtained from national or international references (e.g. national ministry, World Bank, United Nations)
d. for indicators which target values cannot be obtained from the literature, or will not be representative if substituted by literature values: the target values remain unknown.
7.2. Background Indicators, Their Values and Distance-to-Target Analysis (Application of Step 2.a and 2.b)
- The background indicators, the baseline and target values are presented in the following passages. The numbering system of each indicator does not follow the order of this chapter’s sections, but refer to the order of the goals and rules of Helmholtz
Concept. The indicators in italic represent the modified ones, considering the data availability in Gunung Kidul.
- The results of the distance-to-target analysis are presented in a traffic light color system. The colors represent the distance of related condition to the desired situation.
: on track/close to meet the target : medium distance to meet the target
: not on track to meet the target No color : justification is not possible due to incomplete information
1. First Goal: Securing human existence
1.1 Protection of human health Table 7.1 Indicators for the protection of human health
1.1.1 Infant mortality rate
1.1.2 Percentage of population suffering from water related diseases
1.1.2a Percentage of population suffering from diarrhea (water borne disease)
1.1.2b Percentage of population suffering from dengue fever (water related vector)
1.1.3 Percentage of population with access to primary health care services
1.1.3a Percentage of administrative areas covered by primary health cares
1.1.1 Infant mortality rate Rationale: Infant mortality indicates the quality of life over time. Small children are the most likely to be affected by poor sanitation conditions and lack of medical care. The infant mortality rate is the number of infants dying before reaching one year of age, per 1,000 live births in a given year (UNICEF, WHO, World Bank, UN DESA, UNDP, 2011). Fact: According to the Department of Health- Gunung Kidul (2010), the infant mortality rate in 2010 reached 12.44. That means of 1000 births 12.44 babies die before they reach the age of one year.

Step 2 of SusTA: Distance-to-Target Analysis to Support Decision Making in Sanitation____________________
74
Reference/target: According to UNICEF, WHO, World Bank, UN DESA, UNDP (2011) the infant
mortality rate in Indonesia was recorded to be 25 in 2010. That means that the infant mortality rate in Gunung Kidul is still lower than the average in Indonesia. The main cause of infant mortality in Gunung Kidul is unfortunately not recorded. The department set the target for 2015 to decrease infant mortality rate to 11.1.
1.1.2 Percentage of population suffering from water -related diseases Rationale Improved sanitation is closely connected to better health, e.g. less cases of water related diseases. Bradley (1977) in WHO (2002) suggests that there are four principal categories that relate to water:
- water-borne: caused through consumption of contaminated water (for instance diarrhoeal diseases, infectious hepatitis, typhoid, guinea worm);
- water-washed: caused through the use of inadequate volumes for personal hygiene (for instance diarrhoeal disease, infectious hepatitis, typhoid, trachoma, skin and eye infections);
- water-based: where an intermediate aquatic host is required (for instance guinea worm, schistosomiasis); and,
- water-related vector: spread through insect vectors associated with water (for instance malaria, dengue fever)
Fact In Gunung Kidul, the most significant water-related diseases are diarrhoea and dengue fever. Therefore the most relevant indicators are:
1.1.2a Percentage of population suffering from diarrhoea (water- borne disease) Rationale Diarrhoea is the passage of loose or liquid stools more frequently than is normal for the individual (WHO, 2012). It is primarily a symptom of gastrointestinal infection caused by contaminated water (mostly due to shortage of clean water). The use of water in hygiene is an important preventive measure for this disease.
Fact In Gunung Kidul 1.24%. of population is reported suffering from diarrhoea (Department of Health- Gunung Kidul, 2009). This number is calculated as percentage of reported cases related to total number of population.
Reference/target
Diarrhoea occurs world-wide and causes 4% of all deaths and 5% of health loss to disability. It is most commonly caused by gastrointestinal infections which kill around 2.2 million people globally each year, mostly children in developing countries (WHO, 2012). Therefore it is important to cure and prevent diarrhoea. Unfortunately the Department of Health Gunung Kidul does not set any target for improvement for the coming years.
Step 2 of SusTA: Distance-to-Target Analysis to Support Decision Making in Sanitation
75
1.1.2b Percentage of population suffered from dengue fever (water -related vector) Rationale Dengue fever is a severe, flu-like illness that affects infants, young children and adults but rarely causes death (WHO, 2012). Dengue haemorrhagic fever (DHF) is a potentially lethal complication and is today a leading cause of childhood death in several Asian countries.
The most effective method of prevention is to eliminate the mosquito (Aedes aegypti) that causes the disease. This requires removal of the mosquito breeding-sites (source reduction), including untreated grey water which is freely discharged on the surface, uncleaned water containers and unproper disposal of solid waste. In Gunung Kidul dengue fever is more deadly than diarrhoea, with case fatality rate of 1.26 %. Case fatality rate is the ratio of the number of deaths caused by a specified disease to the number of diagnosed cases of that disease.
Fact Based on data from the Department of Health- Gunung Kidul (2010), in 2010 there were 44 reported cases of dengue fever per 100,000 inhabitants, or 0.044% of the population suffering from dengue fever.
Reference/target In the same year, the Ministry of Health of Indonesia set the national target of 2
cases per 100,000 in 2010. Therefore, the condition in Gunung Kidul was considered far from 2010’s national target. However, the Department of Health in Gunung Kidul set no target for the coming years.
1.1.3 Percentage of population with access to primary health care services Rationale Health is one of the main basic needs. Therefore it is important to ensure that each member of society at least has access to primary health care service. Primary Health Care is defined by the Department of Health- Gunung Kidul (2009) as essential health care made accessible at a cost the country and community can afford, with methods that are practical, scientifically sound and socially acceptable.
Fact In Gunung Kidul there is no data on the number of population with access to primary health care. Therefore the indicator is modified.
1.1.3a Percentage of administrative areas covered by primary health cares Fact In Indonesia, the Department of Health is in charge for primary health care services. Health and sanitation information for the community is delivered by sanitarians assigned by primary health care. According to Department of Health- Gunung Kidul (2011), there are in total 110 primary health cares available in all 144 villages, which are served by midwives and nurses. Additionally, there are in total 30 bigger health care facilities with medical doctors available in all 18 main areas of sub-district (a sub-district consists of 5-14 villages).

Step 2 of SusTA: Distance-to-Target Analysis to Support Decision Making in Sanitation____________________
76
Reference/target 100% of administrative areas have been covered by primary health care, although
there is no clear data on the number of population actually having access to such a facility. The existence of primary health care in an area can indicate the existence of sanitation-related information in the community.
1.2 Ensuring satisfaction of basic need The Habitat Agenda, adopted by consensus of 171 States at the Second United Nations Conference on Human Settlements (Habitat II), 1996 stated that everyone has the right to an adequate standard of living for themselves and their families, including adequate food, clothing, housing, water and sanitation.
Therefore the selected indicators (Table 7.2) refer to the fulfillment of abovementioned basic needs.
Table 7.2 Indicators for satisfaction of basic needs
1.2.1 Water consumption per capita and day
1.2.2 Percentage of population with access to improved water supply
1.2.2a Percentage of water samples on a household level in compliance with the national standard of clean water
1.2.3 Percentage of households with access to improved sanitation facilities
1.2.4 Percentage of households living in a healthy housing according to the national standard on healthy housing
1.2.5 Severe to moderate malnutrition in children below 5 years of age
1.2.1 Water consumption per capita and day Rationale There are several diseases linked to poor hygiene such as diarrhoea and other diseases transmitted through the faecal-oral route; skin and eye diseases, in particular trachoma and diseases related to infestations, for instance louse and tick-borne typhus (Bradley, 1977 in WHO, 2002; Cairncross and Feachem, 1993 in Howard and Batram, 2003). Therefore water consumption becomes an important sanitation-related indicator since it influences the quality of the life of the population and determines the type of sanitation technology. According to Howard and Bartram (2003), 50 liters per capita and day (lcpd) is the quantity considered for a low health risk; while 100-200 lcpd is considered to be the quantity that leads to very low health risk (Table 7.3).
Table 7.3 Summary of requirements for water service level to promote health
Service level Access measure Needs met Level of health
concern No access (quantity collected often below 5 lpcd)
More than 1000m or 30 minutes total collection time
Consumption: cannot be assured Hygiene: not possible (unless practised at source)
Very high

Step 2 of SusTA: Distance-to-Target Analysis to Support Decision Making in Sanitation
77
Service level Access measure Needs met Level of health
concern Basic access (average quantity unlikely to exceed 20 lpcd)
Between 100 and 1000m or 5 to 30 minutes total collection time
Consumption: should be assured Hygiene: handwashing and basic food hygiene possible; laundry/ bathing difficult to assure unless carried out at source
High
Intermediate access (average quantity about 50 lpcd)
Water delivered through one tap on plot (or within 100m or 5 minutes total collection time)
Consumption: assured Hygiene: all basic personal and food hygiene assured; laundry and bathing should also be assured
Low
Optimal access (average quantity 100 lpcd and above)
Water supplied through multiple taps continuously
Consumption:all needs met Hygiene: all needs should be met
Very low
Source: Howard and Bartram (2003)
Fact Water consumption in Gunung Kidul is estimated to be 60 lcpd (Local Planning Agency- Gunung Kidul, 2010). According to Howard and Bartram (2003) it is considered as intermediate access with low level of health concerns.
Reference/target The local government of Gunung Kidul currently sets the 2015 target to improve
the water quantity, with 100 lcpd for urban area and 60 lcpd for rural area (Local Planning Agency-Gunung Kidul, 2008). The IWRM project is targeting 80 lcpd for people in service areas.
1.2.2 Percentage of households with access to an improved water supply Rationale The quality of water that is consumed is well-recognised as an important transmission route for infectious diarrhoeal and other diseases (WHO, 2012). WHO and UNICEF (2008) divides water supply into three levels as it is depicted in Figure 7.2.
Figure 7.2 Water supply ladder (modified from: WHO and UNICEF, 2008)
•Piped household water connection located inside the user’s dwelling, plot or yard. Piped water on premises
• Public taps or standpipes, tube wells or boreholes, protected dug wells, protected springs and rainwater collection
Other improved drinking water sources
• Unprotected dug well, unprotected spring, cart with small tank/drum, tanker truck, and surface water (river, dam, lake, pond, stream, canal, irrigation channels), bottled water.
Unimproved drinking water sources

Step 2 of SusTA: Distance-to-Target Analysis to Support Decision Making in Sanitation____________________
78
Fact The data on different water sources in Gunung Kidul to justify the water quality are unavailable. Therefore the indicator is modified into:
1.2.2a Percentage of water samples on a household level in compliance to the national standard on improved water Fact Water sampling is conducted irregularly and randomly. According to the Department of Health-Gunung Kidul, (2011) continuous monitoring is not conducted due to budget limitations. In 2009 around 600 samples were randomly taken from households’ dug wells in all 18 villages (Local Planning Agency - Gunung Kidul, 2010). Around 64% of the samples do not meet the national standard for BOD and total coliform.
Reference/target Unfortunately, there is no continuous monitoring and follow up actions initiated by
the institution. There is no reliable data concerning the share of population with different water sources in the region.
Refering to WHO, 2002 the recommended sampling number of piped supplies and point sources, are presented in Table 7.4.
Table 7.4 Recommended minimum sample number for faecal indicator testing in a distribution system
Type of water supply and population
Total number of samples per year *
Point sources Progressive sampling of all sources over 3-5 year cycles (maximum)
Piped supplies
< 5000 12
5000-100,000 12 per 5000 population
>100,000-500,000 12 per 10,000 population plus an additional 120 samples
>500,000 12 per 50,000 population plus an additional 600 samples
*Parameters such as chlorine, turbidity and pH should be tested more frequently as part of an operational and verification monitoring (Source: WHO, 2002)
1.2.3 Percentage of households with access to improved sanitation facility Rationale Reducing the number of population without improved sanitation facilities becomes one of MDGs target. WHO and UNICEF (2008) define improved sanitation facilities as facilities that ensure hygienic separation of human excreta from human contact. They include: flush or pour-flush toilet/latrines connected to a piped sewer system, septic tanks and pit latrines; ventilated improved pit (VIP) latrines; pit latrines with slab and composting toilets (see Figure 7.3).

Step 2 of SusTA: Distance-to-Target Analysis to Support Decision Making in Sanitation
79
Figure 7.3 Sanitation practice ladder (modified from: WHO and UNICEF 2008)
Fact Specific data concerning coverage of improved sanitation in Gunung Kidul so far does not exist. Currently, the data of sanitation facility is collected differently by several institutions due to the different understanding of improved sanitation facilities. For example, the household surveys held by recorded that 80.69%. of the population having toilet (Department of Health- Gunung Kidul, 2009) and 63.3% connected to “septic tank” (Local Planning Agency -Gunung Kidul, 2010), without providing further information on whether those are improved facilities as per WHO and UNICEF (2008) definition. Reference/target
IST-UTF (2011) summarised several reports on national saniation coverage: the 2007 MDG Report estimated the 1990 sanitation coverage level to be 30% and claimed that Indonesia has already met its 2015 MDG sanitation target of 65%. The 2007 review from the National Development Planning Agency (BAPPENAS) puts the MDG sanitation target at 72.5%, while Ministry of Health set 62.4% as the target (Directorate of Environmental Health, Ministry of Health, 2012). A joint Monitoring Program by WHO and UNICEF (2010) anticipates that Indonesia is ‘on
track’ to meeting its MDG water target, but notes ‘progress, but insufficient’ for
meeting the sanitation target.
1.2.4 Percentage of households living in an healthy housing according to the national standard on healthy housing Rationale Inadequate housing contributes to diseases. The Ministry of Health of Indonesia defines 14 criteria for healthy housing. Six of them are related to sanitation: connectivity to clean water, ownership of toilet (private, shared, none); existence of septic tanks; existence of greywater treatment and existence of drainage channels.
Uni
mpr
oved
san
itatio
n fa
cilit
ies
Shar
ed s
anita
tion
faci
litie
s
Ope
n de
feca
tion
Impr
oved
san
itatio
n fa
cilit
ies Facilities that
ensure hygienic separation of human excreta from human contact. They include: • flush or pour-flush toilet/latrines to: piped sewer systems, septic tanks or pit latrines
• ventilated improved pit (VIP) latrines
• pit latrines with slab
• composting toilets
Sanitation facilities of an otherwise acceptable type shared between two or more households. Shared facilities include public toilets.
Facilities that do not ensure hygienic separation of human excreta from human contact. Unimproved facilities include pit latrines without a slab or platform, hanging latrines and bucket latrines.
Defecation in fields, forests, bushes, bodies of water or other open spaces, or disposal of human faeces with solid waste.

Step 2 of SusTA: Distance-to-Target Analysis to Support Decision Making in Sanitation____________________
80
Fact Based on a survey conducted by the Department of Health -Gunung Kidul (2009), only 55.2% of the households fulfill these criteria.
Reference/target The local government did not set any target for improvement, while the national
government set 80% as 2010’s target.
1.2.5 Severe to moderate malnutrition in children below 5 years of age Rationale Malnutrition, inadequate water supply and bad sanitation are linked to poverty. The impact of repeated or persistent diarrhoea on nutrition-related poverty and the effect of malnutrition on susceptibility to infectious diarrhoea are reinforcing elements of the same vicious circle, especially amongst children in developing countries (WHO, 2012).
Fact In 2009 around 11.8% children are detected to be in severe to moderate malnutrition condition. There is no further explanation on the causes of this malnutrition.
Reference/target
The number is targeted to be 9% in 2015 (Department of Health- Gunung Kidul, 2010).
1.3 Autonomous subsistence based on own income Table 7.5 Indicators on autonomous subsistence based on own income
1.3.1 Percentage of population living below the poverty line
1.3.2 Expenditure for water as a share of the total monthly expenditure
1.3.3 Expenditure for an improved sanitation facility as a percentage of the household’s average income
1.3.1 Percentage of population living below poverty line Rationale Poverty reflects the low quality of life, including sanitation, and is also related to the willingness to pay for any sanitation improvement. In 2009 the average national poverty line was IDR 212,000 (US$ 24.9)/person/month (National Statistic Bureau-Indonesia 2009).
Fact As one of the poorest regions in Indonesia, with majority of farmers, the percentage of population living below the poverty line in Gunung Kidul reached 26.9% (Statistic Bureau- Gunung Kidul, 2008). Reference/target The target value for poverty reduction is not set in the region. At a national level,
over 13% of the Indonesian population of 240 million people still live below the official poverty line. The national target is to be reduced by half the proportion of people living below poverty line in 2015 (UNDP, 2011).

Step 2 of SusTA: Distance-to-Target Analysis to Support Decision Making in Sanitation
81
1.3.2 Expenditure for water as a share of the total monthly expenditure Rationale This indicator is to assess whether the expenditure for water still reasonable for most people. Most people have difficulty to describe their monthly income in cash (refer to section 8.1), therefore it is substituted with “mothly expenditure”.
Fact With a monthly expenditure of IDR 811,731 (US$ 90.19), water occupies 12.8% of respondents’ average monthly expenditure (ITAS, KIT and Faculty of Geography, UGM, 2010). This does not account for the initial cost of a water connection that is sometimes in the range of $100 and above, often equivalent to 100% and more of poor urban households’
monthly income. The initial cost to have pipeline water connection in Gunung Kidul is IDR 1.3 Mio or US$ 144, which is 160% of the average monthly expenditure.
Reference/target This 12.8% is considerably above the recommendations of the Asian Development
Bank (2008) which defined the reasonable share for water bill and sanitation should not exceed 5% of the monthly disposable income. The region does not set any target for improvement.
1.3.3 Expenditure for an improved sanitation facility as a percentage of the household’s
average income Rationale Improved sanitation facilities should be affordable for the people. The regulation in Indonesia enforced that each household should have a standardized septic tank.
Fact The construction cost to build such septic tanks is estimated to be IDR 2 Mio (US$ 222), which is 246% of a household’s average monthly expenditure or 21% of annual expenditure. Monthly expenditure of IDR 811,731 (US$ 90.19) is used to substitute the disposable income (ITAS, KIT and Faculty of Geography, UGM 2010). Depending on the design, a septic tank should be desluged every 2 - 5 years, which costs around IDR 150,000-200,000 (US$ 17-22).
Reference/target Asian Development Bank (2008) defined the reasonable share for water bill and
sanitation should not exceed 5% of the monthly disposable income. No target set by the government of Gunung Kidul to make improved sanitation more affordable.
2. Second Goal: Maintaining society’s productive potential
2.1 Sustainable use of renewable resources Table 7.6 Indicators for sustainable use of renewable resources
2.1.1 Proportion of energy supplied from sustainable resources (renewable resources and resources recovery) within the region
2.1.1a Percentage of households using renewable energy to prepare drinking water 2.1.2 Proportion of organic fertilizer resulting from waste and wastewater in the region
Step 2 of SusTA: Distance-to-Target Analysis to Support Decision Making in Sanitation____________________
82
2.1.1 Proportion of energy supplied from sustainable resources (renewable resources and resources recovery) within the region Rationale In general this indicator is to assess the balance share of renewable and non renewable energy in the region. Since no data in regional level is available, the indicator is simplified into data in household’s level, which particularly related to water:
2.1.1a Percentage of households using renewable energy to prepare drinking water Rationale In many developing countries, including Indonesia, water has to be boiled to meet the standard quality of drinking water. In order to be sustainable, the energy for boiling the water should ideally be supplied by renewable energy.
Fact Almost all households never rely on the single source of energy. Around 68.2% of respondents in Gunung Kidul use liquid natural gas as their main energy source for cooking, while 94.6% of respondents use biomass (wood) as their main or second energy source for cooking (ITAS, KIT and Faculty of Geography, UGM, 2010).
Reference/target
In many villages, cattle dung is not utilized to produce biogas. Office of Environmental Impact Control-Gunung Kidul (2011) tries to introduce biogas digester to the people. Since 2005 the office constructed 10-12 biodigesters anually. Small scale farmers with 2-5 cattles are eligible to apply for the digester.
2.1.2 Proportion of organic fertilizer resulting from waste and wastewater (nutrient recovery) in the region Rationale This indicator is to assess the sustainable use of nutrient in the region.
Fact Around 94.1% of farmers use cattle manure (nutrient recovery) as soil conditioner or fertilizer (ITAS, KIT and Faculty of Geography, UGM, 2010). However, they still need additional fertilizer since their own fertilizer cannot meet the demand.
Reference/target
The government provides support for organic fertilizer through subsidy. According to the Department of Industry and Commerce- Gunung Kidul, (2011) the amount of subsidized organic fertilizer in the market is 23.44% (in 2010) of the total amount of subsidized fertilizer. However, no target is set for the future.
2.3 Sustainable use of the environment as a sink Table 7.7 Indicators for sustainable use of the environment as sink
2.3.1 Percentage of wastewater treated before being discharged into nature
2.3.1.a Class quality of the main river in the region, according to national government regulations

Step 2 of SusTA: Distance-to-Target Analysis to Support Decision Making in Sanitation
83
2.3.1 Percentage of wastewater treated before being discharged into nature Rationale To protect human health and environment as well, wastewater should be treated before discharged to the nature.
Fact According to the Office of Environmental Impact Control- Gunung Kidul (2011) wastewater effluent from domestic use is never monitored. However, every industrial company is responsible to treat their own waste, and report it to the Environmental Control Office every six months. The office will evaluate the effluent based on the report provided by the industry (section 6.3.3). Due to this weak control, the data is considered inappropriate and will not be used for this indicator and is replaced with:
2.3.1a Class quality of the main river in the region, according to national government regulations Rationale Due to the fact that domestic wastewater effluent is discharged to the ground or to an open water body, the quality of river water becomes one of the indicators of effluent quality. Fact The main river, namely river Oyo, flows in non-karst areas. This river meets quality class I to II according to Governor Regulation Number 22 (2007) on River Water Quality, which means relatively clean to lightly polluted. Quality class I means that the water meets the standard as raw water eligible for drinking water purpose, while quality class II means that raw water is only eligible for recreational, fishery and irrigation purposes.
Target
There is no target set to improve the river water quality.
3. Third Goal: Preserving society’s options for development and action
3.1 Participation in social decision making processes Table 7.8 Indicators for participation in social decision making processes
3.1.1 Existence of a policy that guarantees public participation in decision making in the water supply and wastewater sector
3.1.1 Existence of a policy that guarantees public participation in decision making in the water supply and wastewater sector Rationale A condusive political environment is essential for the successful implementation of a sanitation program. Having experienced a long period of top-down planning which often led to the gap between beneficiaries’ demand and government’s supply, a new policy which
encourage public participation is required.

Step 2 of SusTA: Distance-to-Target Analysis to Support Decision Making in Sanitation____________________
84
Fact The policy does exist, through a democratic planning procedure called Musrenbang
(see section 6.3.3.1). The musrenbang process was introduced to replace Indonesia’s former centralized and top-down government system. It is an annual process where community members meet together to discuss the issues they face and decide upon priorities for short-term improvements.
7.3 Summary from Results of Step 2.a and 2.b Considering the sanitation development in Gunung Kidul, the results of distance-to-target analysis can be summarized in Table 7.9:
Table 7.9 Summary from the distance-to-target analysis
Rules Problem detected Remarks Protection of human health
Diarrhoea and dengue fever still become common diseases in Gunung Kidul.
Presumably these diseases are caused by unproper treatment of black- and greywater. Hence, both black- and greywater should be properly managed to increase the health quality of the people.
Ensuring satisfaction of basic need
The percentage of households with access to an improved water supply is undetected. However only 36% of water samples met the national standard for BOD and total coliform.
This indicates that black- and greywater is not treated properly and contaminate the drinking water. The most common treatment, unsealed septic tanks and pit latrines must be improved.
Percentage of households with access to improved sanitation facility in the region is unknown.
Indonesia is ‘notified as ‘progress, but
insufficient’ for meeting the sanitation MDGs
target. Hence, a new sanitation technology introduced in the region should ideally multiplicable in order to catch the target of coverage.
Only around 50% of the households living in an healthy housing conditions.
This shows that water and sanitation conditions in the region are still poor and should be improved.
No exact data on the coverage of health care service, however all of the villages are officially covered by sanitarians.
Sanitarians assigned by Public Health Care are proven to play important roles in changing the mind-set of the community towards a more hygienic lifestyle. Therefore, their role as the main resources in improving the sanitation conditions should be maximized.
Autonomous subsistence based on own income
Water occupies 12.8% of respondents’ average monthly
expenditure and improved sanitation provision occupies 246% of a household’s average monthly
expenditure or 21% of annual expenditure.
This number indicates that water supply and sanitation provision still become the burden of most people. Therefore low-cost technology in water supply and sanitation sector should be promoted as the main priority.
Sustainable use of renewable resources
In many villages, cattle dung is not utilized to produce biogas and current production of cattle manure cannot meet the demand.
The energy and nutrient cycle in the region is not fully closed. Technology which can close both cycles and enhance the quality of cattle manure should be promoted.

Step 2 of SusTA: Distance-to-Target Analysis to Support Decision Making in Sanitation
85
Rules Problem detected Remarks
Sustainable use of the environment as a sink
Wastewater effluent from domestic use and industry is never monitored consistently and regularly.
The effluent must be controlled to protect human health and environment. Moreover, it is notified that only low percentage of water meets the drinking water quality standard, due to wastewater contamination. The institution should start to control the household level treatment, since most treatment relies on this scale. The responsible institution should independently control the industrial wastewater- instead of relying on the company’s report.

Step 3 of SusTA: Examination of Socio-Economic and Physical Condition of the Southern Bribin Catchment Area___________
86
8. Step 3 of SusTA: Examination of Socio-Economic and Physical Condition of the Southern Bribin Catchment Area
This first part of this chapter (8.1) presents the data collecting process- an application of step 3.a (see the box below). The results of examination of socio-economic and physical condition in the southern Bribin catchment area (step 3.b) are presented in section 8.2-8.3. The results of this analysis give a better understanding on the local conditions and become the basis for the sanitation planning in the case study area (Chapter 10).
3 Examination of Physical and Socio-economic Conditions in the Project Area (PSE step) 3.a Collect physical and socio-economic data which are important for sanitation planning
T
A household questionnaire is one of the methods for data collection. Beneficiaries/users and key persons (identified in step 1.c) are involved as respondents of the questionnaires. A household questionnaire for data collection (step 3.a) is provided in Attachment 1. *Before being interviewed, respondents should receive adequate information regarding basic characteristics of technologies (e.g. through workshop or informed technologies catalog).
3.b Examine the physical and socio-economic conditions. Based on this examination, identify the technology criteria which are suitable for the area
8.1. Collecting Physical and Socio-Economic Data for Sanitation Planning (Application of Step 3.a)
The aim of the data collection is to obtain physical and socio-economic data for sanitation planning, including users’ preference on certain type of technologies. In this case study, the information was gained through household questionnaires, key person interviews (Appendix 1) and direct observation.
8.1.1. Social Preference Preference of the respondents to a certain technology becomes an important factor in selecting a sustainable technology. Although a technology is a system consisting of several phases, the main interest of common users focus on certain phases of technology that directly relate to them, namely:
- the user interface (toilet), - treatment options that are applicable for single household or cluster level (e.g.
septic tank, biodigester), and - end product of the system (energy or nutrient recovery).
Therefore the options presented to the respondents during household questionnaires are restricted to these phases. It is not relevant to include user preference on semi off-site system, where common users do not have any knowledge and concern. Only users who serve as operators/caretakers in communal treatment plant will have concern on the whole phases of the system.
However, preference might be a temporal decision which might change over the time. Therefore in assessing the preference, the percentage value from the questionnaire cannot be taken for granted. The reasons behind respondents’ preferences and their vision/wish for the future development contribute significant inputs to assess the long-term preference.
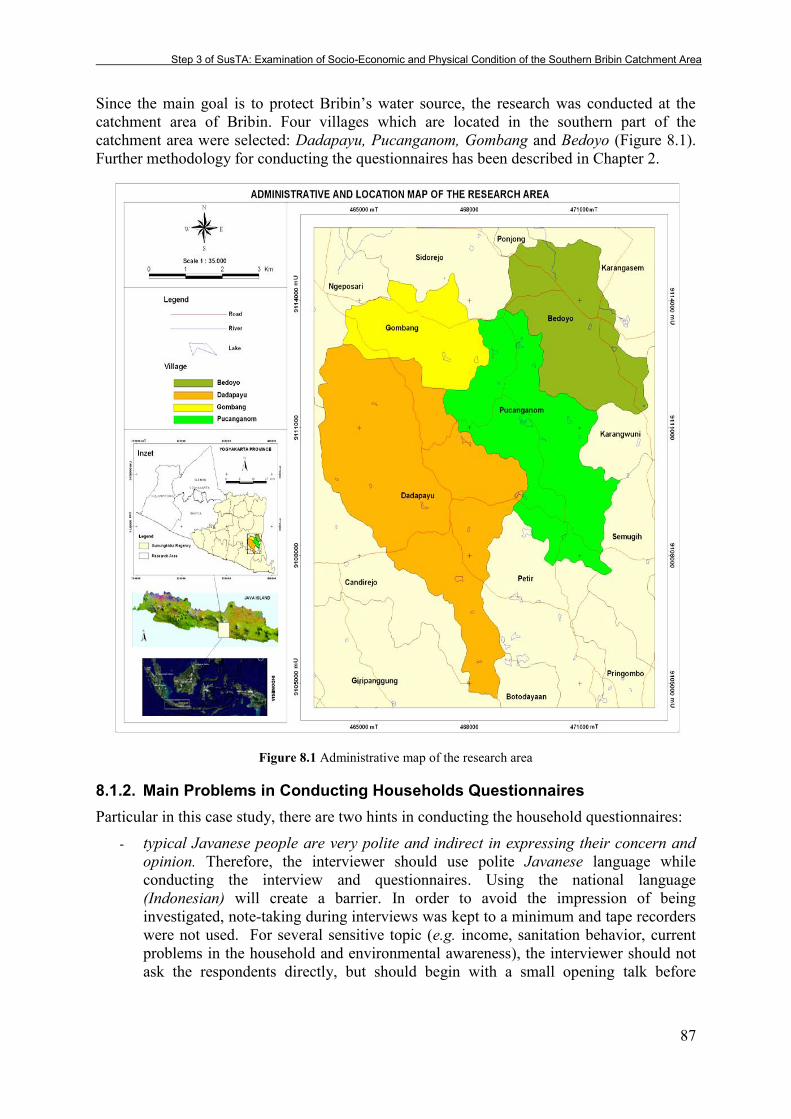
Step 3 of SusTA: Examination of Socio-Economic and Physical Condition of the Southern Bribin Catchment Area
87
Since the main goal is to protect Bribin’s water source, the research was conducted at the
catchment area of Bribin. Four villages which are located in the southern part of the catchment area were selected: Dadapayu, Pucanganom, Gombang and Bedoyo (Figure 8.1). Further methodology for conducting the questionnaires has been described in Chapter 2.
Figure 8.1 Administrative map of the research area
8.1.2. Main Problems in Conducting Households Questionnaires Particular in this case study, there are two hints in conducting the household questionnaires:
- typical Javanese people are very polite and indirect in expressing their concern and opinion. Therefore, the interviewer should use polite Javanese language while conducting the interview and questionnaires. Using the national language (Indonesian) will create a barrier. In order to avoid the impression of being investigated, note-taking during interviews was kept to a minimum and tape recorders were not used. For several sensitive topic (e.g. income, sanitation behavior, current problems in the household and environmental awareness), the interviewer should not ask the respondents directly, but should begin with a small opening talk before

Step 3 of SusTA: Examination of Socio-Economic and Physical Condition of the Southern Bribin Catchment Area___________
88
coming to the intended topic. Once the respondent felt comfortable with the conversation they delivered all of the information. During the interview the respondent offered drink and even food to the interviewer, and it was a part of gaining trust and respect if the interviewer took the offer. Due to this long process one interview took 1-2 hours.
- as the last cross-check of the information, before leaving the respondent’s house, the
interviewer gives a closing talk. This is a very important step as the respondent might express his/her real wishes and concern which might not have been expressed during the interview. Therefore, the closing conversation serves as an information validation approach.
In conducting the questionnaires the main challenge was to gain quantitative data from the respondents, as described in Table 8.1
Table 8.1 Problems and approaches in collecting quantitative data
Quantitative data Problem Approach
Income and expenditures
In most cases the respondents do not have regular (monthly) income due to the fact that most of them are not employed. Many of them receive a seasonal salary (for example as unskilled migrant laborer in the city during the dry season and work again in the village as farmer during the rainy season). As farmers they only receive cash money after harvesting time. Other households receive cash money by borrowing it from formal or informal credit agents. They pay back the money after a certain period (e.g. after receiving money sent by their family members who work in the city or after harvesting time). For these reasons they have difficulties calculating their monthly income.
The respondents were able to estimate their monthly expenditure in cash, e.g. expenditure for water, electricity, housing, children‘s school fee,
transportation and services. The difficulty came in calculating the expenditure for food as most of the food is their own crops. Due to this fact, monthly expenditure was used to estimate the income.
Area There are many units of traditional measurements in the villages for calculating the area which differ from one area to another. As these units of measurement are based on assumption and are not standardized, it is very difficult to convert the unit into an international measurement unit.
The best approach should be a direct calculation on the field. Unfortunately, the agricultural land is mainly far away from the settlements where the interviews took place.The approach used was a direct calculation on several fields together with the respondents using the same traditional unit of measurement. After finding a way to convert traditional to international units of measurement , this conversion was used as reference.
Production of cattle manure
Production of cattle manure was measured in sacks. After cattle dung is dried, this manure is collected in sacks and then brought to the field. There are commonly two types of sacks on the market, the 40 kg and the 50 kg sack. The respondents could only estimate the total number of sacks used to collect manure, without specifying which sack capacity they had used.
For calculation, the 40 kg sack was used as a basis as from the observation this sack was used more frequently by the farmers.
Step 3 of SusTA: Examination of Socio-Economic and Physical Condition of the Southern Bribin Catchment Area
89
Quantitative data Problem Approach
Water consumption
In areas where water is scarce, it is common to have several water sources in a household as survival strategy. These households are normally not connected to the regional water enterprise’s pipeline where the consumption is
measured with equipment.
The calculation was based on the volume of the water containers in the households. In general, there are three water storages in a household: in the kitchen, in the bathroom and in the toilet. Their shapes are sometimes cubical or like a pot (out of terracota). Water consumption was calculated based either on the volume of these three storages or the volume of the buckets used to fill the storages.
Dimension of a septic tank
Many septic tanks were constructed by paid labor. Therefore, most owners only know the estimated cost, the material and the construction type (sealed or unsealed). Some septic tanks were constructed a relatively long time ago by the previous house owners so that the current owners do not know any detailled information on it.
Due to this limitation around 5% of the respondents who own septic tanks could not give detailled answers concerning their septic tanks.
Another challenge in conducting the household questionnaires was to select the respondents which were representative for sanitation planning. Ideally, the composition of the respondents should represent:
a. Women in the households. Sanitation is very close to women. Therefore, the women’s opinion should be taken into consideration, thus the number of respondents
should be equally divided into men and women.
b. The future users and actors of the intended sanitation technology and management. Respondents who are not the real users/beneficiaries should not be involved as they might have other interests.
c. Different groups of users, based on:
- Age: each generation has different thoughts and behaviors which will influence the implementation of the intended program.
- Residence status (permanent residence or migrated laborers) : Gunung Kidul is famous for its high seasonal migration rate. People who migrate to the urban area seasonally (migrate labors) have different thoughts than the permanent residents. Migrate laborers normally only stay in the village during the rainy season, while working in the city during the dry season. Their thoughts are partly influenced by the urban lifestyle and always wish to have urban infrastructures, which actually cannot be afforded. Although it cannot be generalized, this group of people is commonly very demanding. Therefore, it is not recommended to choose this group of people as respondents. Moreover, they are not the real users/actors throughout the year.
- Position in the society: respected people or people with high influence should be part of the respondents. Their opinion can steer the community and involving them will avoid any social interference with social hierarchies.

Step 3 of SusTA: Examination of Socio-Economic and Physical Condition of the Southern Bribin Catchment Area___________
90
In reality it was very difficult to have an ideal share of respondents due to several factors:
- during the time frame of the questionnaire not all expected respondents were present due to several reasons.
- women and young people sometimes refused to be interviewed and gave the chance to the elder man or the husband.
8.2. Examination of the Physical and Socio-Economic Conditions (Application of Step 3.b)
The number of respondents of these questionnaires was 355. It was defined based on an arithmetic method and were randomly obtained from each of these segments at four villages. Most respondents (57%) were above 45 years old, 37% were between 30-45 years old and the rest was below 30 years old, with 64 % of respondents being male. The educational level of the respondents varies between primary school with a 6-year schooling (48%), junior high school with a 9-year schooling (28%) and senior high school with a 12-year schooling (16%). The rest of the respondents either did not attend any formal education (4%) or had a university/academy degree (4%). Around 65% of the total respondents work as farmers, 11% as housewives and the rest work as enterpreneur (6%), civil servant (5%) and others occupations, e.g. labours, private sector, soldiers, retired (13%).
8.2.1. Socio- Economic Conditions Related to Water Due to seasonal water shortages, most of the households do not rely on single water sources, but combine several sources as their survival strategy (Figure 8.2). In the four villages investigated the water sources varies:
- the primary water supply comes from cave Bribin and cave Seropan (karstic sources). The water is pumped and distributed via pipelines by the regional water enterprise (PDAM). For household usage, the enterprise charges IDR 37,500 (USD 4.1)/ 10m3 water
- the secondary water sources are rain water from rainwater cisterns, bore wells, springs and lakes (telaga)
- when there is no access to such sources or access is limited, a household has to buy water from vendors/tankers, which costs approximately IDR 120,000-160,000 (USD 13-USD 18) for 5000- 6000 liters. The prices vary depending on the distance and accessibility of the consumers.
Seventy one percent of the respondents own a rainwater cistern. The cisterns were mostly financed by a government aid program in the 80’s (51%), and some of them were self-financed (49%). Most cisterns are used to collect rainwater from the roof. After the second or third rain in the beginning of rainy season, rainwater from the roof is diverted and stored in the cistern. Once the dirt from the roof settles in the bottom of the tank the rainwater is ready for use. The old generation (with age above 45 years old) tends to use rainwater for drinking purposes. This is due to the habit from the past and the thought that rainwater is free from calcium carbonate, which is believed to cause kidney stones (renal calculus). Rainwater was also the only source in the past generation (in the 80’s) before karstic water from the caves was pumped up. The young generation, who was born after the karstic water was used besides rainwater, does not show a stronger preference to rainwater in comparison to the karstic water source.

Step 3 of SusTA: Examination of Socio-Economic and Physical Condition of the Southern Bribin Catchment Area
91
Figure 8.2 Water sources in the survey area (household level)
Figure 8.3 Rain water cistern
Most cisterns in the region are a cylinder shape with 9 m3 volume. According to 79.5% of the respondents this volume is normally not enough to collect the rain during the rainy season and they actually wish for a bigger cistern volume to capture more rainwater.
Cisterns (see Figure 8.3) or any other form of water containers (Figure 8.4) play important roles for several reasons:
- in some parts of Pucanganom which never receive water from pipeline, rainwater becomes the main source. Cisterns are used to collect rainwater from the roof,
- in some areas in which pipeline water is not available regularly, most of the respondents mix rainwater with pipeline water. Rainwater becomes an additional source. Due to the uncontinuous pipeline water supply, once the pipeline water comes, cisterns/containers serve as water storage for future water consumption
- since the pipeline water is very turbid during the rainy season, cisterns and containers serve as settlement tank as well. Water should be stored for 4 days before it can be consumed
Figure 8.4 Water storage as settlement tank
Figure 8.5 Measurement device for pipeline water
The water expense is still a burden for most households, since it greatly influences the monthly expenditure, as depicted in Table 8.2
45
93
88
49
39
5
36
3
7
3
10
13
5
5
0 20 40 60 80 100
P U C A N G A N O M
B E D O Y O
G O M B A N G
D A D A P A Y U
(%)
rain water/pipe line (PDAM) rain water + water vendor
rain water + other resources pipeline (PDAM) + water vendor

Step 3 of SusTA: Examination of Socio-Economic and Physical Condition of the Southern Bribin Catchment Area___________
92
Table 8.2 Water supply condition related to water expenditure
Village Number of sub
villages*
Number of households*
Water condition in village level*
Average total monthly expenditure/ water
expenditure as % from monthly expenditure **
Dadapayu 20 1790
- 15 sub villages supplied by Bribin daily - 1 sub-village supplied by Bribin and
Seropan irregularly - 4 villages are connected to Bribin but
never receive water (tankers are needed).
IDR 757,570 (USD 84)/
11.2%
Gombang 10 769 - 10 sub villages are all connected with Seropan and receive water daily
IDR 780,549 (USD 88)/
9.7%
Bedoyo 9 926 - 8 sub villages are connected with
Seropan and receive water daily - 1 sub village supplied by Bribin daily
IDR 1,032,545 (USD 115)/
9.7%
Pucanganom 12 1172
- 1 sub village connected with Seropan and receives water daily;
- 4 sub villages connected with Seropan only during the dry season;
- 4 sub villages supplied by Bribin daily; - 3 sub villages not connected to any
scheme (tankers are needed).
IDR 680,911 (USD 76)/
14.6%
Source: * ITAS, KIT and Faculty of Geography, UGM, 2010 based on data on village level * * ITAS, KIT and Faculty of Geography, UGM, 2010 based on questionnaires
8.2.2. Water Consumption Due to differences in water supply conditions, each sub village receives a various amount of water which leads to different water consumptions as well. The average water consumption (liters/capita.day) for cooking/drinking, bathing/washing and toilet purposes is depicted in Figure 8.6. Dadapayu and Gombang are located closer to the karstic sources (Bribin and Seropan), therefore the water supply conditions are relatively better than the Bedoyo and Pucanganom. Pucanganom is a hilly region, located faraway from Bribin source. Therefore it receives the least water compared to other villages in the neighborhood.

Step 3 of SusTA: Examination of Socio-Economic and Physical Condition of the Southern Bribin Catchment Area
93
Figure 8.6 Water consumption (liters/capita.day) in four villages
Figure 8.7 presents the different purposes of water consumption, where each household consists of 4.3 family members, 2 cows and/or 3 goats. Cattles are seen as a household’s
saving and consume much water in the household. Water consumption for flushing the toilet differs greatly, depending on the type of toilet installed in the household.
Figure 8.7 Daily household water consumption and its usages (liters/household.day)
Despite water supply discontinuity and seasonal water scarcity, 56 % of the respondents are generally satisfied with their water supply conditions. The rest who are not satisfied (44%) wish to have a higher quantity of water for daily needs and agriculture. Currently, the area relies on rainwater to irrigate paddy fields. During the dry season agriculture is limited to peanut, soy bean, corn and cassava.
114
215
134
52
0
50
100
150
200
250
Bedoyo Dadapayu Gombang Pucanganom
Wat
er c
on
sum
pti
on
(lc
pd
)
Villages
Bedoyo Dadapayu Gombang Pucanganom
cook, drink 74,4 91,3 114,5 45,6
bath, wash 335,0 775,1 397,2 156,6
toilet 79,8 57,3 65,5 21,7
cattle 90,0 67,4 51,5 23,0
others 68,7 92,1 72,9 22,5
0 100 200 300 400 500 600 700 800 900
lite
rs/
da
y.h
ou
seh
old
Others e.g. gardening, washing the motorbike
Step 3 of SusTA: Examination of Socio-Economic and Physical Condition of the Southern Bribin Catchment Area___________
94
8.2.3. Current Wastewater and Solid Waste Treatment and Their Future Perspectives
The discussion in this section is limited to domestic wastewater, or water which originates from households. There are different characteristics of domestic wastewater (Gajurel, 2003; Tilley et al., 2008):
- greywater is the total volume of water generated from washing food and dishes (kitchen), washing clothes and as well as from bathing (bathroom). It may contain traces of excreta and therefore also contains pathogens and excreta,
- blackwater is the wastewater originates from toilet. It contains the mixture of urine, feces and flushwater along with anal cleansing water (if anal cleansing is practiced) and/or dry cleansing material (e.g. toilet paper). Blackwater has all of the pathogens of faeces and all of the nutrients of urine,
- yellowwater is urine from separation toilets and urinals with flush water,
- brownwater is feces without urine with flush water.
In general the largest volume fraction of the household wastewater results from grey water, while blackwater from toilet (urine and faeces) contributes only a very small part to the domestic wastewater volume.
The existing sanitation facilities in all four villages are explained as follows:
8.2.3.1. Simple Pit Latrine (SPL) Simple pit latrine (SPL) is the simplest technology found in the region, used by 30% of the respondents. The latrine is approximately 1-2 m deep and the upper part is sometimes cemented or covered by wood (Figure 8.8). The cemented upper part of the latrine is removable and can be installed in another place once the latrine is full. SPL is used by communities with low income and/or with a limited water supply in the region. Once the economic conditions and water supply improves people will shift to a siphon toilet. Among all SPL users, 40% are not satisfied with the performance of their latrines and the rest never experience any problems. Most SPLs (44%) will be full after 4-5 years. The rest take longer than 5 years (24%), 2-3 years (10%) and some are never full (22%). Once the SPL is full different follow-up actions are taken by the respondents as depicted in Figure 8.9. Due to the fact that some of the full pit latrines are used for planting (13%) and some are taken up for fertilizer (1%), the concept of resource recovery has been in practice for a long time almost in about one fifth of the households.
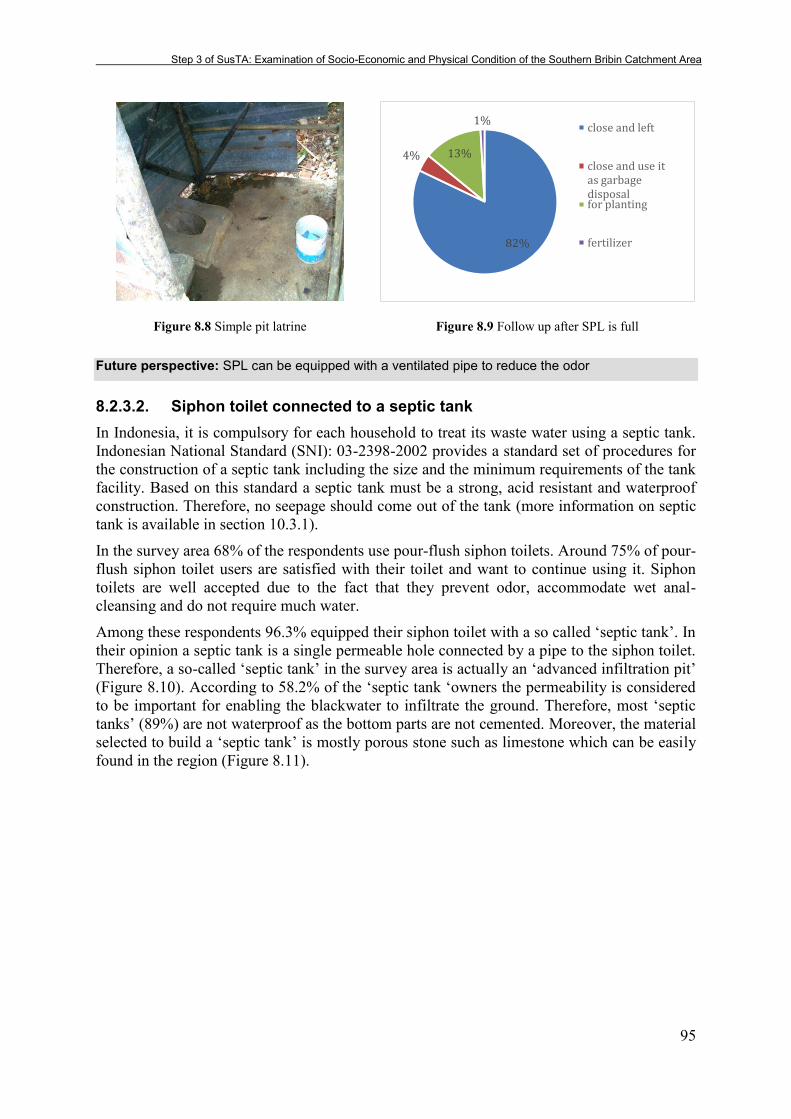
Step 3 of SusTA: Examination of Socio-Economic and Physical Condition of the Southern Bribin Catchment Area
95
Figure 8.8 Simple pit latrine
Figure 8.9 Follow up after SPL is full
Future perspective: SPL can be equipped with a ventilated pipe to reduce the odor
8.2.3.2. Siphon toilet connected to a septic tank In Indonesia, it is compulsory for each household to treat its waste water using a septic tank. Indonesian National Standard (SNI): 03-2398-2002 provides a standard set of procedures for the construction of a septic tank including the size and the minimum requirements of the tank facility. Based on this standard a septic tank must be a strong, acid resistant and waterproof construction. Therefore, no seepage should come out of the tank (more information on septic tank is available in section 10.3.1).
In the survey area 68% of the respondents use pour-flush siphon toilets. Around 75% of pour-flush siphon toilet users are satisfied with their toilet and want to continue using it. Siphon toilets are well accepted due to the fact that they prevent odor, accommodate wet anal-cleansing and do not require much water.
Among these respondents 96.3% equipped their siphon toilet with a so called ‘septic tank’. In
their opinion a septic tank is a single permeable hole connected by a pipe to the siphon toilet. Therefore, a so-called ‘septic tank’ in the survey area is actually an ‘advanced infiltration pit’
(Figure 8.10). According to 58.2% of the ‘septic tank ‘owners the permeability is considered
to be important for enabling the blackwater to infiltrate the ground. Therefore, most ‘septic
tanks’ (89%) are not waterproof as the bottom parts are not cemented. Moreover, the material selected to build a ‘septic tank’ is mostly porous stone such as limestone which can be easily found in the region (Figure 8.11).
82%
4% 13%
1% close and left
close and use it as garbage disposal for planting
fertilizer
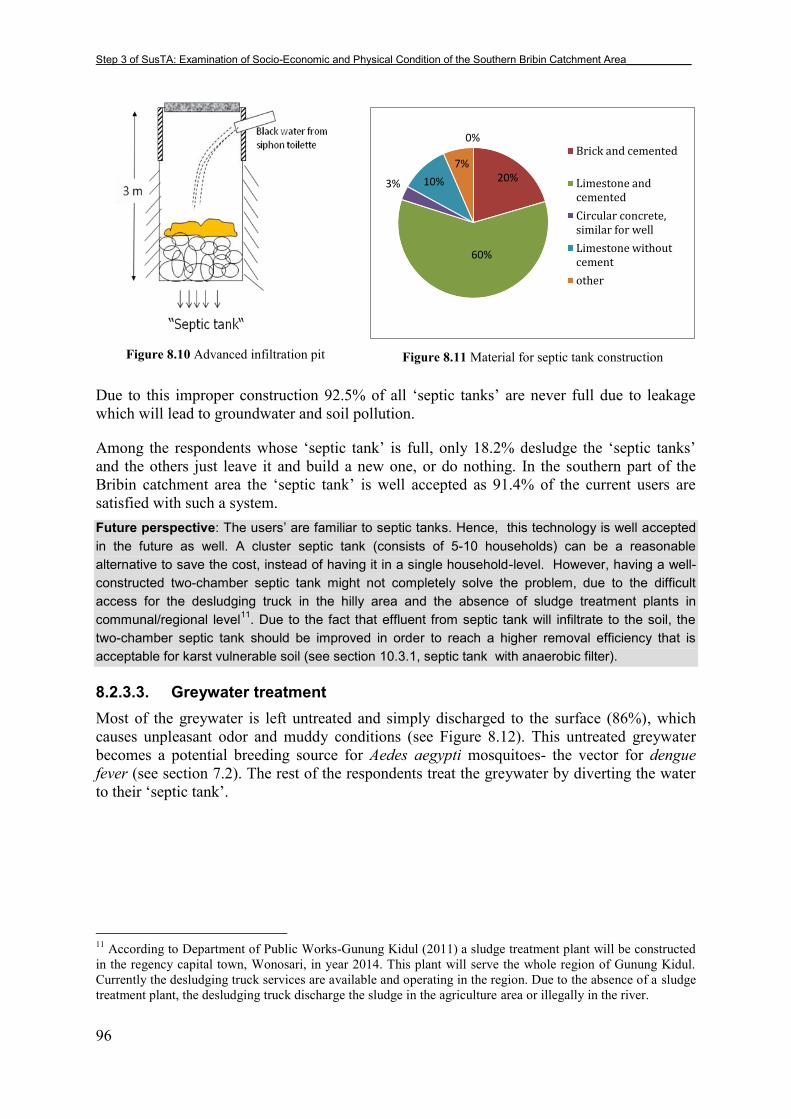
Step 3 of SusTA: Examination of Socio-Economic and Physical Condition of the Southern Bribin Catchment Area___________
96
Figure 8.10 Advanced infiltration pit
Figure 8.11 Material for septic tank construction
Due to this improper construction 92.5% of all ‘septic tanks’ are never full due to leakage
which will lead to groundwater and soil pollution.
Among the respondents whose ‘septic tank’ is full, only 18.2% desludge the ‘septic tanks’
and the others just leave it and build a new one, or do nothing. In the southern part of the Bribin catchment area the ‘septic tank’ is well accepted as 91.4% of the current users are
satisfied with such a system. Future perspective: The users’ are familiar to septic tanks. Hence, this technology is well accepted in the future as well. A cluster septic tank (consists of 5-10 households) can be a reasonable alternative to save the cost, instead of having it in a single household-level. However, having a well-constructed two-chamber septic tank might not completely solve the problem, due to the difficult access for the desludging truck in the hilly area and the absence of sludge treatment plants in communal/regional level11. Due to the fact that effluent from septic tank will infiltrate to the soil, the two-chamber septic tank should be improved in order to reach a higher removal efficiency that is acceptable for karst vulnerable soil (see section 10.3.1, septic tank with anaerobic filter).
8.2.3.3. Greywater treatment Most of the greywater is left untreated and simply discharged to the surface (86%), which causes unpleasant odor and muddy conditions (see Figure 8.12). This untreated greywater becomes a potential breeding source for Aedes aegypti mosquitoes- the vector for dengue fever (see section 7.2). The rest of the respondents treat the greywater by diverting the water to their ‘septic tank’.
11 According to Department of Public Works-Gunung Kidul (2011) a sludge treatment plant will be constructed in the regency capital town, Wonosari, in year 2014. This plant will serve the whole region of Gunung Kidul. Currently the desludging truck services are available and operating in the region. Due to the absence of a sludge treatment plant, the desludging truck discharge the sludge in the agriculture area or illegally in the river.
0%
20%
60%
3% 10%
7% Brick and cemented
Limestone and cemented
Circular concrete, similar for well
Limestone without cement
other

Step 3 of SusTA: Examination of Socio-Economic and Physical Condition of the Southern Bribin Catchment Area
97
Figure 8.12 Existing grey water discharge
In general 55% of the respondents are satisfied with their existing greywater condition. The rest who are not satisfied (45%) still wish for a better greywater management, for instance having a greywater treatment with possibility for reuse. Most respondent wish to water their home garden and prepare drinking water for their cattles using treated greywater (Figure 8.13).
Figure 8.13 Purposes of reusing treated greywater
Future perspective: Depending on the discharge flow, greywater can actually be collected and treated or even reused. A simple vertical bed might filter the greywater before it is discharged into the ground. If the flow is adequate for reuse, a simple horizontal-flow planted filter (see section 10.5.1) can be applied.
8.2.3.4. Solid waste management The villages in the southern part of Bribin are not covered by any solid waste service. Therefore, the community has to handle the waste at the household level. There are various ways to manage the biodegradable organic waste in the areas as depicted in Figure 8.14. Most respondents burn their organic waste (52%), while 25% use it for instance to feed the cattle or mix it with cattle dung to make compost. 16% of the respondents burry their organic waste.
Most non-biodegradable waste is burnt (76%), burried (8%) or collected separately from the organic waste and reused (7%) as depicted in Figure 8.15. Respondents who separate non-biodegradable waste admit that they have difficulties managing the sorted waste. Due to the
53%
4%
39%
4% watering the plants
livestock cleaning
livestock drinking/fishery
toillet flushing

Step 3 of SusTA: Examination of Socio-Economic and Physical Condition of the Southern Bribin Catchment Area___________
98
remote location of the villages there is no enterpreneur interested in taking care of the separated waste. The waste (e.g. containers, packages) can sometimes be reused in the household but the ones which cannot be reused for household purposes are burnt.
Figure 8.14 Biodegradable organic waste handling
Figure 8.15 Non-biodegradable waste handling
8.2.4. Nutrients and Energy Issues Wastewater is actually nutrient and energy source. The largest nutrient contribution of nitrogen (N), phosphorous (P) and potassium (K) originates from yellowwater followed by brownwater. This nutrient can become valuable source for soil conditioner or natural fertilizer. Brownwater contains fewer nutrients than yellowwater, but becomes potential source of biogas.
Besides black- and greywater from human activities, cattles (cows and goats) generate significant amounts of wastes in the study area. Cattle dung is collected nearby the stall during the rainy season and dried during the dry season for further use as fertilizer. However, it cannot be guaranteed that the dung does not flow to the waterways and entering the sinkholes during the rainy season.
Most of the respondents (66.5%) mainly rely on organic fertilizer which is made from pure cattle dung or sometimes mixed with leaves, hay and organic waste. Normally, farmers who have cattles will make their own organic fertilizer. When the fertilizer production is insufficient, they will buy additional mineral fertilizer. The price of this mineral fertilizer is considered to be too high by 58% of the respondents.
Figure 8.16 Spreading organic fertilizer on the field
Figure 8.17 Biomass for cooking
Concerning energy sources for cooking, many respondents use more than one sources for cooking. 68.2% of respondents in the area use liquid natural gas as their main energy source for cooking, while 94.6% of respondents use biomass (wood) as their main or second energy source for cooking (Figure 8.17).
59% 25%
16%
0% burning
reuse
burrying
dispose it to the river/cave
76%
5% 8%
7% 4% burning
dispose it to cave, sinkhole, or river
burrying
waste separation
others
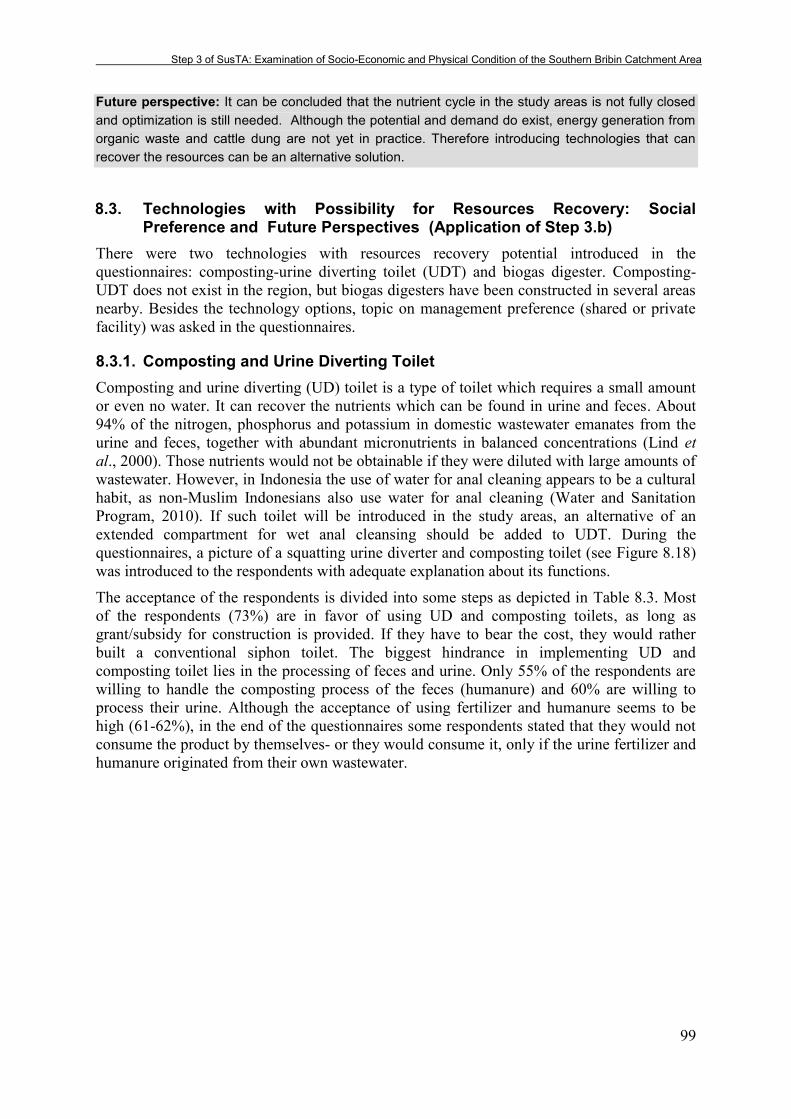
Step 3 of SusTA: Examination of Socio-Economic and Physical Condition of the Southern Bribin Catchment Area
99
Future perspective: It can be concluded that the nutrient cycle in the study areas is not fully closed and optimization is still needed. Although the potential and demand do exist, energy generation from organic waste and cattle dung are not yet in practice. Therefore introducing technologies that can recover the resources can be an alternative solution.
8.3. Technologies with Possibility for Resources Recovery: Social Preference and Future Perspectives (Application of Step 3.b)
There were two technologies with resources recovery potential introduced in the questionnaires: composting-urine diverting toilet (UDT) and biogas digester. Composting- UDT does not exist in the region, but biogas digesters have been constructed in several areas nearby. Besides the technology options, topic on management preference (shared or private facility) was asked in the questionnaires.
8.3.1. Composting and Urine Diverting Toilet Composting and urine diverting (UD) toilet is a type of toilet which requires a small amount or even no water. It can recover the nutrients which can be found in urine and feces. About 94% of the nitrogen, phosphorus and potassium in domestic wastewater emanates from the urine and feces, together with abundant micronutrients in balanced concentrations (Lind et al., 2000). Those nutrients would not be obtainable if they were diluted with large amounts of wastewater. However, in Indonesia the use of water for anal cleaning appears to be a cultural habit, as non-Muslim Indonesians also use water for anal cleaning (Water and Sanitation Program, 2010). If such toilet will be introduced in the study areas, an alternative of an extended compartment for wet anal cleansing should be added to UDT. During the questionnaires, a picture of a squatting urine diverter and composting toilet (see Figure 8.18) was introduced to the respondents with adequate explanation about its functions.
The acceptance of the respondents is divided into some steps as depicted in Table 8.3. Most of the respondents (73%) are in favor of using UD and composting toilets, as long as grant/subsidy for construction is provided. If they have to bear the cost, they would rather built a conventional siphon toilet. The biggest hindrance in implementing UD and composting toilet lies in the processing of feces and urine. Only 55% of the respondents are willing to handle the composting process of the feces (humanure) and 60% are willing to process their urine. Although the acceptance of using fertilizer and humanure seems to be high (61-62%), in the end of the questionnaires some respondents stated that they would not consume the product by themselves- or they would consume it, only if the urine fertilizer and humanure originated from their own wastewater.

Step 3 of SusTA: Examination of Socio-Economic and Physical Condition of the Southern Bribin Catchment Area___________
100
Table 8.3 Acceptance of respondents on CUDT
Steps Acceptance
Yes (%) No (%) Using composting and
UD toilet 73 27
Processing urine 60 40 Processing feces 55 45
Using urine fertilizer 62 38 Using humanure 61 39
Figure 8.18 Squatting urine diverter (Photograph taken by: Lehn, 2010)
Figure 8.19 Reasons for not using composting UDT
For those who are not in favor of composting and UD toilet, the arguments are depicted in Figure 8.19. Many of those respondents are mothers representing their children, and old people who will have difficulties shifting position when using the toilet. Future perspective: As advancement of SPL, composting and UDT in household level, which requires less water, is technically feasible to be used. The main hindrance of having composting-UDT is the acceptance of the end product (humanure) and society’s perception/ mindset on such toilet.
The society is familiar and accept a wet system. Therefore it is difficult to shift this mind with environmental arguments (e.g. closing the nutrient loop, water saving) or economic reasons (e.g. nutrient recovery, less maintenance cost). The UDT can only be accepted, if a full-cycle support system exists e.g. demand of humanure in the market, existence of service and enterpreneur for UDT’s operation and maintenance, and financial and institutional support from the authority. The
implementation of UDT will not to be long lasting, if only a few households install the UDT, while the rest of the households still use a conventional system.
8.3.2. Biogas digester A biogas digester has two main products: slurry (digested sludge) and biogas. These products can be recovered by feeding the digester either with one of the sources or combination of cattle dung, human feces and kitchen waste (more information refer to section 10.3.2). In average a household in the research areas owns two cows with a dung production of 6000 kg/year. Normally, the dung is dried in the sunlight and used as organic fertiliser. Most of the respondents (53%) are interested in using biogas from cattle dung but only 25% are willing to use biogas from human feces. Around 22% of the respondents are unsure to use biogas from
12%
65%
16%
7% uncomfortable
should shift positions
prefer present toilets
other

Step 3 of SusTA: Examination of Socio-Economic and Physical Condition of the Southern Bribin Catchment Area
101
both sources. Among those who are unsure, 51% cannot imagine preparing their meal with biogas, 40% think that biogas might be improper due to bad odor and the rest (9%) refuses it due to religious reasons (najis). The application of slurry from cattle dung for agriculture is highly accepted, while the application of humanure (slurry from human feces) is not accepted. Energy and nutrient recovery seems to be a low priority due to the lack of knowledge of the respondents on biodigesting. On the other side, nutrient demand is actually a big issue in this agricultural area. Future perspective: Biogas digester can actually be one solution which accommodates the recovery of resources from blackwater, kitchen waste and cattle dung. When blackwater (human feces) becomes the input of the digester, the plant should be constructed in a household level- with assumption that user is willing to use the end product coming from their own feces. In implementing a biogas digester, the water availability at the household level must be calculated carefully due to the fact that the technology requires transportation and dillution of the feces and cattle dung.
8.3.3. Public sanitation facility A public sanitation facility (washing, bathing and toilet) does not gain as much interest as in the previous decades of 80’s-90’s (stated by 50.3% respondents), although some respondents (49.7%) still wish to have one. Around 82% of the respondents who are not in favor mention that privacy is important. Therefore, they would like to have their own bathroom and toilet at home. The rest (18%) thinks that a public facility is not attractive as they have to leave the house and queue before using the facility. There are several reasons why people still want to have public facilities. The households in communities who have to carry water to their houses wish to save their own water at home (53.5%) by using a public facility. Around 21.7% wish to use a better public facility which they cannot obtain at home at their own expense. The rest (15.9%) wishes to have public facilities for their guests/relatives because they feel ashamed of their own bathroom. Some would like to meet neighbors during their stay at the public facility (8.9%). Future perspective: A public sanitation facility does not seem to be an alternative in the future. When the economic situation becomes better, people will tend to build their own facility. The need to have social gatherings with neighbors in a public facility is not as high as in the past. Privacy seems to be an important issue today and in the future.
Based on the aforementioned results, a set of criteria to preliminary select the wastewater technology options in Pucanganom village is developed (see section 10.1). This set of criteria serves the function as a technologies screener. Technologies which fulfill the criteria will be further evaluated in a technology assessment matrix (refer to section 10.6).

Step 4 of SusTA: Contextualization of Technology Assessment Process_________________________________
102
9. Step 4 of SusTA: Contextualization of the Technology Assessment Process
This first part of this chapter (section 9.1) discusses the basic principles of the development of the sustainability-based technology assessment indicators. As the application of step 4.a, these indicators are then ranked by the relevant stakeholder groups in section 9.2. After the ranking process, criteria fulfillment of indicators were developed in section 9.3 (as application of step 4.b).
4 Contextualization of Technology Assessment Process (CTX step) 4.a Rank 13 technology assessment indicators based on stakeholder groups’ priorities.
*Relevant stakeholders can be institutions, practitioners, beneficiaries- based on the result of step 1.c. Method for indicators ranking: separate discussion with each stakeholder group
T A set of sustainability-based technology assessment indicators (for step 4.a, 4.b, and 5.c) is provided. The set consists of 13 indicators.
4.b Develop the criteria for indicators’ rating scale together with the relevant stakeholders (identified from 1.c). The criteria describe what is meant by ‘low-medium-high fulfillment’.
T
Each indicator has a rating scale (low-medium-high) to correspond to the technology’s
degree of fulfillment of the indicator. However, each project area has different criteria on what is meant by ‘low-medium-high fulfillment’. References to modify these criteria (based on analytical generalization) are provided.
9.1. Development of a Set of Sustainability-Based Technology Assessment Indicators (Designing Tool for Step 4.a)
In this dissertation, a set of sustainability-based technology assessment indicators is developed based on the integrative approach for sustainable development (Kopfmüller et al., 2001).
The comprehensiveness of a sustainability concept requires many different aspects to be developed and measured. Nevertheless, to be applicable for decision making, indicators should be limited in number according to their purpose. Therefore the selection of this set of indicators considers the following factors:
the minimum requirement a technology should fulfill for sustainable development. Although the indicators are limited in number, they should be able to assess the most essential aspects a wastewater technology should fulfill
the relevant problems to be addressed in developing countries (e.g. financial, society mind-set, energy crisis, user/operator level of knowledge, health status). These problems have been been described in Chapter 7.
the data availability in developing countries, particularly in the project area. In order to avoid ‘measuring the immeasurable’, the selection of indicators should refer to data
availability in developing countries
The selected indicators are presented in Table 9.1.

Step 4 of SusTA: Contextualization of Technology Assessment Process
103
Table 9.1 Selected rules and indicators developed based on the Helmholtz concept
Rules Indicators
Protection of human health
Health risks caused by the system Refers to potential health impact in dealing with a sanitation system and the ability of the system to break the cycle of diseases
Ensuring satisfaction of basic needs
(sanitation)
Compatibility with the existing system (in case an existing system is available) Refers to the technical characteristics of a sanitation system regarding its functionality whenconnected to an existing system Investment cost Refers to the construction cost (land, material, manpower) Operational and maintenance cost Refers to the operational and maintenance cost (expenditure for personnel, energy supply, water supply, chemicals, spare parts, etc.) Technical skills required to operate and maintain the system Refers to the simplicity of the system in relation to its operation, maintenance and level of personnel skill required Possibility of minor problems to be fixed within reasonable repair time Refers to the availability of materials and support during operational phases, and an indication of whether procurement and services are available within reasonable repair time
Sustainable use of non- and renewable resources
Land required for the treatment plant Indication of the land needed to construct and operate the system Natural resource consumption to operate the whole system i Indication of the use of additional natural resouces required to operate the system Energy (electricity, fossil fuels) required to operate the system Indication of the use of resources needed to operate the system Potential nutrient recovery (in case resources recovery is applied) Refers to the usable by- and end product of the system Potential energy recovery (in case resource recovery is applied) Refers to the usable by- and end product of the system
Sustainable use of the environment as a sink
System’s removal efficiency ii
Refers to the technical function and ability of the system to remove pollutants and meet the required standards
Participation in social decision-making
processes
Public preference of technology Indication of public acceptance for using, maintaining and sustaining the system
i : natural resource in this context is meant as a scarce resource, that is needed to operate the sanitation system. In the case study, water is scarce but nevertheless is required to operate the system.
ii : Total Suspended Solids (TSS) and Biochemical Oxygen Demand (BOD) are two universally used effluent standards by which the performace of treatment plant is judged for regulatory control purposes (Metcalf and Eddy, 2003). Therefore TSS and/or BOD removal efficiency can be used as indicator to express technical functionality.

Step 4 of SusTA: Contextualization of Technology Assessment Process_________________________________
104
9.2. Defining Stakeholders’ Priority Concerning Indicators (Application of Step 4.a)
As already mentioned in stakeholders analysis (section 6.4), the main stakeholders in wastewater sector are:
- institutions (authority, governmental agency), - practitioners (non-governmental organization, consultants) and - users/beneficiaries (common users and users who also serve as village administrators
and operators).
In a top-down planning culture, usually the priorities and needs of the community in relation to water and sanitation projects are defined by authorities and are based on their perceptions of what is needed for the target beneficiaries. Meanwhile, the beneficiaries can not express their own interests and also feel afraid to express their opinions in front of the authority, due to hierarchy in the society12. Most beneficiaries in rural areas feel that the authorities have a higher position. If the beneficiaries’ opinions contradict with the authority’s opinion, they
fear that the project/aid will be cancelled. Therefore they prefer to be silent in front of the authority.13 In the end, a gap between demand and response occurs, which can lead to the disfunctional technology. To avoid this problem, discussions with involved stakeholders (practitioners, institution, users) should be conducted to accommodate stakeholders’
preferences and priorities on technology. In this case study, the discussions were conducted separately to enable each stakeholder group to express their opinions freely, without influence from other more dominant stakeholder groups. This separation might be “against” the ideal practice of a participatory approach (e.g. in a workshop, focus group discusion), where all stakeholders sit together and have equal right to express their opinion.
However, there are several arguments that support this stakeholders separation. Many recent studies acknowledge that guided or manipulated participatory processes enable better-placed stakeholders to take advantage of the open and horizontal process for their own ends (Lüthi, 2012). Similarly, Fung and Wright (2001) in Lüthi (2012) argue that the real danger of participatory decision-making is that some participants will use their power to manipulate and enhance positions motivated by particular interests. In Javanese culture (which strongly influences the people in the area) the situation is often detected to be like that. Therefore although in the end the results of the discussion were shared to all stakeholders, the process was kept separate to avoid this manipulation.
During the discussion, it was obvious that experts/practitioners, institutions, and users have their own defined functions and levels of involvement in the planning process. Therefore their interests also differ from each other, as presented in Table 9.2.
12This attitude is influenced by the Javanese concept of “ngrumangsani”-behaving according to one’s
position/hierarchy in the society and “ngajeni”- giving respect to someone in higher strata (refers to section 6.3.2). 13 The Javanese concept of “rukun”- harmonious social appearance, emphasizes in accepting each other without argument. This is also translated as avoidance of open conflict and arguments (refers to section 6.3.2)
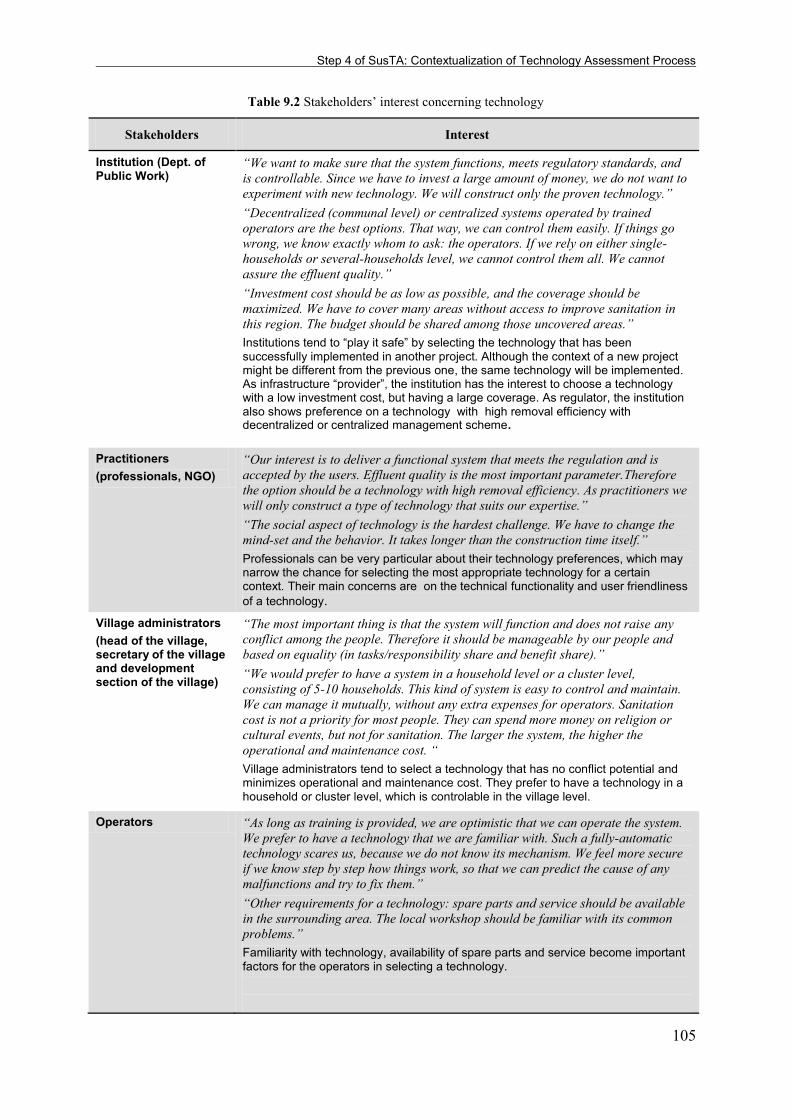
Step 4 of SusTA: Contextualization of Technology Assessment Process
105
Table 9.2 Stakeholders’ interest concerning technology
Stakeholders Interest
Institution (Dept. of Public Work)
“We want to make sure that the system functions, meets regulatory standards, and is controllable. Since we have to invest a large amount of money, we do not want to experiment with new technology. We will construct only the proven technology.” “Decentralized (communal level) or centralized systems operated by trained operators are the best options. That way, we can control them easily. If things go wrong, we know exactly whom to ask: the operators. If we rely on either single- households or several-households level, we cannot control them all. We cannot assure the effluent quality.” “Investment cost should be as low as possible, and the coverage should be maximized. We have to cover many areas without access to improve sanitation in this region. The budget should be shared among those uncovered areas.” Institutions tend to “play it safe” by selecting the technology that has been successfully implemented in another project. Although the context of a new project might be different from the previous one, the same technology will be implemented. As infrastructure “provider”, the institution has the interest to choose a technology with a low investment cost, but having a large coverage. As regulator, the institution also shows preference on a technology with high removal efficiency with decentralized or centralized management scheme.
Practitioners (professionals, NGO)
“Our interest is to deliver a functional system that meets the regulation and is accepted by the users. Effluent quality is the most important parameter.Therefore the option should be a technology with high removal efficiency. As practitioners we will only construct a type of technology that suits our expertise.” “The social aspect of technology is the hardest challenge. We have to change the
mind-set and the behavior. It takes longer than the construction time itself.” Professionals can be very particular about their technology preferences, which may narrow the chance for selecting the most appropriate technology for a certain context. Their main concerns are on the technical functionality and user friendliness of a technology.
Village administrators (head of the village, secretary of the village and development section of the village)
“The most important thing is that the system will function and does not raise any conflict among the people. Therefore it should be manageable by our people and based on equality (in tasks/responsibility share and benefit share).” “We would prefer to have a system in a household level or a cluster level, consisting of 5-10 households. This kind of system is easy to control and maintain. We can manage it mutually, without any extra expenses for operators. Sanitation cost is not a priority for most people. They can spend more money on religion or cultural events, but not for sanitation. The larger the system, the higher the operational and maintenance cost. “ Village administrators tend to select a technology that has no conflict potential and minimizes operational and maintenance cost. They prefer to have a technology in a household or cluster level, which is controlable in the village level.
Operators “As long as training is provided, we are optimistic that we can operate the system.
We prefer to have a technology that we are familiar with. Such a fully-automatic technology scares us, because we do not know its mechanism. We feel more secure if we know step by step how things work, so that we can predict the cause of any malfunctions and try to fix them.” “Other requirements for a technology: spare parts and service should be available in the surrounding area. The local workshop should be familiar with its common problems.” Familiarity with technology, availability of spare parts and service become important factors for the operators in selecting a technology.

Step 4 of SusTA: Contextualization of Technology Assessment Process_________________________________
106
Stakeholders Interest
Users “We have no idea on which system is best for us. Whatever it is, we want to have the toilet (user interface) at home, not shared, to guarantee privacy. It should be nice and clean, and not embarassing for our guests.” “Regarding the treatment option: if there should be a share in responsibility and end product, we can share with a maximum of two other households. We do not like to have problems with neighbors concerning the share. The most important thing is that we can operate the technology, without any technical problem and financial burden.” “Concerning resources recovery: if it takes too much effort to recover the
resources, then we would prefer not to have any resources recovery. We’ve already spent a lot of time on agriculture works and cattles every day, and do not desire any additional jobs to take care of a technology.” Users would like to have privacy and ability to operate the technology independently from others. They also do not want to spend too much time dealing with the operation and maintenance of a technology, eventhough resources can be recovered by the technology.
Depending on their role, each stakeholder has different preferences and sometimes contradictions with others. Despite the differences in preferences and contradictions, a decision should be made in the best way. After the discussion, each stakeholder group was given a chance to rank the indicators depicted in Table 9.1. In this ranking process, the stakeholders were able to express their level of preference for indicators, which will be used to evaluate several technology options. Considering the fact that in this case study the stakeholder groups do not have equal knowledge on criteria to select technology, a simple method was used to rank the indicators. A list of indicators was given to each of the stakeholder group and they were ask to rank these 13 indicators from the most to the least important.
After this ranking process, three models were used to gain insight into which assumptions are critical, i.e. which assumptions affect the ranking. This analysis can serve as a simplified sensitivity analysis for this case study. The process involves various ways of changing input values of the model (i.e. the weight of power) to see the effect on the output value (i.e. the final indicators ranking).
- Model I: Equal influence assumption: it is assumed that each group of stakeholders have the same influence in decision-making. The stakeholders rank the indicators based on their interest, and the final result of the ranking is based on the average sum of each indicator.
- Model II: Project-based assumption: it is assumed that the most influential stakeholder that makes decisions is the institution is the investor (refer to section 6.3 and 6.4 degree of influence). Therefore the institution has a more important share in decision-making, which is expressed by a higher ratio of power. Only when the institution provides an opportunity for beneficiaries to play a bigger role in decision-making will the beneficiaries be involved.
- Model III: Long-term perspective: it assumed that the beneficiaries are the most important stakeholder (see section 6.3 and 6.4 degree of importance). They are important because they are the ones who will operate, maintain and finally sustain the system in a long-term. Therefore the beneficiaries have a higher ratio of power in decision-making.

Step 4 of SusTA: Contextualization of Technology Assessment Process
107
9.2.1. Model I: Equal Influence Assumption Assuming that each stakeholder has the same power and there is no weight of power applied, the results are depicted in Table 9.3 and Figure 9.1.
Table 9.3 Stakeholders ranking on indicators, based on equal influence
Indicators Abbr. Stakeholders
Average ranking i
Final ranking
ii Practitioners
(a) Institution
(b) Users
(c)
Investment cost Invest 5 1 2 2.7 1
Operational and maintenance cost OM 6 2 1 3.0iii 2
Public preference on technology Prefer 2 4 3 3.0iii 3
Technical skills required to operate and maintain the system Skill 3 5 4 4.0 4
Possibility of minor problems to be fixed within reasonable repair time Fix 4 6 5 5.0iv 5
Total Suspended Solids (TSS) removal TSS 1 3 11 5.0iv 6
Land required for the treatment plant Land 7 7 8 7.3 7
Water consumption to operate the whole system Water 8 9 6 7.7 8
Energy (electricity, fossil fuels) required to operate the system EnCon 9 8 7 8.0 9
Compatibility with the existing system Connect 10 10 9 9.7 10
Health risks caused by the system Health 11 11 10 10.7 11
Potential nutrient recovery NutRec 12 12 12 12.0 12
Potential energy recovery EnRec 13 13 13 13.0 13 i : defined from (a+b+c)/3 ii : the smallest i value obtains the highest ranking (1) iii : although the rankings are the same, in this case study operational and maintenance cost gets the higher
ranking due to the fact that cost in general is considered more important than public preference (refer to the discussion summarized in Table 9.2)
iv : although the rankings are the same, in this case study possibility of repair has a higher ranking due to the fact that all three stakeholders rank this indicator at an average position (6,4,5), compared to TSS removal
Figure 9.1 Stakeholders ranking on indicators based on Model I. Equal influence’s assumption
0
2
4
6
8
10
12
14
Ra
nk
ing
Practitioners
Institution
Users

Step 4 of SusTA: Contextualization of Technology Assessment Process_________________________________
108
9.2.2. Model II: Project Perspective It is assumed that the institution is the most influential stakeholder (weight of 0.5), followed by practitioners (weight of 0.3), then users/beneficiaries (weight of 0.2). In order to operate the weight of power, the ranking should be converted into a scoring system. Therefore rank 1 will get the highest score of 13, and rank 13 will get the lowest score of 1 (Table 9.4).
Table 9.4 Conversion from ranking into score
Rank 1 2 3 4 5 6 7 8 9 10 11 12 13
Score 13 12 11 10 9 8 7 6 5 4 3 2 1
The result of applying weight into previous indicators ranking in presented in Table 9.5.
Table 9.5 Stakeholders’ ranking on indicators, based on project perspective
Indicators
Practitioners Institution
Users Sum
(a+b+c)/3 Ranki
Rank Score Score *0.3 (a)
Rank Score Score*
0.5 (b)
Rank Score Score*
0.2 (c)
Investment cost 5 9 2.7 1 13 6.5 2 12 2.4 11.6 1
Operational and maintenance cost 6 8 2.4 2 12 6 1 13 2.6 11.0 2
Public preference on technology 2 12 3.6 4 10 5 3 11 2.2 10.8 3
Technical skills required to operate and maintain the system
3 11 3.3 5 9 4.5 4 10 2.0 9.8 5
Possibility of minor problems to be fixed within reasonable repair time
4 10 3.0 6 8 4 5 9 1.8 8.8 6
Total Suspended Solids (TSS) removal 1 13 3.9 3 11 5.5 11 3 0.6 10.0 4
Land required for the treatment plant 7 7 2.1 7 7 3.5 8 6 1.2 6.8 7
Water consumption to operate the whole system 8 6 1.8 9 5 2.5 6 8 1.6 5.9ii 8
Energy (electricity. fossil fuels) required to operate the system
9 5 1.5 8 6 3 7 7 1.4 5.9ii 9
Compatibility with the existing system 10 4 1.2 10 4 2 9 5 1.0 4.2 10
Health risks caused by the system 11 3 0.9 11 3 1.5 10 4 0.8 3.2 11
Potential nutrient recovery 12 2 0.6 12 2 1 12 2 0.4 2.0 12
Potential energy recovery 13 1 0.3 13 1 0.5 13 1 0.2 1.0 13 i : the highest rank (1) is determined from the largest sum (a+b+c)/3 i i : water consumption and energy comsumption are ranked the same. In this case study, water consumption is
placed at a higher rank, due to the fact that water is scarcer in the region compared to energy
9.2.3. Model III: Long-term Perspective It is assumed that beneficiaries are the most important stakeholder (weight of 0.5), followed by institution (weight of 0.3) and practitioners (weight of 0.2). In order to operate the weight

Step 4 of SusTA: Contextualization of Technology Assessment Process
109
of power, the ranking should be converted to score system. Therefore rank 1 will get the highest score of 13, and rank 13 will get the lowest score of 1 (see Table 9.4).
Table 9.6 Stakeholders’ ranking on indicators, based on long-term perspective
Indicators
Practitioners Institution Users Sum
(a+b+c)/3 Ranki Rank Score Score*
0.2 (a)
Rank Score Score*
0.3 (b)
Rank Score Score*
0.5 (c)
Investment cost 5 9 1.8 1 13 3.9 2 12 6.0 11.7ii 2
Operational and maintenance cost 6 8 1.6 2 12 3.6 1 13 6.5 11.7ii 1
Public preference on technology 2 12 2.4 4 10 3.0 3 11 5.5 10.9 3
Technical skills required to operate and maintain the system
3 11 2.2 5 9 2.7 4 10 5.0 9.9 4
Possibility of minor problems to be fixed within reasonable repair time
4 10 2.0 6 8 2.4 5 9 4.5 8.9 5
Total Suspended Solids (TSS) removal 1 13 2.6 3 11 3.3 11 3 1.5 7.4 6
Land required for the treatment plant 7 7 1.4 7 7 2.1 8 6 3.0 6.5 8
Water consumption to operate the whole system
8 6 1.2 9 5 1.5 6 8 4.0 6.7 7
Energy (electricity. fossil fuels) required to operate the system
9 5 1.0 8 6 1.8 7 7 3.5 6.3 9
Compatibility with the existing system 10 4 0.8 10 4 1.2 9 5 2.5 4.5 10
Health risks caused by with the system 11 3 0.6 11 3 0.9 10 4 2.0 3.5 11
Potential nutrient recovery 12 2 0.4 12 2 0.6 12 2 1.0 2.0 12
Potential energy recovery 13 1 0.1 13 1 0.3 13 1 0.5 0.9 13
i : the highest rank (1) is determined from the largest sum (a+b+c)/3 ii : OM cost is considered more important than investment cost, since it reflects users’ concern in sustaining a
system
The comparison of the three assumptions is presented in Figure 9.2. It can be concluded that although weighting of power is applied, it does not change the ranking of indicators significantly, and only slightly affects the 1-8 ranks. This is due to the fact that each stakeholder group is already influenced by their “natural” interest, determined by their roles
(Table 9.2). Therefore the priorities are almost definite. In general, the stakeholders’ interests are devoted to economic, technical functionality and public acceptance of a technology. The concept of resources recovery, which is actually close to sustainability of resources, is still beyond their mind.
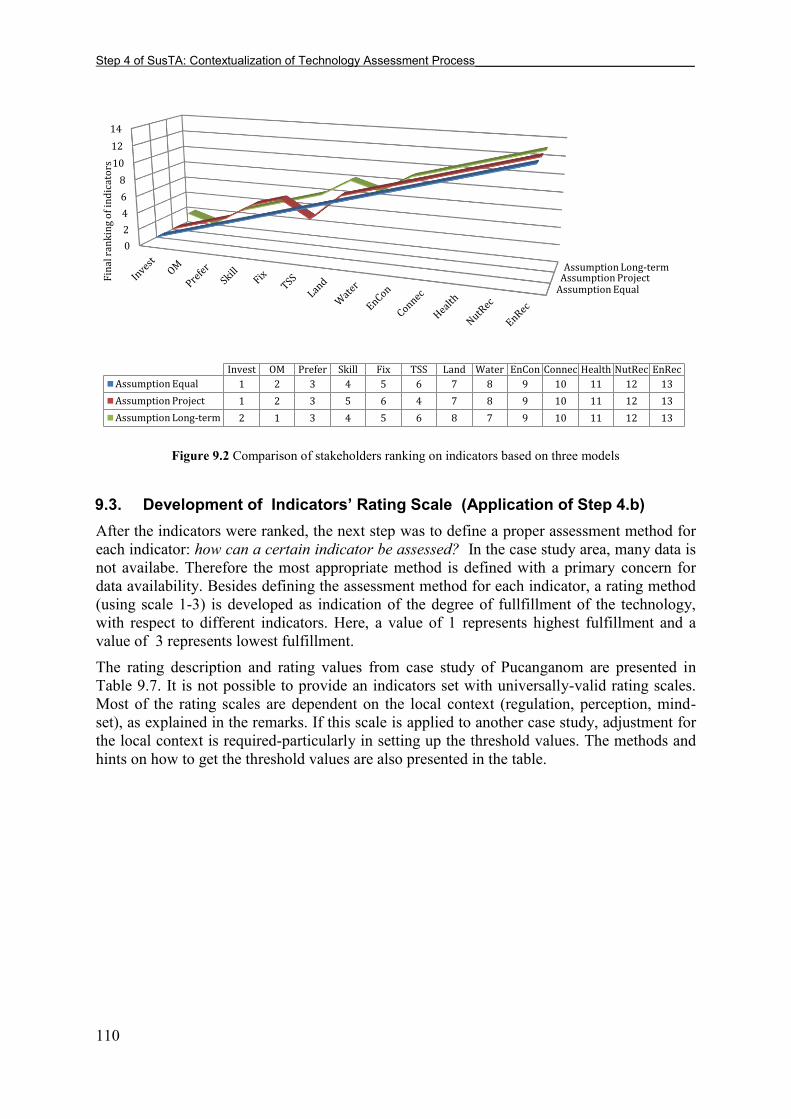
Step 4 of SusTA: Contextualization of Technology Assessment Process_________________________________
110
Figure 9.2 Comparison of stakeholders ranking on indicators based on three models
9.3. Development of Indicators’ Rating Scale (Application of Step 4.b) After the indicators were ranked, the next step was to define a proper assessment method for each indicator: how can a certain indicator be assessed? In the case study area, many data is not availabe. Therefore the most appropriate method is defined with a primary concern for data availability. Besides defining the assessment method for each indicator, a rating method (using scale 1-3) is developed as indication of the degree of fullfillment of the technology, with respect to different indicators. Here, a value of 1 represents highest fulfillment and a value of 3 represents lowest fulfillment. The rating description and rating values from case study of Pucanganom are presented in Table 9.7. It is not possible to provide an indicators set with universally-valid rating scales. Most of the rating scales are dependent on the local context (regulation, perception, mind-set), as explained in the remarks. If this scale is applied to another case study, adjustment for the local context is required-particularly in setting up the threshold values. The methods and hints on how to get the threshold values are also presented in the table.
Assumption Equal Assumption Project Assumption Long-term
0
2
4
6
8
10
12
14
Fin
al r
ank
ing
of
ind
icat
ors
Invest OM Prefer Skill Fix TSS Land Water EnCon Connec Health NutRec EnRec
Assumption Equal 1 2 3 4 5 6 7 8 9 10 11 12 13
Assumption Project 1 2 3 5 6 4 7 8 9 10 11 12 13
Assumption Long-term 2 1 3 4 5 6 8 7 9 10 11 12 13

Step 4 of SusTA: Contextualization of Technology Assessment Process
111
Table 9.7 Technology assessment indicators with rating scale 1-3
Nr. Indicators Measurement Scale
Hints to get the threshold value
Adaptation for other context 1
(highest fulfillment) 2
(moderate fulfillment) 3
(lowest fulfillment)
1 Investment cost (cost components: land, material, manpower)
Quantitative (USD/household)
< USD 438/HH USD 438-876/HH > USD 876 /HH The threshold values gained from Indonesian sanitation scheme budget (Sanimas, 2013). This value is the amount that the government should bear, with 2-4% of household contribution. Values might change with policy changes.
The threshold values should be adapted from the sanitation budget scheme in a certain country.
2 Operational and maintenance cost (cost components: energy and water required, spare parts/material, human resources, incentive)
Quantitative (USD/household. year)
< USD 14.4/HH.year USD 14.4-18.24 /HH.year
> USD 18.24/ HH.year
The values gained assuming that sanitation expense do not exceed 2% of the monthly disposable income (Asian Development Bank, 2008). Value might change due to economic improvement.
The threshold values can be obtained from percentage of monthly disposable income (e.g. 2%) or amount of willingness to pay.
3 Public preference on technology
Quantitative (% preference) based on users questionnaire, or
> 67% preference 33-67% preference < 33% preference The preference is gained from household questionnaire.
Besides questionnaire, workshop or focus group discussion can also be a method to find out public preference.
Semi-quantitative (high-low)
High All aspects of technology are in accordance with society’s
principles/norms (habits, religion and tradition).
Moderate Not all aspects of technology are suitable with society’s principles.
Modification/ customization is required to increase acceptance.
Low All aspects of technology are against society’s
basic principles (habits, religion and tradition).
In case questionnaire cannot be conducted, semi-quantitative assessment can be used as an alternative. This assesment is based on the accordance of the technology with society’s
principles.
Each society has its own principles, which differs from one to another. Therefore it should be clear, which values/ principles are valid for a certain context.

Step 4 of SusTA: Contextualization of Technology Assessment Process_________________________________
112
Nr. Indicators Measurement Scale
Hints to get the threshold value
Adaptation for other context 1
(highest fulfillment) 2
(moderate fulfillment) 3
(lowest fulfillment)
4 Technical skills required to operate and maintain the system
Semi-quantitative (high-low)
Low No special skill required. Information before dealing with the system is adequate.
Moderate Moderate skill required, can be obtained from training on regular basis.
High Skill specificity required, intensive training/education before dealing with the system is required.
The assessment is conducted semi-quantitatively. It considers the baseline knowledge and skills of available human resources.
Threshold values are applicable for other context
5 Possibility of minor problems to be fixed within reasonable repair time
Semi-quantitative (high-low)
High Procurement (material, service) and repair process is finished < 4 hours.
Moderate Procurement (material, service) and repair process is finished within 4-8 hours.
Low Procurement (material, service) and repair process is finished > 8 hours.
The values of reasonable time are gained from interviews with wastewater treatment plant operators and future operators in the pilot village. These values consider the distance/locations between the proposed technology and sources of material and service.
The values of reasonable time differ from one operator to another. In general it is influenced by the distance to support service and material shop (procurement time).
6 Total Suspended Solids (TSS) removal
Quantitative (% TSS removal)
> 70% TSS removal 50-70% TSS removal
< 50 % TSS removal TSS and BOD removal efficiency depends on the technology. However, the range of acceptable TSS and BOD removal value differs from one area to another, depending on the local regulation. The values in this case study are gained by considering the national regulation in Indonesia.
% TSS and BOD removal efficiency is calculated from the difference between TSS and BOD influent and intended TSS and BOD effluent defined by the regulation.
Biochemical Oxygen Demand (BOD) removal
Quantitative (% BOD removal)
> 70% BOD removal 50-70% BOD removal
< 50 % BOD removal
7 Land required for the plant
Quantitative (m2/household)
< 2 m2/HH 2-5 m2/HH > 5 m2/HH The values are gained from interviews in the pilot village. The range might
The threshold values depend greatly on the site conditions (e.g. high/low

Step 4 of SusTA: Contextualization of Technology Assessment Process
113
Nr. Indicators Measurement Scale
Hints to get the threshold value
Adaptation for other context 1
(highest fulfillment) 2
(moderate fulfillment) 3
(lowest fulfillment) differ from place to place
due to land availability. density area, available space in the area)
8 Water consumption to operate the whole system
Quantitative (liter/household. day)
< 40 l/HH.d
40 – 60 l/HH.d
> 60 l/HH.d
The values are gained from calculation based on questionnaires in the pilot village. They may differ from place to place due to the availability of water and water consumption.
The threshold values are influenced by the daily water consumption and water availability in the households.
9 Energy (electricity, fossil fuels) required to operate the system
Quantitative (kWh/household. year)
< 20kWh/ HH.y 20-40 kWh/ HH.y > 40 kWh/ HH.y The values are gained from interviews with pilot village authorities.
The threshold values are determined based on the energy supply condition in the community and household’s ability to
utilize extra energy.
10 Compatibility with the existing system (in case an existing system available)
Semi-quantitative (high-low)
High System can be easily installed or connected to the existing one, only minor adaptation is required.
Moderate Partial changes required to be compatible with the existing system.
Low The intended system cannot be connected to the existing system.
The assessment was conducted semi-quantitatively. It considers the baseline condition and the existing infrastructure where proposed technology will be installed.
Threshold values are applicable for other context
11 Health risks caused by the system
For assessing the technology: Semi-quantitative (low-high)
Low All aspects of technology minimize the contact between users/operators to wastewater and reduce risk of insect breeding.
Moderate Several aspects of the technology require contact between users/operator and wastewater, and there is a risk for insect breeding.
High In all aspects of technology, contact between users/ operator and waste-water is required. Insect breeding is a risk in the system.
The assessment was conducted semi-quantitatively by considering the exposure’s
chances of users/operators to wastewater and insects.
Threshold values are applicable for other context
For assessing the end product:
Low End product can be
Moderate End product of the
High End product still
This assessment was conducted semi-
Threshold values are applicable for other context

Step 4 of SusTA: Contextualization of Technology Assessment Process_________________________________
114
Nr. Indicators Measurement Scale
Hints to get the threshold value
Adaptation for other context 1
(highest fulfillment) 2
(moderate fulfillment) 3
(lowest fulfillment) Semi-quantitative (low-high)
utilized or consumed without causing negative health impact to the users
system requires further treatment before it can safely be utilized or consumed by users
contains pathogens and is not safe to be utilized or consumed
quantitatively by estimating the effect of the end product to the health of the users.
12 Potential nutrient recovery (in case resources recovery is applied)
Semi-quantitative (high-low)
High On-site nutrient recovery is possible at the household level (the loop is closed), resulting in direct benefit for users.
Moderate Semi off-site or off-site nutrient recovery is possible. No direct benefit for the user or the benefit should be shared based on agreement.
Low No resources recovery, or only off-site nutrient recovery is possible. Hence, no direct benefit for users.
This assessment was conducted semi-quantitatively, based on the scale where benefit is gained (on-site, semi-off site or off-site)
In this case study, data on influent and effluent’s
nutrient content does not exist. Generic data on technologies’ nutrient
removal is not available as well. Due to this data shortage, a range of technology’s nutrient
removal cannot be provided. For a case study with better data availability, the range can be provided quantitatively.
13 Potential energy recovery (in case resources recovery is applied)
Semi-quantitative (high-low)
High Technology can produce energy independently from another system, resulting in direct benefit for users.
Moderate Semi off-site energy recovery is possible. No direct benefit for the user or the benefit should be shared based on agreement.
Low No energy recovery or only off-site energy recovery is possible. Hence, no direct benefit for users.
This assessment was conducted semi-quantitatively, based on the scale where benefit is gained (on-site, semi-off site or off-site)
Threshold values are applicable for other context
Red writing : threshold values defined by stakeholders Blue writing: threshold values defined by author
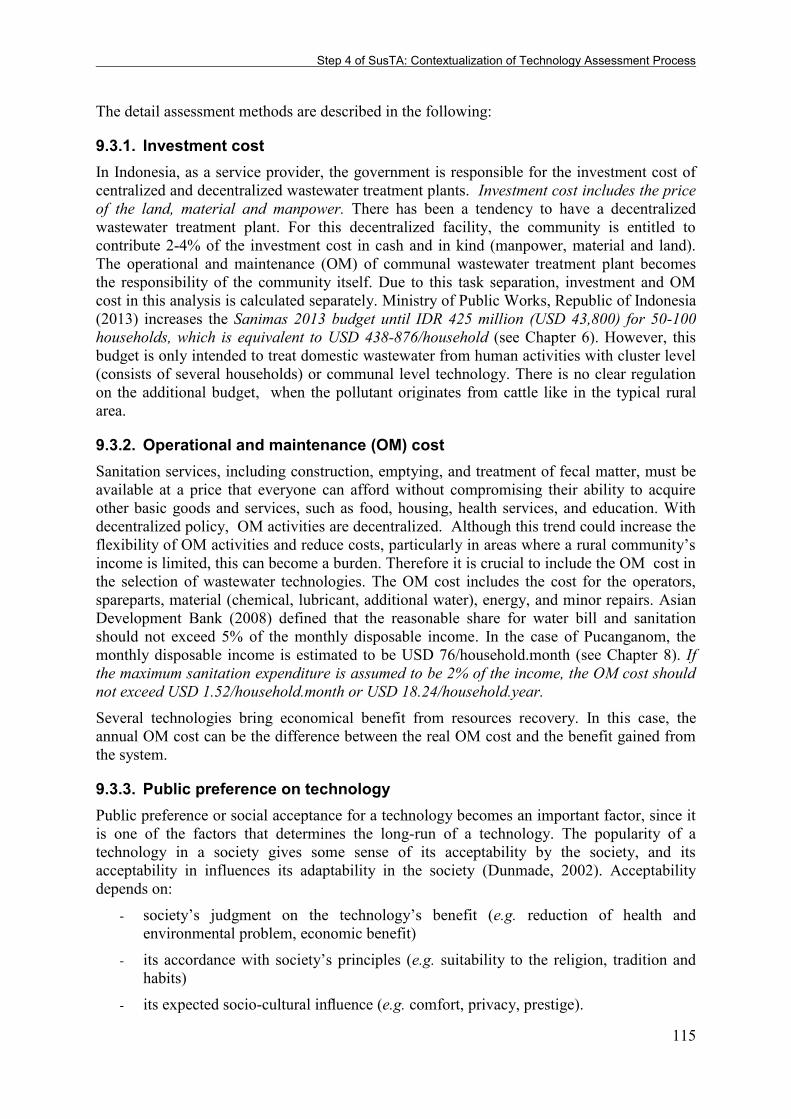
Step 4 of SusTA: Contextualization of Technology Assessment Process
115
The detail assessment methods are described in the following:
9.3.1. Investment cost In Indonesia, as a service provider, the government is responsible for the investment cost of centralized and decentralized wastewater treatment plants. Investment cost includes the price of the land, material and manpower. There has been a tendency to have a decentralized wastewater treatment plant. For this decentralized facility, the community is entitled to contribute 2-4% of the investment cost in cash and in kind (manpower, material and land). The operational and maintenance (OM) of communal wastewater treatment plant becomes the responsibility of the community itself. Due to this task separation, investment and OM cost in this analysis is calculated separately. Ministry of Public Works, Republic of Indonesia (2013) increases the Sanimas 2013 budget until IDR 425 million (USD 43,800) for 50-100 households, which is equivalent to USD 438-876/household (see Chapter 6). However, this budget is only intended to treat domestic wastewater from human activities with cluster level (consists of several households) or communal level technology. There is no clear regulation on the additional budget, when the pollutant originates from cattle like in the typical rural area.
9.3.2. Operational and maintenance (OM) cost Sanitation services, including construction, emptying, and treatment of fecal matter, must be available at a price that everyone can afford without compromising their ability to acquire other basic goods and services, such as food, housing, health services, and education. With decentralized policy, OM activities are decentralized. Although this trend could increase the flexibility of OM activities and reduce costs, particularly in areas where a rural community’s
income is limited, this can become a burden. Therefore it is crucial to include the OM cost in the selection of wastewater technologies. The OM cost includes the cost for the operators, spareparts, material (chemical, lubricant, additional water), energy, and minor repairs. Asian Development Bank (2008) defined that the reasonable share for water bill and sanitation should not exceed 5% of the monthly disposable income. In the case of Pucanganom, the monthly disposable income is estimated to be USD 76/household.month (see Chapter 8). If the maximum sanitation expenditure is assumed to be 2% of the income, the OM cost should not exceed USD 1.52/household.month or USD 18.24/household.year. Several technologies bring economical benefit from resources recovery. In this case, the annual OM cost can be the difference between the real OM cost and the benefit gained from the system.
9.3.3. Public preference on technology Public preference or social acceptance for a technology becomes an important factor, since it is one of the factors that determines the long-run of a technology. The popularity of a technology in a society gives some sense of its acceptability by the society, and its acceptability in influences its adaptability in the society (Dunmade, 2002). Acceptability depends on:
- society’s judgment on the technology’s benefit (e.g. reduction of health and environmental problem, economic benefit)
- its accordance with society’s principles (e.g. suitability to the religion, tradition and habits)
- its expected socio-cultural influence (e.g. comfort, privacy, prestige).

Step 4 of SusTA: Contextualization of Technology Assessment Process_________________________________
116
The acceptance of the technology will be high if all aspects of technology fulfill at least the second point (the accordance with society’s pricipals). Therefore preference is analyzed semi-quantitatively.
Besides semi-quantitatively, public preference on technology can be assessed quantitatively, in this case study using household questionnaires (see section 8.2.3 and 8.3). The aim is to get the degree of acceptance (represented with percentage of preference) on certain technologies that have potential to be implemented in the community.
9.3.4. Technical skills required to operate and maintain the system The inoperativeness of wastewater treatment facilities also occurs due to lack of maintenance conducted by a responsible person, or due to very complicated OM, which cannot be conducted by the community itself. Therefore, in the development phase of the facilities, it is important to consider the support system offered by the government (assistance, training), the skill of locally available people, and the OM requirement of the technology. The compatibility between these elements could determine the long-term operating success of the system.
In this analysis, the technical skill of local resources is defined as the upgraded skill obtained from training provided by the project/government and measured semi-quantitatively. A system is considered sustainable if it does not required too specific skill.
9.3.5. Possibility of minor problems to be fixed within reasonable repair time According to IRC and WHO (2000) in Brikké and Bredero (2003), a service is sustainable when it can be operated and maintained at the local level with limited, yet feasible, external support (e.g. technical assistance, training and monitoring). Maintenance also includes solving the minor problems that often occur in the system (e.g. clogging, minor cracking, breaking of minor spareparts). These common problems can be solved as long as resources and spare parts/material are available within reasonable time to repair the technology.
In general there are two main servicing resources required to solve the common problems: - trained personnel in the community;
- technicians, mechanics, plumbers and workshops within and outside the community.
Besides servicing resources, the availability and accessibility of spare parts should be one of the main factors that guarantee repairs of the technology. Before opting for a technology, the mechanism for supplying spare parts must be investigated, established and assured. Spare parts can be divided into three categories (Brikké and Bredero, 2003) :
- frequently needed spare parts, for which the accessibility should be as close as possible to the village (shop, mechanic);
- occasionally needed spare parts (every six months or every year), for which accessibility can be at a nearby major centre;
- major rehabilitation or replacement spare parts, for which accessibility can be at the local or regional level, or at the state capital.
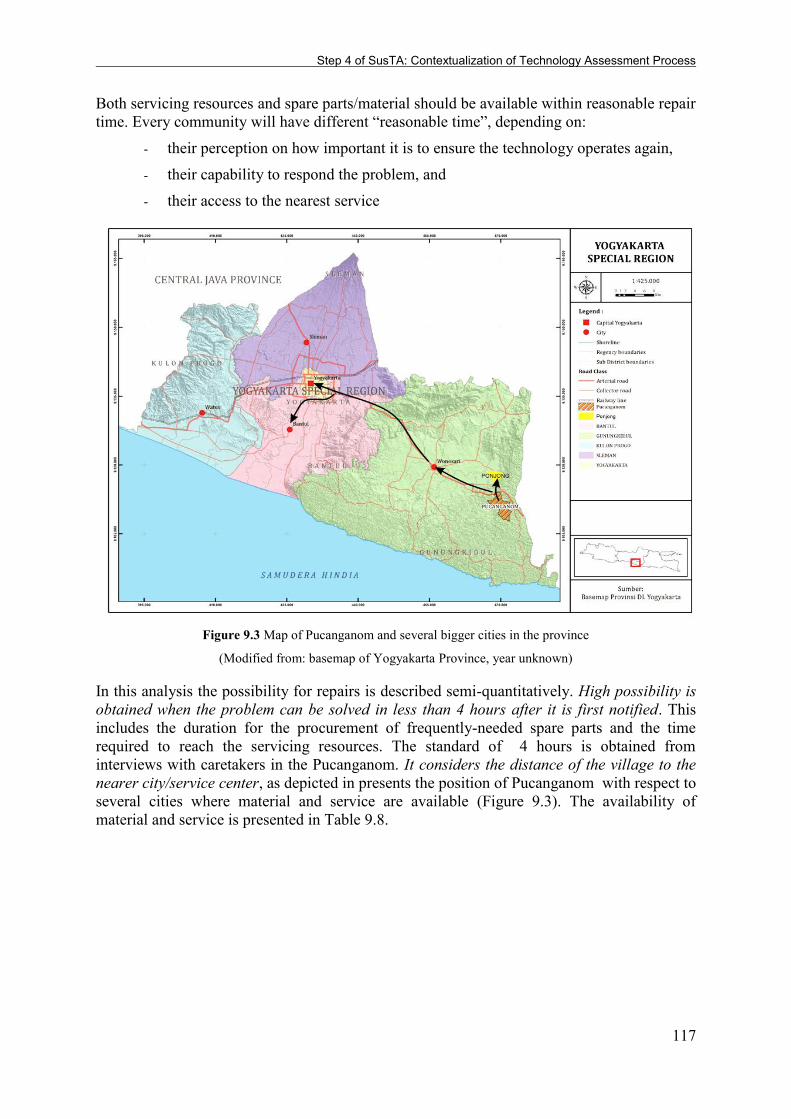
Step 4 of SusTA: Contextualization of Technology Assessment Process
117
Both servicing resources and spare parts/material should be available within reasonable repair time. Every community will have different “reasonable time”, depending on:
- their perception on how important it is to ensure the technology operates again,
- their capability to respond the problem, and
- their access to the nearest service
Figure 9.3 Map of Pucanganom and several bigger cities in the province
(Modified from: basemap of Yogyakarta Province, year unknown)
In this analysis the possibility for repairs is described semi-quantitatively. High possibility is obtained when the problem can be solved in less than 4 hours after it is first notified. This includes the duration for the procurement of frequently-needed spare parts and the time required to reach the servicing resources. The standard of 4 hours is obtained from interviews with caretakers in the Pucanganom. It considers the distance of the village to the nearer city/service center, as depicted in presents the position of Pucanganom with respect to several cities where material and service are available (Figure 9.3). The availability of material and service is presented in Table 9.8.

Step 4 of SusTA: Contextualization of Technology Assessment Process_________________________________
118
Table 9.8 Availability of material and service for Pucanganom
Location Travel time Availability
Ponjong, Gunung Kidul, nearby small town *
± 10.5 km ± 30 minutes driving
- Material such as concrete (cement, gravel, sand), brick, stone, steel, PVC pipes and fiber
Wonosari, Gunung Kidul, nearby city*
± 18.7 km ± 45 minutes driving
- Material such as concrete (cement, gravel, sand), brick, stone, steel, PVC pipes
- Fiber factory with medium-skilled workers - Service on regular basis (e.g. workshops for pumps,
plumbing, motorcycles; and service of vacuum truck for desludging)
Yogyakarta city, province capital city
± 57.3 km ± 1.5 hours driving
- All materials and services that are available in Wonosari - Workshops and spare-parts dealers (vehicles, generators,
etc). - Service/technicians with higher skill
Bantul city, industrial area**
± 65.6 km ± 2 hours driving
- Fabricated material factories (PVC, fiber) with high skilled workers
Note: * : service for desludging truck to Pucanganom is available in this city, although the place for final
sludge disposal is unknown **: the centralized wastewater treatment plant for the whole province, including sludge treatment plant is
located in Bantul. A new sludge treatment plant will be constructed in Wonosari
9.3.6. Total Suspended Solid (TSS) removal One of the aims of a sanitation system is to protect human health. There is concern about fecal contamination in karst area, particularly in Pucanganom, due to untreated domestic wastewater and cattle dung discharge to the sinkhole. There have been discussions concerning the movement of the coliform. Some indicate that bacteria, such coliform, move primarily as free-floating organisms, while several others have stated that sediment indicates particle bacteria in a stream (Irvine et al., 1995 in Irvine et al., 2002).
Turbid runoffs induce microbial contamination associated to suspended particles. The parameter ‘suspended solids’ is the amount of organic and inorganic matter that is not dissolved in water. Suspended solids include settleable and non-settleable solids. The results of several projects conducted within a watershed over the past decade have shown that there is strong positive relationship exists between total suspended solids and fecal coliform (Irvine et al., 2002). Therefore Total Suspended Solids (TSS) removal efficiency is considered as an important indicator to protect human health, particularly for karst area like Pucanganom.
The typical TSS of domestic wastewater in Indonesia is estimated to be 200 mg/l (LIPI, 2008). According to Ministry of Environmental Protection, Republic of Indonesia (2003), the TSS effluent standard for domestic wastewater in Indonesia is 100 mg/l. For karstic area which is very vulnerable, it is assumed that the effluent’s TSS should reach 50 mg/l. That
means that the technology should have a removal efficiency of at least 75%.
9.3.7. Biochemical Oxygen Demand (BOD) removal As alternative to TSS removal, in general technology’s performance is often associated to Biochemical Oxygen Demand (BOD) removal. Biodegradable organics are composed mainly of proteins, carbohydrates and fats. If discharged when untreated into water bodies, their biochemical stabilisation can lead to the depletion of dissolved oxygen and development of septic conditions. BOD is a procedure for measuring the quantity of oxygen (O2) used by microorganisms to break down organic matter in a given sample of wastewater (expressed in

Step 4 of SusTA: Contextualization of Technology Assessment Process
119
mg/l, for a sample incubated at 20°C for 5 days). The BOD therefore provides a measurement of the degree of organic pollution of a wastewater sample.
Despite considering the value of the influent and effluent in a system and the required effluent standard in each country, several references have provided statistical data on the removal efficiency of several wastewater technologies. In general a high BOD removal efficiency is achieved when the technology can remove more than 70% of BOD (Ulrich et al., 2009; Tilley and Peters, 2008). In Indonesia there is no standard on effluent’s BOD for
karstic area, while the standard of domestic wastewater effluent in general is 100 mg/l BOD (Ministry of Environmental Protection, Republic of Indonesia, 2003). The typical BOD of domestic wastewater in Indonesia is estimated to be 200 mg/l (LIPI, 2008). Since karstic area is very vulnerable, it is assumed that the effluent’s BOD should reach 50 mg/l. Therefore the
technology should have a removal efficiency of at least 75%.
Note: For karst area TSS removal of a technology is actually more relevant than BOD removal. Due to data limitation, in this dissertation BOD removal efficiency is used to assess the technology options.
9.3.8. Land availability for the plant Land availability for the plant might become a constraint in determining the choice of wastewater treatment systems. However, in some cases, land scarcity cannot be directly reflected in the price. For instance: in a high-density slum area, the price of land may be very cheap and also have no price due to unclear ownership. In other cases, such as in some rural areas where traditional law still exists, much of the land is administratively owned by the village and such land cannot be traded or valued. Often the land-related problem lies on the space availability – not always the price. Space sufficiency means not only the space to
accommodate the size of the present facilities, but also the possibility for future expansion (Singhirunnusorn and Stenstrom, 2009). Since most wastewater treatment systems are located outdoors, it may cause negative environmental impacts, such as noise and odor, on the surrounding residences. Therefore, system site and plot size must be sufficiently large to provide a buffer to minimize the visual, odor and noise impacts.
In this analysis land is defined as space required to construct the proposed facility, excluding the space required for future expansion and buffer zone. The unit is m2 space/household (HH). A system is considered to take up small piece of land, when it requires 2 m2/HH. It is considered to require a large piece of land if greater than 4 m2/HH is needed to construct one system.
9.3.9. Water consumption to operate the whole system According to Gleick (1996), the water requirement for basic human domestic needs (i.e. for drinking, basic sanitation services, human hygiene, and food preparation) is estimated to be 50 liters per capita per day (lcpd) of clean water. A minimum of 20 liters per capita per day is recommended to account for the maximum benefits of combining waste disposal and related hygiene, and to permit for cultural and societal preferences. This level can be met with a wide range of technological choices. Therefore the technology selection should consider the basic water requirement.
Pucanganom receives water from a regional water enterprise pipeline (PDAM), which comes from Bribin cave. The water consumption per household day is presented in Table 9.10. One households consists of 4.3 members on average (4 members/household is used for further assumption/calculation). Therefore the water consumption is 52 liters per capita per day (lcpd). It is assumed that 80% of water consumption becomes wastewater. With 52 lcpd of

Step 4 of SusTA: Contextualization of Technology Assessment Process_________________________________
120
water consumption, the generated wastewater is ± 42 lcpd. The technology selection should take into account this number.
Table 9.9 Water consumption in Pucanganom
Consumption purpose Liters/household.day
Cooking drinking, and utensil washing 45.6
Bathing, clothes washing, and religious use 156.6
Flushing toilette 21.7
Total 223.9
In the assessment matrix, water requires for operating the system is expressed in liter/household.day. Water requirement of a technology can be fulfilled by the wastewater production flow itself and the additional amount water to run the system (e.g water to dillute the cattle dung before fed to the digester, water to flush the toilet). In the analysis, only additional amount of water is taken into consideration as water consumption to operate the technology. Technology that requires additional water less than 40 liter/household.day is considered as a low water consumption technology, and is rated as 1, while technology that requires more than 60 liters/HH.day of additional water is considered as high water consumption technology, and is rated as 3.
9.3.10. Energy (electricity, fossil fuels) required to operate the system In developing countries the absence of a reliable power supply and the lack of finances to cover high operational and maintenance costs become a common problem. Therefore the aim is to minimize the energy usage of wastewater treatment technology, which leads to cost savings.
The energy usage is considered low if it is less than 20 kWh/HH.year. It is considered high when it requires more than 40 kWh/HH.year.
9.3.11. Compatibility with the existing system It is not always necessary to build a completely new sanitation facility; it may be possible to upgrade the existing system or to combine the new system with an existing one. The rationale for upgrading as the first option for improving sanitation is that in some cases an existing sanitation facility reflects the social and cultural preferences of the community, as well as the local economic and technical capacities (Brikké and Bredero, 2003). If existing community facilities do not meet the basic requirements of hygiene, then upgrading such facilities should be considered first. If an upgrade is not sufficient, a new technology should be installed. From the economic perspective, it is important to have a new system that is compatible with the existing in order to save costs. In the case where there are no sanitation facilities, a completely new system can be developed.
In this analysis system compatibility is described semi-quantitatively. A system that can be easily installed or connected to the existing one, and only requires minor adaptation, is rated as high.
9.3.12. Health risks caused by the system Sanitation-related health risks occur mainly through persistent pathogenic organisms in excreta such as bacteria, viruses, protozoa and helminths. If excreta not collected, treated, transported, and applied properly, this can lead to transmission of infectious diseases such as diarrhoea and the proliferation of intestinal worms. The purpose of every sanitation system is

Step 4 of SusTA: Contextualization of Technology Assessment Process
121
therefore to protect human health and install effective barriers against possible exposure to pathogens. Nevertheless, in dealing with the sanitation system there might be the risk of contracting an infectious disease. Risk in this analysis is defined as exposure intensity of users and caretakers to untreated or pretreated waste water along the system, which might carry diseases. When data is unavailable, the risk can be assessed qualitatively. Low risk occurs when all aspects of the technology minimize the contact between users/operators to wastewater and reduces the risk of insect breeding. Several possible exposures when dealing with sanitation system are depicted in Table 9.10.
Table 9.10 Sanitation system and possible exposure (Source: WHO, 2002)
Part of system Possible exposures Toilet - during and after use
- during cleaning
Treatment system - during maintenance - in case of process failure - direct contact with treatment process
Discharge - contact with treated water - using contaminated groundwater as drinking water source - contact with contaminated insect or wild animals
Handling of rest product - emptying of collected rest products
Use of end-product - application on arable land - consumption of vegetables fertilized with wastewater
In term of end product, care should be taken in promoting reuse of treated wastewater products for agricultural purposes. The product which still contains pathogene is consider to cause high risks for the consumers.
9.3.13. Potential nutrient recovery The macronutrients nitrogen (N), phosphorus (P) and potassium (K) contained in human and animal excreta can be locally recovered and if they are properly treated, they can be used as fertilizer in agriculture.
Due to the fact that many people in the case study area depend on agriculture, there is a high demand for fertilizer. Moreover there are potential sources of nitrogen, namely untreated feces and cattle dung as well, which currently pollute Bribin’s water source. The analysis focused on the ability of a system to recover the nutrient on-site, so that the community themselves can directly benefit, and so that the nutrient loop is closed. Such system will be rated as 1 (high fulfillment to the indicator).
9.3.14. Potential energy recovery Several technologies can be designed in a way to produce renewable energy sources (biogas or biomass) and allow recovery of materials for reuse (e.g urine-diverting toilets,composting toilets). Sanitation systems may also serve to increase income by recovering energy, nutrients and treated wastewater, thus substituting the use of primary resources.
A wastewater technology, such as anaerobic biodigester, can “naturally” produce energy.
Biodigesters do not require another type or extension of technology to produce energy. The energy (in the form of biogas) can be produced on-site, and the users can directly use the

Step 4 of SusTA: Contextualization of Technology Assessment Process_________________________________
122
benefit of the energy. Many other technologies can only produce energy if they are combined with another treatment. For example: sludge from septic tank should be treated in a wastewater treatment plant and dried in a sludge drying bed before being used as biomass.
In this matrix, assessment for potential recovery is conducted qualitatively. A technology that can produce energy independently and bring direct benefit to its users is rated as high, compared to another technology that required another system to produce the energy.

Step 5 of SusTA: Sustainability-based Technology Assessment
123
10. Step 5 of SusTA: Sustainability-based Technology Assessment
This chapter discusses the application of sustainability-based wastewater technology assessment indicators for the context of the project’s pilot village, Pucanganom. Section 10.1 discusses the development of technology screening criteria (step 5.a). Sections 10.2-10.6 describes several technology options for Pucanganom (step 5.b.). The results of technology assessment (step 5.c and 5.d) is discussed in section 10.7.
5 Sustainability-based Technology Assessment (STA step)
5.a Develop a criteria to screen the suitable technologies, based on the results of analysis 2.b (distance-to-target analysis) and 3.b (examination of physical and socio-economic conditions)
T An example of technology criteria for technology pre-selection is provided (see section 10.1).
5.b Define the possible technology options and sanitation system (technology and management) for the area, based on the criteria developed in 5.a
5.c Compare (in matrixes) those sanitation system options by considering the 13 sustainability-based technology assessment indicators.
5.d Select the most sustainable sanitation system for the given context.
10.1. Basic Requirements for a Sanitation System in Pucanganom (Application of Step 5.a)
A technology screening criteria (Figure 10.1) for case study Pucanganom is developed based on the result of distance-to-target analysis (section 7.2-7.3) and examination of socio-economic and physical condition in the project area (section 8.2-8.3). The proposed sanitation system in Pucanganom should fulfill the following requirements:
Figure 10.1 Sanitation system criteria/requirements for Pucanganom
Management scale requirements:
Private toilet (not as a shared facility in user interface) Decentralized system: on-site treatment facility at the household (HH) level and
cluster level (4-10 HH) or semi-off site at the communal level (20-50 HH) depending on settlement structure and local topography
Water consumption requirements:
Wet system, which enables wet anal cleansing Low water consumption to operate the whole
system
Resources related requirements:
Possibility for resource recovery, except input from human excreta as humanure as end product
Low energy consumption to operate the whole system
System performance requirements:
Ability to treat all types of wastewater (blackwater, greywater and cattle dung) in one sanitation system
High removal efficiency due to karst vulnerability
Other requirements:
Low investment cost technology Low operational and maintenance
requirements Multiplicable with own resources

Step 5 of SusTA: Sustainability-based Technology Assessment _________________________________
124
Several important topics in Figure 10.1 will be elaborated on to select the proposed system in Pucanganom:
10.1.1. Decentralized System A decentralized system is identified as one of the technology options’ requirements for
Pucanganom, due to the fact that this village has topography restrictions (i.e hilly area, relatively remote). Several terminologies related to decentralized system are explained in order to give understanding to what they refer to in this dissertation analysis (adapted from USEPA, 1997; Libralato et al., 2012):
- A decentralized system is principally defined by the fact that raw wastewater is treated next to the source. Wastewater must still be collected, but the use of large and long sewerage is avoided, as well as the related excavation work to create a more or less composite collection system network. A decentralized system can consist of an on-site (household or cluster of housings) or semi off-site wastewater system that is used to treat and dispose of relatively small volumes of wastewater.
An on-site system is a simple system or mechanical device used to collect, treat, and discharge or reclaim wastewater from an individual household or cluster of housings (but less than the entire community) close to where the wastewater is generated.
A semi-off site system connects individual households and transports the wastewater through low cost, simplified sewerage14 to a communal level treatment unit that is smaller compared to centralized systems.
- A centralized system, which is identical with an off-site system, uses an extensive sewerage to transport all wastewater and treat them centrally.
The visualization of all those systems is presented in Figure 10.2.
14 Simplified sewerage is a sewerage network that is constructed using smaller diameter pipes laid at a shallower depth and at a flatter gradient than conventional sewers (Tilley et al., 2008).
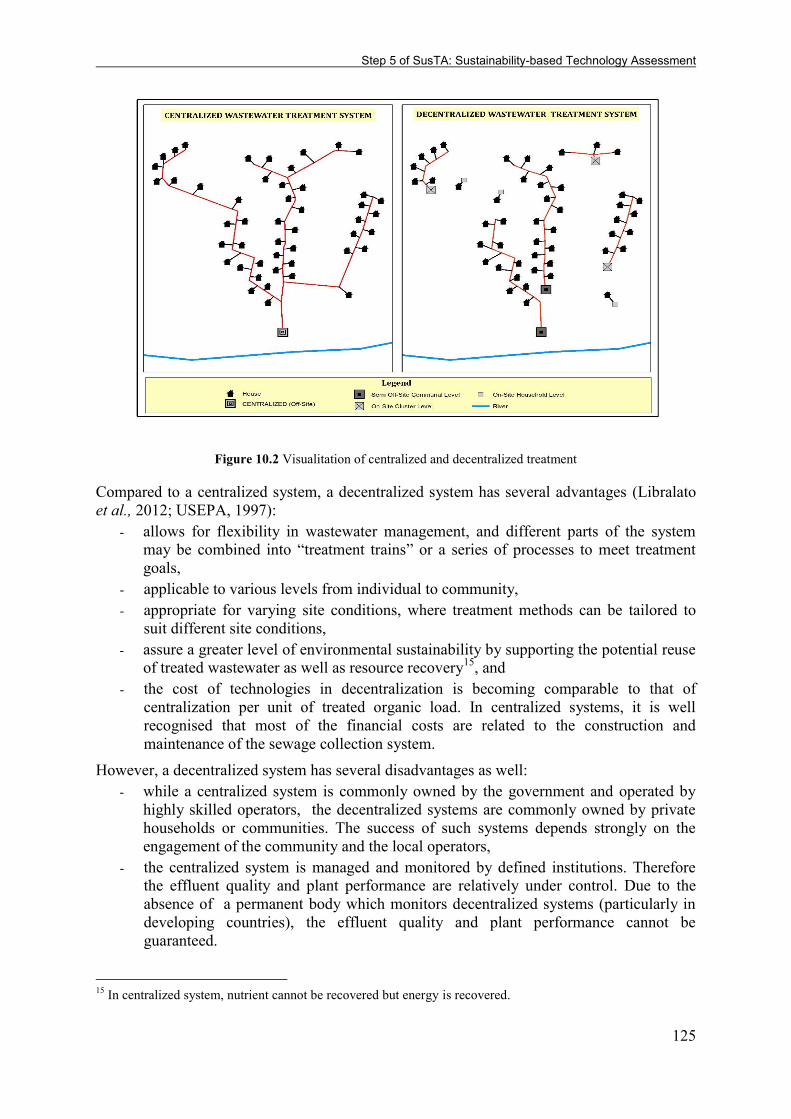
Step 5 of SusTA: Sustainability-based Technology Assessment
125
Figure 10.2 Visualitation of centralized and decentralized treatment
Compared to a centralized system, a decentralized system has several advantages (Libralato et al., 2012; USEPA, 1997):
- allows for flexibility in wastewater management, and different parts of the system may be combined into “treatment trains” or a series of processes to meet treatment
goals, - applicable to various levels from individual to community, - appropriate for varying site conditions, where treatment methods can be tailored to
suit different site conditions, - assure a greater level of environmental sustainability by supporting the potential reuse
of treated wastewater as well as resource recovery15, and - the cost of technologies in decentralization is becoming comparable to that of
centralization per unit of treated organic load. In centralized systems, it is well recognised that most of the financial costs are related to the construction and maintenance of the sewage collection system.
However, a decentralized system has several disadvantages as well: - while a centralized system is commonly owned by the government and operated by
highly skilled operators, the decentralized systems are commonly owned by private households or communities. The success of such systems depends strongly on the engagement of the community and the local operators,
- the centralized system is managed and monitored by defined institutions. Therefore the effluent quality and plant performance are relatively under control. Due to the absence of a permanent body which monitors decentralized systems (particularly in developing countries), the effluent quality and plant performance cannot be guaranteed.
15 In centralized system, nutrient cannot be recovered but energy is recovered.

Step 5 of SusTA: Sustainability-based Technology Assessment _________________________________
126
10.1.2. Anaerobic Treatment Process Due to their remoteness and the low income of the inhabitants, supply of energy sources (gas, electricity, gasoline) becomes a problem in rural communities. On the other side, although many people are not aware of it, the potential to recover energy and nutrients is high (section 8.2.4). Initial and operational cost of a technology becomes a burden to the rural community as well. Based on these energy and financial considerations, an anaerobic treatment process is selected for this technology analysis over an aerobic treatment process.
Table 10.1 Advantages and disadvantages of an anaerobic process
Advantages Disadvantages
less energy required longer start-up time less biological sludge production may require further treatment with an aerobic process
to meet discharge requirement fewer nutrients required much more sensitive to the adverse effect of lower
temperatures on reaction rates methane production as a potential energy source
maybe more susceptible to upsets due to toxic substances
smaller reactor volume required potential for production of odors and corrosive gases rapid response to substrate addition after long periods without feeding
may require alkalinity addition
(Source: Metcalf and Eddy, 2002) Anaerobic digestion is described as a series of processes involving microorganisms to break down biodegradable material in the absence of oxygen. It benefits from a higher digestion temperature, which fits for a tropical country like Indonesia. The anaerobic process may be a net energy producer instead of energy user (Metcalf and Eddy, 2002). Table 10.1 summarizes the advantages and disadvantages of an anaerobic process over an aerobic process.
10.1.3. Sanitation System with Several Technologies and Sub-Systems Wastewater in Pucanganom that should be treated is greywater, blackwater and cattle dung. Sometimes one type of technology cannot treat all types of wastewater, and a combination of several types of technologies in one sanitation system might be required. A sanitation system in this context consists of a series of: toilets (user interface), on-site treatment, transportation, semi off-site treatment and the end product (NETSSAF, 2007; Tilley et al., 2008). The mixed wastewater can be treated either close to where it is generated (on-site-treatment) or transported via a simplified sewerage at the communal level (semi off-site). If this is the case, two options for on-site and semi off-site treatment can be described as two sub-systems. Therefore a sanitation system might consist of a combination of several technologies and several sub-systems.
System boundary in this dissertation:
The analysis is limited to a series of: user interface, on-site treatment, conveyance of wastewater from household to a semi-off site system, semi-off site system and management of end-product in the on-site or semi-off site level. Supporting technologies outside of this system which are organized by other entrepreneurs or institutions (e.g. vacuum/desludging truck, centralized sludge treatment plant) will not be included in the analysis.

Step 5 of SusTA: Sustainability-based Technology Assessment
127
10.2. Part of a Sanitation System: User Interface (Application of Step 5.b) One of the user interfaces is the toilet. Toilets discharge blackwater, while kitchen sinks and bathrooms discharge greywater. The requirements for a toilet in Pucanganom’s context are:
enable wet anal cleansing, nevertheless having a low water consumption. Since nutrient recovery from human excreta is less favourable, the composting toilet is not proposed for this analysis. Due to its high water consumption, a cistern flush- toilet is not included in the analysis as well. The proposed option will be a squatting pour-flush toilet. This toilet is installed at a household level as a private facility.
10.2.1. Blackwater Collection: Pour-Flush Toilet This type of toilet is currently used and well-accepted in Pucanganom, therefore it will be used in the analysis. Inputs: A pour-flush toilet collects blackwater: excreta, urine, water for anal cleansing and flush water.
Structure: It is a regular pedestal or squatting toilet where water is poured in after use by the user (Figure 10.3). A U-bend (siphon) below the pedestal or pan functions as a water seal to prevent insects and odor from the toilet. It is especially suitable where water is used for anal cleansing and where there is a constant supply of water available.
Figure 10.3 Pour flush toilette (Source: BORDA and WSP, 2005)
Water requirement: Compared to a cistern flush toilet, this toilet requires less water. Normally 2-3 liters are sufficient. If freshwater is not available, greywater can alternatively be used for flushing (Tilley et al., 2008). If the water amount used for flushing is not adequate, clogging might occur. Therefore this should be taken into account in the maintenance.
10.2.2. Greywater Collection: Kitchen Sink and Bathroom Greywater from the kitchen contains grease and oil. Large amounts of oil and grease in the wastewater can decrease pipe capacity. Hence, it requires that piping systems be cleaned more often and/or some piping to be replaced sooner than otherwise expected. Oil and grease also reduce treatment effectivity of the wastewater treatment plant. The high BOD present in grease promotes excessive bacterial growth which causes the formation of a thick anaerobic film that has less ability to actually treat the wastewater.

Step 5 of SusTA: Sustainability-based Technology Assessment _________________________________
128
To overcome this problem, a grease trap can be installed before the greywater enters the treatment facility. The grease trap (Figure 10.4) is a simple method applied in small-scale greywater treatment systems. Grease traps are typically used as primary treatment units in greywater irrigation systems and as a low-cost alternative to sedimentation or septic tanks. They are often applied as content (e.g. kitchen greywater, restaurant greywater) prior to a secondary treatment step. Stand-alone grease traps for combined greywater are also frequently applied for domestic greywater (Morel and Diener, 2006).
Figure 10.4 Grease trap prior to further treatment (Source: Morel and Diener, 2006)
According to Morel and Diener (2006) greywater discharged from the bathroom is regarded as the least contaminated greywater source in the household. It might contain traces of urine and faeces and may thus be contaminated with pathogenic microorganisms. In Pucanganom, laundry activity also takes place in the bathroom. Most people wash their clothes by hand and do not use as much detergent as in the city.
10.3. Part of Sanitation System: On-site Treatment (Application of Step 5.b) In the on-site and semi off-site treatment systems, the most important criteria is to have a low investment and operational cost, while still having a higher removal efficiency compared to the existing treatment (simple pit latrine and unsealed “septic tank”). The technology should
have low water consumption- and when possible recover the resources (energy and nutrient). Due to these arguments anaerobic-based technologies are proposed:
10.3.1. Septic Tank with Anaerobic Filter The septic tank is the most popular treatment option in Indonesia, as well as in Pucanganom. To increase the quality of the effluent- especially for vulnerable areas like Pucanganom, a water tight septic tank alone is not adequate. A septic tank, with BOD removal of 40% can be extended with an anaerobic filter (AF), also known as a fixed-bed biological reactor to increase its BOD removal into 85% (Schölzel and Bower, 1999).
Inputs: Septic tanks with AF receive excreta and flush water (blackwater) from flush toilets. If the greywater flow is low, it can be mixed in a household-level septic tank. If the tank is installed at a cluster or communal level, it should be considered to mix greywater to transport the solid parts to the tank.

Step 5 of SusTA: Sustainability-based Technology Assessment
129
Structure: A septic tank (Figure 10.5) is a watertight chambers located below ground level. Insect problems (fly, cockroach, etc.) are minimised by a water barrier (Carr and Strauss, 2001). The effluent of a septic tank can be infiltrated either into a horizontal flow-planted filter or an infiltration pit depending on the locality conditions. The entire septic system can operate by gravity alone, or where topographic considerations require, with the inclusion of a lift pump (NETSSAF, 2007).
Figure 10.5 Two-chamber septic tank (Source: Morel and Diener, 2006)
A septic tank with AF (Figure 10.6) consists of a sedimentation tank or septic tank followed by one to three filter chambers. Filter material commonly used includes gravel, crushed rocks, cinder, or specially formed plastic pieces (Tilley et al., 2008).
Figure 10.6 Septic tank with anaerobic filter (Modified from: Tilley et al., 2008)
Process: The main principle of the septic tank is sedimentation combined with sludge digestion. Wastewater enters the first chamber of the tank, allowing solids to settle and scum to float. The settled solids are anaerobically digested, therefore reducing the volume of solids. The liquid component flows through the dividing wall into the second chamber where further
Step 5 of SusTA: Sustainability-based Technology Assessment _________________________________
130
settlement takes place with the excess liquid. The settled and floating solids require treatment as they contain the bulk of excreted pathogens carried in wastewater; high level of pathogen viability in recently deposited solids.
Most micro-organisms are immobile and attached to solid material. Filter material provides additional surface area for them to settle. They digest the dissolved organic matter in the wastewater within a short retention time. By forcing the fresh wastewater to flow to the filter, intensive contact with active micro-organisms is established and makes the digestion process faster (Ulrich et al., 2009).
End product: Effluent liquids (unless allowed to infiltrate) require treatment, to minimise the pollution load on receiving waters, as they still contain pathogens. When infiltration is allowed, the liquid is disposed of into an infiltration pit. When it is not allowed, the liquid overflows into for example a horizontal-flow plant filter. When a low-cost sewerage exists, it can be transported for further treatment. The faecal sludge (undigested or partially digested slurry or solid resulting from the storage or treatment of blackwater or excreta) still remains in the tank. Therefore it should be desludged every 2-4 years. Access should be provided for the desludging truck otherwise it should be desludged manually.
10.3.2. Biogas digester A biogas digester generates biogas (methane, carbon dioxide, hydrogen sulfide, ammonia), a renewable energy that can be used for cooking, lighting, heating and for generating electrical power. The gas is produced by bacteria that decompose organic matter under anaerobic conditions. The technology of anaerobic digestion has been applied to human and animal excreta for over 150 years (Tilley and Zurbrügg, 2007). It is suitable for a rural area like Pucanganom, which has a large population of cattle and demand on energy and nutrient.
Inputs and end products: According to Tilley and Zurbrügg (2007) a biogas plant or biodigester can generate biogas from various substrates (also in combination with each other), namely:
- organic waste from households or agricultural farms - animal dung - sewage sludge originating from domestic wastewater treatment - blackwater (i.e. mixture of excreta and flushing water best from low-flush or vacuum
toilets) - fresh faecal sludge from toilets, septic tanks or pit latrines
After the generation of biogas, the residue of anaerobic digestion (widely known as "slurry or digestate") still contains relevant nutrients and some organic matter. This residue is therefore suitable for application in agriculture as fertilizer or soil conditioner. In Pucanganom, the common practice of producing fertilizer from cattle dung is by drying it under the sunlight and then applying it directly on the field (see section 8.2.4). In comparison to the application of dried cattle dung, the use of slurry has several advantages (FAO, 1996):
- the macronutrients (N, P and K) which are contained in the substrates remain in the slurry and are easily available to plants.
- organic matter is reduced by the digestion process but is still available in the slurry, and can contribute to raising the soil organic matter content.

Step 5 of SusTA: Sustainability-based Technology Assessment
131
- the slurry is “stabilised” with reduced volume, odour emissions, pathogens and weed
seeds compared to undigested manure.
The use of the slurry as a fertilizer reduces the need for mineral fertilizers (which reduces costs) as well as greenhouse gas emissions. However, according to FAO (1996) pathogens are not removed to a significant extent and therefore safety measures in the application of digestate should be applied, especially when the substrate sources contain human excreta and animal dung. To assure hygienic quality, especially when mixing human excreta, NETSSAF (2007) suggests that a long retention time (> 60 days) should be used, and/or a post treatment step (e.g. wetlands, drain fields, slurry drying bed) applied. A slurry drying bed is a cost-effective method, especially for tropical countries. It is an impermeable concrete floor which is constructed for open slurry drying. Surface aeration is supplied with the wind effect and sludge is heated with direct exposure to the sun. Pathogene removal is also gained from exposure to UV rays in the bed.
Structure and process: Biogas digesters can be used to replace existing septic tanks, by integrating the septic tanks as an inlet chamber (NETSSAF, 2007). Biogas digesters operate best in warm climates, as high temperature assures a sufficient production of biogas and destruction of pathogens. Due to these reasons, according to FAO (1996) biogas digesters are usually built underground to protect them from temperature variations and also to prevent accidental damage. As a chamber, it should be air and water tight. The main function of this structure is to provide anaerobic conditions within it. It can be made of various construction materials and in different shapes and sizes depending on the local conditions (e.g. technical suitability; cost-effectiveness; availability in the region and transport costs; availability of local skills for working with the particular building material).
The two most common types of digesters in developing countries are, the floating roof and (Figure 10.7) and fixed-dome digester (Figure 10.8).

Step 5 of SusTA: Sustainability-based Technology Assessment _________________________________
132
Figure 10.7 Floating roof digester (Modified from: Tauseef et al., 2013)
Figure 10.8 Fixed dome digester (Modified from: Kossmann and Pönitz, 1999)

Step 5 of SusTA: Sustainability-based Technology Assessment
133
The structure, material, process, advantages and disadvantages of these two types are summarized in Table 10.2.
Table 10.2 Comparison of fixed-dome and floating roof digesters
Fixed-dome digester Floating roof digester Structure Consists of an underground digester with a
fixed, non-movable gas holder, which sits on top of the digester
Consist of an underground digester and a moving gas-holder
Construction material The top part of a fixed-dome plant (the gas space) must be gas-tight. Concrete, masonry and cement rendering are not gas-tight. The gas space must therefore be painted with a gas-tight layer (e.g. ’Water-proof’, Latex or
synthetic paints). One possibility to reduce the risk of cracking of the gas-holder consists in the construction of a weak-ring in the masonry of the digester. This "ring" is a flexible joint between the lower (water-proof) and the upper (gas-proof) part of the hemispherical structure
The roof can be made of glass-fiber reinforced plastic and high-density polyethylene (but the construction costs are higher compared to using steel). Floating-drums made of wire-mesh-reinforced concrete are susceptible to hairline cracking and are intrinsically porous. They require a gas-tight, elastic internal coating. PVC drums are unsuitable because they are not resistant to UV
Process When gas production starts, the slurry is displaced into the compensation tank. Gas pressure increases with the volume of gas stored and the height difference between the slurry level in the digester and the slurry level in the compensation tank
The gas-holder floats either directly on the fermentation slurry or in a water jacket of its own. The gas is collected in the gas drum, which rises or lowers, according to the amount of gas stored. The gas drum is prevented from tilting by a guiding frame. If the drum floats in a water jacket, it cannot get stuck, even in substrate with high solid content
Advantages - low initial costs - long useful life-span - no moving or rusting parts involved - basic design is compact, saves space
and is well insulated
- easily operational - gas production at a constant
pressure - the stored gas-volume is
immediately recognizable by the position of the drum
- gas-tightness is no problem
Disadvantages - masonry gas-holders require special sealants and high technical skills for gas-tight construction
- gas leaks occur quite frequently - fluctuating gas pressure complicates gas
utilization - amount of gas produced is not
immediately visible, - plant operation not readily
understandable
- the steel drum is relatively expensive and maintenance-intensive
- removing rust and painting has to be carried out regularly
- the life-time of the drum is short (up to 15 years; in tropical coastal regions about five years).
- if fibrous substrates are used, the gas-holder shows a tendency to get "stuck" in the resultant floating scum
(Modified from: Kossmann and Pönitz, 1999)

Step 5 of SusTA: Sustainability-based Technology Assessment _________________________________
134
10.4. Part of Sanitation System: Semi Off-site Treatment (Application of Step 5.b)
For communal semi off-site treatment, conveyance and a relatively low cost anaerobic technology are proposed.
10.4.1. Conveyance When the wastewater is treated semi off-site, transport of wastewater is required. The small-piped sewerage sanitation chain which is constructed using small-diameter pipes can be an option. In general this small-piped sewerage can be of two different types (Monvois et al., 2010):
- a settled system only discharges greywater and/or blackwater that have undergone pretreatment (such as in a septic tank) at the household level, which means that most of the solid waste is retained. This type of system is designed to evacuate only liquid effluent and can handle only very low volumes of solid waste
- a simplified sewerage system collects wastewater in the same way as a conventional sewerage system, but is less expensive as it is not buried as deep underground and uses smaller diameter pipes. This system evacuates greywater and blackwater at the communal level, regardless of the amount of solid matter it contains. It therefore requires no pretreatment at the household level. The wastewater collected is then evacuated to a treatment facility. At the household level, the facilities that collect the greywater and blackwater are connected to the simplified sewerage system via a junction chamber.
Regardless of the type of small-piped sewerage system considered (settled or simplified), to function properly it requires sufficient quantities of water (in this case a combination of blackwater and greywater) to ensure the effluent flows through the pipes under the force of gravity. In Pucanganom, a simplified system is selected for the analysis due to the absence of pretreatment at a household level. This system transports both untreated greywater and blackwater from many households to a communal level treatment facility.
10.4.2. Anaerobic Baffled Reactor An Anaerobic Baffled Reactor (ABR) is an improved septic tank with a series of baffles under which the wastewater is forced to flow.
Inputs: An ABR can be designed for communities that produce considerable amounts of grey and blackwater. It is mostly appropriate, if water consumption and supply of wastewater are relatively constant (Tilley et al., 2008).
Structure: The construction can be installed underground. Therefore the technology is appropriate for communities with limited land.
Process: In baffled reactors (Figure 10.9), a number of mechanical and anaerobic cleansing processes are applied in sequence. The baffles compartmentalize the reactor, in which the wastewater flows through the compartments. On the bottom of each compartment, microorganism-rich sludge is located. During inflow into the compartment, wastewater is intensively mixed up with the sludge and wastewater pollutants are decomposed.

Step 5 of SusTA: Sustainability-based Technology Assessment
135
Figure 10.9 Anaerobic baffled reactor (Source: Morel and Diener, 2006)
In the first compartments the easily degradable substances are removed. In the following compartments substances which are harder to degrade are removed. The more compartments are applied, the higher the performance of an ABR (BORDA and WSP, 2005).
End product: Depends on the quality and quantity of the effluent. The effluent can be further treated with, for instance, an anaerobic filter or a horizontal-flow planted filter- or discharged in the water body. As faecal sludge accumulates, desludging is required every 2 to 3 years.
10.5. Part of Sanitation System: End Product (Application of Step 5.b) There are two end product catagories of a wastewater treatment facility:
- the reusable ones, such as: biogas and slurry from digester, or reused water from treated effluent. These products can normally be used on-site and directly benefit the users,
- the unreusable ones, such as: faecal sludge and effluent. Both of them require further treatment (normally off-site) or safe disposal within the system.
Several technologies to treat the unreusable products are described below:
10.5.1. Effluent Treatment: Horizontal- Flow Planted Filter Inputs: The horizontal-flow planted filter (HFPF) is used to treat wastewater after being pre-treated by a septic tank or anaerobic filter. It can also receive greywater from the bathroom and kitchen after its solids and grease are removed.
Structure: HFPF (Figure 10.10) consists of a bed lined with impermeable material (typically solid clay packing, concrete or plastic foils) and filled with sand or gravel. Alternative filling material such as PET is investigated to reduce the costs. A 5–10-cm soil layer is often applied on top of the filter substrate to facilitate growth of emergent plants. The filter media acts as both a filter for removing solids, a fixed surface upon which bacteria can attach, and a base for the vegetation (Tilley et al., 2008).
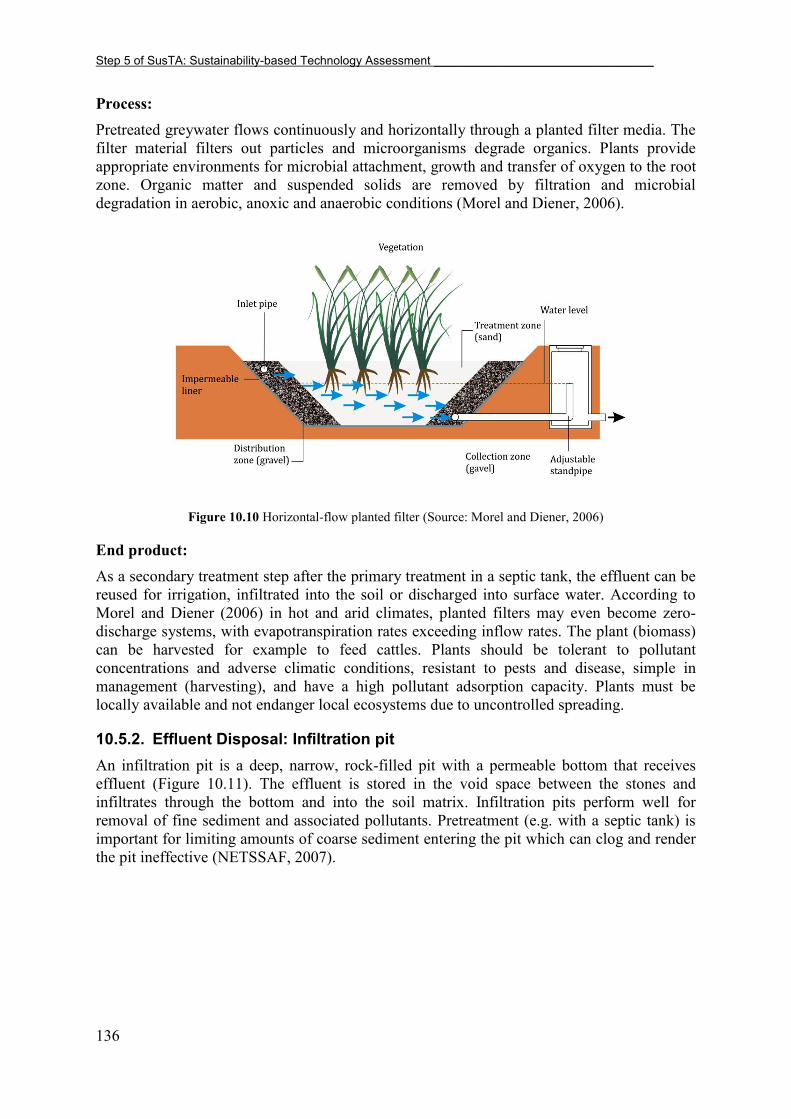
Step 5 of SusTA: Sustainability-based Technology Assessment _________________________________
136
Process: Pretreated greywater flows continuously and horizontally through a planted filter media. The filter material filters out particles and microorganisms degrade organics. Plants provide appropriate environments for microbial attachment, growth and transfer of oxygen to the root zone. Organic matter and suspended solids are removed by filtration and microbial degradation in aerobic, anoxic and anaerobic conditions (Morel and Diener, 2006).
Figure 10.10 Horizontal-flow planted filter (Source: Morel and Diener, 2006)
End product: As a secondary treatment step after the primary treatment in a septic tank, the effluent can be reused for irrigation, infiltrated into the soil or discharged into surface water. According to Morel and Diener (2006) in hot and arid climates, planted filters may even become zero-discharge systems, with evapotranspiration rates exceeding inflow rates. The plant (biomass) can be harvested for example to feed cattles. Plants should be tolerant to pollutant concentrations and adverse climatic conditions, resistant to pests and disease, simple in management (harvesting), and have a high pollutant adsorption capacity. Plants must be locally available and not endanger local ecosystems due to uncontrolled spreading.
10.5.2. Effluent Disposal: Infiltration pit An infiltration pit is a deep, narrow, rock-filled pit with a permeable bottom that receives effluent (Figure 10.11). The effluent is stored in the void space between the stones and infiltrates through the bottom and into the soil matrix. Infiltration pits perform well for removal of fine sediment and associated pollutants. Pretreatment (e.g. with a septic tank) is important for limiting amounts of coarse sediment entering the pit which can clog and render the pit ineffective (NETSSAF, 2007).

Step 5 of SusTA: Sustainability-based Technology Assessment
137
Figure 10.11 Infiltration pit (Source: Tilley et al., 2008)
10.5.3. Faecal Sludge Handling: Desludging Truck Desludging/vacuum trucks can be used to empty septic tanks (with or without an anaerobic filter) or anaerobic baffled reactor without the operators coming into contact with excreta (Figure 10.12). The faecal sludge is usually liquid but can sometimes be quite viscous. The removed sludge then needs to be transported to a sludge treatment plant. The pump in the truck is connected to a hose that is lowered down into a constructed tank (e.g. septic tank) or pit, and the sludge is pumped up into the holding tank on the truck. Humans are required to operate the pump and manoeuvre the hose, but they do not lift or transport the sludge (Tilley et al., 2008). The desludging truck is normally operated by the responsible institution or a private entrepreneur. Users have to bear the cost for this service. Therefore it is not included in the analysis.
Figure 10.12 Desludging truck (Source: BORDA and WSP, 2005)

Step 5 of SusTA: Sustainability-based Technology Assessment _________________________________
138
10.6. Options of Sanitation Systems in Pucanganom (Application of Step 5.b) As the last step of SusTA, three sanitation systems will be analyzed. In 2012 two sanitation sytems in Pucanganom village have been constructed by two different projects (System I and System II). For comparison, an alternative sanitation system is proposed in this dissertation (System III). System III is proposed as an amicable solution by avoiding contact to end product from human feces. It also minimizes conflict between users, by having a household-level treatment for the digester.
10.6.1. System I: Cluster Digester and Cluster HFPF The first system mixes the cattle dung and human excreta (blackwater) in a cluster
level biogas digester and treats greywater from the kitchen and bathroom in a cluster level horizontal-flow planted filter.
The digester (Sub-system I.a) is connected to 3-6 households, with mixed input of cattle dung and human excreta (blackwater) from a pour-flush toilet. The greywater is treated with a horizontal-flow planted filter (Sub-system I.b), also in a cluster level (3-6 households).
Table 10.3 Characteristic of System I in Pucanganom
Input Treatment Management level End product in on-site/semi-off site level
cattle dung, blackwater biogas digester cluster (3*-6 households)
- slurry (usable) - biogas (usable)
greywater (kitchen, bathroom) horizontal-flow planted filter (HFPF)
cluster (3*-6 households)
- biomass (usable) - effluent (infiltrated)
* in this analysis, 3 households are used for assumption and calculation
The schematic diagram of System I is presented in Figure 10.13.

Step 5 of SusTA: Sustainability-based Technology Assessment
139
Figure 10.13 Schematic diagram of System I
10.6.2. System II: Private Digester and Communal ABR The second system separates cattle dung flow, but mixes the greywater from kitchens
and bathrooms and blackwater from pour-flush toilets.
The cattle dung is treated with a biogas digester at the household level (Sub-system II.a).
The untreated greywater and blackwater from 38 households (around 163 people) is transported via a simplified sewerage and treated in an anaerobic baffled reactor (Sub-system II.b), as a communal level treatment plant.
Table 10.4 Characteristic of System II in Pucanganom
Input Treatment Management level End product in on-site/semi-off site level
cattle dung biogas digester household - slurry (usable) - biogas(usable)
blackwater, greywater (kitchen, bathroom)
anaerobic baffled reactor
communal (38 households)
- faecal sludge (need further treatment)
- effluent (discharged into nature)
The schematic diagram of System II is presented in Figure 10.14.
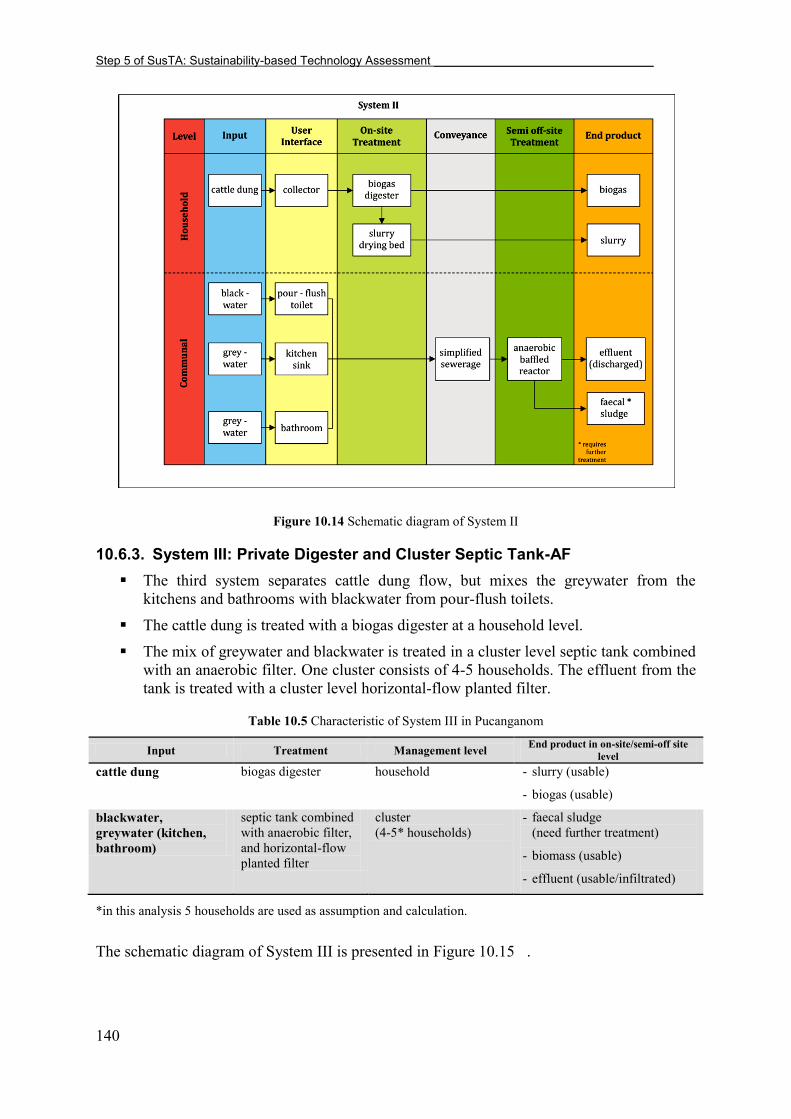
Step 5 of SusTA: Sustainability-based Technology Assessment _________________________________
140
Figure 10.14 Schematic diagram of System II
10.6.3. System III: Private Digester and Cluster Septic Tank-AF The third system separates cattle dung flow, but mixes the greywater from the
kitchens and bathrooms with blackwater from pour-flush toilets.
The cattle dung is treated with a biogas digester at a household level.
The mix of greywater and blackwater is treated in a cluster level septic tank combined with an anaerobic filter. One cluster consists of 4-5 households. The effluent from the tank is treated with a cluster level horizontal-flow planted filter.
Table 10.5 Characteristic of System III in Pucanganom
Input Treatment Management level End product in on-site/semi-off site level
cattle dung biogas digester household - slurry (usable)
- biogas (usable)
blackwater, greywater (kitchen, bathroom)
septic tank combined with anaerobic filter, and horizontal-flow planted filter
cluster (4-5* households)
- faecal sludge (need further treatment)
- biomass (usable)
- effluent (usable/infiltrated)
*in this analysis 5 households are used as assumption and calculation.
The schematic diagram of System III is presented in Figure 10.15 .
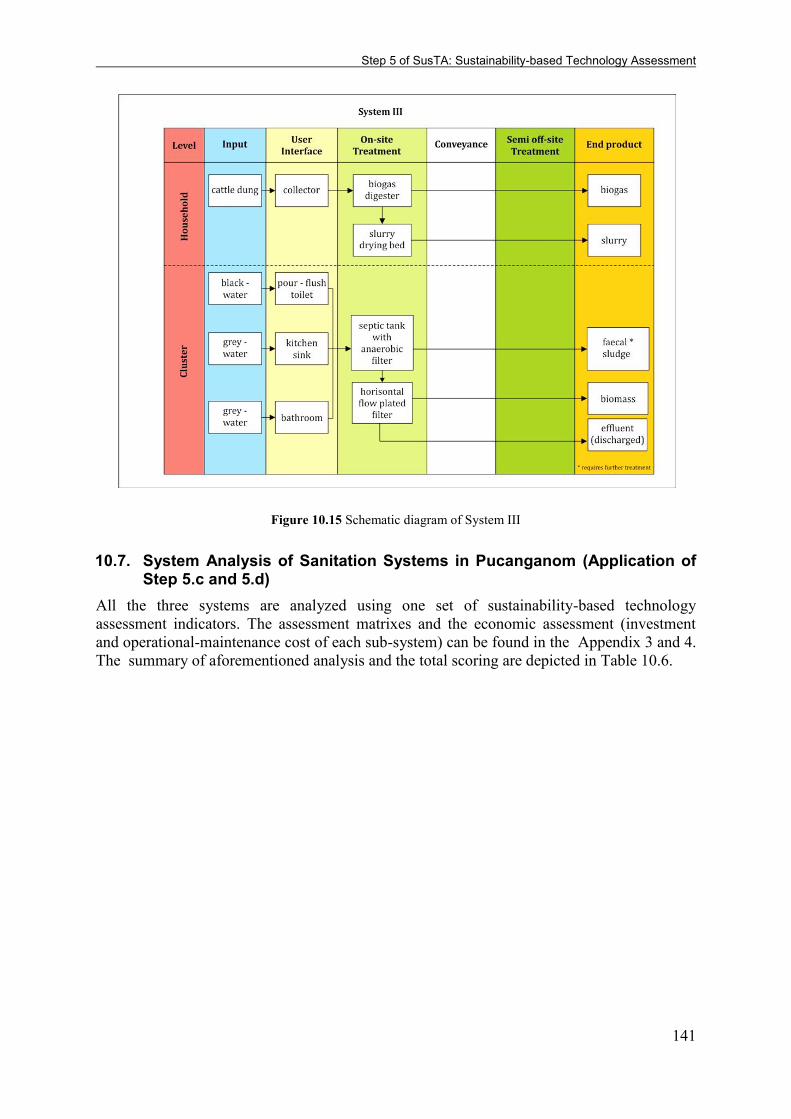
Step 5 of SusTA: Sustainability-based Technology Assessment
141
Figure 10.15 Schematic diagram of System III
10.7. System Analysis of Sanitation Systems in Pucanganom (Application of Step 5.c and 5.d)
All the three systems are analyzed using one set of sustainability-based technology assessment indicators. The assessment matrixes and the economic assessment (investment and operational-maintenance cost of each sub-system) can be found in the Appendix 3 and 4. The summary of aforementioned analysis and the total scoring are depicted in Table 10.6.
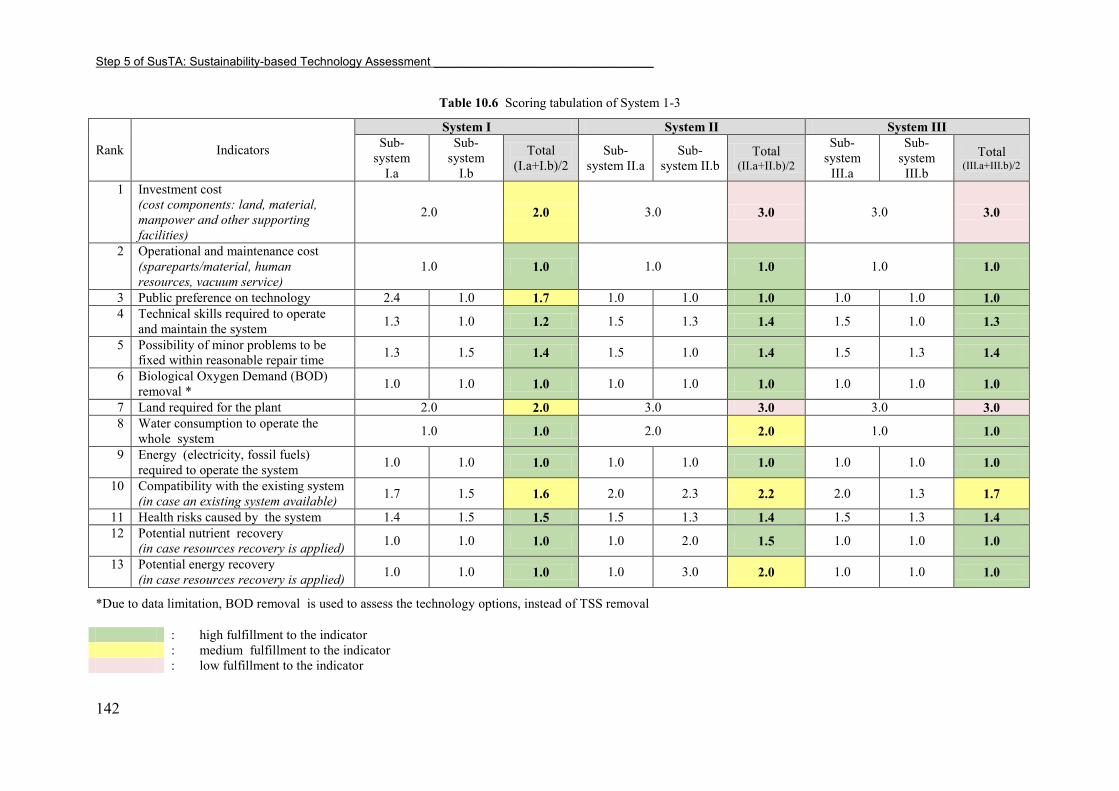
Step 5 of SusTA: Sustainability-based Technology Assessment _________________________________
142
Table 10.6 Scoring tabulation of System 1-3
Rank Indicators
System I System II System III Sub-
system I.a
Sub-system
I.b
Total (I.a+I.b)/2
Sub-system II.a
Sub-system II.b
Total (II.a+II.b)/2
Sub-system
III.a
Sub-system
III.b Total
(III.a+III.b)/2
1 Investment cost (cost components: land, material, manpower and other supporting facilities)
2.0 2.0 3.0 3.0 3.0 3.0
2 Operational and maintenance cost (spareparts/material, human resources, vacuum service)
1.0 1.0 1.0 1.0 1.0 1.0
3 Public preference on technology 2.4 1.0 1.7 1.0 1.0 1.0 1.0 1.0 1.0 4 Technical skills required to operate
and maintain the system 1.3 1.0 1.2 1.5 1.3 1.4 1.5 1.0 1.3
5 Possibility of minor problems to be fixed within reasonable repair time 1.3 1.5 1.4 1.5 1.0 1.4 1.5 1.3 1.4
6 Biological Oxygen Demand (BOD) removal * 1.0 1.0 1.0 1.0 1.0 1.0 1.0 1.0 1.0
7 Land required for the plant 2.0 2.0 3.0 3.0 3.0 3.0 8 Water consumption to operate the
whole system 1.0 1.0 2.0 2.0 1.0 1.0
9 Energy (electricity, fossil fuels) required to operate the system 1.0 1.0 1.0 1.0 1.0 1.0 1.0 1.0 1.0
10 Compatibility with the existing system (in case an existing system available) 1.7 1.5 1.6 2.0 2.3 2.2 2.0 1.3 1.7
11 Health risks caused by the system 1.4 1.5 1.5 1.5 1.3 1.4 1.5 1.3 1.4 12 Potential nutrient recovery
(in case resources recovery is applied) 1.0 1.0 1.0 1.0 2.0 1.5 1.0 1.0 1.0
13 Potential energy recovery (in case resources recovery is applied) 1.0 1.0 1.0 1.0 3.0 2.0 1.0 1.0 1.0
*Due to data limitation, BOD removal is used to assess the technology options, instead of TSS removal
: high fulfillment to the indicator : medium fulfillment to the indicator : low fulfillment to the indicator

Step 5 of SusTA: Sustainability-based Technology Assessment
143
In this analysis, several assumptions are applied:
The total scoring in Table 10.6 is presented in a rose-chart diagram (Figure 10.16). The diagram shows the distance of each indicator’s fulfillment to the target (the centre of the diagram). The closer the distance to the centre, the higher fulfillment of an indicator a system has.
Figure 10.16 Rose-chart diagram of the systems
0,0
0,5
1,0
1,5
2,0
2,5
3,0 Invest
OM Cost
Prefer
Skill
Time
BOD
Land Water
Energy
Compatib
Health
NutRec
EnrRec
System I System II System III
Legend: Invest : investment cost OM cost : operational and maintenance cost Prefer : public preference on technology Skill : technical skills required to operate and maintain the system Time : possibility of minor problems to be fixed within reasonable repair time BOD : Biochemical Oxygen Demand removal Land : land required for the plant Water : water consumption to operate the whole system Energy : energy (electricity, fossil fuels) required to operate the system Compatib : compatibility with the existing system Health : health risks caused by the system NutRec : potential nutrient recovery EnrRec : potential energy recovery
There is no weighing applied for each indicator. The importance of each indicator is presented in the ranking 1-13, with 1 as the highest. This ranking was based on the stakeholders’ judgement
(see chapter 9).
Each system consists of two sub-systems which have the same level of importance. Therefore each sub-system contributes 50% of the score to the overal system’s score

Step 5 of SusTA: Sustainability-based Technology Assessment _________________________________
144
The fulfillment comparison of each indicator of System I, II and III is presented in Figure 10.7. The highest fulfillment is represented by 1, while the lowest fulfillment is scored with 3.
Figure 10.17 Fulfillment comparison of each indicator of System I, II and III
10.7.1. Analysis of System I: Cluster Digester and Cluster HFPF System I consists of a cluster-level digester with input from cattle dung and blackwater, and a cluster-level horizontal-flow planted filter (HFPF) for greywater treatment. Compared to other systems, System I has the least investment cost (USD 596/HH). This is due to the fact, that the system is installed at a cluster-level, which saves on investment cost considerably compared to a single-household system. Both the digester and HFPF bring economic benefit through resources recovery (biogas, slurry, biomass/plant), which in the end reduces the operational and maintenance cost of the total system significantly (see Appendix 4). System I contributes USD 57/HH.month net, which is the highest contribution among the three systems. It also requires a low additional amount of water (32 l/HH.day) and zero energy consumption. Nevertheless System I has a high BOD removal efficiency (80-86%), although it is not the highest efficiency compared to the two systems. In comparison to System II and III, this system requires the least space (4.8 m2/HH), the least technical skill to operate and the highest compatibility to the existing system. The system is quite simple, therefore possible technical problems can be solved within a tolerable time of repairement.
Despite all those positives, System I is the least preferred compared to the other two systems. Sub-system I.a (digester) mixes cattle dung and blackwater. Culturally and religiously, raw or treated human excreta is not acceptable to be used as humanure. The users refuse to use the digestate, because they do not want to have contact with material considered ‘najassa/najis’ (religiously unclean). Moreover, the pathogenes from human excreta might not be 100% removed and therefore lead to higher health risks compared to systems with input from cattle dung only. The cluster-level, or shared management, become more complicated compared to a single-household level, when it requires sharing of regular tasks and end product. Therefore users are not in favor of having such a system, due to this conflict potential.
0,0
0,5
1,0
1,5
2,0
2,5
3,0
3,5
System I
System II
System III

Step 5 of SusTA: Sustainability-based Technology Assessment
145
It can be concluded, that System I is technically and economically feasible- but socially less feasible due to the conflict potential of managing the digester and the low acceptance of humanure.
10.7.2. Analysis of System II: Private Digester and Communal ABR System II consists of a single-household digester with input from cattle dung, and a communal-level anaerobic baffled reactor (ABR) for black- and greywater treatment. Among the three systems, System II has the highest investment cost (USD 1152/HH). This is due to the fact that the digester is constructed at a single household-level (not shared) and the ABR requires a sewerage, which makes the construction cost higher. Sewerage construction also requires earth work, precise positioning and elevation- which makes the new system less compatible with the existing system. Land required for the system is also considered high, 5.2 m2/HH.
Although no energy is required for the system, additional water is required for transporting the solid part of the wastewater through the sewerage and dilluting the cattle dung in the inlet of the digester. Therefore, compared to the other two systems, System II requires more water. This is reflected in the operational and maintenance cost. Users of System II spend OM costs of USD 7/HH.y (a total sum of the expenditure for OM and the economic benefit from the biogas), while users of other systems receive an annual profit of USD 46-57/HH.
Compared to System I and III, the ABR and sewerage need a higher level technician/operator. The presence of this operator guarantees that common problems can be fixed in timely manner, but on the other hand requires additional cost for the OM (salary). However, System II has a higher public preference and lower health risk compared to System I, since the digester is only fed with cattle dung. The BOD removal efficiency of System I is considered high, 80-85%.
It can be concluded, that System II has the highest investment and OM cost. The sewerage and ABR require an operator and additional water, while on the other side the area experiences seasonal water scarcity. Moreover, the system cannot fully recover the resources and does not recover any energy to reduce the OM cost. Due to the fact that there is no sharing of responsibility or end product, this system is not susceptible to conflicts.
10.7.3. Analysis of System III: Private Digester and Cluster Septic Tank-AF System III consists of two sub-systems: a single-household level digester with input from cattle dung, and a cluster-level septic tank with an anaerobic filter followed by a horizontal-flow planted filter (HFPF) to treat black- and greywater. The investment cost of the system is USD 1061/HH, which is higher than System I but lower than System II. This high investment cost results from the construction of a non-shared digester. After subtracting OM costs, the system contributes a total economic benefit from resource recovery (biogas and biomass) amounting of USD 46/HH.y, which is less than System I (USD 57/HH.y). System III does not require any energy and only requires 32 liters/HH.day of water- which is considered low. The sytem is quite simple with a high possibility that the technical problems can be solved within a reasonable amount of time. Compared to the other two systems, System III is moderate in terms of the technical skill required for users to operate the plant and its compatibility to the existing system. However, its space requirement (5.9 m2/HH) is the highest compared to the two other systems.
Similar to System II, System III separates cattle dung and human excreta’s flow, which
makes its potential health risk for users lower compared to System I. System III has the highest BOD removal efficiency, namely 85-98%. Compared to System I, System III is
Step 5 of SusTA: Sustainability-based Technology Assessment _________________________________
146
gaining more acceptance in society since it excludes blackwater in the digester and it can compromise a private and shared management scheme. Although the septic tank is installed at a cluster level, it does not require sharing any regular tasks like the digester in System I. The digester is installed at a single household scale to avoid any conflict.
It can be concluded that System III is an “amicable solution”. Although investment cost is regarded as an important consideration in selecting a system, ‘intangible cost’ such as
conflicts with users and refusal of the end-product play important roles in the reality. The conflict and refusal might lead to unsustainability of a technology. Therefore rather than focusing on an economically viable technology (from investor’s perspective), one should also consider the social effect of the technology in the long-run. The combination of a septic tank-anaerobic filter- HFPF (Sub-System III.b) is economically more feasible compared to a sewerage and communal ABR (Sub-System II.b)- which requires more water and an operator, but does not bring any economic benefit from resources recovery.

Summary and Future Research Perspectives
147
11. Summary and Future Research Perspectives This chapter is a reflection on the development process of a methodology for a sanitation planning tool (SusTA), regarding sustainable technology as an outcome. It summarizes the results and findings of the research as well as recommendations for further research.
11.1. Summary of the Research The development of this planning tool starts with four research questions that were described in Chapter 1:
How can knowledge of sustainability be transferred into operable planning steps which are suitable for developing countries?
This question will be responded to in stages:
i. How can sustainability be viewed? The main reason why a sustainability concept should be integrated into a sanitation planning tool is to guide the decision makers to come to the most sustainable sanitation solution. In many cases, sustainability is only viewed in fragments which lead to an unsustainable solution. Hence, sustainability per definition should be viewed comprehensively, without reducing it to merely environmental or economic aspects.
ii. How can sustainability be assessed? What reference can be used to assess whether developments are sustainable? The Brundtland report with its well-known sustainability definition offered a comprehensive concept of sustainability. But it has been intensely discussed that what is still missing in the debate is a profound theoretical and normative basis for the justification of sustainability (see section 3.3). The Helmholtz Concept of Sustainability provides a theoretically well-founded approach to operationalize the guidelines and an operable analytical tool for sustainability analyses. The goals of this concept are concretized by criteria and indicators which are applicable for different sustainability analyses.
iii. How can knowledge of sustainability be transferred into operable planning steps which are suitable for developing countries? There is a crucial need to identify the problems before jumping to a sanitation solution. In other words, there should be a link between the problem and the proposed solution. In order to have a complete picture regarding the sanitation problems in the region, one has to answer the questions: where are we now, what are our problems, how sustainable are we now, where will we go? In the proposed planning tool (SusTA) a distance-to-target analysis is suggested (Chapter 7). The analysis shall determine the gap between a given sanitation situation and the intended sustainable development A set of indicators derived from the Helmholtz Concept of Sustainability is developed to describe the sanitation-related situations (e.g. health status, sanitation policy, sanitation coverage). The current conditions are expressed by the indicators’ baseline values, while the
target values represent the desired situation. The identification of sustainability deficits is conducted by comparing the current and target values. This analysis allows decision makers to identify the problems/threats and provide measures to achieve sustainable development, particularly in the sanitation sector. Another aspect of the sustainability concept is implemented in the planning tool as a feature for the selection process for a technological solution (Chapter 9 and 10). SusTA recommends a set of sustainability-based technology assessment indicators which is derived from the

Summary and Future Research Perspectives______________________________________________________
148
Helmholtz Concept as well. The thirteen indicators represent the minimum requirements for a sustainable technology in the developing countries’ context. The
indicators are equipped with a modifiable rating scale, which can accommodate the local concerns and needs.
When is stakeholder involvement required in the planning steps and how can different
stakeholder groups be best accommodated? This refers to the fact that the hierarchy culture is very strong in many developing countries and that there is a big gap in knowledge between different stakeholder groups.
Although integrating stakeholders into the decision making is commonly promoted to enhance the sustainability of a technology, it should be considered when and to what extent their involvement is required. The lessons learned from the case study revealed that participation does not always mean to involve all stakeholders in all planning processes. It is recommended to involve only the relevant stakeholders in the right steps with their best participation level. This is due to the fact that the knowledge gap and the disparity of interests do exist between stakeholder groups. Therefore it is considered ineffective to include stakeholders when they do not have the required competency or interest. Dillon (2010) describes stakeholders’ involvement in four levels (Figure 11.1)
Figure 11.1 Stakeholders’ level of involvement (Source: Dillon, 2010)
Having a generic analysis on stakeholders’ level of participation is difficult to accomplish.
However, Figure 11.2 tries to summarize the result obtained from the case study of Pucanganom.
1. Informing
To provide the stakeholder(s)
with information to enable people to understand the
problem, alternatives
and/or solution.
2. Consulting
To obtain stakeholder feedback on
analysis, alternatives
and/or decisions.
3. Collaborating
To work as a partner with the
stakeholder(s) on each aspect of the
decision, including the development of
alternatives and the identification of the preferred solution.
4. Empowering
A process of capacitating the
stakeholder(s) so that they are able to make
informed decisions and to take
responsibility for final decision-making.

Summary and Future Research Perspectives
149
Steps in SusTA SHA : Stakeholders and Sanitation Policy Analysis in the Region
DTT : Distance-to-target Analysis on Sustainability of Sanitation Situation in the Region
PSE : Examination of Physical and Socio-economic Conditions in the Project Area
CTX : Contextualization of Technology Assessment Process
STA : Sustainability-based Technology Assessment
Level of participation
1 : Informing
2 : Consulting
3 : Collaborating
Figure 11.2 Level of stakeholders’ participation in SusTA, case study Pucanganom
How can the sustainability of a sanitation technology be assessed for a certain context?
There is a general understanding that some technologies (particularly the ones that can recover resources) are more sustainable than others. Due to this understanding, sometimes planners overlook the importance of considering the local context in the selection of a sanitation technology (section 3.4.2). In the field of wastewater technology assessment a variety of research has been developing sustainability assessment using indicators. The sets of indicators are sometimes too general to represent the local needs.
There might not be a fixed set of indicators that is universally valid to assess the sustainability of technologies. Hence, a framework for contextualization is provided as one generic step of SusTA. Each stakeholder group is given a chance to describe their priority on criteria to select a sustainable technology, and to describe indication of the conditions to be fulfilled in order to be sustainable. This contextualization accommodates the differing perspectives of sustainability and allows the selection of a technology based on local perspectives of sustainability.
Beneficiaries
Institution Practitioner
0
0,5
1
1,5
2
2,5
3
SHA DTT
PSE CTX
STA
Lev
el o
f par
ticip
atio
n
SHA DTT PSE CTX STA Beneficiaries 2 0 3 3 0 Institution 2 2 0 3 2 Practitioner 2 0 0 3 3

Summary and Future Research Perspectives______________________________________________________
150
What elements/approaches should be included in the proposed planning tool to make it effective, comprehensive, and applicable for the context of developing countries?
This last question serves as a conclusion from the first three research questions. Sustainability-based sanitation planning tool (SusTA) is a tailor-made product of this research. As mentioned in Chapter 2, the development of a planning tool is an iterative process. From this process, it can be concluded that three elements/approaches are necessary to be integrated into the tool to achieve the desired outcome: a sustainable technology for a certain context. These three elements are: sustainability concept, participatory approach, and framework for contextualization. Besides the technical failures, the sustainability concept and stakeholders’ participation were identified as the missing elements in the planning process,
which led to the inoperativeness of the sanitation technology (Chapter 1). Although the sustainability concept is then integrated into SusTA, it is recognized that the perception of sustainability can vary from one region to another – even between stakeholder groups in the same region (section 9.2). How to accommodate various perspectives on what is defined as sustainable in the local context needs to be included in the planning process as well. From the practical perspective, the goal of this dissertation is to contribute to the development of a sanitation planning tool which is applicable for developing countries in similar situations to the case study. In order to be widely applicable, frameworks to systematically modify the planning tool (in this case: the tool kits) should be integrated into SusTA. It is acknowledged that a system analysis for technology assessment is often criticized as a non-standardized method. Due to its nature as a tailored method, it is difficult to compare one study to another (section 3.2.5). The last step of SusTA includes system analysis for sustainability-based technology assessment using TA indicators as its tool kit. Therefore these toolkit-modification frameworks can also serve as a solution for the aforementioned problem.
It can be concluded that there are four elements which should be added to achieve an effective and widely-applicable sanitation planning tool. These elements are illustrated in Figure 11.3:
Figure 11.3 Four essentials elements to be included in SusTA
11.2. Future Research Perspectives This dissertation has contributed to the development of a sanitation planning tool which combines planning theory and practice. However, there are several critical issues that have not been fully addressed in this dissertation. Further research can be carried out for the improvement of SusTA:
Sustainability concept
Participatory approach
Framework for contextualization
Framework for
modification

Summary and Future Research Perspectives
151
a. Regarding stakeholders’ involvement in the planning process: The level of stakeholders’ participation differs from one region to another, partly due to the cultural setting and political system. In countries where a top-down approach is common practice, the beneficiaries’ participation is limited or maybe non-existentand the authority is placed in a higher stratum. Due to this perception it is very difficult to expect an equal participation, especially when all these stakeholders sit together at one table (e.g. workshop or focus group discussion to define priorities and to select a technology). Lately the ‘top-down’ approach has theoretically been replaced by a ‘bottom-up’ approach (Chapter 6). However, this change which should give more space for participation is not always promising. Since the beneficiaries have been accustomed to passiveness for many years, which is also part of the culture, they may not feel comfortable expressing their differing opinions in front of authority. Nevertheless, their wishes and local wisdom should be conveyed in order to plan a sustainable solution. Therefore, for cases in a situation similar to Pucanganom, SusTA recommends to separate each stakeholder group during the identification of the problem and the preferred solutions (e.g. using household questionnaires or informal interviews as described in Chapter 2). This separation is effective to support equity and avoid particular stakeholders’ domination in the decision making process.
However, the final result of this process should be communicated to all stakeholder groups and discussed together in order to find a common solution.
The remaining challenges regarding stakeholders’ participation are:
- How can the different groups of stakeholder be effectively integrated into this particular cultural and political setting?
- Which communication framework is appropriate to provide equity in expressing each stakeholder group’s opinion?
b. Regarding introduction of technologies in the planning tool: Each stakeholder group can be very particular to their technological preference. This particular choice is mainly related to their familiarity with a certain type of technology. The fact that the beneficiaries were only accustomed to a particular type of technology makes it difficult for them to accept a new technology alternative. Similar to that, the institution and practitioners will only construct those types of technologies they already have experience with. Therefore, the introduction of or exposure to several technology alternatives as well as transparent information on the advantages and disadvantages of the existing technology are important. SusTA recommends a workshop for this technologies introduction process (Chapter 8). Alternatively, a technology catalog can be introduced before household questionnaires are conducted. The aim is to provide transparent information on the basic characteristics of technologies before the beneficiaries express their preference in the questionnaire and later on select the technology which suits best. In the real application of SusTA, both methods were tested. The workshop was found to be very time-consuming, while the technology catalog was considered insufficient. Therefore this framework for the introduction of technologies should be better designed, maybe as an additional planning step.
c. Regarding the distance-to-target analysis: The distance-to-target analysis (Chapter 7) is conducted to determine the gap between a given sanitation situation and the achievement of sustainable development. Ideally these target values represent the objectives of the region, which are set by the responsible government institutions. In the case study, the responsible institutions very often did not have any visions regarding their targets. Hence, the data were unavailable. These data were finally replaced by

Summary and Future Research Perspectives______________________________________________________
152
data from literature. Somehow this data substitution cannot fully represent the actual targets of the region. Several indicators even do not have any target values, since there is no representative data. Due to this lack of data, the essence of this analysis might not be to measure the distance to target, but rather to serve as a trigger to recognize the problems and as a starting point to think about the measurements.
In SusTA, institutional interviews were conducted as the main method to collect data for distance-to-target analysis. In the practice, this method was considered ineffective due to the fact that either the data were scattered in different departments or data were not available. For the improvement of SusTA: after conducting institutional interviews, a workshop involving all relevant institutions could be a better solution. That way, the question of ‘who has which
data?’ can be solved at once and there are target values which are compiled by the institutions.
d. Regarding differing perspectives of each stakeholder group: The technology assessment is based on thirteen indicators. This set of indicators is ranked by different stakeholder groups. Differing perspectives regarding which indicators are important to represent the sustainability do exist. In the application of SusTA, these differing perspectives were modeled using three assumptions (section 9.2). These assumptions try to vary the power distribution between stakeholder groups. The result of this simplified sensitivity analysis reveals that despite of weighting using ratio of power is applied, it does not significantly change the ranking of indicators. This is due to the fact that each stakeholder group in the case study is already influenced by their “natural” interest, determined by their
roles. Therefore the priorities are almost definite. Nevertheless, a better method of how to deal with these differing perspectives should be further developed. A mathematical procedure can be applied to formulate the algorhytm of the sensitivity analysis, particularly to see:
- How significant is the change of stakeholders’ natural interest for the result of the ranking of indicators?
- How remarkable is the influence of the ranking of indicators on the final selection of the technology?
e. Regarding the scoring scale of quantitative and qualitative indicators: The technology assessment indicators comprise quantitative and qualitative data, using the rating score 1-3 to represent a low-medium-high fulfillment. For qualitative data, the scoring 1-3 is considered sufficient. This three-level scale can represent clear distinctive conditions in a semi-quantitative method. For quantitative data with features, a scoring scale of 1-3 is considered to be too rough. This is also reflected in the total fulfillment score of a system (consists of several sub-systems) to an indicator. The distinction between a low, medium or high fulfillment becomes too extreme and needs to be refined, in order to have a precise analysis between systems. The remaining question is then: how to deal with different scoring scales in the same matrix (e.g. 1-3 for semi-quantitative data and 1-5 for quantitative data).
f. Regarding weighting of each indicator, each sub-system and aggregating the total score of each technology system
In order to be operable even for a non-expert user, the technology assessment step is designed in a very simple way. The result of the assessment is presented in a matrix, and then summarized in a rose-chart diagram (section 10.7). To provide transparency several approaches are employed:

Summary and Future Research Perspectives
153
a) Weighting of each indicator is not applied. Only ranking/prioritization of the indicators conducted by all stakeholder groups indicates the degree of importance of the indicators.
b) When a system consists of two sub-systems, all sub-systems are assumed to be equally important. Therefore, a system fulfillment to one indicator is obtained from 50% of each sub-system’s fulfillment score.
c) No aggregate score of each system is provided. The decision makers select a system based on its fulfillment of the high-prioritized indicators.
The drawback of these methods is that the decision maker cannot make a precise comparison. For point b): it might happen that one sub-system treats several types of wastewater (e.g. Sub-system I.a, which treats blackwater and cattle dung), while the other sub-system (I.b) only treats greywater. The first sub-system has actually more burden and more ‘share’ to
reduce the pollutant, and therefore more important compared to the other. This differentiation cannot be captured in the final fulfillment, if the share of each sub-system is assigned to be 50%.
The disadvantage of not having a weighting for indicators (point a.) and not aggregating the total score of each system (point c.) is that the decision makers cannot quickly capture the result. Depending on the planner’s/decision maker’s consideration- weighting each sub-system, as well as weighting each indicator and finally performing an aggregate score of each system might also be applied for the last step of SusTA.
g. Regarding SusTA’s applicability for other case study: There are not many decision support tools available to address specific sanitation problems in developing countries, as well as those problems faced by the decision makers. A lack of software, data, and references becomes the main hindrance for the decision process. Therefore it is crucial to develop a tool which can be applied under the aforementioned conditions and is yet also applicable and accurate to support the decision process.
SusTA is developed based on the empirical evidences gained from the IWRM Project in Indonesia. Although the tool is equipped with analytical generalization for its further application, SusTA has never been tested for other case studies. Validation with other case studies in developing countries can improve the systematic and applicability of the tool.
Several proposed characteristics for a further SusTA test case will be as follows (Table 11.1): Table 11.1 Characteristics of project area for SusTA test case
Criteria Remarks
Political situation Developing country with long history of top-down planning approach
Cultural background Region with strong hierarchy culture, dominated by a certain stakeholder group
Socio-economic Middle low- to low-income community
Geography Rural area with lack of infrastructures
Current decision making problems
Lack of availability of supporting data, sustainability analysis and participatory approach in the planning
Other supporting factor Stakeholders’ willingness to cooperate in the planning process

References _______________________________________________________________________________
154
References Adji, T.N. and Sudarmadji. (2008). Hydrological properties of Bribin underground river system
(Experience learned from Seropan river system project). Proceeding of Integrated Water Resources Management Seminar, Yogyakarta, Indonesia
Andreo, B., Goldschneider, N., Vadillo, I., Vías, J.M., Neukum, C., Sinreich, M., Jiménez, P. and Brechenmacher, J. (2005). Karst Groundwater Protection: First Application of a Pan-European Approach to Vulnerability, Hazard and Risk Mapping in The Sierra De Lı´bar (Southern Spain). Science of the Total Environment 357 (2006) 54– 73
Asian Development Bank. (2008). Issues Paper: The Hows and Whys of Water Connection Charges. ADB
Balkema, A. J. (2003). Sustainable Wastewater Treatment –Developing a Methodology and Selecting Promising Systems. Dissertation. Eindhoven, The Netherlands: Eindhoven University Press.Technische Univesiteit Eindhoven
Balkema, A. J., Preisig, H. A., Otterpohl, R. and Lambert, F. J. D. (2002). Indicators for the Sustainability Assessment of Wastewater Treatment Systems. Urban Water 4 (2002) 153–161
Balkema, A.J., Preisig, H., Otterpohl, R., Lambert, A. and Weijers, S. (2001). Developing a Model-based Decision Support Tool for the Identification of Sustainable Treatment Options for Domestic Wastewater. Water Science and Technology 43 (7), 265–269
Betrie, G.D., Sadiq, R., Morin, K.A., and Tesfamariam, S. (2013). Selection of Remedial Alternatives for Mine Sites: A Multicriteria Decision Analysis Approach. Journal of Environmental Management 119 (2013) 36-46
BORDA and WSP. (2005). Informed Choice Catalogue. Information brochure
Bracken, P., Kvarnström, E., Ysunza, A., Kärrman, E., Finnson, A. and Saywell, D. (2005). Making Sustainable Choices – The Development and Use of Sustainability Oriented Criteria in Sanitary Decision Making. In: Ecological Sanitation, A Sustainable, Integrated Solution, Conference Documentation. 3rd International Ecological Sanitation Conference. pp 486–494.
Bräutigam, K.-R. and Gonzalez, T.(2010). Evaluation of Municipal Solid Waste Management in Santiago de Chile Regarding Sustainability. In: International Solid Waste Association-World Congress (ISWA) 2010 (Hrsg.): Urban development and sustainability - a major challenge for waste management in the 21st century. Hamburg, Germany. Available at: http://www.iswa.org/ Last access: August 26, 2011
Brikké, F. and Bredero, M. (2003). Linking Technology Choice with Operation and Maintenance in the Context of Community Water Supply and Sanitation: A Reference Document for Planners and Project Staff. World Health Organization and IRC Water and Sanitation Centre . Geneva, Switzerland. ISBN: 92 4 156215 3
Brunsch, A. (2011). Hydrological Assessment of a Karst Area in Southern Java with Respect to Climate Phenomena. Proceeding of Asian Trans-Disciplinary Karst Conference 2011. Yogyakarta, Indonesia
Carr, R. and Strauss, M. (2001). Excreta Related Infections and the Role of Sanitation in the Control of Transmission In: Ed. Fewtrell and Bartram World Health Organization Water Series, IWA Publishing UK
COHRE (Centre on Housing Rights and Evictions, Right to Water Programme), WaterAid, SDC (Swiss Agency for Development and Cooperation) and UN-HABITAT. (2008). Sanitation: A Human Rights Imperative. Geneva. ISBN: 978-92-95004-47-4
Conradin, K., Kropac, M., Spuhler, D. (Eds). (2010). The Sustainable Sanitation and Water Management Toolbox. Seecon International GmbH. Basel. Available at: http://www.sswm.info. Last access: March 19, 2013

References
155
Cruz, R., Navaluna, M.V., Galing, E., Roncesvalles, J., Sadang, R., de Dios, L.R., Sahagun, V., Luis, R., Kaimo, A., Fuellos, R., Matibag, M., Elvas, L. and Sy, E. (2005). Philippines Sanitation Sourcebook and Decision Aid. World Bank Water and Sanitation Programme for South East Asia and the Pacific (WSP-EAP). German Technical Cooperation (GTZ), Manila, Philippines. Available at: www.susana.org/lang-en/library?view=ccbktypeitem& type=2&id=1335. Last access: May 13, 2013
Damayanti, V.R.(2009). Analysis on the Government Institutions’ Performance and Financial Scheme
on Waste Water and Solid Waste in Gunung Kidul ,Indonesia. Master Thesis. Universität Karlsruhe (TH), Karlsruhe. Unpublished
Department of Health Gunung Kidul. (2009). Profil kesehatan Gunung Kidul data 2008. (Health profile of Gunung Kidul based on 2008 data). Wonosari, Indonesia. Available at: http://dinkesgunungkidul.co.nr/ Last access: August 17, 2011
Department of Health Gunung Kidul. (2010). Indikator kesehatan Gunung Kidul. (Health indicators Gunung Kidul). Wonosari, Indonesia. Available at: http://www.dinkes.gunungkidulkab.go.id/index.php?pModule=content&pSub=content&pAct=view&id=1. Last access: July 22, 2011
Department of Health Gunung Kidul. (2011). Interview with Ms. Noor Faizah (database personal) and Ms. Indiyah (Head of Public Health Section)
Department of Industry and Commerce- Gunung Kidul. (2011). Interview with Ms. Siwi (Head of Fertilizer Distribution
Department of Public Works- Gunung Kidul (2011). Interview with Ir. Slamet Supriyadi (Head of Cipta Karya Division)
DiCicco-Bloom, B. and Crabtree, B.F. (2006). Making Sense of Qualitative Research. The Qualitative Research Interview. Medical Education 2006; 40: 314–321. DOI 10.1111/j.1365-2929.2006.02418.x
Dillon, L.B. (2010). Socio-Cultural Aspects and Stakeholders Analysis. Seecon International GmbH. Basel. Also available at: http://www.sswm.info. Last access: March 19, 2013
Directorate of Environmental Health, Ministry of Health-Indonesia (2012). Indonesia Country Profile
Doerfliger, N., Jeannin, P.Y. and Zwahlen, F. (1999). Water Vulnerability Assessment in Karst Environments: A New Method of Defining Protection Areas Using a Multi-Attribute Approach and GIS Tools (EPIK method). Environ Geol 1999;39(2):165–76
Dunmade, I. (2002). Indicators of Sustainability: Assessing the Suitability of a Foreign Technology for a Developing Economy. Technology in Society 24 (2002) 461–471
Eawag (Swiss Federal Institute of Aquatic Science and Technology). (2005). Household-Centred Environmental Sanitation. Implementing the Bellagio Principles in Urban Environmental Sanitation Provisional Guideline. ISBN 3-906484-35-1
Eiche, E., Hochschild, M., Hartmann, A. and Neumann, T. (2013). Abschlussbericht des Teilprojekts 3 „Geowissenschaftliche Exploration von unterirdischen Karstfließgewässern und Nutzung von mineralischen Ressourcen zur Trinkwasseraufbereitung“ zum Integrierten Wasserressourcen-Management (IWRM), Indonesien. Institute of Mineralogy and Geochemistry, Karlsruhe Institute for Technology. Unpublished.
Eriksson, O. and Frostell, B. (2001). An Approach to Sustainability Assessment of Energy Systems. In: S. Silveria (ed.). Building sustainable energy systems: Swedish Experiences. Swedish National Energy Administration. Sweden
Fleischer, T. and Grunwald, A. (2002). Technikgestaltung für mehr Nachhaltigkeit – Anforderungen an die Technikfolgenabschätzung. In: Grunwald, A. (ed.): Technikgestaltung für eine nachhaltige Entwicklung. Von der Konzeption zur Umsetzung. Berlin

References _______________________________________________________________________________
156
Fleischer, T. and Grunwald, A. (2008). Making nano technology developments sustainable. A Role for Technology Assessment? Journal of Cleaner Production 16(8-9)889-898
Flick, U. (2002). An Introduction to Qualitative Research. Second Edition. SAGE Publications, Inc. California, USA. ISBN 0-7619-7435-0
Food and Agriculture Organization of the United Nations (FAO). (1996). Biogas Technology: A Training Manual for Extension. Support for Development of National Biogas Programme (FAO/TCP/NEP/4451-T)
Gajurel, D.R. (2003). Evaluation of Decentral Physico-Biological Systems for Pre-treatment of Household Wastewater and their Potential for Ecological Sanitaiton. Dissertation. Institute for Wastewater Management and Water Protection, Hamburg University of Technology
Gleick, P.H. (1996). Basic Water Requirements for Human Activities: Meeting Basic Needs. Water International, 21 (1996) 83-92
Goldschneider, N. (2002). Hydrogeology and Vulnerability of Karst Systems – Examples from the Northern Alps and the Swabian Alb. Dissertation. Fakultät für Bio- und Geowissenschaften der Universität Karlsruhe
Grunwald, A. (2009). Technology Assessment: Concepts and Methods. In: A. Meijers (ed.): Philosophy of Technology and Engineering Sciences. Volume 9. Amsterdam: North Holland 2009, p. 1103-1146
Grunwald, A. (2012). Sustainability Assessment of Technologies – An Integrative Approach. Sustainable Development - Energy, Engineering and Technologies - Manufacturing and Environment. Prof. Chaouki Ghenai (Ed.). ISBN: 978-953-51-0165-9
Grunwald, A. and Rösch, C. (2011). Sustainability Assessment of Energy Technologies: Towards an Integrative Framework. Energy, Sustainability and Society 2011, 1:3
Hadorn G.H., Bradley, D., Pohl, C., Rist, S. and Wiesmannd, U. (2006). Implications of Transdisciplinarity for Sustainability Research. Ecol. Econ. 2006, 60, 119-128
Heckmann, A. (2011). Vulnerabilitätskartierung und Gefahrenabschätzung zum Schutz der Trinkwasser-versorgung in der Ländlichen Karstregion Gunung Sewu, Java, Indonesien. Diploma Thesis. Fakultät für Chemie und Geowissenschaften Geographisches Institut, Ruprecht-Karls-Universität Heidelberg
Hellström, D., Jeppsson, U., and Kärrman, E. (2000) A Framework for Systems Analysis of Sustainable Urban Water Management. Environmental Impact Assessment Review 20, 311-321
Hoffmann, B., Nielsen, S.B., Elle, M., Gabriel, S., Eilersen, A.M.,Henze, M. and Mikkelsen, P.S. (2000). Assessing the sustainability of small wastewater systems. A context-oriented planning approach. Environmental Impact Assessment Review 20(3) 347–357
Howard, G. and Bartram, J., (2003). Domestic water quantity, service level and health. World Health Organization (Hrsg.). Geneva, Swiss. Available at: http://www.who.int/water_sanitation_health/diseases/WSH03.02.pdf . Last access: August 26, 2011
Huber, J. (2004). New Technologies and Environmental Innovation. Cheltenham: Edward Elgar IfG (Institut für Geografie). (2004). Sozioökonomische Analyse der potenziellen Wassernutzer. IWRM
Projekt Abschlussbericht, Universität Giessen, Giessen. Unpublished
Irvine, K.N., Somogye, E.L. and Pettibone , G.W. (2002). Turbidity, Suspended Solids, And Bacteria Relationships in the Buffalo River Watershed. Middle States Geographer, 2002, 35:42-51
ISF –UTS. (2011). Indonesia Water, Sanitation and Hygiene Sector Brief. Prepared for AusAID by the Institute for Sustainable Futures, University of Technology Sydney. October 2011

References
157
ITAS, KIT (Institute for Technology Assessment and System Analysis, Karlsruhe Institute of Technology) and ASC (Speleolog Club). (2009). Field Survey in the Northern Part of Bribin Catchment Area. Unpublished (Part of Suwartanti Nayono’s Dissertation)
ITAS, KIT (Institute for Technology Assessment and Systems Analysis, Karlsruhe Institute of Technology) and Faculty of Geography, Gadjah Mada University (UGM). (2010). Survey on Water and Wastewater-related Conditions in Recharge Area of Bribin, Gunung Kidul, Yogyakarta, Indonesia. (unpublished)
IWA (International Water Association). (2006). Sanitation 21. Simple Aproaches to Complex Sanitation. A Draft Framework for Analysis. International Water Association, Alliance House. London
IWG (Institut für Wasser und Gewässerentwicklung). (2005). Integriertes Wasserressourcen-Management in Gunung Kidul, Java, Indonesien, Abschlussbericht, Universität Karlsruhe (TH), Karlsruhe. Unpublished
Jeppsson, U. and Hellström, D. (2002). Systems Analysis for Environmental Assessment of Urban Water and Wastewater Systems. Water Science and Technology Vol 46 No 6–7 pp 121–129 © IWA Publishing 2002
Kaçaroğlu, F. (1999). Review of Groundwater Pollution and Protection in Karst Areas. Water, Air, and Soil Pollution, 113, 337-356.
Kopfmüller, J. (ed). (2006). Ein Konzept auf dem Prüfstand. Das integrative Nachhaltigkeitskonzept in der Forschungspraxis. Berlin: Edition Sigma
Kopfmüller, J., Brandl, V., Jörissen, J., Paetau, M., Banse, G., Coenen, R. and Grunwald, A. (2001). Nachhaltige Entwicklung Integrativ Betrachtet. Konstitutive Elemente, Regeln, Indikatoren. Sigma. Berlin, Germany
Kossmann, W. and Pönitz, U. (1999). Biogas Digest Volume II Biogas - Application and Product Development. Information and Advisory Service on Appropriate Technology (ISAT), Deutsche Gesellschaft für Technische Zusammenarbeit (GTZ). Eschborn, Germany
Kvarnström, E. and af Petersens, E. (2004). Open Planning of Sanitation Systems. EcoSanRes Programme and the Stockholm Environment Institute. Stockholm, Sweden. ISBN 91-88714-95-0
Kvarnström, E. and McConville, J. (2007). Sanitation Planning - A Tool to Achieve Sustainable Sanitation? Proceedings of Water Supply and Sanitation for All (ed. Wilderer et al.), Conference. Sept 26 - 28, 2007. Berching, Germany
LIPI, Indonesian Research Centre (Lembaga Ilmu Pengetahuan Indonesia). (2008). Domestic Wastewater Treatment. (Pengolahan Air Limbah Domestik). Only available in Indonesian
Libralato, A., Ghirardini, A.V. and Avezzù , F. (2012). To Centralise or to Decentralise: An Overview of the Most Recent Trends in Wastewater Treatment Management. Journal of Environmental Management 94 (2012) 61-68
Lind,B.-B., Ban,Z., and Bydén, S. (2000). Nutrient Recovery from Human Urine by Struvite Crystallization with Ammonia Adsorption on Zeolite and Wollastonite. BioresourceTechnology 73 169-174.
Local Planning Agency- Gunung Kidul (2008). Final Report on Water Balance of Gunungkidul Regency. (Laporan Akhir Penyusunan Neraca Sumberdaya Air Kabupaten Gunungkidul). Only available in Indonesian
Local Planning Agency- Gunung Kidul. (2010). Sanitation White Book of Gunung Kidul (Buku Putih Sanitasi). Only available in Indonesian. Unpublished
Ludwig, B. (1997). The Concept of Technology Assessment: An Entire Process to Sustainable Development. Sustainable Development, Vol. 5, 111-117 (1997)

References _______________________________________________________________________________
158
Luks, F. and Siebenhüner, B. (2007). Transdisciplinarity for Social Learning? The Contribution of the German Socio-Ecological Research Initiative to Sustainability Governance. Ecol. Econ. 2007, 63, 18-26
Lundin M., Molander S., and Morrison G.M. (1999). A Set of Indicators for the Assessment of Temporal Variations in Sustainability of Sanitary Systems. Wat. Sci Tech. Vol. 39 No. 5 pp 235-242
Lundin, M., Bengtsson, M., and Molander, S. (2000). Life Cycle Assessment of Wastewater Systems: Influence of System Boundaries and Scale on Calculated Environmental Loads. Environmental Science and Technology, 34, 180–186
Lundin, M. and Morissson, G.M. (2002). A Life Cycle Assessment Based Procedure for Development of Environmental Sustainability Indicators for Urban Water Systems. Urban Water 4 (2002) 145–152
Lüthi, C., Morel, A., Tilley, E. and Ulrich, L. (2011). Community-Led Urban Environmental Sanitation Planning: CLUES. Complete Guidelines for Decision-Makers with 30 Tools. Eawag Sandec/WSSCC/UN-HABITAT
Lüthi, C. (2012). Community-based Environmental Sanitation Planning Approaches for the South: The Household-Centred Approach. Dissertation. Fakultät VI – Planen Bauen Umwelt der Technischen Universität Berlin
Mac Donald and Partners. (1984). Greater Yogyakarta Groundwater Resources Study. Volume 3: Groundwater. Government of the Republic of Indonesia, Ministry of Public Works, Directorate General of Water Resources Development. Indonesia
Marjianto (2010). Report on Gunung Kidul Institutions’ Tasks and Responsibilities. TP 11 IWRM Project Report. Unpublished
McConville, J. (2010). Unpacking Sanitation Planning. Comparing Theory and Practice. Dissertation. Department of Architecture, Chalmers University of Technology, Gothenburg, Sweden. ISBN 978-91-7385-483-2
Metcalf and Eddy, Inc.(2003). Wastewater Engineering: Treatment and Reuse, Fourth Edition. McGraw-Hill. New York, USA
Milman, A. and Short, A. (2008). Incorporating Resilience into Sustainability Indicators: An Example for the Urban Water Sector. Global Environmental Change 18 (2008) 758–767
Mimi, Z. and Assi, A. (2009). Intrinsic Vulnerability, Hazard and Risk Mapping for Karst Aquifers: A Case Study. Journal of Hydrology 364 (2009) 298–310
Ministry of Environmental Protection, Republic of Indonesia (2003). Ministrial Decree Number 112 Year 2003 on Domestic Waste Quality Standard (Keputusan Menteri Negara Lingkungan Hidup Nomor 112 Tahun 2003 Tentang Baku Mutu Air Limbah Domestik). Only available in Indonesian
Ministry of Public Works, Republic of Indonesia, Directorate General of Cipta Karya. (2013). Ministry of Public Work Socializes Sanimas Program 2013 for 48 Cities. Only available in Indonesian. Available at: http://ciptakarya.pu.go.id/v3/?act=vin&nid=1311. Last access: June 6, 2013
Ministry of Public Works, Republic of Indonesia.(2010). Procedure on Execution of Special Alocation Fund for Infrastructure Sector Sanitation Sub Sector. (Petunjuk Pelaksanaan Penggunaan Dana Alokasi Khusus Bidang Infrastruktur Sub Bidang Sanitasi). General Director Cipta Karya. Jakarta. Only available in Indonesian
Moldan, B., Svatava, J. and Hák, T. (2008). How to Understand and Measure Environmental Sustainability: Indicators and Targets. Ecological Indicators 17 (2012) 4–13

References
159
Molinos-Senante, M., Hernández-Sancho, F. and Sala-Garrido, R. (2012). Economic Feasibility Study for New Technological Alternatives in Wastewater Treatment Processes: A Review. Water Science and Technology Vol 65 No 5 pp 898–906 © IWA Publishing 2012. DOI 10.2166/wst.2012.936
Monvois, J., Gabert, J., Frenoux, C. and Guillaume, M. (2009). CMS (Concerted Municipal Strategies) Methodological Guide No 4: How to Select Appropriate Technical Solutions for Sanitation. AFD and the European Commission’s ACP-EU Water Facility. France
Morel A. and Diener S. (2006). Greywater Management in Low and Middle-Income Countries, Review of Different Treatment Systems for Households or Neighbourhoods. Swiss Federal Institute of Aquatic Science and Technology (Eawag). Dübendorf, Switzerland. ISBN: 3-906484-37-8
Muga, H. and Mihelcic,J.R. (2008). Sustainability of Wastewater Treatment Technologies. Journal of Environmental Management 88 (2008) 437–447
Mungkasa, O. (2010). Mainstreaming of Sanimas as the Solution for Urban Sanitation Development in Indonesia. Directorate of Settlement and Housing, National Development Planning Agency/BAPPENAS, Republic of Indonesia. Presentation at IWA Conference, March 23-26, 2010. Surabaya, Indonesia
Murray, A., Ray, I. and Nelson, K.L. (2009). An Innovative Sustainability Assessment for Urban Wastewater Infrastructure and its Application in Chengdu, China. Journal of Environmental Management 90 (2009) 3553–3560
National Statistic Bureau-Indonesia .(2009). Indonesia in Figures 2009. Jakarta, Indonesia
Nayono, S.; Lehn, H.; Kopfmüller, J. and Singer, M. (2010). Sustainable Sanitation as a Part of IWRM in the Karst Area of Gunung Sewu: Community Acceptance and Opinion. Water Practice and Technology 4(2010)5, S. 104. DOI 10.2166/wpt.2010.104
Ness, B., Urbel-Piirsalu, E., Anderberg, S., Olsson, L., (2007). Categorising Tools for Sustainability Assessment. Ecological Economics 60, 498-508
NETSSAF (Network for the development of Sustainable approaches for large Scale Implementation of Sanitation in Africa). (2006). Criteria for the Evaluation And Classification of Conventional and Innovative Low Cost Sanitation Technologies. Project report co-funded by the European Commission within the Sixth Framework Programme (2002-2006)
NETSSAF (Network for the development of Sustainable Approaches for large scale implementation of Sanitation in Africa). (2007). Deliverable 22 & 23 Evaluation of existing low cost conventional as well as innovative sanitation system and technologies. Project Report co-funded by the European Commission within the Sixth Framework Programme (2002-2006)
NETSSAF (Network for the development of Sustainable Approaches for large scale implementation of Sanitation in Africa). (2008). NETSSAF Participatory Planning Approach, A Guideline For Sustainable Sanitation Planning
ODA (Overseas Development Department) (Ed.).(1995). Guidance Note on How to do Stakeholder Analysis of Aid Projects and Programmes. London. Available at: http://www.sswm.info/sites/default/files/reference_attachments/ODA%201995%20Guidance%20Note%20on%20how%20to%20do%20a%20Stakeholder%20Analysis.pdf. Last access: March 20, 2013
OEIC-GK (Office of Environmental Impact Control - Gunung Kidul). (2011). Interview with Ms. Dwi Wiyani, M.Eng (Head of Prevention Program)
Palme, U., Lundin, M., Tillman, A.M. and Molander, S. (2005). Sustainable Development Indicators for Wastewater Systems – Researchers and Indicator Users in A Co-Operative Case Study. Resources, Conservation and Recycling 43 (2005) 293–311

References _______________________________________________________________________________
160
Pintér, L., Hardi, P. and Bartelmus, P. (2005). Indicators of Sustainable Development. Proposals for a Way Forward Discussion Paper Prepared under a Consulting Agreement on behalf of the UN Division for Sustainable Development. United Nations Division for Sustainable Development (UNDSD). New York
PT. Swen (2011). Biogas: Alternative Energy, Organic Fertilizer Producer, Sustainable and Environmental-friendly. (Biogas: Energi Alternatif, Penghasil Pupuk Organik, Ramah Lingkungan dan Berkelanjutan). Company Profile Brochure. Only available in Indonesian
Puspitasari, P.N. (2009). Analysis Of Governmental Institutions Performance Concerning Integrated Water Resources Management. Case Study in Gunungkidul, Indonesia. Master Thesis. Universität Karlsruhe (TH), Karlsruhe. Unpublished
Ridderstolpe, P. (2000). Comparing Consequences Analysis – a Practical Method to Find the Right Solution for Wastewater Treatment. Available at: http://www.iees.ch/EcoEng001/EcoEng001_R4.html. Last access: March 4, 2013
Schertenleib, R. (2008). Urban Sanitation Systems – Building on the Household Centred Environmental Sanitation Approach (HCES). SEI/EcoSanRes 2 Workshop on: Planning and Implementation of Sustainable Sanitation in Peri/Semi-Urban Settings – A Need for Development of Existing Tools. August 25-26, 2008. Stockholm
Schölzel and Bower. (1999). Small Scale Wastewater Treatment Plant. Project Report on Project Criteria, Guidelines and Technologies. South Pacific Applied Geoscience Commission. New Zealand. Available at: http://www.pacificwater.org/userfiles/file/TR0288.pdf. Last access: December 12, 2013
Singhirunnusorn, W. and Stenstrom, M.K. (2009). Appropriate Wastewater Treatment Systems for Developing Countries: Criteria and Indicator Assessment in Thailand. Water, Science and Technology. Vol 59.No 9.2009. © IWA Publishing 2009. DOI 10.2166/wst.2009.215
Statistic Bureau- Gunung Kidul. (2006). Gunung Kidul in Figures 2005.
Statistic Bureau- Gunung Kidul. (2008). Gunung Kidul in Figures 2007.
Statistic Bureau- Gunung Kidul. (2010). Gunung Kidul in Figures 2009. ISSN 0215-5230
Stock, P. and Burton, R.J.F. (2011). Defining Terms for Integrated (Multi-Inter-Trans-Disciplinary) Sustainability Research. Sustainability 2011, 3, 1090-111. DOI 10.3390/su3081090
Sunkar, A. (2008). Sustainability in Karst Resources Management: The Case of the Gunung Sewu in Java. Dissertation. The University of Auckland
Tauseef, S.M, Premalatha, M., Abbasi, T. and Abbasi, M. (2013). Methane Capture from Livestock Manure. Journal of Environmental Management 117 (2013) 187e20
ten Brick, B. (2007). The Natural Capital Index framework (NCI). International Conference on: Beyond GDP. Measuring Progress, True Wealth and the Well-being Nations. November 19-20, 2007. Brussel
Tilley, E. and Peters, S. (Ed.) (2008). Sandec Training Tool 1.0 – Module 4. Sanitation Systems and Technologies. Eawag/Sandec (Department of Water and Sanitation in Developing Countries). Dübendorf, Switzerland
Tilley, E. and Zurbruegg, C. (2007) Evaluation of Existing Low Cost Conventional As Well As Innovative Sanitation System and Technologies. NETSSAF deliverable 22 & 23. Swiss Federal Institute of Aquatic Science and Technology (EAWAG). Duebendorf, Switzerland. Available at: www.susana.org/ lang-en/library?view=ccbktypeitem&type =2&id=1350 . Last access: May 15, 2013
Tilley, E., Lüthi, C., Morel, A., Zurbrügg, C. and Schertenleib, R. (2008). Compendium of Sanitation Systems and Technologies. Swiss Federal Institute of Aquatic Science and Technology (Eawag). Dübendorf, Switzerland. ISBN: 978-3-906484-44-0

References
161
Tillman, A.-M., Lundstroom, H., and Svingby, M. (1998). Life Cycle Assessment of Municipal Waste Water Systems. International Journal of LCA, 3(3), 145–157
Tran, T.A. and Daim, T. (2008). A Taxonomic Review of Methods and Tools Applied in Technology Assessment. Technological Forecasting & Social Change 75 (2008) 1396–1405
Tumwesige, V. , Avery, L., Austin, G., Balana,B. , Bechtel, K., Casson, E., Davidson, G., Edwards, S., Eshete, G., Gebreegziabher, Z., Glenk, K., Hailemichael, K., Mugisha, J., Kasozi, A., Leckie, S., Lemna, B., Magombe, J., Mahteme, Y., Matthews, R., Melamu, R., Mwirigi, J., Naik, L., Orskov, B., Pertiwiningrum, A., Sabiiti, E., Semple, S., Subedi, M., Ssendagire, W., Sylvia, N., Turyareeba, P., Walekwha, P., Yilma, D. , Yongabi, K., Zenk, G. and Smit, J. (2011). Small-Scale Biogas Digester for Sustainable Energy Production in Sub-Saharan Africa. Open Access. First World Sustainability Forum. Nov 1-30, 2011
U.S. National Research Council. (1999). Our Common Journey: A Transition Toward Sustainability. National Academy Press, Washington DC
Ulrich, A., Reuter, S., and Gutterer, B. (Eds) with Sasse, L., Panzerbieter, T. and Reckerzügel, T. (Contributors).(2009). Decentralized Wastewater Treatment Systems (DEWATS) and Sanitation in Developing Countries. WEDC, Loughborough University, UK in association with BORDA (Bremen Overseas Research and Development Association)
UNDP (United Nations Development Program). (2011). Millenium Development Program Indonesia. Available at: http://www.undp.or.id/mdg/index.asp. Last access: February 21, 2013
UNDPCSD (United Nations Division of Sustainable Development). (1995). Work Programme on Indicators for Sustainable Development. Department of Policy Co-ordination and Sustainable Development, United Nations, New York
UNICEF, WHO, World Bank, UN DESA, UNDP (2011). Level and Trends in Child Mortality Report 2011. Estimates Developed by the UN Inter-agency Group for Child Mortality Estimation. Available at: http://data.worldbank.org/indicator/SP.DYN.IMRT.IN. Last access: December 17, 2012
United Nations. (2003). Water for People Water for Life. The United Nations World Water Development Report. UNESCO Publishing. Available at: http://www.
unesdoc.unesco.org/images/0012/001295/129556e.pdf . Last access: December 12, 2013
USEPA (United States Environmental Protection Agency Office of Research and Development). (1988). Design Manual Constructed Wetlands and Aquatic Plant Systems for Municipal Wastewater Treatment. Center for Environmental Research Information. Cincinnati, Ohio
USEPA (United States Environmental Protection Agency). (1997). Response to Congress on Use of Decentralized Wastewater Treatment Systems. Available at: http://nepis.epa.gov. Last access: May 15, 2013
Vías, J.M., Andreo, B., Perles, M.J, Carrasco, F., Vadillo, I. and Jiménez, P. (2006). Proposed Method for Groundwater Vulnerability Mapping in Carbonate (karst) Aquifers: the COP Method. Hydrogeol J 2006;14:912–25. DOI 10.1007/s10040-006-0023-6
Vinnerås, B., Palmquist, H., Balmér, P. and Jönsson, H. (2006). The Characteristics of Household Wastewater and Biodegradable Solid Waste-A Proposal for New Swedish Design Values. Urban Water Journal Volume 3, Issue 1, 2006. DOI 10.1080/15730620600578629
von Münch, E., Ingle, R., Mbalo and D., Kappauf, L. (2012). Compilation of 13 Factsheets on Key Sustainable Sanitation Topics. Sustainable Sanitation Alliance (SuSanA) and GIZ, Germany, 2012. Available at: http://www.susana.org/docs_ccbk/susana_download/2-1229-factsheetbookcompilation.pdf. Last access: March 14, 2013
Walliman, N. (2006). Social Research Methods. SAGE Publications Ltd. London. ISBN10 1 4129 1061 7

References _______________________________________________________________________________
162
Water and Sanitation Program (WSP).(2009). Urban Sanitation in Indonesia: Planning for Progress. Field Note
Water and Sanitation Program (WSP).(2010). Social Factors Impacting Use of EcoSan in Rural Indonesia. Learning Note
WCED (World Commission on Environment and Development). (1987). Our Common Future. Oxford UniversityPress. Oxford
Weaver, P., Jansen, L., van Grootveld, G., van Spiegel, E,. and Vergragt, P. (2000) Sustainable Technology Development. Sheffield: Greenleaf Publishing
Whetzel, D.L and Weaton, G.R. (1997). Applied Measurement Methods in Industrial Psychology. Davis-Black Publishing. Palo Alto, California
WHO (World Health Organization). (2002). The World Health Report 2002: Reducing Risks, Promoting Healthy Life. WHO Report. Geneva. Available at: http://www.who.int/whr/2002/en/ . Last access: March 4, 2013
WHO (World Health Organization). (2012). Water Sanitation Health. Available at: http://www.who.int/water_sanitation_health/diseases/en/. Last access: December 17, 2012
WHO (World Health Organization). (2013). Diarrhoeal Disease. Available at: http://www.who.int/mediacentre/factsheets/fs330/en/index.html. Last access: March 1, 2013
WHO and UNICEF (World Health Organization and United Nations Children’s Fund Joint
Monitoring Programme for Water Supply and Sanitation- JMP). (2008). Progress on Drinking Water and Sanitation: Special Focus on Sanitation. UNICEF, New York and WHO, Geneva
WHO and UNICEF (World Health Organization and United Nations Children’s Fund Joint
Monitoring Programme for Water Supply and Sanitation -JMP). (2010). Progress on Drinking Water and Sanitation: 2010 Update. UNICEF, New York and WHO, Geneva. ISBN 978 924 1563956
WHO and UNICEF (World Health Organization and United Nations Children’s Fund Joint
Monitoring Programme for Water Supply and Sanitation -JMP). (2012). Progress on Drinking Water and Sanitation: 2012 Update. UNICEF, New York and WHO, Geneva. ISBN: 978 9241503297
Wibowo, J.S. and Legowo, H.B. (2010). SANIMAS Approach and ISSDP’s City-wide Sanitation Strategy (CSS). PT. MLD Indonesia and Ministry of Public Works, Indonesia. Presentation at IWA Conference, March 23-26, 2010. Surabaya, Indonesia
Williams P.W. (2008). The Role of the Epikarst in Karst and Cave Hydrogeology: A Review. International Journal of Speleology, 37 (1), 1-10. Bologna, Italy. ISSN 0392-6672
World Bank. (1998). Participation and Social Assessment: Tools and Techniques. Washington: World Bank. Also available at: http://www.rmportal.net/library/content/tools/biodiversity-conservation-tools/putting-conservation-in-context-cd/participatory-approaches-resources/1-c.pdf/at_download/file. Last access: May 10, 2010
Wrisberg N., Udo de Haes HA., Triebswetter U, Eder P. and Clift R. (2002). Analytical Tools for Environmental Design and Management in a Systems Perspective. Kluwer Academic Publisher, Dordrecht

List of Interviews
163
List of Interviews Institutional Interviews
Nr. Name Position/role Date of interview 1 Mr. Pratomo Director of Technical Dept., Local
Water Enterprise (PDAM), Gunung Kidul
08.04.2010 22.04.2010
2 Mr. Sugito Office of Environmental Impact Control (Kapedal), Province of Yogyakarta
29.04.2010
3 Ir. Purnama Jaya Head of Dept.of Public Works (DPU), Gunung Kidul
30.03.2011
4 Mr. Jatmiko Director of Infrastructure Development, Local Planning Agency (BAPPEDA), Gunung Kidul
09.08.2011
5 Ir. Slamet Supriyadi Head of Cipta Karya Division, Dept. of Public Works (DPU), Gunung Kidul
09.08.2011
6 Ms. Noor Faizah and Ms.Indiyah
Database personal and Head of Public Health Section, Dept. of Health (DEPKES), Gunung Kidul
09.08.2011
7 Ms. Siwi Head of Fertilizer Distribution, Department of Industry and Commerce (DEPERINDAGKOP)- Gunung Kidul
09.08.2011
8 Ms. Dwi Wiyani, M.Eng Head of Prevention Program, Office of Environmental Impact Control (KAPEDAL) - Gunung Kidul
09.08.2011
9 Mr. Handoko Dept.of Public Works (DPU), Gunung Kidul
03.04.2012
Personal Interviews with Practitioners Nr. Name Position/role Date of interview
1 Ms. Yuyun Ismawati Head of Bali Focus (NGO) 24.03.2010 2 Mr. Hermanto Soedjarwo Head of Yayasan Dian Desa (NGO) 09.04.2010
24.04.2012 3 Mr. Ibnu Head of LPTP BORDA (NGO) 19.10.2010 4 Ms. Prawisti, Mr. Didin
Djamaludin Engineer and Staff of BORDA SEA (NGO)
08.02.2011
5 Mr. Frank Fladerer Head of BORDA SEA (NGO) 04.03.2011 6 Mr. Edo Soedjarwo Engineer of Yayasan Dian Desa
(NGO) 18.01.2012
Personal Interviews with Village Administrators, Common Users and Operators Nr. Name Position/role Date of interview
1 Mr. Harjono Head of Gombang Village, Gunung Kidul
08.04.2010
2 Mr. Bambang Operator in Seropan Pump, Gunung Kidul
08.04.2010
3 Mr. Supomo Operator in Wastewater Treatment Plant, Jeruk, Wonosari, Gunung
22.04.2010

List of Interviews ____________________________________________________________________________
164
Personal Interviews with Village Administrators, Common Users and Operators Nr. Name Position/role Date of interview
Kidul 4 Mr. Yono Operator of Tofu Digester in
Wonosari, Gunung Kidul 22.04.2010
5 Mr. Bandiyo Operator in Wastewater Treatment Plant, Sukunan, Yogyakarta
03.06.2010
6 Mr. Saryanto Biogas owner 16.08.2011 7 Mr. Surawan Biogas owner, Head of
Pucanganom Village 16.08.2011 06.03.2012
8 Mr. Suprapto Secretary of Pucanganom Village 03.11.2011 03.04.2012
9 Mr. Tuyana Head of Development Dept., Pucanganom Village
03.11.2011 06.03.2012 03.04.2012
10 Mr. Hanum Operator of Wastewater Treatment Plant, Wonosari Hospital, Gunung Kidul
24.01.2012

_____________________________________________________________________________Appendix 1
165
Appendix 1
Institute for Technology Assessment and Systems Analysis (ITAS) (bekerja sama dengan Fakultas Geografi, Universitas Gadjah Mada ) Questionnaire design and copyright by ITAS, KIT
I.A PENGENALAN TEMPAT (Cukup ditanyakan 1 kali, ke kepala dusun atau ketua RT/RW) Location introductory (only for chief of village)
101 Nama Dusun Name of village
102 Luas Area Area
Km2
103 Jumlah Penduduk Number of inhabitants
Orang People
104 Jumlah KK Number of households
KK households
Deskripsi Geografis Secara Umum Geographical description
105 Topografi Topography 1. Datar flat 2. Berbukit hilly
106 Struktur Perumahan Housing structure 1 Terkonsentrasi concentrated 2 Tersebar scattered
107 Persediaan Air Utama di musim kemarau Main water supply in dry season
(1) (2) 1.Ya yes 2.Tidak
no
1. Jaringan Pipa PDAM pipeline connection
2. Penampungan Air Hujan cistern
3. Truk Tanki water vendor
4. Mata Air spring
5. Sumur gali/ bor pribadi private dug well/bored well
6. Sumur gali/ bor umum public dug well/bored well
7. Telaga/ Sungai „lake/river
8. Gua/ Luweng cave/“luweng/sinkhole“
108 Bagaimana kondisi air pada musim kemarau? How is the condition of the water in dry season?
1. Air bagus, tidak masalah No problem with water
2. Air kurang Water scarcity
3. Air ketersediannya tidak menentu Uncertain water
availability
4. Air keruh Water is turbid
5. Lainnya, sebutkan….Other, mention…
109 Persediaan Air Utama di musim hujan Main water supply in rainy season
(1) (2) 1.Ya yes 2.Tidak
no
1. Jaringan Pipa PDAM pipeline connection
2. Penampungan Air Hujan cistern
3. Truk Tanki water vendor
4. Mata Air spring

Appendix 1____________________________________________________________________________
166
5. Sumur gali/ bor pribadi private dug well/bored well
6. Sumur gali/ bor umum public dug well/bored well
7. Telaga/ Sungai „telaga“/river
8. Gua/ Luweng cave/“luweng“
110 Bagaimana kondisi air pada musim hujan? How is the condition of the water in dry season?
1. Air bagus, tidak masalah No problem with water
2. Air kurang Water scarcity
3. Air ketersediannya tidak menentu Uncertain water availability
4. Air keruh Water is turbid
5. Lainnya, sebutkan….Other, mention…
111 Jika ada jaringan pipa di Dusun, dari mana asalnya if there is pipeline connection, the source is from…
1. Seropan
2. Bribin
3. Sumber Air Lainnya (Sebutkan) Other source
(mention)............................
112 Jika ada sumber air alam, siapa yang mengelolanya If there is a natural water source, who manage it
1. PDAM local water enterprise
2. Masyarakat Sendiri self management by the community
3. Belum dikelola not yet managed
113 Infrastruktur mengenai Air
Water infrastructure
Jumlah total number
Jumlah yang berfungsi usable
number
(1) (2) (3)
a) Hidran Umum public stand post
b) Sambungan Rumah (Kran) house connection
c) Fasilitas Cuci Umum public washing facility
d) Fasilitas Mandi Cuci Umum public bathing
and washing facility
e) Fasilitas Mandi Cuci Kakus Umum public
toilette, bathing and washing facility
f) Penampungan Air Hujan (PAH) cistern
g) Sumur gali/ bor dug/bored well
h) Telaga telaga
i) Mata Air spring
114 Fasilitas lain other facility 1.Ya yes 2.Tidak no
1) Jalan Aspal paved road 2) Puskesmas/Pustu community health center
INFORMASI TAMBAHAN Additional information

_____________________________________________________________________________Appendix 1
167
INFORMASI WAWANCARA (ditanyakan ke semua responden) Interview information
Data Kunjungan Visit detail
Tanggal date: Hari (day) Bulan (month) Tahun (year)
Kode kuisioner quisioner code:
Pewawancara interviewer: Alamat KK
Address Nama responden:
RT/ RW: Dusun: Desa: Kecamatan:
Koordinat GPS GPS coordinate:
II. A DATA RESPONDEN Respondent’s data
201 Nama Responden Name Jenis Kelamin Sex
Umur Age
Pendidikan Education
Status Kawin Marital status
Kegiatan Occupation
Utama Main
Sampingan Side
(1) (2) (3) (4) (5) (6) (7)
202 Jumlah anggota keluarga total yang menetap (dalam satu rumah) Household member(s)
Orang people
Keterangan pertanyaan 201 Kolom 2 1. Laki-laki 2. Perempuan
Kolom 4 1. tidak/ belum bersekolah 2. SD/ SR 3. SMP/ SLTP 4. SMA/ SMU/ SMK
5. Diploma [D1/D2/D3/D4] 6. Universitas [S1] 7. Universitas [S2]
Kolom 5 1. Kawin 2. Belum Kawin 3. Cerai Hidup 4. Cerai Mati
Kolom 6 & 7
1. PNS/TNI/POLRI 2. Pensiunan 3. Pedagang 4. Wiraswata/Pengusaha
5. Karyawan/Pegawai Swasta 6. Buruh Bangunan 7. Buruh Serabutan 8. Buruh Pabrik
9. Buruh Tambang 10. Petani/ Peternak 11. Ibu Rumah Tangga 12. Lainnya:
Foto responden dan keluarga

Appendix 1____________________________________________________________________________
168
II.B KONDISI SOSIAL EKONOMI Social economic condition
Berilah tanda silang/ lingkar pada jawaban yang sesuai dan isilah kotak masing-masing Cross the answer or fill the boxes
203 Berapa pengeluaran rata-rata per bulan rumah tangga Anda Monthly expenditure (makan/ minum, listrik/ bahan bakar, sekolah, biaya sosial, angsuran)
Rp ,-
204 Berapa pengeluaran rata-rata per bulan hanya untuk air (membayar PDAM, membeli air, mengambil air) Monthly expenditure for water only
Rp ,-
III. PENYEDIAAN DAN POLA PEMAKAIAN AIR
PAH Cistern
301 Apakah Anda memakai Penampungan Air Hujan (PAH)? Do you use cistern
1.Ya (ke no 302) yes( to 302) 2. Tidak (ke no 303) no (to 303)?
302 Dari mana saja sumber air yang mengisi PAH Anda? From which source of water is your cistern filled?
(1) (2) 1.Ya yes 2. Tidak no
1. Air hujan rain water
2. Air dari pipa /PDAM pipeline water from PDAM
3. Air dari kran (sumber bukan PDAM) pipeline water
not from PDAM
4. Truck tanki water vendor
303 Mengapa tidak memakai PAH? Why don’t you use cistern? 1. Tidak suka air hujan Don’t like the taste of
rainwater
2. Lebih suka air PDAM Prefer pipiline water
3. Sudah terlanjur bayar 10m3 I have paid pipeline
water
4. Lainnya,…sebutkan,….Others
304 Jika Anda memakai PAH, if you use cistern
1) berapa volumenya/ atau berapa
ukurannya what is size and
volume
Volume volume:
m³
Ukuran size:
2) berapa KK berbagi PAH dengan
Anda how many
households share the cistern
KK
3) siapa yang membangunnya
how was the cistern constructed
1.Swadaya self financed 2. Bantuan aid
305 Bagaimana kondisi PAH Anda? 1. Bagus, tidak ada masalah Excellent 2. Retak/bocor Cracking/leaking 3. Ada bagian yang sudah rusak (pipa, saringan, tutup) Some parts are broken (pipe, filter, closing)
306 Seberapa penuh PAH Anda di akhir musim hujan? how full is the cistern in the end of rainy season
1. Sepertiga one third

_____________________________________________________________________________Appendix 1
169
2. Setengah half
3. Penuh full
4. Luber not enough to collect all rain water
307 Apakah Anda menginginkan volume PAH Anda lebih besar do you want to have bigger cistern
1.Ya yes 2. Tidak no
308
Setelah hujan ke berapa, Anda mulai menyimpan air ke PAH? after which rain you collect the water in to the cistern
1. Langsung, saat hujan pertama air disimpan
from the first rain
2. Setelah hujan 2-3 kali dan air langsung disimpan
after 2nd
-3rd
rain
3. Setelah hujan 2-3 kali, tapi ditunggu 10 menit dulu
sebelum air disimpan after 2nd
-3rd
rain with 10
minute waiting time
309 Berapa lama air dari PAH bisa digunakan untuk kebutuhan hidup, terhitung dari awal musim kemarau (air yang hanya berasal dari air hujan) how long is the water from cistern can be used for daily need (from the beginning of dry season, water only from rain)
Bulan month
310 Berapa lama air disimpan di PAH, sebelum Anda menggunakannya? how long do you store the water before you use it
Hari day
311 Apakah ada masalah dengan air dari PAH is there any problem with the water from cistern
1.Ya yes (ke pertanyaan 311 dst to question 311 usw) 2. Tidak (ke pertanyaan 312 dst to question 312 usw)
312 Jika ada masalah dengan airnya, sebutkan problem with cistern water:
(1) (2) 1.Ya yes 2. Tidak no
1. Air kotor/keruh/berlumut turbid water 2. Air rasanya tidak enak/asam no good taste 3. Air licin, tidak nyaman untuk mandi not comfortable for bathing 4. Lainnya, sebutkan… others…..
313 Anda gunakan untuk keperluan apa air dari PAH? (Bisa lebih dari satu jawaban) for what kind of purposes you use the cistern water
(1) (2) 1.Ya yes 2. Tidak no
1. Minum/masak drinking/cooking 2. Mandi bathing 3. Cuci washing 4. Minum ternak cattle consumption 5. Menyiram tanaman watering the plants
314 Setiap berapa lama Anda membersihkan PAH Anda how often do you clean the cistern
1) Tanki tank bulan month
2) Salurannya
pipes
bulan month
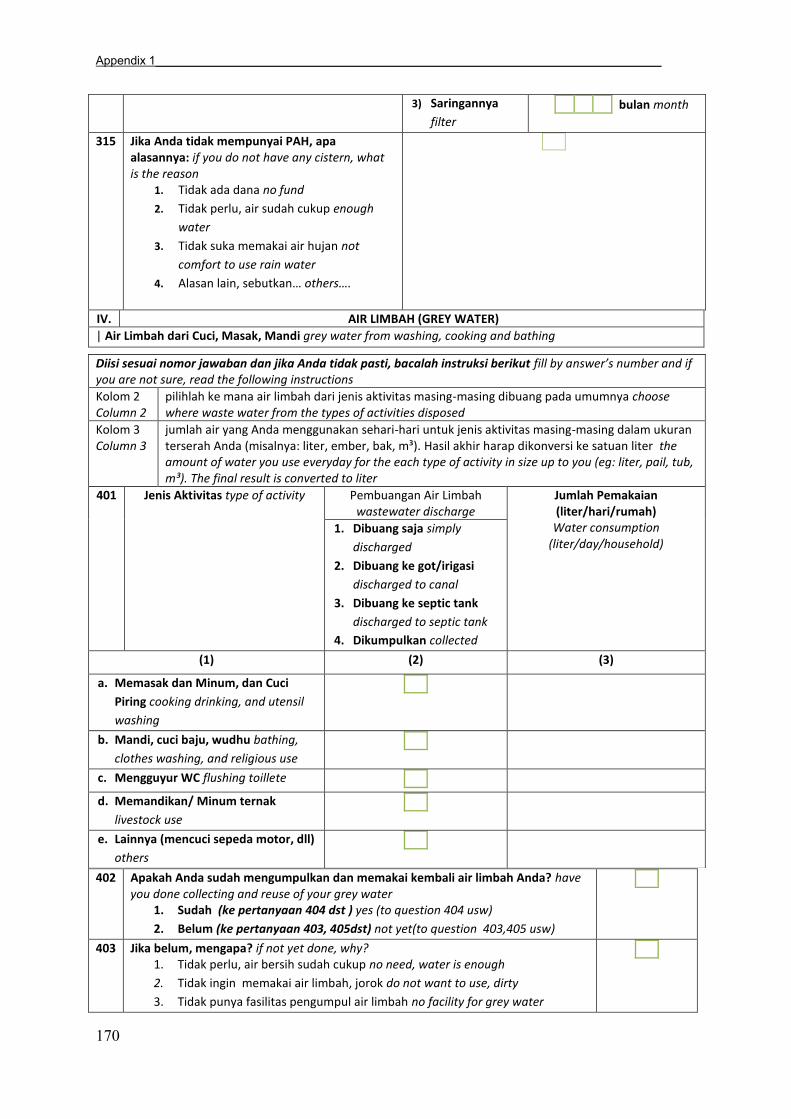
Appendix 1____________________________________________________________________________
170
3) Saringannya
filter
bulan month
315 Jika Anda tidak mempunyai PAH, apa alasannya: if you do not have any cistern, what is the reason
1. Tidak ada dana no fund
2. Tidak perlu, air sudah cukup enough
water
3. Tidak suka memakai air hujan not
comfort to use rain water
4. Alasan lain, sebutkan… others….
IV. AIR LIMBAH (GREY WATER)
| Air Limbah dari Cuci, Masak, Mandi grey water from washing, cooking and bathing
402 Apakah Anda sudah mengumpulkan dan memakai kembali air limbah Anda? have you done collecting and reuse of your grey water
1. Sudah (ke pertanyaan 404 dst ) yes (to question 404 usw)
2. Belum (ke pertanyaan 403, 405dst) not yet(to question 403,405 usw)
403 Jika belum, mengapa? if not yet done, why? 1. Tidak perlu, air bersih sudah cukup no need, water is enough
2. Tidak ingin memakai air limbah, jorok do not want to use, dirty
3. Tidak punya fasilitas pengumpul air limbah no facility for grey water
Diisi sesuai nomor jawaban dan jika Anda tidak pasti, bacalah instruksi berikut fill by answer’s number and if you are not sure, read the following instructions
Kolom 2 Column 2
pilihlah ke mana air limbah dari jenis aktivitas masing-masing dibuang pada umumnya choose where waste water from the types of activities disposed
Kolom 3 Column 3
jumlah air yang Anda menggunakan sehari-hari untuk jenis aktivitas masing-masing dalam ukuran terserah Anda (misalnya: liter, ember, bak, m³). Hasil akhir harap dikonversi ke satuan liter the amount of water you use everyday for the each type of activity in size up to you (eg: liter, pail, tub, m³). The final result is converted to liter
401 Jenis Aktivitas type of activity Pembuangan Air Limbah wastewater discharge
Jumlah Pemakaian (liter/hari/rumah)
Water consumption (liter/day/household)
1. Dibuang saja simply
discharged
2. Dibuang ke got/irigasi
discharged to canal
3. Dibuang ke septic tank
discharged to septic tank
4. Dikumpulkan collected
(1) (2) (3)
a. Memasak dan Minum, dan Cuci
Piring cooking drinking, and utensil
washing
b. Mandi, cuci baju, wudhu bathing,
clothes washing, and religious use
c. Mengguyur WC flushing toillete
d. Memandikan/ Minum ternak
livestock use
e. Lainnya (mencuci sepeda motor, dll)
others
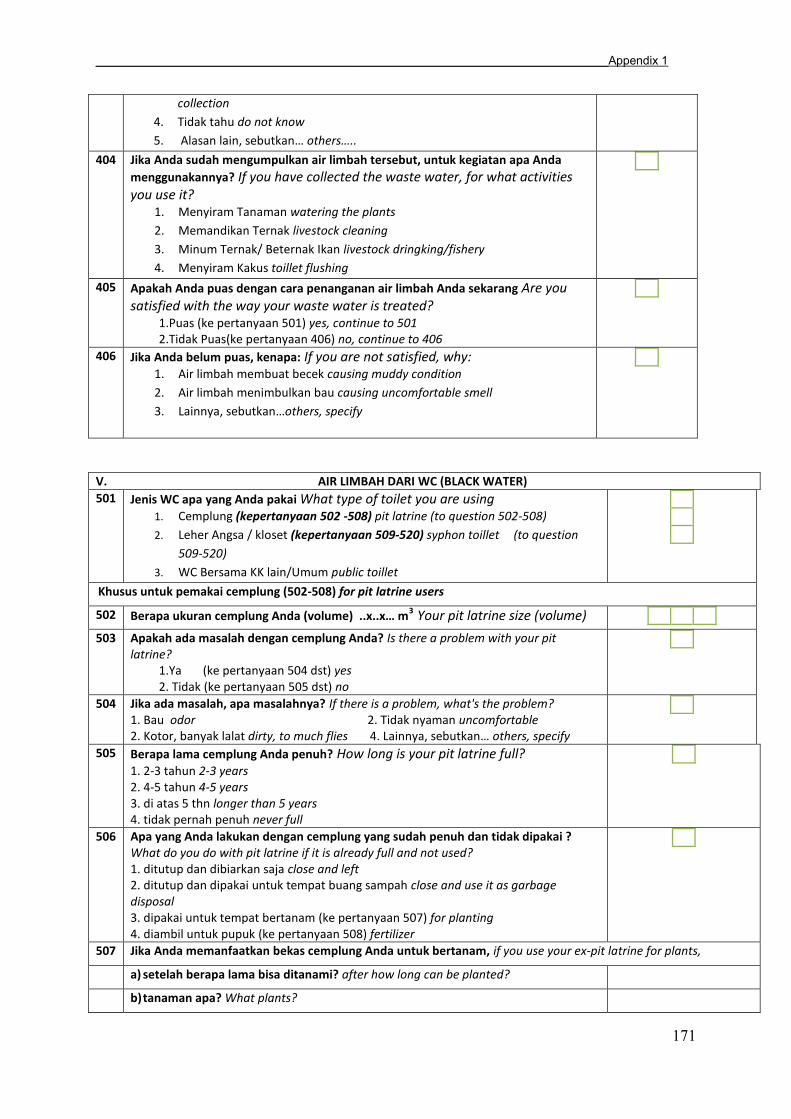
_____________________________________________________________________________Appendix 1
171
collection
4. Tidak tahu do not know
5. Alasan lain, sebutkan… others…..
404 Jika Anda sudah mengumpulkan air limbah tersebut, untuk kegiatan apa Anda
menggunakannya? If you have collected the waste water, for what activities you use it?
1. Menyiram Tanaman watering the plants
2. Memandikan Ternak livestock cleaning
3. Minum Ternak/ Beternak Ikan livestock dringking/fishery
4. Menyiram Kakus toillet flushing
405 Apakah Anda puas dengan cara penanganan air limbah Anda sekarang Are you satisfied with the way your waste water is treated?
1.Puas (ke pertanyaan 501) yes, continue to 501 2.Tidak Puas(ke pertanyaan 406) no, continue to 406
406 Jika Anda belum puas, kenapa: If you are not satisfied, why: 1. Air limbah membuat becek causing muddy condition
2. Air limbah menimbulkan bau causing uncomfortable smell
3. Lainnya, sebutkan…others, specify
V. AIR LIMBAH DARI WC (BLACK WATER)
501 Jenis WC apa yang Anda pakai What type of toilet you are using
1. Cemplung (kepertanyaan 502 -508) pit latrine (to question 502-508)
2. Leher Angsa / kloset (kepertanyaan 509-520) syphon toillet (to question
509-520)
3. WC Bersama KK lain/Umum public toillet
Khusus untuk pemakai cemplung (502-508) for pit latrine users
502 Berapa ukuran cemplung Anda (volume) ..x..x… m3 Your pit latrine size (volume)
503 Apakah ada masalah dengan cemplung Anda? Is there a problem with your pit latrine?
1.Ya (ke pertanyaan 504 dst) yes 2. Tidak (ke pertanyaan 505 dst) no
504 Jika ada masalah, apa masalahnya? If there is a problem, what's the problem? 1. Bau odor 2. Tidak nyaman uncomfortable 2. Kotor, banyak lalat dirty, to much flies 4. Lainnya, sebutkan… others, specify
505 Berapa lama cemplung Anda penuh? How long is your pit latrine full?
1. 2-3 tahun 2-3 years 2. 4-5 tahun 4-5 years 3. di atas 5 thn longer than 5 years 4. tidak pernah penuh never full
506 Apa yang Anda lakukan dengan cemplung yang sudah penuh dan tidak dipakai ? What do you do with pit latrine if it is already full and not used? 1. ditutup dan dibiarkan saja close and left 2. ditutup dan dipakai untuk tempat buang sampah close and use it as garbage disposal 3. dipakai untuk tempat bertanam (ke pertanyaan 507) for planting 4. diambil untuk pupuk (ke pertanyaan 508) fertilizer
507 Jika Anda memanfaatkan bekas cemplung Anda untuk bertanam, if you use your ex-pit latrine for plants,
a) setelah berapa lama bisa ditanami? after how long can be planted?
b) tanaman apa? What plants?
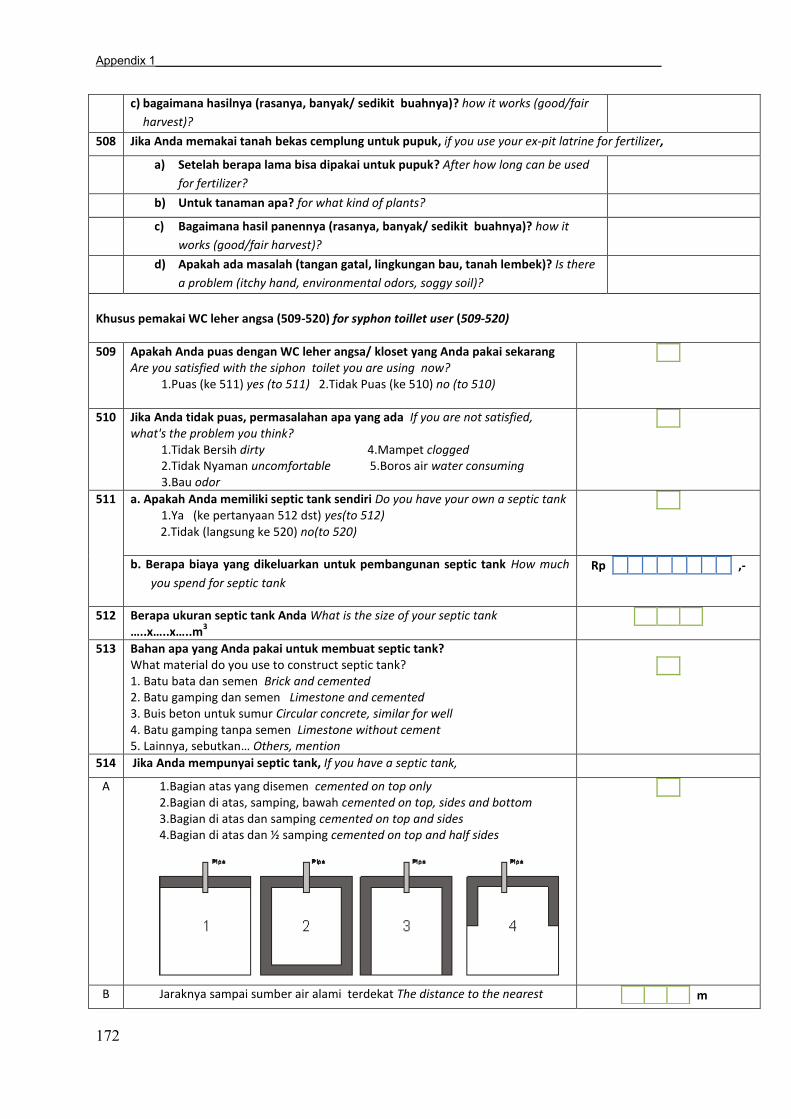
Appendix 1____________________________________________________________________________
172
c) bagaimana hasilnya (rasanya, banyak/ sedikit buahnya)? how it works (good/fair
harvest)?
508 Jika Anda memakai tanah bekas cemplung untuk pupuk, if you use your ex-pit latrine for fertilizer,
a) Setelah berapa lama bisa dipakai untuk pupuk? After how long can be used
for fertilizer?
b) Untuk tanaman apa? for what kind of plants?
c) Bagaimana hasil panennya (rasanya, banyak/ sedikit buahnya)? how it
works (good/fair harvest)?
d) Apakah ada masalah (tangan gatal, lingkungan bau, tanah lembek)? Is there
a problem (itchy hand, environmental odors, soggy soil)?
Khusus pemakai WC leher angsa (509-520) for syphon toillet user (509-520)
509 Apakah Anda puas dengan WC leher angsa/ kloset yang Anda pakai sekarang Are you satisfied with the siphon toilet you are using now?
1.Puas (ke 511) yes (to 511) 2.Tidak Puas (ke 510) no (to 510)
510 Jika Anda tidak puas, permasalahan apa yang ada If you are not satisfied, what's the problem you think?
1.Tidak Bersih dirty 4.Mampet clogged 2.Tidak Nyaman uncomfortable 5.Boros air water consuming 3.Bau odor
511 a. Apakah Anda memiliki septic tank sendiri Do you have your own a septic tank 1.Ya (ke pertanyaan 512 dst) yes(to 512)
2.Tidak (langsung ke 520) no(to 520)
b. Berapa biaya yang dikeluarkan untuk pembangunan septic tank How much
you spend for septic tank
Rp ,-
512 Berapa ukuran septic tank Anda What is the size of your septic tank …..x…..x…..m
3
513 Bahan apa yang Anda pakai untuk membuat septic tank? What material do you use to construct septic tank? 1. Batu bata dan semen Brick and cemented 2. Batu gamping dan semen Limestone and cemented 3. Buis beton untuk sumur Circular concrete, similar for well 4. Batu gamping tanpa semen Limestone without cement 5. Lainnya, sebutkan… Others, mention
514 Jika Anda mempunyai septic tank, If you have a septic tank,
A 1.Bagian atas yang disemen cemented on top only 2.Bagian di atas, samping, bawah cemented on top, sides and bottom 3.Bagian di atas dan samping cemented on top and sides 4.Bagian di atas dan ½ samping cemented on top and half sides
B Jaraknya sampai sumber air alami terdekat The distance to the nearest
m

_____________________________________________________________________________Appendix 1
173
water resources
515 Apakah ada masalah dengan septic tank Anda Is there a problem with your septic tank
1.Ya (ke pertanyaan 516 dst) yes, continue to 516 usw 2.Tidak (ke pertanyaan 517 dst) no, continue to 517 usw
516 Jika ada, apa masalahnya? If there is, what's the problem? 1.Septic tank cepat penuh easily full 3.Septic tank ambles/runtuh/retak collaps 2.Septic tank mampet/ luber clogging 4.Septic tank bau odorous
517 Apa pendapat Anda tentang septic tank yang dasarnya tidak disemen What do you think of a septic tank that is not cemented on its base
1. Bagus, karena tidak akan penuh Good, because it will not full
2. Bagus, karena kotoran cepat meresap ke tanah Good, because the dirt
quickly infiltrate into the ground
3. Tidak bagus, karena mencemari tanah dan air tanah Not good, because
it contaminate soil and groundwater
4. Tidak tahu do not know
518 Apakah septic tank Anda pernah penuh? Do you have experience of a full septic tank?
1. Tidak pernah (ke pertanyaan 519 dst) no 2. Pernah, setelah……tahun (ke pertanyaan 519, 521 dst) yes, after….years
519 Jika septic tank Anda pernah penuh, apa yang anda lakukan? If you have a full septic tank, what are you doing?
1. Dikuras/disedot Drained / aspirated 2. Dibiarkan saja, buat septic tank baru Left alone, build a new septic tank 3. Lainnya, sebutkan…others, specify
520 Jika Anda tidak mempunyai septic tank, apa alasannya If you do not have a septic tank, why
1.Tidak ada dana no funds 2.Tidak perlu no need 3.Tidak tahu do not know 4.Alasan lain,sebutkan… others, specify
Fasilitas Umum MCK/public facilities (ditanyakan kepada semua pemakai baik cemplung, syphon toilette atau MCK)
521 Apakah Anda suka jika menggunakan fasilitas Mandi Cuci Kakus umum? Do you like to use the public facilities for bathing, washing and defecating? 1. Suka (ke no 523) like (to 523) 2. Tidak Suka (ke no 522) do not like(to 522)
522 Jika Anda tidak suka, mengapa? If you do not like, why? 1. Lebih nyaman di rumah sendiri More comfortable in our own home 2. Malas, karena harus berjalan Lazy, because they have to walk 3. Malas, karena harus antre Lazy, having to queue 4. Lainnya, sebutkan…. Others, specify ....
523 Jika Anda suka, mengapa? If you like, why? 1. Bisa bertemu tetangga Meet neighbors 2. Bisa menghemat air di rumah Can save water at home 3. Praktis, tidak perlu membawa air ke rumah Praktis, tidak perlu membawa
air ke rumah Practical, no need to carry water to the house 4. Irit, tidak perlu membangun fasilitas dengan biaya sendiri Cheaper, do not
need to build a facility at their own expense 5. Lainnya, sebutkan…. Others, specify ....
524 Jika suatu saat ada fasilitas umum baru bersediakah Anda menggunakannya untuk kegiatan berikut If ever there was a new public facility will you use it for the following activities

Appendix 1____________________________________________________________________________
174
(1) (2) 1.Ya 2.Tidak
a) Cuci saja washing only
b) Mandi, Cuci bathing and washing
c) Mandi, Cuci, WC bathing, washing and defecating
525 Jika ada pembangunan fasilitas umum tersebut dalam bentuk apakah Anda ingin berpartisipasi If there is development of public facilities, in which form of contribution do you want to participate 1.Kerja Gotong Royong mutual cooperation 3.Bantuan Bahan Bangunan material contribution 2.Uang Sumbangan money contribution 4.Bantuan lainnya others
526 Jika fasilitas umum tersebut sudah dibangun, bagaimana cara merawatnya If public facilities are already built, how to take care of it? 1.Membayar Seseorang pay someone 2.Bergilir rotating work 3.Lainnya, sebutkan: others, specify
WC kompos dan pemisah air seni: Pada WC ini terdapat tiga lubang: satu untuk buang air kecil, satu untuk buang air besar (dengan tutup) dan satu untuk membersihkan diri. Prinsipnya: memisahkan tinja dengan air seni, supaya mudah diolah. Tinja dibuat pupuk kompos dengan mendiamkannya di bak seperti septic tank selama 2-6 bulan dan urine disimpan dalam jerigen selama 2 sebelum akhirnya dipakai sebagai pupuk cair. Composting toilets and urine separation: In this closet there are three holes: one for pee, one for defecating (with lid) and one to clean up. Principle: separating the feces with urine to make it easier to be processed. Feces is made as compost made by left it in the tub like a septic tank for 2-6 (months) and urine is stored in cans for 2 (months) before it is used as liquid fertilizer.

_____________________________________________________________________________Appendix 1
175
527
Apakah Anda bersedia untuk menggunakan WC yang memisahkan tinja, air seni dan air untuk membersihkan diri (WC kompos) Lihat gambar diatas Are you willing to use a separate toilet stool, urine and water to clean themselves (composting toilets) See picture above
1.Ya (ke pertanyaan 529 dst) yes 2.Tidak (ke pertanyaan 528 dst) no
528 Jika Anda tidak bersedia memakai WC kompos-pemisah air seni, mengapa? If you are not willing to use composting toilets, why?
1.Tidak nyaman uncomfortable 2.Repot, harus geser posisi not practical, should shift positions 3.Lebih suka WC sekarang prefer present toilet 4.Lainnya, sebutkan…. others, specify
(Lanjutkan ke no 531 dst) Continue to 531 usw
529 Jika Anda bersedia memakai WC kompos/UD, apakah Anda bersedia mengolah sendiri tinja sebagai pupuk kompos? If you are willing to use composting/UD toilets, are you willing to treat your feces as compost?
1.Ya yes 2.Tidak no
530 Jika Anda bersedia memakai WC kompos/UD, apakah Anda bersedia mengolah sendiri air seni menjadi pupuk cair? If you are willing to use composting/UD toilets, are you willing to treat your urine into a liquid fertilizer?
1.Ya yes 2.Tidak no
531 Apakah Anda bersedia memakai pupuk kompos dari tinja, yang fungsinya sama seperti pupuk kandang? Are you willing to use compost from the feces, which functions as manure?
1.Ya yes 2.Tidak no
532 Apakah Anda bersedia memakai pupuk air seni, yang fungsinya sama dengan pupuk NPK? Are you willing to use urine fertilizer, which functions as a fertilizer NPK?
1.Ya yes 2.Tidak no
533 Jika Anda tidak bersedia mengolah tinja/urin atau memakai pupuknya, mengapa? If you are not willing to treat feces/urine or use it as fertilizer, why?
(1) (2) 1.Ya 2.Tidak
a) Jijik disgusting
b) Najis religiously unclean
c) Takut kena penyakit waktu mengolah / menebar pupuk afraid of illness
d) Takut buahnya berbahaya afraid if it produce unhealthy fruits
e) Takut lingkungan jadi bau afraid if it gives smelly environment

Appendix 1____________________________________________________________________________
176
f) Lainnya, sebutkan…others, mention
534 Apakah ada pengalaman memakai pupuk dari tinja atau air seni? Sebutkan! Is there any experience of using manure from the feces or urine? Explain!
1.Ya , Sebutkan……yes, mention 2.Tidak no
Biogas
535 Bahan bakar apa yang Anda gunakan untuk memasak? Which energy source do you use for cooking?
1. Kayu bakar Wood
2. Minyak tanah kerosene
3. Gas gas
536 Apakah Anda kesulitan mendapatkan bahan bakar tersebut atau harganya terlalu mahal? Do you have problem to get this source, or do you think it is too expensive?
1. Ya yes
2. Tidak no
537 Pernahkah Anda mendengar tentang biogas (gas yang berasal dari pengolahan kotoran manusia, kotoran ternak atau limbah tahu. Gas dari hasil pengolahan limbah dapat dimanfaatkan seperti gas LPG utk memasak )? Have you ever heard about biogas (from feces, cow dung or tofu waste )?
1. Ya yes
2. Tidak no
538 Apakah Anda tertarik memakai biogas dari: Are you interested to use biogas from 1. Kotoran manusia feces
2. Kotoran ternak cow dung
3. Tidak tertarik sama sekali not at all
1.Ya 2.Tidak
539 Jika Anda tidak tertarik sama sekali, mengapa? If you are not interested at all, why? 1. Jijik Disgusting
2. Haram Haram (forbidden in religion)
3. Tidak tahu No idea
4. Lainnya, sebutkan… Others, mention….
VI. SAMPAH / SOLID WASTE
Sampah organik/ basah organic waste sisa makanan, daun-daun, buah-buahan food scraps, leaves, fruits
Sampah anorganik / kering anorganic waste
plastik, kertas, karet, kaca plastic, paper, rubber, glass
601 Bagaimana cara Anda menangani sampah organik ? How do you deal with organic waste?
a)Membakarnya burning b)Membuatnya kompos composting c)Menguburkannya burrying d)Memilahnya/ Menggunakannya kembali sorting/recycling e)Membuang ke luweng/gua dispose it to the cave/“luweng“ f)Membuang ke sungai dispose it to the river
602 Bagaimana cara Anda menangani sampah anorganik ? How do you deal with inorganic garbage?
a)Membakarnya burning b)Membuatnya kompos composting c)Menguburkannya burrying d)Memilahnya/ Menggunakannya kembali sorting/recycling

_____________________________________________________________________________Appendix 1
177
e)Membuang ke luweng/gua dispose it to the cave/“luweng“ f)Membuang ke sungai dispose it to the river
603 Andaikan Anda mau membuang kantong plastik berisi sisa es teh dan harus memilih antara tong sampah basah dan kering/ Ke mana Anda akan membuangnya? Suppose you want to throw away a plastic bag containing the rest of iced tea and had to choose between wet garbage and dry / Where are you going to throw it away?
1.Sampah Basah wet waste 2.Sampah Kering dry waste
604 Apakah Anda berpendapat memilah sampah kemudian mendaur ulang/memakainya kembali (recycle) berguna? Do you think that sorting and recycling waste is useful?
1.Ya yes 2.Tidak no
605 Jika tidak berguna, mengapa? If it is useless, why? 1. Memilah sampah menghabiskan waktu Sorting will waste the time 2. memilah sampah tidak nyaman/membingungkan Sorting is uncomfortable and confusing 3. Tidak ingin pakai produk hasil daur ulang Not interested to use the recycle product
VII. KESADARAN KESEHATAN DAN LINGKUNGAN
701 Menurut Anda apakah ada jenis penyakit yang diakibatkan oleh kualitas air yang buruk Do you think that there are types of diseases caused by poor water quality
1.Ya yes 2.Tidak no 3.Tidak Tahu do not know
702 Apakah Anda pernah berpikir bahwa air limbah dan sampah yang dibuang langsung ke tanah dapat Did you ever think that the waste water and garbage can be dumped directly into the soil
(1) (2) 1.Ya 2. Tidak
3. Tidak tahu
a) mencemari kualitas air sumur dan sungai contaminate the quality of water
from wells and river
b) mencemari kualitas sungai bawah tanah contaminate underground river
c) berpengaruh pada kesehatan affecting health
703 Apakah Anda atau anggota keluarga Anda berhubungan dengan petugas puskesmas setahun terakhir (pergi ke puskesmas atau didatangi petugas) Are you or your family members associated with health officials last year (go to the clinic or visited by officers)
1.Ya yes 2.Tidak no
Jika Ya, berapa kali dalam satu tahun If Yes, how many times in one year
704 Jika ya, apa alasannya If yes, why
(1) (2) 1. Ya 2.
Tidak
a) Berobat treatment
b) Konsultasi consultation
c) Penyuluhan guidance
705 Apakah dalam setahun terakhir anda dan anggota keluarga menderita penyakit seperti di bawah ini What illness is you and your family members suffered last year
(1) (2) 1. Ya 2. Tidak
a) Diare/Muntaber Diarrhea / vomiting

Appendix 1____________________________________________________________________________
178
b) Tifus typhus
c) Hepatitis A, B
d) Infeksi Saluran Napas Atas upperway infection
e) Malaria/malaria
f) Sakit Lambung (Gastritis) stomach pain
g) Penyakit Kulit skin irritation
h) Demam Berdarah dengue fever
VIII PERTANIAN/KERAJINAN/INDUSTRI
Pertanian
801 Berapa luas tanah yang Anda tanami How much land do you cultivate
Ha
802 Apakah tanah tersebut teririgasi Is the land irrigated 1.Ya (ke pertanyaan 803 dst) yes (to question 803) 2.Tidak (ke pertanyaan 804 dst ) no
803 Jika ya, dari mana sumbernya If yes, from where is the source of water 1.Jaringan Pipa pipeline 3.Sumur gali/ bor wells 2.Embung (Air Hujan) rain water 4.Sumber Air Alam natural resources
804 Apakah Anda punya hewan ternak Do you have livestock
(1) (2) 1. Ya yes 2. Tidak no
(3) Jika Ya, if yes
a) Sapi cow
b) Kambing goat
c) Ayam/Bebek chicken/goat
d) Kolam Ikan fishery
Ekor
Ekor
ekor
m2
/ Ekor
805 Jika Anda mempunyai kolam ikan, If you have a fish pond,
1) Ya 2) Tidak
1.Saluran Irigasi
2.Air Hujan 3.PDAM
Jika ya, jenis apakah yg ditanam:
(1) (2) (3) (4)
a) dari mana airnya source of water?
b) apakah pendapatan dari beternak ikan
bisa untuk gantungan hidup? whether the
income from fish farming can be the
primary source of money?
c) apakah ada tanaman di dalamnya are there
plants in it?
.....................................
806 Jika saat ini tidak ada tanaman, di kolam Anda, apakah Anda membayangkan menanami eceng gondok di sebagian kolam ikan Anda atau di kolam baru? If no plant, do you imagine the water hyacinth plant in some fish pond or in your new pool?
1.Ya yes 2.Tidak no
807 Apakah Anda bersedia untuk memakai air limbah yang diolah untuk kolam ikan Anda? Are you willing to use treated waste water for your fish pond?
1.Ya yes 2.Tidak no
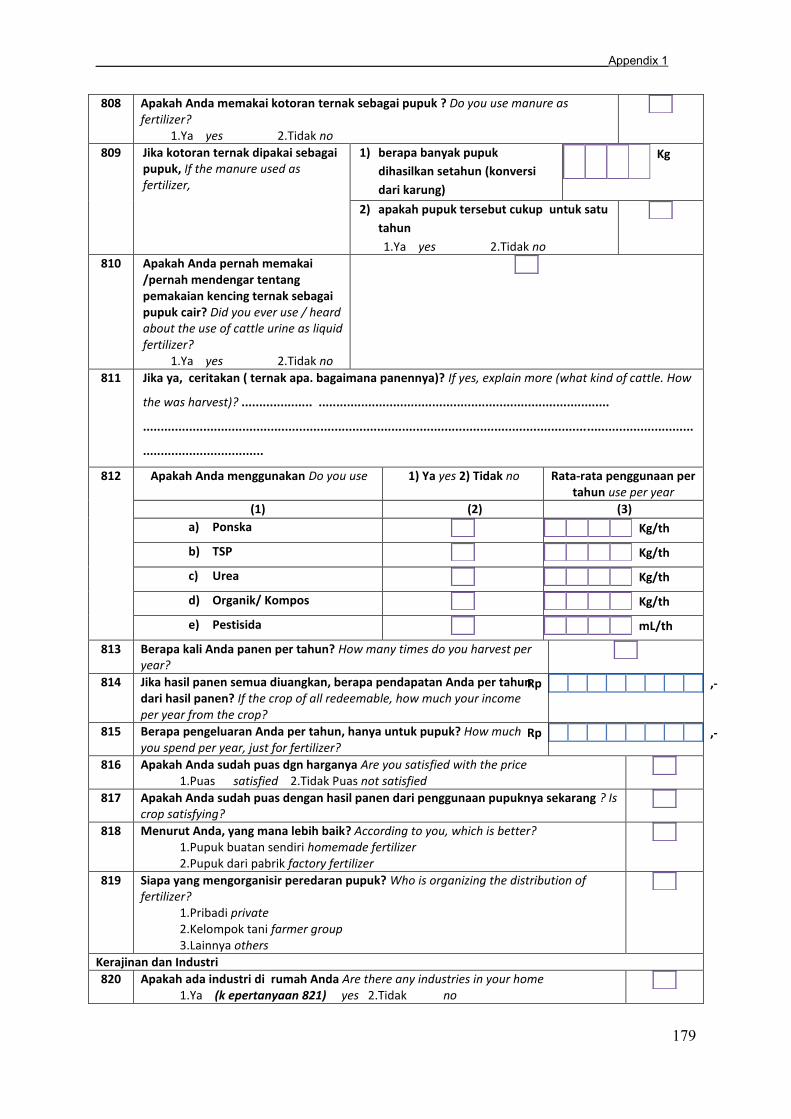
_____________________________________________________________________________Appendix 1
179
808 Apakah Anda memakai kotoran ternak sebagai pupuk ? Do you use manure as fertilizer?
1.Ya yes 2.Tidak no
809 Jika kotoran ternak dipakai sebagai pupuk, If the manure used as fertilizer,
1) berapa banyak pupuk
dihasilkan setahun (konversi
dari karung)
Kg
2) apakah pupuk tersebut cukup untuk satu
tahun
1.Ya yes 2.Tidak no
810 Apakah Anda pernah memakai /pernah mendengar tentang pemakaian kencing ternak sebagai pupuk cair? Did you ever use / heard about the use of cattle urine as liquid fertilizer?
1.Ya yes 2.Tidak no
811 Jika ya, ceritakan ( ternak apa. bagaimana panennya)? If yes, explain more (what kind of cattle. How
the was harvest)? .................... ..................................................................................
...........................................................................................................................................................
..................................
812 Apakah Anda menggunakan Do you use 1) Ya yes 2) Tidak no Rata-rata penggunaan per tahun use per year
(1) (2) (3)
a) Ponska
Kg/th
b) TSP
Kg/th
c) Urea
Kg/th
d) Organik/ Kompos
Kg/th
e) Pestisida
mL/th
813 Berapa kali Anda panen per tahun? How many times do you harvest per year?
814 Jika hasil panen semua diuangkan, berapa pendapatan Anda per tahun dari hasil panen? If the crop of all redeemable, how much your income per year from the crop?
Rp ,-
815 Berapa pengeluaran Anda per tahun, hanya untuk pupuk? How much you spend per year, just for fertilizer?
Rp ,-
816 Apakah Anda sudah puas dgn harganya Are you satisfied with the price 1.Puas satisfied 2.Tidak Puas not satisfied
817 Apakah Anda sudah puas dengan hasil panen dari penggunaan pupuknya sekarang ? Is crop satisfying?
818 Menurut Anda, yang mana lebih baik? According to you, which is better? 1.Pupuk buatan sendiri homemade fertilizer 2.Pupuk dari pabrik factory fertilizer
819 Siapa yang mengorganisir peredaran pupuk? Who is organizing the distribution of fertilizer?
1.Pribadi private 2.Kelompok tani farmer group 3.Lainnya others
Kerajinan dan Industri
820 Apakah ada industri di rumah Anda Are there any industries in your home 1.Ya (k epertanyaan 821) yes 2.Tidak no

Appendix 1____________________________________________________________________________
180
821 Jika ada industri di rumah Anda, If any industry in your house,
1.Ya 2.Tidak kebutuhan airnya
(1) (2) (3)
a) tahu/tempe
l/hari
b) ketela (keripik, tiwul, dll)
l/hari
c) kerajinan
l/hari
822 Bagaimana limbahnya? How is the waste disposal? 1.Dibuang ke tanah directly discharged 2.Dibuang ke got/irigasi/sungai to water bodies 3.Dibuang ke septic tank septic tank 4.Lainnya… others
Ketersediaan Air
823 Andaikan tersedia lebih banyak air, apakah Anda akan mengkonsumsi lebih banyak air Suppose that more water is available, whether you will consume more water
1.Ya (ke pertanyaan 824) yes 2.Tidak no
824 Jika ya, untuk keperluan apakah If yes, for the purposes of… 1.Kebutuhan sehari-hari daily needs 2.Pertanian farming 3.Kerajinan crafts 4.Industri industry
CATATAN, TAMBAHAN DAN KESIMPULAN Additional information
Pertanyaan
question
Catatan/ Tambahan Additional information
Kesimpulan
1 Bagaimana Anda menggambarkan suasana saat wawancara berlangsung How would you describe the atmosphere during the interview
1. Sangat Resmi
2. Cemas/
Tegang
3. Santai
4. Senang
3 Bagaimana ekspresi dan emosi yang responden How was the expressions or emotions of the respondents:
2 Pertanyaan mana yang dianggap oleh responden sulit dijawab Which question is considered by the respondents difficult to answer:
4 Jawaban yang mana saja menurut Anda kurang bisa dipertanggungjawabkan Where have the answers you think you can not be accounted for:

Appendix 2
181
Appendix 2
Diskusi tentang persepsi perangkat desa mengenai teknologi dan pengelolaan sanitasi
di Pucanganom
Discussion regarding village officers’ perception on sanitation technology and management in Pucanganom
Designed by : Suwartanti Nayono, M.Sc (Karlsruher Institut für Technologie, ITAS/TP 10)
Nama respondent (name of respondent) :
Umur (age) :
Pendidikan terakhir (education) :
Pekerjaan (position/job) :
Dusun (sub village) :
Tanggal interview (date of interview) :
1. Fasilitas sanitasi apa yang dimiliki mayoritas masyarakat desa saat ini? What kind of sanitation facility do most people in your village have?
a. WC leher angsa dilengkapi septic tank kedap air (squatting syphon toilette with waterproof septic tank)
b. WC leher angsa dilengkapi septic tank dengan dasar terbuka (squatting syphon toilette with unsealed septic tank)
c. WC cubluk (simple pit latrine)
d. keduanya a dan c atau b dan c (both a anc, or both b and c)
2. Apa sumber air utama yang digunakan masyarakat dusun/desa gunakan sepanjang tahun? What is most people’s main water source during the year? a. air hujan saja
(rain water only)
b. air PDAM saja (pipe water only)
c. gabungan antara air hujan dan air PDAM (mix of rain and pipe water)
d. gabungan antara air hujan, air PDAM dan tanki (mix of rain and pipe water, and additionally from tanker/vendor)

Appendix 2
____________________________________________________________________________
182
3. Secara umum, bagaimana pendapat Anda mengenai ketersediaan air yang masyarakat pakai untuk keperluan bersih-bersih (mandi, WC, cuci baju, cuci piring)? In general, what is your opinion on water quantity the community use s for cleaning purposes (taking shower, toiletting, washing clothes and dishes) ?
a. cukup (enough) b. kurang (insufficient) c. berlebih (more than enough)
4. Untuk perencanaan ke depan, WC model apa yang menurut Anda paling cocok
untuk mayoritas masyarakat desa?
If you might choose, which type of toilette do you think the most appropriate for the community?
a. WC jongkok leher angsa (squatting syphon toilette)
b. WC duduk (sitting syphon toilette with flushing button)
c. WC dengan pemisah air seni dan tinja beserta air untuk membersihkan diri (no-mix toilette,UDDT with anal cleansing chamber)
d. cubluk (simple pit latrine)
5. Apa tiga prioritas utama Anda dalam memilih WC? Please rank your first three priorities on selecting a toilette!
Prioritas (Items) Urutan (Rank) Indah/mewah
(luxurious/representative)
Nyaman dipakai (comfortable)
Tidak jauh berbeda dengan WC / kebiasaan saya sekarang (close to my current habit)
Bersih dan tidak berbau (clean and odorless)
Mudah perawatannya
b.
a. c. d.

Appendix 2
183
Prioritas (Items) Urutan (Rank) (easy to maintain)
Hemat air (safe water)
Harga murah (low investment cost)
Lainnya: .... (other...) 6. Menurut Anda, sumber energi yang mana sangat terbatas di desa Anda?
Which resource(s ) is lacking in your village? (more than one answer is possible)
a. energi untuk memasak (energy for cooking) b. listrik (electricity) c. pupuk (fertilizer) d. air untuk kebutuhan tidak pokok/tambahan (water for secondary purposes) e. lainnya.......................................................... (other.....)
7. Seandainya ada kesempatan untuk memperbaiki fasilitas pengolahan tinja dari WC Anda, fasilitas mana yang Anda nilai cocok diterapkan di wilayah Anda? For private toilettes in your area, which wastewater treatment option do you think appropriate ?
a. septik tank pribadi (private septic tank)
b. septik tank bersama skala 3-5 rumah (shared septic tank 3-5 households)
c. biogas pribadi (private biogas digester)
d. biogas bersama skala 3-5 rumah (shared biogas digester 3-5 households)
e. pengolahan limbah terpadu skala 15-30 rumah (communal wastewater treatment plant ca. 15-30 households)
f. lainnya ................................................................... (other....)
8. Apa prioritas utama Anda dalam memilih fasilitas pengolahan limbah? Please rank your priorities on selecting a wastewater treatment !
Prioritas (Items) Urutan (Rank)
Biaya pembuatan rendah (low construction cost)
Biaya pemeliharaannya rendah (low maintenance cost)
Mudah operasional dan perawatannya (easy to operate and maintain)
Mudah disambungkan dengan fasilitas yang sudah ada (connectivity to the existing facility)

Appendix 2
____________________________________________________________________________
184
Prioritas (Items) Urutan (Rank)
Dapat bermanfaat secara ekonomi (menghasilkan biogas, pupuk, air daur ulang)
(bring economic benefit eg: biogas, fertilizer, reuse of water)
Konsumsi air secara keseluruhan rendah (low water consumption)
Bersih dan tidak menimbulkan bau, tidak menggangu kesehatan (clean, odorless and healthy)
Tanggung jawab pembuatan dan pemeliharaan fasilitas ditanggung bersama (responsibility is shared among users)
Jauh dari rumah saya, sehingga tidak mengganggu- atau butuh lahan sedikit saja
(not in my backyard, or require low space)
Teknologinya dapat mengurangi pencemaran (high removal efficiency)
Lainnnya (other...:)
9. Bagaimana pendapat Anda mengenai pengolahan limbah untuk wilayah Anda dengan instalasi biogas?
What is your opinion on biogas digester for wastewater treatment in your area?
a. tidak tertarik, kebutuhan energi di rumah sudah tercukupi (not interested, energy in the household is sufficient)
b. tidak tertarik, lebih banyak repotnya daripada hasilnya (not interested, too much additional work to operate the digester compared to the benefit)
c. tertarik, bisa membawa keuntungan ekonomi (interested, economic benefit is expected)
d. tertarik, bisa memanfaatkan kotoran ternak yang tersedia (interested, to make use of excess of cattle dung)
e. lainnya .................................................................... ( other.....) 10. Jika di desa ini tersedia fasilitas biogas yang dapat dimanfaatkan untuk memasak,
biogas yang berasal dari apa yang menurut Anda pantas untuk dipakai? If there would be biogas for cooking in your area, which source(s) is acceptable for you?
a. kotoran ternak saja (cattle dung only)
b. kotoran ternak dan sampah sisa makanan/dapur (cattle dung and kitchen waste)
c. semua, termasuk dari tinja manusia (all, inluding human excreta)
d. tidak tertarik sama sekali pada biogas (not in favor for biogas digester)
11. Bagaimana pendapat Anda tentang pengolahan limbah terpadu skala kurang lebih 15-30 rumah di desa Anda?
What is your opinion on having communal WWTP for about 15-30 households in this village ?
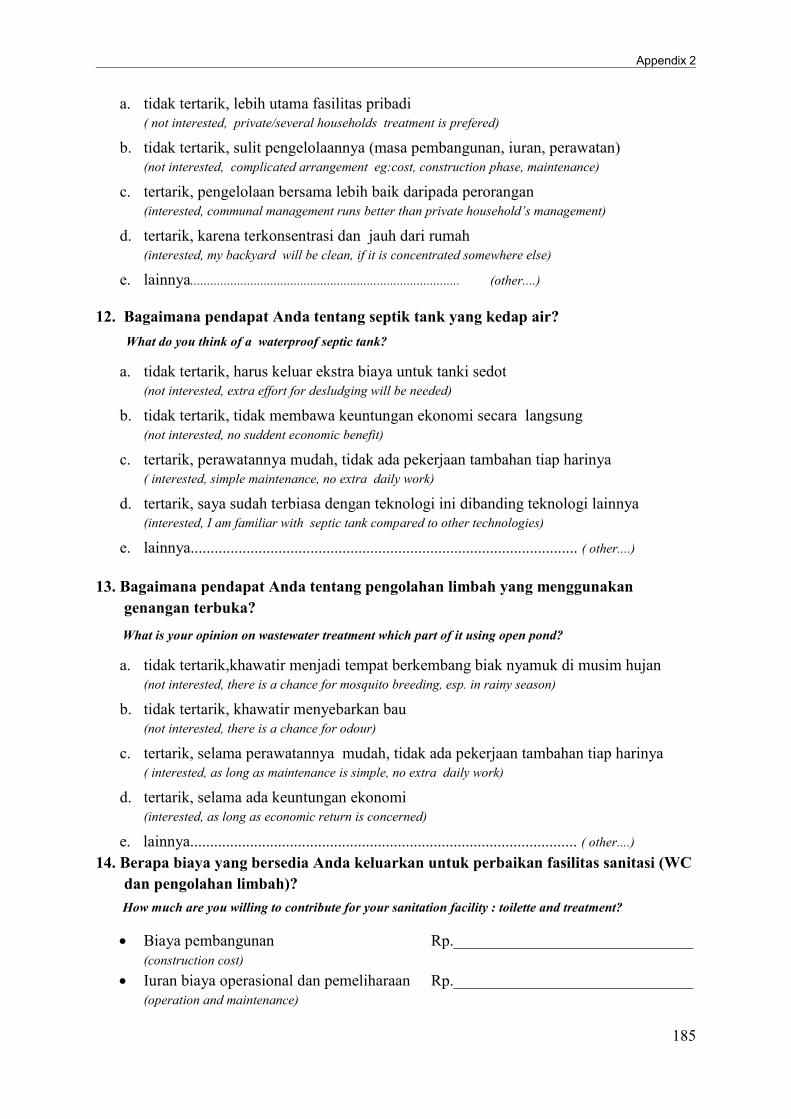
Appendix 2
185
a. tidak tertarik, lebih utama fasilitas pribadi ( not interested, private/several households treatment is prefered)
b. tidak tertarik, sulit pengelolaannya (masa pembangunan, iuran, perawatan) (not interested, complicated arrangement eg:cost, construction phase, maintenance)
c. tertarik, pengelolaan bersama lebih baik daripada perorangan (interested, communal management runs better than private household’s management)
d. tertarik, karena terkonsentrasi dan jauh dari rumah (interested, my backyard will be clean, if it is concentrated somewhere else)
e. lainnya................................................................................. (other....)
12. Bagaimana pendapat Anda tentang septik tank yang kedap air? What do you think of a waterproof septic tank?
a. tidak tertarik, harus keluar ekstra biaya untuk tanki sedot (not interested, extra effort for desludging will be needed)
b. tidak tertarik, tidak membawa keuntungan ekonomi secara langsung (not interested, no suddent economic benefit)
c. tertarik, perawatannya mudah, tidak ada pekerjaan tambahan tiap harinya ( interested, simple maintenance, no extra daily work)
d. tertarik, saya sudah terbiasa dengan teknologi ini dibanding teknologi lainnya (interested, I am familiar with septic tank compared to other technologies)
e. lainnya................................................................................................. ( other....)
13. Bagaimana pendapat Anda tentang pengolahan limbah yang menggunakan genangan terbuka?
What is your opinion on wastewater treatment which part of it using open pond?
a. tidak tertarik,khawatir menjadi tempat berkembang biak nyamuk di musim hujan (not interested, there is a chance for mosquito breeding, esp. in rainy season)
b. tidak tertarik, khawatir menyebarkan bau (not interested, there is a chance for odour)
c. tertarik, selama perawatannya mudah, tidak ada pekerjaan tambahan tiap harinya ( interested, as long as maintenance is simple, no extra daily work)
d. tertarik, selama ada keuntungan ekonomi (interested, as long as economic return is concerned)
e. lainnya................................................................................................. ( other....) 14. Berapa biaya yang bersedia Anda keluarkan untuk perbaikan fasilitas sanitasi (WC
dan pengolahan limbah)? How much are you willing to contribute for your sanitation facility : toilette and treatment?
Biaya pembangunan Rp.______________________________ (construction cost)
Iuran biaya operasional dan pemeliharaan Rp.______________________________ (operation and maintenance)
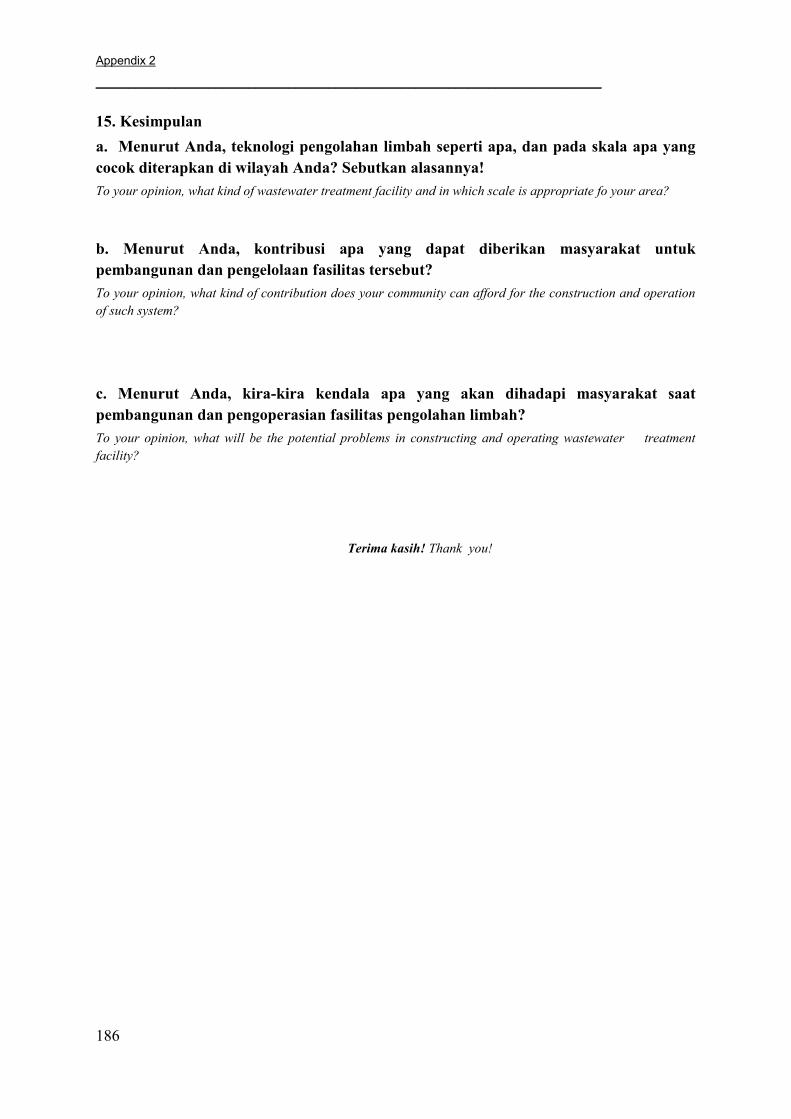
Appendix 2
____________________________________________________________________________
186
15. Kesimpulan a. Menurut Anda, teknologi pengolahan limbah seperti apa, dan pada skala apa yang cocok diterapkan di wilayah Anda? Sebutkan alasannya! To your opinion, what kind of wastewater treatment facility and in which scale is appropriate fo your area?
b. Menurut Anda, kontribusi apa yang dapat diberikan masyarakat untuk pembangunan dan pengelolaan fasilitas tersebut? To your opinion, what kind of contribution does your community can afford for the construction and operation of such system?
c. Menurut Anda, kira-kira kendala apa yang akan dihadapi masyarakat saat pembangunan dan pengoperasian fasilitas pengolahan limbah? To your opinion, what will be the potential problems in constructing and operating wastewater treatment facility?
Terima kasih! Thank you!

Appendix 3
187
Appendix 3 Sub-system I.a Level of treatment : cluster Input : blackwater and cattle dung
Nr. Indicators Unit User interface On-site treatment End product
Total score Pour-flush toilette (private)
Biogas digester (shared)
Slurry drying bed (shared)
Slurry for fertilizer
Biogas for cooking
1 Investment cost (cost components:material manpower, land and supporting facilities) USD/
household (HH)
35 451 31 Not relevant Not relevant
This cost (USD 521/HH) should be added to the investment cost of sub-system I.b (USD 75/HH). Total cost: USD 596/HH
521 2*
2 Operational and maintenance cost (cost components: water required,spareparts/ material, human resources)
USD/ HH.year 0
OM cost: -USD 53/HH.y Benefit from biogas production:+ USD 104/HH.y Total benefit: : + USD 51/HH.y
Not relevant Not relevant
This cost should be added to the benefit cost of sub sub-system I.b (USD 6/HH.y). Total cost: USD 57/HH.y
1*
3 Public preference on technology
-
High Users are familiar with the technology
Low Digester with input from mixture of cattle dung and human feces is less accepted. Moreover where the human feces also originates from other households (not their own family member).
Low Handling slurry originates from human feces is a sensitive issue in the society.
Low Contact with human feces is a sensitive issue in the society.Although slurry is already stabilized, the acceptance is still low.
Moderate Gas originates from mixture of human feces and cattle dung is less accepted, due to the perception of human feces in the society
(1+3+3+3+2)/5= 2.4
a. Cattle dung flow: dung collector b. Blackwater flow: pour-flush toilet
biogas digester slurry drying bed

Appendix 3___________________________________________________________________________
188
Nr. Indicators Unit User interface On-site treatment End product
Total score Pour-flush toilette (private)
Biogas digester (shared)
Slurry drying bed (shared)
Slurry for fertilizer
Biogas for cooking
4 Technical skills required to operate and maintain the system
-
Low No skill required. The toilet does not have any mechanical part which needs maintenance.
Moderate Users need to be trained in the use and maintenance of the system; expert supervision is required during the first six month.
Low No skill required for daily operation
Not relevant Not relevant (1+2+1)/3= 1.3
5 Possibility of minor problems to be fixed within reasonable repair time
-
High Common problem: clogging. Service and material are available within 2 hours.
Moderate Common problem:leakage in the pipes, low gas production due to unprecise ratio between wastewater and water. Material and service can be gained in 2 hour, repairement requires > 4 hours.
High Almost no common problem, except cracking. All materials can be easily found. Not relevant Not relevant (1+2+1)/3=
1.3
6 Biochemical Oxygen Demand (BOD) removal % Not relevant
80-85% (Cruz et al., 2005)
Not relevant Not relevant Not relevant 1
7 Land required for the plant
m2/ HH
1.5 m2/HH (assumed as private
land)
2.4 m2/HH (PT. Swen, 2011)
1.6 m2/HH (Cruz et al., 2005)
Not relevant Not relevant
This land requirement should be added to the sub-system Ib (0.8 m2/HH) Total land: 4.8 m2/HH
4 m2/HH All structures require space on the surface 2*
8 Water consumption to operate the whole system liter/
HH. day
Requires additional water amounting 3 lcpd for flushing (Tilley et al., 2008, thus 12liter /HH.day
Requires additional amount of water for dilluting the cattle dung, 20 liter/HH.day (ratio1:1)
Not relevant Not relevant Not relevant
This water consumption should be added to the sub-system Ib ( 0 l/HH.d). Total water:

Appendix 3
189
Nr. Indicators Unit User interface On-site treatment End product
Total score Pour-flush toilette (private)
Biogas digester (shared)
Slurry drying bed (shared)
Slurry for fertilizer
Biogas for cooking
32 l/HH.d
32 1*
9 Energy (electricity, fossil fuels) required to operate the system
kWh/HH. year
Low No energy required
Low No energy required
Low Solar energy required
Not relevant Not relevant (1+1+1)/3= 1
10 System compatibility with the existing system (in case an existing system available)
-
High Can be installed in the place where previous facility existed, can be connected to a digester.
Low Digester cannot be connected to the existing system without major changes, e.g. changing pit latrine into siphon toilette, plaste-ring the cattle dung, make a higher slope for a gravity driven-system.
High Very flexible, as long as space available
Not relevant Not relevant (1+3+1)/3= 1.7
11 Health risks gained from dealing with the system
-
Low Assumption: Hand washing after
anal cleansing Adequate amount of
water used for flushing
Water seal functions properly and pre-vents odour and flies
Water container placed next to the toilette, is kept clean from risk for
Low No contact required
Moderate Risks could be for the person handling the materials undergoing. The fresh slurry still contain pathogens, and digester amplifying the growth of certain pathogens (Tumwesige et al., 2011)
Moderate The slurry is “stabilised” with
reduced odour emissions, pathogens and weed seeds compared to undigested manure. Nevertheless pathogens are not removed to a significant extent ( von Munch, 2012)
Low No human health risk at all caused by pathogenic contamination in biogas itself (Vinnerås et al., 2006).
(1+1+2+2+1)/5= 1.4
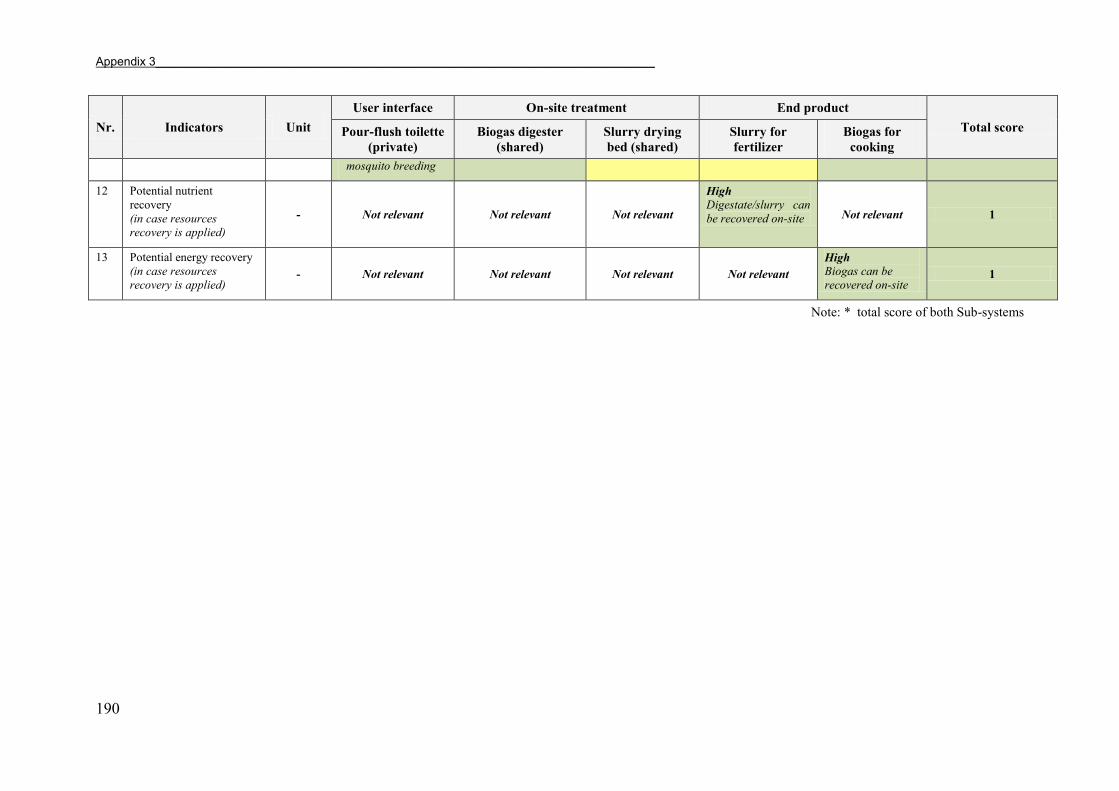
Appendix 3___________________________________________________________________________
190
Nr. Indicators Unit User interface On-site treatment End product
Total score Pour-flush toilette (private)
Biogas digester (shared)
Slurry drying bed (shared)
Slurry for fertilizer
Biogas for cooking
mosquito breeding
12 Potential nutrient recovery (in case resources recovery is applied)
- Not relevant Not relevant Not relevant
High Digestate/slurry can be recovered on-site Not relevant 1
13 Potential energy recovery (in case resources recovery is applied)
- Not relevant Not relevant Not relevant Not relevant High Biogas can be recovered on-site
1
Note: * total score of both Sub-systems

Appendix 3
191
Sub-system I.b
Level of treatment : cluster Input : greywater
Nr. Indicators Unit
On-site treatment End product
Total score Horizontal-flow planted filter (cluster level, 3 HH) Biomass (plant) Treated effluent
(infiltrated)
1 Investment cost (cost components: land, material, manpower and other supporting facilities)
USD/ household
(HH) USD 75/HH.y Not relevant Not relevant
This cost should be added to the investment cost of sub-system I.a (USD 521/HH). Total cost:USD 596/HH
2*
2 Operational and maintenance cost (spareparts/material,human resources, vacuum service) USD/
HH.year
OM of HFPF=-USD 6/HH.y Benefit from biomass +USD12/HH.y Total= + USD 6/HH.y
Not relevant Not relevant
This cost should be added to the OM cost of sub sub-system I.a (+USD 51/HH.y) Total cost: + USD 57/HH.y
1*
3 Public preference on technology
-
High The technology does not against society’s
principles.
High Preference is high. Biomass for feeding the cattles is accepted.
Not relevant 1
4 Technical skills required to operate and maintain the system
-
Low No special skill required. Main focus is placed on maintenance of the vegetation (gardening work, monitoring of the water level and clogging. During the initial vegetation period, the filter must be kept clean and free from other plants (Morel and Diener, 2006).
Not relevant Not relevant 1
5 Possibility of minor problems to be - Low Not relevant Not relevant 1
b. Greywater: kitchen sink, kitchen, bathroom horizontal-flow planted filter
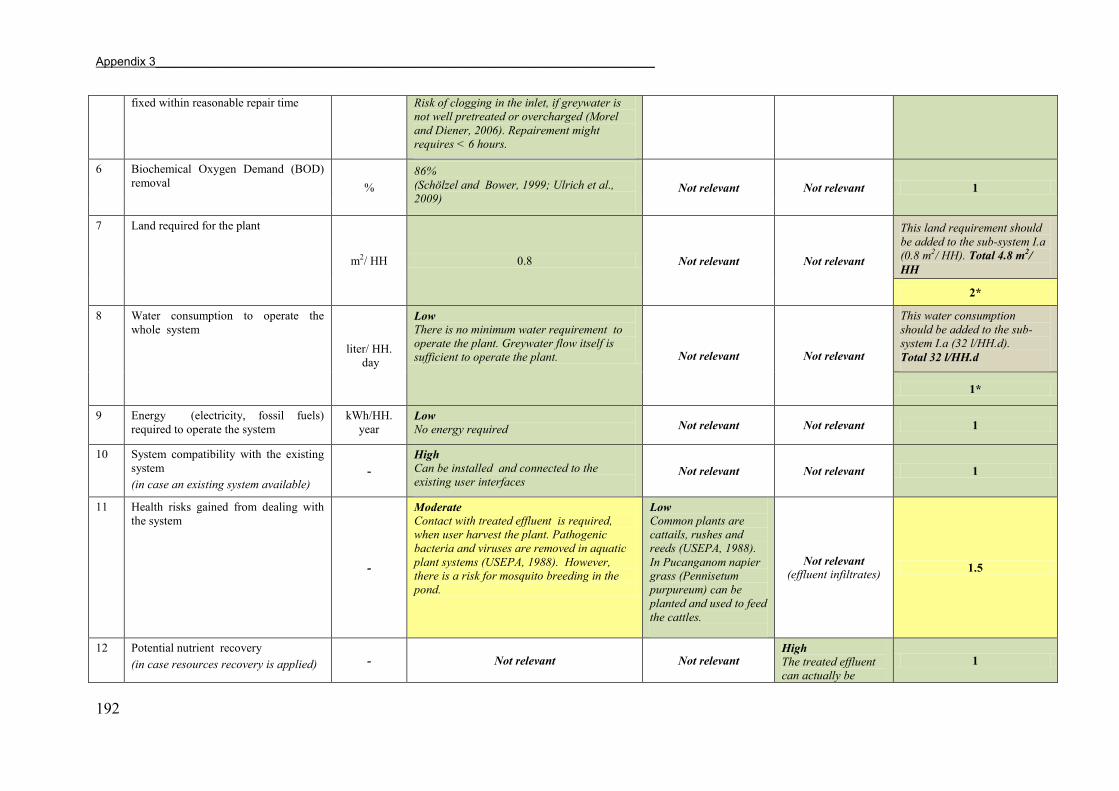
Appendix 3___________________________________________________________________________
192
fixed within reasonable repair time Risk of clogging in the inlet, if greywater is not well pretreated or overcharged (Morel and Diener, 2006). Repairement might requires < 6 hours.
6 Biochemical Oxygen Demand (BOD) removal %
86% (Schölzel and Bower, 1999; Ulrich et al., 2009)
Not relevant Not relevant 1
7 Land required for the plant
m2/ HH 0.8 Not relevant Not relevant
This land requirement should be added to the sub-system I.a (0.8 m2/ HH). Total 4.8 m2/ HH
2*
8 Water consumption to operate the whole system
liter/ HH. day
Low There is no minimum water requirement to operate the plant. Greywater flow itself is sufficient to operate the plant. Not relevant Not relevant
This water consumption should be added to the sub-system I.a (32 l/HH.d). Total 32 l/HH.d
1*
9 Energy (electricity, fossil fuels) required to operate the system
kWh/HH. year
Low No energy required Not relevant Not relevant 1
10 System compatibility with the existing system (in case an existing system available)
- High Can be installed and connected to the existing user interfaces
Not relevant Not relevant 1
11 Health risks gained from dealing with the system
-
Moderate Contact with treated effluent is required, when user harvest the plant. Pathogenic bacteria and viruses are removed in aquatic plant systems (USEPA, 1988). However, there is a risk for mosquito breeding in the pond.
Low Common plants are cattails, rushes and reeds (USEPA, 1988). In Pucanganom napier grass (Pennisetum purpureum) can be planted and used to feed the cattles.
Not relevant (effluent infiltrates) 1.5
12 Potential nutrient recovery (in case resources recovery is applied) - Not relevant Not relevant
High The treated effluent can actually be
1

Appendix 3
193
reused for gardening. However,in hot and arid climates planted filters may even become zero-discharge systems, with evapo-transpiration rates exceeding inflow rates (Morel and Diener, 2006).
13 Potential energy recovery (in case resources recovery is applied) - Not relevant
Energy (biomass) can be recovered on-site Not relevant 1
Note: * total score of both Sub-systems
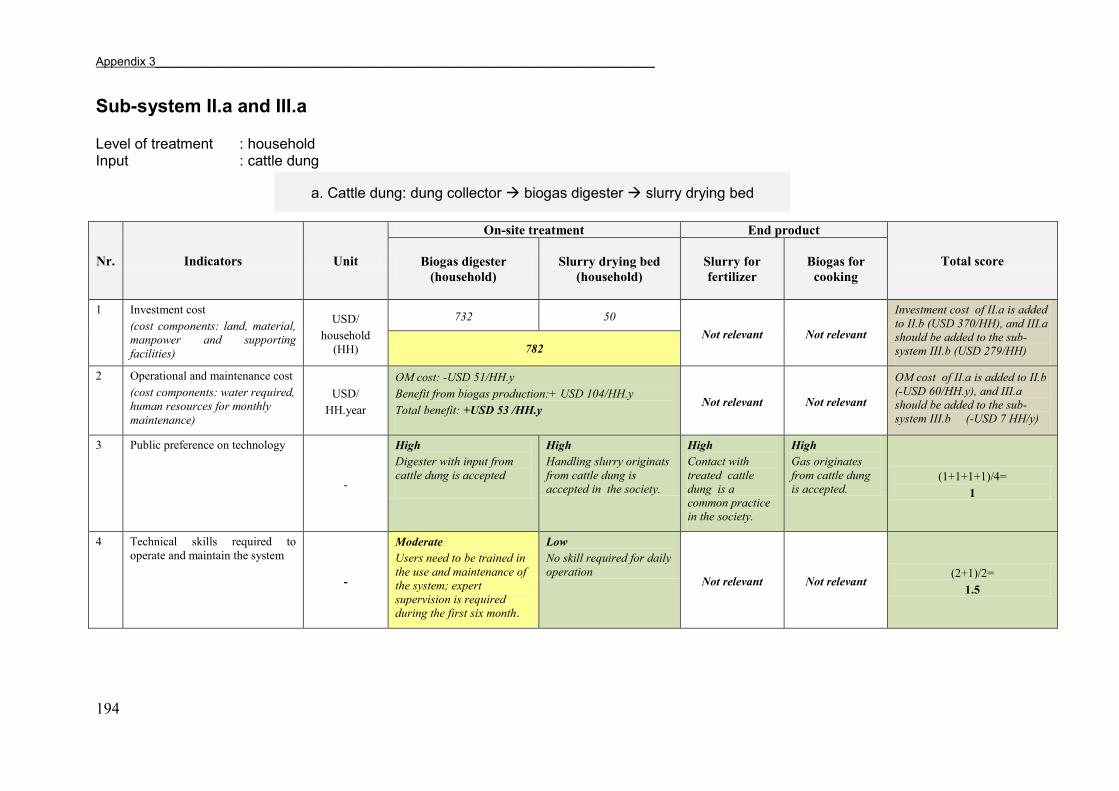
Appendix 3___________________________________________________________________________
194
Sub-system II.a and III.a
Level of treatment : household Input : cattle dung
Nr. Indicators Unit
On-site treatment End product
Total score Biogas digester (household)
Slurry drying bed (household)
Slurry for fertilizer
Biogas for
cooking
1 Investment cost (cost components: land, material, manpower and supporting facilities)
USD/ household
(HH)
732 50 Not relevant Not relevant
Investment cost of II.a is added to II.b (USD 370/HH), and III.a should be added to the sub-system III.b (USD 279/HH) 782
2 Operational and maintenance cost (cost components: water required, human resources for monthly maintenance)
USD/ HH.year
OM cost: -USD 51/HH.y Benefit from biogas production:+ USD 104/HH.y Total benefit: +USD 53 /HH.y
Not relevant Not relevant
OM cost of II.a is added to II.b (-USD 60/HH.y), and III.a should be added to the sub-system III.b (-USD 7 HH/y)
3 Public preference on technology
-
High Digester with input from cattle dung is accepted
High Handling slurry originats from cattle dung is accepted in the society.
High Contact with treated cattle dung is a common practice in the society.
High Gas originates from cattle dung is accepted.
(1+1+1+1)/4= 1
4 Technical skills required to operate and maintain the system
-
Moderate Users need to be trained in the use and maintenance of the system; expert supervision is required during the first six month.
Low No skill required for daily operation
Not relevant Not relevant (2+1)/2=
1.5
a. Cattle dung: dung collector biogas digester slurry drying bed

Appendix 3
195
5 Possibility of minor problems to be fixed within reasonable repair time
-
Moderate (6-12 hours) Common problem:leakage in the pipes, low gas production due to unprecise ratio between wastewater and water. Material and service can be gained in 2 hour, repairement > 4 hours.
High Almost no problem. All materials can easily be found.
Not relevant Not relevant (2+1)/2=
1.5
6 Biochemical Oxygen Demand (BOD) removal %
80-85% (Cruz et al., 2005)
Not relevant Not relevant Not relevant 1
7 Land required for the plant
m2/HH
2.4 m2/HH (PT. Swen, 2011)
1.6 m2/HH (Cruz et al., 2005)
Not relevant Not relevant
The land requirement of II.a is added to II.b (1.2 m2/HH), and III.a should be added to the sub-system III.b(1.9 m2/HH)
4 m2/HH
8 Water consumption to operate the whole system liter/HH.day
Cattle dung dillution: 20 liter/HH.day (ratio 1:1) Not relevant Not relevant Not relevant
The water consumption of II.a is added to II.b (40 l/HH.d), and III.a should be added to the sub-system III.b(12 l/HH.d)
9 Energy (electricity, fossil fuels) required to operate the system kWh/HH.year
Low No energy required
Low Solar energy required
Not relevant Not relevant
(1+1)/2= 1
10 System compatibility with the existing system (in case an existing system available)
-
Low Digester cannot be connected to the existing system without major changes, e.g. plastering the cattle dung, make a higher slope for a gravity driven-system
High Very flexible, as long as space available
Not relevant Not relevant (3+1)/2=
2
11 Health risks gained from dealing - Low Moderate Moderate Low (1+2+2+1)/4=
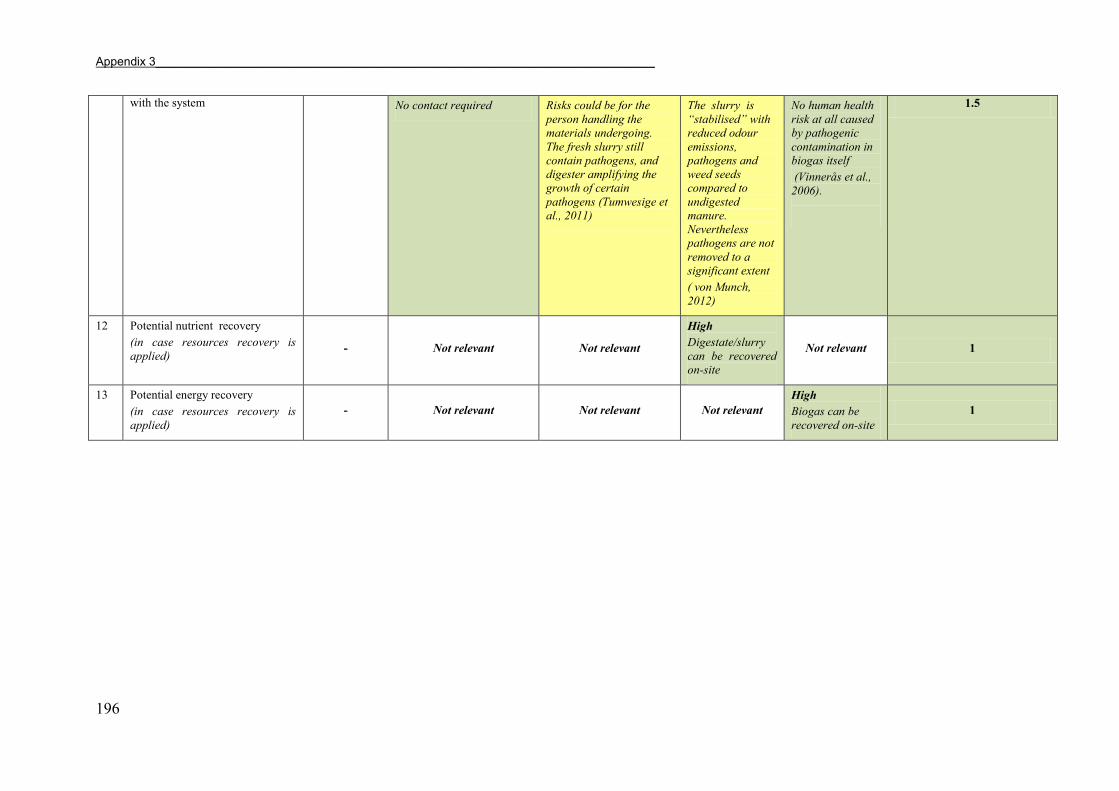
Appendix 3___________________________________________________________________________
196
with the system No contact required Risks could be for the person handling the materials undergoing. The fresh slurry still contain pathogens, and digester amplifying the growth of certain pathogens (Tumwesige et al., 2011)
The slurry is “stabilised” with
reduced odour emissions, pathogens and weed seeds compared to undigested manure. Nevertheless pathogens are not removed to a significant extent ( von Munch, 2012)
No human health risk at all caused by pathogenic contamination in biogas itself (Vinnerås et al., 2006).
1.5
12 Potential nutrient recovery (in case resources recovery is applied)
- Not relevant Not relevant
High Digestate/slurry can be recovered on-site
Not relevant 1
13 Potential energy recovery (in case resources recovery is applied)
- Not relevant Not relevant Not relevant High Biogas can be recovered on-site
1

Appendix 3
197
Sub-system II.b
Level of treatment : communal Input : blackwater and greywater
Nr. Indicators Unit
User interface Conveyance Semi off-site treatment End product
Total score Pour-flush toilet (private)
Simplified sewerage
(communal)
Anaerobic baffled reactor
(communal)
Faecal sludge (requires
further off-site treatment)
Treated effluent
(discharged to the nature)
1 Investment cost (cost components: land, material, manpower and other supporting facilities)
USD/household (HH)
35 146 189 Not relevant Not relevant
Investment cost of II.a (USD 782/HH) is added to II.b. Total cost: USD 1152/HH
USD 370/HH 3*
2 Operational and maintenance cost (cost components: additional water and salary of operator) USD/HH.year
-56 -4
Not relevant Not relevant
OM cost of II.a (+USD 53 HH/y)is added to II.b. Total cost: - USD 7/HH.y
-USD 60/HH (only OM expenditure, no economic benefit from resources recovery) 1*
3 Public preference on technology -
High Users are familiar with the technology
High Closed sewerage is accepted.
Not relevant Not relevant Not relevant (1+1)/2=
1
4 Technical skills required to operate and maintain the system - Low
No skill required. Low No skill required for
Moderate O M activities
Not relevant Not relevant (1+1+2)/3=
a. Blackwater: pour-flush toilet b. Greywater: bathroom, kitchen sink simplified sewerage anaerobic baffled reactor

Appendix 3___________________________________________________________________________
198
The toilet does not have any mechanical part which needs maintenance.
cleaning and maintaining collection component; instant removal of blockages, regular cleaning/ desludging from manhole.
consist of desludging and removal of accumulated floating debris such as coarse materials and grease from the sedimentation chamber. OM activities require a trained operator and a well-organized community organization (Schölzel and Bower, 1999; BORDA SEA, 2005)
1.3
5 Possibility of minor problems to be fixed within reasonable repair time
-
High Common problem: clogging. Service and material are available within 2 hours.
Moderate Common problem: clogging. Since the sewerage covers a large area, it might be difficult to detect where the clogging occurs. Checking each manhole and repairement can take >4 hours
High Risk of clogging especially in the inlet. Problem can be solved within 2 hours
Not relevant Not relevant (1+2+1)/3=
1.3
6 Biochemical Oxygen Demand (BOD) removal % Not relevant Not relevant
85% (Ulrich et al., 2009) Not relevant Not relevant 1
7 Land required for the plant
m2/HH
1.5 m2/HH (assumed as private land)
Not relevant 1.2 m2/HH
Not relevant Not relevant
Land requirement of II.a (4 m2/HH) is added to II.b.
Total 5.2 m2/HH
1.2 m2/HH 3*
8 Water consumption to operate the whole system liters/HH.day
Requires water for flushing amounting 3 lcpd
Requires water amounting > 50 lcpd to transport the
ABR can treat influent of 1-200 m3/d (Monvois et al.,
Not relevant Not relevant Water consumption of II.a (20 l/HH.d)is added to II.b.

Appendix 3
199
(Tilley et al., 2008)
solid part in the sewerage (Monvois et al., 2009). The wastewater flow in Pucanganom is 42 lcpd. To prevent clogging, 10 lcpd of water (including 3 lcpd for toilet flushing)must be added to the system.
2009).
The wastewater flow in Pucanganom(160 people @ 42 lcpd) is 6,72m3/d.
However >50 lcpd water is required to transport the solid part in the sewerage system.
Total 60 l/HH.d
40 l/HH.d 2*
9 Energy (electricity, fossil fuels) required to operate the system
kWh/HH.year
Low No energy required
Low No energy required, water flows by gravity
Low No energy required Not relevant Not relevant 1
10 System compatibility with the existing system (in case an existing system available)
-
High Can be installed in the place where previous facility existed, and easily connected to a septic tank.
Low Requires earth work, and precise position for elevation/ gradient to enable water transport by gravity force
Low Although the space required for each household is low (1,2 m2/HH), ABR requires a large space for its total construction. Earth work for ABR construction and channeling is required.
Not relevant Not relevant (1+3+3 )/3=
2.3
11 Health risks gained from dealing with the system
-
Low Assumption: Hand washing
after anal cleansing
Adequate amount of water used for flushing
Water seal func-tions properly and
Low The sewerage only needs maintenance every 6 months. The operator should check the manhole and remove the solid part with shovel.
Moderate The operator has to check the inlet and manhole every two weeks. Therefore there is risk for contact with pathogene every two weeks. The service personal vacuums
Not relevant (treatment outside of the system)
Not relevant (effluent is infiltrated)
(1+1+2)/3=
1.3

Appendix 3___________________________________________________________________________
200
prevents odour Water container
placed next to the toilette is cleaned to reduce risk for mosquito breeding
the sludge in the tank every 3 years.
12 Potential nutrient recovery (in case resources recovery is applied)
- Not relevant Not relevant Not relevant
Low Only off-site nutrient recovery is possible, no direct benefit for users.
High Theoretically the treated effluent can actually be reused for gar-dening. In the practice, the amount of waste-water in Pucang-anom is very low (42 lcpd). Considering the amount of water loss in the sewerage, the effluent is too few to be recovered.
(1+3)/2=
2
13 Potential energy recovery (in case resources recovery is applied)
- Not relevant Not relevant Not relevant Low
Energy recovery is not possible 3
Note: * total score of both Sub-systems

Appendix 3
201
Sub-system III.b
Level of treatment : cluster Input : blackwater and greywater
Nr. Indicators Unit
User interface On-site treatment End product
Total score Pour-flush toilet (private)
Septic tank with anaerobic filter
(cluster)
Horizontal-flow planted filter
(cluster)
Biomass (plant)
Treated effluent
(infiltrated)
1 Investment cost (cost components: land, material, manpower and other supporting facilities)
USD/ household
(HH)
35 220 24 Not relevant Not relevant
Investment cost of III.a (USD 782/HH) is added to III.b.
Total USD 1061/HH.
USD 279/HH 3*
2 Operational and maintenance cost (spareparts/material, human resources, vacuum service) USD/HH.
year
-USD 17/HH.y (expenditure for additional water for flushing the toilet)
-USD 2/HH.y (expenditure for desludging septic tank)
+USD12/HH.y (benefit from biomass)
Not relevant Not relevant
OM cost of III.a (+USD 53/HH.y) is added to III.b.
Total +USD 46/HH.y
-USD 7/HH.y (OM expenditure> economic benefit from resources recovery)
1*
3 Public preference on technology
-
High Users are familiar with the technology
High Users are familiar with the technology
High The technology does not against society’s
principles.
High Biomass for feeding the cattles is highly prefered
Not relevant (1+1+1+1)/4
=1
4 Technical skills required to operate and maintain the
- Low No skill required. The
Low No special skill
Low No special skill re-
Not relevant Not relevant (1+1+1)/3
Blackwater: pour-flush toilet septic tank with anerobic filter horizontal-flow planted filter
Greywater: kitchen sink, bathroom
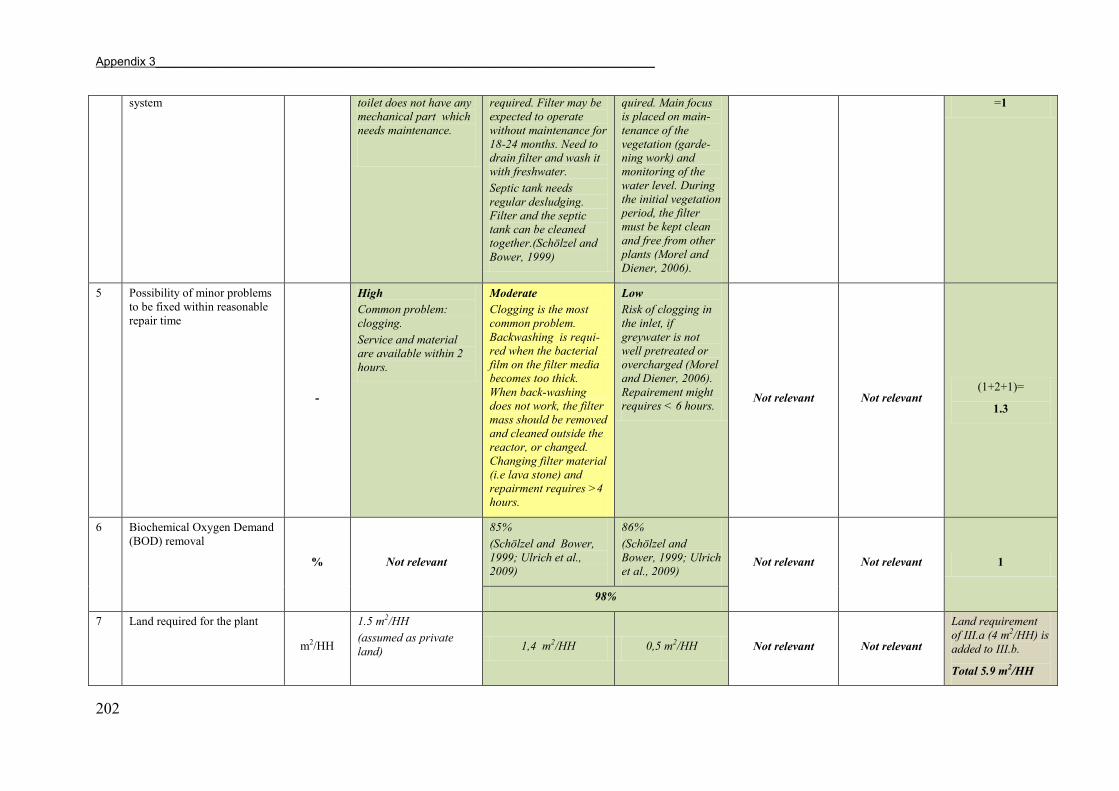
Appendix 3___________________________________________________________________________
202
system toilet does not have any mechanical part which needs maintenance.
required. Filter may be expected to operate without maintenance for 18-24 months. Need to drain filter and wash it with freshwater. Septic tank needs regular desludging. Filter and the septic tank can be cleaned together.(Schölzel and Bower, 1999)
quired. Main focus is placed on main-tenance of the vegetation (garde-ning work) and monitoring of the water level. During the initial vegetation period, the filter must be kept clean and free from other plants (Morel and Diener, 2006).
=1
5 Possibility of minor problems to be fixed within reasonable repair time
-
High Common problem: clogging. Service and material are available within 2 hours.
Moderate Clogging is the most common problem. Backwashing is requi-red when the bacterial film on the filter media becomes too thick. When back-washing does not work, the filter mass should be removed and cleaned outside the reactor, or changed. Changing filter material (i.e lava stone) and repairment requires >4 hours.
Low Risk of clogging in the inlet, if greywater is not well pretreated or overcharged (Morel and Diener, 2006). Repairement might requires < 6 hours.
Not relevant Not relevant (1+2+1)=
1.3
6 Biochemical Oxygen Demand (BOD) removal
% Not relevant
85% (Schölzel and Bower, 1999; Ulrich et al., 2009)
86% (Schölzel and Bower, 1999; Ulrich et al., 2009)
Not relevant Not relevant 1
98%
7 Land required for the plant
m2/HH
1.5 m2/HH (assumed as private land) 1,4 m2/HH 0,5 m2/HH Not relevant Not relevant
Land requirement of III.a (4 m2/HH) is added to III.b.
Total 5.9 m2/HH

Appendix 3
203
1,9 m2/HH 3*
8 Water consumption to operate the whole system
liter/HH. day
Requires additional water for flushing amounting 2-3 lcpd (Tilley et al., 2008)
or 12 l/HH.day
30 lcpd (Carr and Strauss, 2001)
or 120 l/HH.day This amount of water can be obtained from the wastewater discharge. Therefore no additional amount of water required.
Not relevant Not relevant
Water consumption of III.a (20 l/HH.d) is added to III.b. Total 32 l/HH.d
12 l/HH.day 1*
9 Energy (electricity, fossil fuels) required to operate the system
kWh/HH.year
Low No energy required
Low No energy required
Low No energy required Not relevant Not relevant 1
10 System compatibility with the existing system
(in case an existing system available) -
High Can be installed in the place where previous facility existed, and easily connected to a septic tank.
Moderate The septic tank should be installed in the place where accesscible from all toilet and where wastewater can flow by gravity.
High Can be installed next to the septic tank Not relevant Not relevant
(1+2+1)=
1.3
11 Health risks gained from dealing with the system
-
Low Assumption: Hand washing after
anal cleansing Adequate amount of
water for flushing Water seal functions
properly to prevent odour
Water container is regularly cleaned to reduce risk of mosquito breeding
Low Septic tank is an underground structure. Users do not have daily contact with the waste-water. Contact might be occured during backwashing the filter and when the service personal vacuums the tank every 3 years.
Moderate Contact with treated effluent is required, when user harvest the plant. Pathoge-nic bacteria and viruses are removed in aquatic plant sys-tems (USEPA, 1988). However, there is a risk for mosquito breeding in the pond.
Low Common plants are cattails(Typha), rushes (Scirpus), and reeds (Phrag-mites) (USEPA, 1988). In Pucang-anom napier grass (Pennisetum purpureum) can be planted and used to feed the cattles.
Not relevant
(effluent infiltrates)
(1+1+2+1)=
1.3
12 Potential nutrient recovery (in case resources recovery is applied) - Not relevant Not relevant Not relevant Not relevant
High
The treated effluent can actually be reused for gardening. However,in hot
1

Appendix 3___________________________________________________________________________
204
and arid climates planted filters may even become zero-discharge systems, with evapo-transpiration rates exceeding inflow rates (Morel and Diener, 2006).
13 Potential energy recovery (in case resources recovery is applied)
- Not relevant Not relevant Not relevant Energy (biomass) can be recovered on-site
Not relevant 1
Note: * total score of both Sub-systems

Appendix 4
205
Appendix 4
INVESTMENT and OPERATIONAL MAINTAINANCE COST CALCULATION
INVESTMENT COST
I. SYSTEM I: Cluster Digester and Cluster Horizontal-Flow Planted Filter (HFPF)
A. Blackwater and cattle dung flow in a cluster fixed dome digester
Nr Item Dimension/number Unit
Unit price (IDR)
Cost (IDR)
Cost (USD)
1. Squatting toilet 1 unit 250,000 250,000 26
2. Plastering the floor of the toilet= 1,5x1,5 m2 2,25 m2 40,000 90,000 9
3. Open channel to digester's inlet 2 m 176,500 353,000 36
4. Plastering the floor of the cattle stall= 3X3 m2 9 m2 75,000 675,000 70
5. Digester, capacity for 6 cows, shared by 3 HH, Total cost IDR 9,518,080 1 unit 3,172,693 3,172,693 327
6.
Sludge drying bed (actual required volume 1,26 m3), Designed for 3x1,5x0,5 m3, Cost is shared between 3 HH
9 m2 100,000 300,000 31
7. Sludge drying bed 2,25 m3 17,500 13,125 1
8. Land (digester and slurry drying bed) 4 m2 50,000 200,000 21
Total I a: 5,053,818 521
B. Greywater flow in a cluster HFPF
Nr Item Dimension/number Unit
Unit price (IDR)
Cost (IDR)
Cost (USD)
1. Cluster HFPF , Tot 1,041,800 1 unit 347,267 347,267 36
2. PVC pipeline for greywater to HFPF 5 m 76,800 384,000 40
3. Land(2,4x1x0,4) 0,8 m2 50,000 40,000 4
Total I b: 731,267 75
Total Investment for System I (A+ B) = 5,785,085,00 IDR /household or 596 USD/household

Appendix 4____________________________________________________________________________
206
II. SYSTEM II: Private Digester and Communal Anaerobic Baffled Reactor (ABR)
A. Cattle dung flow in a household level fixed dome digester
Nr, Item Dimension/ number Unit Unit price
(IDR) Cost
(IDR) Cost
(USD)
1. Plastering the floor of the cattle stall= 3X3 m2 9 m2 75,000 675,000 70
2. Open channel 1,5 m 90,000 135,000 14
3. Sludge drying bed (actual required volume 0,42 m3), Designed for 1,5 x1x0,5 m3,
0,75 m3 17,500 13,125 1
4. Plastering SDB 4 m2 100,000 400,000 41
5. Fixed dome digester, capacity for 2 cows (1 HH) 1 unit 6,165,120 6,165,120 636
6. Land (digester and slurry drying bed) 3,9 m2 50,000 195,000 20
Total II a: 7,583,245 782
B. Blackwater and greywater flow in ABR communal level
Nr, Item Dimension/ number Unit Unit price
(IDR) Cost
(IDR) Cost
(USD)
1. Squatting toilet 1 unit 250,000 250,000 26
2. Plastering the floor of the toilet= 1,5x1,5 m2 2,25 m2 40,000 90,000 9
3. Simplified sewerage 8 m 176,800 1,414,400 146
4. Anaerobic baffled reactor (8 chambers, capacity 38 HH), total cost IDR 67,333,597
1 unit 1,771,937 1,771,937 183
5. Land for ABR 1,2 m2 50,000 60,000 6
Total II b: 3,586,337 370
Total Investment for System II (A+ B) = 11,169,582,00 IDR/household or 1,152 USD/household

Appendix 4
207
III. SYSTEM III: Private Digester and Cluster Septic Tank- Anaerobic Filter (ST-AF) and Cluster Horizontal-Flow Planted Filter (HFPF)
A. Cattle dung flow in a household level fixed dome digester
Nr, Item Dimension/ number Unit Unit price
(IDR) Cost
(IDR) Cost
(USD)
1. Plastering the floor of the cattle stall= 3X3 m2 9 m2 75,000 675,000 70
2. Open channel 1,5 m2 90,000 135,000 14
3. Sludge drying bed (actual required volume 0,42 m3), Designed for 1,5 x1x0,5 m3,
0,75 m3 17,500 13,125 1
4. SDB plastered 4 m2 100,000 400,000 41
5. Fixed dome digester, capacity for 2 cows (1 HH) 1 unit 6,165,120 6,165,120 636
6. Land (digester and slurry drying bed) 3,9 m2 50,000 195,000 20
Total III a 7,583,245 782
B. Black and greywater in septic tank-anaerobic filter and HFPF
Nr, Item Dimension/ number Unit Unit price
(IDR) Cost
(IDR) Cost
(USD) 1. Squatting toilet 1 unit 250,000 250,000 26
2. Plastering the floor of the toilet= 1,5x1,5 m2 2,25 m2 40,000 90,000 9
3. Septic tank with anaerobic filter, Total for % HH IDR 8,399,200 1 unit 8,399,200 1,679,840 173
4. PVC pipe from toilet to ST-AF 5 m 76,800 384,000 40
5. HFPF, cluster level, Tot IDR 1,041,800 1 unit 1,041,800 208,360 21
6. Land (ST-AF-HFPF) 1,9 m2 50,000 95,000 10
Total IIIb 2,707,200 279
Total Investment for System III (A+ B) = 10,290,445 IDR/household or 1,061 USD/household

Appendix 4____________________________________________________________________________
208
OM COST
I. OM System I
Nr Item IDR/year USD/year USD/HH (3 HH)
Digester 1. water (32 lcpd, IDR 37,500/10 m3) 438.000 45 45
2. cement (IDR 40.000/y) 40.000 4 1 3. cleaning (IDR 15.000/month) 180.000 19 6
HFPF 4. cleaning (IDR 5.000/HH.month) 60,000 6 2
Total OM Cost 54
Benefit System I
Nr Item IDR/HH/ year
USD/HH/ year USD/HH
Biogas substitutes kerosene (IDR 2.760/d) 1.007.400 100 100
Biomass (IDR 10.000/HH.m) 120.000 12 12
Total Benefit 112
Net benefit System I: 112-54 =108 USD/HH.y
II. OM System II
Nr Item IDR/HH/ year USD/HH/ year
Digester
1 water 20 lcpd 273.750 28 2 cleaning IDR 15.000/m 180.000 19 3 cement IDR 40.000/y 40.000 4
Sub-total 51
ABR
1 operator 36.000 4 2 additional water 8 lcpd 547.500 56
Sub-total 60
Total OM System II 111
Net benefit System I: 100-111 = -11 USD/HH.y

Appendix 4
209
III. OM System III (ST-AF-HFPF)
Nr Item IDR/HH.y USD/HH/ year
1 water for flushing toilet 12 l/HH.d= 4,38 m3/y 164.250 17
2 desludging/ 3 year (IDR 250.000/5 HH) 16.667 2
3 human power /3 year (IDR 40.000/5 HH) 4.444 0
OM Cost/year 185.361 19
Benefit kalanjana grass 10.000/HH.m 120.000 12
TOT benefit -OM
benefit biogas (+)
104
benefit biomass (+)
12
OM digester (-)
51
OM ST AF HFPF (-)
19
Net Benefit System III (USD/HH.y) 46