dissertation - qucosa · dissertation in fulfillment of ... thankful to dr. heiko breitsohl and dr....
TRANSCRIPT

Job Satisfaction in Teams —
A Multi-Level Theory of Emergence and Consequences
DISSERTATION
in fulfillment of the requirements for the degree of Doctor rerum naturalium
(Dr. rer. nat.)
presented to the Faculty of Behavioural and Social Sciences at TU Chemnitz
by
Dipl.-Psych. Benjamin Haarhaus, B.Sc. Born on 11.12.1985 in Aachen
Submitted on 30.01.2017
This dissertation was written from 01.04.2015 to 30.01.2017 at the Institute of Organizational and Economic Psychology.


To my family


Acknowledgements
While this dissertation holds a single name on the cover, a project demanding that much time and attention inevitably affects not only the author, but also his colleagues, friends, and family. I would like to thank them for their help, support, and patience.
First and foremost, I like to express my sincerest gratitude to my supervisor Prof. Bertolt Meyer. The fact that the supervisor of a dissertation is referred to as the doctoral father in German hints at the importance this role holds, demanding a delicate balance between guidance, advice, and latitude. Bertolt always struck this balance by providing helpful ad-vice and encouragement while, at the same time, being open to different ideas and view-points. I could not have wished for a better supervisor than him.
In keeping with the family metaphor, if there were to be a doctoral big brother, it would be Dr. Jost Sieweke, without whom this dissertation would not have seen the light of day. Throughout the years, he has been both a mentor and close friend to me. I consider myself fortunate to have worked with him.
I would also like to express my gratitude to the colleagues and friends who supported me in the pursuit of this dissertation. I am especially grateful to Anne-Kathrin Bühl. It was not only she who introduced me to Bertolt Meyer, she also managed to provide both helpful advice and helpful distraction at the right times. I also thank Dr. Henning Rode and Dr. Simon Dischner. Our dinner-and-paper-review colloquia shall not be forgotten. I am also thankful to Dr. Heiko Breitsohl and Dr. Florian Zapkau for their helpful advice and comments on parts of this dissertation, and to my colleagues Alex Zill and Sasha Cook for the good times we had when I was in Chemnitz.
Finally, I like to thank my loving family, Markus, Claudia, and Stefanie, for supporting and bearing with me.

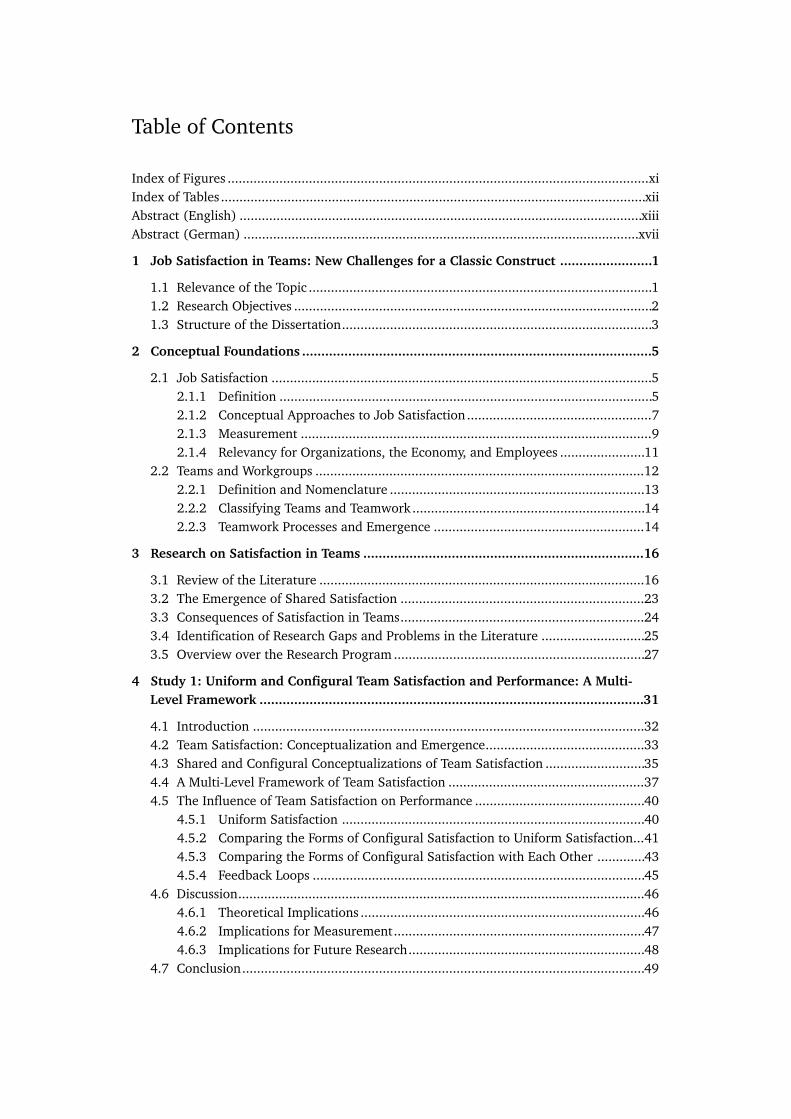
Table of Contents
Index of Figures xi ..................................................................................................................Index of Tables xii ...................................................................................................................Abstract (English) xiii .............................................................................................................Abstract (German) xvii ...........................................................................................................
1 Job Satisfaction in Teams: New Challenges for a Classic Construct 1 ........................
1.1 Relevance of the Topic 1 .............................................................................................1.2 Research Objectives 2 .................................................................................................1.3 Structure of the Dissertation 3 ....................................................................................
2 Conceptual Foundations 5 ...........................................................................................
2.1 Job Satisfaction 5 .......................................................................................................2.1.1 Definition 5 .....................................................................................................2.1.2 Conceptual Approaches to Job Satisfaction 7 ..................................................2.1.3 Measurement 9 ...............................................................................................2.1.4 Relevancy for Organizations, the Economy, and Employees 11 .......................
2.2 Teams and Workgroups 12 .........................................................................................2.2.1 Definition and Nomenclature 13 .....................................................................2.2.2 Classifying Teams and Teamwork 14 ...............................................................2.2.3 Teamwork Processes and Emergence 14 .........................................................
3 Research on Satisfaction in Teams 16 .........................................................................
3.1 Review of the Literature 16 ........................................................................................3.2 The Emergence of Shared Satisfaction 23 ..................................................................3.3 Consequences of Satisfaction in Teams 24 ..................................................................3.4 Identification of Research Gaps and Problems in the Literature 25 ............................3.5 Overview over the Research Program 27 ....................................................................
4 Study 1: Uniform and Configural Team Satisfaction and Performance: A Multi- Level Framework 31 ....................................................................................................
4.1 Introduction 32 ..........................................................................................................4.2 Team Satisfaction: Conceptualization and Emergence 33 ...........................................4.3 Shared and Configural Conceptualizations of Team Satisfaction 35 ...........................4.4 A Multi-Level Framework of Team Satisfaction 37 .....................................................4.5 The Influence of Team Satisfaction on Performance 40 ..............................................
4.5.1 Uniform Satisfaction 40 ..................................................................................4.5.2 Comparing the Forms of Configural Satisfaction to Uniform Satisfaction 41 ...4.5.3 Comparing the Forms of Configural Satisfaction with Each Other 43 .............4.5.4 Feedback Loops 45 ..........................................................................................
4.6 Discussion 46 ..............................................................................................................4.6.1 Theoretical Implications 46 .............................................................................4.6.2 Implications for Measurement 47 ....................................................................4.6.3 Implications for Future Research 48 ................................................................
4.7 Conclusion 49 .............................................................................................................

5 Study 2a: Construction and Validation of a Short Measure to Assess General and Facet-Specific Job Satisfaction 51 .........................................................................
5.1 Einleitung 52 ..............................................................................................................5.2 Deutschsprachige Verfahren zur Messung von Arbeitszufriedenheit 53 ......................5.3 Hintergrund der Skalenentwicklung 55 ......................................................................5.4 Entwicklung des initialen Itempools 56 ......................................................................5.5 Validierungshypothesen 56 .........................................................................................
5.5.1 Faktorielle Validität 56 ....................................................................................5.5.2 Konstrukt- und Kriteriumsvalidität 56 .............................................................
5.6 Methode 58 ................................................................................................................5.6.1 Stichproben 58 ................................................................................................5.6.2 Verwendete Skalen und Maße 59 ....................................................................5.6.3 Itemselektion und Skalenbildung 60 ...............................................................
5.7 Ergebnisse 62 .............................................................................................................5.7.1 Faktorielle Validität 62 ....................................................................................5.7.2 Konstrukt- und Kriteriumsvalidität 64 .............................................................
5.8 Diskussion 66 .............................................................................................................
6 Study 2b: Measuring Satisfaction in Teams — An Adaptation of the KAFA Scales 69 ...
6.1 Introduction 70 ..........................................................................................................6.2 Adapting the KAFA Scales to the Team Context 70 .....................................................6.3 Validation Hypotheses 73 ...........................................................................................
6.3.1 Factorial Validity 73 .........................................................................................6.3.2 Correlational Pattern 73 .................................................................................6.3.3 Construct Validity 73 .......................................................................................
6.4 Method 74 ..................................................................................................................6.4.1 Sample 74 .......................................................................................................6.4.2 Measures 74 ....................................................................................................
6.5 Results 75 ...................................................................................................................6.5.1 Item and Scale Statistics 75 .............................................................................6.5.2 Factorial Validity 76 .........................................................................................6.5.3 Correlational Pattern 78 ..................................................................................6.5.4 Construct Validity 78 .......................................................................................
6.6 Discussion 79 ..............................................................................................................
7 Study 3: Uncovering Cognitive and Affective Sources of Satisfaction Homogeneity in Work Teams 83 ........................................................................................................
7.1 Introduction 84 ..........................................................................................................7.2 Satisfaction Homogeneity: Conceptualization and Review 84 ....................................7.3 Affective and Cognitive Routes to Job Satisfaction 86 ................................................7.4 Situational, Dispositional, and Social Antecedents of Satisfaction Homogeneity 87 ...
7.4.1 Situational Antecedents 88 .............................................................................7.4.2 Dispositional Antecedents 89 ..........................................................................7.4.3 Social Antecedents 90 .....................................................................................
7.5 Method 91 ..................................................................................................................7.5.1 Sample 91 .......................................................................................................7.5.2 Measures 92 ....................................................................................................

7.6 Results 94 ...................................................................................................................7.6.1 Preliminary Analyses 94 ..................................................................................7.6.2 Model Estimation 96 .......................................................................................7.6.3 Testing of Hypotheses 98 .................................................................................7.6.4 Supplemental Analyses 99 ..............................................................................
7.7 Discussion 101 ............................................................................................................7.7.1 Implications for Research 103 .........................................................................7.7.2 Limitations and Future Research 104 ..............................................................7.7.3 Conclusion 105 ...............................................................................................
8 General Discussion 107 ...............................................................................................8.1 Summary and Integration of Findings 107 .................................................................8.2 Implications for Theory and Research 112 ................................................................8.3 Implications for Managerial Practice 118 ...................................................................8.4 Methodological Implications 120 ...............................................................................8.5 Strengths and Limitations 122 ....................................................................................8.6 Conclusion 124 ...........................................................................................................
References 125 .......................................................................................................................Appendix 148.........................................................................................................................


Index of Figures
Figure 1. Hierarchical structure of job satisfaction 6 ..............................................................Figure 2. Research interest for satisfaction in the team context 16 ............................................Figure 3. Integration and research foci of the four studies 29 ................................................Figure 4. Forms of group-level team satisfaction 36 ...............................................................Figure 5. Multi-Level Input-Mediator-Outcome (MIMO) framework 38 .................................Figure 6. Basic assumptions of affective events theory 86 ......................................................Figure 7. Theoretical framework and hypotheses 87 ..............................................................Figure 8. Initial (a) and revised (b) path model for the antecedents of satisfaction homogeneity 97 .......................................................................................................Figure 9. Effects of job satisfaction average and homogeneity on team-rated and supervisor-rated performance 100 ...........................................................................Figure 10. IMO framework 113 ..............................................................................................Figure 11. General MIMO framework 114 .............................................................................Figure 12. Network approach to satisfaction in teams 117 .....................................................Figure 13. Exemplar box plots of satisfaction configurations 119 ..........................................
xi

Index of Tables
Table 1. Two-Dimensional Classification Scheme of Approaches to Job Satisfaction 8 ...........Table 2. Overview of Common Job Satisfaction Scales and Measures 10 ................................Table 3. Satisfaction in the Team Context 17 ..........................................................................Table 4. Definitions and Approaches to Satisfaction in Teams 18 ...........................................Table 5. Notation, Targets, Facets, Levels of Analysis, Compositions Models, and Measurement of Satisfaction in Teams 20 .................................................................Table 6. Overview over the Studies 28 ....................................................................................Table 7. Classification of (Team) Satisfaction Facets 34 ..........................................................Table 8. Propositions Regarding the Effects of Group-Level Satisfaction Forms on Team Performance 45 .........................................................................................................Tabelle 9. Mittelwerte, Standardabweichungen und Trennschärfen aller Items des KAFA 61 ....Tabelle 10. Mittelwerte, Standardabweichungen und Cronbachs Alpha für alle Skalen des KAFA 62 .........................................................................................................Tabelle 11. Varimaxrotierte fünffaktorielle Struktur der Facettenskalen des KAFA 63 ............Tabelle 12. Interkorrelationen aller Skalen des KAFA in Stichproben 1 und 2 65 ...................Tabelle 13. Konstrukt- und Kriteriumsvalidität des KAFA 66 ..................................................Table 14. Original and Adapted Version of Job Satisfaction Scales Used in This Dissertation 72 ..Table 15. Item Statistics for the Four Satisfaction Scales 75 ...................................................Table 16. Individual-Level and Group-Level Scale Statistics 76 ..............................................Table 17. Factor Loadings for Satisfaction Facets in PCA and CFA 77 .....................................Table 18. CFA Fit Statistics for the Three-Factorial Model 78 ..................................................Table 19. Correlations Between Satisfaction Scales and Validation Criteria 79 .......................Table 20. Means, Standard Deviations, Internal Consistencies, and Intercorrelations for Individual-Level Data 94 .........................................................................................Table 21. Means, Standard Deviations, and Intercorrelations for Team-Level Data 95 ...........Table 22. Correlations and Semi-Partial Correlations Between Model Variables and Homogeneity Indices 99 ..........................................................................................Table 23. Effects of Job Satisfaction Average and Homogeneity on Team Performance 100 ...Table 24. Overview of the Contributions of the Four Studies 109 ...........................................
xii

Abstract (English)
Job satisfaction is the central attitude about work and can be considered among the most important constructs in organizational psychology and managerial practice. While scholars traditionally focused on job satisfaction of individual employees, the ongoing shift from individual to team-based working led to a new emphasis of satisfaction in the context of teams. Specifically, the focus on job satisfaction as an individual-level construct was com-plemented by a group-level perspective, which describes the satisfaction of teams as a whole. Furthermore, employees’ satisfaction with the team (i.e., team satisfaction) appeared as a new facet on the research agenda.
Although research on job satisfaction in teams has grown in recent years, it still faces im-portant challenges. The main problem is that prior research mostly viewed satisfaction in teams from a single-level perspective and conceptualized it as construct that is shared by all team members, overlooking that exclusion and polarization processes might lead to other than uniform satisfaction patterns. Second, while the literature already established a relationship between teams’ average satisfaction and performance, authors so far devoted only little attention to multi-level conceptualizations, neglecting that satisfaction on different levels of analysis can have different effects on emergent states, team processes, and per-formance. Finally, a lack of validated scales to assess satisfaction in teams forces researchers to rely on ad-hoc measures, on scales that were adapted from different research contexts, and on single-item measures, which complicates the testing of theoretical models, and the prediction and improvement of performance of individuals and teams. This dissertation addresses these challenges in a series of four studies.
Study 1 presents a conceptual multi-level framework of team satisfaction. Current theori-zing on team satisfaction as a group-level construct and its relationship to team perfor-mance faces two challenges: (1) a merely consensus-based conceptualization of team satisfaction at the group level and (2) a neglect of multi-level effects. This limits our under-standing of team satisfaction and its influence on team performance because team mem-bers’ satisfaction does not always emerge as a uniform group-level construct. In this case, current theory cannot adequately explain the relationship between team satisfaction and team performance. In this conceptual paper, my co-authors and I develop a typology of different forms of team satisfaction (uniform, fragmented, deviate, and bimodal satisfac-tion), and introduce a multi-level framework that explains how these forms affect team performance within and across different levels of analysis. Based on our framework, we propose that the forms of team satisfaction affect emergent states, such as cohesiveness and trust climate, and team processes, such as cooperation and conflict resolution, that affect team performance beyond the effects of team members’ individual level of satisfac-tion. The paper contributes to current theory about team satisfaction and its relationship to team performance.
Study 2a focuses on a methodological problem concerning the measurement of job satis-faction. Although an economical and differentiated assessment of job satisfaction is im-portant for research and practice, German job satisfaction scales are often extensive or cannot differentiate between satisfaction facets. In order to fill this gap, I construct and validate a short questionnaire to assess general job satisfaction as well as satisfaction with
xiii

the work itself, coworkers, promotions, pay, and supervision. First, I derive a large item pool from different versions of the Job Descriptive Index (JDI) and its German equivalent Arbeitsbeschreibungsbogen (ABB). Second, based on data collected with an online survey (N = 217), I subsequently reduce the item pool to a 30-item short questionnaire. Finally, I cross-validate the short questionnaire with an independent sample (N = 377). Given its satisfactory psychometric properties, the new scales allow for a reliable, valid, and econo-mical measurement of job satisfaction and its facets in the German language.
Study 2b adapts these newly developed scales to the context of teams. Studies that assess satisfaction in the team context usually rely on ad-hoc measures that are not validated and difficult to compare across studies. To address this problem, Study 2b adapts the scales developed in Study 2a to the team context and validates them using the data from 202 team members working in 47 teams. Despite a small method bias due to reverse-coded items, the scales’ psychometric properties are satisfactory. The results further show that, in contrast to non-team contexts, satisfaction with the team members appears to be the most important facet of satisfaction as it exhibits the strongest relationships with performance-related criteria and overall satisfaction. In summary, the results suggest that the adapted scales provide for a reliable and valid measurement of satisfaction in the context of teams.
Study 3 addresses the emergence of job satisfaction in teams by examining homogeneity of satisfaction. Job satisfaction homogeneity is necessary for aggregating team members’ job satisfaction to the group level, and affects team-related outcomes such as social inte-gration, team cohesion, and absenteeism. However, our understanding of the processes that lead to shared satisfaction is limited. Based on affective events theory, I test compe-ting hypotheses about situational, dispositional, and social antecedents of satisfaction homo-geneity. Path analyses based on data from 415 team members working in 110 teams sug-gest that job satisfaction homogeneity primarily depends on characteristics of the working environment, and to a lesser extent on team members’ personality traits. Unlike earlier studies, the study finds no evidence that social interaction leads to agreement in job satis-faction. Additionally, the study partly replicates the finding that satisfaction homogeneity moderates the group-level satisfaction—team performance relationship.
Taken together, the studies comprising this dissertation contribute to three research domains — emergence, measurement, and consequences — of job satisfaction in teams. Concerning emergence, the studies comprising this dissertation present strong arguments and empirical evidence why satisfaction dispersion can occur in real-life teams, which marks a departure from the former emphasis on satisfaction as a shared group-level construct. In particular, whereas Study 1 argues that team satisfaction can emerge as a configural construct on the group-level in addition to uniform satisfaction, Study 3 analyzes the antecedents of satis-faction homogeneity. Concerning measurement, the results of Studies 2a and 2b provide valuable shortscales for future research and organizational practice that can be used to assess overall and facet-specific job satisfaction in team and non-team contexts. Given their individual-level nature, scale scores can be interpreted in cases without sufficient consensus and can be used for a variety of research questions at different levels of analy-sis. Finally, concerning consequences, this research emphasizes the importance of satisfac-tion facets and configurations for the relationship to team performance. Whereas Study 2b showed that facets of satisfaction are differently related to individual-level and group-level performance criteria, the theorizing of Study 1 and the findings of Study 3 build on and
xiv

advance prior studies that have shown that differences in jo satisfaction are meaningful in the team context. A further contribution of this dissertation lies in the development of a multi-level input-mediator-outcome framework which advances prior team effectiveness frameworks and connects to a wide range of research areas. Taken together, the theorizing and empirical findings of this dissertation show that a configural and multi-level concep-tualization is necessary to advance research on satisfaction in teams.
xv


Abstract (German)
Arbeitszufriedenheit ist die zentrale Einstellung gegenüber der Arbeit und zählt zu den wichtigsten Konstrukten in der Organisationspsychologie und der praktischen Personalar-beit. Traditionellerweise beschäftigte sich die Forschung mit der Arbeitszufriedenheit indi-vidueller Mitarbeiter. Der anhaltende Trend hin zu team-basierten Arbeitsformen führte jedoch zu einer Betonung der Arbeitszufriedenheit im Teamkontext. Zum einen wurde der Fokus auf Arbeitszufriedenheit als Konstrukt auf der Individualebene durch eine Gruppen-level-Perspektive ergänzt, die die Zufriedenheit von Teams beschreibt. Zum anderen erschien Team-Zufriedenheit, die Zufriedenheit mit dem Team, als eine spezifische (Sub-)Facette von Arbeitszufriedenheit auf der Forschungsagenda.
Obwohl die Forschung zu Arbeitszufriedenheit in Teams in der Vergangenheit große Fort-schritte verzeichnen konnte, sieht sie sich nach wie vor wichtigen Herausforderungen ge-genüber. Das Hauptproblem ist in der Konzeptionalisierung von Gruppen-Level-Zufrieden-heit ausschließlich als geteilte Eigenschaft des Teams und im Verzicht auf Mehr-Ebenen-Konzeptionen zu sehen. Die Möglichkeit, dass Exklusions- und Polarisierungsprozesse zu anderen als uniformen Zufriedenheitsverteilungen führen könnten, wird in der Regel nicht betrachtet. Ein weiteres Problem besteht darin, dass sich die Forschung insbesondere auf durchschnittliche oder summierte Zufriedenheit konzentriert, um den Zusammenhang von Zufriedenheit auf Gruppenebene und Teamleistung zu erklären. Mehr-Ebenen-Konzeptio-nen, die unterschiedliche Effekte auf Teamprozesse, Teameigenschaften und Teamleistung auf verschiedenen Analyseebenen beleuchten, werden nicht betrachtet. Schlussendlich ist das Fehlen validierter Messinstrumente zur Erfassung von Zufriedenheit in Teams zu kon-statieren. Forscher greifen daher häufig auf Ad-hoc-Maße, Ein-Item-Skalen oder adaptierte Skalen aus anderen Forschungskontexten zurück, was sowohl das Testen theoretischer Modelle als auch die Vorhersage und Verbesserung von Individual- und Gruppenleistung erschwert. Die Dissertation befasst sich mit diesen Herausforderungen in vier Studien.
In Studie 1 wird ein konzeptionelles Mehrebenen-Rahmenmodell von Arbeitszufriedenheit in Teams entwickelt. Das derzeitige Verständnis von Arbeitszufriedenheit in Teams und ihrem Zusammenhang zur Teamleistung ist durch zwei Probleme gekennzeichnet: (1) ein ausschließlich konsensbasiertes Konzept von Zufriedenheit auf Gruppenebene sowie (2) die Vernachlässigung von Mehrebenen-Effekten. Diese schränken das Verständnis von Zu-friedenheit auf Gruppenebene und ihrem Zusammenhang zur Teamleistung ein, da aus der Arbeitszufriedenheit einzelner Teammitglieder nicht immer geteilte Zufriedenheit entsteht. Da der Zusammenhang zwischen Zufriedenheit auf Gruppenebene und Teamleistung mit den derzeitigen Ansätzen nur unzureichend erklärt werden kann, entwickeln meine Koau-toren und ich in Studie 1 eine Typologie von Zufriedenheitsformen (uniforme, fragmen-tierte, abweichende und deviante Zufriedenheit), und stellen ein Mehrebenen-Rahmen-modell vor, das den Zusammenhang dieser Formen und Teamleistung innerhalb und zwi-schen verschiedenen Analyseebenen erklärt. Auf Basis des Rahmenmodells stellen wir dar, dass die Zufriedenheitsformen emergente Eigenschaften wie die Teamkohäsion und das Vertrauensklima sowie Teamprozesse wie Kooperation und Konfliktlösung beeinflussen. Diese wiederum beeinflussen die Teamleistung über die individuelle Zufriedenheit hinaus. Die Studie leistet einen Beitrag zur aktuellen Forschung zur Teamzufriedenheit und ihrem Zusammenhang zur Teamleistung.
xvii

Studie 2a befasst sich mit dem methodischen Problem der Messung von Arbeitszufrieden-heit. Obwohl eine ökonomische und differenzierte Erfassung von Arbeitszufriedenheit für Forschung und betriebliche Praxis von hoher Relevanz ist, sind deutschsprachige Messin-strumente meist sehr umfangreich oder nicht in der Lage, zwischen Zufriedenheitsfacetten zu differenzieren. Vor diesem Hintergrund besteht das Ziel des Beitrags darin, einen Kurz-fragebogen zu entwickeln und zu validieren, mit dem sich die Gesamtzufriedenheit sowie die Zufriedenheit mit den Tätigkeiten, Kolleginnen und Kollegen, Entwicklungsmöglichkei-ten, der Bezahlung und der/dem Vorgesetzten messen lassen. Hierfür wird zunächst auf Basis verschiedener Versionen des Job Descriptive Index (JDI) und des Arbeitsbeschrei-bungsbogens (ABB) ein umfangreicher Itempool abgeleitet. Dieser wird anschließend mit Daten einer Onlinebefragung (N = 217) zu einem 30 Items umfassenden Kurzfragebogen verdichtet. Der neu entwickelte Kurzfragebogen wird schlussendlich an einer zweiten, un-abhängigen Stichprobe (N = 377) kreuzvalidiert. Die Ergebnisse der Studie zeigen, dass das neu entwickelte Verfahren in der Lage ist, Arbeitszufriedenheit und ihre Facetten re-liabel, valide und ökonomisch zu messen.
In Studie 2b werden die neu entwickelten Skalen auf den Teamkontext adaptiert. Frühere Studien nutzten in der Regel Ad-hoc-Maße, die nicht sorgfältig entwickelt und validiert sind, häufig keine Differenzierung von Zufriedenheitsfacetten zulassen und deren Messer-gebnisse sich nur eingeschränkt zwischen Studien vergleichen lassen. An den Items und Vignetten der in Studie 2a entwickelten Skalen wurden daher linguistische Anpassungen vorgenommen und die adaptieren Skalen anschließend mit Daten von 202 Teammitglie-dern aus 47 Teams validiert. Die Ergebnisse zeigen, dass die psychometrische Qualität der Items und Skalen, abgesehen von einem schwachen Methoden-Bias aufgrund negativ ko-dierter Items, solide und vergleichbar zu der der Original-Skalen ist. Darüber hinaus of-fenbart die Studie Unterschiede zur Arbeitszufriedenheit in Nicht-Team-Kontexten. Insbe-sondere zeigen die Ergebnisse, dass die Zufriedenheit mit den Tätigkeiten nur eine unter-geordnete Rolle für die Gesamtzufriedenheit sowie für individuelle und teambezogene Leistungsmaße spielt. Insgesamt deuten die Ergebnisse darauf hin, dass die adaptierten Skalen eine zuverlässige und valide Messung von Arbeitszufriedenheit im Teamkontext ermöglichen.
Studie 3 befasst sich mit der Emergenz von Arbeitszufriedenheit in Teams, insbesondere mit ihrer Homogenität. Zufriedenheitshomogenität ist eine wichtige Grundvoraussetzung, um individuelle Zufriedenheitsurteile zu einem Gruppenkonstrukt zu aggregieren und wirkt sich auf verschiedene Teammaße, wie z.B. soziale Integration, Kohäsion und Absen-tismus aus. Die Prozesse, die eine geteilte Zufriedenheitsstruktur begünstigen, sind jedoch noch weitgehend unklar. Auf Basis der Theorie affektiver Ereignisse werden in dieser Studie alternative Hypothesen zu situativen, dispositionalen und sozialen Einflussfaktoren auf Zufriedenheitshomogenität getestet. Pfadanalysen (n = 415 Teammitglieder; N = 110 Teams) zeigen, dass Zufriedenheitshomogenität primär von der Arbeitsumgebung und zu einem geringeren Ausmaß von Persönlichkeitsmerkmalen der Teammitglieder abhängt. Im Gegensatz zu früheren Studien konnten keine Effekte sozialer Interaktion auf Zufrieden-heitshomogenität nachgewiesen werden. Zudem werden frühere Untersuchungen teilweise repliziert, die zeigen konnten, dass Zufriedenheitshomogenität den Zusammenhang zwi-schen Zufriedenheit auf Gruppenebene und Teamleistung moderiert.
xviii

Im Zusammenhang leisten die vier Studien dieser Dissertation Beiträge zu den Forschungs-bereichen Emergenz, Messung und Konsequenzen von Zufriedenheit in Teams. Bezüglich der Emergenz auf Gruppenebene liefern die zusammengefassten Ergebnisse sowohl theore-tische Argumente als auch empirische Evidenz, wieso Zufriedenheit in Teams unterschied-lich verteilt sein kann und stellt damit eine Abkehr vom vorherrschenden Fokus auf geteilte Zufriedenheit dar. Während Studie 1 postuliert, dass sich Teamzufriedenheit nicht nur zu einer uniformen, sondern auch zu einer konfiguralen Eigenschaft auf Gruppenebene ent-wickeln kann, untersucht Studie 3 die Emergenz zu einem geteilten bzw. uniformen Grup-penkonstrukt. Bezüglich der Messung von Zufriedenheit liefern die Ergebnisse von Studien 2a und 2b wertvolle Kurzskalen für die Forschung und Praxis, die zur Erfassung von all-gemeiner und facettenspezifischer Zufriedenheit sowohl im Teamkontext als auch in ande-ren Kontexten genutzt werden können. Da die Skalen die Zufriedenheit auf der Individual-Ebene erfassen, lassen sich die Messergebnisse auch ohne hinreichende Übereinstimmung im Team interpretieren und sind daher für verschiedene Forschungsfragen auf verschiedenen Analyse-Ebenen nutzbar. Bezüglich der Konsequenzen von Zufriedenheit verdeutlichen die Ergebnisse die Wichtigkeit von Zufriedenheitsfacetten und -konfigurationen für den Zu-sammenhang zur Teamleistung. Während Studie 2b zeigen konnte, dass sich unterschied-liche Facetten von Zufriedenheit in unterschiedlichem Maße auf gruppenbezogene Leis-tungsmaße auswirken, verdeutlichen die Befunde aus Studien 1 und 3 die Relevanz von Zufriedenheitsdifferenzen im Teamkontext. Die Dissertation leistet einen weiteren Beitrag in Form der Entwicklung eines Mehrebenen-Rahmenmodells, das in Studie 1 vorgestellt wird. Das neue Rahmenmodell stellt eine Weiterentwicklung vorheriger Rahmenmodelle zur Teameffektivität dar und ist an verschiedene Forschungsbereiche anschlussfähig. In ihrer Gesamtheit zeigen die theoretischen und empirischen Befunde dieser Dissertation, dass eine konfigurale Mehrebenenkonzeption nötig ist, um die Forschung zur Arbeitszu-friedenheit in Teams weiterzuentwickeln.
xix


1 Job Satisfaction in Teams: New Challenges for a Classic Construct
1.1 Relevance of the Topic
How people think and feel about their work has been attracting the attention of researchers and practitioners for decades (Judge, Weiss, Kammeyer-Mueller, & Hulin, 2017; Hoppock, 1935). Given that work has such a strong impact on our everyday life and identity, job satisfaction might be one of the “most important attitudes people ever hold” (Dalal, 2005, p. 341). As it set the stage for the Human Relations movement, job satisfaction can even be regarded the founding construct of organizational psychology itself. That said, research on job satisfaction was only to a limited extent motivated by ethical considerations of well-being and a fulfilled work life. Researchers and practitioners were rather interested in job satisfaction as a means to improve job performance, which has been referred to as the Holy Grail of organizational behavior (Landy, 1989). In this line of research, job satisfac-tion has proven to be substantially related to job performance (Judge & Kammeyer-Mueller, 2012) and to a wide range of other performance-related outcomes, such as motivation, citizenship behaviors, lateness, and turnover intention (Kinicki, McKee-Ryan, Schriesheim, & Carson, 2002). Nevertheless, some authors also regarded job satisfaction as an outcome variable similar to performance, indicating that job satisfaction is desirable in and of itself (e.g., Geister, 2006; Rockmann & Northcraft, 2010).
From the very beginning, job satisfaction research has focused not only on the work itself, but also on the social fabric in which the work takes place. Virtually all theories of work motivation and job satisfaction recognized that the working environment and social re-lationships with coworkers and supervisors have a sizeable impact on an individual’s satis-faction. The ongoing shift from individual to team-based organization of work (cf. Kozlowski & Bell, 2003) underlines and reinforces this rationale. The trend towards team-based working left a mark on the research landscape, as more and more scholars now focus on satisfaction within the context of teams.
This focus entails new challenges and questions for research: How can we conceptualize satisfaction in teams? How does satisfaction emerge as a higher-level construct? How does satisfaction affect performance of team members and the team as a whole when some members are less satisfied than others? Answering these questions will improve our theo-retical understanding of satisfaction in teams and also holds great potential for improving team management practices and work routines. Because most organizations carry out em-ployee surveys on a regular basis, data on job satisfaction is abounding. However, without adequate theory to understand, critically examine, and interpret survey results, the useful-ness of these data is severely limited. The more profound our understanding of satisfaction in teams, the better we are able to foresee difficulties, such as absenteeism and turnover, and to derive measures suitable for maintaining and improving performance of individuals and teams.
1

1.2 Research Objectives
Given job satisfaction’s long research history and the ubiquity of team-based working in modern organizations, it is not surprising that satisfaction in teams captured researchers’ attention. Mirroring the traditional research agenda of individual satisfaction, the main focus of this line of research lies in exploring the relationship between satisfaction as a group-level construct and team performance. Although this relationship has already been established (Harter, Schmidt, & Hayes, 2002; Whitman, van Rooy, & Viswesvaran, 2010), research in this domain still faces strong challenges.
The main challenge is that research on satisfaction in teams has not kept pace with the advancements team research has made in the last decade. In particular, whereas research in the 2000s largely focused on uniform, single-level conceptualizations of teams (Mathieu, Maynard, Rapp, & Gilson, 2008), more recent team research acknowledges that teams are multi-level phenomena in which individuals dynamically interact and organize to achieve personal, social, and organizational goals (E. R. Crawford & LePine, 2013; Humphrey & Aime, 2014). Research on satisfaction in teams, however, is still characterized by a focus on collective, aggregated constructs and assumptions of within-team homogeneity. Although studies have long since shown that team members not always experience the same level of satisfaction (e.g., Hausknecht, Hiller, & Vance, 2008; Li, Li, & Wang, 2009), most authors continue to view group-level satisfaction as a shared, uniform construct at the group level that is essentially the sum of its parts. In doing so, they neglect that differences in working conditions, or interpersonal processes such as exclusion and polarization, might lead to non-uniform satisfaction patterns that are potentially relevant for team collaboration. The collectivist approach to satisfaction in teams is also evident in research on the group-level satisfaction—team performance relationship in which aggregate satisfaction is used to predict aggregate performance measures (Whitman et al., 2010). That is, the current literature does not consider that satisfaction at different levels of analysis can have diffe-rent effects on affects, cognitions, behaviors, and performance of individuals and teams.
In accordance with current team research, the main premise of this dissertation is that satisfaction in teams requires a more complex theoretical foundation that involves confi-gural and multi-level conceptualizations of satisfaction and its consequences. Specifically, I challenge the widely-held assumption that satisfaction always emerges as a uniform team attitude at the group level. Throughout this dissertation, I not only argue why and how group-level satisfaction emerges as a configural construct, but also empirically examine why some teams have uniform and others non-uniform distributions of satisfaction. In contrast to the prevailing single-level view on satisfaction, I propose a multi-level team effectiveness framework that explains how satisfaction of individual members and the team as a whole interactively affect team functioning within and across levels of analysis.
In order to test theoretical models and to predict and improve performance of individuals and teams, researchers and practitioners need reliable and validated satisfaction scales. However, validated scales to assess satisfaction in teams are scarce. For this reason, prior research had to rely either on non-validated ad-hoc measures (e.g., B. West, Patera, & Carsten, 2009), on scales that were adapted from different research contexts (e.g., Costa, 2003), and on single-item measures (e.g., Mohr, Young, Meterko, Stolzmann, & White,
2

2011), all of which are unsatisfactory. To overcome this obstacle, I develop a series of short scales to assess facet-specific and overall satisfaction in team and non-team contexts.
Taken together, the objective of this dissertation is to develop a multi-level theory of emer-gence and consequences of job satisfaction in teams. To achieve this objective, I conduct a series of four studies in which I address the challenges described above. In particular, I (1) develop a conceptual multi-level framework that explains how the satisfaction of individuals and teams relates to affects, cognitions, behaviors, and performance of individuals and teams, (2) examine the emergence of satisfaction as a shared and configural group-level construct, and (3) develop and validate short scales to measure satisfaction in teams.
1.3 Structure of the Dissertation
This dissertation is structured as follows: The second chapter is concerned with the con-ceptual foundations of the constructs and topics addressed in this dissertation. In particu-lar, it considers the two main topics: job satisfaction and teams. In doing so, this chapter presents definitions of the constructs, and outlines different conceptual approaches and streams in the respective literatures.
In Chapter 3, I review and summarize prior research on satisfaction in teams: I present different conceptualizations of satisfaction in teams found throughout the literature, and review prior research on the emergence of satisfaction as well as research on the conse-quences of satisfaction in teams. Building on this review, I identify and highlight gaps in the literature that I consider in the four studies encompassing this dissertation. The chap-ter closes with an overview of how the four studies are connected and how they integrate into the overall research question.
Chapters 4 to 7 contain the four studies. In Chapter 8, I summarize and discuss the findings of the four studies. This chapter also highlights strengths and limitations of the overall research program and derives implications of the overall results for research, methodology, and managerial practice.
3


2 Conceptual Foundations
This chapter lays out the conceptual foundations of relevant terms and concepts referred to throughout this dissertation. First, I discuss the central construct of this dissertation, job satisfaction, by briefly presenting seminal definitions, reviewing different conceptualizati-ons and measures, and commenting on its relevancy for organizations, the economy, and employees. In the second part of this chapter, I review definitions of teams and workgroups, as well as approaches and classifications for teams and teamwork processes. In closing, I briefly explain the concept of emergence.
2.1 Job Satisfaction
Job satisfaction is among the most prominent and well-researched constructs in organiza-tional psychology (Spector, 1997). Since it first appeared on the research agenda in the 1930s (Hoppock, 1935), there has been an overwhelmingly large body of research con-cerned with the concept, antecedents, and consequences of job satisfaction. A search for “job satisfaction” in the scientific search engine Google Scholar reveals over 27,000 published articles in the year 2016 alone. Because a thorough review of this literature is beyond the scope of this dissertation, and good reviews exist elsewhere (e.g., Judge & Kammeyer-Mueller, 2012; Locke, 1969; Spector, 1997), this section gives a brief overview of seminal definitions, conceptual approaches, measurement, and consequences of job satisfaction.
2.1.1 Definition
As the words job and satisfaction are both colloquial terms, defining job satisfaction appears to be straightforward. However, a consensual definition is lacking. The term job satisfaction is a compound consisting of the two elements job and satisfaction, both of which have some level of ambiguousness to them. To work towards a definition, we look at both ele-ments separately.
The term job denotes what the satisfaction refers to. It entails different levels of abstraction that can be brought in a hierarchical relationship (Judge & Kammeyer-Mueller, 2012): At the highest level of abstraction, satisfaction refers to the job in general and is, hence, often denoted as general or overall job satisfaction. At lower levels of abstraction, satisfaction refers to specific domains of work that are often referred to as facets of satisfaction. The most commonly considered facets of satisfaction are the ones assessed in the Job Descrip-tive Index (P. Smith, Kendall, & Hulin, 1969), namely satisfaction with pay, promotion, supervisors, colleagues, and the work itself (see Figure 1). These facets, in turn, can be further divided into subfacets. For instance, pay satisfaction can be subdivided into satis-faction with pay level, benefits, pay raises, and structure and administration (Heneman III & Schwab, 1985). In a meta-analysis, Roedenbeck (2008) identified no less than 59 facets of satisfaction that have been discussed in research.
5

In applied settings, researchers and practitioners select satisfaction facets and the level of abstraction depending on the research question or the objective of the survey. According to the principle of compatibility, the more similar attitudes and behaviors are in terms of action, target, context, and time elements, the stronger their association (Ajzen, 2011). Conse-quently, if one wants to predict absenteeism in team meetings (i.e., a behavior), satisfaction with meetings (i.e., an attitude) will be a better predictor than general job satisfaction (Rogelberg, Allen, Shanock, Scott, & Shuffler, 2010).
Figure 1. Hierarchical structure of job satisfaction. Satisfaction facets depicted in this figure are ex-emplary and not exhaustive.
As for the term satisfaction, authors disagree whether it refers to an affective state, such as a mood or an emotion, or to an attitude. Many authors view satisfaction as a purely affec-tive construct. For instance, Locke (1969, p. 316), defines job satisfaction as a “pleasurable emotional state resulting from the appraisal of one’s job as achieving or facilitating one’s job values”, a definition that is still very common to this day (e.g., García-Chas, Neira-Fontela, & Varela-Neira, 2016; Zablah, Carlson, Donavan, Maxham III, & Brown, 2016). Likewise, job satisfaction has been defined as an “affective attachment to the job” (Tett & Meyer, 1993, p. 261) and “an affective (i.e., emotional) reaction to one’s job” (Cranny, Smith, & Stone 1992, p. 1).
Disagreeing with this view, other authors (e.g., Brief, 1998; H. Weiss, 2002) conceptualize job satisfaction as an attitude towards the job. H. Weiss (2002, p. 175) defines job satisfac-tion as “a positive (or negative) evaluative judgment one makes about one’s job or job situation”. Because attitudes are “psychological tendencies that are expressed by evalua-ting a particular entity with some degree of favor or disfavor” (Eagly & Chaiken, 1993, p. 1), job satisfaction can also be described as an evaluation of the job.
General / Overall Satisfaction
Colleagues Work Pay Supervisors Promotions
Level Raises Benefits Structure / Administration
Facets included in the JDI (P. Smith, Kendall, & Hulin, 1969)
Facets of pay satisfaction(Heneman III & Schwab, 1985)
6

The attitudinal and affective views on job satisfaction are not mutually exclusive, because attitudes can be influenced by moods and emotions. Therefore, the attitudinal view recognizes job affect as an antecedent of job satisfaction. This line of reasoning is reflected in affective events theory (H. Weiss & Cropanzano, 1996), which I briefly review below and in more detail in Chapter 7. Depending on the specific facet, satisfaction is more based on affect or on cognition (van den Berg, Manstead, van der Pligt, & Wigboldus, 2006). For instance, satisfaction with the working conditions is more based on objective assessments and nor-mative-actual value comparisons (i.e., cognition) while satisfaction with the coworkers is more based on liking and personal sympathy (i.e., affect).
In the course of this dissertation, I follow the satisfaction-as-attitude approach. The reason for doing so is that prior research provided compelling evidence that affective states and attitudes are distinct constructs that are discernible theoretically and empirically (for a review, see H. Weiss, 2002). Furthermore, measures of job satisfaction almost exclusively assess evaluative judgements of the job by using rating scales that range from bad to good (cf. Chapter 2.1.3). In this research, job and facet satisfaction will be understood according to the following definitions:
Job satisfaction is as an evaluative judgment individuals make of their job.
Facet satisfaction is an evaluative judgment individuals make of specific aspects of their job.
These definitions slightly differ from earlier ones: First, prior authors often defined job satisfaction as satisfaction with the job and/or job aspects. For example, Spector (1997, p. 2) defined job satisfaction as “how people feel about their job and different aspects of their jobs”. However, because the job and specific job aspects are not the same thing, job satis-faction and facet satisfaction are evaluations of different entities and should not be viewed as the same construct. Therefore, the definitions offered here account for the fact that job satisfaction and facet satisfaction are distinct constructs that refer to distinct attitudinal targets. Second, as this research is concerned with levels-of-analysis issues, the definitions emphasize that satisfaction is a construct at the individual level of analysis.
2.1.2 Conceptual Approaches to Job Satisfaction
In about eight decades of research, a wide variety of different approaches and concepts of job satisfaction has been proposed. These approaches can be broadly organized along two dimensions (see Table 1): The first dimension addresses the antecedents of satisfaction and distinguishes environmental, social, and dispositional influences. The second dimension is concerned with the distinction between cognitive and affective sources of satisfaction that emerged in the mid 90s with H. Weiss and Cropanzano’s (1996) seminal article on affec-tive events theory. The following section gives a concise overview of prior research on job satisfaction along this two-dimensional classification scheme.
7

Table 1Two-Dimensional Classification Scheme of Approaches to Job Satisfaction
Early research on job satisfaction largely focused on cognitive approaches. These approaches all employ some kind of “cognitive algebra” in which perceived job features, such as pay, promotions, and supervision, are compared to expected or ideal levels of these features. For instance, expectancy-value models (e.g., Mitchell, 1974; Vroom, 1964) used mathema-tical formulae to calculate work motivation based on the valence of expected outcomes and the probability of attaining these outcomes. Building on the works of Maslow (1943), Porter (1961, 1962) conceptualized job satisfaction as the degree of perceived need deficiency. According to Porter, the difference between actual and desired need fulfillment, weighted by the need importance, indicates job satisfaction or dissatisfaction. Finally, equity theory (Adams, 1966) states that individuals derive their satisfaction not only from absolute levels of what they have (e.g., pay or autonomy), but also from what they have in relation to others. That is, team members compare their working characteristics with those of their coworkers. If this comparison turns out to be incongruent, the employee experiences injus-tice and will be dissatisfied.
In their social information processing (SIP) approach, Salancik and Pfeffer (1978) point out that job attitudes depend not only on characteristics of the working environment, but also on the workers’ social context, such as their coworkers, peers, and supervisors. According to the SIP approach, social information affects perceptions of the working environment by guiding attention to specific (positive or negative) aspects of the environment, thereby influencing job satisfaction. Social information also has a normative function by providing a frame of reference that is resorted to when comparing actual and ideal work features.
It was only after some studies (e.g., Staw, Bell, & Clausen, 1986; Staw & Ross, 1985) de-monstrated intra-individual stability of job satisfaction that dispositional influences on satisfaction appeared on the research agenda. The most notable dispositional influence on the cognitive route are core self-evaluations (CSEs; Judge, Locke, Durham, & Kluger, 1998),
Routes to job satisfaction / underlying processes
Antecedents Cognitive route Affective route
Environmental influences
Expectancy-value-models (Mitchell, 1974; Vroom, 1964)
Need satisfaction (Porter, 1962) Equity theory (Adams, 1966)
Affective events elicited by the working environment (H. Weiss & Cropanzano, 1996)
Social influences Social information processing (Salancik & Pfeffer, 1978)
Affective events elicited by colleagues and supervisors (H. Weiss & Cropanzano, 1996; Dasborough, 2006; Dimotakis, Scott, & Koopman, 2011)
Dispositional influences
Core self-evaluations (Judge, Bono, & Locke, 2000; Srivastava, Locke, Judge, & Adams, 2010)
Positive and negative affectivity (Connolly & Viswesvaran, 1999; Thoresen, Kaplan, Barsky, Warren, & de Chermont, 2003)
8

a broad construct that entails the personality traits self-esteem, locus of control, self-efficacy, and neuroticism. CSEs affect job satisfaction by influencing how employees perceive their working environment (Judge et al. 2000; Srivastava et al., 2010). Specifically, employees with high levels of CSEs perceive their jobs more positively than employees with low levels of CSEs because they focus on the positive aspects of their working environment, feel more in control, and see their work as more challenging and intrinsically motivating (Judge et al., 1998).
Affective approaches emphasize the role of moods and emotions at work. The most influen-tial theory in this domain is affective events theory (AET; H. Weiss & Cropanzano, 1996). The theory considers all three types of antecedents (i.e., environmental, social, and dispo-sitional) but focuses on their affective rather than cognitive underpinnings. In particular, the theory proposes that the working environment affects job satisfaction by making certain affective events more likely to happen. A job with high workload and time pressure, for instance, will often trigger stressful events which can, in turn, evoke negative emotional reactions and, eventually, dissatisfaction.
In keeping with affective events theory, the social context also affects employee’s moods and emotions in the workplace (Basch & Fisher, 2000). On the one hand, social interac-tions, such as conflicts or mutual support among coworkers, can be viewed as affective events that influence job satisfaction (Dimotakis et al., 2011). Similarly, leader behaviors, such as assigning unpleasant tasks and giving performance feedback, also affect subordi-nates’ moods and emotions (Belschak & Den Hartog, 2009; Dasborough, 2006). On the other hand, the social context regulates employees’ affect by emotional transfer processes (Barsade & Gibson, 2012) and by providing norms for emotional expression (Kelly & Barsade, 2001).
Finally, the most notable dispositional influence on the affective route is positive and nega-tive affectivity (PA and NA; Connolly & Viswesvaran, 1999; Thoresen et al., 2003). An ex-planation for the effects of PA and NA on job satisfaction is that they moderate the rela-tionship between affective events and affective reactions. Employees high in negative affectivity are more susceptible to experiencing negative emotions in response to negative events and have a higher threshold for experiencing positive emotions in response to posi-tive events (Brief, Butcher, & Roberson, 1995; H. Weiss & Cropanzano, 1996). Conversely, employees high in PA are more sensitive to positive events (Shaw, Duffy, Mitra, Lockhart, & Bowler, 2003) and more resistant to stress (Gloria, Faulk, & Steinhardt, 2013).
2.1.3 Measurement
In over eighty years of job satisfaction research, a multitude of measures and scales has accumulated that differ in conceptual approaches to satisfaction, answering formats, con-sidered satisfaction facets, and length. Table 2 gives a concise overview over common job satisfaction scales and measures.
9

Table 2Overview of Common Job Satisfaction Scales and Measures
Scale name Target(s) Number of items Authors
Job Descriptive Index (JDI) Work, colleagues, pay, promotions, supervision 72 (long) / 30 (abridged) P. Smith et al. (1969); Balzer et al. (1997)
Job in General Scale (JIG) Overall satisfaction 18 (long) / 8 (abridged) Ironson, Smith, Brannick, Gibson, & Paul (1989); Stanton et al. (2001)
Job Satisfaction Survey (JSS) Overall satisfaction 36 Spector (1985)
Brief Index of Affective Job Satisfaction (BIAJS)
Overall satisfaction 4 (+ 3 distracter items) Thompson & Phua (2012)
Minnesota Satisfaction Questionnaire (MSQ)
Ability utilization, achievement, activity, advancement, authority, company, compensation, co-workers, creativity, independence, moral values, recognition, responsibility, security, social service, social status, supervision–human relations, supervision–technical, variety, working conditions
100 (long) / 20 (abridged) D. Weiss, Dawis, England, & Lofquist (1967)
Porter Need Satisfaction Questionnaire (PNSQ)
Security needs, social needs, esteem needs, autonomy needs, self-actualization needs
2 x 13 (actual and desired level of need fulfillment)
Porter (1961)
Single items Overall satisfaction or facets 1 e.g., G. G. Fisher, Matthews, & Gibbons (2015); Kunin (1955)
10
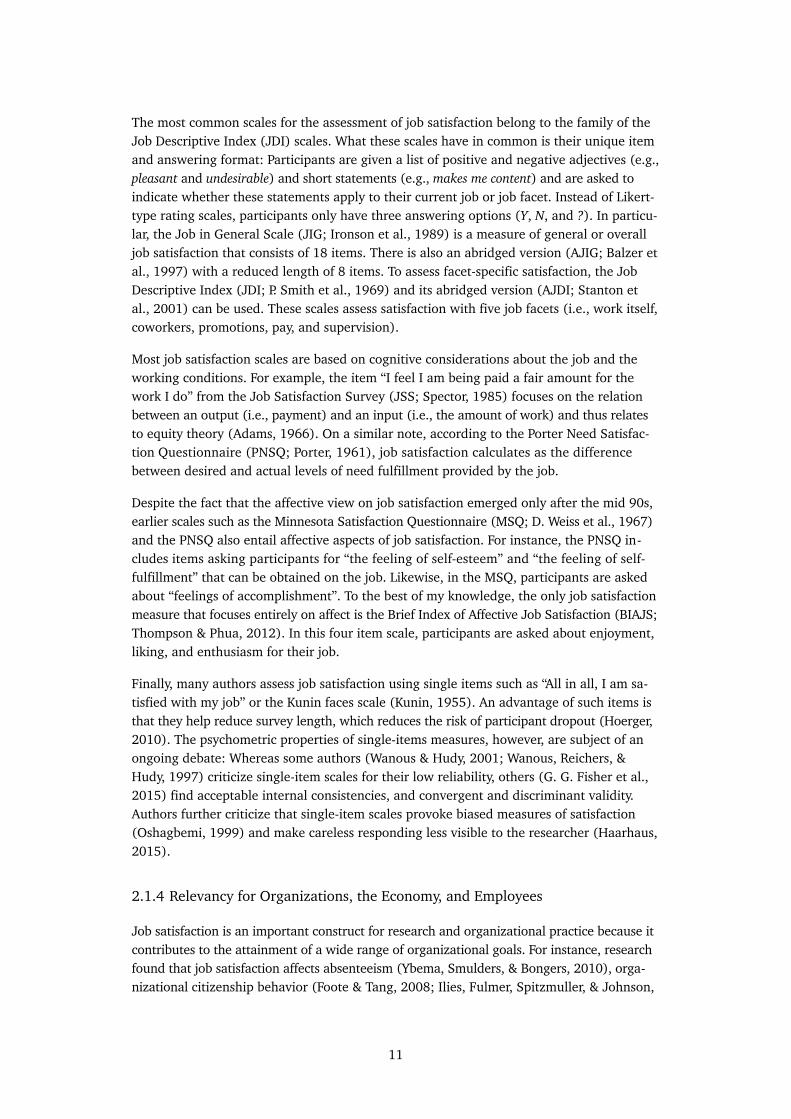
The most common scales for the assessment of job satisfaction belong to the family of the Job Descriptive Index (JDI) scales. What these scales have in common is their unique item and answering format: Participants are given a list of positive and negative adjectives (e.g., pleasant and undesirable) and short statements (e.g., makes me content) and are asked to indicate whether these statements apply to their current job or job facet. Instead of Likert-type rating scales, participants only have three answering options (Y, N, and ?). In particu-lar, the Job in General Scale (JIG; Ironson et al., 1989) is a measure of general or overall job satisfaction that consists of 18 items. There is also an abridged version (AJIG; Balzer et al., 1997) with a reduced length of 8 items. To assess facet-specific satisfaction, the Job Descriptive Index (JDI; P. Smith et al., 1969) and its abridged version (AJDI; Stanton et al., 2001) can be used. These scales assess satisfaction with five job facets (i.e., work itself, coworkers, promotions, pay, and supervision).
Most job satisfaction scales are based on cognitive considerations about the job and the working conditions. For example, the item “I feel I am being paid a fair amount for the work I do” from the Job Satisfaction Survey (JSS; Spector, 1985) focuses on the relation between an output (i.e., payment) and an input (i.e., the amount of work) and thus relates to equity theory (Adams, 1966). On a similar note, according to the Porter Need Satisfac-tion Questionnaire (PNSQ; Porter, 1961), job satisfaction calculates as the difference between desired and actual levels of need fulfillment provided by the job.
Despite the fact that the affective view on job satisfaction emerged only after the mid 90s, earlier scales such as the Minnesota Satisfaction Questionnaire (MSQ; D. Weiss et al., 1967) and the PNSQ also entail affective aspects of job satisfaction. For instance, the PNSQ in-cludes items asking participants for “the feeling of self-esteem” and “the feeling of self-fulfillment” that can be obtained on the job. Likewise, in the MSQ, participants are asked about “feelings of accomplishment”. To the best of my knowledge, the only job satisfaction measure that focuses entirely on affect is the Brief Index of Affective Job Satisfaction (BIAJS; Thompson & Phua, 2012). In this four item scale, participants are asked about enjoyment, liking, and enthusiasm for their job.
Finally, many authors assess job satisfaction using single items such as “All in all, I am sa-tisfied with my job” or the Kunin faces scale (Kunin, 1955). An advantage of such items is that they help reduce survey length, which reduces the risk of participant dropout (Hoerger, 2010). The psychometric properties of single-items measures, however, are subject of an ongoing debate: Whereas some authors (Wanous & Hudy, 2001; Wanous, Reichers, & Hudy, 1997) criticize single-item scales for their low reliability, others (G. G. Fisher et al., 2015) find acceptable internal consistencies, and convergent and discriminant validity. Authors further criticize that single-item scales provoke biased measures of satisfaction (Oshagbemi, 1999) and make careless responding less visible to the researcher (Haarhaus, 2015).
2.1.4 Relevancy for Organizations, the Economy, and Employees
Job satisfaction is an important construct for research and organizational practice because it contributes to the attainment of a wide range of organizational goals. For instance, research found that job satisfaction affects absenteeism (Ybema, Smulders, & Bongers, 2010), orga-nizational citizenship behavior (Foote & Tang, 2008; Ilies, Fulmer, Spitzmuller, & Johnson,
11

2009), turnover intentions (Wright & Bonett, 2007), organizational innovation (Shipton, West, Parkes, Dawson, & Patterson, 2006), firm value (Edmans, 2012), and job perfor-mance (Judge, Thoresen, Bono, & Patton, 2001; Kinicki et al., 2002; Riketta, 2008).
Over and above these effects, job satisfaction also has indirect and long-term consequences for organizations. Because dissatisfied employees might put the organization’s reputation as an employer (i.e., its employer brand) at risk (Helm, 2013), organizations are induced to maintain the staff’s job satisfaction to attract and retain prospective job applicants. In-deed, a meta-analysis found that the organization’s image is among the most potent predictors of job attractiveness and job pursuit intentions (Chapman, Uggerslev, Carroll, Piasentin, & Jones, 2005). On internet platforms such as kununu, jobvote, or glassdoor, current and former employees can publicly review and evaluate companies, giving their evaluation a wide audience. This development is also reflected in the fact that companies created satisfaction metrics based on the willingness to recommend the company as a place to work (Davenport, Harris, & Shapiro, 2010).
There is also an economic dimension to job satisfaction. In a meta-analysis, job satisfaction was associated with mental and physical health issues, most notably burnout, depression, anxiety, and reduced self-esteem (Faragher, Cass, & Cooper, 2005). On a larger scale, this makes low job satisfaction a burden to the public health care system that can cause severe economic damage.
By focusing on the consequences for organizations, most research on job satisfaction takes a utilitarian perspective. However, job satisfaction is, not least, also vital for employees themselves. What is often overlooked in light of the organizational and economic viewpoints is that satisfaction is an important value in and of itself. Because people spend most of their waking time working, how satisfied one is with his or her job affects life satisfaction (Judge & Watanabe, 1993; Tait, Youtz Padgett, & Baldwin, 1989) and is considered a key factor for happiness (C. D. Fisher, 2010) and subjective well-being (Diener, Suh, Lucas, & Smith, 1999).
2.2 Teams and Workgroups
For decades, team-based working has been a cornerstone for organizations and is omni-present in the organizational literature (Mathieu, Tannenbaum, Donsbach, & Alliger, 2014; van Hootegem, Benders, Delarue, & Procter, 2005). An international survey among almost 1,000 companies revealed that team-based working is among the most common manufac-turing practices in Japan, Australia, Switzerland, and the United Kingdom (Clegg et al., 2002). There are several reasons for this development: By relying on teams, companies aim to produce innovative products and services that help them to react to increasingly competitive environments (Stark & Bierly, 2009). Team-based working also enhances em-ployee autonomy and participation (Rasmussen & Jeppesen, 2006), contributes to higher performance and satisfaction (Mayer & Dale, 2010), and can increase the quality of deci-sions (Mesmer-Magnus & Dechurch, 2009).
12

This section gives an overview of relevant definitions for teams and workgroups, presents different approaches for classifying teams and teamwork, and reviews the concepts of teamwork processes and emergence.
2.2.1 Definition and Nomenclature
Despite team-based working being ubiquitous in modern organizations, there is yet no agreed-upon definition for teams and workgroups. Some exemplary definitions include “a small group of individuals who share responsibility for outcomes for their organizations” (Sundstrom, De Meuse, & Futrell, 1990, p. 120) and “two or more people interacting to achieve an objective” (Lussier, 1990, p. 314). In summarizing these and other definitions, Kozlowski and Bell (2003) point out that most definitions share a set of common charac-teristics. According to these authors (2003, p. 334), work teams and groups
(a) are composed of two or more individuals, (b) who exist to perform orga-nizationally relevant tasks, (c) share one or more common goals, (d) interact socially, (e) exhibit task interdependencies (i.e., workflow, goals, outcomes), (f) maintain and manage boundaries, and (g) are embedded in an orga-nizational context that sets boundaries, constrains the team, and influences exchanges with other units in the broader entity.
Although this and similar component definitions are prevalent in team research, Humphrey and Aime (2014) raise concerns about whether they are still useful for analyzing teams in modern working environments. In particular, these definitions place little emphasis on the self-organizing, microdynamic aspect of contemporary teamwork, and neglect that teams may not have clear boundaries (Mortensen & Hinds, 2002), may span multiple organizations, or may not be embedded in any organization (Hertel, Niedner, & Herrmann, 2003). There-fore, Humphrey and Aime (2014, p. 450) offer a — somewhat bulky — definition of teams, according to which
[t]eams are assemblies of interdependent relations and activities organizing shifting sets or subsets of participants embedded in and relevant to wider resource and institutional environments.
In accordance with the developments of team-based working, the above definition focuses less on the team as a collective, but more on the individuals constituting it. It is also more encompassing than the prior component definitions as it neither presupposes fixed team boundaries nor an organizational context. Given that this approach is more compatible with the configural multi-level perspective that this research pursues, I take this definition as a basis when referring to teams throughout this dissertation.
Some authors differentiate between teams and workgroups. For Katzenbach and Smith (1993), a workgroup is the first stage of team development in which the team members’ individual contributions are simply added together without the need to coordinate and cooperate. Only after a common purpose, a shared goal, and mutual accountability have developed, the workgroup can become a “real team” (Katzenbach & Smith, 1993, p. 85). In the course of this thesis, however, I do not concur with this differentiation and use the terms team and workgroup interchangeably.
13

Definitions also vary in the number of members that form a team. The minimum number of team members mostly varies between two and three members. In some contexts, a minimum number of three members is chosen because some team phenomena, such as ingroup/outgroup separation and the emergence of subgroups, cannot be observed in groups with only two members. Although most definitions of teams do not state a maxi-mum number of team members, most authors assume a maximum number of 10 to 15 members when they speak of teams (M. West, 2012). Because team size is a continuous variable, classifications and cut-off values are by and large arbitrary. For example, Salas et al. (2008) distinguish between small teams with two members, medium-sized teams with three to five members, and large teams with more than five members.
2.2.2 Classifying Teams and Teamwork
In order to generalize research findings, researchers need classification schemes to pinpoint to what kinds of teams and tasks their results apply and can be generalized to. Unfortu-nately, there has been a multitude of different terms and taxonomies without real consen-sus. A notable example is Steiner’s (1972) taxonomy of team tasks which distinguishes additive, compensatory, disjunctive, conjunctive, and discretionary tasks, depending on the form of interdependence in teams. In a literature review, Hollenbeck, Beersma, and Schouten (2012) identified no less than 42 different team types, including project teams, manage-ment teams, and autonomous work teams.
In summarizing and organizing the team types referred to in the literature, these authors developed a three dimensional classification scheme to describe teams and team tasks. The first dimension, skill differentiation, is concerned with the distribution of skills, abili-ties and educational backgrounds within the team. While in teams with high skill differen-tiation, such as a surgical team, all team members have substantially different abilities and, hence, cannot be replaced easily, in teams with low skill differentiation, members have similar skills and abilities so that every member can take every other members’ role and task. The second dimension, authority differentiation, refers to the degree to which decisions are made by a (formal) team leader or by the team as a whole. The third dimen-sion, temporal stability, distinguishes short-term or ad-hoc teams that have little or no ex-perience in working together as a team, and long-term teams that have worked together for extended periods of time.
2.2.3 Teamwork Processes and Emergence
Organizational psychology and related disciplines, such as management science and orga-nizational behavior, were always interested in the factors that make teams successful. In the course of this development, different conceptual approaches to teamwork have been suggested. The input-process-output, or I-P-O framework (e.g., Hackman, 1987), concep-tualized teamwork as a process that converts inputs to outcomes. However, the I-P-O framework has been criticized for a number of reasons (e.g., Ilgen, Hollenbeck, Johnson, & Jundt, 2005; Mathieu et al., 2008): First, some of the factors that mediate the relationship between inputs and outputs are not processes. Marks et al. (2001, p. 357) defined team processes as “members’ interdependent acts that convert inputs to outcomes through cognitive, verbal, and behavioral activities directed toward organizing taskwork to achieve
14

collective goals”. However, variables such as cohesion or potency do not refer to activities, but to state-like properties, which have therefore been labeled emergent states (Marks et al., 2001). The second criticism concerns the framework’s inability to account for temporal dynamics and feedback loops. The I-P-O framework suggests a linear and unidirectional path between inputs and outputs, which is incompatible with the view on teams as “com-plex, dynamic systems” (Ilgen et al., 2005, p. 519). In addressing these criticisms, Ilgen et al. (2005) proposed the input-mediator-outcome (IMO) framework . As a derivative and 1
enhancement of the I-P-O framework, it not only considers processes and emergent states as mediators, but also places greater emphasis on the dynamic aspect of teamwork.
Linked to the question of how team inputs and outputs are related is the concept of emer-gence. According to K. Klein and Kozlowski (2000b, p. 55) “[a] phenomenon is emergent when it originates in the cognition, affect, behaviors, or other characteristics of individu-als, is amplified by their interactions, and manifests as a higher-level, collective phenome-non”. Because team processes and emergent states that mediate the input-output relationship are group-level constructs that originate at the individual level, they describe emergent phenomena (Kozlowski, Chao, Grand, Braun, & Kuljanin, 2013). For instance, if all team members are attracted to the team (i.e., an individual-level cognition), the team as a whole is characterized as cohesive (i.e., an emergent state at the group level). Team processes also originate at the individual level in the form of team members’ behaviors. For example, cooperation (i.e., a process) emerges from team members’ coordinated helping and sup-porting behaviors.
K. Klein and Kozlowski (2000b) distinguish two basic processes of emergence (i.e., com-position and compilation) that lead to different types of constructs (i.e., shared and confi-gural constructs). In composition emergence, similar or identical lower-level characteristics converge to a shared property at a higher level which is essentially the same as its consti-tuting elements. Examples of shared constructs that emerge by composition include shared mental models (Mohammed, Ferzandi, & Hamilton, 2010), group affective tone (George, 1990), and shared climate perceptions (Anderson & West, 1998). The second process by which lower-level units emerge to a higher level is compilation. In this form of emergence, complex combinations of different lower-level characteristics result in a configural higher-level construct. An illustrative example of emergence by compilation is the performance of a football team. In this scenario, the goalkeeper, defense, midfield, and forward players all differ in functions, behaviors, and contributions. However, the complex combination of these different contributions emerges to the higher-level construct team performance.
Note that the same framework has been referred to as both the IMO framework by Mathieu et al. (2008) and as the IMOI 1
framework by Ilgen et al. (2005). In the course of this dissertation, I use the shorter form.
15

3 Research on Satisfaction in Teams
The previous chapter introduced and delineated the relevant terms and concepts of this dissertation — job satisfaction and teams — in isolation. This chapter combines these con-cepts by focussing on job satisfaction in teams. In particular, I review how prior research conceptualized job satisfaction in teams and consider issues related to definitions and nomenclature, satisfaction facets, levels of analysis, models of composition, and measure-ment. Because most research conceptualizes group-level satisfaction as a shared construct, I then examine the literature on satisfaction convergence. The subsequent section presents relevant findings from prior studies concerned with the consequences of job satisfaction in teams. In summarizing the preceding sections, I identify and discuss relevant research gaps in the literature that I address in this dissertation. The final section gives a concise overview over the research program.
3.1 Review of the Literature
Given the importance of job satisfaction for research and organizational practice in conjunc-tion with the growing reliance on team-based working, it is not surprising that job satisfac-tion in the context of teams is an emerging field for organizational psychology and related disciplines. The increasing research interest can be illustrated by the development of search hits for job satisfaction in the team context in the scientific search engine Google Scholar (see Figure 2). In ten years, the number of published articles that contain keywords such as team satisfaction, team-level job satisfaction, or group-level job satisfaction almost quadrupled.
Figure 2. Research interest for satisfaction in the team context. Exact search terms in Google Scholar were “team satisfaction”, “team-level” “job satisfaction”, and “group-level” “job satisfaction”.
Year
Sear
ch H
its
500
1.000
1.500
2.000
Year
20042005
20062007
20082009
20102011
20122013
20142015
Group-Level Job Satisfaction
Team Satisfaction
Team-Level Job Satisfaction
16

Because the term job satisfaction in the team context is extensive and somewhat fuzzy, I first aim to clarify the scope of this research. The term team context has a double meaning: On the one hand, it can refer to the attitudinal target, that is, satisfaction with the team. On the other hand, it can refer to the level of analysis, that is, satisfaction of the team. Combi-ning both meanings leads to a 2×2 matrix (see Table 3). To reduce ambiguity, please note that in the course of this dissertation, I mostly use the prefix group-level instead of team-level when referring to satisfaction as a higher-level construct.
Table 3 Satisfaction in the Team Context
The main focus of this dissertation lies on satisfaction with the team, both at the individual level (see the lower right quadrant in Table 3) and at the group level (upper right quadrant). The lower left quadrant reflects the traditional job satisfaction research (Judge & Kammeyer-Mueller, 2012). Because this is the only quadrant that neither focuses on satisfaction in teams nor of teams, it will not be considered in this dissertation. The upper left quadrant refers to group-level job satisfaction, that is, an aggregation of overall satisfaction with the job. As I outline in Study 1, the usefulness of overall job satisfaction as a group-level con-struct is somewhat limited. Although I consider group-level job satisfaction in the subse-quent literature review, it will only play a minor role in the course of this research. As a side note, team satisfaction is basically a facet of overall job satisfaction, so that the two categories are not mutually exclusive.
Tables 4 and 5 provide an overview of the literature on satisfaction in the context of teams. While Table 4 summarizes definitions and conceptual approaches to satisfaction in teams, Table 5 focuses on its notation, targets, facets, levels of analysis, composition models, and measurement.
Attitudinal target / satisfaction facet
Level of analysis Job Team
Higher level (group)
Group-level job satisfaction
Group-level team satisfaction
Lower level (individual)
Individual-level job satisfaction
Individual-level team satisfaction
17

Table 4Definitions and Approaches to Satisfaction in Teams
Target / Level Definitions and approaches Authors
Job
Group level
[a] group’s shared feelings toward the job Zampetakis and Moustakis (2011, p. 84)
the extent to which a team's members agreed or disagreed that team members were satisfied with their pay, the promotion opportunities possible, the team's relations with other employees and departments, and the team's current job assignments
Kirkman and Rosen (1999, p. 67)
a collective feeling of satisfaction and well-being in the workplace that exists among organizational members
Jinnet and Alexander (1999, p. 177)
a work unit’s shared internal state that is expressed by affectively and cognitively evaluating shared job experiences with some degree of favor or disfavor
Whitman et al., (2010, p. 46)
team members’ affective response to the job Rodríguez-Escudero, Carbonell, and Munuera-Aleman (2010, p. 858)
Team
Individual level
the affective evaluation of the team experience Stark and Bierly (2009, p. 462)
group cohesion, consensus, and satisfaction with group communication
Rozell and Scroggins (2010, p. 36)
Group level
the overall extent to which members are satisfied with the team’s outcomes
Standifer et al. (2015, p. 692)
the extent to which team members are satisfied with their teamwork
Costa (2003, p. 612)
the group’s shared attitude toward its task and work environment
Mason and Griffin (2005, p. 625)
a shared happiness with belonging to a group, and how much individuals feel working with the same team members in the future is beneficial and desirable
Behfar, Friedman, and Oh (2015, p. 3)
shared values Koys (2001, p. 102)
the level of morale within the team, how well the team satisfies members’ needs, and the willingness of the team to work together again on future tasks
Werner and Lester (2001, p. 393)
18

Although satisfaction in teams has become an important theme in research, the literature review shows that there is no consistent definition. Given that the same was true for indi-vidual job satisfaction (see Chapter 2.1), this is hardly surprising. Following the satisfaction-as-affect approach (Locke, 1969), many authors emphasize the affective component in satisfaction, referring to “shared feelings” (Zampetakis & Moustakis, 2011, p. 84), a “collective feeling” (Jinnett & Alexander, 1999, p. 177), or “shared happiness” (Behfar et al., 2015, p. 3). Other authors follow H. Weiss (2002) in defining satisfaction as an attitude that can be based on affect and cognition. For example, Whitman et al. (2010, p. 46) refer to collective job satisfaction as “a work unit’s shared internal state that is expressed by affectively and cognitively evaluating shared job experiences with some degree of favor or disfavor”. Likewise, Mason and Griffin (2005, p. 625) define group task satisfaction as “the group’s shared attitude toward its task and work environment”. Still others bypass this discussion and offer operational definitions such as “satisfaction with the team’s outcomes” (Standifer et al., 2015, p. 692) or “satisfaction with […] teamwork” (Costa, 2003, p. 612). Interestingly, some definitions relate to other constructs than satisfaction, such as cohesion and consensus (Rozell & Scroggins, 2010), morale (Werner & Lester, 2001), and values (Koys, 2001). What is also noticeable in the definitions of satisfaction as a group-level construct is the focus on sharedness and consensus as the above authors refer to shared feelings, shared attitudes, shared values, shared happiness, and collective feelings.
19
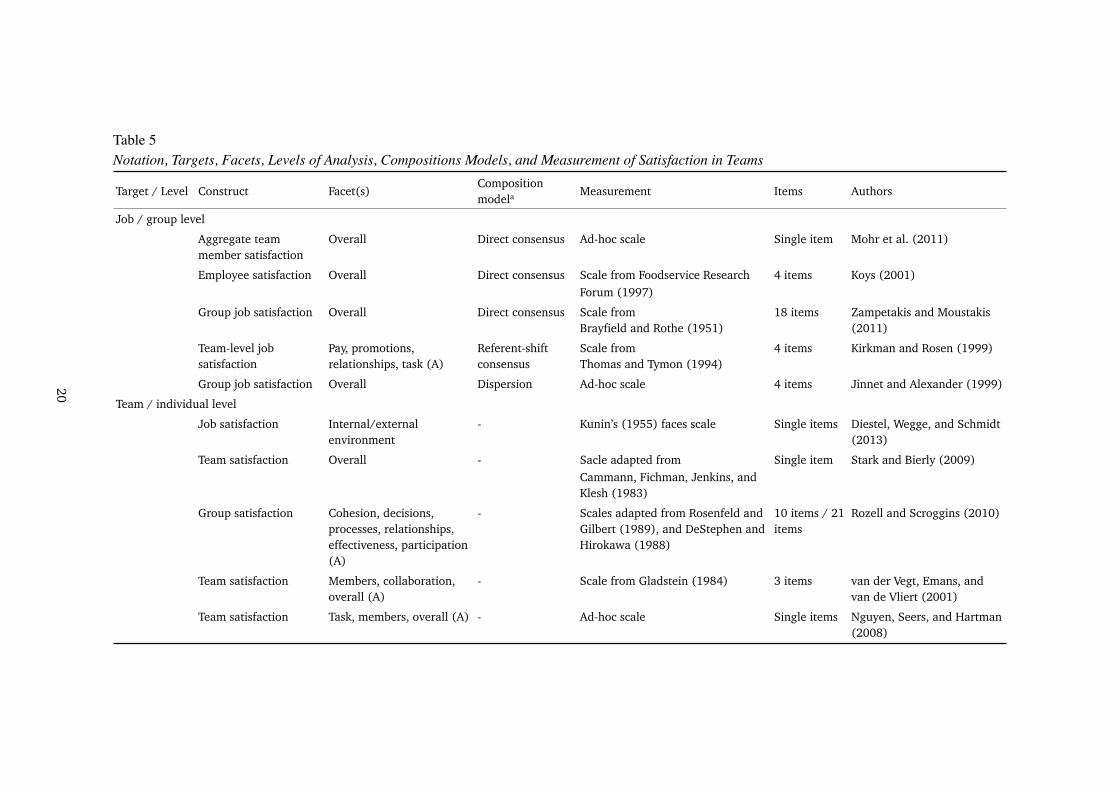
Table 5 Notation, Targets, Facets, Levels of Analysis, Compositions Models, and Measurement of Satisfaction in Teams
Target / Level Construct Facet(s) Composition modela Measurement Items Authors
Job / group levelAggregate team member satisfaction
Overall Direct consensus Ad-hoc scale Single item Mohr et al. (2011)
Employee satisfaction Overall Direct consensus Scale from Foodservice Research Forum (1997)
4 items Koys (2001)
Group job satisfaction Overall Direct consensus Scale from Brayfield and Rothe (1951)
18 items Zampetakis and Moustakis (2011)
Team-level job satisfaction
Pay, promotions, relationships, task (A)
Referent-shift consensus
Scale from Thomas and Tymon (1994)
4 items Kirkman and Rosen (1999)
Group job satisfaction Overall Dispersion Ad-hoc scale 4 items Jinnet and Alexander (1999)Team / individual level
Job satisfaction Internal/external environment
- Kunin’s (1955) faces scale Single items Diestel, Wegge, and Schmidt (2013)
Team satisfaction Overall - Sacle adapted from Cammann, Fichman, Jenkins, and Klesh (1983)
Single item Stark and Bierly (2009)
Group satisfaction Cohesion, decisions, processes, relationships, effectiveness, participation (A)
- Scales adapted from Rosenfeld and Gilbert (1989), and DeStephen and Hirokawa (1988)
10 items / 21 items
Rozell and Scroggins (2010)
Team satisfaction Members, collaboration, overall (A)
- Scale from Gladstein (1984) 3 items van der Vegt, Emans, and van de Vliert (2001)
Team satisfaction Task, members, overall (A) - Ad-hoc scale Single items Nguyen, Seers, and Hartman (2008)
20

Note. (A) = facets are aggregated to an overall satisfaction score. a Composition models based on Chan (1998) and Cole et al. (2011).
Target / Level Construct Facet(s)Composition modela Measurement Items Authors
Team / group level
Team satisfaction Intention to remain, performance, overall (A)
Additive Ad-hoc scale 4 items B. West et al. (2009)
Work group satisfaction Team members, team leader (A)
Additive JDS scales from Hackman and Oldham (1975)
6 items Lester, Meglino, and Korsgaard (2002)
Team satisfaction Overall Referent-shift consensus
Scale from Hackman (1987) and ad-hoc item
3 items Werner and Lester (2001)
Team satisfaction Overall Direct consensus Scale adapted from Hackman (1990)
8 items Standifer et al. (2015)
Team satisfaction Teamwork Referent-shift consensus
Scale adapted from Smith and Barclay (1997)
5 items Costa (2003)
Group task satisfaction Team task, internal and external environment
Referent-shift consensus
Ad-hoc scales 3 (task), 4 (internal),5 (external)
Mason and Griffin (2005)
Deep-level diversity Work, supervisor, overall Dispersion JDI subscales (Smith, Kendall, and Hulin, 1969); Kunin’s (1955) faces scale; items taken from JDS (Hackman and Oldham, 1975)
18 (work) 18 (superv.) 3 (overall)
Harrison, Price, and Bell (1998)
Team / job satisfaction Internal and external environment
Dispersion composition
Ad-hoc scale Single item Dineen, Noe, Shaw, Duffy, and Wiethoff (2007)
Team satisfaction Team members, attraction, intention to remain, overall (A)
Direct consensus Scale adapted from Peterson (1999)
4 items Behfar et al. (2015)
21

Besides the missing consensual definition, the nomenclature is not always consistent. To distinguish between satisfaction targets, constructs that address overall job satisfaction often entail the term job such as in group job satisfaction (Zampetakis & Moustakis, 2011) or team-level job satisfaction (Kirkman & Rosen, 1999). In contrast, studies that address satisfaction with the team mostly refer to team satisfaction (e.g., Standifer et al., 2015; B. West et al., 2009) or group satisfaction (e.g., Rozell & Scroggins, 2010). However, there are some inconsistencies in the nomenclature: Although team satisfaction usually means satisfaction with the team, Koys (2001) considers employee satisfaction as satisfaction of employees. Similarly, Mohr et al. (2011, p. 20) refer to job satisfaction of the team as aggregate team member satisfaction.
The constructs these authors refer to also differ in the targets or facets of satisfaction, and as to whether these facets are considered separately or aggregated to an overall satisfac-tion score. Many authors select a number of satisfaction facets and aggregate them into a single overall score. For instance, Rozell and Scroggins (2010) assessed satisfaction with group decisions, decision processes, group member relationships, individual effectiveness, and opportunities to participate, and aggregated these subscales to an overall group satis-faction score. By contrast, few authors considered different facets separately. For instance, Dineen et al. (2007) distinguished between internally (e.g., team members) and externally (e.g., the job) focused satisfaction. Likewise, Mason and Griffin (2005) considered team members’ satisfaction with the internal (e.g., collaboration) and the external (e.g., avail-able resources) working environment, and the team task. In a study on deep-level diversity, Harrison et al. (1998) distinguished between satisfaction with the task, the supervisor, and the job overall.
Studies that conceptualized satisfaction as a group-level construct differ in the model of composition, that is, how individual-level satisfaction is assumed to emerge as a construct at the group level (Chan, 1998). Some authors (Lester et al., 2002; B. West et al., 2009) used additive composition models, in which satisfaction as a higher-level construct is the simple sum or average of team members’ individual satisfaction. In these models, team members are interchangeable “like light bulbs” (Humphrey & Aime, 2014, p. 465). Consen-sus of lower-level responses is not necessary and must not be assessed prior to aggregation. The two prevailing composition models in the literature are the direct-consensus model and the referent-shift consensus model. In the direct-consensus model, team members are asked about their own satisfaction (e.g., “I am satisfied with my team”). Given a sufficient degree of consensus or agreement in the team, members’ individual scores are then aggre-gated to a sum or average score that reflects the satisfaction of the whole team. In the referent-shift consensus model, the team itself becomes the referent (i.e., the referent shifts from the individual to the team). In this case, members are not asked about their own, but about the team’s satisfaction (e.g., “We are satisfied with each other’s contributions to our team”; Costa, 2003). In referent-shift consensus models, too, agreement of lower-level entities must be ascertained prior to aggregation. Only few authors employed dispersion models for conceptualizing satisfaction at the group level: Jinnet and Alexander (1999) used a proportional measure of satisfaction. According to these authors, satisfaction of the team is reflected in the proportion of team members that exceed the average satisfaction level of the whole sample. In this way, satisfied and dissatisfied members cannot “average each other out”, making it essentially a measure of satisfaction homogeneity. Similarly, Harrison et al. (1998) used the coefficient of variation in satisfaction to conceptualize
22

deep-level diversity. Finally, Dineen et al. (2007) considered the standard deviation of satisfaction within the team as an indicator of sharedness. However, these authors also considered the team’s average level of satisfaction, therefore following a dispersion-compo-sition model (Cole, Bedeian, Hirschfeld, & Vogel, 2011).
Furthermore, prior studies differ in how they measured satisfaction. In fact, there are hardly two studies identifiable that used the same satisfaction scale. The majority of studies used either ad-hoc measures or scales that were adapted from other research contexts. For instance, Costa (2003) adapted a scale from J. B. Smith and Barclay (1997) that was originally developed to assess mutual satisfaction in selling partner relationships. Similar-ly, Rozell and Scroggins (2010) adapted a cohesion scale that was originally intended for the use in classrooms. It is also notable that many studies use single items to assess satis-faction, such as “Are you satisfied with the members of your work team?” (Dineen et al., 2007).
3.2 The Emergence of Shared Satisfaction
The literature review indicates that the vast majority of studies employed direct-consensus or referent-shift consensus models to explain the emergence of group-level satisfaction. This means that authors mostly conceptualized satisfaction in teams as a shared evaluation of the job or the team. As many authors pointed out (e.g., Chan, 1998; Cole et al., 2011; LeBreton & Senter, 2008), these models rely on consensus (also referred to as agreement, homogeneity, or sharedness) of the focal construct. If team members have the same or similar levels of satisfaction, the sum or average of individual responses represents satis-faction of the team as a whole. Conversely, if the lower-level units are not in agreement (i.e., if they have different levels of satisfaction), their data cannot be aggregated to a meaningful higher-level construct. For example, if half of the team is satisfied and the other half is dissatisfied, the team’s average satisfaction represents none of the team mem-bers’ attitudes (K. Klein & Kozlowski, 2000a). The strong focus on consensus has methodo-logical and theoretical implications.
From a methodological perspective, researchers who aim to transfer individual satisfaction scores to the group level must justify aggregation by determining some level of sufficient homogeneity (Chan, 1998). Whether or not team members’ satisfaction scores are sufficient-ly homogenous for aggregation is usually determined by rules of thumb, such as rWG > .70 (LeBreton, Burgess, Kaiser, Atchley, & James, 2003) or ICC(1) > .12 (James, 1982). How-ever, LeBreton and Senter (2008) criticized the arbitrary dichotomy between agreement and non-agreement and proposed a more inclusive set of standards to help multi-level researchers determine whether aggregation is justified.
From a theoretical perspective, it is important to “explain how and why team members come to share the construct of interest” (K. Klein & Kozlowski, 2000a, p. 215). Following this guideline, authors usually present three arguments how team members come to share satisfaction. First, authors propose that members of the same team share situational influ-ences on satisfaction. For instance, Nishii, Lepak, and Schneider (2008, p. 514) argue that “unit members are likely to be exposed to a variety of unit goals, rules and procedures,
23

strategies, technologies, work environments, task demands, and leadership that lead to shared experiences and attitudes”. Likewise, Whitman et al. (2010, p. 46) contend that “employees in the same unit tend to have a common workspace; the same practices, rules, and policies; the same coworkers; and the same technologies”. Second, according to the attraction-selection-attrition framework (Schneider, Goldstein, & Smith, 1995), teams become more homogenous over time because the team attracts and retains members with similar personality traits. As a consequence, individual influences on job satisfaction, such as negative affectivity (Bowling, Hendricks, & Wagner, 2008) and core self-evaluations (Judge & Bono, 2001), are expected to become similar in work teams due to self-selection processes. Third, social influences make the emergence of shared satisfaction more likely because team members who frequently interact with each other mutually influence their moods and emotions (Barsade & Gibson, 2012), perceptions (K. Klein, Conn, Smith, & Sorra, 2001), and attitudes (Mason, 2006).
3.3 Consequences of Satisfaction in Teams
Because job satisfaction has traditionally been seen as a means to attain organizational goals, most research on satisfaction in teams takes a utilitarian perspective and is mainly concerned with the question of how satisfaction affects team effectiveness. In this section, I briefly review and comment on prior findings regarding the relationship between satis-faction in teams and different indicators of team performance.
To date, two meta-analyses have addressed the outcomes of average job satisfaction at the group level. Harter et al. (2002) analyzed the data of 7,939 business units in 36 companies. They obtained modest correlations between unit’s average job satisfaction and performance outcomes that lie in the range between r = .09 (profit) and r = .16 (customer satisfaction). The correlation between average job satisfaction and a composite measure of unit perfor-mance was slightly higher, r = .22. It should be noted, however, that this study is based on business units and does not focus exclusively on teams. In another meta-analysis, Whitman et al. (2010) considered a total of 5,849 business units, including 1,526 teams. They re-port somewhat stronger relationships between teams’ average job satisfaction and perfor-mance-related outcomes that lie in the range between r = .27 (customer satisfaction) and r = -.35 (withdrawal).
Considering individual studies in detail further reveals that average job satisfaction relates to a wide variety of performance indicators such as innovation (Shipton et al., 2006), citi-zenship behaviors (Nishii et al., 2008), absenteeism (Hausknecht et al., 2008), and service quality and customer satisfaction (Yee, Yeung, & Cheng, 2008). Although most studies found that average satisfaction has positive consequences for the team and the organization, there are also some inconclusive findings to be noted: In a longitudinal study, van de Voorde et al. (2014) found no relationship between units’ average work satisfaction and labor productivity. Similarly, Koys (2001) found no relationship between aggregated employee satisfaction and profitability after a two-year timespan. Mason and Griffin (2005) found that group-level team satisfaction related to citizenship behaviors, but neither to team performance nor to absenteeism norms.
24

Whereas research mainly focused on the effects of (shared) average satisfaction, some studies also addressed the effects of differences in satisfaction. In a longitudinal study on the effects of deep-level diversity, Harrison et al. (1998) found a negative effect of job satis-faction dispersion on team cohesion. The negative effect on cohesion was stronger, the more time team members spent together. In a similar vein, van der Vegt (2002) considered the effects of job satisfaction dissimilarity, that is, the difference between each team mem-ber’s satisfaction to the rest of the team. Using longitudinal data, the study established a causal link between dissimilarity in satisfaction and identification, collaboration, and commitment. What both studies have in common is that they controlled for the absolute level of satisfaction in the team.
Few studies considered interaction effects of level and dispersion of satisfaction. In Whitman et al.’s (2010) meta analysis, within-unit consensus of job satisfaction was found to mode-rate the relationship between average unit satisfaction and unit performance. Particularly, the relationship between average satisfaction and performance was stronger when consen-sus was high, r = .26, than when it was low, r = .19. Dineen et al. (2007) used average level, dispersion, and facets of satisfaction to predict absenteeism from group meetings. Across two studies, the authors found significant interactions between average and disper-sion of externally focused satisfaction. More particular, shared dissatisfaction with external entities, such as the task, was found to reduce absenteeism. By showing that collective (dis)satisfaction in teams has fundamentally different effects than (dis)satisfaction of indi-viduals, this study challenges the assumption that the effects of job satisfaction are neces-sarily homologous across levels of analysis. These findings have recently been corroborated by Knight and Eisenkraft (2015) who found that shared negative feelings towards an ex-ternal entity can promote social integration and task performance.
3.4 Identification of Research Gaps and Problems in the Literature
Despite the growing interest in the study of satisfaction in teams, there are still gaps and problems in the literature. In particular, the main problems relate to the emergence of satis-faction as a uniform group-level construct and to the lack of multi-level theorizing on the relationship between satisfaction and performance.
Concerning the emergence as a higher-level construct, two issues can be identified. First, the vast majority of studies conceptualized group-level satisfaction as a shared, uniform construct. However, empirical findings challenge the assumption that satisfaction is always shared by all team members. In particular, while some studies find that team members share satisfaction (e.g., Koys, 2001; Mason & Griffin, 2005; Zampetakis & Moustakis, 2011), others show that team members experience different levels of satisfaction (e.g., Dineen et al., 2007; Hausknecht et al., 2008; Li, et al. 2009; Nishii et al., 2008). Yet, the literature review has shown that most theorizing on group-level satisfaction does not take satisfaction dispersion into consideration. Instead, most authors see dispersion as an unde-sirable artifact of measurement. For instance, Li et al. (2009) excluded teams that were low in agreement from analyses, which puts the generalizability of research findings into risk. Other authors (e.g., Nishii et al., 2008; van de Voorde et al., 2014) aggregated satis-faction to the group level, regardless of low within-group agreement.
25

Second, prior research devoted little attention to the processes by which team members’ individual satisfaction emerges to a uniform group-level attitude. To the best of my know-ledge, only one study (Mason, 2006) attempted to disentangle different sources of uniform satisfaction in an empirical setting. This lack of research is surprising for a number of reasons: Understanding the process of satisfaction convergence is valuable because it helps predict why and under which circumstances team members will share satisfaction. This is especially important because agreement or consensus in satisfaction has been linked to cohesion, identification, collaboration, and commitment (Harrison et al., 1998; van der Vegt, 2002). Furthermore, a deeper understanding of the factors that drive satisfaction convergence would illuminate why some studies were unable to find uniform satisfaction despite the theoretical arguments presented above. The lack of research on the process of satisfaction convergence has not gone unnoticed: Whitman et al. (2010) point out that it is still unclear how job satisfaction emerges as a shared construct. Likewise, Zampetakis and Moustakis (2011) raise the question if it is group members’ shared experiences or social influences that give rise to shared evaluations. However, this question remains to be answered.
Concerning the consequences of satisfaction in teams, the main issue relates to the neglect of multi-level theorizing: Prior studies either took an individual-level perspective (i.e., team members’ satisfaction with the team) or a group-level perspective (i.e., aggregated satisfaction), but did not integrate these two perspectives into a multi-level approach. This is problematic because satisfaction can simultaneously influence behaviors, affect, cognition, and performance at different levels of analysis. For example, Dineen et al. (2007) showed that, at the group level, shared dissatisfaction can have a unifying effect on team members. At the same time, individual-level dissatisfaction reduces team members’ motivation and task performance (Judge & Kammeyer-Mueller, 2012). That is, we must expect that indi-vidual-level and group-level satisfaction have distinct or even opposing effects on team members and the team as a whole. The single-level conceptualization of satisfaction also hinders research to account for possible cross-level effects. For example, if a single dissatis-fied member spoils team morale with organizational cynicism (Naus, van Iterson, & Roe, 2007), individual dissatisfaction would exert a negative bottom up effect on an emergent state at the group level. Conversely, if uniform satisfaction reduces team members’ intention to leave the team, group-level satisfaction exerts a top-down effect on an individual-level behavior. These examples illustrate that the effects of satisfaction in teams are too complex for a single-level conceptualization and that we need multi-level theory to understand the consequences of satisfaction within and between different levels of analysis.
A second problem concerning the consequences of satisfaction relates to the prevailing approach to conceptualize group-level satisfaction as a uniform construct that I highlighted above. As an implication of this narrow focus, we know little about the consequences of constellations other than uniform satisfaction. This is a problem worth noting because dis-persed satisfaction is observable in empirical settings (e.g., Hausknecht et al., 2008), and has been shown to affect team functioning (Harrison et al., 1998). For instance, we can expect that a team comprising five satisfied and one dissatisfied member performs worse than a team comprising six moderately satisfied members. To overcome this problem, we need a configural view on satisfaction in teams that takes non-uniform pattern of satisfac-tion into account.
26

A further research gap in this domain relates to the fact that prior research largely focused on the consequences of overall job or team satisfaction without taking specific satisfaction facets into account. However, based on research on individual-level satisfaction (e.g., Diestel et al., 2013; Edwards, Bell, Arthur, & Decuir, 2008), we must expect that group-level satis-faction that focuses on specific facets of (team)work, too, will have distinct effects on indi-vidual and team outcomes. For example, we would expect that attitudes towards the other team members are more predictive of group cohesion than attitudes towards the team task. A facet-based approach of satisfaction in teams could therefore help to better explain and predict team members’ and teams’ behaviors and performance.
To empirically address the issues concerning the emergence and consequences of satisfac-tion in teams, researchers need reliable and validated satisfaction scales. However, most studies in this domain used ad-hoc measures like “Considering everything, how satisfied are you with your job?” (Whitman et al., 2010, p. 55). This is problematic because ad-hoc scales lack systematic development, are seldom validated, and complicate comparability of findings from different studies (Thompson & Phua, 2012). A similar concern lies in the use of adapted scales that were not developed for the team context. Without rigorous testing, scales should not be adapted or reworded because the scales’ psychometric properties might not be applicable in a different than the originally intended research context. A further measurement-related problem lies in the fact that authors use items that do not reflect an evaluative judgement of the job or the team. For instance, Behfar et al. (2015, p. 8) asked participants to what extend they “would like to work with this team again in the future”. Similarly, B. West et al. (2009, p. 257) used the item “To what extent would you like to remain a member of this team?”. Although these items certainly have an evaluative com-ponent to them, they do not assess the evaluation itself but rather its consequences. This is a problem because operationalizing a construct through its presumed consequences is an issue of criterion contamination that leads to an overestimation of predictor-criterion rela-tionships and biased research findings.
3.5 Overview over the Research Program
Taken together, prior research on satisfaction in teams is characterized by ambiguous nomenclature and a focus on shared satisfaction and its relationship with other group-level constructs. At the same time, little is known about how satisfaction converges to a shared team attitude and about the consequences of different facets and constellations of satisfac-tion in the team within and across levels of analysis. To complicate matters, there are currently no validated scales available to assess satisfaction and its facets in the context of teams. This research program addresses these issues and contributes to reducing the research gaps identified and discussed above. It consists of four studies (see Table 6) that I describe in more detail below.
27

Table 6Overview over the Studies
Study 1, entitled “Uniform and configural team satisfaction and performance: A multi-level framework”, presents a conceptional approach to satisfaction in teams and its relationship to team performance. It marks a departure from the compositional view on satisfaction in teams by proposing prototypical forms or constellations of satisfaction that are found throughout the literature. We argue that these forms influence affect, cognition, behavior, and performance at the individual and the group level. These different qualities of satis-faction extend the currently prevailing view on satisfaction dispersion as a purely quantita-tive construct that ranges from low to high. We embed the forms of satisfaction in a newly developed multi-level team effectiveness framework, labeled the Multi-Level Input-Mediator-Outcome (MIMO) framework. In this way, the study adds a multi-level perspective to satis-faction in teams, which has previously been discussed as a single-level construct only.
Study 2a, entitled “Construction and validation of a short measure to assess general and facet-specific job satisfaction”, is a methodological paper in which I develop short scales for the assessment of overall job satisfaction and satisfaction facets in the German language area. To do so, I build a comprehensive item pool based on well-established job satisfac-tion scales such as the Job Descriptive Index (JDI; P. Smith et al., 1969) and its German equivalent (Arbeitsbeschreibungsbogen; Neuberger & Allerbeck, 1978). On this basis, I derive six short scales, and assess psychometric properties (i.e., factorial structure, internal consis-tencies, and validity) of the newly developed scales in two separate studies with 594 subjects.
Study 2b, entitled “Measuring satisfaction in teams — An adaptation of the KAFA scales” adapts the satisfaction scales developed in Study 2a to the team context. In particular, I make three of the five facet scales (satisfaction with the task, the team leader, and the team members) and the overall satisfaction scale applicable in the context of teamwork. Besides evaluating the scales’ psychometric properties, I investigate how they relate to performance-related outcomes of individuals (turnover intention) and the team as a whole (meeting absenteeism, team citizenship behavior, and team-rated performance).
Study No. Authors, title, and journal
Study 1 Haarhaus, B., Sieweke, J., & Meyer, B. (2016). Uniform and configural team satisfaction and performance: A multi-level framework. Submitted to the Journal of Occupational and Organizational Psychology.
Study 2a Haarhaus, B. (2015). Construction and validation of a short measure to assess general and facet-specific job satisfaction. Published in Diagnostica, 62, 61-73.
Study 2b Haarhaus, B. (2016). Measuring satisfaction in teams — An adaptation of the KAFA scales.Unpublished research report.
Study 3 Haarhaus, B. (2017). Uncovering cognitive and affective sources of satisfaction homogeneity in work teams. Published in Group Processes & Intergroup Relations, ahead of print, 1–23.
28

Study 3, entitled “Uncovering cognitive and affective sources of satisfaction homogeneity in work teams”, is an empirical study that focuses on the convergence of satisfaction to a shared team attitude. In this paper, I employ the framework of affective events theory (H. Weiss & Cropanzano, 1996) to consider situational, dispositional, and social influences on satisfaction homogeneity. To the best of my knowledge, this is the first study testing diffe-rent sources of satisfaction homogeneity with a comprehensive model that distinguishes between the underlying cognitive and affective processes. Because homogeneity and average level of satisfaction are statistically confounded, this study controls for the average level of satisfaction, which allows analyzing satisfaction homogeneity in isolation and makes interpretation of results more clear-cut. Furthermore, this study contributes to research on the relationship between group-level satisfaction and team performance by testing how shared and dispersed satisfaction affect self-rated and supervisor-rated performance.
Taken together, this research program addresses three aspects of satisfaction in teams: Emergence, measurement, and consequences (see Figure 3).
Figure 3. Integration and research foci of the four studies.
The emergence of group-level satisfaction is considered in Studies 1 and 3. In Study 1, my co-authors and I propose that group-level satisfaction can take the form of both a shared (uniform) and a configural construct. Based on this premise, we delineate four prototypi-cal forms or configurations of group-level satisfaction. In Study 3, I take an empirical approach to the emergence of group-level satisfaction by examining the processes that lead to shared or dispersed satisfaction.
Study 2a
Construction and validation of a short measure to assess general
and facet-specific job satisfaction
Study 1
Uniform and configural team satisfaction and performance:
A multi-level framework
Study 3
Uncovering cognitive and affective sources of satisfaction
homogeneity in work teams
Study 2b
Measuring satisfaction in teams –
An adaptation of the KAFA scales
Emergence
Group-level performance
Individual-level performance
Consequences
Measurement
Emergence
Individual-level satisfaction
Group-level satisfaction
29
Studies 2a and 2b address issues concerning the measurement of satisfaction in teams. In particular, the development of the job satisfaction short scales (Study 2a) serves as the methodological groundwork. Although the scales developed in Study 2a do not focus on satisfaction in teams, I adapt them to the team context in Study 2b and apply them in Study 3 to measure satisfaction.
Finally, Studies 1, 2b, and 3 all address the consequences of satisfaction in teams, particu-larly its effects on team performance and related criteria. Study 1 develops multi-level theory on how individual-level and group-level satisfaction affect emergent states, proces-ses, and team performance. In the process of scale validation, Study 2b examines how individual-level and group-level satisfaction with different foci affect performance-related outcomes of team members and the team as a whole. Besides overall team satisfaction, it addresses satisfaction with the team members, the team leader, and the individual tasks in the team. Finally, by showing that uniform and dispersed satisfaction exert different effects on team performance, Study 3 indicates that the structure of group-level satisfaction moderates the group-level satisfaction—team performance relationship.
30

4 Study 1: Uniform and Configural Team Satisfaction and Performance: A Multi-Level Framework
Benjamin HaarhausTU Chemnitz, Germany
Jost Sieweke Vrije Universiteit Amsterdam, Netherlands
Bertolt Meyer TU Chemnitz, Germany
Submitted to the Journal of Occupational and Organizational Psychology
Abstract
Current theorizing on team satisfaction (i.e., employees’ satisfaction with the team) as a group-level construct and its relationship to team performance faces two challenges: (1) a merely consensus-based conceptualization of team satisfaction at the group level and (2) a neglect of multi-level effects. This limits our understanding of team satisfaction and its influence on team performance because team members’ satisfaction does not always emerge as a uniform group-level construct. In this case, current theory cannot adequately explain the relationship between team satisfaction and team performance. In this concep-tual paper, we develop a typology of different forms of team satisfaction (uniform, frag-mented, deviate, and bimodal satisfaction) and introduce a multi-level framework that explains how these forms affect team performance within and across different levels of analysis. Based on our framework, we propose that the forms of team satisfaction affect emergent states, such as cohesiveness and trust climate, and team processes, such as co-operation and conflict resolution, that affect team performance beyond the effects of team members’ individual level of satisfaction. The paper contributes to current theory about team satisfaction and its relationship to team performance.
31

4.1 Introduction
Job satisfaction, that is, an individual’s attitude towards his or her job, is one of the most frequently researched constructs in organizational psychology and management studies (Cascio & Aguinis, 2008). Scholars and managers are interested in job satisfaction mainly because a satisfied staff involves a competitive advantage for organizations: Satisfied em-ployees perform better on the job (Riketta, 2008), are healthier (Faragher et al., 2005), and less likely to leave the organization (Wright & Bonett, 2007). Employees’ job satisfac-tion has also been linked to company reputation (Helm, 2013), which is essential for attracting and retaining highly qualified personnel.
Traditionally, scholars have mostly examined job satisfaction of individual employees. However, tasks in organizations have become more complex and require more diverse skills and expertise than before. Therefore, work design began to shift from individual to team-based working (B. S. Bell & Kozlowski, 2010). This development affected research on job satisfaction in two ways: First, within the variety of possible satisfaction facets, employees’ satisfaction with the team (i.e., team satisfaction) appeared as a new facet on the research agenda. Second, the traditional focus on job satisfaction at the individual level was complemented by a group-level perspective, which describes the satisfaction of teams as a whole (e.g., Judge, Hulin, & Dalal, 2012; Mason & Griffin, 2005).
This conceptual paper focuses on team satisfaction both at the individual level and at the group level. Although research on team satisfaction has grown in recent years (e.g., Behfar et al., 2015; Rozell & Scroggins, 2010; Stark & Bierly, 2009), current theorizing faces two challenges: First, most studies implicitly assume that team satisfaction at the group level is a shared construct that emerges through composition processes, that is, throughout a direct consensus model (Chan, 1998). In other words, researchers suggest that all members are similarly satisfied or dissatisfied with the team (e.g., Hausknecht et al.; Mason, 2006; Whitman et al., 2010). However, this assumption often does not hold, as some studies found that team members significantly differ regarding their level of satisfaction (Nishii et al., 2008; van de Voorde et al., 2014). This is not surprising given that team members occupy different roles and work on different tasks (Humphrey, Morgeson, & Mannor, 2009), and might enjoy different working conditions (Lautsch & Kossek, 2011). In this case, team satisfaction emerges to the group level from compilation processes, that is, the combinati-on or pattern of each member’s individual satisfaction (i.e., throughout a dispersion model, Chan, 1998). We argue that conceptualizing group-level team satisfaction as a configural construct holds additional explanatory power in predicting team performance (Cole et al., 2011). For instance, a team comprising one dissatisfied and five satisfied members is satis-fied on average; yet, the dissatisfied member might impair team functioning by engaging in counterproductive behaviors (Mount, Illies, & Johnson, 2006), or withholding informa-tion from other team members (Mesmer-Magnus & Dechurch, 2009). Hence, we expect that this team performs worse compared to a team with the same average satisfaction but with equally satisfied members.
Second, theory on the relationship between team satisfaction and team performance is mostly based on group-level conceptualizations and devotes little attention to individual-level and cross-level effects. However, team satisfaction at the individual level and at the group level might have distinct effects on team performance. In our example above, the
32

dissatisfied member will be less motivated and contribute less to the team task than the other members so that this member’s individual dissatisfaction exerts a negative bottom-up effect on team performance. Additionally, at the group level, the satisfaction configura-tion — one dissatisfied member in a satisfied team — might impair team functioning because the satisfied members will mainly cooperate with each other and avoid the dissa-tisfied member (Balliet, Wu, & De Dreu, 2014). Top-down effects might also occur because being ignored by the majority will further negatively affect the dissatisfied member’s team-work and taskwork behavior (Kouchaki & Wareham, 2015). This example illustrates that we require multi-level theory to disentangle effects on and between different levels of ana-lysis, and to increase our understanding of how team satisfaction affects team performance.
Our paper addresses these challenges by developing multi-level theory regarding the effects of uniform and configural team satisfaction on team performance. Based on different streams of diversity research, we develop a typology of four prototypical satisfaction confi-gurations. We then extend the Input-Mediator-Outcome (IMO) team effectiveness frame-work (Mathieu et al., 2008) by adding a multi-level perspective. Based on the Multi-Level Input-Mediator-Outcome (MIMO) framework that we introduce, we connect research on team satisfaction at the individual level and at the group level and develop propositions about how team satisfaction affects team performance within and across different levels of analysis.
4.2 Team Satisfaction: Conceptualization and Emergence
Team satisfaction is a subdomain of overall job satisfaction that entails attitudes towards all aspects of the teams’ internal working environment. This includes attitudes towards the other team members (Dineen et al., 2007), collaboration (van der Vegt et al., 2001), per-formance (M. West, 2012), meetings (Rogelberg et al., 2010), and the team as a whole (Stark & Bierly, 2009). Team satisfaction is a construct that is inherently rooted at the in-dividual level. Nevertheless, as we argue throughout the paper, team satisfaction can also ma-nifest at a higher level of analysis, that is, as a group-level construct (e.g., Behfar et al., 2015).
Prior research in this domain addressed different but related constructs. In particular, while some studies investigated teams’ internal working environment (Costa, 2003; Stark & Bierly, 2009), other studies also focused on teams’ external working environment (Diestel et al., 2013; Dineen et al., 2007), or on overall job satisfaction (Mohr et al., 2011; Whit-man et al., 2010). Given this breadth of prior studies and the many facets of (team) satis-faction that they cover, it is important to clarify the scope of this research. In Table 7, we organize the facets of (team) satisfaction into a two-dimensional classification scheme.
The first dimension considers the location of the facet and distinguishes between internal and external facets. The internal/external dichotomy originates from the commitment literature (Siders, George, & Dharwadkar, 2001) and has also been applied to team satis-faction (Diestel et al., 2013; Dineen et al., 2007; Mason & Griffin, 2005). Internal facets relate to aspects situated within the teams’ internal working environment such as collabo-ration, the team members, or the team as a whole. External facets subsume all attitudinal targets that are located in the organizational context, such as superordinate structures
33

(e.g., work units, projects, or organizations), persons or groups of persons (e.g., team leaders or senior managers), and general working conditions (e.g., organizational policies or available resources).
The second dimension considers the sameness of the referent. This dimension reflects whether the satisfaction facet is the same for all team members. For instance, if we con-sider “the team as a whole” as a satisfaction facet, this facet is the same for all team mem-bers. In other words, because the team is a single entity, satisfaction of all members refers to the same target. Conversely, the facet “individual tasks and roles” can be different for each member, particularly in teams with high levels of skill differentiation (Hollenbeck et al., 2012). In this case, team members’ satisfaction refers to their own tasks and roles, that is, to different targets.
Table 7Classification of (Team) Satisfaction Facets
Note. Facets presented in this table are exemplary.
Our theorizing focuses on satisfaction with internal facets because we expect that it is more predictive of performance-related behaviors in teams than satisfaction with external facets. According to the principle of compatibility (Ajzen, 2011), the relationship between attitudes and behaviors is strongest when they refer to the same action, target, context, and time elements. Thus, if we aim to predict behaviors in the team context, such as task-work or citizenship behaviors, we should focus on team-related attitudes instead of overall job attitudes. The problem with external facets (and overall job satisfaction) as a group-level construct is amplified by the fact that employees, besides their regular work in their department or unit, often work in multiple teams (O'Leary, Mortensen, & Woolley, 2011). Consequently, the very same employee might enjoy working in one or all of his or her teams, but be dissatisfied with the regular job. In this case, the employee’s overall job satisfaction cannot be used to predict motivation and citizenship behaviors within the team context.
A further reason for our focus on internal facets lies in the fact that satisfaction with ex-ternal facets will not always emerge to a higher-level construct. Kozlowski et al. (2013) emphasize that emergence is bound to interactions among team members with a strong
Location of facets
Sameness of referent Internal facets External facets
Same referent for team members
• team as a whole • team collaboration • team members
• top management • organizational policies • team leader
Different referent for team members
• individual tasks and roles • individual working conditions • individual responsibilities
• non-team supervisors and coworkers
• non-team tasks and working conditions
34

focus on communication and exchange. Without exchanging viewpoints about the respec-tive aspects of work, satisfaction cannot emerge as a group-level construct. However, team members do not necessarily speak about aspects of their external work environment. Con-sider members of a project team who report results to the same team leader but have dif-ferent line managers for their regular work outside of the team. In this scenario, we expect that team members frequently speak to each other about their team leader, but rarely about their line managers because they do not have any relevance to the team’s objectives. Therefore, team members’ satisfaction with their line managers (located in the lower right quadrant in Table 7) will not emerge as a group-level construct. This is not to say that the emergence of satisfaction necessarily requires a single referent. For instance, since indivi-dual tasks, roles, and working conditions within the team are highly relevant for collabo-ration and team success, team members will exchange views about these aspects. In this case, the team as a whole affects the satisfaction of individual members in a top-down fashion by providing guidelines and norms about what can be expected (Salancik & Pfef-fer, 1978). As a consequence, uniform patterns of satisfaction might emerge. Note that, although prior research referred to this case as “shared satisfaction”, we believe that “uni-form satisfaction” is a more appropriate term, as satisfaction cannot be shared unless it refers to the same target. It is also possible that team members compare their own working conditions to those of their co-workers, resulting in contrast effects (Mussweiler, Ruter, & Epstude, 2004). In this case, satisfaction emerges as a non-uniform, configural construct that can take the form of different distributions or patterns of satisfaction. We describe these patterns in more detail below.
4.3 Shared and Configural Conceptualizations of Team Satisfaction
K. Klein and Kozlowski (2000a) distinguish two basic types of higher-level constructs: shared constructs and configural constructs. Shared constructs are characteristics that are similarly experienced by team members and converge to a collective aspect of the unit as a whole. The associated form of emergence is called composition and entails summarizing or averaging individual responses. Configural constructs do not converge among team members, but each member contributes differently to the higher-level construct. The cor-responding form of emergence is called compilation and entails various data combination techniques, such as minimum, maximum, or variation of individual responses.
Prior research has mostly conceptualized team satisfaction as a uniform construct that emerges through composition processes. However, given empirical findings of satisfaction differences in teams (e.g., van de Voorde et al., 2014), we argue that a uniform construct does not fully capture the complexity of satisfaction in teams (cf. Kimberly, 2011). We therefore propose that team satisfaction can manifest itself both as a uniform and a confi-gural construct (cf. K. Klein & Kozlowski, 2000a). If team members are equally satisfied or dissatisfied, team satisfaction emerges as a uniform construct at the group level and is represented by the team’s average level of satisfaction; if team members have different levels of satisfaction, team satisfaction emerges as a non-uniform, configural construct at the group level and is represented by the configuration or pattern of team members’ indi-vidual satisfaction.
35

While it is relatively straightforward to conceptualize team satisfaction as a uniform con-struct, team members’ individual satisfaction can emerge as a configural construct in diffe-rent ways. In order to organize these possible configurations, we introduce a typology of satisfaction configurations. Prior research identified three basic configurations or forms of higher-level constructs (DeRue, Hollenbeck, Ilgen, & Feltz, 2010; Harrison & Klein, 2007; Shemla, Meyer, Greer, & Jehn, 2014): A form that focuses on the difference between one member and the rest of the team (“disparity”, “minority belief”, or “self-to-team”); a form that focuses on a split within the team (“separation”, “bimodal”, or “split into subgroups”); and a form that focuses on the overall dispersion or spread (“variety”, “fragmented”, or “diverse as a whole”). Our typology of satisfaction follows these previous approaches. Par-ticularly, we focus on the form of uniform satisfaction and three forms of configural satis-faction: fragmented, deviate, and bimodal satisfaction (see Figure 4). All forms are ideal types; that is, we seldom find them in their pure form in organizations. Nevertheless, using ideal forms helps us to reduce complexity and to organize theory regarding their influence on team performance (see, e.g., Doty & Glick, 1994).
Figure 4. Forms of group-level team satisfaction. M1 to M4 = Satisfaction of team members 1 to 4 on an 11-point scale. In the deviate satisfaction form, the deviate might be more or less satisfied than the rest of the team.
Emergence of uniform satisfaction is caused by three factors (cf. Whitman et al., 2010): First, team members might come to similar attitudes towards their team because they encounter the same stimuli, such as a shared working environment. Second, the attrac-tion-selection-attrition framework (Schneider et al., 1995) suggests that team members with different dispositional antecedents of satisfaction are likely to leave the team. Third, uniform satisfaction emerges through the interactions of team members. That is, although each team member might perceive and interpret the internal working environment (e.g., team member collaboration) differently, their perceptions may align and lead to equal levels of satisfaction over time as a result of frequent exchanges and discussions within the team (Kozlowski & Chao, 2012).
Group-level team satisfaction
Configural satisfaction
Uniform satisfaction Fragmented satisfaction Deviate satisfaction Bimodal satisfaction
36
M1 M2 M3 M4 M1 M2 M3 M4 M1 M2 M3 M4M1 M2 M3 M4
10
7,5
5
2,5
0
10
7,5
5
2,5
0
10
7,5
5
2,5
0
10
7,5
5
2,5
0

If team members have different levels of satisfaction, the team falls into one of the three forms of configural satisfaction: Fragmented satisfaction describes the situation in which team members are differently satisfied (i.e., highly, moderately, and little satisfied). Frag-mented satisfaction is likely to occur in early stages of team formation (i.e., in the forming stage, cf. Tuckman & Jensen, 1977), when team members had interacted seldom with each other or when each member of a virtual team works at a different location. In this situati-on, team members’ attitudes do not align so that team satisfaction will be strongly influen-ced by team members’ dispositional characteristics, which can differ between team mem-bers. For example, members might differ in positive and negative affectivity, which selec-tively guide attention towards positive or negative aspects of the working environment (Bowling et al., 2008). Hence, team members might focus on different aspects of the working environment, leading to different attitudes.
In the form of deviate satisfaction, one member’s satisfaction is significantly higher or lower than the team average. Deviate satisfaction can arise because one member has little interaction or infrequent exchange with the other members of the team, for example, if a team member mostly works at home or is socially excluded (Einarsen & Raknes, 1997).
Finally, bimodal satisfaction describes a constellation in which differences in team mem-bers’ levels of satisfaction polarize the team into a satisfied and a dissatisfied subgroup. Subgroups, which comprise of at least two members (Carton & Cummings, 2012), can form because some team members interact and communicate more with each other than with other members of the team, for example, because they work on similar tasks or be-cause members of virtual teams work at different locations. As a result, the perceptions of those members who frequently interact align over time; yet, the perceptions are distinct from those of the other team members, which may lead to the formation of satisfaction subgroups within the team.
4.4 A Multi-Level Framework of Team Satisfaction
Our reasoning about the effects of team satisfaction on team performance builds on the Input-Mediator-Outcome (IMO) team effectiveness framework (Mathieu et al., 2008). Yet, we extend the IMO framework by a multi-level perspective that also considers team mem-bers’ individual team satisfaction, affect and cognition, teamwork and taskwork behaviors, and contributions to the team task (see Figure 5). Our Multi-Level Input-Mediator-Outcome (MIMO) framework rests on two main premises: First, team processes and emergent states mediate the relationship between team satisfaction (input) and team performance (outcome). Second, the relationships between inputs, mediators and outcomes operate on and in between the individual level and the group level.
37

� Figur
e 5. M
ulti-
Leve
l Inp
ut-M
ediat
or-O
utco
me (
MIM
O) fr
amew
ork.
Indi
vidu
al c
ontri
butio
n
e.g.
, del
iver
able
s, w
ork
pack
ages
, ide
as
Team
per
form
ance
e.g.
, pro
duct
ivity
, su
perv
isor
ratin
gs,
qual
ity o
f wor
k
Emergent group level Individual level
Indi
vidu
al
affe
ct /
cog
nitio
n
e.g.
, attr
actio
n to
the
team
, tru
st to
war
ds
mem
bers
Team
affe
ct /
cog
nitio
n (e
mer
gent
sta
tes)
e.g.
, coh
esio
n,co
mm
itmen
t, tru
st c
limat
e
Indi
vidu
al te
amw
ork
/ ta
skw
ork
beha
vior
s
e.g.
, hel
ping
, sup
port
,in
form
atio
n sh
arin
g
Team
beh
avio
rs
(pro
cess
es)
e.g.
, com
mun
icat
ion,
co
oper
atio
n, c
onfli
ct
man
agem
ent
Team
sat
isfa
ctio
n
e.g.
, with
the
team
as
a w
hole
, with
team
co
llabo
ratio
n
Team
sat
isfa
ctio
n co
nfig
urat
ion
unifo
rm, d
evia
tebi
mod
al, f
ragm
ente
d
Inpu
tsM
edia
tors
Outc
omes
Emer
genc
e (b
otto
m-u
p)Cr
oss-
leve
l effe
ct (t
op-d
own)
Dire
ct e
ffect
Feed
back
-loop
bc
d
e
fg
hi
j
a
38

Inputs mark the starting point of the MIMO framework. While satisfaction has sometimes been considered as a mediator (van de Voorde et al., 2014) or an outcome variable (Card, Mas, Moretti, & Saez, 2012), most research is concerned with its consequences (Judge et al., 2001). Following these previous works, team satisfaction forms the individual-level input in our framework. At the group level, team members’ satisfaction emerges as a uni-form or configural property of the team, so that group-level satisfaction forms the group-level input.
Emergent states and processes are mediators that convert group-level inputs into team outcomes. Emergent states are defined as “cognitive, motivational, and affective states of teams” (Marks et al., 2001, p. 357), such as cohesion, commitment and trust climate. Emergent states are group-level constructs that originate at the individual level (Coultas, Driskell, Burke, & Salas, 2014). For instance, if all team members are attracted to the team (i.e., an individual-level cognition), the team as a whole is characterized as cohesive (i.e., an emergent state at the group level). Processes are defined as interdependent actions of team members (e.g., communication, cooperation, and conflict management) that aim to achieve collective goals (Marks et al., 2001). Team processes, such as cooperation and conflict resolution, also originate at the individual level in the form of team members’ behaviors. For instance, cooperation emerges as patterns of team members’ individual hel-ping and supporting behaviors.
Prior research used a variety of effectiveness criteria to assess team outcomes, such as actual performance (e.g., productivity, supervisor ratings, and quality of work), attitudes (e.g., trust), and behaviors (e.g., absenteeism or counterproductive work behaviors). We focus on actual team performance and consider attitudes and behaviors as mediators. Yet, since we are interested in performance at the group level, the MIMO framework takes into account that team performance itself is an emergent team property that arises through team members’ individual tangible or intangible contributions to the team task (e.g., deliverables, work packages, and ideas) (Katzenbach & Smith, 2005).
The MIMO framework acknowledges that most relationships between group-level con-structs, such as emergent states and team processes, are, in fact, cross-level relationships that are mediated through the individual level. For instance, LePine, Piccolo, Jackson, Mathieu, and Saul (2008) found a strong relationship between cohesion and interperso-nal processes. Due to its multi-level architecture, the framework explains how this relationship operates across levels: Cohesion does not affect interpersonal processes directly, but af-fects individual behaviors, such as motivating and conflict management (Path c), which then emerge to the group level. The only relationship between two group-level constructs considered in the framework is the one between team processes and team performance (Path d) because processes such as coordination affect team performance over and above team members’ individual contributions to the team task.
In the next section, we develop propositions about the influence of team satisfaction on team performance. We apply the MIMO framework to structure our arguments. Similar to the IMO, the MIMO framework also incorporates episodic cycles and feedback loops between inputs, mediators and outcomes (Mathieu et al., 2008). We discuss these feed-back loops and temporal dynamics of team satisfaction in a later section.
39

4.5 The Influence of Team Satisfaction on Performance
4.5.1 Uniform Satisfaction
Uniform satisfaction is the most thoroughly researched form of satisfaction. Although a meta-analysis found that uniform satisfaction is positively related to the performance of teams and business units, the authors concede that we know little about “the mechanisms through which it [uniform satisfaction] affects important organizational variables […]” (Whitman et al., 2010, p. 46). Based on the MIMO framework, we argue that the proces-ses that underlie this relationship are located at the individual and the group level.
Prior research substantiated that individual-level satisfaction is positively related to team-work and taskwork behaviors (Path a in the MIMO framework), such as team members’ job involvement and citizenship behaviors (Kinicki et al., 2002). The more satisfied each team member is, the higher his or her motivation and the more he or she will contribute to the team task (Path g), which positively affects team performance. Additionally, if all members engage in teamwork and taskwork behaviors, team processes will benefit (E. R. Crawford & LePine, 2013), which also improves team performance (Path d).
The relationship between individual satisfaction and team processes has received strong empirical support. For instance, satisfaction positively affects communication in teams resulting in more knowledge sharing (Wang & Noe, 2010), which increases the stock of knowledge team members can use to solve work-related problems. Higher levels of satis-faction are also positively related to cooperation (Scott, Bishop, & Chen, 2003), which improves the efficiency of team members’ interactions. Thus, the MIMO framework pro-poses that team members’ satisfaction affects individual teamwork and taskwork behaviors, as denoted in Path a, and that these behaviors manifest in the form of team processes and individual contributions.
At the group level, uniform satisfaction affects team members’ affect and cognitions across levels (Path b) which, in turn, manifest as emergent states. Having the same attitudes towards internal facets increases the bonding between members (Byrne, 1961) so that we expect positive effects on team commitment, identification, and cohesion. These emergent states positively affect team members’ teamwork and taskwork behaviors across levels (Path c): For instance, team commitment (Bishop, Dow Scott, & Burroughs, 2000) and identification (Farmer, Van Dyne, & Kamdar, 2015) both foster members’ citizenship beha-viors (Riketta, 2002). Furthermore, in highly cohesive teams, members are more likely to share information (Mesmer-Magnus & Dechurch, 2009) and less likely to engage in social loafing (Hoigaard, 2006).
In summary, uniform satisfaction affects team performance through each member’s team-work and taskwork behaviors at the individual level (Path a) and through team members’ affect and cognitions across levels (Path b). Therefore, we propose:
Proposition 1: In the form of uniform satisfaction, the team’s average level of satisfaction is positively related to team performance.
40

4.5.2 Comparing the Forms of Configural Satisfaction to Uniform Satisfaction
In this section, we develop propositions about the relationship between configural satisfac-tion and team performance. Our propositions regarding configural satisfaction differ from the proposition we formulated for uniform satisfaction because configurations are catego-rical variables. Therefore, we follow previous studies and compare the effects of different configurations with each other (cf. O'Leary & Mortensen, 2010). In the first set of proposi-tions, we compare the effects of fragmented, deviate, and bimodal satisfaction on team performance to the effects of uniform satisfaction. In the second set of propositions, we compare the effects of the different configurations on team performance with each other.
It is important to note, however, that average level and configuration of satisfaction are not independent. For instance, a team with only one dissatisfied member will inevitably have a moderate to high average level of satisfaction. To avoid confounding between the average level of satisfaction and configuration of satisfaction, we compare the satisfaction configurations at equal average levels of satisfaction.
Fragmented vs. uniform satisfaction. We propose that teams with fragmented satisfac-tion perform worse than teams with uniform satisfaction, because differences in team members’ satisfaction impair emergent states and team processes.
When members have different attitudes towards internal facets such as the team task or collaboration, they are likely to differ in team-related behaviors. Whereas highly satisfied members engage in citizenship behaviors and excel in terms of quality and quantity of work, dissatisfied members are less likely to help others and will invest little effort in their work (Path a) (Kinicki et al., 2002). These differences in teamwork and taskwork behaviors at the individual level can have negative effects on team functioning and performance, because they impair perceptions of distributive and interactional peer justice (Cropanzano, Li, & Benson III, 2011). Indeed, several studies show that perceived workload sharing and balance of contributions positively affect team processes such as communication and co-operation, and emergent states such as cohesion, loyalty and potency (Barrick, Stewart, Neubert, & Mount, 1998; Carless & De Paola, 2000; Cropanzano et al., 2011). Furthermore, differences in behaviors such as punctuality or work speed reduce team identification and in-crease the likeliness of relationship conflicts (Hentschel, Shemla, Wegge, & Kearney, 2013).
At the group level, fragmented satisfaction will impair team members’ affect and cognitions across levels. Research in social psychology suggests that team members are attracted to and prefer interaction with members who have similar attitudes and values (Byrne, 1961; Turner, Hogg, Oakes, Reicher, & Wetherell, 1987). Yet, in teams with fragmented satisfac-tion, mutual attraction of team members will suffer because members hold a wide range of different attitudes towards the team. In line with this reasoning, research found that differences in satisfaction reduce group cohesiveness (Harrison et al., 1998) and social in-tegration in work groups (Guillaume, Brodbeck, & Riketta, 2012; van der Vegt, 2002). In the MIMO framework, these relationships are represented by proposing a cross-level rela-tionship between fragmented satisfaction and individual-level affect and cognitions — in this case attraction to the team (Path b). Therefore, we propose:
Proposition 2: At the same average-level of satisfaction, teams with fragmen-ted satisfaction perform worse than teams with uniform satisfaction.
41

Deviate vs. uniform satisfaction. In the deviate satisfaction form, satisfaction of one member is either higher or lower than the satisfaction of the rest of the team. Compared to a team with the same average level of uniform satisfaction, we propose that the deviate form negatively affects team performance, independent of whether the satisfaction of the deviant member is lower or higher than the satisfaction of the other team members.
Drawing on theories in social psychology, we expect majority members to exclude a team member with deviating attitudes. For example, self-categorization theory (Turner et al., 1987) presumes that a deviant group member will be less liked than prototypical mem-bers, because he or she threatens the group’s integrity (Hogg & Terry, 2000). Similarly, balance theory (Heider, 1958) suggests that, in a configuration in which one member holds different attitudes than the rest of the team, the deviator and the majority tend to dislike each other. In other words, deviate satisfaction will have a positive effect on affect and cognitions of majority members, and a negative effect on affect and cognition of the minority member (Path b). Because of their similar attitudes, members of the majority will emerge to a highly cohesive subgroup whose members will be committed to each other, but not to the deviate member. The majority members will also perceive the deviator as less trustworthy, because they have difficulties anticipating his or her future behavior (Chou, Wang, Wang, Huang, & Cheng, 2008).
This configuration of commitment, cohesion, and trust will affect team members’ indivi-dual teamwork and taskwork behaviors (Path c), thereby disrupting team processes and impairing individual contributions (Path g). Because the relationship between the majority and the deviate member will be characterized by low levels of trust, members will with-hold information from the other party, which negatively affects team effectiveness (Staples & Webster, 2008). Note that this process constitutes a cross-level effect, where an emer-gent state — (configural) trust climate — affects an individual-level behavior — information sharing. Furthermore, due to their low attraction, the majority and the deviate member will avoid interacting with each other, which will negatively affect communication and cooperation between the majority and the deviate member (Balliet et al., 2014). Coopera-tion is, however, an emergent property on the group level, which emerges from team members’ individual behaviors such as helping, support, and information sharing. These group-level processes mediate the relationships between the different forms of group-level satisfaction and team performance (Path d).
Finally, these team behaviors, such as the exclusion of a single team member, will affect the deviate member’s self-esteem (Penhaligon, Louis, & Restubog, 2009) and well-being (Hitlan, Cliffton, & DeSoto, 2006). In other words, prior findings suggest a cross-level effect from team processes to individual team members’ affect and cognitions (Path e). In turn, individual affective states such as self-esteem and well-being affect individual taskwork behaviors such as counterproductive work behaviors (Kouchaki & Wareham, 2015; see Path f). Given that individual taskwork behaviors emerge to group-level behaviors (see above), and given that team processes affect team performance (Path d), we propose:
Proposition 3: At the same average-level of satisfaction, teams with deviate satisfaction perform worse than teams with uniform satisfaction.
Bimodal vs. uniform satisfaction. In the bimodal satisfaction form, the team is split into two differently satisfied subgroups. Self-categorization theory (Turner et al., 1987) posits
42

that such a configuration affects members’ individual attraction to and identification with other team members (Path b), leading to the formation of identity-based subgroups — which is essentially an emergent (configural) team property (Carton & Cummings, 2012).
We expect that these subgroups exert negative cross-level effects that impair individual-level teamwork and taskwork behaviors (Path c) and subsequent individual contributions (Path g) and emergent team processes: Members of different subgroups tend to be posi-tively biased and more cooperative towards ingroup members (Ruffle & Sosis, 2006). For instance, members communicate less and avoid sharing information with outgroup mem-bers (Lau & Murnighan, 2005; O'Leary & Mortensen, 2010). Research has also shown that subgroup formation can decrease individual effort and contribution to the team task (Meyer, Schermuly, & Kauffeld, 2015; see Paths c and g). These patterns of individual behaviors then emerge to unfavorable team processes such as poor coordination and cooperation which, eventually, decrease team performance. Identity-based subgroups are also well-known sources of relationship conflicts (Thatcher, Jehn, & Zanutto, 2003). Because the structural hole between the subgroups complicates conflict resolution, conflicts within the team might endure or escalate. Inter-subgroup conflicts further distract from task fulfill-ment (de Wit, Greer, & Jehn, 2012; Thatcher et al., 2003). Given that team performance emerges from team members’ individual contributions, we propose:
Proposition 4: At the same average-level of satisfaction, teams with bimodal satisfaction perform worse than teams with uniform satisfaction.
4.5.3 Comparing the Forms of Configural Satisfaction with Each Other
In this section, we compare the effects of the three configural forms of team satisfaction on team performance with each other. Because each form can exhibit different levels of satis-faction dispersion (i.e., different standard deviations) — for example, subgroups’ satisfac-tion levels might differ moderately or highly — we will compare teams at equal average levels of satisfaction and equal levels of dispersion.
Fragmented vs. deviate and bimodal satisfaction. We propose that fragmented satisfac-tion is less detrimental to team performance than deviate and bimodal satisfaction. At the group level, we expect that although the team might be fragmented into multiple satisfac-tion subgroups, low attitudinal differences prevent polarization and reduce the threat of inter-subgroup conflicts (Polzer, Crisp, Jarvenpaa, & Kim, 2006). Fragmented satisfaction might also facilitate productive work-related discussions within the team (Morrison, 2011). Unlike teams with deviate and bimodal satisfaction, teams with fragmented satisfaction include moderately satisfied members who might bridge the gap between the satisfied and dissatisfied members and mediate team discussions. Such discussions might initiate reflec-tions among team members, help resolve sources of dissatisfaction, and result in changes to routines and processes. In line with this argument, Tsai and Sish (2010) found a stronger negative relationship between attitude strength and cooperation when team member’s attitudes were polarized than when they were mixed. Furthermore, a team with fragmen-ted satisfaction is more likely to perceive itself as a coherent whole than teams with bimo-dal or deviate satisfaction because there will be no exclusion and polarization based on attitudes. Thus, members will still be committed to their team and team cohesion will be relatively high.
43

We also expect that fragmented satisfaction exerts less negative cross-level effects on indi-vidual teamwork and taskwork behaviors compared to teams with deviate or bimodal satisfaction. First, knowing that other members feel similarly about the issue in question, the least satisfied member will be more likely to talk about his or her dissatisfaction, which might help him or her to cope with the dissatisfaction (Weeks, 2004) and reduce the likeli-ness of negative affect, cynicism, and counterproductive work behaviors. Therefore, the least satisfied member will exert less negative effects on team performance when satisfac-tion is fragmented. Second, the relatively low faultline strength in teams with fragmented satisfaction increases the likeliness that members communicate and share knowledge with each other compared to the bimodal or deviate forms. Therefore, we propose:
Proposition 5: At the same average-level and dispersion of satisfaction, teams with fragmented satisfaction perform better than teams with deviate satisfaction.
Proposition 6: At the same average-level and dispersion of satisfaction, teams with fragmented satisfaction perform better than teams with bimodal satisfaction.
Deviate vs. bimodal satisfaction. Finally, we assume that teams with deviate satisfaction perform better than teams with bimodal satisfaction. We argue that cohesion in teams with deviate satisfaction will be higher than in teams with bimodal satisfaction, because the majority shares satisfaction or dissatisfaction. Uniform satisfaction is positively related to team cohesion (Spink, 2005), and researchers have argued that cohesion also results from shared dissatisfaction (Dineen et al., 2007; Weeks, 2004), because having similar attitudes increases mutual attraction (Byrne, 1961) and social integration (van der Vegt, 2002). While in the deviate form, the majority of members will be highly cohesive, the bimodal form will be comprised of two cohesive subgroups. Because subgroup members tend to identify with their subgroup and not with the team as a whole, within-team cohe-siveness suffers (Carton & Cummings, 2012). Consequently, the team’s overall cohesion will be higher in the deviate form than in the bimodal form (Beal, Cohen, Burke, & McLendon, 2003).
Additionally, we expect that within-team cooperation is higher in teams with deviate satis-faction than in teams with bimodal satisfaction. In the bimodal form, team members main-ly cooperate with members of their own subgroup and avoid cross-subgroup interactions; in the deviate form, the majority of members will cooperate with each other, despite one member having different attitudes. Thus, although both forms impair cooperation, the effects will be stronger in the bimodal than in the deviate form.
We further assume that conflicts between the deviator and the majority are less harmful to team viability than conflicts between subgroups. Given that in the deviate form most team members are mutually attracted, conflicts will mainly affect the deviator but not the whole team, which might further strive to accomplish the team’s goals. In contrast, if the team is split into subgroups, members might get “locked” into conflicts, especially when the sub-groups are similar in size (Carton & Cummings, 2012). These conflicts will affect the team as a whole and jeopardize its viability.
Finally, we expect that bimodal satisfaction exerts more negative cross-level effects com-pared to teams with bimodal satisfaction. The lower cohesiveness in teams with bimodal satisfaction increases the likeliness for short-term absenteeism (Sanders & Nauta, 2004)
44

and counter-productive work behaviors (O'Boyle, Forsyth, & O'Boyle, 2011), and reduces the likeliness that members of different subgroups support and help each other with their tasks (Kidwell, Mossholder, & Bennett, 1997). Therefore, we propose:
Proposition 7: At the same average-level and dispersion of satisfaction, teams with deviate satisfaction perform better than teams with bimodal satisfaction.
Table 8 summarizes our propositions regarding the effects of uniform and configural satis-faction on team performance.
Table 8Propositions Regarding the Effects of Group-Level Satisfaction Forms on Team Performance
4.5.4 Feedback Loops
Throughout the paper, we assumed a path from inputs (team satisfaction) through media-tors (affect, cognition, and behaviors) to outcomes (performance), both on the individual and the group level. However, this oversimplifies the case because mediators and outcomes will also react upon individual satisfaction. Therefore, the MIMO framework also posits feedback loops, which we outline in this section.
First, although performance is usually regarded as a consequence of satisfaction (Riketta, 2008), some authors argue that performance is also an antecedent of satisfaction, or that satisfaction and performance are reciprocally related (Judge et al., 2001). For instance, team leaders, customers or the team itself often provide feedback and appraisal regarding team performance to ensure future outcome quality (Levy & Williams, 2004). These per-formance appraisals elicit positive or negative affective reactions such as happiness, pride, shame and guilt, and cognitions such as turnover intentions and justice perceptions among team members (Belschak & Den Hartog, 2009; Lam, Yik, & Schaubroeck, 2002; see Path i). According to affective events theory (Weiss & Cropanzano, 1996), these cognitions and
Form of team satisfaction
Proposition Focal Referent Proposition
1 Uniform - Average level of satisfaction is positively related to team performance
2 Fragmented Uniform Fragmented < Uniform
3 Deviate Uniform Deviate < Uniform
4 Bimodal Uniform Bimodal < Uniform
5 Fragmented Deviate Fragmented > Deviate
6 Fragmented Bimodal Fragmented > Bimodal
7 Deviate Bimodal Deviate > Bimodal
45

affective experiences at work independently affect individual satisfaction (Path h). Specifi-cally, the theory suggests that team members recall affective episodes and integrate them into an overall judgement of satisfaction. Therefore, the MIMO framework proposes that team performance in an earlier performance episode will affect subsequent individual sa-tisfaction (Path i), and that this effect is mediated by team member affect and cognition (Path h).
Second, we propose that emergent states at the group level influence individual satisfac-tion. When team members’ affect and cognition coalesce, they form conceptually distinct group-level constructs that influence individual satisfaction over and above the effects of affect and cognition of individual team members. Emergent states serve as the background or context of team member interaction and influence how members perceive their internal working environment. For instance, if positive traits such as trust and potency are ascribed to the team, working in this team will be regarded more enjoyable than working in a team with a poor rating on these attributes. In support of this assumption, studies have shown that team member satisfaction is influenced by emergent states such as team trust (Costa, 2003), team mental models (Marques Santos & Margarida Passos, 2013), and cohesiveness and potency (Duffy & Shaw, 2000). This process is denoted in the MIMO framework (Path j).
4.6 Discussion
Although research on team satisfaction has grown in recent years, prior research mostly followed a collectivist approach to team satisfaction and did not consider the multi-level nature of team satisfaction and its relationship to team performance. Addressing these issues, the purpose of this paper was to introduce a configural view on team satisfaction and to develop multi-level theory on its relationship to team performance. Below, we ex-amine the theoretical contributions of our analysis, and outline directions for future research.
4.6.1 Theoretical Implications
Our paper makes multiple contributions to the literature on team satisfaction. Shared con-structs and the composition form of emergence have been the predominant focus of team research over the last decades. However, researchers recently suggested that group-level constructs such as team justice perceptions (Roberson & Colquitt, 2005), team efficacy (DeRue et al., 2010), and team trust (De Jong & Dirks, 2012) can also emerge through compilational processes and, thus, have to be conceptualized as configural constructs. Our paper connects to this broader movement in team research. We have discussed throughout this paper that emergence processes related to individual satisfaction might lead to both homogeneity (i.e., a uniform construct) and heterogeneity (i.e., a configural construct). This approach represents a departure from previous research that defined team satisfac-tion as a “shared internal state” (Whitman et al., 2010, p. 46).
Conceptualizing team satisfaction as a configural construct has several implications for research: First, our framework points to the mechanisms that underlie the relationship between team satisfaction and team performance, which might help to explain inconclusive
46

results of previous studies. Whereas many studies found a strong effect of the average level of satisfaction on team performance (Whitman et al., 2010), some found a weak (Harter et al., 2002), or even no effect (van de Voorde et al., 2014). The MIMO framework ex-plains these inconclusive findings with differences in teams’ form of satisfaction. According to the framework, at the same average level of satisfaction, performance of teams with uniform satisfaction is higher than performance of teams that fall in one of the three con-figural forms. Indeed, agreement statistics indicate that Whitman et al.’s (2010) meta-analysis, which found a strong effect of average satisfaction on team performance, inclu-ded only teams with uniform satisfaction, whereas Van de Voorde et al. (2014), who found no significant effect, included teams and business units which did not share satisfaction. This argument is further supported by the moderating effect of team consensus on the relationship between uniform satisfaction and team performance (Whitman et al., 2010). Thus, the MIMO framework helps to integrate inconclusive empirical findings and indicates that considering different forms of configural satisfaction yields insights that help us better understand and predict team performance.
Second, this paper contributes to research on team satisfaction by extending the Input-Mediator-Outcome framework with a multi-level perspective. In doing so, we do justice to the fact that team satisfaction and its relationship to emergent states, team processes, and performance are essentially multi-level phenomena. Given that we specified detailed pro-cesses and feedback loops underlying the more general propositions, the MIMO frame-work allows deducting a very fine-grained set of hypotheses for empirical testing. These span from the individual to the group level, illustrating the importance of taking both levels into account when decomposing the complex processes that operate between team satis-faction and performance. In this way, the MIMO framework could also serve as a blueprint for theorizing about the effects of other important team composition variables.
Finally, and on a more general note, our paper suggests that group-level constructs in general deserve more theoretical scrutiny apart from checking statistical criteria to justify aggregation. To date, many group-level constructs such as team positivity (B. West et al., 2009), team emotional skills (Troth, Jordan, Lawrence, & Tse, 2011), and team citizenship behavior (Pearce & Herbik, 2004) are considered to be shared constructs. However, as we agued throughout the paper, these constructs can also take on configural forms. For in-stance, drawing on the relationship between individual satisfaction and helping behavior, we hypothesized that satisfied members will be more inclined to help their teammates than dissatisfied members, resulting in an uneven distribution of citizenship behavior. In this case, a configural conceptualization of team citizenship behavior would be more appropriate than a conceptualization as a shared construct.
4.6.2 Implications for Measurement
Our paper also has some implications for measurement. Researchers should ensure that their measures allow for assessing both uniform and configural forms of team satisfaction. Previous research used either the individual team member (e.g., “I am satisfied with my team”) or the team as a whole (“Our team is satisfied with its work”) as the referent for the items (for a review, see Wallace et al., 2013). The latter approach, which is known as referent-shift consensus model (Chan, 1998), assumes that all team members have the same level of satisfaction. If they do, the team average is a meaningful reflection of a
47

uniform attitude. However, if team members disagree on referent-shift items, we only know that they have different opinions about the team’s overall satisfaction, but we do not know how individual satisfaction is distributed within the team. In cases of disagreement, neither the average nor the dispersion of referent-shift items can be meaningfully interpre-ted. Conversely, if we choose the individual as the referent, data can be interpreted in cases of agreement and disagreement. Therefore, we recommend assessing team satisfaction with the individual member as the referent.
4.6.3 Implications for Future Research
Our paper suggests directions for future research that go beyond testing the propositions. To reduce the complexity of our framework, we did not consider that groups are dynamic entities that are subject to social influences (Latané, 1996), although the feedback loops in the MIMO framework indicate that team satisfaction is a dynamic construct. Over time, team members’ satisfaction might vary (Liu, Mitchell, Lee, Holtom, & Hinkin, 2012) so that teams might change from one form of satisfaction to another. This raises questions about the initial development, stability, and transitions between different forms of satisfac-tion, which should be addressed in future research.
The form of satisfaction might initially depend upon the stage of team development (Tuckman & Jensen, 1977). In early stages, processes that lead to satisfaction homogeneity, such as sharing experience (Mason, 2006), have not taken effect. Therefore, team satisfac-tion will be strongly influenced by members’ own dispositional characteristics, such as core self-evaluations (Judge et al., 1998). Thus, a team is likely to fall into a fragmented satis-faction form in the early stage of team development. When team members have worked together for some time, processes such as homogenization, exclusion, and polarization can change the fragmented satisfaction form into a uniform, deviate, or bimodal form. Future studies could analyze how team satisfaction changes during the developmental stages and under which conditions a uniform, deviate, or bimodal satisfaction form develops over time.
Future research might also focus on stability and transitions between the different satisfac-tion forms. We assume that deviate satisfaction is the most unstable form, because the deviate member is likely to adapt to the majority or vice versa. According to the social information processing approach to job attitudes (Salancik & Pfeffer, 1978), a majority which frequently expresses their attitude about specific aspects of work will affect the de-viate’s perceptions and attitudes, so that uniform satisfaction might emerge. However, the majority might also adapt to the deviate member. Being the only member who holds dif-ferent attitudes than the rest of the team is not comfortable and might be a source of cogni-tive dissonance (Matz & Wood, 2005). To alleviate this negative experience, the deviate member might seek the support of his or her teammates to confirm his or her view about the aspect in question. Depending on the deviator’s personal characteristics, role, and sta-tus, he or she might convince some teammates of his or her views, resulting in a bimodal form of satisfaction. Future research should attempt to identify the conditions under which the different satisfaction forms are stable and under which they are likely to change into different forms.
48

4.7 Conclusion
Prior research has mostly conceptualized team satisfaction as a uniform construct and neglected that team members might be differently satisfied. By theorizing that team satis-faction can be a uniform and a configural construct, our aim was to provide a more com-prehensive perspective on satisfaction within work teams. The different forms of satisfac-tion were integrated in a multi-level input-mediator-outcome (MIMO) framework that explains the relationship between team satisfaction and team performance within and across levels of analysis. We are confident that this configural multi-level view opens up new avenues for research on team satisfaction.
49


5 Study 2a: Construction and Validation of a Short Measure to Assess General and Facet-Specific Job Satisfaction
Benjamin HaarhausTU Chemnitz, Germany
Published in Diagnostica, 62, 61–73 2
Abstract (English)
Although an economical and differentiated assessment of job satisfaction is important for research and practice, German job satisfaction scales are often extensive or cannot differen-tiate between satisfaction facets. The present article aims to fill this gap by constructing and validating a short questionnaire to assess general and facet-specific job satisfaction (KAFA). Based on different versions of the Job Descriptive Index (JDI) and its German equivalent (ABB), a 30-item short questionnaire is developed that assesses general job satisfaction as well as satisfaction with the work itself, coworkers, promotions, pay, and supervision. Given its satisfactory psychometric properties, KAFA allows for a reliable, va-lid, and economical measurement of job satisfaction and its facets in the German language.
Abstract (German)
Obwohl eine ökonomische und differenzierte Erfassung von Arbeitszufriedenheit für For-schung und betriebliche Praxis von hoher Relevanz ist, sind deutschsprachige Messinstru-mente meist sehr umfangreich oder nicht in der Lage, zwischen Zufriedenheitsfacetten zu differenzieren. Vor diesem Hintergrund besteht das Ziel des Beitrags darin, auf Basis ver-schiedener Versionen des Job Descriptive Index (JDI) und des Arbeitsbeschreibungsbogens (ABB) einen Kurzfragebogen zur Erfassung von Allgemeiner und Facettenspezifischer Arbeitszufriedenheit (KAFA) zu entwickeln und zu validieren. Anhand von zwei Stichpro-ben (N = 594) wird ein 30 Items umfassender Kurzfragebogen entwickelt, mit dem sich die Gesamtzufriedenheit sowie die Zufriedenheit mit den Tätigkeiten, Kolleginnen und Kollegen, Entwicklungsmöglichkeiten, der Bezahlung und der/dem Vorgesetzten reliabel, valide und ökonomisch messen lassen.
German title: „Entwicklung und Validierung eines Kurzfragebogens zur Erfassung von allgemeiner und facettenspezifi2 -scher Arbeitszufriedenheit“
51

5.1 Einleitung
Arbeitszufriedenheit zählt zweifelsohne zu den prominentesten Konstrukten der Arbeits- und Organisationspsychologie. Ihre Prominenz hat sie wohl weniger der ethischen Maxime der Gewährleistung einer zufriedenen Belegschaft zu verdanken, sondern vielmehr dem Glauben an die hohe Leistungsfähigkeit zufriedener Mitarbeiterinnen und Mitarbeiter. In der Tat konnte in einer Vielzahl von empirischen Untersuchungen gezeigt werden, dass eine zufriedene Belegschaft für Organisationen von Vorteil ist. So wirkt sich hohe Zufrie-denheit nicht nur positiv auf die Arbeitsleistung aus (Judge et al., 2001), sondern auch auf Gesundheit (Basch & Fisher, 2000), Absentismus (Ybema et al., 2010), Wechselbereit-schaft (Wright & Bonett, 2007), Produktivität (Patterson, Warr, & West, 2004) und das Verhalten am Arbeitsplatz (Foote & Tang, 2008). Nicht zuletzt sind Arbeitgeber aufgrund des Arbeitsschutzgesetzes (ArbSchG: Arbeitsschutzgesetz, 2014) dazu verpflichtet, die Ar-beitsbedingungen auf mögliche Gefahren hin zu beurteilen, was nach §5 Abs. 3 Nr. 6 des ArbSchG auch explizit psychische Belastungen bei der Arbeit miteinschließt. Informatio-nen zur Arbeitszufriedenheit bzw. -unzufriedenheit können hier als Belastungsindikatoren fungieren und helfen, die Ursachen psychischer Belastungen zu erkennen und entspre-chende Interventionsmaßnahmen abzuleiten.
Vor diesem Hintergrund verwundert es nicht, dass sowohl Vertreter der Wissenschaft als auch der betrieblichen Praxis großes Interesse daran haben, Arbeitszufriedenheit zu mes-sen. Die hierfür zum Einsatz kommenden Messinstrumente sollten prinzipiell drei Ansprü-chen genügen: Erstens müssen sie die Hauptgütekriterien psychologischer Messinstrumen-te erfüllen, d. h. sie müssen die Arbeitszufriedenheit objektiv, reliabel und valide erfassen. Zweitens ist es in der Regel von Vorteil, nicht nur die Gesamtzufriedenheit, sondern auch die Zufriedenheit mit spezifischen Teilbereichen der Arbeit (Facetten) zu erfassen. Facet-tenspezifische Zufriedenheit ist zum einen relevant, da Zufriedenheitsfacetten unterschied-liche Verhaltensweisen unterschiedlich gut vorhersagen (Kinicki et al., 2002). Zum ande-ren lassen sich aus Ergebnissen von Zufriedenheitsbefragungen nur dann Interventions-maßnahmen ableiten, wenn sie auf Teilbereiche der Arbeit hinweisen, mit denen die Mit-arbeiterinnen und Mitarbeiter unzufrieden sind. Drittens sind Fragen zur Arbeitszufrie-denheit meist in umfangreichere Mitarbeiterbefragungen oder Forschungsvorhaben einge-bettet, deren Teilnahme in aller Regel freiwillig erfolgt. Da längere Befragungen häufiger abgebrochen werden als kürzere (Hoerger, 2010), sollte die Messung der Zufriedenheit möglichst ökonomisch, d. h. mit geringem Zeitaufwand erfolgen.
Die derzeit eingesetzten deutschsprachigen Messinstrumente werden diesen Ansprüchen jedoch nur teilweise gerecht. Während im englischen Sprachraum mit der Abridged Job in General Scale (AJIG; Russell et al., 2004) und dem Abridged Job Descriptive Index (AJDI; Stanton et al., 2001) valide Kurzskalen zur Messung von allgemeiner und facettenspezifi-scher Arbeitszufriedenheit vorliegen, sind deutschsprachige Verfahren zu umfangreich und komplex, erfassen keine Zufriedenheitsfacetten oder haben keine zufriedenstellenden Gütekriterien. Vor diesem Hintergrund besteht das Ziel dieses Beitrags darin, einen Kurz-fragebogen zur Erfassung von Allgemeiner und Facettenspezifischer Arbeitszufriedenheit (KAFA) zu entwickeln und zu validieren.
52

5.2 Deutschsprachige Verfahren zur Messung von Arbeitszufriedenheit
In einer Literaturanalyse untersuchte Ferreira (2007), welche Verfahren zur Messung von Arbeitszufriedenheit im deutschsprachigen Raum eingesetzt werden. Zu den häufig einge-setzten Verfahren zählen demnach der Arbeitsbeschreibungsbogen (ABB; Neuberger, 1976), die Skala zur Erfassung der Arbeitszufriedenheit und ihre Kurzversion (SAZ bzw. SAZK; Fischer & Lück, 1972) sowie der Arbeitszufriedenheits-Kurzfragebogen (AZK; Bruggemann, 1976). Häufig wird die Arbeitszufriedenheit auch mit einzelnen Items (Ein-Item-Skalen) erfasst (Wanous & Hudy, 2001).
Der Arbeitsbeschreibungsbogen (ABB) von Neuberger (1976) stellt eine deutschsprachige Adaptation des Job Descriptive Index (JDI; P. Smith et al., 1969) dar. Er besteht aus einer Liste mit positiven und negativen Adjektiven und kurzen Aussagen, zu denen die Befrag-ten jeweils angeben sollen, inwiefern sie auf ihre Arbeit zutreffen. Neuberger (1976) er-weiterte die fünf Facetten des JDI (Tätigkeiten, Kollegen/innen, Entwicklungsmöglichkei-ten, Bezahlung und Vorgesetzte/r) um die beiden Facetten Arbeitsbedingungen und Orga-nisation und Leitung. Außerdem fügte er Ein-Item-Skalen zur Messung der erlebten Job-Unsicherheit, der Zufriedenheit mit der Zeiteinteilung sowie der allgemeinen Arbeits- und Lebenszufriedenheit hinzu. Der ABB weist gute psychometrische Kennwerte auf (Neuber-ger & Allerbeck, 1978), ist jedoch mit insgesamt 79 Items recht umfangreich. Ein weiteres Problem des Arbeitsbeschreibungsbogens besteht darin, dass die Gesamtzufriedenheit mit nur einem einzelnen Item gemessen wird. Alternativ lässt sie sich als der mit der subjektiv empfundenen Bedeutung gewichtete Mittelwert der verschiedenen Zufriedenheitsfacetten berechnen. Zur Gewichtung stehen den Befragten insgesamt 80 Gewichtungspunkte zur Verfügung, die vollständig auf die einzelnen Facetten aufzuteilen sind. Während die rein praktische Schwierigkeit der Punkteverteilung durch computerisierte Durchführung ent-schärft werden könnte, stellen sich methodische Kritikpunkte an diesem Vorgehen sub-stantieller dar. Als problematisch erweisen sich hier insbesondere die Konfundierung von Zufriedenheit und Bedeutung sowie die unrealistische Annahme eines Verhältnisskalenni-veaus (Neuberger, 1974). Empirische Studien weisen zudem darauf hin, dass Bedeutungs-gewichtungen von Zufriedenheitsfacetten zu keiner Verbesserung der Validität führen, sondern diese sogar reduzieren können (Quinn & Mangione, 1973; Staples & Higgins, 1998).
Die Skala zur Erfassung der Arbeitszufriedenheit (SAZ) von Fischer und Lück (1972) er-fasst mit insgesamt 37 Items die Zufriedenheit mit neun verschiedenen Arbeitsfacetten. Neben der Langversion existiert eine Kurzversion (SAZK), die die acht trennschärfsten Items enthält. Obwohl den Autoren zufolge Zufriedenheitsfacetten erfasst werden, konnte die Faktorstruktur empirisch nicht bestätigt werden (Neuberger, 1975). Der SAZ ist somit nicht den Facetten-Maßen, sondern den Maßen allgemeiner Arbeitszufriedenheit zuzuord-nen, was seine Nützlichkeit für Interventionsmaßnahmen einschränkt. Die Items sind teil-weise uneindeutig formuliert (z. B. „Meine Arbeit macht mir wenig Spaß, aber man sollte nicht allzu viel erwarten“), was sich negativ auf die messtheoretische Objektivität und folglich auch auf die Reliabilität und Validität auswirkt (Neuberger, 1975). Das Alter des SAZ wird an der Frage nach der Zufriedenheit mit dem „Beruf“ deutlich: War es in den 70er Jahren noch üblich, die eigene Arbeitstätigkeit als seinen Beruf zu bezeichnen, so muss heute zwischen dem eher kurzfristigen, organisationsbezogenen Job und dem eher
53

langfristigen, identitätsstiftenden Beruf unterschieden werden (vgl. auch organizational und occupational commitment nach Cooper-Hakim & Viswesvaran, 2005). So kann ein Arzt beispielsweise mit der Wahl seines Berufs durchaus zufrieden sein, gleichzeitig aber unzufrieden mit seinem Job, der durch seinen aktuellen Arbeitgeber, seine Position und die Tätigkeiten charakterisiert ist.
Der Arbeitszufriedenheits-Kurzfragebogen (AZK) basiert auf dem Zürcher Arbeitszufrie-denheitsmodell (Bruggemann, 1974, 1976). Im Gegensatz zu den meisten anderen Verfah-ren erfasst der AZK nicht die quantitative Ausprägung der Zufriedenheit, sondern qualita-tiv unterschiedliche Typen von Arbeitszufriedenheit und -unzufriedenheit. Während der Fokus auf die Entstehung der Zufriedenheitsurteile in der Wissenschaft großen Anklang fand und bis heute findet (Ziegler & Schlett, 2013), wird der AZK aus methodischer Per-spektive stark kritisiert (z.B. Baumgartner & Udris, 2005; Ferreira, 2009). Bemängelt wer-den insbesondere die komplexen, nicht eindeutig beantwortbaren Items und der quer-schnittliche Ansatz, mit dem sich der Prozesscharakter des Modells nicht erfassen lässt. Zudem differenziert auch der AZK nicht zwischen Zufriedenheitsfacetten, so dass sich hier die gleichen Einschränkungen in Bezug auf Interventionsansätze ergeben wie beim SAZ. Zwar wurden einige der Kritikpunkte in einer Weiterentwicklung aufgegriffen (FEAT; Fer-reira, 2009), was jedoch zu einem methodisch anspruchsvollen und komplexen Verfahren geführt hat, dessen praktische Bewährung noch aussteht (vgl. auch Süß & Haarhaus, 2013).
Die Notwendigkeit ökonomischer Erhebungsinstrumente wird nicht zuletzt daran deutlich, dass Arbeitszufriedenheit häufig mit einzelnen Items der Sorte „Alles in allem, wie zufrie-den sind Sie mit Ihrem Job?“ gemessen wird (Wanous & Hudy, 2001). Bereits die in den ABB integrierte Kunin-Skala (Kunin, 1955) nutzt ein einzelnes Item, bei dem die Befragten ihre Zufriedenheit durch Ankreuzen verschiedener fröhlicher oder trauriger Gesichter zum Ausdruck bringen sollen. Trotz der Tatsache, dass sich Ein-Item-Skalen in der Praxis gro-ßer Beliebtheit erfreuen, ist ihre Nutzung nicht unproblematisch: Laut Wanous et al. (1997) variiert die Reliabilität von Ein-Item-Skalen in Abhängigkeit der zugrunde gelegten An-nahmen zwischen α = .45 und α = .69, was psychometrischen Ansprüchen kaum gerecht wird. Oshagbemi (1999) weist ferner darauf hin, dass Ein-Item-Skalen zu einer Positiv-Verzerrung der Zufriedenheitsurteile führen können. Ein weiterer, rein praktischer Nach-teil der Nutzung einzelner Items ist darin zu sehen, dass sich inkonsistente Antwortmuster nur schwierig identifizieren lassen. Wenn ein gering motivierter Teilnehmer beispielsweise eine aus mehreren Items bestehende Skala „durchkreuzt“, ohne dabei auf invertierte Items zu achten, lässt das Antwortmuster auf geringe Motivation schließen und die Antworten können gegebenenfalls als fehlende Werte deklariert werden. Bei Ein-Item-Skalen besteht hingegen keine Möglichkeit, derartige Antwortmuster zu identifizieren, so dass die Ergeb-nisse hier anfälliger für Verzerrungen sind.
54

5.3 Hintergrund der Skalenentwicklung
Die Defizite der zurzeit verwendeten Verfahren verdeutlichen die Notwendigkeit eines ökonomischen, deutschsprachigen Verfahrens, das sowohl allgemeine als auch facetten-spezifische Arbeitszufriedenheit erfasst. Einen guten Ausgangspunkt dafür bilden die Ver-fahren der „JDI-Familie“, zu der neben dem JDI (P. Smith et al., 1969) die Job in General Scale (JIG; Ironson et al., 1989), die aus diesen Verfahren abgeleiteten Kurzformen AJDI (Stanton et al., 2001) und AJIG (Russell et al., 2004) sowie der ABB (Neuberger, 1976) zählen. Der JDI und seine Derivate bieten sich deshalb als Grundlage an, da sie zu den meistgenutzten (Bowling et al., 2008) und am besten validierten (Kinicki et al., 2002) Verfahren zur Messung von Arbeitszufriedenheit zählen. Von Vorteil ist ferner das einheit-liche Itemformat für allgemeine und facettenspezifische Zufriedenheit, das sich auch für die Entwicklung von Kurzskalen als geeignet erwiesen hat (Russell et al., 2004; Stanton et al., 2001).
Eine Besonderheit des JDI besteht darin, dass die Zufriedenheit nicht direkt gemessen, sondern aus wertenden Beschreibungen abgeleitet wird. Zu einem Oberbegriff (z. B. „Mein/e Vorgesetzte/r“) werden positive und negative Eigenschaften und Verhaltenswei-sen vorgegeben (z. B. „ist fair“ oder „ist da, wenn man ihn/sie braucht“), zu denen die Befragten jeweils angeben sollen, ob bzw. wie stark sie auf den Obergriff zutreffen. Die Arbeitszufriedenheit als evaluatives Urteil über die Arbeit bzw. Teilaspekte der Arbeit (H. Weiss, 2002) spiegelt sich in der Zustimmung bzw. der Nicht-Zustimmung zu den positi-ven und negativen Beschreibungen wider.
Eine wichtige Frage betrifft die Anzahl und Auswahl relevanter Zufriedenheitsfacetten. Arbeitszufriedenheit lässt sich als hierarchisch organisiertes Konstrukt verstehen (Judge & Kammeyer-Mueller, 2012), wobei sich die Gesamtzufriedenheit auf der höchsten Ebene befindet und sich in verschiedene Facetten und Subfacetten untergliedern lässt. Beispiels-weise kann die Facette Bezahlung in die Subfacetten Gehaltshöhe, Gehaltserhöhungen, Zu-satzleistungen und Struktur unterteilt werden (Heneman III & Schwab, 1985). Die Wahl der Betrachtungsebene hängt von der Zielsetzung und den Rahmenbedingungen der Un-tersuchung ab: In der betrieblichen Praxis wird die Unternehmensleitung vor allem an der Gesamtzufriedenheit, die Personalverantwortlichen hingegen an spezifischeren Aussagen zur Zufriedenheit interessiert sein. Auch für Forschungsfragen spielt die Betrachtungsebe-ne eine große Rolle, da sich Zusammenhänge zwischen Zufriedenheit und Verhalten vor allem dann ergeben, wenn sich Prädiktor und Kriterium auf der gleichen Ebene befinden (Ajzen, 2011). Ein neues Messinstrument sollte daher idealerweise verschiedene Detaillie-rungsgrade berücksichtigen. Hierbei ist einschränkend zu beachten, dass die Anzahl der benötigten Items mit der Anzahl der betrachteten Facetten steigt. Besonders detaillierte Verfahren sind daher für manche Anwendungen eventuell zu umfangreich.
Um einen Kompromiss aus Detaillierungsgrad und Praktikabilität zu finden, beschränkt sich der KAFA neben einer Skala für die Gesamtzufriedenheit (G) auf die fünf Facetten Tätigkeiten (T), Kollegen/innen (K), Entwicklungsmöglichkeiten (E), Bezahlung (B) und Vorgesetzte/r (V). Fünf Zufriedenheitsfacetten lassen sich mit einer überschaubaren An-zahl von Items erheben und sind hinreichend differenziert, um praktische Verbesserungs-potenziale zu identifizieren. Die Entscheidung zugunsten der fünf Facetten des JDI be-gründet sich dadurch, dass sie sich in empirischen Studien als bedeutsame Prädiktoren für
55

Leistung, Motivation und Kündigungsabsicht herausgestellt haben und sich zudem fakto-renanalytisch differenzieren lassen (Kinicki et al., 2002). Die hohe Relevanz der gewählten Facetten wird außerdem daran deutlich, dass sie nicht nur in allen Verfahren der JDI-Fami-lie, sondern auch im Job Satisfaction Survey (JSS; Spector, 1985), im Minnesota Satisfac-tion Questionnaire (MSQ; D. Weiss et al., 1967) und dem Facet-Specific Job Satisfaction Questionnaire (Quinn & Staines, 1984) enthalten sind.
5.4 Entwicklung des initialen Itempools
Zur Entwicklung des initialen Itempools wurden verschiedene Verfahren aus der JDI-Fami-lie herangezogen. Alle Items des AJDI (Stanton et al., 2001) und AJIG (Russell et al., 2004) wurden ins Deutsche übersetzt und in den Itempool integriert. Zudem liegen sowohl von AJDI als auch AJIG aktualisierte Versionen (Brodke et al., 2009) vor, deren Items ebenfalls ins Deutsche übersetzt und in den initialen Itempool aufgenommen wurden. Zusätzlich wurden alle Items der Skalen Tätigkeiten, Kollegen/innen, Entwicklungsmöglichkeiten, Bezahlung und Vorgesetzte/r des ABB in den initialen Itempool integriert.
Der Pool wurde anschließend auf redundante Items hin untersucht. Es wurden solche Items als redundant klassifiziert, die dem Wortlaut oder dem Inhalt nach identisch waren. Die verbliebenen Items wurden hinsichtlich ihrer Formulierung vereinheitlicht. Beispiels-weise wurde das Item „kann kaum davon leben“ der Facette Bezahlung in „Meine Bezah-lung… ist so gering, dass ich kaum davon leben kann“ geändert, wobei „Meine Bezah-lung…“ als Überschrift über alle Items dieser Facette platziert wurde. Nach erfolgter Item-selektion enthielt der initiale Itempool insgesamt 83 Items (Tätigkeiten: 19; Kollegen/in-nen: 14; Entwicklungsmöglichkeiten: 11; Bezahlung: 13; Vorgesetzte/r: 18; Gesamtzufrie-denheit: 8). 3
5.5 Validierungshypothesen
5.5.1 Faktorielle Validität
Für die Skala Gesamtzufriedenheit wird eine einfaktorielle Struktur angenommen. Die Items der fünf Zufriedenheitsfacetten sollten auf weitgehend unabhängigen Faktoren laden, so dass sich eine fünffaktorielle Struktur ergibt.
5.5.2 Konstrukt- und Kriteriumsvalidität
Korrelationsmuster. Die Interkorrelationen zwischen den fünf Zufriedenheitsfacetten soll-ten von moderater Höhe sein (Kinicki et al., 2002). Ferner sollten alle Facettenskalen mit der Skala Gesamtzufriedenheit zusammenhängen, insbesondere die Skala Tätigkeiten (Judge & Kammeyer-Mueller, 2012; Stanton et al., 2001).
Der vollständige Item-Pool findet sich in Anhang A7.3
56

Einkommen. Während dem Einkommen häufig eine stark motivierende Wirkung attestiert wird (Saari & Judge, 2004), konnten empirische Studien bislang nur moderate Zusam-menhänge zwischen Einkommen und Arbeitszufriedenheit zeigen (Judge, Piccolo, Podsa-koff, Shaw, & Rich, 2010). Das Einkommensniveau sollte daher nur schwach mit der Skala Gesamtzufriedenheit und etwas höher mit der Skala Bezahlung zusammenhängen.
Job-Charakteristika. Das Job Characteristics Model (Hackman & Oldham, 1980) erklärt den Zusammenhang zwischen Arbeitsmotivation und verschiedenen Job-Charakteristika, wie z. B. Autonomie und Feedback. Da der postulierte Zusammenhang in vielen Studien bestätigt werden konnte (Kinicki et al., 2002), erwarten wir positive Korrelationen zwi-schen den Job-Charakteristika nach Hackman und Oldham (1980) und der Skala Gesamt-zufriedenheit. Auf Facettenebene sind starke Zusammenhänge insbesondere zu der Skala Tätigkeiten zu erwarten, da die Job-Charakteristika hauptsächlich Tätigkeitsaspekte, wie z. B. Anforderungsvielfalt und Bedeutsamkeit, fokussieren.
Kündigungsgedanken und -absicht. Kündigungsgedanken und Kündigungsabsicht soll-ten ebenfalls mit den fünf betrachteten Zufriedenheitsfacetten korrelieren, insbesondere mit der Zufriedenheit mit den Tätigkeiten (Russell et al., 2004).
Arbeitsereignisse und Affekte. Eine Ursache von Arbeitszufriedenheit und -unzufrieden-heit sind laut Affective Events Theory (H. Weiss & Cropanzano, 1996) positive und negati-ve Ereignisse, die während der Arbeit eintreten. Ereignisse, wie z. B. ein nettes Gespräch in der Kaffeeküche oder negatives Leistungsfeedback, rufen positive oder negative Affekte hervor, die sich wiederum auf die Arbeitszufriedenheit auswirken. Die Häufigkeit positiver Arbeitsereignisse und Affekte sollte daher positiv, die Häufigkeit negativer Ereignisse und Affekte hingegen negativ mit der Skala Gesamtzufriedenheit korrelieren. Ferner ist anzu-nehmen, dass sich Arbeitsereignisse, die sich auf bestimmte Facetten der Arbeit beziehen, besonders stark auf die Zufriedenheit mit diesen Facetten auswirken. Beispielsweise soll-ten sich häufige Streitigkeiten mit Kolleginnen und Kollegen vor allem auf die Zufrieden-heit mit den Kolleginnen/Kollegen auswirken, nicht jedoch auf die Zufriedenheit mit den ausgeübten Tätigkeiten. Wir erwarten also Kongruenz zwischen dem Inhalt der Ereignisse und der beeinflussten Zufriedenheitsfacette.
Core Self-Evaluations. Unter den Core Self-Evaluations (dt.: „zentrale Selbstbewertun-gen“) werden die vier Persönlichkeitseigenschaften Selbstwirksamkeit, Selbstwertgefühl, Neurotizismus (negativ gepolt) und Kontrollüberzeugung zusammengefasst (Judge, Locke, & Durham, 1997). Personen mit hohen Ausprägungen auf diesen Faktoren sollten zufrie-dener sein als Personen mit niedrigen Ausprägungen: Zum einen nehmen sie ihre Arbeit als herausfordernd, kontrollierbar und intrinsisch motivierend wahr und konzentrieren sich besonders auf die positiven Aspekte der Arbeit (Judge & Bono, 2001; Srivastava et al., 2010). Zum anderen können positive Core Self-Evaluations als Puffer bzw. Ressource ge-gen Arbeitsbelastungen fungieren und somit zur Zufriedenheit beitragen (Harris, Harvey, & Kacmar, 2009; Karatepe, 2011). Wir erwarten daher positive Zusammenhänge zwischen den Core Self-Evaluations und der Skala Gesamtzufriedenheit.
57

5.6 Methode
Zur Entwicklung und Validierung der Zufriedenheitsskalen wurden zwei Erhebungen durchgeführt. Das Ziel der ersten Erhebung bestand darin, den initialen Itempool zu redu-zieren und die verkürzten Skalen anhand verschiedener externer Kriterien zu validieren. Mit der zweiten Erhebung sollten die verkürzten Zufriedenheitsskalen an einer größeren, unabhängigen Stichprobe kreuzvalidiert werden. Dies ist aus zwei Gründen notwendig: Erstens sind die Kennwerte der Skalen z. T. stichprobenabhängig, da die Items auf Basis ihrer Faktorladungen selektiert wurden. Da der Kontext der anderen Items die Messung beeinflussen kann (Knowles, 1988; Steinberg, 1994) ist zweitens zu überprüfen, ob sich die statistischen Kennwerte der Items und Skalen verändern, wenn sie ohne die anderen Items dargeboten werden. Zudem wurde die zweite Erhebung genutzt, um die Validität der verkürzten Zufriedenheitsskalen an zusätzlichen Kriterien zu überprüfen.
5.6.1 Stichproben
Stichprobe 1. Insgesamt 217 Personen (137 Frauen und 80 Männer) füllten die initiale Version des Fragebogens aus. Die Rekrutierung der Teilnehmerinnen und Teilnehmer bei-der Stichproben erfolgte online. Die Studie wurde zum einen auf der Internetpräsenz eines deutschen Personalberatungsinstituts, zum anderen in verschiedenen Online-Foren und Netzwerken beworben. Die Teilnahme erfolgte in allen Fällen freiwillig und ohne Kompen-sation. Die Teilnehmerinnen und Teilnehmer waren durchschnittlich 33.2 (SD = 9.5) Jah-re alt und standen seit durchschnittlich 12.2 (SD = 9.6) Jahren im Berufsleben. Der Groß-teil der Befragten (59 %) gab an, sich in einem Normalarbeitsverhältnis in der Privatwirt-schaft zu befinden. Weitere Beschäftigtengruppen in der Stichprobe sind Beamte (17 %), Schüler/innen und Studenten/innen (9 %) sowie Praktikanten/innen und Auszubildende 4
(6 %). Das Bildungsniveau der Stichprobe kann als mittelmäßig bis hoch bezeichnet wer-den: 27 % gaben die mittlere Reife, 31 % die (Fach-)Hochschulreife und 34 % ein abge-schlossenes (Fach-)Hochschulstudium als höchsten Bildungsabschluss an. Der Median der Einkommensverteilung liegt bei einem monatlichen Bruttogehalt von 2 000 � bis 3 000 �.
Stichprobe 2. Die zweite Stichprobe besteht aus 377 Personen (168 Männer und 209 Frauen). Das Durchschnittsalter der Teilnehmerinnen und Teilnehmer betrug 33.7 (SD = 10.4) Jahre, die durchschnittliche Zeit im Berufsleben 12.7 (SD = 10.3) Jahre. Das Bildungsniveau ist ähnlich ausgeprägt wie in Stichprobe 1: 29 % der Befragten verfügen über die mittlere Reife, 29 % über die (Fach-)Hochschulreife und 33 % über ein abge-schlossenes (Fach-)Hochschulstudium. Knapp die Hälfte (49 %) der Befragten befindet sich in einem Normalarbeitsverhältnis in der Privatwirtschaft und etwa 19 % sind Beamte. Weitere Beschäftigtengruppen sind Schüler/innen (7 %), Studenten/innen (7 %) und Aus-zubildende (3 %). Der Median der Einkommensverteilung liegt auch in dieser Stichprobe bei einem monatlichen Bruttogehalt von 2 000 � bis 3 000 �.
Ein anonymer Gutachter merkte an, dass Schüler/innen und Studenten/innen evtl. nicht mit Personen in einer Festanstel4 -lung vergleichbar sind. Alle Berechnungen wurden daher noch einmal ohne Schüler/innen und Studenten/innen durchge-führt. Die Faktorstruktur, interne Konsistenzen, Interkorrelationen sowie Zusammenhänge zu den Validierungskriterien änderten sich hierdurch nicht.
58

5.6.2 Verwendete Skalen und Maße
Arbeitszufriedenheit. Zur Messung der Arbeitszufriedenheit wurde in beiden Erhebungen der KAFA verwendet. In der ersten Erhebung kam die initiale, 83 Items umfassende Version, in der zweiten Erhebung die 30 Items umfassende Kurzversion zum Einsatz.
Das originale Antwortformat des JDI sieht die drei Antwortmöglichkeiten ja, nein und ? vor, die respektive mit drei, null und einem Punkt bewertet werden. Während einige Auto-ren (z.B. Russell et al., 2004) dieses Antwortformat bevorzugen, empfehlen andere (Kini-cki et al., 2002), es zu modifizieren. Das originale Antwortformat wurde aus mehreren Gründen durch eine 11-stufige Likertskala mit den Ankern 0 = trifft überhaupt nicht zu und 10 = trifft vollkommen zu ersetzt. Erstens lässt sich die Antwortoption ? nicht eindeu-tig interpretieren, was die Objektivität der Messung einschränkt. Sollten die Befragten das Fragezeichen als weiß ich nicht oder keine Angabe interpretieren, ist eine inhaltliche Inter-pretation im Sinne der Arbeitszufriedenheit wenig sinnvoll. Zweitens scheinen die den Antwortoptionen zugeordneten Punktwerte willkürlich gewählt und einer (mess-)theoreti-schen Fundierung zu entbehren. Drittens zeigen empirische Untersuchungen, dass längere Skalen in der Regel zu höheren Reliabilitäten, Validitäten und Trennschärfen führen sowie durch die Teilnehmer positiver bewertet werden als kürzere Skalen (Coelho & Esteves, 2007; Preston & Colman, 2000).
Job-Charakteristika. Die Job-Charakteristika wurden mit sieben Items der deutschspra-chigen Version (Schmidt & Kleinbeck, 1999) des Job Diagnostic Survey (JDS; Hackman & Oldham, 1975) erhoben. Die erfassten Job-Charakteristika sind Anforderungsvielfalt, Auf-gabengeschlossenheit, Bedeutsamkeit der Arbeit, Autonomie, Rückmeldung, soziale Be-ziehungen sowie Feedback von Mitarbeitern und Vorgesetzten. Ein Beispielitem lautet „Meine Arbeit verlangt ein großes Maß an Zusammenarbeit mit anderen Leuten“. Alle Items waren auf einer siebenstufigen Likertskala mit den Ankern 1 = trifft nicht zu und 7 = trifft vollkommen zu zu beantworten. Aufgrund vielfacher Kritik an Hackman und Oldhams multiplikativer Scoringmethode (z.B. Evans & Ondrack, 1991; Hinton & Bider-man, 1995) wurde der Summenscore des JDS als Validierungskonstrukt herangezogen.
Kündigungsgedanken und -absicht. Kündigungsgedanken sowie Kündigungsabsicht wurden in beiden Erhebungen mit jeweils einem Item erfasst. Das Item zur Messung von Kündigungsgedanken lautet „Ich denke häufig über Kündigung nach“. Kündigungsabsicht wurde mit dem Item „Ich werde mir bald einen neuen Job suchen“ erfasst. Die Items wa-ren auf einer 11-stufigen Likertskala mit den Ankern 0 = trifft überhaupt nicht zu und 10 = trifft vollkommen zu zu beantworten.
Positiver und negativer Affekt. Zur Messung positiven und negativen Affekts wurde die deutschsprachige Version (Krohne, Egloff, Kohlmann, & Tausch, 1996) des Positive and Negative Affect Schedule (PANAS; J. R. Crawford & Henry, 2004) verwendet. Das PANAS enthält eine Liste mit 10 positiv-valenten Adjektiven (z. B. stark, begeistert) sowie 10 negativ-valenten Adjektiven (z. B. nervös, ängstlich), die Emotionen und Stimmungen be-schreiben. Die Befragten sollten auf einer fünfstufigen Likertskala angeben, wie häufig sie das jeweilige Gefühl im Laufe des letzten Monats bei der Arbeit erlebt hatten. Die Anker der Skala lauten 1 = gar nicht oder sehr selten, 2 = selten, 3 = manchmal, 4 = häufig, 5 = sehr häufig. Es ergeben sich interne Konsistenzen von α = .90 (positiver Affekt) und α = .86 (negativer Affekt).
59

Arbeitsereignisse. Auf Basis der Literatur (Basch & Fisher, 2000; Grandey, Tam, & Brau-burger, 2002; Mignonac & Herrbach, 2004) wurden insgesamt sechs Items formuliert, die drei positive und drei negative Arbeitsereignisse im Zusammenhang mit Tätigkeiten, Vor-gesetzten und Kollegen/innen beschreiben. Die Befragten sollten angeben, wie häufig sie jedes Ereignis im Laufe des letzten Monats erlebt hatten. Die positiven Ereignisse lauten angenehme Aufgaben bearbeitet, positives Feedback vom Vorgesetzten erhalten und Aner-kennung von Kollegen/innen erhalten. Die negativen Ereignisse lauten Aufgaben bearbei-tet, auf die Sie keine Lust hatten, negatives Feedback vom Vorgesetzten erhalten und sich mit Kollegen/innen gestritten. Die verwendete Skala war die gleiche wie die zur Erfassung positiver und negativer Affekte.
Core Self-Evaluations. Die Core Self-Evaluations wurden mit einer deutschsprachigen Version (Kesting, Stumpp, Hülsheger, & Maier, 2006) der Core Self-Evaluation Scale (Judge, Erez, Bono, & Thoresen, 2003) erfasst. Die Skala erfasst die vier Facetten der Core Self-Evaluations mit jeweils drei Items. Ein Beispielitem lautet: „Ich bin zuversichtlich, im Leben den Erfolg zu bekommen, den ich verdiene“. Als Validierungskonstrukt wurde der Summenscore der vier Facetten herangezogen (α = .84).
Einkommen. Die Befragten wurden gebeten, ihr monatliches Brutto-Einkommen auf einer siebenstufigen Skala anzugeben. Die Antwortoptionen reichten von weniger als 1 000 � bis mehr als 6 000 �.
5.6.3 Itemselektion und Skalenbildung
Das Ziel der ersten Erhebung bestand in der Extraktion der sechs Zufriedenheitsskalen. Zur Itemselektion der fünf Facettenskalen wurde zunächst eine Hauptkomponentenanaly-se mit Varimax-Rotation durchgeführt. Nach dem Kaiser-Kriterium ließen sich 13 Faktoren extrahieren. Der Eigenwerteverlauf (21.5; 7.1; 6.0; 4.3; 3.7; 2.0; …) zeigt einen deutli-chen „Knick“ nach dem fünften Faktor, was dem Scree-Test (Cattell, 1966) zufolge auf eine fünffaktorielle Struktur hinweist. Eine zusätzlich durchgeführte Parallel-Analyse (Horn, 1965; O’Connor, 2000) mit 1 000 zufälligen Datensätzen legt ebenfalls eine Extraktion von fünf Faktoren nahe. Die fünf Faktoren erklären insgesamt 57 % der Varianz. Anschlie-ßend wurden die Items mit den höchsten Faktorladungen ausgewählt. Um Antwortten-denzen zu vermeiden, wurde zudem darauf geachtet, dass jede Skala sowohl positiv als auch negativ formulierte Items enthält, auch wenn hierfür in der Regel Einschränkungen der internen Konsistenz und Faktorstruktur in Kauf genommen werden müssen (Barnette, 2000). Um die Wahrscheinlichkeit fehlerhaften Antwortverhaltens zu reduzieren, wurde auf Items verzichtet, die lediglich durch das Wort „nicht“ umgepolt wurden (Spector, 1992). Beispielsweise wurde anstelle der Formulierung „Meine Tätigkeiten… sind nicht spannend“ die Formulierung „Meine Tätigkeiten… langweilen mich“ verwendet. Für die Skala Gesamtzufriedenheit wurde das gleiche Vorgehen gewählt. Der Eigenwerteverlauf der Hauptkomponentenanalyse (5.1; 0.8; 0.6; …) zeigt hier einen deutlichen Hauptfaktor, der 64 % der Varianz erklärt.
Tabelle 9 gibt eine Übersicht über die selektierten Items sowie über ihre Mittelwerte, Standardabweichungen und korrigierten Trennschärfen. Alle Trennschärfen liegen über .60 und können somit als gut bezeichnet werden.
60

Tabelle 9Mittelwerte, Standardabweichungen und Trennschärfen aller Items des KAFA
Anmerkungen. Mit (r) markierte Items sind negativ gepolt. Angegeben sind Mittelwerte in Originalpolung.
Stichprobe 1 (N = 217)
Stichprobe 2 (N = 377)
Item M SD rit M SD rit
(T) Meine Tätigkeiten…T1 sind ziemlich uninteressant. (r) 3.09 3.00 .73 3.38 2.96 .64T2 sind spannend. 5.56 2.90 .81 5.34 2.86 .77T3 fordern mich. 5.65 3.02 .77 5.47 2.91 .69T4 langweilen mich. (r) 4.03 3.31 .77 3.84 3.01 .68T5 gefallen mir. 6.20 2.92 .79 6.06 2.55 .70
(K) Meine Arbeitskollegen/innen sind…K1 zerstritten. (r) 3.21 3.20 .63 2.79 2.65 .62K2 sympathisch. 7.00 2.25 .76 6.94 2.28 .76K3 kollegial. 6.62 2.57 .70 6.72 2.50 .80K4 angenehm. 6.69 2.33 .74 6.86 2.39 .77K5 frustrierend. (r) 3.51 3.05 .68 3.04 2.80 .67
(E) Meine Entwicklungsmöglichkeiten…E1 sind gut. 3.40 2.97 .82 3.97 3.18 .84E2 sind ziemlich eingeschränkt. (r) 6.43 3.31 .75 4.03 3.35 .71E3 sind angemessen. 3.60 2.82 .74 3.93 2.97 .78E4 existieren kaum. (r) 6.07 3.55 .79 5.53 3.49 .79E5 sind leistungsgerecht. 3.76 2.96 .69 3.75 2.96 .78
(B) Meine Bezahlung…B1 ist fair. 4.75 3.04 .80 4.84 2.92 .74B2 ist ungerecht. (r) 4.16 3.38 .81 4.24 3.23 .75B3 ist zufriedenstellend. 5.13 2.99 .74 4.90 2.94 .64B4 ist unangemessen. (r) 4.24 3.51 .76 4.69 3.32 .73B5 ist schlecht. (r) 3.49 3.51 .80 4.16 3.37 .75
(V) Mein/e direkte/r Vorgesetzte/r…V1 ist rücksichtsvoll. 5.63 2.81 .76 5.71 2.79 .74V2 ist fair. 5.80 3.00 .86 5.99 2.80 .82V3 ist unbeliebt. (r) 3.69 3.39 .70 3.48 2.97 .71V4 ist vertrauenswürdig. 6.00 3.09 .81 5.89 3.08 .80V5 ist ungerecht. (r) 3.18 3.13 .76 3.23 2.89 .79
(G) Alles in allem ist mein Job…G1 gut. 6.05 2.76 .81 6.14 2.79 .82G2 zufriedenstellend. 5.53 2.95 .75 5.46 2.73 .72G3 dürftig. (r) 3.45 3.08 .72 3.25 3.05 .66G4 angenehm. 5.82 2.90 .82 5.74 2.72 .74G5 niemandem zu wünschen. (r) 2.37 3.03 .66 2.27 3.02 .65
61
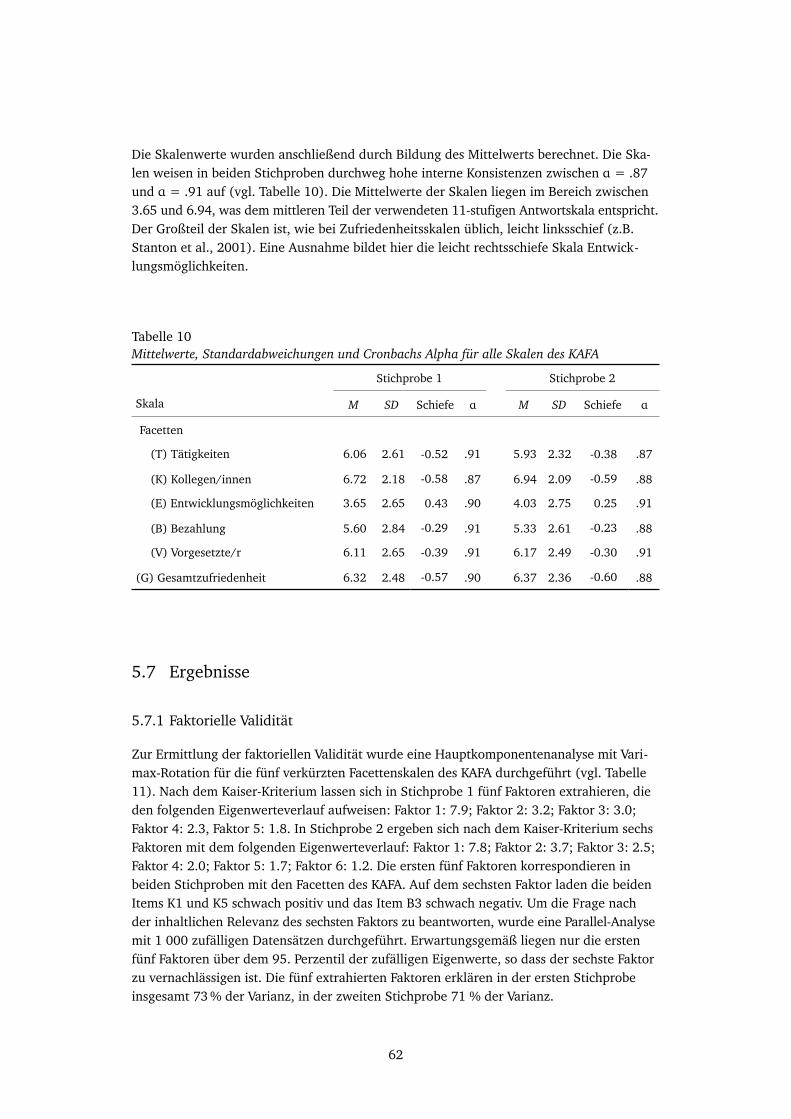
Die Skalenwerte wurden anschließend durch Bildung des Mittelwerts berechnet. Die Ska-len weisen in beiden Stichproben durchweg hohe interne Konsistenzen zwischen α = .87 und α = .91 auf (vgl. Tabelle 10). Die Mittelwerte der Skalen liegen im Bereich zwischen 3.65 und 6.94, was dem mittleren Teil der verwendeten 11-stufigen Antwortskala entspricht. Der Großteil der Skalen ist, wie bei Zufriedenheitsskalen üblich, leicht linksschief (z.B. Stanton et al., 2001). Eine Ausnahme bildet hier die leicht rechtsschiefe Skala Entwick-lungsmöglichkeiten.
Tabelle 10Mittelwerte, Standardabweichungen und Cronbachs Alpha für alle Skalen des KAFA
5.7 Ergebnisse
5.7.1 Faktorielle Validität
Zur Ermittlung der faktoriellen Validität wurde eine Hauptkomponentenanalyse mit Vari-max-Rotation für die fünf verkürzten Facettenskalen des KAFA durchgeführt (vgl. Tabelle 11). Nach dem Kaiser-Kriterium lassen sich in Stichprobe 1 fünf Faktoren extrahieren, die den folgenden Eigenwerteverlauf aufweisen: Faktor 1: 7.9; Faktor 2: 3.2; Faktor 3: 3.0; Faktor 4: 2.3, Faktor 5: 1.8. In Stichprobe 2 ergeben sich nach dem Kaiser-Kriterium sechs Faktoren mit dem folgenden Eigenwerteverlauf: Faktor 1: 7.8; Faktor 2: 3.7; Faktor 3: 2.5; Faktor 4: 2.0; Faktor 5: 1.7; Faktor 6: 1.2. Die ersten fünf Faktoren korrespondieren in beiden Stichproben mit den Facetten des KAFA. Auf dem sechsten Faktor laden die beiden Items K1 und K5 schwach positiv und das Item B3 schwach negativ. Um die Frage nach der inhaltlichen Relevanz des sechsten Faktors zu beantworten, wurde eine Parallel-Analyse mit 1 000 zufälligen Datensätzen durchgeführt. Erwartungsgemäß liegen nur die ersten fünf Faktoren über dem 95. Perzentil der zufälligen Eigenwerte, so dass der sechste Faktor zu vernachlässigen ist. Die fünf extrahierten Faktoren erklären in der ersten Stichprobe insgesamt 73 % der Varianz, in der zweiten Stichprobe 71 % der Varianz.
Stichprobe 1 Stichprobe 2
Skala M SD Schiefe α M SD Schiefe αFacetten
(T) Tätigkeiten 6.06 2.61 -0.52 .91 5.93 2.32 -0.38 .87
(K) Kollegen/innen 6.72 2.18 -0.58 .87 6.94 2.09 -0.59 .88
(E) Entwicklungsmöglichkeiten 3.65 2.65 0.43 .90 4.03 2.75 0.25 .91
(B) Bezahlung 5.60 2.84 -0.29 .91 5.33 2.61 -0.23 .88
(V) Vorgesetzte/r 6.11 2.65 -0.39 .91 6.17 2.49 -0.30 .91
(G) Gesamtzufriedenheit 6.32 2.48 -0.57 .90 6.37 2.36 -0.60 .88
62
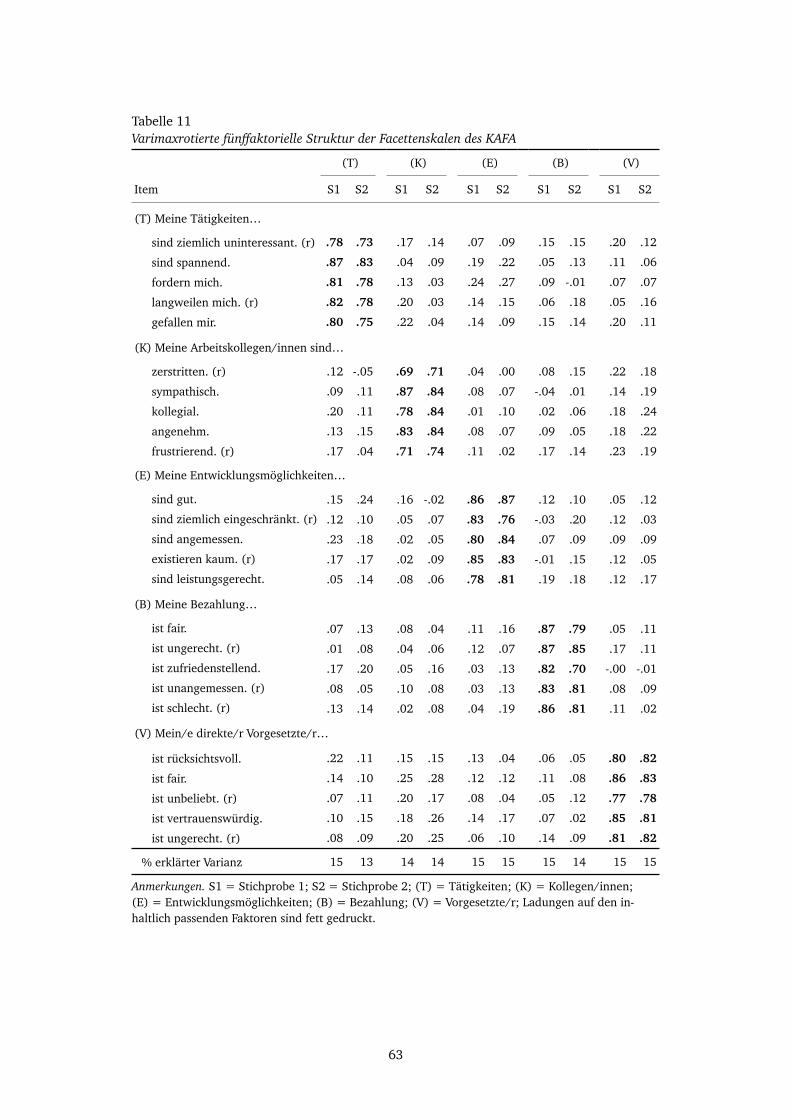
Tabelle 11Varimaxrotierte fünffaktorielle Struktur der Facettenskalen des KAFA
Anmerkungen. S1 = Stichprobe 1; S2 = Stichprobe 2; (T) = Tätigkeiten; (K) = Kollegen/innen; (E) = Entwicklungsmöglichkeiten; (B) = Bezahlung; (V) = Vorgesetzte/r; Ladungen auf den in-haltlich passenden Faktoren sind fett gedruckt.
(T) (K) (E) (B) (V)
Item S1 S2 S1 S2 S1 S2 S1 S2 S1 S2
(T) Meine Tätigkeiten…
sind ziemlich uninteressant. (r) .78 .73 .17 .14 .07 .09 .15 .15 .20 .12sind spannend. .87 .83 .04 .09 .19 .22 .05 .13 .11 .06fordern mich. .81 .78 .13 .03 .24 .27 .09 -.01 .07 .07langweilen mich. (r) .82 .78 .20 .03 .14 .15 .06 .18 .05 .16gefallen mir. .80 .75 .22 .04 .14 .09 .15 .14 .20 .11
(K) Meine Arbeitskollegen/innen sind…
zerstritten. (r) .12 -.05 .69 .71 .04 .00 .08 .15 .22 .18sympathisch. .09 .11 .87 .84 .08 .07 -.04 .01 .14 .19kollegial. .20 .11 .78 .84 .01 .10 .02 .06 .18 .24angenehm. .13 .15 .83 .84 .08 .07 .09 .05 .18 .22frustrierend. (r) .17 .04 .71 .74 .11 .02 .17 .14 .23 .19
(E) Meine Entwicklungsmöglichkeiten…
sind gut. .15 .24 .16 -.02 .86 .87 .12 .10 .05 .12sind ziemlich eingeschränkt. (r) .12 .10 .05 .07 .83 .76 -.03 .20 .12 .03sind angemessen. .23 .18 .02 .05 .80 .84 .07 .09 .09 .09existieren kaum. (r) .17 .17 .02 .09 .85 .83 -.01 .15 .12 .05sind leistungsgerecht. .05 .14 .08 .06 .78 .81 .19 .18 .12 .17
(B) Meine Bezahlung…
ist fair. .07 .13 .08 .04 .11 .16 .87 .79 .05 .11ist ungerecht. (r) .01 .08 .04 .06 .12 .07 .87 .85 .17 .11ist zufriedenstellend. .17 .20 .05 .16 .03 .13 .82 .70 -.00 -.01ist unangemessen. (r) .08 .05 .10 .08 .03 .13 .83 .81 .08 .09ist schlecht. (r) .13 .14 .02 .08 .04 .19 .86 .81 .11 .02
(V) Mein/e direkte/r Vorgesetzte/r…
ist rücksichtsvoll. .22 .11 .15 .15 .13 .04 .06 .05 .80 .82ist fair. .14 .10 .25 .28 .12 .12 .11 .08 .86 .83ist unbeliebt. (r) .07 .11 .20 .17 .08 .04 .05 .12 .77 .78ist vertrauenswürdig. .10 .15 .18 .26 .14 .17 .07 .02 .85 .81ist ungerecht. (r) .08 .09 .20 .25 .06 .10 .14 .09 .81 .82
% erklärter Varianz 15 13 14 14 15 15 15 14 15 15
63

In einem nächsten Schritt wurden mit den Daten aus Stichprobe 2 konfirmatorische Fakto-renanalysen (CFA) mit dem R-Softwarepaket lavaan (Rosseel, 2012) durchgeführt. Da die 5
Zufriedenheitsskalen alle deutlich von einer Normalverteilung abweichen, wurde eine Ma-ximum-Likelihood-Schätzung mit robusten Standardfehlern verwendet (Satorra & Bentler, 1994). Für die Skala Gesamtzufriedenheit ergeben sich die folgenden Modellstatistiken: 6
χ² = 13.950, df = 5, p < . 01, CFI = .988, SRMR = .027, RMSEA = .069. Alle Items laden signifikant auf einem Generalfaktor und die standardisierten Faktorladungen liegen zwi-schen .68 und .91. Die Modifikationsindizes weisen jedoch auf einen Methodenfaktor hin, so dass ein weiteres Modell geschätzt wurde, in dem die Kovarianz der Residuen der negativ gepolten Items G3 und G5 zur Schätzung freigegeben wurde. Der Modellfit verbessert sich dadurch deutlich: χ² = 3.753, df = 4, p = .440, CFI = 1.000, SRMR = .011, RMSEA = .000.
Für das fünffaktorielle Modell der Zufriedenheitsfacetten ergeben sich folgende Modellsta-tistiken: χ² = 609.808, df = 265, p < .001, CFI = .931, SRMR = .050, RMSEA = .060. Auch hier laden alle Items signifikant auf den zugehörigen Faktoren und lediglich die standardisierte Faktorladung eines Items (K1) liegt mit .59 nur knapp unter .60. Da die Fit-Indizes über bzw. unter den üblicherweise verwendeten Cut-Off-Werten liegen (D. Hooper, Coughlan, & Mullen, 2008; Hu & Bentler, 1999), kann festgehalten werden, dass die Skala Gesamtzufriedenheit eine einfaktorielle und die Facettenskalen eine fünffaktori-elle Struktur aufweisen, faktorielle Validität mithin als gegeben angenommen werden kann.
5.7.2 Konstrukt- und Kriteriumsvalidität
Korrelationsmuster. Die fünf Subskalen weisen in beiden Stichproben erwartungsgemäß moderate Interkorrelationen auf (vgl. Tabelle 12). Sie liegen zwischen r = .17 und r = .51; die per Fishers Z-Transformation (R. A. Fisher, 1915) errechneten mittleren Korrelationen betragen r = .30 in Stichprobe 1 und r = .31 in Stichprobe 2. Zudem korrelieren alle Sub-skalen, insbesondere die Skala Tätigkeiten, mit der Skala Gesamtzufriedenheit.
Einkommen. Das Einkommensniveau der Befragten korreliert erwartungsgemäß schwach mit der Skala Gesamtzufriedenheit, r = .23, p < .01, und moderat mit der Skala Bezah-lung, r = .36, p < .01.
Job-Charakteristika. Es ergibt sich ein positiver Zusammenhang zwischen dem Summen-score des JDS und der Skala Gesamtzufriedenheit, r = .44, p < .01. Auf Facettenebene ist die Korrelation zur Skala Tätigkeiten am stärksten, r = .51, p < .01, und zur Skala Bezah-lung am schwächsten, r = .21, p < .05, ausgeprägt.
Da die Items auf Basis ihrer Faktorladungen in Stichprobe 1 selektiert wurden, beschränkt sich Darstellung hier auf die 5
Ergebnisse der CFA für Stichprobe 2.
Um eine Überschätzung der Modellgüte durch die Satorra-Bentler-Korrektur auszuschließen, wurden alle Modelle zusätz6 -lich ohne Satorra-Bentler-Korrektur geschätzt. Die Fit-Indizes werden dadurch zwar schlechter, stellen die Faktorstruktur jedoch nicht in Frage. Gesamtskala: χ² = 5.755, df = 4, p = .218, CFI = .998, SRMR = .012, RMSEA = .034; Facettenska-len: χ² = 848.730, df = 265, p < .001, CFI = .900, SRMR = .051, RMSEA = .078.
64

Tabelle 12Interkorrelationen aller Skalen des KAFA in Stichproben 1 und 2
Anmerkungen. Die Interkorrelationen aus Stichprobe 1 finden sich in der oberen, die Interkorrelatio-nen aus Stichprobe 2 in der unteren Dreiecksmatrix. ** p < .01 (zweiseitig).
Kündigungsgedanken und -absicht. Auf Basis der Daten beider Stichproben zeigt sich, dass sowohl Kündigungsgedanken als auch Kündigungsabsicht negativ mit allen Zufrieden-heitsskalen korrelieren. Die schwächsten Zusammenhänge ergeben sich für die Skala Kol-legen/innen, rKG = -. 24, p < .01; rKA = -.16, p < .01, die stärksten für die Skala Gesamtzu-friedenheit, rKG = -. 60, p < . 01; rKA = -.49, p < .01.
Positiver und negativer Affekt. In Einklang mit der Affective Events Theory (H. Weiss & Cropanzano, 1996) korreliert das Erleben positiver Emotionen und Stimmungen positiv mit der Skala Gesamtzufriedenheit, das Erleben negativer Affekte hingegen negativ. Auf Facettenebene wird deutlich, dass insbesondere die Skala Tätigkeiten stark mit positivem Affekt verbunden ist, r = .68, p < .01.
Arbeitsereignisse. Es ergibt sich ein hypothesenkonformes Korrelationsmuster zwischen den Arbeitsereignissen und den Zufriedenheitsfacetten. Tabelle 13 zeigt die Zusammen-hänge zwischen den sechs Arbeitsereignissen und den verschiedenen Skalen des KAFA. Ereignisse, die Tätigkeiten betreffen, hängen am stärksten mit der Skala Tätigkeiten zu-sammen, r = .64, p < .01 bzw. r = -.47, p < .01, Anerkennung und Streit mit Kolleginnen und Kollegen korrelieren am stärksten mit der Skala Kollegen/innen, r = .40, p < .01 bzw. r = -.53, p < .01 und positives bzw. negatives Feedback von der/dem Vorgesetzten am stärksten mit der Skala Vorgesetzte/r, r = .41, p < .01 bzw. r = -.43, p < .01.
Core Self-Evaluations. Der Summenscore der Core Self-Evaluations korreliert erwar-tungsgemäß positiv mit allen Zufriedenheitsskalen des KAFA, insbesondere mit den Skalen Gesamtzufriedenheit, r = .36, p < .01, und Tätigkeiten, r = .31, p < .01.
Skala (T) (K) (E) (B) (V) (G)
(T) Tätigkeiten - .39** .37** .25** .35** .71**
(K) Kollegen/innen .22** - .21** .19** .48** .56**
(E) Entwicklungsmöglichkeiten .43** .17** - .18** .28** .39**
(B) Bezahlung .33** .24** .38** - .23** .43**
(V) Vorgesetzte/r .30** .51** .26** .22** - .52**
(G) Gesamtzufriedenheit .68** .33** .44** .51** .45** -
65

Tabelle 13Konstrukt- und Kriteriumsvalidität des KAFA
Anmerkungen. T = Tätigkeiten; K = Kollegen/innen; E = Entwicklungsmöglichkeiten; B = Bezahlung; V = Vorgesetzte/r; G = Gesamtzufriedenheit. a Spearmans Rho.* p < .05, ** p < .01 (zweiseitig).
5.8 Diskussion
Trotz der enormen Relevanz von Arbeitszufriedenheit für Forschung und betriebliche Pra-xis liegt zurzeit kein deutschsprachiges Verfahren vor, mit dem sich allgemeine und facet-tenspezifische Arbeitszufriedenheit ökonomisch messen lassen. Vor diesem Hintergrund bestand das Ziel des vorliegenden Beitrags darin, einen Kurzfragebogen zur Erfassung von Allgemeiner und Facettenspezifischer Arbeitszufriedenheit (KAFA) zu entwickeln und zu validieren.
Auf Basis etablierter englisch- und deutschsprachiger Zufriedenheitsskalen wurde ein um-fassender Itempool entwickelt und faktorenanalytisch zu sechs Kurzskalen verdichtet. Fast alle Trennschärfen und standardisierten Faktorladungen der selektierten Items übersteigen .60 und die internen Konsistenzen der Skalen liegen zwischen α = .87 und α = .91. So-wohl die Trennschärfen als auch die internen Konsistenzen sind damit als gut bis sehr gut zu bezeichnen. Die internen Konsistenzen des KAFA sind zudem mit denen der Langversi-on des JDI vergleichbar (Kinicki et al., 2002) und fallen deutlich höher aus als die der häufig verwendeten Ein-Item-Skalen, deren geschätzte Reliabilität zwischen α = .45 und
Kriterium Stichprobe T K E B V G
Einkommena 1+2 .19** .06 .11** .36** -.01 .23**Job-Charakteristika 2 .51** .27** .30** .21** .29** .44**Kündigung
Kündigungsgedanken 1+2 -.48** -.24** -.37** -.39** -.36** -.60**Kündigungsabsicht 1+2 -.40** -.16** -.38** -.35** -.32** -.49**
AffektPositiver Affekt 2 .68** .19** .40** .27** .27** .57**Negativer Affekt 2 -.32** -.34** -.16** -.24** -.33** -.44**
ArbeitsereignisseAngenehme Aufgaben 2 .64** .31** .30** .24** .33** .57**Unangenehme Aufgaben 2 -.47** -.12* -.17** -.25** -.21** -.40**Anerkennung von Kollegen
2 .26** .40** .26** .18** .26** .27**
Streit mit Kollegen 2 -.04 -.53** -.04 -.08 -.25** -.11*Positives Feedback vom Vorgesetzten
2 .26** .29** .28** .14** .41** .20**
Negatives Feedback vom Vorgesetzten
2 -.11* -.26** -.02 -.10* -.43** -.18**
Core Self-Evaluations 2 .31** .22** .22** .20** .15** .36**
66

α = .69 liegt (Wanous et al., 1997). Mithilfe explorativer und konfirmatorischer Faktoren-analysen konnten die angenommene einfaktorielle Struktur der Skala Gesamtzufrieden-heit sowie die fünffaktorielle Struktur der Facettenskalen nachgewiesen werden. Kon-strukt- und Kriteriumsvalidität des KAFA konnten an zwei unabhängigen Stichproben an einer Vielzahl von Kriterien belegt werden: Job-Charakteristika, positiver Affekt und Core Self-Evaluations korrelieren positiv, Kündigungsgedanken, Kündigungsabsicht und negati-ver Affekt korrelieren negativ mit der Skala Gesamtzufriedenheit. Auch auf Facettenebene ergibt sich ein konsistentes Muster, das sich insbesondere in den Zusammenhängen zwi-schen den Zufriedenheitsfacetten und verschiedenen Arbeitsereignissen widerspiegelt.
Zusammenfassend kann festgehalten werden, dass mit dem KAFA ein ökonomisches Mess-instrument vorliegt, das Arbeitszufriedenheit mit den fünf Facetten Tätigkeiten, Kollegen/innen, Entwicklungsmöglichkeiten, Bezahlung und Vorgesetzte/r sowie die Gesamtzufrieden-heit reliabel und valide erfasst.
67


6 Study 2b: Measuring Satisfaction in Teams — An Adaptation of the KAFA Scales
Benjamin HaarhausTU Chemnitz, Germany
Unpublished research report
Abstract
Studies that assess satisfaction in the team context usually rely on ad-hoc measures that are not validated and difficult to compare across studies. To address this problem, this research adapts a series of German short scales that assess general and facet-specific job satisfaction to the team context. The adapted scales are validated using the data from 202 team members working in 47 teams. Despite a small method bias due to reverse-coded items, the scales’ psychometric properties are satisfactory. The results further show that, in contrast to non-team contexts, satisfaction with the team members appears to be the most important facet of satisfaction as it exhibits the strongest relationships with performance-related criteria and overall satisfaction. In summary, the results suggest that the adapted scales provide for a reliable and valid measurement of satisfaction in the context of teams.
69

6.1 Introduction
Job satisfaction is among the most central constructs in organizational psychology (Judge & Kammeyer-Mueller, 2012). Given its’ long research history (Hoppock, 1935), an abun-dance of satisfaction measures has been developed that differ in theoretical background, length, and focus. However, the continuing reliance on team-based forms of work in mo-dern organizations (Mathieu et al., 2014) presents a new challenge for research on job satisfaction because traditional measures cannot be directly applied to the team context. Therefore, validated scales are needed that are developed specifically for the assessment of satisfaction in teams.
Prior research in this domain mostly relied on ad hoc measures like “Considering every-thing, how satisfied are you with your job?“ (Whitman et al., 2010, p. 55). This is proble-matic for at least two reasons: First, these scales are mostly developed for a specific research question and lack thorough scale development and validation. Second, without common satisfaction metrics, results are not directly comparable across studies. Another problem of these scales concerns the neglect of satisfaction facets (for a notable exception, see Mason & Griffin, 2005). The vast majority of measures for satisfaction in teams focus on overall satisfaction. However, studies that employed a more nuanced view on satisfaction found that different facets of satisfaction had distinct effects on outcome variables, making the assessment of satisfaction facets more valuable for research and managerial practice (Dineen et al., 2007; Mason & Griffin, 2005).
Taken together, the aim of this study is to develop measures that are suitable to assess satisfaction in the context of teams. To do so, I use a series of validated scales as a founda-tion. This approach has the advantage that results from team and non-team contexts are more easily comparable across studies. In particular, I adapt and validate a series of Ger-man short scales that assess general and facet-specific job satisfaction (KAFA; Haarhaus, 2015) to the team context.
6.2 Adapting the KAFA Scales to the Team Context
The KAFA (Haarhaus, 2015) is a German short questionnaire that assesses general job satisfaction as well as satisfaction with the work itself, coworkers, promotions, pay, and supervision. The scales share the item format with the Job Descriptive Index (JDI; Balzer et al., 1997). Participants are asked whether positive and negative adjectives (e.g., plea-sant and undesirable) and short statements (e.g., makes me content) apply to their current job or facet of the job.
To adapt the scales to the context of teams, the vignettes above the adjectives and state-ments, such as “All in all, my job is…”, need to be rephrased (see Table 14). For the task facet, I replaced the phrase “work on your job” with the phrase “work in your team”. Likewise, for the supervisor facet, I replaced the term “supervisor” with the term “team leader”. Finally, for the coworkers facet, I replaced the term “coworkers“ with the term “team colleagues”. While the adaption of the three facet scales is relatively straightfor-
70

ward, there is a problem in determining what overall satisfaction in the team context re-fers to. If changed to “overall satisfaction with the team”, the team itself (i.e., as an entity) becomes the focus. To avoid this, the vignette I used for overall satisfaction in the team context was „All in all, working in this team is…”. By adding the phrase “working in”, I aimed at broadening the scale’s content domain so that it refers to more than just team members’ interpersonal relationships, which are already covered by the team members scale. The original KAFA scales include two more facets, namely satisfaction with pay and promotions. However, since pay and promotions are usually not related to the team, there is no need to adapt and re-validate these scales in the team context. This research will therefore focus on satisfaction with the individual task, the team leader, the team mem-bers, and overall team satisfaction.
In contrast to Mason and Griffin’s (2005) scales, the adapted KAFA items are formulated with the individual instead of the team as the referent (cf. Chan, 1998). That is, while Mason and Griffin’s (2005) scales let members estimate the satisfaction of the team as a whole (e.g., “Our team is satisfied with senior managers of this organization”), the scales presented herein assess each individual members’ satisfaction with the respective facets. This is an important distinction because with the team as the referent, distributions other than shared satisfaction cannot be reasonably interpreted. Conversely, items with the indi-vidual as the referent are much more flexible as they can be used for additive, direct-con-sensus, and dispersion models (Chan, 1998; Cole et al., 2011).
71

Tabl
e 14
Origi
nal a
nd A
dapt
ed Ve
rsion
of Jo
b Sat
isfac
tion
Scal
es U
sed
in T
his D
isser
tatio
n
Note.
Ital
ics a
re a
dded
for e
mph
asiz
ing
the
diffe
renc
es b
etw
een
both
ver
sions
and
are
no
genu
ine
part
of t
he sc
ales
.
Ger
man
Engl
ish
Focu
sO
rigin
alTe
am a
dapt
atio
nO
rigin
alTe
am a
dapt
atio
n
Task
Den
ken
Sie
bitte
an
die
Tätig
keite
n,
die
Sie
bei I
hrer
Arb
eit ta
gtäg
lich
ausf
ühre
n. W
ie g
ut b
esch
reib
en d
ie
folg
ende
n Au
ssag
en Ih
re
Tätig
keite
n?
Mei
ne T
ätig
keite
n…
Den
ken
Sie
nun
bitte
an
die
Tätig
keite
n, d
ie S
ie in
Ihre
m Te
am
ausf
ühre
n. In
wie
fern
tref
fen
die
folg
ende
n Au
ssag
en z
u?
Die
Tät
igke
iten,
die
ich
in d
iesem
Te
am a
usfü
hre…
Plea
se th
ink
abou
t you
r dai
ly w
ork
on yo
ur jo
b. H
ow w
ell d
o th
e fo
llow
ing
stat
emen
t des
crib
e yo
ur
wor
k?
My
wor
k…
Plea
se th
ink
abou
t the
wor
k yo
u do
in
your
team
. How
wel
l do
the
follo
win
g st
atem
ent a
pply
? Th
e w
ork
I do
in th
is tea
m…
Team
Le
ader
Den
ken
Sie
nun
bitte
an
Ihre
/n
dire
kte/
n Vo
rges
etzte/
n (d
er/d
ie
Ihne
n An
wei
sung
en g
eben
und
Ihre
Ar
beit
kont
rolli
eren
kan
n). W
ie g
ut
besc
hrei
ben
die
folg
ende
n Au
ssag
en
Ihre
/n V
orge
setz
te/n
? M
ein/
e di
rekt
e/r V
orge
setzt
e/r…
Den
ken
Sie
nun
bitte
an
Ihre
/n
Team
leiter
/in. I
nwie
fern
tref
fen
die
folg
ende
n Au
ssag
en z
u?
Uns
er/e
Team
leiter
/in…
Plea
se th
ink
abou
t you
r dire
ct
supe
rviso
r (w
ho c
an g
ive
you
assig
nmen
ts a
nd c
ontr
ol y
our w
ork)
. H
ow w
ell d
o th
e fo
llow
ing
stat
emen
t de
scrib
e yo
ur su
perv
isor?
My
dire
ct su
perv
isor…
Plea
se th
ink
abou
t you
r tea
m le
ader
. H
ow w
ell d
o th
e fo
llow
ing
stat
emen
t ap
ply?
Our
team
lead
er…
Team
M
embe
rsD
enke
n Si
e bi
tte a
n di
e Ko
llegi
nnen
un
d Ko
llege
n, m
it de
nen
Sie
rege
l-m
äßig
zus
amm
enar
beite
n. W
ie g
ut
besc
hrei
ben
die
folg
ende
n Au
ssag
en
Ihre
Arb
eits
kolle
gen/
inne
n?
Mei
ne A
rbeit
skoll
egen
/inne
n sin
d…
Den
ken
Sie
nun
bitte
an
die
ande
ren
Mitg
liede
r Ihr
es T
eam
s. In
wie
fern
tr
effe
n di
e fo
lgen
den
Auss
agen
zu?
Mei
ne Te
amko
llege
n/in
nen
sind…
Plea
se th
ink
abou
t you
r cow
orke
rs
who
you
regu
larly
col
labo
rate
with
. H
ow w
ell d
o th
e fo
llow
ing
stat
emen
t de
scrib
e yo
ur c
owor
kers
?
My
cowo
rker
s are
…
Plea
se th
ink
abou
t the
oth
er
mem
bers
of y
our t
eam
. How
wel
l do
the
follo
win
g st
atem
ent d
escr
ibe
your
team
mem
bers
?
My
team
colle
ague
s are
…
Ove
rall
Die
folg
ende
n Au
ssag
en b
ezie
hen
sich
auf I
hren
akt
uelle
n Jo
b. W
ie g
ut
besc
hrei
ben
die
folg
ende
n Au
ssag
en
Ihre
n Jo
b?
Alle
in a
llem
ist m
ein Jo
b…
Die
folg
ende
n Au
ssag
en b
ezie
hen
sich
auf I
hr Te
am. I
nwie
fern
tref
fen
die
folg
ende
n Au
ssag
en z
u?
Alle
s in
alle
m is
t die
Arb
eit in
dies
em
Team
…
The
follo
win
g st
atem
ent r
elat
e to
yo
ur jo
b in
gene
ral.
How
wel
l do
the
follo
win
g st
atem
ent d
escr
ibe
your
jo
b?
All i
n al
l, m
y job
is…
The
follo
win
g st
atem
ent r
elat
e to
yo
ur te
am. H
ow w
ell d
o th
e fo
llow
ing
stat
emen
t app
ly?
All i
n al
l, wo
rkin
g in
this
team
is…
72

6.3 Validation Hypotheses
6.3.1 Factorial Validity
The facet scales should exhibit a three-factorial structure, with items loading on their re-spective factors without sizeable cross-loadings. The overall satisfaction scale, on the other hand, should be unidimensional.
6.3.2 Correlational Pattern
With regard to the scales’ intercorrelations, there is little prior research to guide hypothe-ses development, because most research did not consider different facets of satisfaction in teams separately. In two studies, Dineen et al. (2007) assessed satisfaction with the team (i.e., an internal facet) and satisfaction with the job and the study course (i.e., external facets). In both cases, intercorrelations between the two facets were modest (.40 and .42). Mason and Griffin (2005) considered three satisfaction facets: satisfaction with the inter-nal and the external working environment, and satisfaction with the task itself. Their scales are similar to the ones discussed here, as team members and the team leader are part of the teams’ internal and external working environment, respectively. In their study, internal satisfaction showed moderate correlations to task satisfaction, r = .33, and to external satisfaction, r = .38. The relationship between task satisfaction and external satisfaction was stronger, r = .61. This pattern of results corresponds to Dineen et al.’s (2007) who conceptualized the study course, which describes the teams’ overall task, as an external facet. Taken together, I expect modest correlations between the team members satisfaction scale and the other facets, and a somewhat stronger relationship between task and team leader satisfaction.
6.3.3 Construct Validity
I expect overall satisfaction to be positively related to performance-related criteria. In par-ticular, based on the Whitman et al.’s (2010) meta analysis, I expect positive relationships with team-rated performance and citizenship behaviors. I further expect that a negative overall evaluation of the team will promote absenteeism from meetings.
According to affective events theory (H. Weiss & Cropanzano, 1996), work events, such as conflict or feedback, can affect job attitudes by inducing positive or negative affect. Although not explicitly stated by the theory, events that relate to a specific aspect of the job can be assumed to affect satisfaction with this aspect. For instance, if a member frequently receives positive or negative feedback from the team leader, we can expect that the effect on team leader satisfaction will be stronger than on other satisfaction facets. In other words, I ex-pect stronger relationships between corresponding satisfaction facets and events than between non-corresponding satisfaction facets and events.
73

6.4 Method
6.4.1 Sample
To validate the adapted satisfaction scales, I used the data from 202 team members working in 47 teams. Teams were sampled from a variety of branches and industries including re-tail, chemical engineering, construction, finance, and education. Average team size was M = 9.87 (SD = 7.52) members, with M = 4.35 (SD = 2.20) participating team members. The average participation rate per team was 58 % (SD = 30 %).
6.4.2 Measures
Satisfaction. I assessed satisfaction with the adapted version of the KAFA. I used the four scales described above to assess overall satisfaction and satisfaction with the task, the team leader, and the team members. All items (both the German original and an English translation) are presented in Table 15.
Affective events. I formulated six items that asked participants how frequently certain affective events occurred in the last month. Specifically, events focused on the task (e.g., worked on enjoyable tasks), the team leader (e.g., received positive feedback from supervisor), and the team members (e.g., had an argument with a coworker). The instruction was: “On the following page, you will find a list of events that can occur in everyday professional life. Please state, how often you experienced these events in the last month.” Response options ranged from 1 (very rarely or not at all) to 5 (very often).
Individual-level consequences. I assessed team members’ intention to leave the team as an individual-level consequence of (dis)satisfaction. I used two items: “I often think about leaving this team” and “I would leave the team if I could”. Response options ranged from 1 (do not agree at all) to 6 (completely agree). Internal consistency of this scale was α = .92.
Group-level consequences. I assessed team-rated performance, team citizenship behavi-or, and meeting absenteeism as group-level consequences of (dis)satisfaction. Team mem-bers were asked to rate the team’s overall task performance on an eleven-point scale from 0 (very poor) to 10 (very good). Team citizenship behaviors were assessed with the Hel-ping subscale from Podsakoff, Ahearne, & MacKenzie (1997). An example item was “Members of my team take steps to try to prevent problems with other crew members”. Internal consistency of the scale was α = .86. Finally, I assessed meeting absenteeism with two items. The items were “All scheduled members attend team meetings” (reverse coded) and “When we have team meetings, there are often some members missing”. Internal con-sistency of this scale was α = .86. For team citizenship behaviors and meeting absenteeism, I used the same response options as for intention to leave.
Since all group-level performance outcomes follow a referent-shift consensus model (Chan, 1998), I calculated rWG indices before aggregating them to the group level. Average within-group agreement was moderate (rWG = .52) for meeting absenteeism, and strong for team citizenship behavior (rWG = .81) and team-rated performance (rWG = .82). I averaged individual responses to obtain group-level indices.
74

6.5 Results
6.5.1 Item and Scale Statistics
Tables 15 and 16 show item and scale statistics, respectively. Most of the part-whole cor-rected item-total correlations are above .50 with exception of the items rather uninteres-ting (task) and satisfying (overall) whose rit values are below .40.
Table 15Item Statistics for the Four Satisfaction Scales
Note. n = 202 team members. rit = part-whole corrected item-total correlation; (r) = reverse-coded item. Mean values of reverse-coded items are shown prior to inverting. a The study was conducted in German. English translations are intended for non-German readers. The translated items have not been tested or validated.
Items (German) Items (English)a M SD rit
Die Tätigkeiten, die ich in diesem Team ausführe…
The work I do in this team…
sind ziemlich uninteressant. (r) is rather uninteresting. (r) 2.03 2.71 .38sind spannend. is exciting. 7.00 1.99 .64fordern mich. challenges me. 7.04 2.12 .53langweilen mich. (r) bores me. (r) 1.36 1.95 .59gefallen mir. pleases me. 7.80 1.78 .57
Meine Teamkollegen/innen sind… My team colleagues are…zerstritten. (r) quarreling. (r) 1.82 2.53 .74sympathisch. likeable. 8.31 1.82 .84kollegial. cooperative. 7.90 2.11 .82angenehm. pleasant. 8.05 2.11 .81frustrierend. (r) frustrating. (r) 1.87 2.48 .77
Unser/e Teamleiter/in ist Our team leader is…rücksichtsvoll. considerate. 7.62 2.46 .84fair. fair. 7.74 2.44 .81unbeliebt. (r) unpopular. (r) 1.75 2.46 .74vertrauenswürdig. trustworthy. 7.98 2.32 .83ungerecht. (r) unjust. (r) 1.60 2.36 .78
Alles in allem ist die Arbeit in diesem Team…
All in all, working in this team is…
gut. good. 8.00 2.26 .75zufriedenstellend. satisfying. 7.22 2.64 .39dürftig. (r) poor. (r) 1.57 2.28 .57angenehm. enjoyable. 8.09 2.11 .78niemandem zu wünschen. (r) undesirable. (r) 0.86 1.98 .74
75

As a consequence of the medium-sized item-total correlations, internal consistencies for the task (α = .76) and overall satisfaction (α = .83) scales are somewhat lower than the ones for the team members and team leader satisfaction scales (both α = .92). In accor-dance with the original KAFA and other satisfaction scales (e.g., Stanton et al., 2001), the mean values lie above the scales’ midpoints and the distributions are skewed to the left. To assess within-group agreement in satisfaction, I calculated rWG values with uniform null distributions (James, Demaree, & Wolf, 1993). All rWG values lie in the range between .70 and .77 which indicate moderate to strong agreement (LeBreton & Senter, 2008).
Table 16Individual-Level and Group-Level Scale Statistics
Note. n = 202 team members; N = 47 teams. Internal consistencies (Cronbach’s alpha) in parenthe-ses for individual-level data; rWG values in parentheses for group-level data. * p < .05, ** p < .01, *** p < .001 (two-sided).
6.5.2 Factorial Validity
In a next step, I sought to assess the factorial validity of the four satisfaction scales. Speci-fically, I expected a three-factorial structure for the three facet scales, and a one-factorial (i.e., unidimensional) structure for overall satisfaction.
To test the three-factorial structure, I first conducted a principal component analysis (PCA) with varimax rotation (see Table 17). Three factors had eigenvalues greater than one (Fac-tor 1: 6.89; Factor 2: 2.06, Factor 3: 1.44) which were retained (Kaiser, 1960). The PCA shows that all items load on their corresponding factors without sizeable cross loadings (maximum cross loading = .33). All primary loadings were above the cut-off values re-commended in the literature (e.g., Costello & Osborne, 2005; Ford, MacCallum, & Tait, 1986) and can thus be interpreted as substantive. The three factors explained a total of 69 % of the variance.
Level / Scale M SD Skewness 1. 2. 3. 4.
Individual level
1. Task 7.61 1.56 -0.78 (.76)
2. Team Members 8.08 1.94 -1.42 .35*** (.92)
3. Team Leader 7.97 2.12 -1.27 .35*** .65*** (.92)
4. Overall 8.15 1.77 -1.55 .39*** .80*** .62*** (.83)
Group level (average)
1. Task 7.66 0.89 -0.20 (.77)
2. Team Members 8.16 1.28 -0.60 .33* (.75)
3. Team Leader 8.03 1.38 -0.88 .24 .60*** (.70)
4. Overall 8.23 1.04 -0.66 .40** .87*** .52*** (.77)
76

Table 17Factor Loadings for Satisfaction Facets in PCA and CFA
Note. n = 202 team members. (r) = reverse-coded item; F = Factor; M = Model. PCA factor loadings above .40 are printed in bold.a Factor loadings are shown for Satorra-Bentler-adjusted models only.
In a next step, I conducted a confirmatory factor analysis (CFA) with the R software package lavaan (Rosseel, 2012). However, because the descriptive statistics have shown that the data are non-normally distributed (cf. Table 18), maximum likelihood estimation would produce biased statistics (Yuan, Bentler, & Zhang, 2005). I therefore used maximum likeli-hood estimation with robust standard errors, also know as the Satorra-Bentler adjustment (Satorra & Bentler, 1994). Because this adjustment improves model fit, I report the results for both models — one without and one with Satorra-Bentler adjusted statistics.
Table 18 shows the fit statistics for the three-factorial model. The initial model (Model 1) provided mediocre fit to the data (Hu & Bentler, 1999). Modification indices revealed that the reverse-coded items in all scales had common variance unaccounted for by the latent factors. I therefore respecified the model by adding method factors (Model 2). This im-proved fit for both models significantly (for the unadjusted model: Δdf = 3, Δχ² = 81.026, p < .001; and for the adjusted model: Δdf = 3, Δχ² = 55.037 , p < .001). 7
PCA CFAa
Facet Item (English) Item (German) F1 F2 F3 M1 M2
Team Leader considerate rücksichtsvoll .84 .31 .15 .76 .73Team Leader trustworthy vertrauenswürdig .83 .31 .13 .90 .90
Team Leader fair fair .82 .28 .15 .78 .76Team Leader unjust (r) ungerecht (r) -.80 -.28 -.15 -.90 -.91
Team Leader unpopular (r) unbeliebt (r) -.79 -.25 -.10 -.86 -.86Team Members likeable sympathisch .30 .84 .16 .76 .73
Team Members cooperative kollegial .31 .82 .16 .91 .91Team Members pleasant angenehm .33 .82 .14 .89 .90
Team Members frustrating (r) frustrierend (r) -.28 -.79 -.11 -.74 -.71Team Members quarreling (r) zerstritten (r) -.25 -.77 -.18 -.89 -.89
Task exciting spannend .17 .13 .79 .64 .63Task boring (r) langweilig (r) -.02 -.10 -.78 -.66 -.73
Task challenging fordernd .23 -.10 .74 .66 .73
Task pleasing gefallen mir .13 .25 .68 .41 .41Task rather
uninteresting (r)ziemlich uninteressant (r)
-.03 -.19 -.53 -.82 -.78
Eigenvalue 6.89 2.06 1.44% Variance explained 25.73 25.35 18.20% Variance explained cum. 25.73 51.08 69.28
Note that the difference between two scaled chi-square values does not follow a chi-square distribution. I therefore calcu7 -lated a scaled difference chi-square test statistic, as described in Satorra and Bentler (2001).
77

Table 18 CFA Fit Statistics for the Three-Factorial Model
Note. Adjustment refers to the Satorra-Bentler adjustment (Satorra & Bentler, 1994). CFI = comparative fit index; RMSEA = root-mean-square error of approximation; SRMR = standardized root-mean-square residual.
To check for unidimensionality in the overall satisfaction scale, I conducted another CFA. 8
Fit statistics were χ² = 30.266, df = 5, p < .001, CFI = .949, RMSEA = .158, SRMR = .040. Here, a pattern similar to the one obtained for the facet scales emerged as the two reverse-coded items had common variance unaccounted for by the latent factor. After allowing the covariance of the residuals to be freely estimated, fit statistics were χ² = 3.645, df = 4, p = .456, CFI = 1.000, RMSEA = .000, SRMR = .015, and overall fit improved significantly, Δdf = 1, Δχ² = 26.621, p < .001. Factor loadings for the five items were .87 (good), .91 (enjoyable), .44 (satisfying), .59 (poor), and .75 (undesirable).
6.5.3 Correlational Pattern
The intercorrelations of the three facets scales are not as expected (cf. Table 16). Although I assumed a stronger relationship between task and team leader satisfaction, their rela-tionship was modest at the individual level, r = .35, p < .001, and small at the group level, r = .24, p = .10. However, the team members and team leader scales were strongly rela-ted on both the individual level, r = .65, p < .001, and the group level, r = .60, p < .001. While I formulated no hypotheses concerning the relationship of the satisfaction facets with the overall satisfaction scale, Table 16 shows that the team members and overall satisfaction scales are highly correlated, r = .80 at the individual level; r = .87 at the group level.
6.5.4 Construct Validity
Table 19 shows individual-level and group-level correlations between the four satisfaction scales and the validation criteria. The relationships between the satisfaction scales and the affective events show the hypothesized pattern as events related to the team leader, the team members, and the task are most strongly related to the corresponding satisfaction
Model Method factors df χ² p CFI RMSEA SRMR
Unadjusted
Model 1 no 87 207.017 .000 .939 .083 .049
Model 2 yes 84 125.991 .002 .979 .050 .045
Adjusted
Model 1 no 87 158.507 .000 .931 .064 .049
Model 2 yes 84 103.470 .074 .981 .034 .045
As fit statistics were very similar for the adjusted and unadjusted models, I report statistics for the unadjusted models only.8
78
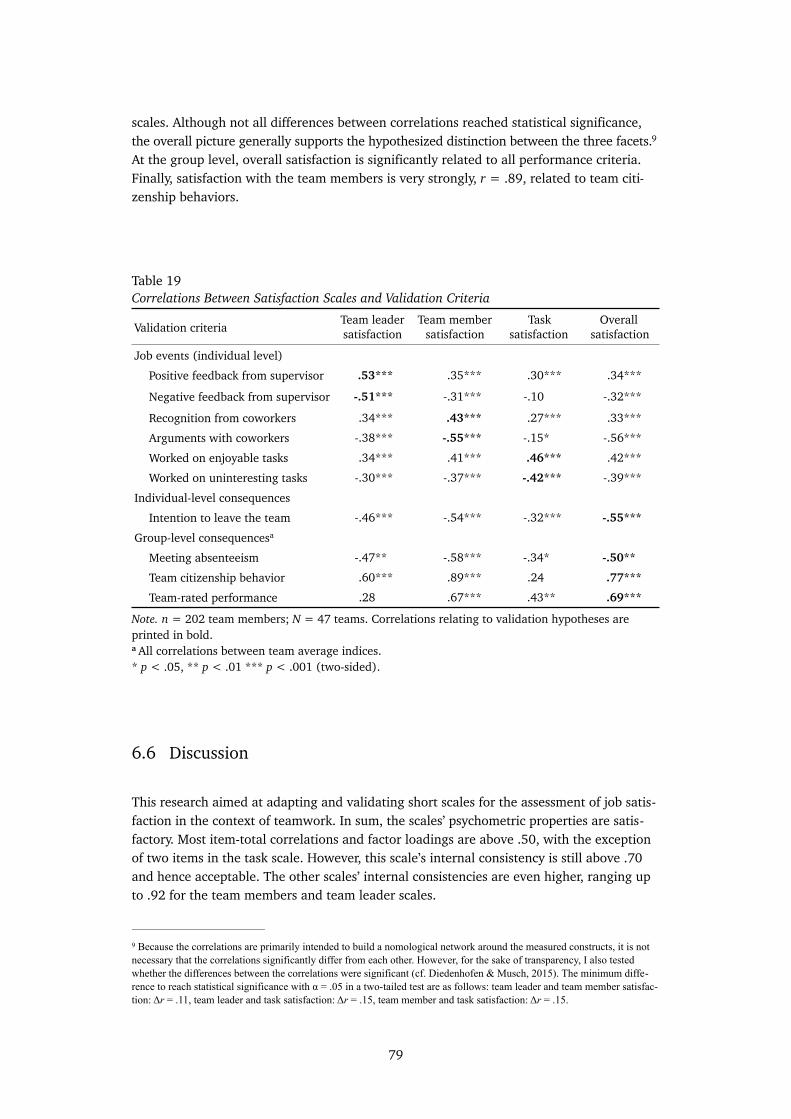
scales. Although not all differences between correlations reached statistical significance, the overall picture generally supports the hypothesized distinction between the three facets. 9
At the group level, overall satisfaction is significantly related to all performance criteria. Finally, satisfaction with the team members is very strongly, r = .89, related to team citi-zenship behaviors.
Table 19Correlations Between Satisfaction Scales and Validation Criteria
Note. n = 202 team members; N = 47 teams. Correlations relating to validation hypotheses are printed in bold.a All correlations between team average indices. * p < .05, ** p < .01 *** p < .001 (two-sided).
6.6 Discussion
This research aimed at adapting and validating short scales for the assessment of job satis-faction in the context of teamwork. In sum, the scales’ psychometric properties are satis-factory. Most item-total correlations and factor loadings are above .50, with the exception of two items in the task scale. However, this scale’s internal consistency is still above .70 and hence acceptable. The other scales’ internal consistencies are even higher, ranging up to .92 for the team members and team leader scales.
Validation criteria Team leader satisfaction
Team member satisfaction
Task satisfaction
Overall satisfaction
Job events (individual level)Positive feedback from supervisor .53*** .35*** .30*** .34***
Negative feedback from supervisor -.51*** -.31*** -.10 -.32***
Recognition from coworkers .34*** .43*** .27*** .33***Arguments with coworkers -.38*** -.55*** -.15* -.56***Worked on enjoyable tasks .34*** .41*** .46*** .42***Worked on uninteresting tasks -.30*** -.37*** -.42*** -.39***
Individual-level consequencesIntention to leave the team -.46*** -.54*** -.32*** -.55***
Group-level consequencesa
Meeting absenteeism -.47** -.58*** -.34* -.50**Team citizenship behavior .60*** .89*** .24 .77***Team-rated performance .28 .67*** .43** .69***
Because the correlations are primarily intended to build a nomological network around the measured constructs, it is not 9
necessary that the correlations significantly differ from each other. However, for the sake of transparency, I also tested whether the differences between the correlations were significant (cf. Diedenhofen & Musch, 2015). The minimum diffe-rence to reach statistical significance with α = .05 in a two-tailed test are as follows: team leader and team member satisfac-tion: Δr = .11, team leader and task satisfaction: Δr = .15, team member and task satisfaction: Δr = .15.
79

While exploratory and confirmatory factor analyses generally supported the expected fac-torial structures, analyses also showed that the reverse-coded items produced common method bias (Podsakoff, MacKenzie, Lee, & Podsakoff, 2003). This is, in fact, a well-known problem for scale developers that has been subject to much debate (for a review, see Weij-ters & Baumgartner, 2012). In short, there are both advantages and disadvantages in using reverse-coded items. While on the one hand, reverse-coded items are helpful for tackling acquiescence bias and detecting careless responding, on the other hand, they often have smaller factor loadings and item-total correlations than positive-coded items, lead to reduced scale reliability, and impair factorial validity (Herche & Engelland, 1996; Weijters & Baumgartner, 2012). Faced with this trade-off, I decided to retain the reverse-coded items for two reasons. First, factor loadings and item-total correlations for these items were not considerably worse than for the positive-coded items. Second, internal consisten-cies were acceptable despite the inclusion of reverse-coded items.
The correlational pattern between the facet scales was not as hypothesized. An explanation could lie in different conceptualizations of task satisfaction as compared to prior studies. Whereas Mason and Griffin (2005) focused on a single team task (i.e., the task of the team as a whole), the task facet in this research focuses on team members’ individual tasks within the team. Although somewhat speculative, the strong correlation between task and team leader satisfaction in Mason and Griffin’s (2005) study could be due to the fact that the team leader assigns, controls, and evaluates the teams’ task and task performance. Con-versely, each team member’s individual task might to a lesser extend be controlled by the team leader, but more by the teams’ internal agreements. This would suggest that team members’ task satisfaction in this study and team task satisfaction as conceptualized by Mason and Griffin (2005) are different constructs. While more research is needed to resolve this issue, researchers should nevertheless be careful when referring to task satisfaction in the team context to avoid confusion.
Construct validation revealed another interesting finding concerning differences to job satisfaction in non-team contexts. Traditionally, satisfaction with the task has been con-sidered the most important facet of satisfaction as it usually shows the strongest relation-ships with job performance, withdrawal cognitions, and withdrawal behaviors (Kinicki et al., 2002). In the team context, however, satisfaction with the task seems to play a much less important role. From all facets considered in this study, task satisfaction exhibited the weakest relationships with turnover intention, meeting absenteeism, and citizenship behavior.
In contrast, the results emphasize the role of satisfaction with the team members for indi-vidual and group-level outcomes. Attitudes towards the other members most strongly af-fected members’ intention to leave the team, and also showed the strongest relationships with absenteeism, citizenship behavior, and performance. The relationship between team member and overall satisfaction was also remarkably strong. In fact, the magnitude of this relationship, r = .87 at the group level, casts some doubt on the discriminant validity of the two constructs. However, two reasons speak in favor of a differentiation: From a statis-tical perspective, recognition from coworkers and team citizenship behaviors had signifi-cantly stronger relationships with team member satisfaction than with overall satisfaction, indicating that satisfaction with these facets are different construct. From a conceptual perspective, there is no overlap in the vignettes and items used to assess both constructs. We can therefore assume that team member and overall satisfaction are separate but highly
80

related constructs. In other words, the interpersonal relationships among team members play a crucial role for the evaluation of working in the team.
Taken together, this research introduced short scales to assess overall and facet-specific satisfaction in the context of teams. Although the data presented herein suggest reliable and valid measurement, researchers should bear in mind that this is the first empirical application of the scales. The results of this study should therefore be replicated to better evaluate the scales’ properties. I hope that the availability of validated scales contributes to a better comparability of results across studies and encourages future research to invest in the study of satisfaction in teams.
81


7 Study 3: Uncovering Cognitive and Affective Sources of Satisfaction Homogeneity in Work Teams
Benjamin HaarhausTU Chemnitz, Germany
Published in Group Processes & Intergroup Relations, ahead of print, 1–23.
Abstract
Shared satisfaction in teams is crucial for team functioning and performance. However, it is still unclear how and why team members’ job satisfaction transforms into a shared team property. Based on affective events theory, I test hypotheses about situational, dispositional 10
and social antecedents of satisfaction homogeneity with a comprehensive model. Path analyses based on data from 415 team members working in 110 teams suggest that job satisfaction homogeneity primarily depends on characteristics of the working environ-ment. Experiencing similar affective job events increased the likelihood of shared satisfac-tion by inducing shared affect. Team members’ personality traits (core self-evaluations) had indirect and small effects on satisfaction homogeneity. Unlike earlier studies, there was no evidence that social interaction leads to agreement in job satisfaction. Additionally, I partly replicated the finding that satisfaction homogeneity moderates the team-level satisfaction—team performance relationship.
As this study focuses on overall satisfaction with the team (cf. Table 7, p. 34), the term team satisfaction would be more 10
appropriate than job satisfaction. The terms shared satisfaction and uniform satisfaction are used interchangeably because the referent is the same for all members.
83

7.1 Introduction
Job satisfaction in teams is crucial for team functioning and performance. Meta-analyses revealed that satisfaction in teams is related to outcomes such as turnover, absenteeism, productivity, and performance, especially when it is shared among members (Harter et al., 2002; Whitman et al., 2010). Despite these findings, it is still unclear how job satisfaction emerges as a shared attitude of the team. In particular, three issues remain that I will focus on in this article: First, empirical studies on the antecedents of satisfaction homogeneity are scarce (for an exception, see Mason, 2006). This is problematic because the literature provides multiple explanations for shared satisfaction that have not been tested simulta-neously. Second, prior studies did no integrate the antecedents of homogeneity into an overarching theoretical framework, which makes it difficult to explain the processes un-derlying the emergence of shared satisfaction. Third, the few empirical studies on homo-geneity were based on small samples (Mason, 2006), or did not consider that average scores and homogeneity are statistically confounded (e.g., K. Klein et al., 2001), which complicates interpretability of results.
Given these shortcomings, it is not surprising that authors called for more research in this domain (e.g., Whitman et al., 2010; Zampetakis & Moustakis, 2011). In response to these calls, the purpose of this study is to identify and analyze the factors that lead to satisfac-tion homogeneity in work teams. In particular, this study contributes to the literature by addressing the three issues stated before: It tests various hypotheses about the antecedents of satisfaction homogeneity in an empirical setting. Hypotheses are embedded in a com-prehensive model that considers cognitive and affective sources of satisfaction, which helps distinguishing the processes underlying satisfaction homogeneity. Finally, controlling for the average level of satisfaction allows to analyze satisfaction homogeneity in isolation, which makes interpretation of results more clear-cut. In this way, the article adds to our understanding of how job satisfaction transforms into a shared attitude on the team level and contributes to a more comprehensive understanding of job satisfaction in teams.
7.2 Satisfaction Homogeneity: Conceptualization and Review
Job satisfaction homogeneity refers to within-team agreement or consensus regarding job satisfaction. In the case of high homogeneity, all team members are similarly satisfied or dissatisfied with their jobs. In the absence of homogeneity, team members hold different or even opposing attitudes towards their jobs. A related but distinct construct, attitude (dis)similarity, refers to one member’s job satisfaction relative to the team’s average satis-faction, that is, an individual-level construct. In contrast, satisfaction homogeneity is a team-level construct that can be operationalized using agreement indices such as rWG
(James, Demaree, & Wolf, 1984; James et al., 1993), ICC(1) and ICC(2) (LeBreton & Senter, 2008), or transformed variances (Bliese & Halverson, 1998).
Convergence of satisfaction in teams is an important field for research because a shared attitude towards the task and the working environment affects team member relationships and collaboration. For instance, the similarity/attraction paradigm (Byrne, 1961) suggests
84

that attitudinal congruence is a rewarding experience because it validates and approves each members’ own attitudes. While differing views about the job might provoke tension among members, collective satisfaction (and dissatisfaction) can help strengthen social bonds and increase cohesiveness (Weeks, 2004). Likewise, dissatisfied members’ negativi-ty, cynicism, and low engagement can ruin a whole team’s morale like the proverbial bad apple that spoils the barrel (Felps, Mitchell, & Byington, 2006). Bolstering these arguments, studies showed that homogeneity of satisfaction affects team cohesion (Harrison et al., 1998), social integration (van der Vegt, 2002), absenteeism (Dineen et al., 2007), and the relationship between teams’ average satisfaction and team performance (Whitman et al., 2010).
In the literature on team-level satisfaction, authors usually propose three antecedents and processes that foster the sharedness of job satisfaction. These can be classified as situational, dispositional, and social influences (e.g., Mason & Griffin, 2005; Ryan, Schmit, & Johnson, 1996; van de Voorde et al., 2014).
Situational influences refer to the fact that team members are confronted with the same organizational context and working conditions, often have the same team leader, and have similar experiences at work.
Dispositional influences refer to the fact that individuals differ in how they perceive and react to their environment. In particular, authors hypothesized that members with similar personality traits will also have similar levels of job satisfaction. This argument is mostly put forward in conjunction with the attraction-selection-attrition (ASA) framework (Schneider et al., 1995). Applied to the team context, the ASA framework suggests that individuals are attracted to and selected into teams in which members have matching or fitting personality traits. Taken together, the dispositional argument rests on two distinct premises: First, personality traits in teams become more similar over time, and second, similarity in personality traits fosters shared satisfaction. In this paper, I will focus on the latter relationship because it is a necessary condition for shared satisfaction to arise.
Finally, social influences refer to the fact that team members mutually shape their attitudes through interaction and communication. Two main processes that foster shared satisfac-tion have been discussed: First, social interaction leads to shared satisfaction because it gives team members the opportunity to exchange moods and emotions, which has been referred to as emotional contagion (Barsade & Gibson, 2012; Tanghe, Wisse, & van der Flier, 2010). Second, social interaction lets team members adjust their perceptions of job features, which has been denoted as social information processing (K. Klein et al., 2001; Salancik & Pfeffer, 1978).
Since the antecedents presented before can operate on a cognitive and an affective route, they can be embedded in a theoretical framework that considers both sources of job satis-faction. A framework that does that is affective events theory (H. Weiss & Cropanzano, 1996), which I will briefly review in the following section.
85

7.3 Affective and Cognitive Routes to Job Satisfaction
H. Weiss, Nicholas, and Daus (1999, p. 175) define job satisfaction as “a positive (or nega-tive) evaluative judgment one makes about one’s job or job situation”. Like other attitudes, job satisfaction is based on cognitive considerations, that is, beliefs about the attitude ob-ject, and affective experiences, that is, moods and emotions associated with the attitude object (van den Berg et al., 2006). Cognitive approaches to job satisfaction employ some kind of “cognitive algebra” in which perceived job features, such as pay, promotions and supervision, are compared to expected or ideal levels of these features. Affective approaches, on the other hand, focus on the role of moods and emotions at work. Affective events theory (H. Weiss & Cropanzano, 1996) combines both approaches (see Figure 6): On the affective route, job satisfaction results from positive and negative job events that elicit positive and negative affective responses to these events. These affective responses in turn lead to the emergence of job satisfaction or dissatisfaction. On the cognitive route, job satisfaction results from beliefs about or evaluations of job features, such as autonomy or task signifi-cance. Job features affect job satisfaction in two ways (Wegge, Dick, Fisher, West, & Daw-son, 2006): First, they affect the likeliness of positive or negative job events to occur, thereby affecting job satisfaction on the affective route. Second, they are compared to a set of stan-dards which directly influences job satisfaction on the cognitive route.
Figure 6. Basic assumptions of affective events theory. Based on H. Weiss and Cropanzano, 1996.
Affective events theory also explains the relationship between personality traits and job satisfaction. According to the theory, personality traits indirectly influence satisfaction by affecting how individuals react to workplace events. For instance, individuals high in trait anxiety show stronger reactions to negative workplace events than individuals with lower levels of trait anxiety (Glasø, Vie, Holmdal, & Einarsen, 2011). Hence, affect arises from an interaction of environmental conditions and individual dispositions.
Job Satisfaction
Job Features
Dispositions
Job Events Job Affect
Cognitive Route
AffectiveRoute
86

Affective events theory is a suitable framework for analyzing satisfaction homogeneity in work teams: First, the framework considers both affective-based and cognitive-based sources of job satisfaction, which is helpful in explaining the processes underlying satisfaction ho-mogeneity. Second, affective events theory considers situational and dispositional influen-ces on job satisfaction, which supports our aim to empirically disentangle their effects on satisfaction homogeneity. Finally, the theory’s basic assumptions have been proven valid in several studies dealing with a variety of organizational phenomena such as work-family enrichment (Carlson, Kacmar, Zivnuska, Ferguson, & Whitten, 2011), political tactics (Thiel, Hill, Griffith, & Connelly, 2012), transformational leadership (Ge, Tian, & Fu, 2012), and workplace bullying (Glasø et al., 2011).
7.4 Situational, Dispositional, and Social Antecedents of Satisfaction Homogeneity
Affective events theory explains how (perceived) job features and job events affect indivi-dual job satisfaction. However, homogeneity of satisfaction is a group-level construct so that we need to adapt the framework to the group level (see Figure 7).
Figure 7. Theoretical framework and hypotheses.
When transferring the framework to the group level, I made three changes to the model. First, the adapted framework considers within-team homogeneity instead of individual responses. Since the focal construct at the group level is the agreement or consensus of lower-level responses, the composition follows a dispersion model according to Chan (1998). For instance, the path between (perceived) job features and job satisfaction in the original model is now a path between homogeneity of (perceived) job features and homo-
Homogeneity of Job Satisfaction
Homogeneity of (Perceived) Job
Features
Homogeneity of neg. Job Events
Homogeneity of CSEs
Homogeneity of pos. Job Events
Homogeneity of pos. Job Affect
Social Interaction
H1a
H1bH1b
H1bH1b
H2a
H2b
H3a
H3b
Homogeneity of neg. Job Affect
87

geneity of job satisfaction. Thus, if team members have a similar perception of their working environment, their job satisfaction is likely to be similar. Second, I separated job events and job affect into positive and negative events and affect, respectively. I introduced this separation because I will consider positive and negative events and affect separately in the subsequent path analysis. Third, I added social interactions to the model. In contrast to the other factors, social interaction refers to a mean-based value, that is, to the extent to which team members interact with each other. In the following sections, I address the mo-del’s elements in more details and derive hypotheses about situational, dispositional and social antecedents of satisfaction homogeneity.
7.4.1 Situational Antecedents
According to affective events theory, job features affect job satisfaction via the cognitive route. Consequently, team members who work under the same conditions, such as the same supervisor support or the same degree of autonomy, will evaluate their jobs more similar than members who work under different conditions.
Why would we expect job features to differ between team members? According to the job characteristics model (Hackman & Oldham, 1975, 1980), job features that influence job satisfaction are the experienced meaningfulness (that is, skill variety, task identity, and task significance), autonomy and feedback. Each of these features might be different for members of the same team. It is common that team members hold different roles (Hum-phrey et al., 2009), have different skills (Torre-Ruiz, Aragón-Correa, & Ferrón-Vílchez, 2011; Volmer & Sonnentag, 2011) and different responsibilities (Moon et al., 2004), all of which might contribute to some team members’ experiencing their jobs as more meaningful than others. Team members might also have different degrees of autonomy, for example because some members have the privilege to work at home while others need to be pre-sent (Lautsch & Kossek, 2011). Finally, some team members might receive more feedback from their supervisor than others. For instance, research on leader-member exchange (LMX) has shown that team leaders can have different relationships with individual team members which affects team member’s behaviors (Vidyarthi, Liden, Anand, Erdogan, & Ghosh, 2010) and job satisfaction (D. T. Hooper & Martin, 2008). In summary, I propose that homogeneity of job features will have a direct positive effect on homogeneity of job satisfaction.
Hypothesis 1a: Homogeneity of job features is positively related to homogeneity of job satisfaction.
Further situational influences on job satisfaction are job events, such as an argument with a co-worker or the successful completion of a task (Mignonac & Herrbach, 2004). Because individual job events elicit individual affective reactions, we can assume that, on the team level, similar job events will lead to similar affective experiences. Performance feedback, for instance, can be regarded an affective event because it elicits positive or negative affec-tive reactions (Belschak & Den Hartog, 2009). If the team leader gives feedback to the team as a whole, all members experience the same positive or negative event so that we expect them to show similar affective reactions in response to this event. Conversely, if team members receive feedback individually, they might experience different affective events and show different affective reactions.
88

As proposed by affective events theory and supported by empirical studies, affective expe-riences are closely related to job satisfaction (Kafetsios & Zampetakis, 2008; Meeusen, van Dam, van Zundert, & Knape, 2010). Therefore, on the team level, homogeneity of affect at work will be positively related to homogeneity of job satisfaction. Taken together, I hypo-thesize that satisfaction homogeneity depends on the extent to which team members expe-rience similar job events and that this relationship is mediated by the affective reactions elicited by these events.
Hypothesis 1b: Homogeneity of job events is positively related to homogeneity of job satisfaction. The effect is mediated by homogeneity of affect at work.
7.4.2 Dispositional Antecedents
In the discussion on the linkage between personality traits and job satisfaction, a disposition that received wide attention by researchers is the concept of core self-evaluations (CSEs; Judge et al., 1997). CSEs form a broad construct that entails the personality traits self-esteem, locus of control, self-efficacy, and neuroticism (negatively scored). Individuals high in CSEs are characterized by a positive self image, low emotional vulnerability, and the belief of being in control and being capable of overcoming obstacles.
There is strong meta-analytic evidence that CSEs are positively related to job satisfaction (e.g., Chang, Ferris, Johnson, Rosen, & Tan, 2011; Lemelle & Scielzo, 2012). On the cogni-tive route, CSEs influence how team members perceive their working environment (Judge et al., 2000; Srivastava et al., 2010). Members with high levels of CSEs perceive their jobs more positively than members with low levels of CSEs because they focus on the positive aspects of their working environment, feel more in control, and see their work as more challenging and intrinsically motivating (Judge et al., 1998). Consequently, team members with similarly high or low levels of CSEs should also have a similarly positive or negative view on their working environment. Therefore, in conjunction with Hypothesis 1a, I expect that homogeneity of CSEs affects homogeneity of job satisfaction, mediated by homogeneity of perceived job features.
Hypothesis 2a: Homogeneity of CSEs is positively related to homogeneity of job satisfaction. The effect is mediated by homogeneity of perceived job fea-tures.
Personality traits do not only influence team members’ perception of job features but also their susceptibility to positive and negative affect. In particular, personality traits can be seen as predispositions that “set the stage” for experiencing certain moods and emotions (H. Weiss & Cropanzano, 1996, p. 37). According to affective events theory, personality traits influence affective experiences in two ways: First, they influence how easily and how often individuals experience positive or negative affect. Second, they can provide resour-ces that help individuals to cope with stressful situations (Hobfoll, 1989). For instance, studies found that CSEs moderate the effects of social stressors (Harris et al., 2009) and exhaustion (Karatepe, 2011) on job satisfaction, and the relationship between work-family conflict and burnout (Haines, Harvey, Durand, & Marchand, 2013). The relationship between CSEs and job satisfaction is, therefore, also due to core self-evaluations’ reducing negative affect, especially in response to negative events.
89

However, the moderating effect of CSEs does not translate well to the team level when dealing with homogeneity: In the case of low homogeneity of negative events (that is, team members experience negative events differently often) and low homogeneity of CSEs, the direction of the effect depends on which specific members have high and which have low levels of CSEs, or stated differently, if the frequency of negative events and the level of CSEs align. Therefore, I will focus on the direct effect of homogeneity of CSEs without considering a possible interaction with homogeneity of negative events.
In summary, I argue that team members with similarly high or low levels of CSEs will be similarly prone to experiencing negative moods and emotions at work. Stated differently, I expect a positive relationship between homogeneity of CSEs and homogeneity of negative affect. In conjunction with Hypothesis 1b, I propose the following:
Hypothesis 2b: Homogeneity of CSEs is positively related to homogeneity of job satisfaction. The effect is mediated by homogeneity of negative affect.
7.4.3 Social Antecedents
A third potential influencing factor for homogeneity of job satisfaction are social influen-ces, that is, influences of the team itself. Mason (2006) found that social interaction among team members fosters shared job attitudes. Building on this study, I not only seek to repli-cate this finding but also to explain the mechanism underlying this relationship. I will therefore formulate two hypotheses about the effect of social interaction on satisfaction homogeneity.
From a cognitive perspective, team members’ job satisfaction converges because team members mutually influence their perceptions of job features (Salancik & Pfeffer, 1978). When interacting with each other, team members make certain aspects of the working en-vironment more salient than others. In turn, team members will be more attentive to these aspects. For instance, one members’ expressing his or her discontent with the supervisor’s always being late to team meetings will guide the other members’ attention towards this behavior. The team also provides the frame of reference against which the actual working environment is compared to. Being late to team meetings might be considered rude behavior in some teams but acceptable in others. Finally, disagreement is a source of cognitive dis-sonance and leads to pressure of conformity (Matz & Wood, 2005). Therefore, team mem-bers might alter their perception of job features to reduce dissonance and fit in with the group. In line with this reasoning, K. Klein et al. (2001) found that social interaction reduced the variability in perceptions of job features. Taken together, the more often team members interact with each other, the more similar their perceptions of job features will become, which will lead to homogeneity of job satisfaction.
Hypothesis 3a: Social interaction is positively related to homogeneity of job satisfaction. The effect is mediated by homogeneity of perceived job features.
From an affective point of view, social interaction increases satisfaction homogeneity be-cause team members mutually influence their moods and emotions and therefore tend to have similar affective experiences (Kelly & Barsade, 2001). This process of mood conver-gence has been described as emotional contagion (Hatfield, Cacioppo, & Rapson, 1994) or
90

the dynamic pathway to group affect (Klep, Wisse, & Van der Flier, 2011). Since emotional transfer relies particularly on nonverbal cues, interpersonal contact among team members is crucial for the emergence of group affect (Barsade, 2002). This assumption is in line with Mason (2006), who found a strong relationship between meeting frequency and homogeneity of positive affect. Bartel and Saavedra (2000) also found a relationship between affective convergence and social interdependence, however, without controlling for the statistical confound between average and consensus. Taken together, I hypothesize that social interaction is positively related to homogeneity of positive and negative affect at work, which, in turn, affects satisfaction homogeneity.
Hypothesis 3b: Social interaction is positively related to homogeneity of job satisfaction. The effect is mediated by homogeneity of positive and negative affect at work.
7.5 Method
7.5.1 Sample
I collected data from teams of different branches using an online survey. The survey was split into two parts: a short survey for the supervisor and a longer one for the team mem-bers. I contacted supervisors from different organizations and asked them to fill in the short questionnaire first. The supervisor was asked about the team size, branch, and per-formance. At the end of the questionnaire, a link was generated which the supervisor sent to the team members. Parameters attached to the link automatically assigned respondents to their respective team and supervisor. In the team member questionnaire, participants were asked whether they answered the questionnaire in a serious manner, as this approach has been shown to improve data quality (Aust, Diedenhofen, Ullrich, & Musch, 2013).
The initial dataset contained 468 responses from a total of 163 teams. However, since this study focuses on within-team homogeneity, teams with less than two responses had to be excluded. In sum, 415 team members working in 110 teams remained in the final sample. The average number of members per team was M = 3.77, SD = 1.92, ranging from 2 to 9 members. The average within-team response rate for each team was M = 67 %, SD = 29 %, with 31 % of complete teams. Team size ranged from 2 to 40 members, M = 7.35, SD = 6.60. I address the issue of missing-response bias in the Discussion section.
91

7.5.2 Measures
Homogeneity of job satisfaction. Team members’ job satisfaction was assessed with a short scale based on the Job Descriptive Index (P. Smith et al., 1969). Respondents were 11
asked to state how much they agreed with five descriptive statements about working in their team on an eleven-point Likert scale ranging from 0 (do not agree) to 10 (completely agree). The instruction text was: “The following statements refer to your team. Please mark the field that best describes your personal view. All in all, working in this team is…”. Sample items include “satisfying” and “enjoyable”.
I used rWG (James et al., 1984, 1993) with a uniform null distribution (LeBreton & Senter, 2008) as a measure of homogeneity. While some authors used the standard deviation (SD) to assess homogeneity, rWG and SD values were highly correlated (all rs > .90) so that I report results for rWG only. With homogeneity being the dependent variable we have to consider that average and homogeneity are not independent (Cole et al., 2011). In parti-cular, at very high or low average levels of satisfaction, variance is necessarily limited. To disentangle average and homogeneity, I followed prior research (Mason, 2006) and calcu-lated semi-partial correlations. That is, I regressed job satisfaction rWG on teams’ average satisfaction and used the standardized residuals for all analyses, which I will refer to as corrected rWG or rWGc. 12
Homogeneity of perceived job features. To measure perceived job features, I used a translated and validated version (Schmidt & Kleinbeck, 1999) of the Job Diagnostic Sur-vey (Hackman & Oldham, 1975). Because the the original scoring method proposed by Hackman and Oldham (1975) was subject to much criticism (e.g., Evans & Ondrack, 1991; Hinton & Biderman, 1995), I used the sum score of all items instead. An example item was “The job gives me a chance to use my personal initiative and judgement in carry-ing out the work”. Homogeneity of perceived job features was calculated in the same way as homogeneity of job satisfaction. In accordance with other authors (Wegge et al., 2006), I did not assess actual job features separately but used perceived job features as a proxy instead.
Homogeneity of job events. Participants were given a set of 4 positive and 4 negative everyday job events and were asked to indicate how frequently they experienced these events in the last month. Response options ranged from 1 (very rarely or not at all) to 5 (very often). I selected job events on the basis of prior studies (Basch & Fisher, 2000; Grandey et al., 2002; Mignonac & Herrbach, 2004). Positive events include “received positive feedback from your supervisor” and “successfully finished a task”. Examples of negative events are “had an argument with a coworker”, “received negative feedback from your supervisor”. Summation of positive and negative items resulted in two separa-te individual-level scales, one for positive and one for negative events. Homogeneity of job events was calculated in the same way as homogeneity of job satisfaction.
This refers to the adapted version of the KAFA (cf. Study 2b).11
I estimated an alternative model using the uncorrected rWG indices and including the respective average scores 12
of each variable in the model. Since fit statistics and path coefficients were nearly identical, I report results for the more parsimonious model only. Results for the other model can be obtained from the author upon request.
92

Homogeneity of job affect. To assess affective experiences, respondents were given 10 items of a translated version (Krohne et al., 1996) of the positive and negative affect schedule (PANAS; Watson, Clark, & Tellegen, 1988). In the Negative Affect (NA) Scale, respondents were asked to indicate how often in the last month they experienced negative emotions or moods, such as feeling distressed, guilty, or afraid at work. In the Positive Af-fect (PA) Scale, respondents were asked how often they experienced positive emotions or moods, such as feeling excited, proud, or active at work. Response options were the same as the ones used to assess job events. Homogeneity of job affect was calculated in the same way as homogeneity of job satisfaction.
Homogeneity of CSEs. Team members’ core self-evaluations were assessed using a trans-lated and validated version (Stumpp, Muck, Hülsheger, Judge, & Maier, 2010) of the Core Self-Evaluations Scale (Judge et al., 2003). The scale consists of 12 items that assess self-esteem (e.g., “Sometimes when I fail I feel worthless”), self-efficacy (e.g., “When I try, I generally succeed”), locus of control (e.g., “I determine what will happen in my life”), and neuroticism (e.g., “Sometimes I feel depressed”). Homogeneity of CSEs was calculated in the same way as homogeneity of job satisfaction.
Social interaction. Social interaction was assessed with four items that asked participants how often the team holds meetings and how much time they spend with other team mem-bers. Sample items include “Team members regularly exchange views”, and “Our team holds regular meetings”. Response options ranged from 1 (do not agree at all) to 6 (com-pletely agree). Individual responses were averaged across team members to obtain a team-level measure of social interaction.
Self-rated performance. Team members rated the team’s task performance on a scale from 0 (very poor) to 10 (very good). The instruction was “All in all, how would you rate the performance of the team as a whole?”. Individual responses were averaged across team members to obtain a team-level measure of self-rated performance.
Supervisor-rated performance. The teams’ supervisor was asked to rate the team’s task performance on a scale from 0 (very poor) to 10 (very good). The instruction was the same as the one used to assess self-rated performance.
93

7.6 Results
7.6.1 Preliminary Analyses
Table 20 shows means, standard deviations, internal consistencies, and intercorrelations of variables at the individual level. Since job features, job events, and affective experiences are formative constructs, items of these scales must not necessarily correlate (Diamanto-poulos, Riefler, & Roth, 2008). However, for the sake of transparency, internal consisten-cies are reported for both reflective and formative measures. Cronbach’s alpha of the re-flective measures ranged from .73 to .89.
Table 20Means, Standard Deviations, Internal Consistencies, and Intercorrelations for Individual-Level Data
Note. N = 405–416. Internal consistencies in parentheses.All correlations are significant, p < .01, two-sided.
Table 21 shows means, standard deviations, and intercorrelations for within-team averages and rWGc indices. Because social interaction and self-rated performance followed a direct consensus model (Chan, 1998), I calculated intraclass correlations (ICC; James, 1982) in order to justify aggregation of individual-level responses to the team level. For social in-teraction ICC(1) was .43, indicating that 43 % of the variance in social interaction could be explained by group membership. ICC(2), which represents the reliability of the group means, was .68, indicating acceptable reliability (Bliese, 2000). Finally, rWG was .85, SD = 0.22. Based on conventional cut-off criteria (James, 1982), aggregation to the team level was justified. Analyses for self-rated performance yielded similar results, ICC(1) = .49, ICC(2) = .78, and rWG = .84, SD = 0.27.
Variables M SD 1. 2. 3. 4. 5. 6. 7. 8.1. Job satisfaction 8.19 1.60 (.82)2. Job features 4.45 0.75 .38 (.75)3. Negative affect 1.89 0.72 -.51 -.30 (.83)4. Negative events 2.02 0.65 -.58 -.35 .63 (.69)5. Positive affect 3.44 0.68 .38 .50 -.29 -.35 (.81)6. Positive events 3.45 0.60 .40 .53 -.31 -.33 .66 (.64)7. CSEs 4.77 0.76 .44 .48 -.60 -.60 .45 .46 (.89)8. Social interaction 4.89 0.88 .45 .32 -.37 -.46 .30 .29 .49 (.73)
94

Table 21Means, Standard Deviations, and Intercorrelations for Team-Level Data
Note. N = 110.a N = 100.* p < .05; ** p < .01 (two-sided).
Variables M SD 1. 2. 3. 4. 5. 6. 7. 8. 9. 10. 11. 12. 13. 14. 15. 16. 17.
Within-team average
1. Job satisfaction 8.25 1.14 -
2. Job features 4.48 0.52 .47** -
3. Negative affect 1.91 0.56 -.60** -.42** -
4. Negative events 2.03 0.51 -.69** -.40** .65** -
5. Positive affect 3.45 0.45 .46** .57** -.40** -.44** -
6. Positive events 3.47 0.40 .45** .60** -.45** -.42** .70** -
7. CSEs 4.74 0.60 .57** .57** -.70** -.73** .59** .59** -
8. Interaction frequency 4.89 0.70 .59** .37** -.49** -.61** .38** .36** .58** -
Homogeneity index rWGc
9. Job satisfaction 0.00 0.16 .00 -.00 -.06 .10 .02 .10 -.04 -.05 -
10. Job features 0.00 0.14 -.04 .00 -.01 -.00 -.12 -.00 .00 .06 .28** -
11. Negative affect 0.00 0.23 -.02 .05 .00 .06 .10 .15 .00 -.08 .56** .30** -
12. Negative events 0.00 0.16 .10 -.06 .02 .00 -.11 -.03 -.14 .01 .49** .28** .41** -
13. Positive affect 0.00 0.14 .07 .03 -.06 .04 .00 .11 .04 .12 .30** .43** .11 .20* -
14. Positive events 0.00 0.12 .13 .06 -.12 -.02 .07 .00 .10 .11 .09 .32** .03 .16 .45** -
15. CSEs 0.00 0.13 -.05 .05 -.02 .04 .07 .11 .00 -.16 .36** .30** .56** .18 .12 .01 -
Team performance
16. Self-rated 7.80 1.68 .43** .38** -.42** -.38** .44** .46** .39** .30** .04 -.09 .17 .11 -.03 -.11 .09 -
17. Supervisor-rateda 8.05 1.48 .32** .23* -.31** -.25* .27** .38** .20* .17 -.16 -.08 -.09 .01 .02 -.15 -.04 .50** -
95

7.6.2 Model Estimation
I used path analysis (Kline, 2011) and the R software package lavaan (Rosseel, 2012) to test the hypotheses. Path coefficients were estimated using Maximum Likelihood parame-ter estimation.
The initial model provided mediocre fit to the data. Fit statistics were χ² = 28.014, df = 12, p < .01, root-mean-square error of approximation (RMSEA) = .110, comparative fit index (CFI) = . 908, and standardized root-mean-square residual (SRMR) = .075. To ensure in-terpretability of parameter estimates, I sought to improve model fit by examining modifi-cation indices. However, these indices are not without debate, mainly because they can promote data-driven modifications without theoretical underpinning (Iacobucci, 2009; MacCallum, Roznowski, & Necowitz, 1992). Therefore, I opted for a procedure that inclu-ded (a) as little changes to the initial model as possible, (b) reporting both the initial and the revised model, and (c) an examination of the revised model based on theory. Modifica-tion indices suggested to estimate an additional path from negative events rWGc to job satis-faction rWGc. Doing so improved the model fit significantly, Δχ² = 11.047, p < .001, resul-ting in adequate fit statistics, χ² = 16.967, df = 11, p = .109, RMSEA = . 070, CFI = .966, SRMR = .061, according to conventional criteria (Hu & Bentler, 1999). Figures 8a and 8b show the initial and the revised model, respectively, and their standardized path coefficients. Because both models yield nearly identical parameter estimates and do not suggest different interpretations of results, I will discuss the revised model only and will address differences between the models in the Discussion section.
96

Figure 8. Initial (a) and revised (b) path model for the antecedents of satisfaction homogeneity. Only significant paths are shown. Numbers represent standardized path coefficients. Dashed lines repre-sent paths that have been added to improve model fit. * p < .05; ** p < .01; *** p < .001 (two-sided).
Homogeneity of Job Satisfaction
Homogeneity of (Perceived) Job
Features
Homogeneity of neg. Job Events
Homogeneity of CSEs
Homogeneity of pos. Job Events
Homogeneity of pos. Job Affect
.52***.33***
.43***
.28**
.32***
.35***
Homogeneity of neg. Job Affect
.51***
.24**
Homogeneity of Job Satisfaction
Homogeneity of (Perceived) Job
Features
Homogeneity of neg. Job Events
Homogeneity of CSEs
Homogeneity of pos. Job Events
Homogeneity of pos. Job Affect
.43***.33***
.43***
.28**
.32***
.35***
Homogeneity of neg. Job Affect
.51***
.21**
.28***
(a)
(b)
97

7.6.3 Testing of Hypotheses
Hypothesis 1a stated that homogeneity of perceived job features is positively related to homogeneity of job satisfaction. While the indirect effects added up to a total effect of β = .15, the direct path from job features rWGc to job satisfaction rWGc was not significant, β = -.02, p > .05. Hypothesis 1a is, thus, not supported.
Hypothesis 1b stated that homogeneity of job events is positively related to homogeneity of job satisfaction and that this effect is mediated by homogeneity of affect at work. Indeed, path coefficients between job events rWGc and affect rWGc, and between affect rWGc and job satisfaction rWGc were significant for both positive and negative job events and affect. Most notably, the path coefficient between affective homogeneity and satisfaction homogeneity was about twice as large for negative, β = .43, p < .001, as for positive affect, β = .21, p < .01. To test if the indirect effects were significant I ran additional Sobel tests (Sobel, 1982). The tests showed that the indirect effects were significant for both positive events and affect, Z = 2.70, p < .01, and negative events and affect, Z = 3.48, p < .001. Because the additional direct path between negative job events rWGc and job satisfaction rWGc improved the model fit significantly, it is not surprising that this path coefficient was also significant, β = .28, p < .001. The total effect of similarity of job events calculated to β = .51. In sum, Hypothesis 1b is supported.
In Hypothesis 2a, I proposed that homogeneity of CSEs is positively related to homogeneity of job satisfaction, mediated by homogeneity of perceived job features. While the stan-dardized path coefficient between CSEs rWGc and job features rWGc was significantly different from zero, β = .35, p < .001, the path leading to job satisfaction rWGc was not (cf. Hypo-thesis 1a). Therefore, the hypothesis was not supported by the data.
In Hypothesis 2b, I argued that homogeneity of CSEs affects homogeneity of job satisfac-tion, mediated by homogeneity of negative affect at work. Indeed, the path coefficients between CSEs rWGc and negative affect rWGc, β = .50, p < .001, and between negative affect rWGc and job satisfaction rWGc, β = .43, p < .001, were significantly different from zero. The Sobel test revealed that the indirect effect was highly significant, Z = 4.11, p < .001, thus supporting Hypothesis 2b.
Finally, in hypotheses 3a and 3b, I proposed that social interaction affects the homogeneity of job satisfaction via the homogeneity of perceived job features, and affect, respectively. Since all path coefficients were not significantly different from zero and far from conven-tional levels of statistical significance (all ps between .19 and .98), the data supported neither of the two hypotheses.
98

7.6.4 Supplemental Analyses
Given that earlier studies did not control for the statistical confound of average and homo-geneity, I also conducted an exploratory post-hoc analysis in which I contrasted correlations between model variables with and without controlling for the average (see Table 22). The analysis showed that without controlling for the confound of average and homogeneity, the relationship between social interaction and homogeneity of satisfaction became significant.
Table 22Correlations and Semi-Partial Correlations Between Model Variables and Homo-geneity Indices
Note. N = 110.* p < .05; ** p < .01; *** p < .001 (two-sided).
Finally, I sought to replicate earlier findings from Whitman et al. (2010) who showed that the relationship between average satisfaction and team performance is stronger when satisfaction homogeneity is high.
Job satisfaction homogeneity
Model variablesWithout controlling
for the average (rWG)Controlling for the
average (rWGc)Situational influences
Negative affect (homogeneity) .57*** .56***Negative events (homogeneity) .52*** .49***Positive affect (homogeneity) .34** .30**Positive events (homogeneity) .24* .09Job features (homogeneity) .26* .28**
Dispositional influencesCore self-evaluations (homogeneity)
.34*** .36***
Social influencesSocial Interaction (average) .28** -.05
99

Table 23Effects of Job Satisfaction Average and Homogeneity on Team Performance
Note. ✝ p < .10; * p < .05; ** p < .01; *** p < .001 (two-sided).
Regression analyses revealed that team’s average satisfaction was positively related to both self-rated performance and supervisor-rated performance (see Table 23 and Figure 9). For self-rated performance, the interaction between average and homogeneity of satisfaction became significant, β = .25, p = .06. Simple slope tests showed that team’s average satis-faction and self-rated performance are positively related when satisfaction homogeneity is high, b = 0.96, t(100) = 3.86, p < .001, but unrelated when homogeneity is low, b = 0.12, t(100) = 0.38, ns. However, average and homogeneity of satisfaction did not interact in predicting supervisor-rated performance, β = -. 14, p = .32.
Figure 9. Effects of job satisfaction average and homogeneity on team-rated and supervisor-rated performance
Self-rated performance Supervisor-rated performance
Model variables Model 1 Model 2 Model 3 Model 1 Model 2 Model 3
ControlTeam size -.00 .03 .02 -.05 .01 .01Response rate -.02 .02 .05 .10 .06 .04
Job satisfactionAverage .38*** .32** .43*** .47***Homogeneity .07 .28✝ -.19 -.31✝
Average × homogeneity .25✝ -.14
Team-rated performance
Team
-rat
ed p
erfo
rman
ce
6
7
8
9
10
Low average satisfaction High average satisfaction
Low satisfaction homogeneityHigh satisfaction homogeneity
Supervisor-rated performance
Supe
rvis
or-r
ated
per
form
ance
6
7
8
9
10
Low average satisfaction High average satisfaction
Low satisfaction homogeneityHigh satisfaction homogeneity
0,000272
0,553416599959798 0,982279630889318
-0,428863030929521,53569623084912
Low averagesatisfaction
High averagesatisfaction
Low averagesatisfaction
High averagesatisfaction
Team-rated performance
Team
-rat
ed p
erfo
rman
ce
6
7
8
9
10
Low average satisfaction High average satisfaction
Low satisfaction homogeneityHigh satisfaction homogeneity
Supervisor-rated performance
Supe
rvis
or-r
ated
per
form
ance
6
7
8
9
10
Low average satisfaction High average satisfaction
Low satisfaction homogeneityHigh satisfaction homogeneity
0,000272
0,553416599959798 0,982279630889318
-0,428863030929521,53569623084912
Low satisfaction homogeneityHigh satisfaction homogeneity
Team-rated performance Supervisor-rated performance
100

7.7 Discussion
In summary, the predictions received mixed support. The first set of hypotheses was con-cerned with situational antecedents of satisfaction homogeneity. Situational factors are often held responsible for the emergence of satisfaction as a shared team property. Specifically, authors argue that team members are similarly satisfied or dissatisfied because they share the same working environment, such as organizational practices, rules, policies, and the team leader (Whitman et al., 2010). The results support this assumption. However, it is not abstract job features but actual events taking place at work that contribute to shared satisfaction. Cognitive believes about the job and its features play a minor role in the emergence of shared satisfaction, yielding only modest indirect effects. Job events, on the other hand, strongly affect whether satisfaction converges to a shared team property. In line with affective events theory, shared affect mediates this relationship. Team members who undergo certain job events similarly often are more likely to experience similar positive and negative affect. Most notably, the results indicate that the frequency of negative events such as arguments with coworkers or customers are more predictive of shared satisfaction than the frequency of positive events. This finding is in line with other research that has established a general principle for “bad things” having a stronger impact than “good things” (for a review, see Baumeister, Bratslavsky, Finkenauer, & Vohs, 2001).
The second set of hypotheses related to dispositional antecedents of satisfaction homogeneity. Referring to the attraction-selection-attrition framework (Schneider et al., 1995), authors argue that team members who are similar in terms of personality would be similarly satis-fied or dissatisfied with their jobs. The study lends support for this assumption. While there is a positive correlation between homogeneity of CSEs and homogeneity of satisfaction, path analysis allows us to show on which route the effect operates. The results indicate that homogeneity of CSEs leads to shared satisfaction by influencing whether negative affect is shared by the team members. Team members who have similarly high or low core self-evaluations also tend to perceive their working environment similarly, but this does not affect whether satisfaction is shared. This suggests that dispositional antecedents of satisfaction homogeneity, too, are mainly based on affective rather than cognitive processes.
The last set of hypotheses was concerned with social antecedents of satisfaction homogeneity. Contrary to expectations, the results indicate that social interaction is neither related to homogeneity of satisfaction nor to its presumed antecedents. This finding stands in con-trast to those reported in the literature (K. Klein et al., 2001; Mason, 2006; Tanghe et al., 2010) and demands close consideration.
There are different possible explanations why social interaction was not related to a shared perception of job features. Social interaction and exchange about one’s job conditions might have triggered social comparisons among members. Prior research found that these comparisons can have opposing effects, namely assimilation and contrast (e.g., Mussweiler et al., 2004). For instance, in order to evaluate if their level of autonomy is acceptable, members will exchange views and use each others appraisal as a reference point for their own appraisal. Depending on moderators such as similarity, psychological closeness, and the salience of the team or the individual (Suls, Martin, & Wheeler, 2002), team members might not come to a shared perception of autonomy (that is, assimilation), but will perceive their levels of autonomy as more different than they actually are (that is, contrast). Therefore,
101

social interaction might have reduced agreement in perceptions of the working environ-ment in some teams, and increased agreement in others. The fact that earlier studies came to different results might also be a methodological issue. K. Klein et al. (2001) who found a relationship between social interaction and agreement in perceptions of team innovativeness did not address the statistical confound between average and homogeneity. Therefore, their finding might reflect that teams in which members interact more frequently are not in stronger agreement about innovativeness but are simply more innovative than teams with less interaction.
Social interaction was also unrelated to affective homogeneity when controlling for abso-lute levels of positive and negative affect in the team. That is, unlike prior studies (Bartel & Saavedra, 2000), this study shows no evidence for emotional contagion among mem-bers. It seems that mere interaction is not sufficient to induce shared affect. In fact, the literature points to other factors that influence whether members’ moods and emotions converge to shared team affect, such as team members’ similarity (Wrobel, Krolewiak, & Czarna, 2015) and identification with the team (Tanghe et al., 2010). That is, if members see themselves as dissimilar from one another and do not identify with the team, affective contagion is unlikely, despite frequent interaction. This finding stands in contrast to the one reported by Mason (2006) who found that frequency of meetings was positively rela-ted to homogeneity of job satisfaction and positive affect. A methodological explanation for this difference is that Mason’s study had a low sample size of only twenty four teams in conjunction with the high number of forty correlations that are prone to inflated type I errors.
Finally, this study adds to our understanding of the relationship between team-level satis-faction and team performance. First, it replicates earlier studies in showing that job satis-faction and job performance are positively related not only at the individual level, but also on the team level (Harter et al., 2002). In contrast to an earlier study (Mason & Griffin, 2005), I found that this relationship applies for both self-rated and supervisor-rated team performance, indicating that the effect is relatively robust. Second, the study partly repli-cates the finding that satisfaction homogeneity moderates the team-level satisfaction—team performance relationship (Whitman et al., 2010). When satisfaction homogeneity is low, the team’s average satisfaction is not a valid higher-order construct as it does not re-flect a shared attitude of all team members. In this case, some members might be mode-rately or not at all satisfied. Because these members will be less motivated, less likely to support their fellow members and will have lower individual task performance than satis-fied members (Kinicki et al., 2002), the team might perform poorly despite having a high average satisfaction. This argument is also in line with research on “bad apples that spoil the barrel” (Dunlop & Lee, 2004; O'Boyle et al., 2011). In summary, these findings show that homogeneity of satisfaction is more than just a statistical hurdle for the aggregation of individual-level data to the team level. In line with earlier studies that found effects of satisfaction homogeneity on team processes and emergent states (e.g., Harrison et al., 1998; van der Vegt, 2002), these results further indicate that the degree to which satisfac-tion is shared among members can affect team functioning and performance, thereby pointing to the importance of satisfaction convergence for more general group processes.
However, the moderating effect was found only for self-rated but not for supervisor-rated performance. This finding can be explained by leader-member exchange (LMX) theory (for
102

a review, see Schriesheim, Castro, & Cogliser, 1999). We can assume that supervisors will form stronger relationships with satisfied than with dissatisfied team members because they will be more engaged and work more conscientiously, and will display more positive and less negative affect in the workplace, which makes interacting with them more pleasant (Dulebohn, Bommer, Liden, Brouer, & Ferris, 2012). This can have two effects: First, in their evaluation of the team’s performance, supervisors might especially rely on information they obtain from the satisfied members because they are seen as more trustworthy (Gómez & Rosen, 2001). Second, the focus on satisfied members might give rise to a halo effect (Nisbett & Wilson, 1977) in which positive attributes of the satisfied members are erro-neously transferred to the team as a whole. Both effects would lead to an overestimation of the team’s performance and could explain the different results for self-rated and super-visor-rated performance.
Given that the initial path model did not fit the data well, I examined modification indices that help improve model fit and obtain interpretable path coefficients. Because these indi-ces have been criticized for their lack of theoretical underpinning (MacCallum et al., 1992), a careful examination whether the revised model concurs with theory is necessary. In the revised model, the similarity of negative events affects satisfaction homogeneity over and above the mediating effect of shared affect. While this effect was not envisaged in the initial model, it does, however, not contradict the assumptions of affective events theory. The theory must be thought of as a theoretical framework that is not bound to specific events, moods, and emotions. That said, it is likely that the chosen negative events simply elicited other affective reactions than the ones that were assessed in this study. The added path in the revised model reflects these affective reactions not accounted for in this study and is therefore theoretically justifiable.
7.7.1 Implications for Research
This study has implications for research that considers team-level constructs. The first im-plication concerns the handling of teams with different degrees of consensus. While teams low in agreement are sometimes excluded from analyses (e.g., Nishii et al., 2008), some authors recommend against this practice because the level of agreement might carry meaningful information beyond the mean (Carron et al., 2003). Indeed, studies have sub-stantiated effects of homogeneity for a variety of different constructs, such as climate (González-Romá, Fortes-Ferreira, & Peiró, 2009), perceptions of leader behavior (Cole et al., 2011), teamwork schemes (Rentsch & Klimoski, 2001), and trust (De Jong & Dirks, 2012). The results of this study are in accordance with these findings and underline the importance of within-team agreement for relationships involving team-level constructs. Therefore, instead of dropping teams from analyses researchers should consider both the mean and the level of agreement in future studies.
Another implication relates to the study of distributional characteristics such as homogeneity or variability. If distributions are the construct of interest, researchers should bear in mind their nonindependence to average scores. This study shows that disregarding this confound can lead to different and potentially fallacious conclusions: When not controlling for the average level of satisfaction, I was able to replicate earlier studies that found a relationship between social interaction and homogeneity of satisfaction. This relationship, however, merely reflects that social interaction is highly correlated with average job satisfaction.
103

While this, technically, does imply a relationship with homogeneity of satisfaction, it points to a fundamentally different process: Instead of interaction leading to a convergence of positive or negative attitudes, it suggests that social interaction is a positive experience in and of itself and improves job satisfaction, or that satisfied team members are more inclined to engage in social interaction. To avoid ambiguous results and false conclusions, future studies should control for these effects by employing semi-partial correlations (Mason, 2006) or regression techniques (Cole et al., 2011).
7.7.2 Limitations and Future Research
There are some limitations to this study that need to be addressed. I believe that drawing on real-life teams instead of student groups is a strength of this study and adds to the ex-ternal validity of the results. On the downside, however, data collection in real-life scena-rios is especially prone to within-team nonresponse (Nesterkin & Ganster, 2015). Unfortu-nately, this study is no exception to the rule. While there is still no agreed-upon approach on how to handle missing data in team research, teams are often dropped from analyses when the within-team nonresponse rate exceeds a predefined threshold (Maloney, John-son, & Zellmer-Bruhn, 2010). Despite the frequent use of this practice, authors recently advised against the use of retention rules (Hirschfeld, Cole, Bernerth, & Rizzuto, 2013; Maloney et al., 2010; Stanley, Allen, Williams, & Ross, 2011): First, dropping teams with low response rates from analyses reduces the overall sample size, thereby decreasing sta-tistical power to detect effects. Second, dropping teams rarely reduces estimation bias (e.g., in estimating the relationship between a diversity score and an outcome variable) but always increases the variability of estimation, thereby increasing overall error (Stanley et al., 2011). Third, when data are not missing at random, excluding teams leads to a sys-tematically biased sample. In the case of job satisfaction, we must assume that nonresponse is somewhat systematic because dissatisfied team members might be less willing to take part in voluntary surveys (Rogelberg, Luong, Sederburg, & Cristol, 2000). In summary, Stanley et al. (2011, p. 519) conclude that “in the diversity context, retention rules are inappropriate for both random and systematic missing data”. Given these arguments, I decided to retain all teams with more than one participant in the final sample, irrespective of low within-team response rates. Whereas this approach concurs with the recommenda-tions given before, missing data still pose a threat to the validity of the assessed constructs and findings. Therefore, future studies should try to gain access to complete teams and replicate the results of this study.
The fact that job satisfaction is a dynamic construct (Liu et al., 2012) makes the cross-sectional design of this study another limitation. Cross-sectional data let us only look at satisfaction homogeneity at a specific point in time, thereby obscuring the process of con-vergence itself. For instance, authors proposed that convergence is a reciprocal process in which employees mutually respond to and influence each others affective expressions (Walter & Bruch, 2008) and attitudes (Morgeson & Hofmann, 1999). While the rate of social interaction served as a proxy for these processes, they cannot be directly observed using cross-sectional data. Authors also argued that the processes of attraction, selection, and attrition lead to similar personality traits in teams and thereby homogenize job satis-faction over time (Mason, 2006). Whereas this study substantiated a relationship between homogeneity of CSEs and homogeneity of satisfaction (that is, the „second part“), evidence for the homogenization of personality traits over time (that is, the „first part“) is still lacking.
104
In fact, there is some evidence that the ASA framework might not be suitable for descri-bing convergence of team members’s personality traits (Kristof-Brown, Barrick, & Stevens, 2005). To explore the process of satisfaction convergence more thoroughly, longitudinal research is needed.
7.7.3 Conclusion
In light of the ongoing trend towards team-based working, team-level constructs have taken a permanent place in the field of organizational psychology and related disciplines. While research has predominantly focused on team average scores, more and more authors consider distributional characteristics such as homogeneity in their studies. To enhance our understanding of how homogeneity develops and how it affects team performance, I addressed homogeneity of one of the most central job-related attitudes, job satisfaction, in this study. Given the findings of this and prior studies, homogeneity appears to be a pro-mising field for future research. I hope that the results and questions raised in this study encourage researchers to further explore how team members come to share affect, percep-tions, and attitudes, and how they are related to team performance. I am convinced that research in this domain will eventually contribute to a deeper understanding of how teams work.
105


8 General Discussion
The objective of this dissertation was to develop a multi-level theory of emergence and consequences of job satisfaction in teams. In particular, the dissertation focused on the emergence of satisfaction to the group level and its consequences within and across different levels of analysis. Having conducted four studies that addressed specific aspects of the overall research question, the final chapter of this dissertation takes a larger perspective and aims at highlighting the implications of the research program in its entirety. It is orga-nized as follows: I first summarize and integrate the theorizing and empirical findings from the four studies. In the subsequent sections, I derive and discuss implications of the studies for theory and research, managerial practice, and methodology. In closing, I criti-cally appraise the overall research program by highlighting its strengths and limitations, and draw an overall conclusion.
8.1 Summary and Integration of Findings
Being the central attitude about work, job satisfaction can be considered among the most important constructs in organizational psychology and managerial practice. At the same time, organizations keep relying on team-based forms of work to produce innovative pro-ducts and services that help them to react to increasingly competitive environments. Although satisfaction in the context of teams is a growing field for research, the literature review in Chapter 3 revealed that research in this domain suffers from multiple shortcom-ings. Most notably, it is characterized by a static, collectivist perspective on teams that fo-cuses on aggregated satisfaction and relies on the unrealistic assumption that all team members hold the same attitudes (cf. Humphrey and Aime 2014). In other words, prior research placed surprisingly little emphasis on the emergence of satisfaction as a configu-ral group-level construct, and largely neglected multi-level conceptualizations regarding the consequences of individual-level and group-level satisfaction. Furthermore, validated measures for overall and facet-specific satisfaction in teams are generally lacking, which makes empirical research in this domain more difficult. After identifying these issues, I addressed them in a series of conceptual and empirical studies.
In Study 1, my co-authors and I took a conceptual approach to satisfaction in teams. Prior theorizing in this domain was characterized by a mere consensus-based conceptualization of group-level satisfaction and a neglect of multi-level effects between satisfaction and performance. In this study, we addressed both issues by developing multi-level theory re-garding the effects of uniform and configural group-level satisfaction on team performance. First, we extended the Input-Mediator-Outcome (IMO) team effectiveness framework (Ilgen et al., 2005) by distinguishing between the individual and the group level of analysis, resulting in a Multi-Level Input-Mediator-Outcome (MIMO) framework. Second, based on the diversity literature (e.g., DeRue et al., 2010; Shemla et al., 2014), we identified four distinct forms of satisfaction dispersion in teams. Drawing on different streams of diversity research, such as social categorization and faultline theory, we examined how the forms of satisfaction influence affects, cognitions, behaviors, and performance of individuals and
107

teams. Based on our reasoning, we offered a series of testable propositions that guide fu-ture research on the relationship between uniform and configural team satisfaction and team performance.
Study 2a was concerned with the measurement of job satisfaction in the German language area. In a literature review, Ferreira (2007) found that German job satisfaction scales rare-ly comply with scientific standards. Furthermore, they are often extensive or cannot dif-ferentiate between satisfaction facets. I therefore developed and validated short scales for the assessment of general job satisfaction as well as satisfaction with the work itself, co-workers, promotions, pay, and supervision. I tested the scales’ psychometric properties as well as their factorial, construct, and criterion-related validity with two separate large samples and found them to conform to conventional criteria. The newly developed scales overcome the criticism towards other scales as they are scientifically sound, relatively short, and include the most common facets of satisfaction (Kinicki et al., 2002).
Study 2b focused on the measurement of satisfaction in the team context. Using four of the scales developed in Study 2a (overall, team leader, team members, and task satisfaction) as a foundation, I adapted the scales’ wording to make them applicable in the context of teams. Despite a small method bias due to reverse-coded items, the psychometric proper-ties were satisfactory and overall comparable to the original scales’. The study not only provides brief satisfaction measures for future research and employee surveys in organiza-tions, it also gives new insights into the relationships between different facets of satisfac-tion in teams and performance-related outcomes: From the three facets considered, satis-faction with the team members consistently had the strongest impact on all individual-level and group-level performance criteria, especially on citizenship behaviors, making team member satisfaction a useful construct for future employee surveys.
Study 3 focused on the emergence of satisfaction as a higher-level construct. Although most authors conceptualize group-level satisfaction as a shared construct, it is still unclear when and how satisfaction emerges as a shared attitude of the team. Using a group-level framework based on affective events theory (H. Weiss & Cropanzano, 1996), the study design allowed to empirically disentangle situational, dispositional, and social influences on satisfaction homogeneity, and considered both affective (i.e., job events) and cognitive (i.e., job features) sources of satisfaction. The results pointed to the importance of shared affective experiences for the convergence of satisfaction. Interestingly, the expected effects of social interaction could not be found. Furthermore, I sought to replicate earlier findings on the relationship between average satisfaction and team performance in this study. As opposed to an earlier study (Mason & Griffin, 2005), the data showed that average satis-faction is related not only to self-rated performance but also to supervisor-rated perfor-mance. I also partly replicated the moderating influence of satisfaction homogeneity on the relationship between average satisfaction and performance (Whitman et al., 2010), substantiating that average satisfaction is not a meaningful construct without consensus.
108

Tabl
e 24
Over
view
of th
e Con
tribu
tions
of th
e Fou
r Stu
dies
Rese
arch
Dom
ains
Stud
yEm
erge
nce
Mea
sure
men
tCo
nseq
uenc
es
Stud
y 1•
Prop
osed
team
satis
fact
ion
as a
conf
igur
al
cons
truct
at t
he g
roup
leve
l in
addi
tion
to
shar
ed /
unifo
rm sa
tisfa
ctio
n
•Pr
opos
ed d
iffer
ent d
istrib
utio
ns o
f tea
m
satis
fact
ion
(uni
form
, dev
iate
, bim
odal
, and
fra
gmen
ted)
•De
velo
ped
mul
ti-lev
el th
eory
on
how
indi
vidua
l-lev
el an
d gr
oup-
level
team
sa
tisfa
ctio
n af
fect
team
per
form
ance
with
in
and
acro
ss le
vels
of a
naly
sis
•Co
ncep
tual
ly ex
amin
ed a
nd co
mpa
red
the
effe
cts o
f uni
form
, dev
iate
, bim
odal
, and
fra
gmen
ted
satis
fact
ion
on te
am
perfo
rman
ce
Stud
ies 2
a an
d 2b
•De
velo
ped
and
valid
ated
a se
ries o
f sho
rt sc
ales
for a
sses
sing
over
all a
nd fa
cet-
spec
ific j
ob sa
tisfa
ctio
n
•Ad
apte
d th
e dev
elope
d sc
ales
to th
e tea
m
cont
ext a
nd ex
amin
ed it
em a
nd sc
ale
statis
tics,
inte
rcor
rela
tions
, fac
toria
l val
idity
, an
d co
nstru
ct va
lidity
•Ex
plor
ed d
iffer
entia
l effe
cts o
f ove
rall
and
face
t-spe
cific
satis
fact
ion
on p
erfo
rman
ce
outc
omes
at t
he in
divid
ual l
evel
and
the
grou
p lev
el
Stud
y 3•
Exam
ined
the r
ole o
f situ
atio
nal,
disp
ositi
onal
, and
socia
l inf
luen
ces f
or th
e em
erge
nce o
f sat
isfac
tion
as a
shar
ed
grou
p-lev
el co
nstru
ct
•Hi
ghlig
hted
the r
ole o
f sha
red
affe
ctive
ex
perie
nces
and
per
sona
lity t
raits
for s
hare
d sa
tisfa
ctio
n
•Re
plica
ted
and
exte
nded
prio
r stu
dies
by
show
ing
that
shar
ed te
am sa
tisfa
ctio
n re
late
s to
self-
rate
d an
d su
perv
isor-r
ated
te
am p
erfo
rman
ce
•Pa
rtly r
eplic
ated
a m
oder
atio
n ef
fect
of
satis
fact
ion
hom
ogen
eity o
n th
e re
latio
nshi
p be
twee
n av
erag
e sat
isfac
tion
and
team
per
form
ance
109

In summarizing these findings, the overall research program contributes to three research domains — emergence, measurement, and consequences — of satisfaction in teams (see Table 24).
This dissertation contributes to research on the emergence of satisfaction as a higher-level construct. The main contribution lies in highlighting the fact that satisfaction can take forms other than a uniform construct. Whereas earlier studies almost exclusively argued in favor of uniform satisfaction, the studies comprising this dissertation present strong argu-ments (cf. Study 1) and empirical evidence (cf. Study 3) why satisfaction dispersion can be found in real-life teams. In particular, we proposed to view team satisfaction as a configu-ral construct at the group-level in addition to uniform satisfaction. Although some authors already argued in favor of a configural construct that emerges through compilation pro-cesses (Dineen et al., 2007; Harrison et al., 1998), these authors considered the dispersion of satisfaction in the form of the standard deviation or the coefficient of variation. Going beyond these works, our theorizing takes a more nuanced view on dispersion than a quan-titative construct that ranges from low to high. Considering configurations or patterns ad-vances prior research, because these configurations are expected to influence performance beyond the quantitative dispersion. By considering different forms of satisfaction, this re-search connects to other fields of study such as justice climate (González-Romá & Hernan-dez, 2014), team efficacy (DeRue et al., 2010), types of diversity (Harrison & Klein, 2007), and diversity perceptions (Shemla et al., 2014). As a further contribution, this dissertation put the theory-driven arguments regarding satisfaction convergence that many authors brought forward to empirical testing. In doing so, it points to the processes by which satis-faction emerges as a uniform group-level property. At the same time, it explains why satis-faction sometimes not emerges as a uniform attitude at the group level, thereby illumina-ting why prior studies came to different results regarding satisfaction homogeneity (e.g., Mohr et al., 2011; van de Voorde et al., 2014). Finally, these findings help predict if a team’s satisfaction will be uniform or non-uniform, and point to potential interventions to strengthen the sharedness of satisfaction (see Chapter 8.3).
Concerning measurement, the scales developed in Studies 2a and 2b can be put to use in future research on satisfaction in teams. As teams in organizations are “there to stay” (van Hootegem et al., 2005, p. 167), one can expect that satisfaction in teams will be of con-tinuing interest for researchers. However, reliable and valid measurement lies at the heart of this endeavor. The newly developed scales hold a number of advantages for future research.
(1) Prior scales (Mason & Griffin, 2005) used the team as the referent which results in non-interpretable scale scores at the individual level. This is because an item such as “Our team is satisfied with its task” does not represent team members’ satisfaction, but their appraisal of the team’s satisfaction. In contrast, the scales developed in this dissertation use the individual as the referent. For instance, an item such as “Our team leader is trust-worthy” reflects how satisfied each team member is with the team leader. Therefore, scale scores are valid measures of satisfaction at the individual level and at the group level. For the same reason, researchers can interpret scale scores in cases without consensus, and can use them for a variety of research questions, including deep-level diversity (Phillips, Northcraft, & Neale, 2006) and self-to-team dissimilarity (Guillaume et al., 2012), and to test the propositions developed in Study 1.
110

(2) The scales consider both overall satisfaction and satisfaction with specific facets of (team)work. For non-team contexts, satisfaction with the most common job facets (i.e., the work itself, coworkers, promotions, pay, and supervision) can be assessed which is use-ful if one seeks to replicate the findings of earlier studies that have employed measures of the JDI family. In the team context, satisfaction with three facets (i.e., coworkers, team leader, and tasks) can be assessed in addition to overall satisfaction, which allows testing more fine grained hypotheses than using overall team satisfaction scales.
(3) Prior scales (Behfar et al., 2015; B. West et al., 2009) included items that assessed consequences of team satisfaction, such as the intention to remain in the team, instead of team satisfaction itself. In contrast, the scales developed in this dissertation provide a pure measure of evaluative judgments towards their respective targets. In this way, criterion contamination and biased predictor-criterion relationships can be avoided.
(4) Finally, across the two studies, the scales’ psychometric properties proved to be rela-tively similar in team and non-team contexts. This is important because it suggests that — while the scales used here were in German — the equivalent job satisfaction scales in English (Russell et al., 2004; Stanton et al., 2001) can be transferred to the group-level in a straightforward way by rephrasing the items and vignettes.
The combined studies make several contributions to research on the consequences of satis-faction in teams. The results of Study 2b showed that facets of satisfaction are differently related to individual-level and group-level performance criteria. For example, team citi-zenship behaviors were unrelated to satisfaction with the task but highly related to satis-faction with the team members. Likewise, team leader satisfaction was negatively related to turnover intentions but unrelated to team-rated performance. In line with theoretical assumptions about attitude-behavior relationships (Ajzen, 2011; Ajzen & Fishbein, 1977) and earlier studies (Mason & Griffin, 2005; Whitman et al., 2010), these findings substan-tiate that satisfaction with different aspects of teamwork holds great potential for future research on satisfaction in teams.
The theorizing of Study 1 and the findings of Study 3 build on and advance prior studies that have shown that attitudinal differences are meaningful in the team context. The sa-tisfaction distributions proposed in Study 1 address the issue of dispersion in more detail than prior studies (e.g., Harrison et al., 1998; Dineen at al., 2007). Most notably, a theo-retical comparison between deviate, bimodal, and fragmented satisfaction suggested that these distributions relate to different group phenomena, such as exclusion and subgroup splits, and affect team functioning to different extents. In Study 3, the dispersion of satis-faction moderated the relationship between teams’ average satisfaction and self-rated team performance. Prior studies showed that within-team differences in attitudes com-promise team cohesion (Harrison et al., 1998) and team members’ social integration, that is, collaboration with other members and identification with the team (Guillaume et al., 2012; Harrison, Price, Gavin, & Florey, 2002; van der Vegt et al., 2001). The moderating effect of satisfaction dispersion that was found for the relationship between average satis-faction and self-rated team performance is in line with these findings. It shows that aver-age satisfaction is not related to team performance unless satisfaction follows a uniform distribution.
111

8.2 Implications for Theory and Research
The overall findings and theorizing of this dissertation have implications for theory and research. While I already described some of these in the respective studies, this section focuses on more general implications and questions that future research on satisfaction in teams might address. In particular, this section highlights (1) how the development of the MIMO framework advances former team effectiveness frameworks and how it connects to the recent team literature, and (2) why a configural perspective is necessary for research on satisfaction in the light of contemporary forms of (team)work.
A central implication of this dissertation lies in the development of the MIMO framework (cf. Study 1). As our framework is based on inputs and outcomes, it follows the tradition of the earlier I-P-O (Hackman, 1987) and IMO (Ilgen et al., 2005) team effectiveness frameworks. Addressing the criticism raised towards I-P-O frameworks (cf. Chapter 2.2.3), the IMO framework advanced team research by considering the distinction between emer-gent states and processes (Marks et al. 2001), and by taking into account temporal dynamics in the form of feedback loops, thereby offering a more complex and dynamic view on teamwork than the former process models. However, the IMO framework fails to cover the advancements made by team research in the last decade. In particular, research is moving towards a microdynamic, multi-level understanding of teams (Humphrey & Aime, 2014). Although the IMO framework considers the nested nature of individuals in teams, it does so only for the team composition input, but conceptualizes emergent states, processes, and outcomes as collective, single-level phenomena (see Figure 10). The single-level concep-tualization is paralleled by a focus on uniform constructs. That is, the framework does not acknowledge that group-level constructs can emerge from complex, non-uniform patterns of individual-level variables by compilation processes.
The MIMO framework that we developed in Study 1 addresses these shortcomings by con-sidering the multi-level nature of the input, mediator, and outcomes variables, and ack-nowledging that these variables can emerge as uniform and non-uniform group-level con-structs. Whereas we applied the newly developed framework to the field of team satisfac-tion in Study 1, it is far more versatile and can serve as a blueprint for future team effec-tiveness research. A more general version of the framework is presented in Figure 11. It entails slight changes compared to the satisfaction-focused framework in Study 1 (cf. Figure 5, p. 38), that I describe in the following.
112

Figure 10. IMO framework. Based on Mathieu et al. (2008).
(a) Because of its research focus, the framework employed in Study 1 considered team satisfaction as the sole individual-level und group-level input. However, the general framework acknowledges that other team member attributes also affect team processes and emergent states, most notably personality traits, abilities, values, and demographic characteristics.
(b) The general framework follows the nomenclature introduced by K. Klein and Kozlowski (2000a) and organizes group-level inputs into shared, configural, and global properties. Whereas shared properties are common to all members of the team and converge to uni-form group-level constructs, configural properties emerge from the complex pattern of lower-level responses. In contrast to shared and configural properties, global properties, such as team size, task interdependence, or virtuality, are single-level phenomena that do not emerge from the individual level but originate at the group level instead. Although global properties are not emergent constructs, for the sake of completeness, I retained them in the framework but denoted the difference by placing them in parentheses.
(c) In keeping with affective events theory (Weiss & Cropanzano, 1996), the framework employed in Study 1 proposed that individual-level team satisfaction is affected by team members’ affect and cognition (Path h), but not vice versa. However, because the general framework is more extensive and versatile than its satisfaction-focused application in Stu-dy 1, it entails an additional path between individual-level input variables and individual affect and cognition (Path k). For example, team members’ personality traits such as posi-tive and negative affectivity (Thoresen et al., 2003) influence the likeliness of experiencing positive and negative affect, that is, a relationship between an individual-level input variable and individual affect (e.g., Gloria et al., 2013).
ProcessesEmergent states Multiple criteria
Inputs Mediators Outcomes
Members
Team context
Organizational context
Episodic cycles
Developmental processes
113

Figure 11. General MIMO framework.
Individual contribution
e.g., deliverables, work packages, ideas
Team performance
e.g., productivity, supervisor ratings,
quality of work
Emer
gent
gro
up le
vel
Indi
vidu
al le
vel
Individual affect / cognition
e.g., attraction to the team, trust towards
members
Team affect / cognition (emergent states)
e.g., cohesion,commitment, trust climate
Individual teamwork / taskwork behaviors
e.g., helping, support,information sharing
Team behaviors (processes)
e.g., communication, cooperation, conflict
management
Individual input
e.g., attitudes, values, personality, abilities,
demographic
Team-level input
(global properties)shared properties
configural properties
Inputs Mediators Outcomes
Composition and compilation emergence (bottom-up)
Cross-level effect (top-down) Direct effect Feedback-loop
b c
d
e
f g
h i
j
a
k
114

The MIMO framework connects to a wide range of research areas and can be applied to a variety of team composition variables (i.e., the input). It covers both surface-level variables, such as age, sex, and race; and deep-level variables, such as attitudes, values, personality characteristics, and abilities. In contrast to earlier team-effectiveness frameworks, the MIMO considers the multi-level nature of these variables and that they can emerge as shared and configural properties. For instance, S. T. Bell (2007) examined different pat-terns, such as minimum and maximum, of the big five personality traits, mental abilities, and values, recognizing that these variables are not necessarily uniform group-level con-structs. Likewise, research showed that single team members with exceptional abilities can affect team performance over and above the team’s average level of abilities (Devine & Philips, 2001; Sonnentag & Volmer, 2009). In this case, group-level ability emerges as a configural construct in the deviate form.
Furthermore, the framework recognizes that emergent states, team processes, and team performance, too, can emerge as both shared constructs (i.e., by composition processes) and configural constructs (i.e., by compilation processes): In their seminal article, Marks et al. (2001) did not explicitly consider that emergent states might not be shared constructs. Following this rationale, research traditionally confined to shared emergent states. However, more and more authors consider configural emergent states in their models: For example, whereas prior research mostly assumed that trust climate emerges as a shared construct (Kirkman, Rosen, Tesluk, & Gibson, 2006), De Jong & Dirks (2012) recognized that trust relationships can be asymmetric, that is, that some members trust others but do not receive trust in return. Similarly, team mental models (TMMs) have been described as “team members’ shared, organized understanding and mental representation of knowledge” (Mohammed, Klimoski, & Rentsch, 2000, p. 125). However, research found that team mental models are not always shared and that the similarity of team members’ cognitions influence team performance, mediated by team processes (for a review, see Mohammed et al., 2010). Finally, whereas team efficacy has traditionally been viewed as teams’ shared belief of being capable to perform (Bandura, 1997; Lindsley, Brass, & Thomas, 1995), DeRue and colleagues (2010) argued that the distribution or pattern of efficacy in the team is more predictive of team effectiveness than average levels of team efficacy. Although these examples illustrate that team research benefits from a compilational view on emergent states, conceptualizations as shared constructs are still prevalent. This issue has also been highlighted by Coultas et al. (2014, p. 681) who commented that “[e]mergent states, such as cohesion, psychological safety, and trust, seem to be underrepresented with configural conceptualizations”.
In a similar vein, prior team research mostly viewed team processes as uniform, collective constructs: A good example is the meta-analysis by LePine et al. (2008). The fact that these authors used correlational methodology to account for the effects of teamwork processes implies that all studies considered in their analysis conceptualized teamwork as something unidimensional that ranges from less to more. In contrast to this view, E. R. Crawford & LePine (2013, p. 32) substantiated that interaction in teams “occur[s] in patterns that are complex, dynamic, discontinuous, and nonuniform”. Based on social network analysis, these authors proposed to view team processes as a set of connections between team members within taskwork and teamwork networks (cf. Figure 12a, p. 117). The networks approach implies that members can have unique relationship patterns within the team, such as discussing ideas with some members more than with others. Furthermore, members
115

can hold more central or more peripheral positions in the network, which affects their im-portance for team processes. For example, Humphrey et al. (2009) proposed core roles in teams; that is, roles that are particularly important for team processes, such as being responsible for aligning, coordinating, and monitoring the team’s tasks (Marks et al., 2001). Based in this theorizing, the MIMO framework acknowledges that teamwork pro-cesses are emergent and configural in nature.
Finally, the framework takes uniform and configural team performance into account. The idea of configural team performance goes back to the work of Steiner (1972) who proposed a taxonomy of team tasks. According to Steiner, different task types involve different pro-cesses of how individual contributions emerge to team performance. For instance, in teams working on conjunctive tasks, such as a mountain climbing group, the team’s weakest link determines the team’s overall performance. The configural view on team performance is also reflected in the the literature on star performers which substantiated that few team members can contribute overproportionally to team performance (Aguinis & O'Boyle, 2014). These examples illustrate that team performance should be conceptualized as a configural group-level property that emerges from complex combinations of team members’ individual contributions.
In summary, the MIMO framework helps to shed more light on the discussed emergence and levels-of-analysis issues in team effectiveness research. Although its level of abstrac-tion is relatively high, the framework can guide theory development and help researchers derive more specific and testable propositions and hypotheses.
A related implication of the configural perspective concerns the study of satisfaction in modern forms of teamwork. The term modern refers to the fact that teamwork structures are becoming more fluid and versatile: Employees often work in multiple teams, short-term project teams, across geographical and organizational boundaries, or may not be embedded in any organization at all (Hertel et al., 2003; O'Leary & Mortensen, 2010). As a consequence of this development, it is sometimes difficult to pinpoint local and temporal team boundaries, that is, the question who counts as a team member (Espinosa, Cummings, Wilson, & Pearce, 2003). For example, Humphrey and Aime (2014, p. 449) observed that it is “increasingly difficult and arbitrary to draw clear boundaries” for modern teams. The issue of team membership has also been apparent in this research: In Study 3, the team members and the team leader were asked about the team’s size. Remarkably, there were some inconsistencies between team member and team leader responses as well as among responses given by the team members. In other words, not all team members and leaders were in agreement about who is part of the team. This phenomenon, which has been de-scribed as boundary disagreement or fuzzy boundaries (Mortensen & Hinds, 2002), has con-sequences for research on team satisfaction, especially for the selection of satisfaction facets and the emergence to the group level.
Satisfaction facets denote what is evaluated or what the satisfaction refers to (e.g., satis-faction with the team or the task). However, if the team as such cannot be delimited because it changes constantly, it would be pointless to ask employees how satisfied they are with it. A possible solution lies in placing a stronger emphasis on internal facets that can be different for each member (cf. Table 7, p. 34). For example, future research could consider satisfac-tion with each member’s individual tasks, roles, and responsibilities within the respective team context, because these facets are unaffected by the team’s potentially fuzzy boundaries.
116

Likewise, it might not be useful to consider satisfaction with the team members as a collec-tive in cases of fluid membership. Instead, future research should focus on satisfaction with the specific teamwork and taskwork relationships between the team members (E. R. Crawford & LePine, 2013).
Figure 12. Network approach to satisfaction in teams. (a) Solid lines represent task-work ties, dashed lines represent teamwork ties. (b) Arrows represent satisfaction of the focal Member A with taskwork (solid) and teamwork (dashed) relationships that are relevant for team performance. The figure is based on E. R. Crawford and LePine (2013).
Consider the exemplar team depicted in Figure 12a. Member A shares taskwork ties with Members C, D, and F (indicated by the solid lines), teamwork ties with Members B and F (indicated by the dashed lines), and neither tie with Member E. The missing tie between Members A and E indicates that these members neither work on the same tasks nor engage in teamwork processes, such as coordination and helping. This suggests that Member A might not even know who Member E is or that he or she is part of the team at this point in time. Therefore, Member A has either not formed an attitude towards Member E, or the attitude has little relevance for the team’s performance. Likewise, Members A and B share a teamwork but not a taskwork tie. This means that these members interact to coordinate and monitor taskwork, and to help and motivate each other, but do not work on the same tasks (Marks et al., 2001). Consequently, research should focus on Member A’s satisfaction with the teamwork processes that he or she engages in with Member B. This reasoning leads to a network of satisfaction relationships that are relevant for each focal member, depicted in Figure 12b. To complicate matters, we must consider that dyadic relationships are not always symmetrical (Bowler & Brass, 2006) which implies that Member A might be highly satisfied with the teamwork relationship with Member B, but not vice versa. Therefore, future research on satisfaction in teams should consider which team member is satisfied with which type of relationship with which other member.
A
C
B
F
E D
A
C
B
F
E D
(a) Teamwork and taskwork network
(b) Network of relevant satisfaction relationships for Member A
117

These deliberations again highlight the limits of the collectivist approach to satisfaction in teams. At the same time, they emphasize the need for a configural understanding of satis-faction that is compatible with configural approaches to team processes, emergent states, and team performance that characterize current team research and modern forms of teamwork.
8.3 Implications for Managerial Practice
The theorizing and empirical findings of this dissertation suggest some implications for managerial practice. First and foremost, they suggest that managers should pay attention to satisfaction dispersion within teams. Managers who conduct employee attitude surveys should be aware that average scores might obscure teams’ actual satisfaction distributions and can lead to false conclusions: For example, in the case of a single dissatisfied member (i.e., deviate satisfaction), managers must pay attention especially to the dissatisfied member, learn the reasons why he or she is dissatisfied, and adopt appropriate measures to prevent negative consequences for the team. These measures might focus on the dissatis-fied member, such as reassignment of tasks and responsibilities, or relocation to another team; or focus on the relationship between the deviate member and the rest of the team, such as guided discussions or team trainings. If managers mistakenly assume that all team members are moderately satisfied, they might either adopt measures that are not suitable to resolving the problem or might not realize the need for action at all, which can be detrimental for the team’s further collaboration, viability, and performance.
To guide managers’ attention towards the issue of satisfaction distributions, straightfor-ward graphical depictions of group-level satisfaction are necessary. I propose box plots as an easily comprehensible means to depict satisfaction distributions (see Figure 13). In the example, Teams A to D have uniform, deviate, bimodal, and fragmented satisfaction dis-tributions, respectively. The small width of Team A’s box shows that the data is clustered closely around the median, which indicates a uniform distribution. In Team B’s plot, the small box width in conjunction with the stretched whisker indicates a dissatisfied outlier in an otherwise satisfied team. Due to the greater variance in bimodal and fragmented distributions, Teams C and D can be easily distinguished from Teams A and B by the larger box width. The bimodal and fragmented distributions can be differentiated by the location of the median, which is indicated by the black band inside the boxes: In bimodal distribu-tions, the median is located on the left or right side of the box; in fragmented distributions, it is located in the center. In sum, box plots provide a convenient way of displaying and distinguishing various distributions of satisfaction in teams and can help introduce the concept of satisfaction distributions into organizational routine.
118

Figure 13. Exemplar box plots of satisfaction configurations. Whiskers represent minimum and maximum scores within the team.
The findings from Study 3 have implications for managers who seek to unify satisfaction in their teams. Because teams’ average level of satisfaction affects team performance and citizenship behaviors (Whitman et al., 2010), team leaders obviously seek to avoid dissa-tisfaction in their teams. Moreover, and less obviously so, satisfaction dispersion, too, is undesirable for teams as it negatively affects team cohesion (Harrison et al., 1998) and social integration (van der Vegt, 2002). Consequently, team leaders might be interested in promoting uniform satisfaction in their teams. Although I think that one should be cau-tious about giving practical advice based on a single study, I would like to point to some implications this study offers for practice.
Contrary to expectations, the results of Study 3 do not indicate a relationship between social interaction and satisfaction homogeneity. Therefore, if supervisors want to foster uniform satisfaction, merely scheduling regular team meetings or having members work in an open-plan office will not suffice. Instead, when seeking to enhance satisfaction homo-geneity, supervisors should induce shared affect. A reliable way to do so is by letting team members experience the same affective events. For example, collective events, such trainings (Salas et al., 2008) and team building interventions (C. Klein et al., 2009), have been shown to induce positive affect. Conversely, it might be helpful if team members also share negative events. Drawing on the notion that shared negative affect enhances team cohesion (Weeks, 2004), Dineen et al. (2007) showed that dissatisfaction actually reduces absenteeism when it is shared among members. Therefore, team leaders should consider giving negati-ve feedback or bad news to the team as a whole instead of giving it only to some of the members. Moreover, the finding that homogeneity of CSEs affects homogeneity of satisfac-tion has implications for staffing procedures. When selecting members with high levels of CSEs, team members will be similarly resistant against negative affect and are likely to experience similar levels of satisfaction. Given that other studies also showed positive effects of CSEs in the team context (e.g., Haynie, 2011; Tasa, Sears, & Schat, 2011), I advo-cate its use in staffing decisions.
dissatisfied satisfied
Team A[Uniform]
Team B[Deviate]
Team C[Bimodal]
Team D[Fragmented]
109876543210
119

8.4 Methodological Implications
The findings of this dissertation have methodological implications. As testing the proposi-tions of Study 1 requires distinguishing between the four forms of group-level satisfaction, methods to categorize teams according to the four categories must be developed and tested. Above, I argued that the forms of group-level satisfaction can be identified by a graphical examination of teams’ satisfaction distribution with box plots (see Figure 13). Although this method has the advantage that it does not rely on arbitrary cut-off criteria, the coding procedure might be a quite time-consuming process, especially for a larger number of teams. Therefore, numerical methods for classification are needed. DeRue et al. (2010) suggested two approaches for classification: First, they suggested considering distribution moments such as variance, skewness, and kurtosis to operationalize the four distributions: Small variances would indicate uniform satisfaction, highly skewed distributions would suggest deviate satisfaction, a kurtosis value of -2.0 would be indicative of bimodal satis-faction, and a kurtosis value of -1.2 would suggest fragmented satisfaction (cf. Chissom, 1970). Second, rWG statistics (James et al., 1993) with different null distributions (uniform, bimodal, and skewed distributions) can be used to determine the form of group-level satis-faction. A distribution would be classified as uniform if all rWG indices are high, as deviate if rWG skewed is low, as bimodal if rWG bimodal is low, and as fragmented if rWG uniform is low. While both approaches might help to quickly and objectively categorize larger num-bers of teams, to the best of my knowledge, neither approach has been empirically tested yet. A study with simulated teams could assess sensitivity and specificity of the proposed classification procedures and estimate how team size and measurement reliability affect the precision of classification.
An alternative approach lies in assessing the form of satisfaction directly. That is, instead of measuring each team member’s individual attitudes and deducing the form of satisfac-tion based on distributional characteristics, future research could try to assess the form directly by using a referent-shift consensus model (Chan, 1998). Exemplar items would be “The members of our team are similarly satisfied with working in this team” (uniform), “In our team, there is one member who is not as satisfied as the rest of us” (deviate), “In our team, there are subgroups who are differently satisfied with working in this team” (bimo-dal), and “All members are differently satisfied with working in this team” (fragmented). Provided that psychometrically sound items can be developed, this approach would have two advantages: First, it would provide a pure assessment of the satisfaction forms without information about the absolute level and dispersion of satisfaction in the team, which would be helpful for testing the propositions developed in Study 1. Particularly, measuring the satisfaction forms in isolation would allow testing whether the forms explain additional variance over and above the teams’ average and dispersion of satisfaction when predicting performance-related outcomes. Second, such a measure would focus on the perceived rather than the actual satisfaction form. Following research on perceived diversity (Shem-la et al., 2014), it can be expected that perceived and actual satisfaction forms are distinct constructs that have discernible and unique effects on team functioning. Therefore, future research could employ both approaches and investigate how perceived and actual forms of satisfaction relate to one another, and how they affect team processes, emergent states, and performance.
120

This research also has implications for the formulation of items to assess the absolute level (rather than the form) of satisfaction. According to Chan’s (1998) typology, group-level measures can be based on items that follow a direct consensus model (e.g., “I am satisfied with my tasks in the team”) or a referent-shift consensus model (e.g., “Our team is satis-fied with its task”; Mason & Griffin, 2005). The theorizing and empirical findings of this dissertation speak in favor of the former model: The referent-shift consensus model pre-supposes that all team members have a similar view on the respective facet, such as the team, the team leader, or the task. However, in the course of this dissertation, I challenged the assumption that satisfaction is necessarily a uniform construct. Against this background, the use of referent-shift worded items is difficult to justify. Furthermore, as elaborated above, data cannot be reasonably interpreted in cases of disagreement when the team is chosen as the referent. Organizations and researchers who seek to assess the absolute level of satisfaction in employee surveys should, therefore, opt to use the individual as the refe-rent when formulating items.
Instead of developing new items, resorting to validated scales is preferable. Given that organizations rely on the results of employee attitude surveys to make strategic decisions (Schneider, Ashworth, Higgs, & Carr, 1996), using reliable and valid measures is para-mount. However, ad-hoc scales compromise the psychometric quality of measurement, and complicate benchmarking one’s scores against those of other organizations (Thompson & Phua, 2012). To overcome these problems, the scales that I developed in the course of this dissertation can be used to assess satisfaction and its facets in the German language area. Two advantages of these scales can be highlighted. First, all scales have proven reliable and valid in several studies with distinct and large samples. Second, the scales consist of only five items each so that they save precious survey space and reduce the risk of partici-pant dropout (Hoerger, 2010). Therefore, I endorse using the satisfaction scales developed in Studies 2a and 2b as an alternative to self-built measures and single-items scales.
A final methodological implication relates to the problem of missing team member data. The forms of satisfaction we have discussed in Study 1 cannot be examined in applied set-tings unless data from all members are available. However, obtaining responses from all team members is often unrealistic and has, in fact, been described as “nearly impossible” (Maloney et al., 2010, p. 282). While within-team non-response is a general issue in team research, the advancement of theories that entail configurations of lower-level responses (e.g., E. R. Crawford & LePine, 2013; Roberson & Colquitt, 2005) will further aggravate the problem. In particular, without responses of all team members, configurations cannot be reliably distinguished from one another. Consider a case in which data from four out of five team members are available. If the four members have similar levels of satisfaction, depending on the missing member’s satisfaction, the overall configuration could either be uniform or deviate. Likewise, if only three of the four members have similar levels of satis-faction and one member deviates from the others, the overall configuration could be deviate (if the missing member shares satisfaction with the majority), bimodal (if the missing member shares satisfaction with the minority), or fragmented (if the missing member shares satisfaction with neither party).
Because our theoretical analysis in Study 1 suggested that these configurations differently relate to emergent states, processes, and performance-related outcomes, missing team member data can threaten the validity of survey results and research findings. The problem
121

is especially severe for satisfaction research because the less satisfied team members are, the less likely they are to participate in voluntary employee surveys or research projects (Rogelberg et al., 2000). This means that dissatisfied members are particularly prone to drop out of analyses (i.e., systematic drop-out). To mitigate the problem, researchers might opt to exclude all teams from analyses with less than 100 % response rate — provided their samples are large enough. However, this solution is not advisable as it decreases sta-tistical power and can lead to biased samples (Hirschfeld et al., 2013; Maloney et al., 2010; Stanley et al., 2011). Therefore, Rogelberg et al. (2000) advocate addressing this problem proactively by increasing compliance. This can be achieved through providing feedback about survey results, implementing changes based on survey data, and avoiding over-surveying employees.
8.5 Strengths and Limitations
As with any research, this one, too, has strengths and limitations. From a methodological perspective, a strength of this dissertation lies in the samples used for the empirical studies. The scale development in Study 2a was based on two independent and large samples. While the first sample was used for item selection, the second sample helped cross validate the scales. Because team acquisition is tiresome, team research often relies on ad-hoc student teams (Chiocchio & Essiembre, 2009) or suffers from small sample sizes (e.g., Mason, 2006). In this research, the findings of Studies 2a, 2b, and 3 are based on relatively large samples: Study 2a used two independent samples comprising 594 participants. In Study 3, data from 415 team members working in 110 teams were analyzed. Study 2b used a subset of this sample that was comprised of 202 members in 47 teams. Furthermore, instead of teams comprised of students who work together just for the duration of the stu-dy, this research used teams in real business settings that were sampled from a variety of branches and industries including retail, chemical engineering, construction, finance, and education, which increases robustness and generalizability of findings.
A further strength lies in the breadth of indicators that were employed for performance of individuals and teams. Performance itself is a wide construct that has been defined with a variety of different criteria (Mathieu et al., 2008). To account for this breadth, Study 2b used four distinct criteria: Intention to leave the team, team-rated performance, team citizenship behaviors, and meeting absenteeism. Likewise, Study 3 examined not only self-rated performance, but also performance rated by the teams’ supervisor. Because satisfaction was assessed directly from the team members, the inclusion of supervisor-rated performance diminishes the threat of common method bias and increases the validity and generalizability of results (Podsakoff et al., 2003).
There are also limitations inherent to this dissertation that need to be addressed. A first limitation lies in the cross-sectional research design of the empirical studies, particularly Studies 2b and 3. While the primary focus of Study 2b was to adapt the satisfaction scales to the team context and to validate them, it also yielded some interesting findings when convergent validity was assessed. However, the cross-sectional research design of the study only allowed for a mere correlational analysis and precluded testing causal relationships. Therefore, alternative explanations for the relationships found in this study cannot be ruled
122

out. For instance, although low team member satisfaction might increase the likeliness for members to skip team meetings, regularly holding meetings with members missing might also impair satisfaction with the other members. Similar arguments have been brought forward for the relationship between satisfaction and performance: Whereas most authors view performance as a consequence of satisfaction (Riketta, 2008), others have argued that satisfaction might also be caused by performance (for a review, see Judge et al., 2001). In both examples, satisfaction and its presumed outcomes could also influence each other in a spiraling process. Although the MIMO framework accounts for these temporal dyna-mics (cf. Study 1), I was unable to examine them empirically.
In Study 3, I examined how team members’ individual attitudes converge to a uniform attitude at the group level. However, because convergence of satisfaction must be thought of as a reciprocal process (Walter & Bruch, 2008), it requires longitudinal data to be thoroughly addressed. For example, the study substantiated a relationship between shared team affect and shared satisfaction. Although affective events theory proposes that this relationship is causal in nature, which posits a time interval between cause and effect, cross-sectional data only tell us that teams who share positive and negative affect at a spe-cific point in time also share satisfaction at this point in time. Likewise, the study showed that shared affective events and similarity in personality traits increase the likeliness of shared affect. However, given the cross-sectional design, the study allows no conclusions regarding the process of convergence itself. In this way, the results of Study 3 highlight the static, but not the dynamic pathway to uniform satisfaction (Klep et al., 2011). Taken together, research would benefit if future studies replicated the findings of Studies 2b and 3 using longitudinal designs as this would help to gain a deeper understanding of the questions of emergence and causality that were addressed in this research.
A second limitation of the empirical studies conducted in this research program concerns the neglect of multi-level methodology. Because Study 3 examined team averages and homogeneity indices, it essentially employed a single-level design. However, as proposed in the literature (e.g., Diestel et al., 2013) and in the MIMO framework in Study 1, satis-faction in teams as well as team processes, emergent states, and performance, are multi-level phenomena in which lower-level (individual) affective experiences, attitudes, and be-haviors emerge to the group level through composition and compilation processes. Although this study provided interesting new insights into the emergence of uniform satisfaction, a multi-level investigation could have enhanced the impact this study has for team research and would have allowed for a more fine-grained test of the hypothesized relationships and processes.
A final limitation lies in the fact that not all studies in this dissertation considered facets of satisfaction. In Studies 2a and 2b, I developed measures for overall and facet-specific satis-faction. However, as incorporating different satisfaction facets in Studies 1 and 3 would have been beyond the respective scopes of the studies, they were concerned with overall team satisfaction only. This is a limitation in so far, that theoretical considerations and em-pirical findings support the use of satisfaction facets instead of overall satisfaction measures: Ajzen and Fishbein’s compatibility principle suggests that the relationship between attitudes and behaviors is stronger in cases where the breadth of the predictor matches the breadth of the criterion (Ajzen, 2011; Ajzen & Fishbein, 1977). Because team performance is not a behavior in itself, but rather the consequence of specific behaviors (i.e., teamwork and
123

taskwork behaviors), considering satisfaction with specific facets might allow for better predictions of the behaviors that lead to performance than measures of overall satisfaction. Empirical studies also show that attitudes towards different work-related facets contain valuable information that help to better predict work-related outcomes at the individual level (e.g., Kinicki et al. 2002, Edwards et al. 2008) and at the group level (Dineen et al., 2007; Mason & Griffin, 2005). In fact, this was also found in Study 2b, where, for instan-ce, satisfaction with the team members was considerably stronger related to citizenship behaviors than satisfaction with the task. Building on the findings of this dissertation and the taxonomy of satisfaction facets in Study 1, future research could place a greater em-phasis on differences between internal and external facets of satisfaction. Using this classi-fication, future studies could investigate whether the convergence of internal and external satisfaction (cf. Study 3) is based on the same or on different processes, and whether satis-faction facets moderate the relationship between the forms of satisfaction (cf. Study 1) and performance.
8.6 Conclusion
As team-based working continues to be among the most common forms of organizing work, team members’ job satisfaction is a major concern for research and organizational practice. This dissertation identified conceptual and methodological issues in prior research on satisfaction in teams and addressed them in a series of four studies. Challenging the notion that satisfaction always takes the form of a uniform team attitude, this research focused on the role of distributional characteristics of satisfaction, their emergence, and their effects on team functioning. Furthermore, it provided new measures and practical guidelines for the assessment of satisfaction and its facets in employee surveys. Taken to-gether, the theorizing and empirical findings of this research emphasize the merits of a configural and multi-level conceptualization of satisfaction in teams. I am convinced that taking such a perspective opens new avenues for future research on satisfaction in teams and offers great potential for predicting, explaining, and understanding how teams work.
124

References
Adams, J. (1966). Inequity in social exchange. Advances in Experimental Social Psychology, 2, 267–299. doi:10.1016/S0065-2601(08)60108-2
Aguinis, H., & O'Boyle, E. (2014). Star performers in twenty-first century organizations. Personnel Psychology, 67, 313–350. doi:10.1111/peps.12054
Ajzen, I. (2011). Job satisfaction, effort, and performance: A reasoned action perspective. Contemporary Economics, 5(4), 32–43. doi:10.5709/ce.1897-9254.26
Ajzen, I., & Fishbein, M. (1977). Attitude-behavior relations: A theoretical analysis and review of empirical research. Psychological Bulletin, 84, 888–918. doi:10.1037/0033-2909.84.5.888
Anderson, N., & West, M. (1998). Measuring climate for workgroup innovation: Development and validation of the team climate inventory. Journal of Organizational Behavior, 19, 235–258. doi:10.1002/(SICI)1099-1379(199805)19:3<235::AID-JOB837>3.0.CO;2-C
ArbSchG: Arbeitsschutzgesetz. (2014). Arbeitsgesetze, 84. Aufl. München. Aust, F., Diedenhofen, B., Ullrich, S., & Musch, J. (2013). Seriousness checks are useful to
improve data validity in online research. Behavior Research Methods, 45, 527–535. doi:10.3758/s13428-012-0265-2
Balliet, D., Wu, J., & De Dreu, C. K. W. (2014). Ingroup favoritism in cooperation: A meta-analysis. Psychological Bulletin, 140, 1556–1581. doi:10.1037/a0037737
Balzer, W. K., Kihm, J. A., Smith, P. C., Irwin, J. L., Bachiochi, P. D., Robie, C., . . . Parra, L. F. (1997). Users' manual for the Job Descriptive Index (JDI; 1997 Revision) and the Job In General scales. Bowling Green, OH: Bowling Green State University.
Bandura, A. (1997). Self-efficacy: The exercise of control. New York, NY: Freeman. Barnette, J. J. (2000). Effects of stem and likert response option reversals on survey
internal consistency: If you feel the need, there is a better alternative to using those negatively worded stems. Educational and Psychological Measurement, 60, 361–370. doi:10.1177/00131640021970592
Barrick, M. R., Stewart, G. L., Neubert, M. J., & Mount, M. K. (1998). Relating member ability and personality to work-team processes and team effectiveness. Journal of Applied Psychology, 83, 377–391. doi:10.1037/0021-9010.83.3.377
Barsade, S. G. (2002). The ripple effect: Emotional contagion and its influence on group behavior. Administrative Science Quarterly, 47, 644–675. doi:10.2307/3094912
Barsade, S. G., & Gibson, D. E. (2012). Group affect: Its influence on individual and group outcomes. Current Directions in Psychological Science, 21, 119–123. doi:10.1177/0963721412438352
Bartel, C. A., & Saavedra, R. (2000). The collective construction of work group moods. Administrative Science Quarterly, 45, 197–231. doi:10.2307/2667070
Basch, J., & Fisher, C. D. (2000). Affective events-emotions matrix: A classification of work events and associated emotions. In N. M. Ashkanasy, C. E. J. Härtel & W. J. Zerbe (Eds.), Emotions in the workplace: Research, theory, and practice (pp. 36–48). Westport, CT: Quorum Books.
Baumeister, R. F., Bratslavsky, E., Finkenauer, C., & Vohs, K. D. (2001). Bad is stronger than good. Review of General Psychology, 5, 323–370. doi:10.1037/1089-2680.5.4.323
125

Baumgartner, C., & Udris, I. (2005). Das „Zürcher Modell“ der Arbeitszufriedenheit — 30 Jahre „still going strong“ [The Zurich model of job satisfaction — 30 years “still going strong”]. In L. Fischer (Ed.), Arbeitszufriedenheit (Vol. 2, pp. 111–134). Göttingen: Hogrefe.
Beal, D. J., Cohen, R. R., Burke, M. J., & McLendon, C. L. (2003). Cohesion and performance in groups: A meta-analytic clarification of construct relations. Journal of Applied Psychology, 88, 989–1004. doi:10.1037/0021-9010.88.6.989
Behfar, K. J., Friedman, R., & Oh, S. H. (2015). Impact of team (dis)satisfaction and psychological safety on performance evaluation biases. Small Group Research, 47, 77–107. doi:10.1086/268432
Bell, B. S., & Kozlowski, S. (2010). Work teams. In J. M. Levine & M. A. Hogg (Eds.), Encyclopedia of group processes and intergroup relations (pp. 955–958). Thousand Oakes, CA: Sage.
Bell, S. T. (2007). Deep-level composition variables as predictors of team performance: A meta-analysis. Journal of Applied Psychology, 92, 595–615. doi:10.1037/0021-9010.92.3.595
Belschak, F. D., & Den Hartog, D. N. (2009). Consequences of positive and negative feedback: The Impact on emotions and extra-role behaviors. Applied Psychology, 58, 274–303. doi:10.1111/j.1464-0597.2008.00336.x
Bishop, J. W., Dow Scott, K., & Burroughs, S. M. (2000). Support, commitment, and employee outcomes in a team environment. Journal of Management, 26, 1113–1132. doi:10.1016/S0149-2063(00)00083-0
Bliese, P. D. (2000). Within-group agreement, non-independence, and reliability. In K. Klein & S. Kozlowski (Eds.), Multilevel Theory, Research, and Methods in Organizations (pp. 349–381). San Francisco, CA: Jossey-Bass. doi:10.12691/education-3-1-14
Bliese, P. D., & Halverson, R. R. (1998). Group consensus and psychological well-being: A large field study. Journal of Applied Social Psychology, 28, 563–580. doi:10.1111/j.1559-1816.1998.tb01720.x
Bowler, W. M., & Brass, D. J. (2006). Relational correlates of interpersonal citizenship behavior: A social network perspective. Journal of Applied Psychology, 91, 70–82. doi:10.1037/0021-9010.91.1.70
Bowling, N., Hendricks, E., & Wagner, S. (2008). Positive and negative affectivity and facet satisfaction: A meta-analysis. Journal of Business and Psychology, 23, 115–125. doi:10.1007/s10869-008-9082-0
Brayfield, A., & Rothe, H. (1951). An index of job satisfaction. Journal of Applied Psychology, 35, 307–311. doi:10.1037/h0055617
Brief, A. P. (1998). Attitudes in and around organizations (Vol. 9). Thousand Oaks, CA: Sage.
Brief, A. P., Butcher, A. H., & Roberson, L. (1995). Cookies, disposition, and job attitudes: The effects of positive mood-inducing events and negative affectivity on job satisfaction in a field experiment. Organizational Behavior and Human Decision Processes, 62, 55–62. doi:10.1006/obhd.1995.1030
Brodke, M. R., Sliter, M. T., Balzer, W. K., Gillespie, J. Z., Gillespie, M. A., Gopalkrishnan, P., & Yankelevich, M. (2009). The job descriptive index and job in general: 2009 revision quick reference guide. Bowling Green, OH: Bowling Green State University.
126

Bruggemann, A. (1974). Zur Unterscheidung verschiedener Formen von „Arbeitszufriedenheit“ [On distinguishing different forms of “job satisfaction”]. Arbeit und Leistung, 28, 281–284.
Bruggemann, A. (1976). Zur empirischen Untersuchung verschiedener Formen von Arbeitszufriedenheit [On the empirical examination of different forms of job satisfaction]. Zeitschrift für Arbeitswissenschaft, 30, 71–74.
Byrne, D. (1961). Interpersonal attraction and attitude similarity. The Journal of Abnormal and Social Psychology, 62, 713–715. doi:10.1037/h0044721
Cammann, C., Fichman, M., Jenkins, G.D. and Klesh, J.R. (1983). Assessing the attitudes and perceptions of organizational members. In S. E. Seashore, E. E. Lawler III, P. H. Mirvis, and C. Cammann (Eds.), Assessing Organizational Change: A Guide to Methods, Measures, and Practices (pp. 71–138). New York, NY: Wiley-Blackwell.
Card, D., Mas, A., Moretti, E., & Saez, E. (2012). Inequality at work: The effect of peer salaries on job satisfaction. American Economic Review, 102, 2981–3003. doi:10.3386/w16396
Carless, S. A., & De Paola, C. (2000). The measurement of cohesion in work teams. Small Group Research, 31, 71–88. doi:10.1177/104649640003100104
Carlson, D., Kacmar, K. M., Zivnuska, S., Ferguson, M., & Whitten, D. (2011). Work-family enrichment and job performance: a constructive replication of affective events theory. Journal of Occupational Health Psychology, 16, 297–312. doi:10.1037/a0022880
Carron, A. V., Brawley, L. R., Eys, M. A., Bray, S., Dorsch, K. I. M., Estabrooks, P., . . . Terry, P. C. (2003). Do individual perceptions of group cohesion reflect shared beliefs? An empirical analysis. Small Group Research, 34, 468–496. doi:10.1177/1046496403254274
Carton, A., & Cummings, J. (2012). A theory of subgroups in workteams. Academy of Management Review, 37, 441–470. doi:10.5465/amr.2009.0322
Cascio, W. F., & Aguinis, H. (2008). Research in industrial and organizational psychology from 1963 to 2007: Changes, choices, and trends. Journal of Applied Psychology, 93, 1062–1081. doi:10.1037/0021-9010.93.5.1062
Cattell, R. B. (1966). The scree test for the number of factors. Multivariate Behavioral Research, 1, 245–276. doi:10.1207/s15327906mbr0102_10
Chan, D. (1998). Functional relations among constructs in the same content domain at different levels of analysis: A typology of composition models. Journal of Applied Psychology, 83, 234–246. doi:10.1037/0021-9010.83.2.234
Chang, C. H., Ferris, D. L., Johnson, R. E., Rosen, C. C., & Tan, J. A. (2011). Core self-evaluations: A review and evaluation of the literature. Journal of Management, 38, 81–128. doi:10.1177/0149206311419661
Chapman, D. S., Uggerslev, K. L., Carroll, S. A., Piasentin, K. A., & Jones, D. A. (2005). Applicant attraction to organizations and job choice: A meta-analytic review of the correlates of recruiting outcomes. Journal of Applied Psychology, 90, 928–944. doi:10.1037/0021-9010.90.5.928
Chiocchio, F., & Essiembre, H. (2009). Cohesion and performance: A meta-analytic review of disparities between project teams, production teams, and service teams. Small Group Research, 40, 382–420. doi:10.1177/1046496409335103
Chissom, B. S. (1970). Interpretation of the kurtosis statistic. The American Statistician, 24(4), 19–22.
127

Chou, L. F., Wang, A. C., Wang, T. Y., Huang, M. P., & Cheng, B. S. (2008). Shared work values and team member effectiveness: The mediation of trustfulness and trustworthiness. Human Relations, 61, 1713–1742. doi:10.1177/0018726708098083
Clegg, C., Wall, T., Pepper, K., Stride, C., Woods, D., Morrison, D., . . . Kogi, K. (2002). An international survey of the use and effectiveness of modern manufacturing practices. Human Factors and Ergonomics in Manufacturing, 12, 171–191. doi:10.1002/hfm.10006
Coelho, P. S., & Esteves, S. P. (2007). The choice between a five-point and a ten-point scale in the framework of customer satisfaction measurement. International Journal of Market Research, 49, 313–339.
Cole, M., Bedeian, A., Hirschfeld, R., & Vogel, B. (2011). Dispersion-composition models in multilevel research: A data-analytic framework. Organizational Research Methods, 14, 718–734. doi:10.1177/1094428110389078
Connolly, J. & Viswesvaran, C. (1999). The role of affectivity in job satisfaction: A meta-analysis. Personality and Individual Differences, 29, 265–281. doi:10.1016/S0191-8869(99)00192-0
Cooper-Hakim, A., & Viswesvaran, C. (2005). The construct of work commitment: Testing an integrative framework. Psychological Bulletin, 131, 241–259. doi:10.1037/0033-2909.131.2.241
Costa, A. C. (2003). Work team trust and effectiveness. Personnel Review, 32, 605–622. doi:10.1108/00483480310488360
Costello, A. B., & Osborne, J. W. (2005). Best practices in exploratory factor analysis: Four recommendations for getting the most from your analysis. Practical Assessment, Research & Evaluation, 10(7), 1–9. doi:10.1.1.110.9154
Coultas, C. W., Driskell, T., Burke, C. S., & Salas, E. (2014). A conceptual review of emergent state measurement: Current problems, future solutions. Small Group Research, 45, 671–703. doi:10.1177/1046496414552285
Cranny, C. J., Smith, P. C., & Stone, E. F. (1992). Job satisfaction: how people feel about their jobs and how it affects their performance. New York, NY: Lexington Press.
Crawford, E. R., & LePine, J. A. (2013). A configural theory of team processes: Accounting for the structure of taskwork and teamwork. Academy of Management Review, 38, 32–48. doi:10.5465/amr.2011.0206
Crawford, J. R., & Henry, J. D. (2004). The Positive and Negative Affect Schedule (PANAS): Construct validity, measurement properties and normative data in a large non-clinical sample. British Journal of Clinical Psychology, 43, 245–265. doi:10.1348/0144665031752934
Cropanzano, R., Li, A., & Benson III, L. (2011). Peer justice and teamwork process. Group & Organization Management, 36, 567–596. doi:10.1177/1059601111414561
Dalal, R. S. (2005). A meta-analysis of the relationship between organizational citizenship behavior and counterproductive work behavior. Journal of Applied Psychology, 90, 1241–1255. doi:10.1037/0021-9010.90.6.1241
Dasborough, M. T. (2006). Cognitive asymmetry in employee emotional reactions to leadership behaviors. The Leadership Quarterly, 17, 163–178. doi:10.1016/j.leaqua.2005.12.004
Davenport, T. H., Harris, J., & Shapiro, J. (2010). Competing on talent analytics. Harvard Business Review, 88(10), 52–58.
128

De Jong, B. A., & Dirks, K. T. (2012). Beyond shared perceptions of trust and monitoring in teams: Implications of asymmetry and dissensus. Journal of Applied Psychology, 97, 391–406. doi:10.1037/a0026483
de Wit, F. R. C., Greer, L. L., & Jehn, K. A. (2012). The paradox of intragroup conflict: A meta-analysis. Journal of Applied Psychology, 92, 360–390. doi:10.1037/a0024844
DeRue, S., Hollenbeck, J., Ilgen, D., & Feltz, D. (2010). Efficacy dispersion in teams: Moving beyond agreement and aggregation. Personnel Psychology, 63, 1–40. doi:10.1111/j.1744-6570.2009.01161.x
DeStephen, R. S. & Hirokawa, R.Y. (1988). Small group consensus: Stability of group support of the decision, task process, and group relationships. Small Group Behavior, 19, 227–239. doi:10.1177/104649648801900204
Devine, D. J., & Philips, J. L. (2001). Do smarter teams do better: A meta-analysis of cognitive ability and team performance. Small Group Research, 32, 507–532. doi:10.1177/104649640103200501
Diamantopoulos, A., Riefler, P., & Roth, K. (2008). Advancing formative measurement models. Journal of Business Research, 61, 1203–1218. doi:10.1016/j.jbusres.2008.01.009
Diedenhofen, B., & Musch, J. (2015). cocor: A comprehensive solution for the statistical comparison of correlations. PLoS One, 10(4), e0121945. doi:10.1037/0003-066X.44.10.1276
Diener, E., Suh, E. M., Lucas, R. E., & Smith, H. L. (1999). Subjective well-being: Three decades of progress. Psychological Bulletin, 125, 276–302. doi:10.1037/0033-2909.125.2.276
Diestel, S., Wegge, J., & Schmidt, K. (2013). The impact of social context on the relationship between individual job satisfaction and absenteeism: The roles of different foci of job satisfaction and work-unit absenteeism. Academy of Management Journal, 57, 353–382. doi:10.5465/amj.2010.1087
Dimotakis, N., Scott, B. A., & Koopman, J. (2011). An experience sampling investigation of workplace interactions, affective states, and employee well-being. Journal of Organizational Behavior, 32, 572–588. doi:10.1002/job.722
Dineen, B., Noe, R., Shaw, J., Duffy, M., & Wiethoff, C. (2007). Level and dispersion of satisfaction in teams: Using foci and social context to explain the satisfaction-absenteeism relationship. Academy of Management Journal, 50, 623–643. doi:10.5465/AMJ.2007.25525987
Doty, D. H., & Glick, W. H. (1994). Typologies as a unique form of theory building: Toward improved understanding and modeling. Academy of Management Review, 19, 230–251. doi:10.5465/AMR.1994.9410210748
Duffy, M. K., & Shaw, J. D. (2000). The Salieri syndrome: Consequences of envy in groups. Small Group Research, 31, 3–23. doi:10.1177/104649640003100101
Dulebohn, J. H., Bommer, W. H., Liden, R. C., Brouer, R. L., & Ferris, G. R. (2012). A meta-analysis of antecedents and consequences of leader-member exchange integrating the past with an eye toward the future. Journal of Management, 38, 1715–1759. doi:10.1177/0149206311415280
Dunlop, P. D., & Lee, K. (2004). Workplace deviance, organizational citizenship behavior, and business unit performance: The bad apples do spoil the whole barrel. Journal of Organizational Behavior, 25, 67–80. doi:10.1002/job.243
Eagly, A. E., & Chaiken, S. (1993). The psychology of attitudes. Fort Worth, TX: Harcourt Brace Jovanovich. doi:10.1002/mar.4220120509
129

Edmans, A. (2012). The link between job satisfaction and firm value, with implications for corporate social responsibility. Academy of Management Perspectives, 26, 1–19. doi:10.5465/amp.2012.0046
Edwards, B., Bell, S. T., Arthur, J. W., & Decuir, A. (2008). Relationships between facets of job satisfaction and task and contextual performance. Applied Psychology, 57, 441–465. doi:10.1111/j.1464-0597.2008.00328.x
Einarsen, S., & Raknes, B. I. (1997). Harassment in the workplace and the victimization of men. Violence and victims, 12, 247–263.
Espinosa, J. A., Cummings, J. N., Wilson, J. M., & Pearce, B. M. (2003). Team boundary issues across multiple global firms. Journal of Management Information Systems, 19, 157–190.
Evans, M. G., & Ondrack, D. A. (1991). The motivational potential of jobs: Is a multiplicative model necessary? Psychological Reports, 69, 659–672.
Faragher, B., Cass, M., & Cooper, C. (2005). The relationship between job satisfaction and health: A meta-analysis. Occupational and Environmental Medicine, 62, 105–112. doi:10.1136/oem.2002.006734
Farmer, S. M., Van Dyne, L., & Kamdar, D. (2015). The contextualized self: How team-member exchange leads to coworker identification and helping OCB. Journal of Applied Psychology, 100, 583–595. doi:10.1037/a0037660
Felps, W., Mitchell, T. R., & Byington, E. (2006). How, when, and why bad apples spoil the barrel: Negative group members and dysfunctional groups. Research in Organizational Behavior, 27, 175–222. doi:10.3410/f.3569959.3276054
Ferreira, Y. (2007). Evaluation von Instrumenten zur Erhebung der Arbeitszufriedenheit [Evaluation of instruments to assess job satisfaction]. Zeitschrift für Arbeitswissenschaft, 61, 87–94.
Ferreira, Y. (2009). FEAT — Fragebogen zur Erhebung von Arbeitszufriedenheitstypen: Zukunftsperspektive für das Züricher Modell [FEAT — Questionnaire to evaluate types of job satisfaction: Future prospects of the Zurich Model]. Zeitschrift für Arbeits- und Organisationspsychologie A&O, 53, 177–193. doi:10.1026/0932-4089.53.4.177
Fischer, L. & Lück, H. (1972). Entwicklung einer Skala zur Messung von Arbeitszufriedenheit (SAZ) [Development of a scale for the assessment of job satisfaction (SAZ)]. Psychologie und Praxis, 16, 63–76.
Fisher, C. D. (2010). Happiness at work. International Journal of Management Reviews, 12, 384–412. doi:10.1111/j.1468-2370.2009
Fisher, G. G., Matthews, R. A., & Gibbons, A. M. (2015). Developing and investigating the use of single-item measures in organizational research. Journal of Occupational Health Psychology, 21, 3–23. doi:10.1037/a0039139
Fisher, R. A. (1915). Frequency distribution of the values of the correlation coefficient in samples from an indefinitely large population. Biometrika, 10, 507–521. doi:10.2307/2331838
Foodservice Research Forum. (1997). Industry of choice. Chicago, IL: The Educational Foundation, National Restaurant Association.
Foote, D., & Tang, T. L.-P. (2008). Job satisfaction and organizational citizenship behavior (OCB): Does team commitment make a difference in self-directed teams? Management Decision, 46, 933–947. doi:10.1108/00251740810882680
130

Ford, J. K., MacCallum, R. C., & Tait, M. (1986). The application of exploratory factor analysis in applied psychology: A critical review and analysis. Personnel Psychology, 39, 291–314. doi:10.1111/j.1744-6570.1986.tb00583.x
García-Chas, R., Neira-Fontela, E., & Varela-Neira, C. (2016). High-performance work systems and job satisfaction: A multilevel model. Journal of Managerial Psychology, 31, 451–466. doi:10.1108/JMP-04-2013-0127
Ge, J., Tian, X., & Fu, Q. (2012, October). The mechanism of how transformational leadership impacts on subordinates' voice behavior: A test of basic assumption of affective events theory. Paper presented at the Information Management, Innovation Management and Industrial Engineering (ICIII), Sanya, China.
Geister, S. (2006). Effects of process feedback on motivation, satisfaction, and performance in virtual teams. Small Group Research, 37, 459–489. doi:10.1177/1046496406292337
George, J. (1990). Personality, affect, and behavior in groups. Journal of Applied Psychology, 75, 107–116. doi:10.1037/0021-9010.75.2.107
Gladstein D. (1984). Groups in context: A model of task group effectiveness. Administrative Science Quarterly, 29, 499–517. doi:10.2307/2392936
Glasø, L., Vie, T. L., Holmdal, G. R., & Einarsen, S. (2011). An application of affective events theory to workplace bullying. European Psychologist, 16, 198–208. doi:10.1027/1016-9040/a000026
Gloria, C. T., Faulk, K. E., & Steinhardt, M. A. (2013). Positive affectivity predicts successful and unsuccessful adaptation to stress. Motivation and Emotion, 37, 185–193. doi:10.1007/s11031-012-9291-8
Gómez, C., & Rosen, B. (2001). The leader-member exchange as a link between managerial trust and employee empowerment. Group & Organization Management, 26, 53–69. doi:10.1177/1059601101261004
González-Romá, V., Fortes-Ferreira, L., & Peiró, J. M. (2009). Team climate, climate strength and team performance. A longitudinal study. Journal of Occupational and Organizational Psychology, 82, 511–536. doi:10.1348/096317908X370025
González-Romá, V., & Hernandez, A. (2014). Climate uniformity: Its influence on team communication quality, task conflict, and team performance. Journal of Applied Psychology, 99, 1042–1058. doi:10.1037/a0037868
Grandey, A. A., Tam, A. P., & Brauburger, A. L. (2002). Affective states and traits in the workplace: Diary and survey data from young workers. Motivation and Emotion, 26, 31–55. doi:10.1023/A:1015142124306
Guillaume, Y. R. F., Brodbeck, F. C., & Riketta, M. (2012). Surface- and deep-level dissimilarity effects on social integration and individual effectiveness related outcomes in work groups: A meta-analytic integration. Journal of Occupational and Organizational Psychology, 85, 80–115. doi:10.1111/j.2044-8325.2010.02005
Haarhaus, B. (2015). Entwicklung und Validierung eines Kurzfragebogens zur Erfassung von allgemeiner und facettenspezifischer Arbeitszufriedenheit [Construction and validation of a short Measure to assess general and facet-specific job satisfaction]. Diagnostica, 62, 61–73. doi:10.1026/0012-1924/a000136
Hackman, R. (1987). The design of work teams. In J. W. Lorsch (Ed.), Handbook of Organizational Behavior (pp. 315–342). Englewood Cliffs, NJ: Prentice Hall.
Hackman, R., & Oldham, G. (1974). The job diagnostic survey: An instrument for the diagnosis of jobs and the evaluation of job redesign projects (Tech. Rep. No. 4). New Haven, CT: Yale University, Department of Administrative Sciences.
131

Hackman, R., & Oldham, G. (1975). Development of the Job Diagnostic Survey. Journal of Applied Psychology, 60, 159–170. doi:10.1037/h0076546
Hackman, R., & Oldham, G. (1980). Work redesign. Reading, MA: Addison-Wesley. Haines, V. Y., Harvey, S., Durand, P., & Marchand, A. (2013). Core self-evaluations, work-
family conflict, and burnout. Journal of Marriage and Family, 75, 778–793. doi:10.1111/jomf.12026
Harris, K. J., Harvey, P., & Kacmar, K. M. (2009). Do social stressors impact everyone equally? An examination of the moderating impact of core self-evaluations. Journal of Business and Psychology, 24, 153–164. doi:10.1007/sl0869-009-9096-2
Harrison, D. A., & Klein, K. (2007). What's the difference? Diversity constructs as separation, variety, or disparity in organizations. Academy of Management Review, 32, 1199–1228. doi:10.5465/AMR.2007.26586096
Harrison, D. A., Price, K. H., & Bell, M. P. (1998). Beyond relational demography: Time and the effects of surface- and deep-level diversity on work group cohesion. Academy of Management Journal, 41, 96–107. doi:10.2307/256901
Harrison, D. A., Price, K. H., Gavin, J. H., & Florey, A. T. (2002). Time, teams, and task performance: Changing effects of surface- and deep-level diversity on group functioning. Academy of Management Journal, 45, 1029–1045. doi:10.2307/3069328
Harter, J. K., Schmidt, F. L., & Hayes, T. L. (2002). Business-unit-level relationship between employee satisfaction, employee engagement, and business outcomes: A meta-analysis. Journal of Applied Psychology, 87, 268–279. doi:10.1037//0021-9010.87.2.268
Hatfield, E., Cacioppo, J. T., & Rapson, R. L. (1994). Emotional contagion. Cambridge, England: Cambridge University Press.
Hausknecht, J., Hiller, N., & Vance, R. (2008). Work-unit absenteeism: Effects of satisfaction, commitment, labor market conditions, and time. Academy of Management Journal, 51, 1223–1245. doi:10.5465/AMJ.2008.35733022
Haynie, J. J. (2011). Core-self evaluations and team performance: The role of team-member exchange. Small Group Research, 43, 315–329. doi:10.2307/2015992110.2307/20159921
Heider, F. (1958). The psychology of interpersonal relations. New York, NY: John Wiley & Sons. doi:10.2307/2572978
Helm, S. (2013). A matter of reputation and pride: Associations between perceived external reputation, pride in membership, job satisfaction and turnover intentions. British Journal of Management, 24, 542–556. doi:10.1111/j.1467-8551.2012.00827
Heneman III, H. G., & Schwab, D. P. (1985). Pay satisfaction: Its multidimensional nature and measurement. International Journal of Psychology, 20, 129–141. doi:10.1080/00207598508247727
Hentschel, T., Shemla, M., Wegge, J., & Kearney, E. (2013). Perceived diversity and team functioning: The role of diversity beliefs and affect. Small Group Research, 44, 33–61. doi:10.1177/1046496412470725
Herche, J., & Engelland, B. (1996). Reversed-polarity items and scale unidimensionality. Journal of the Academy of Marketing Science, 24, 366–374. doi:10.1177/0092070396244007
Hertel, G., Niedner, S., & Herrmann, S. (2003). Motivation of software developers in open source projects: An internet-based survey of contributors to the Linux kernel. Research Policy, 32, 1159–1177. doi:10.1016/S0048-7333(03)00047-7
132

Hinton, M., & Biderman, M. (1995). Empirically derived job characteristics measures and the motivating potential score. Journal of Business and Psychology, 9, 355–364. doi:10.1007/BF02230975
Hirschfeld, R. R., Cole, M. S., Bernerth, J. B., & Rizzuto, T. E. (2013). Voluntary survey completion among team members: Implications of noncompliance and missing data for multilevel research. Journal of Applied Psychology, 98, 454–468. doi:10.1037/a0031909
Hitlan, R. T., Cliffton, R. J., & DeSoto, M. C. (2006). Perceived exclusion in the workplace: The moderating effects of gender on work-related attitudes and psychological health. North American Journal of Psychology, 8, 217–236.
Hobfoll, S. E. (1989). Conservation of resources: A new attempt at conceptualizing stress. American Psychologist, 44, 513–524. doi:10.1037/0003-066X.44.3.513
Hoerger, M. (2010). Participant dropout as a function of survey length in internet-mediated university studies: Implications for study design and voluntary participation in psychological research. Cyberpsychology, Behavior, and Social Networking, 13, 697–700. doi:10.1089/cyber.2009.0445
Hogg, M. A., & Terry, D. J. (2000). Social identity and self-categorization processes in organizational contexts. Academy of Management Review, 25, 121–140. doi:10.5465/AMR.2000.2791606
Hoigaard, R. (2006). The relationship between group cohesion, group norms, and perceived social loafing in soccer teams. Small Group Research, 37, 217–232. doi:10.1177/1046496406287311
Hollenbeck, J. R., Beersma, B., & Schouten, M. E. (2012). Beyond team types and taxonomies: A dimensional scaling conceptualization for team description. Academy of Management Review, 37, 82–106. doi:10.5465/amr.2010.0181
Hooper, D., Coughlan, J., & Mullen, M. R. (2008). Structural equation modelling: Guidelines for determining model fit. Electronic Journal of Business Research Methods, 6, 53–60. doi:10.1016/j.paid.2006.09.018
Hooper, D. T., & Martin, R. (2008). Beyond personal leader-member exchange (LMX) quality: The effects of perceived LMX variability on employee reactions. The Leadership Quarterly, 19, 20–30. doi:10.1016/j.leaqua.2007.12.002
Hoppock, R. (1935). Job satisfaction. Oxford, England: Harper. Horn, J. L. (1965). A rationale and test for the number of factors in factor analysis.
Psychometrika, 30, 179–185. doi:10.1007/BF02289447 Hu, L., & Bentler, P. M. (1999). Cutoff criteria for fit indexes in covariance structure
analysis: Conventional criteria versus new alternatives. Structural Equation Modeling: A Multidisciplinary Journal, 6, 1–55. doi:10.1080/10705519909540118
Humphrey, S. E., & Aime, F. (2014). Team microdynamics: Toward an organizing approach to teamwork. The Academy of Management Annals, 8, 443–503. doi:10.1080/19416520.2014.904140
Humphrey, S. E., Morgeson, F. P., & Mannor, M. J. (2009). Developing a theory of the strategic core of teams: A role composition model of team performance. Journal of Applied Psychology, 94, 48–61. doi:10.1037/a0012997
Iacobucci, D. (2009). Everything you always wanted to know about SEM (structural equations modeling) but were afraid to ask. Journal of Consumer Psychology, 19, 673–680. doi:10.1016/j.jcps.2009.09.002
133

Ilgen, D. R., Hollenbeck, J. R., Johnson, M., & Jundt, D. (2005). Teams in organizations: From input-process-output models to IMOI models. Annual Review of Psychology, 56, 517–543. doi:10.1146/annurev.psych.56.091103.070250
Ilies, R., Fulmer, I. S., Spitzmuller, M., & Johnson, M. D. (2009). Personality and citizenship behavior: The mediating role of job satisfaction. Journal of Applied Psychology, 94, 945–959. doi:10.1037/a0013329
Ironson, G. H., Smith, P. C., Brannick, M. T., Gibson, W. M., & Paul, K. B. (1989). Construction of a job in general scale: A comparison of global, composite, and specific measures. Journal of Applied Psychology, 74, 193–200. doi:10.1037/0021-9010.74.2.193
James, L. R. (1982). Aggregation bias in estimates of perceptual agreement. Journal of Applied Psychology, 67, 219–229. doi:10.1037/0021-9010.67.2.219
James, L. R., Demaree, R. G., & Wolf, G. (1984). Estimating within-group interrater reliability with and without response bias. Journal of Applied Psychology, 69, 85–98. doi:10.1037/0021-9010.69.1.85
James, L. R., Demaree, R. G., & Wolf, G. (1993). rwg: An assessment of within-group interrater agreement. Journal of Applied Psychology, 78, 306–309. doi:10.1037//0021-9010.78.2.306
Jinnett, K., & Alexander, J. (1999). The influence of organizational context on quitting intention: An examination of treatment staff in long-term mental health care settings. Research on Aging, 21, 176–204. doi:10.1177/0164027599212003
Judge, T. A., & Bono, J. E. (2001). Relationship of core self-evaluations traits — self-esteem, generalized self-efficacy, locus of control, and emotional stability — with job satisfaction and job performance: A meta-analysis. Journal of Applied Psychology, 86, 80–92. doi:10.1037//0021-9010.86.1.80
Judge, T. A., Bono, J. E., & Locke, E. A. (2000). Personality and job satisfaction: The mediating role of job characteristics. Journal of Applied Psychology, 85, 237–249. doi:10.1037//0021-9010.85.2.237
Judge, T. A., Erez, A., Bono, J., & Thoresen, C. (2003). The core self-evaluations scale: Development of a measure. Personnel Psychology, 56, 303–331. doi:10.1111/j.1744-6570.2003.tb00152.x
Judge, T. A., Hulin, C. L., & Dalal, R. S. (2012). Job satisfaction and job affect. In S. W. Kozlowski (Ed.), The Oxford handbook of organizational psychology (pp. 496–525). Oxford, England: Oxford University Press.
Judge, T. A., & Kammeyer-Mueller, J. D. (2012). Job attitudes. Annual Review of Psychology, 63, 341–367. doi:10.1146/annurev-psych-120710-100511
Judge, T. A., Locke, E., Durham, C., & Kluger, A. (1998). Dispositional effects on job and life satisfaction: The role of core evaluations. Journal of Applied Psychology, 83, 17–34. doi:10.1037/0021-9010.83.1.17
Judge, T. A., Locke, E. A., & Durham, C. C. (1997). The dispositional causes of job satisfaction: A core evaluations approach. Research in Organizational Behavior, 19, 151–188. doi:10.1016/j.sbspro.2015.04.917
Judge, T. A., Piccolo, R., Podsakoff, N., Shaw, J., & Rich, B. (2010). The relationship between pay and job satisfaction: A meta-analysis of the literature. Journal of Vocational Behavior, 77, 157–167. doi:10.1016/j.jvb.2010.04.002
Judge, T. A., Thoresen, C., Bono, J., & Patton, G. (2001). The job satisfaction-job performance relationship: A qualitative and quantitative review. Psychological Bulletin, 127, 376–407. doi:10.1037//0033-2909
134

Judge, T. A., & Watanabe, S. (1993). Another look at the job satisfaction-life satisfaction relationship. Journal of Applied Psychology, 78, 939–948. doi:10.1002/job.4030080109
Judge, T. A., Weiss, H. M., Kammeyer-Mueller, J. D., & Hulin, C. L. (2017). Job attitudes, job satisfaction, and job affect: A century of continuity and of change. Journal of Applied Psychology. Advance online publication. doi:10.1037/apl0000181
Kafetsios, K., & Zampetakis, L. A. (2008). Emotional intelligence and job satisfaction: Testing the mediatory role of positive and negative affect at work. Personality and Individual Differences, 44, 712–722. doi:10.1016/j.paid.2007.10.004
Kaiser, H. F. (1960). The application of electronic computers to factor analysis. Educational and Psychological Measurement, 20, 141–151. doi:10.1177/001316446002000116
Karatepe, O. M. (2011). Core self-evaluations, exhaustion, and job outcomes: A study of frontline hotel employees in Iran. Tourism and Hospitality Research, 11, 248–257. doi:10.1177/1467358411418898
Katzenbach, J. R., & Smith, D. K. (1993). The wisdom of teams: Creating the high-performance organization. Boston, MA: Harvard Business School Press. doi:10.1225/3670
Katzenbach, J. R., & Smith, D. K. (2005). The discipline of teams. Harvard Business Review, 83, 162–171. doi:10.1225/93207
Kelly, J., & Barsade, S. G. (2001). Mood and emotions in small groups and work teams. Organizational Behavior and Human Decision Processes, 86, 99–130. doi:10.2307/2393638
Kesting, M., Stumpp, T., Hülsheger, U. R., & Maier, G. W. (2006, September). Zentrale Selbstbewertungen: Validierung eines Messinstrumentes [Core self-evaluations: Validation of a measuring instrument]. Paper presented at the 45. Conference of the German Psychological Society — DGPs, Nürnberg, Germany.
Kidwell, R. E., Mossholder, K. W., & Bennett, N. (1997). Cohesiveness and organizational citizenship behavior: A multilevel analysis using work groups and individuals. Journal of Management, 23, 775–793. doi:10.1177/014920639702300605
Kimberly, J. R. (2011). The relationship between job satisfaction of primary care team members and quality of care: A comment on Mohr et al. American Journal of Medical Quality, 26, 8–9. doi:10.1177/1062860610387235
Kinicki, A. J., McKee-Ryan, F. M., Schriesheim, C. A., & Carson, K. P. (2002). Assessing the construct validity of the Job Descriptive Index: A review and meta-analysis. Journal of Applied Psychology, 87, 14–32. doi:10.1037//0021-9010.87.1.14
Kirkman, B. L., & Rosen, B. (1999). Beyond self-management: Antecedents and consequences of team empowerment. Academy of Management Journal, 42, 58–74. doi:10.2307/256874
Kirkman, B. L., Rosen, B., Tesluk, P. E., & Gibson, C. B. (2006). Enhancing the transfer of computer-assisted training proficiency in geographically distributed teams. Journal of Applied Psychology, 91, 706–716. doi:10.1037/0021-9010.91.3.706
Klein, C., DiazGranados, D., Salas, E., Le, H., Burke, C. S., Lyons, R., & Goodwin, G. F. (2009). Does team building work? Small Group Research, 40, 181–222. doi:10.1177/1046496408328821
Klein, K., Conn, A. B., Smith, D. B., & Sorra, J. S. (2001). Is everyone in agreement? An exploration of within-group agreement in employee perceptions of the work environment. Journal of Applied Psychology, 86, 3–16. doi:10.1037//0021-9010.86.1.3
135
Klein, K., & Kozlowski, S. (2000a). From micro to meso: Critical steps in conceptualizing and conducting multilevel research. Organizational Research Methods, 3, 211–236. doi:10.1177/109442810033001
Klein, K., & Kozlowski, S. (2000b). A multilevel approach to theory and research in organizations: Contextual, temporal, and emergent processes. In K. Klein & S. Kozlowski (Eds.), Multilevel theory, research, and methods in organizations: Foundations, extensions, and new directions (pp. 3–90). San Francisco, CA: Jossey-Bass.
Klep, A., Wisse, B., & van der Flier, H. (2011). Interactive affective sharing versus non-interactive affective sharing in work groups: Comparative effects of group affect on work group performance and dynamics. European Journal of Social Psychology, 41, 312–323. doi:10.1002/ejsp.775
Kline, R. (2011). Principles and Practice of Structural Equation Modeling. New York, NY: The Guilford Press.
Knight, A. P., & Eisenkraft, N. (2015). Positive is usually good, negative is not always bad: The effects of group affect on social integration and task performance. Journal of Applied Psychology, 100, 1214–1227. doi:10.1037/apl0000006
Knowles, E. S. (1988). Item context effects on personality scales: Measuring changes the measure. Journal of Personality and Social Psychology, 55, 312–320. doi:10.1037/0022-3514.55.2.312
Kouchaki, M., & Wareham, J. (2015). Excluded and behaving unethically: Social exclusion, physiological responses, and unethical behavior. Journal of Applied Psychology, 100, 547–556. doi:10.1037/a0038034
Koys, D. (2001). The effects of employee satisfaction, organizational citizenship behavior, and turnover on organizational effectiveness: A unit-level, longitudinal study. Personnel Psychology, 54, 101–114. doi:10.1111/j.1744-6570.2001.tb00087.x
Kozlowski, S., & Bell, B. S. (2003). Work groups and teams in organizations. In W. Borman, D. Ilgen & R. Klimoski (Eds.), Handbook of Psychology Volume 12: Industrial and Organizational Psychology (pp. 333–375). New York, NY: Wiley-Blackwell. doi:10.1002/0471264385.wei1214
Kozlowski, S., Chao, G. T., Grand, J. A., Braun, M. T., & Kuljanin, G. (2013). Advancing multilevel research design: Capturing the dynamics of emergence. Organizational Research Methods, 16, 581–615. doi:10.1177/1094428113493119
Kristof-Brown, A., Barrick, M. R., & Stevens, C. K. (2005). When opposites attract: A multi-sample demonstration of complementary person-team fit on extraversion. Journal of Personality, 73, 935–957. doi:10.1111/j.1467-6494.2005.00334.x
Krohne, H. W., Egloff, B., Kohlmann, C.-W., & Tausch, A. (1996). Untersuchungen mit einer deutschen Version der „Positive and Negative Affect Schedule“ (PANAS) [Investigations with a German Version of the Positive and Negative Affect Schedule (PANAS)]. Diagnostica, 42, 139–156.
Kunin, T. (1955). The construction of a new type of attitude measure. Personnel Psychology, 8, 65–77. doi:10.1111/j.1744-6570.1955.tb01189.x
Lam, S. S. K., Yik, M. S. M., & Schaubroeck, J. (2002). Responses to formal performance appraisal feedback: The role of negative affectivity. Journal of Applied Psychology, 87, 192–201. doi:10.1037/0021-9010.87.1.192
Landy, F. J. (1989). Psychology of work behavior. Belmont, CA: Thomson Brooks/Cole Publishing.
136

Latané, B. (1996). Dynamic social impact: The creation of culture by communication. Journal of Communication, 46(4), 13–25. doi:10.1111/j.1460-2466.1996.tb01501.x
Lau, D. C., & Murnighan, J. K. (2005). Interactions within groups and subgroups: The effects of demographic faultlines. Academy of Management Journal, 48, 645–659. doi:10.5465/AMJ.2005.17843943
Lautsch, B. A., & Kossek, E. E. (2011). Managing a blended workforce. Organizational Dynamics, 40, 10–17. doi:10.1016/j.orgdyn.2010.10.005
Lautsch, B. A., Kossek, E. E., & Eaton, S. C. (2009). Supervisory approaches and paradoxes in managing telecommuting implementation. Human Relations, 62, 795–827. doi:10.1177/0018726709104543
LeBreton, J. M., Burgess, J. R. D., Kaiser, R. B., Atchley, E. K., & James, L. R. (2003). The restriction of variance hypothesis and interrater reliability and agreement: Are ratings from multiple sources really dissimilar? Organizational Research Methods, 6, 80–128. doi:10.1177/1094428102239427
LeBreton, J. M., & Senter, J. L. (2008). Answers to 20 questions about interrater reliability and interrater agreement. Organizational Research Methods, 11, 815–852. doi:10.1177/1094428106296642
Lemelle, C. J., & Scielzo, S. A. (2012). How you feel about yourself can affect how you feel about your job: A meta-analysis examining the relationship of core self-evaluations and job satisfaction. Journal of Business Diversity, 12, 116–133.
LePine, J. A., Piccolo, R. F., Jackson, C. L., Mathieu, J. E., & Saul, J. R. (2008). A meta-analysis of teamwork processes: Tests of a multidimensional model and relationships with team effectiveness criteria. Personnel Psychology, 61, 273–307. doi:10.1111/j.1744-6570.2008.00114.x
Lester, S., Meglino, B., & Korsgaard, A. (2002). The antecedents and consequences of group potency: a longitudinal investigation of newly formed groups. Academy of Management Journal, 45, 352–368. doi:10.2307/3069351
Levy, P. E., & Williams, J. R. (2004). The social context of performance appraisal: A review and framework for the future. Journal of Management, 30, 881–905. doi:10.1016/j.jm.2004.06.005
Li, F., Li, Y., & Wang, E. (2009). Task characteristics and team performance: The mediating effect of team member satisfaction. Social Behavior and Personality: an international journal, 37, 1373–1382. doi:10.2224/sbp.2009.37.10.1373
Lindsley, D., Brass, D., & Thomas, J. (1995). Efficacy-performance spirals: A multilevel perspective. Academy of Management Review, 20, 645–678. doi:10.5465/AMR.1995.9508080333
Liu, D., Mitchell, T. R., Lee, T. W., Holtom, B. C., & Hinkin, T. R. (2012). When employees are out of step with coworkers: How job satisfaction trajectory and dispersion influence individual- and unit-level voluntary turnover. Academy of Management Journal, 55, 1360–1380. doi:10.5465/amj.2010.0920
Locke, E. A. (1969). What is job satisfaction? Organizational Behavior and Human Performance, 4, 309–336. doi:10.1016/0030-5073(69)90013-0
Lussier, R. N. (1990). Human relations in organizations: A skill-building approach. Burr Ridge, IL: Irwin Professional Publishing.
MacCallum, R. C., Roznowski, M., & Necowitz, L. B. (1992). Model modifications in covariance structure analysis: The problem of capitalization on chance. Psychological Bulletin, 111, 490–504. doi:10.1037//0033-2909.111.3.490
137

Maloney, M. M., Johnson, S. G., & Zellmer-Bruhn, M. E. (2010). Assessing group-level constructs under missing data conditions: A monte carlo simulation. Small Group Research, 41, 281–307. doi:10.1177/1046496410363829
Marks, M., Mathieu, J., & Zaccaro, S. (2001). A temporally based framework and taxonomy of team processes. Academy of Management Review, 26, 356–376. doi:10.5465/AMR.2001.4845785
Marques Santos, C., & Margarida Passos, A. (2013). Team mental models, relationship conflict and effectiveness over time. Team Performance Management: An International Journal, 19, 363–385. doi:10.1108/TPM-01-2013-0003
Maslow, A. (1943). A theory of human motivation. Psychological Review, 50, 370–396. doi:10.1037/h0054634
Mason, C. M. (2006). Exploring the processes underlying within-group homogeneity. Small Group Research, 37, 233–270. doi:10.1177/1046496406288972
Mason, C. M., & Griffin, M. A. (2005). Group task satisfaction: The group's shared attitude to its task and work environment. Group Organization Management, 30, 625–652. doi:10.1177/1059601104269522
Mathieu, J., Maynard, Rapp, T., & Gilson, L. (2008). Team effectiveness 1997–2007: A review of recent advancements and a glimpse into the future. Journal of Management, 34, 410–476. doi:10.1177/0149206308316061
Mathieu, J. , Tannenbaum, S. I., Donsbach, J. S., & Alliger, G. M. (2014). A review and integration of team composition models: Moving toward a dynamic and temporal framework. Journal of Management, 40, 130–160. doi:10.1177/0149206313503014
Matz, D. C., & Wood, W. (2005). Cognitive dissonance in groups: The consequences of disagreement. Journal of Personality and Social Psychology, 88, 22–37. doi:10.1037/0022-3514.88.1.22
Mayer, B., & Dale, K. (2010). The impact of group cognitive complexity on group satisfaction: A person-environment fit perspective. Journal of Behavioral and Applied Management, 12, 24–47.
Meeusen, V., van Dam, K., van Zundert, A., & Knape, J. (2010). Job satisfaction amongst Dutch nurse anaesthetists: The influence of emotions on events. International Nursing Review, 57, 85–91. doi:10.1111/j.1466-7657.2009.00763.x
Mesmer-Magnus, J., & Dechurch, L. (2009). Information sharing and team performance: a meta-analysis. Journal of Applied Psychology, 94, 535–546. doi:10.1037/a0013773
Meyer, B., Schermuly, C. C., & Kauffeld, S. (2015). That’s not my place: The interacting effects of faultlines, subgroup size, and social competence on social loafing behaviour in work groups. European Journal of Work and Organizational Psychology, 25, 31–49. doi:10.1080/1359432X.2014.996554
Mignonac, K., & Herrbach, O. (2004). Linking work events, affective states, and attitudes: An empirical study of managers' emotions. Journal of Business and Psychology, 19, 221–240. doi:10.1007/s10869-004-0549-3
Mitchell, T. R. (1974). Expectancy models of job satisfaction, occupational preference and effort: A theoretical, methodological, and empirical appraisal. Psychological Bulletin, 81, 1053–1077. doi:10.1111/bjet.12220
Mohammed, S., Ferzandi, L., & Hamilton, K. (2010). Metaphor no more: A 15-year review of the team mental model construct. Journal of Management, 36, 876–910. doi:10.1177/0149206309356804
138

Mohammed, S., Klimoski, R., & Rentsch, J. R. (2000). The measurement of team mental models: We have no shared schema. Organizational Research Methods, 3, 123–165. doi:10.1177/109442810032001
Mohr, D., Young, G., Meterko, M., Stolzmann, K., & White, B. (2011). Job satisfaction of primary care team members and quality of care. American Journal of Medical Quality and Quantity, 26, 18–25. doi:10.1177/1062860610373378
Moon, H., Hollenbeck, J. R., Humphrey, S. E., Ilgen, D. R., West, B., Ellis, A. P. J., . . . Ellis, A. P. J. (2004). Asymmetric adaptability: Dynamic team structures as one-way streets. Academy of Management Review, 47, 681–695. doi:10.2307/20159611
Morgeson, F. P., & Hofmann, D. A. (1999). The structure and function of collective constructs: Implications for multilevel research and theory development. Academy of Management Review, 24, 249–265. doi:10.5465/AMR.1999.1893935
Morrison, E. W. (2011). Employee voice behavior: Integration and directions for future research. Academy of Management Annals, 5, 373–412. doi:10.1080/19416520.2011.574506
Mortensen, M., & Hinds, P. (2002). Fuzzy teams: Boundary disagreement in distributed and collocated teams. In P. Hinds & S. Kiesler (Eds.), Distributed work (pp. 283–308). Cambridge, MA: The MIT Press.
Mount, M., Illies, R., & Johnson, E. (2006). Relationship of personality traits and counterproductive work behaviors: The mediating effects of job satisfaction. Personnel Psychology, 59, 591–622. doi:10.1111/j.1744-6570.2006.00048.x
Mussweiler, T., Ruter, K., & Epstude, K. (2004). The ups and downs of social comparison: Mechanisms of assimilation and contrast. Journal of Personality and Social Psychology, 87, 832–844. doi:10.1037/0022-3514.87.6.832
Naus, F., van Iterson, A., & Roe, R. (2007). Organizational cynicism: Extending the exit, voice, loyalty, and neglect model of employees' responses to adverse conditions in the workplace. Human Relations, 60, 683–718. doi:10.1177/0018726707079198
Nesterkin, D. A., & Ganster, D. C. (2015). The effects of nonresponse rates on group-level correlations. Journal of Management, 41, 789–807. doi:10.1177/0149206311433853
Neuberger, O. (1974). Theorien der Arbeitszufriedenheit [Theories of job satisfaction]. Stuttgart: Kohlhammer.
Neuberger, O. (1975). Erfahrungen mit der „Skala zur Messung von Arbeitszufriedenheit (SAZ)“ [Experiences with the scale for the assessment of job satisfaction (SAZ)]. Psychologie und Praxis, 19, 63–72.
Neuberger, O. (1976). Der Arbeitsbeschreibungsbogen: Ein Versuch zur Messung der Arbeitszufriedenheit [The Arbeitsbeschreibungsbogen: An attempt to measure job satisfaction]. Problem und Entscheidung, 1, 1–169.
Neuberger, O., & Allerbeck, M. (1978). Messung und Analyse von Arbeitszufriedenheit: Erfahrungen mit dem „Arbeits-Beschreibungs-Bogen (ABB)“ [Measurement and analysis of job satisfaction: Experiences with the „Arbeits-Beschreibungs-Bogen (ABB)“]. Bern: Hans Huber.
Nguyen, N. T., Seers, A., & Hartman, N. S. (2008). Putting a good face on impression management: Team citizenship and team satisfaction. Journal of Behavioral and Applied Management, 9, 148–168.
Nisbett, R. E., & Wilson, T. D. (1977). The halo effect: Evidence for unconscious alteration of judgments. Journal of Personality and Social Psychology, 35, 250–256. doi:10.1037/0022-3514.35.4.250
139
Nishii, L. H., Lepak, D., P., & Schneider, B. (2008). Employee attributions of the “why” of HR practices: Their effects on employee attitudes and behaviors, and customer satisfaction. Personnel Psychology, 61, 503–545. doi:10.1111/j.1744-6570.2008.00121.x
O'Boyle, E. H., Forsyth, D. R., & O'Boyle, A. S. (2011). Bad apples or bad barrels: An examination of group-and organizational-level effects in the study of counterproductive work behavior. Group & Organization Management, 36, 39–69. doi:10.1177/1059601110390998
O'Leary, M. B., & Mortensen, M. (2010). Go (con)figure: Subgroups, imbalance, and isolates in geographically dispersed teams. Organization Science, 21, 115–131. doi:10.1287/orsc.1090.0434
O'Leary, M. B., Mortensen, M., & Woolley, A. W. (2011). Multiple team membership: A theoretical model of its effects on productivity and learning for individuals and teams. Academy of Management Review, 36, 461–478. doi:10.5465/amr.2009.0275
O’Connor, B. P. (2000). SPSS and SAS programs for determining the number of components using parallel analysis and Velicer’s MAP test. Behavior Research Methods, Instruments, & Computers, 32, 396–402. doi:10.3758/BF03200807
Oshagbemi, T. (1999). Overall job satisfaction: How good are single versus multiple-item measures? Journal of Managerial Psychology, 14, 388–403. doi:10.1108/02683949910277148
Patterson, M., Warr, P., & West, M. (2004). Organizational climate and company productivity: The role of employee affect and employee level. Journal of Occupational and Organizational Psychology, 77, 193–216. doi:10.1348/096317904774202144
Pearce, C. L., & Herbik, P. A. (2004). Citizenship behavior at the team level of analysis: The effects of team leadership, team commitment, perceived team support, and team size. The Journal of Social Psychology, 144, 293–310. doi:10.3200/SOCP.144.3.293-310
Penhaligon, N. L., Louis, W. R., & Restubog, S. L. (2009). Emotional anguish at work: the mediating role of perceived rejection on workgroup mistreatment and affective outcomes. Journal of Occupupational Health Psychology, 14, 34–45. doi:10.1037/a0013288
Phillips, K. W., Northcraft, G. B., & Neale, M. A. (2006). Surface-level diversity and decision-making in groups: When does deep-level similarity help? Group Processes & Intergroup Relations, 9, 467–482. doi:10.1177/1368430206067557
Podsakoff, P. M., Ahearne, M., & MacKenzie, S. B. (1997). Organizational citizenship behavior and the quantity and quality of work group performance. Journal of Applied Psychology, 82, 262–270. doi:10.1037/0021-9010.82.2.262
Podsakoff, P. M., MacKenzie, S. B., Lee, J. Y., & Podsakoff, N. P. (2003). Common method biases in behavioral research: A critical review of the literature and recommended remedies. Journal of Applied Psychology, 88, 879–903. doi:10.1037/0021-9010.88.5.879
Polzer, J. T., Crisp, C. B., Jarvenpaa, S. L., & Kim, J. W. (2006). Extending the faultline model to geographically dispersed teams: How colocated subgroups can impair group functioning. Academy of Management Journal, 49, 679–692. doi:10.5465/AMJ.2006.22083024
Porter, L. (1961). A study of perceived need satisfaction, in bottom and middle management jobs. Journal of Applied Psychology, 45, 1–10. doi:10.1037/h0043121
140

Porter, L. (1962). Job attitudes in management: I. Perceived deficiencies in need fulfillment as a function of job level. Journal of Applied Psychology, 46, 375–384. doi:10.1037/h0047808
Preston, C. C., & Colman, A. M. (2000). Optimal number of response categories in rating scales: reliability, validity, discriminating power, and respondent preferences. Acta Psychologica, 104, 1–15. doi:10.1016/S0001-6918(99)00050-5
Quinn, R. P., & Mangione, T. W. (1973). Evaluating weighted models of measuring job satisfaction: A Cinderella story. Organizational Behavior and Human Performance, 10, 1–23. doi:10.1016/0030-5073(73)90002-0
Quinn, R. P., & Staines, G. (1984). The 1977 quality of employment survey. University of Michigan, Institute for Social Research. doi:10.3886/ICPSR07689.v1
Rasmussen, T., & Jeppesen, H. J. (2006). Teamwork and associated psychological factors: A review. Work & Stress, 20, 105–128. doi:10.1080/02678370600920262
Rentsch, J. R., & Klimoski, R. J. (2001). Why do ‘great minds’ think alike? Antecedents of team member schema agreement. Journal of Organizational Behavior, 22, 107–120. doi:10.1002/job.81
Riketta, M. (2002). Attitudinal organizational commitment and job performance: A meta-analysis. Journal of Organizational Behavior, 23, 257–266. doi:10.1002/job.141
Riketta, M. (2008). The causal relation between job attitudes and performance: A meta-analysis of panel studies. Journal of Applied Psychology, 93, 472–481. doi:10.1037/0021-9010.93.2.472
Roberson, Q. M., & Colquitt, J. A. (2005). Shared and configural justice: A social network model of justice in teams. Academy of Management Review, 30, 595–607. doi:10.5465/AMR.2005.17293715
Rockmann, K. W., & Northcraft, G. B. (2010). Expecting the worst? The dynamic role of competitive expectations in team member satisfaction and team performance. Small Group Research, 41, 308–329. doi:10.1177/1046496410363744
Rodríguez-Escudero, A. I., Carbonell, P., & Munuera-Aleman, J. L. (2010). Positive and negative effects of team stressors on job satisfaction and new product performance. Journal of Product Innovation Management, 27, 856–868. doi:10.1111/j.1540-5885.2010.00756.x
Roedenbeck, M. R. H. (2008). Theoretische Grundlagen eines komplexen Modells der Arbeitszufriedenheit (KM) [Theoretical foundations of a complex model of job satisfaction (KM)]. Journal für Psychologie, 16, 1–19.
Rogelberg, S. G., Allen, J. A., Shanock, L., Scott, C., & Shuffler, M. (2010). Employee satisfaction with meetings: A contemporary facet of job satisfaction. Human Resource Management, 49, 149–172. doi:10.1002/hrm.20339
Rogelberg, S. G., Luong, A., Sederburg, M. E., & Cristol, D. S. (2000). Employee attitudes surveys: Examining the attitudes of noncompliant employees. Journal of Applied Psychology, 85, 284–293. doi:10.1037//0021-9010.85.2.284
Rosenfeld, L. B. & Gilbert, J.R. (1989). The measurement of cohesion and its relationship to dimensions of self-disclosure in classroom settings. Small Group Behavior, 20, 291–301. doi:10.1177/104649648902000301
Rosseel, Y. (2012). lavaan: An R package for structural equation modeling. Journal of Statistical Software, 48(2), 1–36. doi:10.18637/jss.v048.i02
Rozell, E. J., & Scroggins, W. A. (2010). How much is too much? The role of emotional intelligence in self-managed work team satisfaction and group processes. Team Performance Management, 16, 33–49. doi:10.1108/13527591011028915
141

Ruffle, B. J., & Sosis, R. (2006). Cooperation and the in-group-out-group bias: A field test on Israeli kibbutz members and city residents. Journal of Economic Behavior & Organization, 60, 147–163. doi:10.1016/j.jebo.2004.07.007
Russell, S. S., Spitzmüller, C., Lin, L. F., Stanton, J. M., Smith, P. C., & Ironson, G. H. (2004). Shorter can also be better: The abridged job in general scale. Educational and Psychological Measurement, 64, 878–893. doi:10.1177/0013164404264841
Ryan, A. M., Schmit, M. J., & Johnson, R. (1996). Attitudes and effectiveness: Examining relations at an organizational level. Personnel Psychology, 49, 853–882. doi:10.1111/j.1744-6570.1996.tb02452.x
Saari, L. M., & Judge, T. A. (2004). Employee attitudes and job satisfaction. Human Resource Management, 43, 395–407. doi:10.1002/hrm.20032
Salancik, G. R., & Pfeffer, J. (1978). A social information processing approach to job attitudes and task design. Administrative Science Quarterly, 23, 224–253. doi:10.2307/2392563
Salas, E., DiazGranados, D., Klein, C., Burke, C. S., Stagl, K. C., Goodwin, G. F., & Halpin, S. M. (2008). Does team training improve team performance? A meta-analysis. Human Factors: The Journal of the Human Factors and Ergonomics Society, 50, 903–933. doi:10.1518/001872008X375009
Sanders, K., & Nauta, A. (2004). Social cohesiveness and absenteeism: The relationship between characteristics of employees and short-term absenteeism within an organization. Small Group Research, 35, 724–741. doi:10.1177/1046496404267186
Satorra, A., & Bentler, P. M. (1994). Corrections to test statistics and standard errors in covariance structure analysis. In A. von Eye & C. C. Clogg (Eds.), Latent variables analysis: Applications for developmental research. (pp. 399–419). Thousand Oaks, CA: Sage.
Satorra, A., & Bentler, P. M. (2001). A scaled difference chi-square test statistic for moment structure analysis. Psychometrika, 66, 507–514. doi:10.1007/BF02296192
Schmidt, K.-H., & Kleinbeck, U. (1999). Job Diagnostic Survey (JDS - deutsche Fassung). In H. Dunckel (Ed.), Handbuch psychologischer Arbeitsanalyseverfahren. Schriftenreihe Mensch-Technik-Organisation, Band 14 [Handbook of psychological work analysis methods. Publication series people-technology-organization, Vol. 14] (pp. 205–230). Zürich: vdf Hochschulverlag AG.
Schneider, B., Ashworth, S. D., Higgs, A. C., & Carr, L. (1996). Design, validity, and use of strategically focused employee attitude surveys. Personnel Psychology, 49, 695–705. doi:10.1111/j.1744-6570.1996.tb01591.x
Schneider, B., Goldstein, H., & Smith, B. (1995). The ASA framework: An update. Personnel Psychology, 48, 747–773. doi:10.1111/j.1744-6570.1995.tb01780.x
Schriesheim, C. A., Castro, S. L., & Cogliser, C. C. (1999). Leader-member exchange (LMX) research: A comprehensive review of theory, measurement, and data-analytic practices. The Leadership Quarterly, 10, 63–113. doi:10.1016/S1048-9843(99)80009-5
Scott, D., Bishop, J. W., & Chen, X. (2003). An examination of the relationship of employee involvement with job satisfaction, employee cooperation, and intention to quit in US invested enterprise in China. International Journal of Organizational Analysis, 11, 3–19. doi:10.1108/eb028960
Shaw, J. D., Duffy, M. K., Mitra, A., Lockhart, D. E., & Bowler, M. (2003). Reactions to merit pay increases: A longitudinal test of a signal sensitivity perspective. Journal of Applied Psychology, 88, 538–544. doi:10.1037/0021-9010.88.3.538
142

Shemla, M., Meyer, B., Greer, L., & Jehn, K. A. (2014). A review of perceived diversity in teams: Does how members perceive their team's composition affect team processes and outcomes? Journal of Organizational Behavior, 37, 89–106. doi:10.1002/job.1957
Shipton, H. J., West, M., Parkes, C. L., Dawson, J. F., & Patterson, M. G. (2006). When promoting positive feelings pays: Aggregate job satisfaction, work design features, and innovation in manufacturing organizations. European Journal of Work and Organizational Psychology, 15, 404–430. doi:10.1080/13594320600908153
Siders, M. A., George, G., & Dharwadkar, R. (2001). The relationship of internal and external commitment foci to objective job performance measures. Academy of Management Journal, 44, 570–579. doi:10.2307/3069371
Smith, J. B., & Barclay, D. W. (1997). The effects of organizational differences and trust on the effectiveness of selling partner relationships. The Journal of Marketing, 61, 3–21. doi:10.2307/1252186
Smith, P., Kendall, L., & Hulin, C. (1969). The measurement of satisfaction in work and retirement: A strategy for the study of attitudes. Chicago, IL: Rand McNally.
Sobel, M. E. (1982). Asymptotic confidence intervals for indirect effects in structural equation models. Sociological Methodology, 13, 290–312.
Spector, P. E. (1985). Measurement of human service staff satisfaction: Development of the Job Satisfaction Survey. American Journal of Community Psychology, 13, 693–713. doi:10.1007/BF00929796
Spector, P. E. (1992). Summated rating scale construction: An introduction (Sage university paper series on quantitative applications in the social sciences, series no. 07–082). Newbury Park, CA: Sage. doi:10.4135/9781412986038
Spector, P. E. (1997). Job satisfaction — Appliation, assessment, cause and consequences. Thousand Oaks, CA: Sage. doi:10.4135/9781452231549
Spink, K. S. (2005). Using a multilevel approach to examine the relationship between task cohesion and team task satisfaction in elite ice hockey players. Small Group Research, 36, 539–554. doi:10.1177/1046496405275229
Srivastava, A., Locke, E. A., Judge, T. A., & Adams, J. W. (2010). Core self-evaluations as causes of satisfaction: The mediating role of seeking task complexity. Journal of Vocational Behavior, 77, 255–265. doi:10.1016/j.jvb.2010.04.008
Standifer, R. L., Raes, A. M. L., Peus, C., Passos, A. M., Santos, C. M., & Weisweiler, S. (2015). Time in teams: Cognitions, conflict and team satisfaction. Journal of Managerial Psychology, 30, 692–708. doi:10.1108/JMP-09-2012-0278
Stanley, D. J., Allen, N. J., Williams, H. M., & Ross, S. J. (2011). Examining workgroup diversity effects: Does playing by the (group-retention) rules help or hinder? Behavioral Research Methods, 43, 508–521. doi:10.3758/s13428-010-0053-9
Stanton, J. M., Sinar, E. F., Balzer, W. K., Julian, A. L., Thoresen, P., Aziz, S., . . . Smith, P. C. (2001). Development of a compact measure of job satisfaction: The abridged Job Descriptive Index. Educational and Psychological Measurement, 62, 173–191. doi:10.1177/001316440206200112
Staples, D. S., & Higgins, C. A. (1998). A study of the impact of factor importance weightings on job satisfaction measures. Journal of Business and Psychology, 13, 211–232. doi:10.1023/A:1022907023046
Staples, D. S., & Webster, J. (2008). Exploring the effects of trust, task interdependence and virtualness on knowledge sharing in teams. Information Systems Journal, 18, 617–640. doi:10.1111/j.1365-2575.2007
143

Stark, E., & Bierly, P. (2009). An analysis of predictors of team satisfaction in product development teams with differing levels of virtualness. R & D Management, 39, 461–472. doi:10.1111/j.1467-9310.2009.00571.x
Staw, B. M., Bell, N. E., & Clausen, J. A. (1986). The dispositional approach to job attitudes: A lifetime longitudinal test. Administrative Science Quarterly, 33, 56–77. doi:10.2307/2392766
Staw, B. M., & Ross, J. (1985). Stability in the midst of change: A dispositional approach to job attitudes. Journal of Applied Psychology, 70, 469–480. doi:10.1037/0021-9010.70.3.469
Steinberg, L. (1994). Context and serial-order effects in personality measurement: Limits on the generality of measuring changes the measure. Journal of Personality and Social Psychology, 66, 341–349. doi:10.1037/0022-3514.59.6.1301
Steiner, I. D. (1972). Group process and productivity. New York, NY: Academic Press. Stumpp, T., Muck, P. M., Hülsheger, U. R., Judge, T. A., & Maier, G. W. (2010). Core self-
evaluations in Germany: Validation of a German measure and its relationships with career success. Applied Psychology, 59, 674–700. doi:10.1111/j.1464-0597.2010.00422.x
Suls, J., Martin, R., & Wheeler, L. (2002). Social comparison: Why, with whom, and with what effect? Current Directions in Psychological Science, 11, 159–163. doi:10.1111/1467-8721.00191
Sundstrom, E., De Meuse, K. P., & Futrell, D. (1990). Work teams: Applications and effectiveness. Amercian Psychologist, 45, 120–133. doi:10.1177/105960118100600105
Süß, S., & Haarhaus, B. (2013). Arbeitszufriedenheit von IT-Freelancern: Eine empirische Analyse auf Basis des Zürcher Modells [Job satisfaction of IT freelancers — An empirical analysis based on the Zurich Model]. Zeitschrift für Arbeits- und Organisationspsychologie A&O, 57, 33–44. doi:10.1026/0932-4089/a000095
Tait, M., Youtz Padgett, M., & Baldwin, T. (1989). Job and life satisfaction: A reevaluation of the strength of the relationship and gender effects as a function of the date of the study. Journal of Applied Psychology, 74, 502–507. doi:10.1037/0021-9010.74.3.502
Tanghe, J., Wisse, B., & van der Flier, H. (2010). The formation of group affect and team effectiveness: The moderating role of identification. British Journal of Management, 21, 340–358. doi:10.1111/j.1467-8551.2009.00656.x
Tasa, K., Sears, G., & Schat, A. (2011). Personality and teamwork behavior in context: The cross-level moderating role of collective efficacy. Journal of Organizational Behavior, 32, 65–85. doi:10.1002/job.680
Tett, R., & Meyer, J. (1993). Job satisfaction, organization commitment, turnover intention, and turnover: Path analyses based on meta-analytic findings. Personnel Psychology, 46, 259–293. doi:10.1111/j.1744-6570.1993.tb00874.x
Thatcher, S., Jehn, K. A., & Zanutto, E. (2003). Cracks in diversity research: The effects of diversity faultlines on conflict and performance. Group Decision and Negotiation, 12, 217–241. doi:10.1023/A:1023325406946
Thiel, C. E., Hill, J., Griffith, J. A., & Connelly, S. (2012). Political tactics as affective events: Implications for individual perception and attitude. European Journal of Work and Organizational Psychology, 23, 1–16. doi:10.1080/1359432X.2012.725534
144

Thomas, K. W., & Tymon, W. G., Jr. (1994). Does empowerment always work: Understanding the role of intrinsic motivation and personal interpretation. Journal of Management Systems, 6, 39–54. doi:10.1177/1548051814565819
Thompson, E. R., & Phua, F. T. T. (2012). A brief index of affective job satisfaction. Group & Organization Management, 37, 275–307. doi:10.1177/1059601111434201
Thoresen, C. J., Kaplan, S. A., Barsky, A. P., Warren, C. R., & de Chermont, K. (2003). The affective underpinnings of job perceptions and attitudes: A meta-analytic review and integration. Psychological Bulletin, 129, 914–945. doi:10.1037/0033-2909.129.6.914
Torre-Ruiz, J. M. D. L., Aragón-Correa, J. A., & Ferrón-Vílchez, V. (2011). Job-related skill heterogeneity and action team performance. Management Decision, 49, 1061–1079. doi:10.1108/00251741111151145
Troth, A., Jordan, P., Lawrence, S., & Tse, H. (2011). A multilevel model of emotional skills, communication performance, and task performance in teams. Journal of Organizational Behavior, 33, 700–722. doi:10.1002/job.785
Tsai, M.-H., & Shih, M. (2010). The effect of group attitude diversity and attitude strength on subsequent cooperation. Paper presented at the 23rd Annual International Association of Conflict Management Conference, Boston, MA. doi:10.2139/ssrn.1615209
Tuckman, B. W., & Jensen, M. A. C. (1977). Stages of small-group development revisited. Group & Organization Management, 2, 419–427. doi:10.1177/105960117700200404
Turner, J. C., Hogg, M. A., Oakes, P. J., Reicher, S. D., & Wetherell, M. S. (1987). Rediscovering the social group: A self-categorization theory. Cambridge, MA: Blackwell. doi:10.2307/2073157
van de Voorde, K., Van Veldhoven, M., & Paauwe, J. (2014). Relationships between work unit climate and labour productivity in the financial sector: A longitudinal test of the mediating role of work satisfaction. European Journal of Work and Organizational Psychology, 23, 295–309. doi:10.1080/1359432X.2012.729312
van den Berg, H., Manstead, A. S. R., van der Pligt, J., & Wigboldus, D. H. J. (2006). The impact of affective and cognitive focus on attitude formation. Journal of Experimental Social Psychology, 42, 373–379. doi:10.1080/14768320500161786
van der Vegt, G. S. (2002). Effects of attitude dissimilarity and time on social integration: A longitudinal panel study. Journal of Occupational and Organizational Psychology, 75, 439–452. doi:10.1348/096317902321119592
van der Vegt, G. S., Emans, B. J. M., & van de Vliert, E. (2001). Patterns of interdependence in work teams: A two-level investigation of the relations with job and team satisfaction. Personnel Psychology, 54, 51–69. doi:10.1111/j.1744-6570.2001.tb00085.x
van Hootegem, G., Benders, J., Delarue, A., & Procter, S. (2005). Teamworking: Looking back and looking forward. The International Journal of Human Resource Management, 16, 167–173. doi:10.1080/0958519042000311372
Vidyarthi, P. R., Liden, R. C., Anand, S., Erdogan, B., & Ghosh, S. (2010). Where do I stand? Examining the effects of leader-member exchange social comparison on employee work behaviors. Journal of Applied Psychology, 95, 849–861. doi:10.1037/a0020033
Volmer, J., & Sonnentag, S. (2011). The role of star performers in software design teams. Journal of Managerial Psychology, 26, 219–234. doi:10.1108/02683941111112659
145

Vroom, V. (1964). Work and motivation. New York, NY: Wiley-Blackwell. doi:10.1002/job.322
Wallace, J. C., Edwards, B. D., Paul, J., Burke, M., Christian, M., & Eissa, G. (2013). Change the referent? A meta-analytic investigation of direct and referent-shift consensus models for organizational climate. Journal of Management, 42, 838–861. doi:10.1177/0149206313484520
Walter, F., & Bruch, H. (2008). The positive group affect spiral: A dynamic model of the emergence of positive affective similarity in work groups. Journal of Organizational Behavior, 29, 239–261. doi:10.1002/job.505
Wang, S., & Noe, R. A. (2010). Knowledge sharing: A review and directions for future research. Human Resource Management Review, 20, 115–131. doi:10.1016/j.hrmr.2009.10.001
Wanous, J., & Hudy, M. (2001). Single-item reliability: A replication and extension. Organizational Research Methods, 4, 361–375. doi:10.1177/109442810144003
Wanous, J., Reichers, A., & Hudy, M. (1997). Overall job satisfaction: How good are single-item measures? Journal of Applied Psychology, 82, 247–252. doi:10.1037//0021-9010.82.2.247
Watson, D., Clark, L. A., & Tellegen, A. (1988). Development and validation of brief measures of positive and negative affect: The PANAS scales. Journal of Personality and Social Psychology, 54, 1063–1070. doi:10.1037//0022-3514.54.6.1063
Weeks, J. (2004). Whining away the hours: Employees’ complaints are often good for morale, particularly when nothing’s done about them. Harvard Business Review, 82(5), 20–21.
Wegge, J., Dick, R. v., Fisher, G. K., West, M., & Dawson, J. F. (2006). A test of basic assumptions of Affective Events Theory (AET) in call centre work. British Journal of Management, 17, 237–254. doi:10.1111/j.1467-8551.2006.00489.x
Weijters, B., & Baumgartner, H. (2012). Misresponse to reversed and negated items in surveys: A review. Journal of Marketing Research, 49, 737–747. doi:10.1509/jmr.11.0368
Weiss, D., Dawis, R., England, G., & Lofquist, L. (1967). Manual for the Minnesota Satisfaction Questionnaire. Minneapolis, MN: Industrial Relations Center, University of Minnesota.
Weiss, H. (2002). Deconstructing job satisfaction. Separating evaluations, beliefs and affective experiences. Human Resource Management Review, 12, 173–194. doi:10.1016/S1053-4822(02)00045-1
Weiss, H., & Cropanzano, R. (1996). Affective events theory: A theoretical discussion of the structure, causes and consequences of affective experiences at work. In B. M. Staw & L. L. Cummings (Eds.), Research in organizational behavior: An annual series of analytical essays and critical reviews, Vol. 18 (pp. 1–74). New York, NY: Elsevier Science/JAI Press.
Weiss, H., Nicholas, J. P., & Daus, C. S. (1999). An examination of the joint effects of affective experiences and job beliefs on job satisfaction and variations in affective experiences over time. Organizational Behavior and Human Decision Processes, 78, 1–24. doi:10.1006/obhd.1999.2824
Werner, J. M., & Lester, S. W. (2001). Applying a team effectiveness framework to the performance of student case teams. Human Resource Development Quarterly, 12, 385–402. doi:10.1002/hrdq.1004
146

West, B., Patera, J., & Carsten, M. (2009). Team level positivity: Investigating positive psychological capacities and team level outcomes. Journal of Organizational Behavior, 30, 249–267. doi:10.1002/job.593
West, M. (2012). Effective teamwork. Practical lessons from organizational research, 3rd Edition. Oxford, England: BPS Blackwell. doi:10.1027/1016-9040.10.1.79
Whitman, D., van Rooy, D., & Viswesvaran, C. (2010). Satisfaction, citizenship behaviors, and performance in work units: A meta-analysis of collective construct relations. Personnel Psychology, 63, 41–48. doi:10.1111/j.1744-6570.2009.01162.x
Wright, T., & Bonett, D. (2007). Job satisfaction and psychological well-being as nonadditive predictors of workplace turnover. Journal of Management, 33, 141–160. doi:10.1177/0149206306297582
Wrobel, M., Krolewiak, K., & Czarna, A. Z. (2015). Do I mirror your mood if we're peas in a pod? Similarity and liking in the social induction of affect. The Journal of Social Psychology, 155, 636–649. doi:10.1080/00224545.2015.1047437
Ybema, J., Smulders, P., & Bongers, P. (2010). Antecedents and consequences of employee absenteeism: A longitudinal perspective on the role of job satisfaction and burnout. European Journal of Work and Organizational Psychology, 19, 102–124. doi:10.1080/13594320902793691
Yee, R. W. Y., Yeung, A. C. L., & Cheng, T. C. E. (2008). The impact of employee satisfaction on quality and profitability in high-contact service industries. Journal of Operations Management, 26, 651–668. doi:10.1016/j.jom.2008.01.001
Yuan, K.-H., Bentler, P. M., & Zhang, W. (2005). The effect of skewness and kurtosis on mean and covariance structure analysis the univariate case and its multivariate implication. Sociological Methods & Research, 34, 240–258. doi:10.1177/0049124105280200
Zablah, A. R., Carlson, B. D., Donavan, D. T., Maxham III, J. G., & Brown, T. J. (2016). A cross-lagged test of the association between customer satisfaction and employee job satisfaction in a relational context. Journal of Applied Psychology, 101, 743–755. doi:10.1037/apl0000079
Zampetakis, L. A., & Moustakis, V. (2011). Managers' trait emotional intelligence and group outcomes: The case of group job satisfaction. Small Group Research, 42, 77–102. doi:10.1177/1046496410373627
Ziegler, R., & Schlett, C. (2013). Formen der Arbeitszufriedenheit [Forms of job satisfaction]. Zeitschrift für Arbeits- und Organisationspsychologie A&O, 57, 51–76. doi:10.1026/0932-4089/a000107
147

Appendix
The tables below present all items that were used in the empirical studies comprising this dissertation. Because all studies were conducted in German, the tables also present English translations.
Table A1Items for Positive and Negative Work Events
Note. All items have been developed by the author.
German English
Instruktion: Im Folgenden finden Sie eine Reihe von Ereignissen, die tagtäglich im beruflichen Alltag auftreten können. Bitte geben Sie an, wie häufig Sie diese Ereignisse im Laufe des letzten Monats erlebt haben.
Instruction: On the following page, you will find a list of events that can occur in everyday professional life. Please state, how often you experienced these events in the last month.
Positive Ereignisse Positive events
Aufgaben erfolgreich bewältigt successfully finished a task
Anerkennung von Ihren Kollegen/innen bekommen
received recognition from your coworkers
positives Feedback von Ihrem/r Teamleiter/in erhalten
received positive feedback from your supervisor
angenehme Aufgaben bearbeitet Worked on enjoyable tasks
Negative Ereignisse Negative events
das Gefühl gehabt, nichts geschafft zu haben
had the feeling of not having accomplished anything
negatives Feedback von Ihrem/r Teamleiter/in erhalten
received negative feedback from your supervisor
Aufgaben bearbeitet, auf die Sie keine Lust hatten
worked on uninteresting tasks
sich mit Kollegen/innen gestritten had an argument with a coworker
148

Table A2Items for Positive and Negative Work Affect
Note. English original taken from Watson et al. (1988). Translated version taken from Krohne et al. (1996).
German English
Instruktion: Im Folgenden finden Sie eine Reihe von Stimmungen / Emotionen, die tagtäglich im beruflichen Alltag auftreten können. Bitte geben Sie an, wie häufig Sie diese Stimmungen und Emotionen im Laufe des letzten Monats erlebt haben.
Instruction: On the following page, you will find a list of moods and emotions that can occur in everyday professional life. Please state, how often you experienced these moods and emotions in the last month.
Positiver Affekt Positive affectbegeistert excitedstark strongstolz proudangeregt excitedaktiv active
Negativer Affekt Negative affectverärgert upsetgereizt irritablebekümmert distressedbeschämt ashameddurcheinander jittery
149

Table A3 Items of the Job Diagnostic Survey
Note. (r) = reversed item. English original taken from Hackman and Oldham (1974). Translated version taken from Schmidt and Kleinbeck (1999).
German English
Instruktion: Die folgenden Aussagen beziehen sich auf die Tätigkeiten, die Sie in Ihrem Team ausüben. Bitte geben Sie an, inwiefern Sie den folgenden Aussagen zustimmen.
Instruction: The following statements refer to the tasks you carry out in your team. Please state how much you agree with the following statement.
Meine Arbeit verlangt ein großes Maß an Zusammenarbeit mit anderen Leuten.
The job requires a lot of cooperative work with other people.
Meine Arbeit gibt mir die Möglichkeit, eine angefangene Arbeit auch zu Ende zu führen.
The job is arranged so that I do not have the chance to do an entire piece of work from beginning to end. (r)
Meine Arbeit gibt mir beträchtliche Gelegenheit, selbst zu entscheiden, wie ich dabei vorgehe.
The job gives me a chance to use my personal initiative and judgement in carrying out the work.
Bei der Ausführung meiner Arbeitstätigkeiten kann ich gut feststellen, wie gut ich arbeite.
Just doing the work required by the job provides many chances for me to figure out how well I am doing.
Meine Arbeit verlangt von mir den Einsatz einer Vielzahl von verschiedenen komplexen Fähigkeiten mit hohen Anforderungen.
The job requires me to use a number of complex or high-level skills.
Meine Vorgesetzten und Kollegen/innen lassen mich sehr oft wissen, wie gut ich meine Arbeit mache.
The supervisors and co-workers on this job almost never give me any feedback about how well I am doing in my work. (r)
Die Art und Weise, wie gut ich meine Arbeit mache, beeinflusst viele Leute.
The job is one where a lot of people can be affected by how well the job gets done.
150

Table A4 Items of the Core Self-Evaluations Scale
Note. (r) = reversed item. Translated version taken from Stumpp et al. (2010).
German English
Instruktion: Bitte geben Sie an, inwiefern die folgenden Aussagen auf Sie persönlich zutreffen.
Instruction: Please state how much the following statements apply to you personally.
Selbstwirksamkeit Self-efficacy
Ich bin zuversichtlich, im Leben den Erfolg zu bekommen, den ich verdiene.
I am confident I get the success I deserve in life
Wenn ich mich anstrenge, bin ich im Allgemeinen erfolgreich.
When I try, I generally succeed.
Ich erledige Aufgaben erfolgreich. I complete tasks successfully.
Selbstwertgefühl Self-esteem
Ich zweifle an meinen Fähigkeiten. (r) I am filled with doubts about my competence. (r)
Ich bin in der Lage, die meisten meiner Probleme zu bewältigen.
I am capable of coping with most problems.
Im Großen und Ganzen bin ich mit mir zufrieden.
Overall, I am satisfied with myself.
Kontrollüberzeugung Locus of control
Ich bestimme, was in meinem Leben geschehen soll.
I determine what will happen in my life.
Ich habe das Gefühl, den Erfolg meiner Karriere nicht unter Kontrolle zu haben. (r)
I do not feel in control of my success in my career. (r)
Manchmal habe ich das Gefühl, keine Kontrolle über meine Arbeit zu haben. (r)
Sometimes, I do not feel in control of my work. (r)
Neurotizismus Neuroticism
Manchmal bin ich deprimiert. Sometimes I feel depressed.
Es gibt Zeiten, in denen mir die Dinge ziemlich düster und hoffnungslos erscheinen.
There are times when things look pretty bleak and hopeless to me.
Wenn ich etwas nicht schaffe, fühle ich mich manchmal wertlos.
Sometimes when I fail I feel worthless.
151

Table A5Items for Organizational Citizenship Behavior
Note. English original taken from Podsakoff et al. (1997). German version translated by the author.
German English
Instruktion: Bitte geben Sie an, inwiefern die Aussagen auf Ihr Team zutreffen oder nicht. Die Mitglieder unseres Teams…
Instruction: Please state how much the following statements apply to your team. The members of our team…
teilen ihr Wissen mit anderen Mitgliedern des Teams gerne.
willingly share their expertise with other members of the crew.
unterstützen sich gegenseitig. help each other out if someone falls behind in his/her work.
investieren freiwillig Zeit darin, anderen Mitgliedern zu helfen.
willingly give of their time to help crew members who have work-related problems.
sprechen sich bei Dingen, die andere Mitglieder betreffen, im Vorhinein mit diesen ab.
touch base'' with other crew members before initiating actions that might affect them.
ermutigen sich gegenseitig, wenn es mal nicht so gut läuft.
encourage each other when someone is down.
versuchen, Probleme mit anderen Mitgliedern zu vermeiden.
take steps to try to prevent problems with other crew members.
versuchen, Meinungsverschiedenheiten zwischen anderen Mitgliedern zu schlichten.
try to act like peacemakers when other crew members have disagreements.
152

Table A6Items for Interaction Frequency, Turnover Intention, and Absenteeism
Note. (r) = reversed item. All items developed by the author.
German English
Instruktion: Die folgenden Aussagen beziehen sich auf verschiedene Aspekte Ihres Teams. Bitte geben Sie an, inwiefern die Aussagen auf Ihr Team zutreffen oder nicht.
Instruction: The following statements refer to different aspects of your team. Please state how much the following statements apply to your team.
Interaktionshäufigkeit Interaction frequency
Ich habe häufig Kontakt zu den anderen Mitgliedern meines Teams.
I am in steady contact to the other members of my team.
Die Mitglieder unseres Teams tauschen sich regelmäßig untereinander aus.
Team members regularly exchange views.
In unserem Team finden regelmäßige Treffen statt.
Our team holds regular meetings.
Die anderen Mitglieder meines Teams bekomme ich nur selten zu Gesicht. (r)
I seldom catch sight of the other members of my team. (r)
Wechselbereitschaft Turnover intention
Wenn ich könnte, würde ich dieses Team verlassen.
I would leave the team if I could.
Ich denke häufig darüber nach, dieses Team zu verlassen.
I often think about leaving this team.
Absentismus Absenteeism
Bei unseren Teammeetings fehlen häufig einzelne Mitglieder.
When we have team meetings, there are often some members missing.
Bei unseren Teammeetings sind immer alle eingeplanten Mitglieder da. (r)
All scheduled members attend team meetings. (r)
153

Table A7Initial Item Pool in the Development of the KAFA Scales German EnglishAlles in allem ist mein Job… All in all, my job…
* gut. is good.* niemandem zu wünschen. (r) is undesirable.
besser als die meisten anderen. is better than most.* unangenehm. (r) is disagreeable.* zufriedenstellend. makes me content.
exzellent. is excellent.* angenehm. is enjoyable.
dürftig. (r) is poor.Meine Bezahlung… My pay is…
ist so gering, dass ich kaum davon leben kann. (r)
so low that I can barely live on income.
* ist unangemessen. (r) inadequate.* ist ungerecht. (r) unjust.
ist leistungsgerecht. performance-related.entspricht meiner Verantwortung. appropriate for my responsibility.ist gut. good.
* ist schlecht. (r) bad.reicht aus, um davon zu leben. enough to live on.ist komfortabel. comfortable.ist unsicher. (r) insecure.reicht bei normalen Ausgaben völlig aus. adequate for normal expenses.
* ist fair. fair.* ist zufriedenstellend. satisfying.
Meine Entwicklungsmöglichkeiten… My opportunities for promotion are…* sind gut. good.* sind ziemlich eingeschränkt. (r) somewhat limited.
sind schlechter als die meiner Kollegen/innen (r)
worse than my co-workers’.
sind sicher. secure.* sind angemessen. adequate.
sind nicht sehr zahlreich. (r) not very numerous.sind ungeregelt. (r) unregulated.
* existieren kaum. (r) almost none-existing.* sind leistungsgerecht. performance-related.
sind enttäuschend. (r) disappointing.geben mir Auftrieb. motivating.gefällt mir. pleasing.
154

German EnglishMein/e direkte/r Vorgesetzte/r… My direct supervisor…
lobt gute Arbeit. praises good work.* ist rücksichtsvoll. is considerate.
ist unhöflich. (r) is rude.setzt sich für uns ein. supports us.
* ist fair. is fair.* ist unbeliebt. (r) is unpopular.* ist vertrauenswürdig. is trustworthy.
informiert schlecht. (r) informs badly.lässt uns mitreden. lets us have a say.nörgelt gerne. (r) likes to nag.ist taktvoll. is tactful.ist immer auf dem neuesten Stand. is up to date.ist mir lästig. (r) is annoying.versteht was von seiner/ihrer Arbeit. knows his/her job well.ist richtungsweisend. is influential.ist schlimm. (r) is bad.
* ist ungerecht. (r) is unjust.ist aktiv. is active.
Meine Arbeitskollegen sind… My co-workers are…langweilig. (r) boring.
* zerstritten. (r) quarreling.* sympathisch. likeable.
unfähig. (r) incompetent.* kollegial. cooperative.* angenehm. pleasant.
verantwortungsvoll. responsible.faul. (r) lazy.schlau. smart.
* frustrierend. (r) frustrating.langsam. (r) slow.intelligent. intelligent.hilfsbereit. helpful.stur. (r) stubborn.
155

Note. Items marked with asterisk are retained in the final scales.
German EnglishMeine Tätigkeiten… My work…
* sind ziemlich uninteressant. (r) is rather uninteresting.sind festgefahren. (r) is deadlocked.sind unselbständig. (r) lacks independence.sind nutzlos. (r) is useless.sind angesehen. is respected.sind enttäuschend. (r) is disappointing.unterfordern mich. (r) demands too little from me.zeigen sichtbare Ergebnisse. shows visible results.geben mir die Möglichkeit, meine Fähigkeiten einsetzen.
lets me put my skills into practice.
geben mir die Möglichkeit, eigene Ideen zu verwirklichen.
lets me realize own ideas.
sind verantwortungsvoll. is responsible.sind zufriedenstellend. is satisfying.sind gut. is good.
* sind spannend. is exciting.sind bereichernd. is rewarding.geben mir das Gefühl, etwas zu erreichen. gives me a sense of accomplishment.
* fordern mich. challenges me.* langweilen mich. (r) bores me.* gefallen mir. pleases me.
156