dissertação de doutoramento - run.unl.pt · ao pessoal da salinha quero agradecer as animadas...
TRANSCRIPT
Dissertação de Doutoramento
Molybdenum-containing proteins from Sulphate Reducing Bacteria:
studying proteins with novel cofactors and revealing new features
of old enzymes.
Maria Gabriela Rivas
Lisboa, 2006


Maria Gabriela Rivas
Molybdenum-containing proteins from Sulphate Reducing Bacteria:
studying proteins with novel cofactors and revealing new features
of old enzymes.
Dissertação apresentada para a obtenção do
Grau de Doutor em Bioquímica, especialidade
de Bioquímica-Física pela Universidade Nova de
Lisboa, Faculdade de Ciências e Tectologia.
Lisboa, 2006


-Nº de arquivo
-“Copyright”


…to Pablo…


i
ACKNOWLEDGMENTS
A minha orientadora, Prof. Isabel Moura, quero agradecer ter-me aceite (ainda sem
me conhecer) no seu grupo de investigação e por ter depositado toda a sua confianza no
meu trabalho. A sua energia e entusiasmo têm sido um incentivo permanente na
realizacão desta tese. Quero ainda acrescentar a minha grande admiração pelo seu
domínio na área teórica e experimental tanto na purificação como caracterização de
proteínas.
Ao Prof. José Moura pelo seu dinamismo e orientação científica alêm da simpatía e
da boa disposição demonstrada em todo momento.
Al Dr. Carlos Brondino quiero agradecerle muy especialmente por todo el
conocimiento transmitido a lo largo de estos años, por la paciencia y la incansable
disposición a la hora de trabajar, analizar y discutir los resultados. El gran interés
demostrado en todos los temas discutidos en esta tesis es de gran admiración. Su simpatía
y buen humor fueron una importantísima contribución para que la propuesta de cruzar la
frontera y empezar nuevos desafíos tenga un balance muy positivo.
Quiero agradecer al Dr. Jose Calvete del Instituto de Biomedicina de Valencia por la
colaboración en la secuenciación de la Blue protein de D. aminophilus. Ha sido un gran
placer conocer a una excelente persona tanto desde el punto de vista profesional como
humano. La estadía en su laboratorio así como las tapas, la visita al mercado central de
Valencia, la paella y el asado serán inolvidables. Agradezco también a todo su grupo de
investigación, especialmente a Libia, por el compañerismo demostrado haciendo todavía
más placenteras las horas de trabajo en el instituto.
Ao Prof. Dr. Graham N. Jorge e a Dra. Gosia Korbas (University of Saskatchewan,
Canada) pela adquicição e análises dos resultados de espectroscopía absorção de raios-X.
Ao Lic. Cristiano Mota, quem levou a cabo a sequenciação do operão da Fdh e da
Blue protein de D. alaskensis sob a minha orientação, agradeço a boa dispocição, a calma,
a persistência e o excelente espírito de trabalho que o caracterizam.
Agradeço ao Prof. Jorge Lampreia pela disponibilização do sequenciador de
proteínas e especialmente Dra. Marta Santos por a grande ajuda e o interesse
demonstrados na sequenciação das subunidades da Dd Fdh e da Blue protein de D.
alaskensis. Quero ainda agradecer ao Prof. Jorge Caldeira pela disponibilização das colunas
de fase reversa utilizadas na separação de péptidos.
Quero agradecer à Dra. Raquel Rial-Otero e à Lic. Luz Fernadez pelos análises por
espectrometria de massas da Blue protein de Desulfovibrio alaskensis (FCT-UNL, Caparica,
Portugal).

Acknowledgments
ii
Gostaría ainda de agradecer aos meus colegas de laboratório incluindo ao Grupos
Bion e X-tal. Particularmente agradeço ao Dr. Sergey Bursakov pela ajuda na primeira
purificação da Dd Fdh e a Prof. Alice Pereira pela ajuda prestada na sequenciação de DNA
da Blue protein de D. aminophilus.
À Prof. Maria João Romão pela simpatía com que sempre me tratou e pelas
discussões científica relativas à Fdh.
Quero expressar o meu agradecimento à Eng. Lúcia, à Dra. Isabel Rodrigues, à Dra.
Maria José Carapinha e Dra. Fátima por todo o apoio na parte burocrática, mas
principalmente pela simpatia e a paciência que sempre demonstraram.
Ao pessoal da salinha quero agradecer as animadas conversas ao almoço e durante
o café.
À Casimira por fazer que cada dia de trabalho tenha um final feliz.
A toda la gente del Departamento de Física de la Facultad de Bioquímica y Ciencias
Biológicas de la Universidad Nacional del Litoral por la simpatía y el excelente ambiente de
trabajo con el que me acogieron en el último mes de escritura de esta tesis. Especialmente
a Aberto Rizzi.
A mis amigas en Argentina (mis grandes amigas): Marianela, Mariana, Noelia y
Verónica. Les agradezco el cariño y la compañía (aun a larga distancia).
A Ana e a Roeland por los momentos lindos que pasamos juntos.
A Laura por su amistad, por las charlas sobre todo y más y por hacerme ver la Costa
con otros ojos.
A Carlos y José Luis quiero agradecerles el cariño y la compañía que me ofrecieron
desde la llegada a Portugal. Los momentos compartidos (incluyendo días de playa, cenas,
almuerzos, bodas, caminatas, viajes por lugares inhóspitos y superpoblados) así como los
consejos recibidos han hecho que sean considerados como nuestra familia en Portugal.
GRACIAS!
Quero agradecer aos meus amigos em Portugal: Sofia, Ana Teresa, Inês, Marta,
Pedro, Jorginho, Teresinha, Stef & Cathy (mais Prisca e Tom!), Jorge, Simone, Fancesca,
Joana e Fançoise pelo carinho, pelas palavras certas e por fazer que tenha tantas saudades
de Portugal quando estou longe. Um reconhecimento especial à Sofia pelo exemplo dado
no dia e pela inmensa quantidade de coisas que aprendi (e continuo a aprender) com ela,
pelas correcções ao meu portunhol. À Marta ainda quero agradecer a leitura crítica de
alguns capítulos desta tese.
A mi familia (papá, mamá, Pao, Cande, Vale, Walter, Lara, Mica y nonos) les
agradezco el apoyo, la paciencia y el haber estado siempre a mi lado. A mi familia González
(incluyendo a Sarita) por el apoyo y la preocupación constante.

Acknowledgments
iii
A Pablo, mi marido, compañero y amigo, le agradezco el haberme incentivado
siempre y la ayuda en todo. Tu compañía, paciencia y buen humor me ayudan a
sobrepasar todas las dificultades. GRACIAS
Agradeço a SECYT (Argentina) e GRICES (Portugal) pelo apoio económico dado no
marco do acordo de Cooperação Científica e Tecnológica Portugal - Argentina.
Agradeço ao governo de Portugal por permitir a formação avanzada tanto de
cidadãos portugueses como estrangeiros, particularmente o apoio financiero que a
Fundação para a Ciência e a Tecnologia me concedeu através da bolsa de doutoramento.

Ackonowledgments
iv
v
RESUMO
O trabalho apresentado nesta tese corresponde ao estudo de duas classes distintas
de proteínas isoladas de bactérias redutoras de sulfato. A proteína descrita na primeira
parte é a enzima mononuclear de molibdénio desidrogenase do formato de D.
desulfuricans ATCC 27774 (Dd Fdh). As Fdhs são enzimas que catalisam a oxidação do
formato a dióxido de carbono, reacção que envolve a transferência de dois electrões.
Estudos preliminares de EPR e EXAFS realizados na Dd Fdh demonstraram que esta enzima
pertence à familia da reductase do dimetilsulfóxido de metilo e que está relacionada com
outras Fdhs de bactérias reductoras de sulfato e de E. coli. A estrutura cristalina de três Fdhs
que pertencem a esta família encontram-se resolvidas: a Fdh-H e a Fdh-N de E. coli e a W-
Fdh de D. gigas. A subunidade catalítica destas três enzimas apresenta um folding idêntico
e contém, além do centro activo, um centro [4Fe-4S]. O sítio activo inclui um ião
[Mo/W(VI)] coordenado a quatro enxofres provenientes de duas pterinas, um átomo de
selénio de uma selenocisteína e um ligando cuja origem é controversa. Nas Fdhs de E. coli
e Dd o sexto ligando foi identificado como sendo um átomo de oxigénio. No entanto,
dados obtidos da estrutura de Raios X da W-Fdh de D. gigas sugerem um átomo de
enxofre na posição deste ligando. O mecanismo de reacção destas enzimas é baseado nos
resultados obtidos de estudos de EPR e Raios X da desidrogenase do formato H de E. coli.
A função fisiológica destas enzimas é variável facto que poderá dever-se à sua variável
localização celular, aos parceiros fisiológicos, à composição de subunidades e ao conteúdo
de cofactores.
O trabalho descrito na primeira parte desta tese tem por objetivo a compreensão da
organização dos genes que codificam para a Fdh e as propriedades cinéticas e de EPR
desta enzima. Os genes que codificam para a Fdh (fdhABEC) estão organizados de forma
similar ao operão que codifica para a Fdh-3 de D. vulgaris Hildenborough. É de salientar a

Resumo
vi
presença de duas sequências de DNA a montante e a jusante do gene fdhE sem
homologia relativamente a outras proteínas conhecidas.
Estudos cinéticos nos quais deuteroformato foi usado como substrato alternativo
demonstraram um efeito isotópico primário o que indica que a ruptura da ligação C-H é o
passo limitante da oxidação do formato. Estudos de inibição demonstraram que o nitrato é
um inibidor competitivo e a azida e o cianeto são inibidores mistos da enzima. O espectro
de EPR da Fdh reduzida com formato é diferente do observado quando a enzima é
reduzida com ditionito. Este sinal é rómbico e apresenta desdobramentos hiperfinos
atribuíveis à presença de dois núcleos com I=1/2. Um dos dois núcleos é não permutável
com o solvente e poderá corresponder ao protão que se encontra sobre o carbono do β-
metileno da selenocisteína coordenada ao Mo. O segundo núcleo é, pelo contrário,
permutável com o solvente e poderá pertencer a protões unidos a uma molécula de
solvente coordenada ao Mo. Estudos de EPR em condições de inibição detectaram a
presença de um sinal conhecido como 2.094 e que fora proposto como pertencendo a
um intermediário na oxidação do formato. Assim, neste trabalho é ainda apresentada uma
análise da relevância destas duas espécies paramagnéticas na catalise e a origem do sexto
ligando.
A segunda parte desta dissertação inclui o estudo de duas proteínas que parecem
ser membros de uma nova família de metaloproteínas e que são conhecidas com o nome
genérico de Blue proteins. Estas proteínas foram isoladas de diferentes bactérias do género
Desulfovibrio e a sua função é ainda desconhecida. Nos anos 1978 e 1986 foi descrito pela
primeira vez o isolamento de proteínas contendo Mo-Fe de Desulfovibrio africanus e
Desulfovibrio salexigens. Mais tarde, uma proteína homóloga que contém no seu centro
metálico Mo, Fe e Cu foi isolada de D. gigas. O trabalho realizado nesta parte compreende
a caracterização primária de duas Blue proteins isoladas de D. aminophilus e de
Desulfovibrio alaskensis. Todas estas proteínas apresentam-se como agregados
multiméricos com baixa homologia relativamente à sequência primária. As sequências de

Resumo
vii
nucleótidos das Blue proteins destes dois organismos foram obtidas e a sequência
traduzida de aminoácidos sugere uma localização periplásmica para ambas. O valor de pI
calculado a partir da sequências de aminoácidos derivadas da sequência do DNA está de
acordo com o comportamento das proteínas nas colunas de troca aniónica. A analise de
metais detectou a presença de Mo e Fe na Blue protein de D. alaskensis e de Cu e Fe na
poteína isolada de D. aminophilus. No que se refere aos centros metálicos, datos de
espectroscopía de absorção de raios-X sugerem agregados heterometálicos com
diferenças na coordenação dos ligandos em torno do ião metálico.

Resumo
viii

ix
ABSTRACT The work presented in this thesis was oriented to the study of two different types of
proteins isolated from sulphate reducing bacteria. One of them is the mononuclear
molybdenum containing enzyme Formate dehydrogenase from D. desulfuricans ATCC
27774 (Dd Fdh). Formate dehydrogenases are enzymes that catalyze the two-electron
oxidation of formate to carbon dioxide. Dd Fdh belongs to the dimethylsulphoxide
reductase family and is closely related to other Fdhs isolated from both sulphate reducing
organisms and E. coli. The crystal structures of three Fdhs belonging to this family have
been reported to date: the Mo-containing Fdh-H and Fdh-N from E coli; and the W-
containing Fdh from D. gigas. The catalytic subunit of these three proteins contains the
active site and one [4Fe-4S] cluster, and presents an identical fold. The oxidized active site
comprises a [Mo/W(VI)] ion coordinated to four sulphurs from two pterins, a Se atom
provided by the Seleno-Cysteine, and a sixth ligand whose nature is still controversial. This
ligand has been identified as a hydroxyl group in Dd and E. coli Fdhs. However, the X-ray
data obtained from the D. gigas enzyme suggest a sulphur atom. Despite all these enzymes
catalyze a unique reaction, their physiological roles are variable, which could arise from
their different cellular localization, physiological partners, and subunit and cofactor
composition.
The work performed was oriented to understand the gene organization, and the
kinetic and EPR properties of Dd Fdh. The genes codifying the Fdh enzyme are organized
as a fdhABEC cluster similar to the D. vulgaris Hildenborough Fdh-3 operon. Two gaps
containing ORFs without homology with any annotated sequences were identified
upstream and downstream from fdhE. Kinetic studies using deuteroformate as substrate
revealed a primary isotope effect indicating that the break of the C-H bond is the rate
limiting-step in the formate oxidation. Inhibition studies showed that nitrate is a competitive
inhibitor whereas azide and cyanide are mixed inhibitors. The reduction of Dd Fdh with

Abstract
x
sodium formate yields a different signal from the dithionite reduced enzyme. The EPR signal
obtained on formate reduction is a rhombic signal and is split by two interacting I=1/2
nuclei. One of them is not solvent exchangeable and according to the proposed structure
for the Mo site is located on the β-methylene carbon of the Se-Cysteine. In contrast, the
second interacting nucleus is exchangeable with solvent and could be produced by
protons of a solvent molecule bound to the Mo. EPR studies in inhibiting conditions yields a
signal called 2.094 which was proposed to be produced by an intermediate of the catalytic
reaction in the E coli enzyme. The relevance of these paramagnetic species in catalysis as
well as the nature of the six ligand of the Mo site is discussed.
The second type of proteins corresponds to two proteins belonging to a new family
of metalloproteins that receives the generic name of Blue proteins. These proteins were
isolated from several bacteria of the Desulfovibrio genus and their function in the cell is still
unknown. There are few reports on these proteins. The first ones, which date from 1978
and 1986, describe the isolation of two novel Mo-Fe containing proteins from D. africanus
and D. salexigens, respectively. More recently, a homologous protein, containing Mo, Fe
and Cu, was isolated from D. gigas. In this work, the Blue proteins isolated from
Desulfovibrio aminophilus and Desulfovibrio alaskensis are reported. The function of both
proteins is also unknown and the work was oriented to perform their primary
characterization. These Blue proteins are multimeric proteins sharing low aminoacid
sequence homology. The sequencing of the open reading frame showed to contain a
signal peptide which suggests a periplasmic location. The high pI calculated from the
deduced amino acid sequences is in agreement with the behaviour showed through
anionic chromatographic columns. Metal analysis detected Mo and Fe for D. alaskensis and
Cu and Fe for the D. aminophilus. X-ray adsorption spectroscopy studies suggest
multinuclear clusters with potential differences in the coordination around metal ions, and
which has not been observed in Mo-containing proteins.

xi
Abbreviations
ATCC American Type Culture Collection
Blast Basic Local Alignment Search Tool
D. Desulfovibrio
Dd Desulfovibrio desulfuricans
DEAE DiEthylAminoEthyl
DLP Direct Linear Plot
DMSOR DimethylSulfoxide Reductase
DNA DeoxyriboNucleic Acid
DvH D esulfovibrio v ulgaris Hildenborough
E coli E scherichia coli
Ec E scherichia c oli
EPR Electron Paramagnetic Resonance
EXAFS Extended X-ray Absorption Fine Structure
Fdh Formate dehydrogenase
FeMo Iron-Molybdenum
FHL Formate Hydrogen Lyase
HPLC High Performance Liquid Chromatography
HTP Hydroxyapatite
LB Luria Bertani
MALDI-TOF Matrix-Assisted Laser Desorption/Ionisation-Time Of Flight
MCD Molybdopterin Cytosine Dinucleotide
MGD Molybdopterin Guanine Dinucleotide
NCBI National Center for Biotechnology Information
ORF Open Reading Frame
PCR Polymerase Chain Reaction
PFL Pyruvate Formate-Lyase
pI Isoelectric point
RBS Ribosome Binding Site
SDS-PAGE Sodium Dodecyl Sulphate Polyacrylamide Gel Electrophoresis
SECIS Selenocysteine Insertion Sequence
SeCys SelenoCysteine
SO Sulfite Oxidase
SRB Sulphate Reducing Bacteria
Tat Twin arginine transport
Tm annealing temperature
XAS X-ray Absorption Spectroscopy
XO Xanthine Oxidase

xii

xiii
INDEX ACKNOWLEDGEMENTS i
RESUMO v
ABSTRACT ix
ABBREVIATIONS xi
FIGURE INDEX xvii
TABLE INDEX xxiii
CHAPTER I. GENERAL INTRODUCTION 1
CHAPTER II. MOLYBDENUM-CONTAINING PROTEINS FROM SULPHATE REDUCING BACTERIA:
REVEALING NEW FEATURES OF OLD ENZYMES.
II.1 INTRODUCTION 9
II.1.1 Metabolism of formate in the bacterial cell 9
II.1.2 Biochemical and structural properties of Mo- and W-Formate dehydrogenases
belonging to the DMSO reductase family 12
II.1.2.1Formate dehydrogenases from sulphate reducing bacteria 13
II.1.2.1.1 W-Formate dehydrogenase from Desulfovibrio gigas 13
II.1.2.1.2 Formate dehydrogenases from Desulfovibrio vulgaris
Hildenborough 15
II.1.2.1.3 Formate dehydrogenase from Desulfovibrio alaskensis NCBI
1391 16
II.1.2.1.4 Formate dehydrogenase from Desulfovibrio desulfuricans
ATCC 27774 16
II.1.2.2 Formate dehydrogenases from E coli
II.1.2.2.1 Formate dehydrogenase H 17
II.1.2.2.2 Formate Dehydrogenase N 19
II.1.3 Oxidation of formate to carbon dioxide: The proposed reaction mechanisms 21
II.1.4 Gene organization of Formate dehydrogenases 24
II.2 MATERIALS AND METHODS 29
II.2.1 Cell growth and protein purification 29
II.2.2 Protein and Metal quantification 30
II.2.3 Molecular weight determination 30
II.2.4 Activity assays 31
II.2.5 EPR spectroscopy 31
II.2.5.1 X-Band EPR spectroscopy 31
II.2.5.2 Q-Band EPR spectroscopy 32
II.2.6 Spin quantification 32
II.2.7 Formate dehydrogenase operon sequence 33
II.2.7.1 Gene isolation strategy 33

Index
xiv
II.2.7.2 DNA amplification reactions 36
II.2.7.3 Cloning and sequencing the fdh gen 37
II.2.7.4 Analysis of protein and DNA sequences 38
II.2.8 Sequencing N-Terminal Formate dehydrogenase subunits 38
II.3 RESULTS 39
II.3.1 Molecular properties 39
II.3.2 UV-visible spectroscopy 39
II.3.3 Fdh operon sequence 40
II.3.4 Kinetic Experiments 52
II.3.4.1 Determination of kinetic constants (Km and Vm) 52
II.3.4.2 Influence of β-mercaptoethanol on the kinetic assay 55
II.3.4.3 Deuterioformate as substrate 58
II.3.4.4 Inhibition studies 62
II.3.4.4.1 Inhibition by Azide 63
II.3.4.4.2 Inhibition by Nitrate 65
II.3.4.4.3 Inhibtion by Cyanide 67
II.3.5 EPR Spectroscopy 68
II.3.5.1 Molybdenum centre 68
II.3.5.1.1 As-prepared and dithionite reduced enzyme 68
II.3.5.1.2 Formate reduced enzyme 70
II.3.5.1.3 Azide and cyanide inhibited enzyme 72
II.3.6.2 Iron sulphur clusters 77
II.3.5.3 Heme centres 78
II.4 DISCUSSION 81
II.4.1 Gene organization 81
II.4.2 Kinetic properties 85
II.4.2.1 Influence of the C-H break in the rate liming-step 86
II.4.2.2 Effect of inhibitors 88
II.4.3 EPR of redox cofactors 88
II.4.3.1 The Fdh active site centre 88
II.4.3.1.1 The formate species 88
II.4.3.1.2 The 2.094 species. Effects of the inhibitors on the coordination
around Mo(V) centre. 89
II.4.4.1.3 Involvement of formate and 2.094 species in the reaction
mechanism of formate oxidation
91
II.4.3.2 The [4Fe-4S] clusters 92
II.5 REFERENCES
93

Index
xv
CHAPTER III. MOLYBDENUM-CONTAINING PROTEINS FROM SULPHATE REDUCING BACTERIA: STUDYING
PROTEINS WITH NOVEL COFACTORS
III.1. INTRODUCTION 101
III.2. MATERIALS AND METHODS 103
III.2.1 Growth media and culture conditions 103
III.2.2 Purification procedures 103
III.2.3 Protein and Metal quantification 107
III.2.4 Molecular mass determination and subunit composition 107
III.2.5 Quantification of labile sulphide 108
III.2.6 Determination of N-terminal and internal amino acid sequences 108
III.2.7 DNA sequencing strategies 109
III.2.7.1 Desulfovibrio aminophilus Blue Protein DNA sequencing 109
III.2.7.2 Desulfovibrio alaskensis Blue Protein DNA sequencing 111
III.2.8 EXAFS data collection and analysis 112
III.3 RESULTS 113
III.3.1. Protein purification 113
III.3.2. Determination of molar extinction coefficients 114
III.3.3 Molecular weight determination 115
III.3.4 Metal quantification 116
III.3.5 Labile sulphide quantification 117
III.3.6 Protein and gene sequence 117
III.3.6.1 Desulfovibrio aminophilus Blue Protein 117
III.3.6.2 Desulfovibrio alaskensis Blue Protein 120
III.3.7 EPR spectroscopy 123
III.3.8 X-ray Absorption Spectroscopy of Mo, Cu and Fe site of Blue proteins 123
III.3.8.1 Desulfovibrio aminophilus and Desulfovibrio gigas Blue protein 123
III.3.8.1.1 Fe K-Near edge and K-edge EXAFS 123
III.3.8.1.2 Cu K-Near edge and K-edge EXAFS 125
III.3.8.1.3 Mo K-Near edge and K-edge EXAFS 127
III.3.8.2 Desulfovibrio alaskensis Blue protein 128
III.3.8.2.1 Mo and Fe K- near edge spectr a 128
III.3.8.2.2 Mo and Fe K-edge EXAFS 130
III.4 DISCUSSION 137
III.4.1 Primary characterization of Blue Proteins from Desulfovibrio genus 137
III.4.2 Amino acid sequence: conserved motifs and homology with other proteins 138
III.4.3 Novel cofactors in proteins isolated from Desulfovibrio genus 140
III.5 REFERENCES 143
CHAPTER IV. CONCLUDING REMARKS 145

Index
xvi

xvii
FIGURE INDEX Figure I.1 Catalytic active site of MoFe nitrogenase from Azotobacter vinelandii . 1
Figure I.2 Catalytic active site of Cu,Mo-CO Dehydrogenase from Oligotropha carboxidovorans [7]. 2
Figure I.3 (a) Active-site structure of the three families of mononuclear molybdenum- and tungsten-
containing enzymes. X and Y represent ligands such as oxygen (oxo, hydroxo, water, serine, and
aspartic acid), sulphur (cysteine), and selenium (selenocysteine) atoms. (b) Structure of the
pyranopterin molecule.
3
Figure I.4 (a) Half-reaction catalyzed by the enzyme aldehyde oxidoreductase of the XO family. (b)
Half-reaction catalyzed by the enzyme nitrate reductase, which, depending upon the source can
belong to either the DMSOR or SO family.
4
Figure I.5 Accepted general mechanism for oxidative (left) and reductive (right) reactions catalyzed
by mononuclear molybdenum-containing enzymes. 5
Figure II.1.1 Schematic representation of formate metabolism in E coli. (Adapted from reference [28]) 10
Figure II.1.2 Schematic representation of formate metabolism in Desulfovibrio vulgaris (Adapted from
[29]) 11
Figure II.1.3 Active site of three Fdhs belonging to the DMSO reductase family (adapted from [10]). X
and Y represent ligands such as oxygen (oxo, hidroxo, water, serine, aspartic acid), sulphur (cysteine)
and selenium atom (selenocysteine). The coordination around the active site of the enzymes was
adapted from: (a), [39, 40]; (b), [37]; (c), [37, 41]; (d), [42]; (e), [23, 24].
13
Figure II.1.4 Stereo representation of the overall structure of W-Fdh from Desulfovibrio gigas (a) and
the redox cofactors involved in electron transfer (b) (reproduced from [35, 39, 40]). 14
Figure II.1.5 Coordination around W atom in the oxidized Fdh from Desulfovibrio gigas. 15
Figure II.1.6 Postulated coordination around Mo active site of Dd Fdh on the basis of EXAFS data
[53]. Oxidized (a) and reduced state (b). 17
Figure II.1.7 Stereo view of E coli Fdh-H [37]. Domains I, II, III and IV are shown in blue, green, yellow
and red, respectively. Redox cofactors (Mo bis-MGD and [4Fe-4S] cluster) are represented as balls
model.
18
Figure II.1.8 The oxidized active site of E coli Fdh-H. 18
Figure II.1.9 Coordination around the reduced active site of E coli Fdh-H. (a) Formate reduced form
as determined by Boyington J.C. et al. [37] (b) New interpretation by Raaijmakers & Romão [42]. 19
Figure II.1.10 Fdh-N from E coli. Left: overall stereo view with redox cofactors represented as balls
model. Right: Arrangement of redox cofactors involved in electron pathway from formate to oxidized
menaquinone.
21
Figure II.1.11 Schematic representation of the reaction mechanism. Black line: proposed reaction
mechanism for E coli Fdh-H by references [37, 41]. Red line: proposal for the reaction mechanism
deduced from the reanalysis of the X-ray data of formate-reduced Fdh-H [42].
23

Figure Index
xviii
Figure II.1.12 The nitrite/formate binding site. Nitrite molecule replaces the OH/SH ligand being
stabilized by Arg333. The postulated electron transfer pathway is shown by grey arrows. 24
Figure II.1.13 Postulated SECIS element for: a) Desulfovibrio gigas fdhA [65] and b) Escherichia coli
K12 fdhF [63]. C: single C that prevents UGA read through, T/U: bulged U/T that interacts with
SELB.
26
Figure II.3.1 Tricine SDS-PAGE (15%) of Dd Fdh after Superdex 200 column. 39
Figure II.3.2 UV-visible spectra of as-prepared Dd Fdh (black line) and dithionite reduced form (red
line). 40
Figure II.3.3 Nucleotide and corresponding aminoacid sequence of the four ORF of Dd Fdh operon.
Underlined sequences shows the putative Ribosome Binding Sites (RBS), M and * are the ORF start
and end, respectively.
41
Figure II.3.4 Schematic representation of gene organization for Dd Fdh operon. The ORFs and its
transcription senses are indicated by the arrows. 45
Figure II.3.5 Amino acid sequence alignment of the Dd FdhA with related proteins from different
Desulfovibrio species. Dd27774FdhA: FdhA subunit from Desulfovibrio deulfuricans ATCC 27774,
DVU2812FdnG3: large subunit from Desulfovibrio vulgaris Hilderborough (DVU2812),
Dde3513DdG20FdhA4: Fdh large subunit from Desulfovibrio desulfuricans G20 (Dde3513),
Q934F5DgFdhA: Fdh large subunit from Desulfovibrio gigas (Q934F5), light grey: twin arginine
motif, light yellow: conserved SeCys, light blue: conserved residues probably involved in emzymatic
catalysis ▼: signal peptide cleavage site, •: cysteines motifs involved in the coordination of [4Fe-4S]
clusters, (*): identity, (:): strongly similar, and (.) weekly similar.
47
Figure II.3.6 Aminoacid sequence alignment of the Dd FdhB with Fdh homologous subunits from
related organisms. Dd27774FdhB: FdhB subunit from Desulfovibrio deulfuricans ATCC 27774,
DVU2811FdnG3B: β-subunit from Desulfovibrio vulgaris Hilderborough (DVU2811),
Dde3514DdG20FdhB: Fdh β-subunit from Desulfovibrio desulfuricans G20 (Dde3514),
Q8GC87DgFdhB: Fdh small subunit from Desulfovibrio gigas (Q8GC87), Red, blue and green
circles: cysteine motifs probably involved in the FeSII, FeIII and FeSIV cluster binding, (*): identity, (:):
strongly similar, and (.) weekly similar.
50
Figure II.3.7 Multiple sequence alignment of FdhE. Dd27774FdhE: FdhE protein from Desulfovibrio
desulfuricans ATCC 27774, DVU2810FdnG3E: FdhE protein from Desulfovibrio vulgaris
Hilderborough (DVU2810), Dde3515DdG20FdhE: FdhE protein from Desulfovibrio desulfuricans
G20 (Dde3515), (*): identity, (:): strongly similar, and (.) weekly similar.
51
Figure II.3.8 Amino acid sequence alignment of the Dd FdhC subunit with the cytochrome c3 from
Desulfovibrio vulgaris Hildenborough. Dd27774FdhC: Dd FdhC subunit, DVU2809Cytc3: DvH
cytochrome C3 (locus tag DVU2809), ▼: signal peptide cleavage site, ●: histidines probable involved
in the coordination of the haemic iron, red boxes: CX2CH motif involved in heme coordination, (*):
identity, (:): strongly similar, and (.) weekly similar.
52

Figure Index
xix
Figure II.3.9 Initial rate vs. formate concentration (a) and benzyl viologen concentration (b). The red
lines show the best fit using a Michaelis-Menten model.
53
Figure II.3.10 Direct linear plot of Vm against Km using equation II.3.2. The slope and ordinate of each
line correspond to each experimental point of Figure II.3.9 which come from the average of three
independent measurements. (a) and (b) plots were constructed at benzyl viologen and formate
concentration constant (7.5 mM and 1 mM, respectively)
54
Figure II.3.11 Evaluation of effect of β-mercaptoethanol on the substrate affinity. (a) Initial rates vs.
formate concentration least square to the Michaelis-Menten model, and (b) DLP of Vm against Km.
Black and red lines correspond to assays performed with and without β-mercaptoethanol,
respectively.
56
Figure II.3.12 Initial rates versus concentration of β-mercaptoethanol in different conditions. (■)
standard kinetic assay; (●) assay in absence of formate; (▲) assay in absence of formate and enzyme;
(▼)subtraction of initial rates in absence of formate (●) and in absence of formate and enzyme (▲)
to those obtained in standard conditions (■). The concentration of benzyl viologen used was 7.5
mM.
57
Figure II.3.13 Influence of C-H breaking in the limiting rate step. (a) initial rates vs. formate
concentration (■, HCOONa; □, DCOONa). (b) Direct linear plot of turnover number against Km
(black and red lines correspond to HCOONa and DCOONa, respectively).
59
Figure II.3.14 Influence of C-H breaking in the sodium formate reduction by Dg Fdh. (a) turnover
number vs. formate concentration (■, HCOONa; □, DCOONa), and (b) direct linear plot of turnover
number against Km (black and red lines correspond to HCOONa and DCOONa, respectively).
61
Figure II.3.15 Inhibitor concentration (a, azide; b, cyanide and c, nitrate) vs. initial rate decreasing.
Concentration of formate used in the reaction mixture was 1 mM. 62
Figure II.3.16 Direct linear plots showing mixed inhibition by azide. Black and red lines correspond to
the experiments with and without inhibitor. Azide concentrations used in inhibition experiments
were 0.5 mM (a) and 2 mM (b).
64
Figure II.3.17 Competitive inhibition by nitrate (Cornish-Bowden Plot [87]). Formate concentration
used were: (■) 50 µM, (●) 100 µM, (▲) 200 µM and (▼) 1000 µM. 65
Figure II.3.18 Direct linear plot showing competitive inhibition by nitrate. Black lines: without
inhibitor, red lines: 20 mM nitrate. 66
Figure II.3.19 Dixon plot for competitive inhibition by nitrate. Formate concentration used were: (■)
50 µM, (●) 100 µM, (▲) 200 µM and (▼) 1000 µM. 66
Figure II.3.20 Direct linear plots showing mixed inhibition by cyanide. Black and red lines correspond
to the experiments with and without inhibitor. Cyanide concentration used in inhibition experiments
was 1.25 mM (a) and 2.5 mM (b).
67

Figure Index
xx
Figure II.3.21 Mo(V) EPR spectra of as-prepared and dithionite reduced enzyme. (a) As-prepared
signal, (b) Signal obtained after 10 min reduction with 10 times excess of dithionite, (c) Idem (b) but
incubated 30 min, and (d) Signal obtained after 30 min with 25 times excess of dithionite.
Frequency: 9.65 GHz, Microwave power: 2 mW, and Modulation Field: 10 Gpp, Temperature: 100K.
69
Figure II.3.22 Mo(V) EPR signals obtained after 30 minutes of formate addition to Dd Fdh together
with simulations. a) enzyme in H2O-buffer reduced with HCOONa, b) enzyme in H2O-buffer
reduced with DCOONa, c) enzyme exchanged into D2O-buffer reduced with HCOONa. d) enzyme
exchanged into D2O-buffer reduced with DCOONa. Simulations (red lines) were done with
parameters given in Table II.3.7. Frequency: 9.65 GHz, Microwave power: 2 mW, Modulation
amplitude, 5 G; Temperature, 100 K.
71
Figure II.3.23 EPR signals of azide inhibited samples obtained after 15 seconds of formate reduction
to Dd Fdh together with simulations. a) Inhibited enzyme in H2O-buffer reduced with HCOONa, b)
Inhibited enzyme in H2O-buffer reduced with DCOONa, c) Inhibited enzyme exchanged into D2O-
buffer reduced with HCOONa, d) Inhibited enzyme exchanged into D2O-buffer reduced with
DCOONa, and e) 2.094 signal from E coli Fdh-H. Simulations (red lines) were done with parameters
given in Table II.3.8. Experimental conditions: Microwave frequency, 9.65 GHz; Modulation field, 100
kHz, Modulation amplitude, 5 G; Microwave power, 2 mW; Temperature, 100 K.
73
Figure II.3.24 EPR signals of azide inhibited samples obtained at different incubation times with
sodium formate. a) Inhibited enzyme in H2O-buffer reduced 15 sec with DCOONa, b) Inhibited
enzyme in H2O-buffer reduced 15 min with DCOONa, c) Inhibited enzyme exchanged into D2O-
buffer incubated 15 sec with HCOONa, d) Inhibited enzyme exchanged into D2O-buffer incubated
15 min with HCOONa. Frequency: 9.65 GHz, Modulation field: 100 kHz, Modulation amplitude: 5 G,
Microwave power: 2 mW, and Temperature, 100 K.
75
Figure II.3.25 EPR spectra of the reduced FeS clusters in Dd Fdh at 20 K and 40K. Frequency: 9.65
GHz, Modulation field: 100 kHz, Modulation amplitude: 10 G, and Microwave power: 2 mW. 76
Figure II.3.26 Q-band spectra of the reduced FeS clusters in Dd Fdh at 10 K and 30K together with
its simulations (red lines). Frequency: 33.94 GHz, Modulation field: 100 kHz, Modulation amplitude:
5G, and Microwave power: 4.256 x 10⁻² mW
77
Figure II.3.27 FeS I EPR signal at 63.5 mW and 2 mW. Frequency: 9.65 GHz, Modulation field: 100
kHz,Modulation amplitude: 10 G, and Temperature: 40 K. 78
Figure II.3.28 EPR spectrum of the as-prepared Dd Fdh associated with the four different heme
groups. The peaks marked with an asterisk correspond to adventitious iron (g~4.3) and Mo signals
(g~2). Frequency, 9.65 GHz; Modulation field, 100 kHz; Modulation amplitude, 10 G; Microwave
power, 2 mW, and Temperature: 20 K.
79
Figure II.4.1 Schematic representation of the fdh gene organization in diverse bacteria. Dde:
Desulfovibrio desulfuricans G20, DVU: Desulfovibrio vulgaris Hildenborough, b14XX: Escherichia coli
K12.
82
Figure II.4.2 Tungsten catalytic site of Dg Fdh [39, 40]. Lys56 makes a bridge between the pterin and
the first [4Fe-4S] cluster which could be the electron transfer pathway of formate oxidation. 83

Figure Index
xxi
Figure II.4.3 Postulated SECIS element for Desulfovibrio desulfuricans fdhA. C: single C that prevents
UGA read through, T: bulged T that interacts with SELB (See section II.1.4). 84
Figure II.4.4. Potential energy as a function of the distance between the atoms involved in a C-H
bond (left) and C-D bond (adapted from reference [84]). The difference between the energies of the
fundamental vibrational state is indicated.
85
Figure II.4.5 Coordination around Mo centre for E coli. Data obtained from EPR experiments on Dd
Fdh suggests a similar coordination around Mo centre to that proposed for Mo(VI) from E coli Fdh-
H, where ligand X should correspond to an oxygenic species.
89
Figure II.4.6 Proposed coordination around Mo(V) centre. (a) Hexacoordinated structure proposed
on the basis of EPR data from Dd Fdh. (b) Pentacoordinated structure in agreement with re-
evaluation of crystallographic data obtained from E coli Fdh-H [42].
90
Figure III.2.1 Purification scheme of Blue protein from Desulfovibrio aminophilus. 105
Figure III.2.2 Purification scheme of Desulfovibrio alaskensis Blue protein. 106
Figure III.3.1 Electrophoretic pattern (a) and UV-visible spectra (b) of pure Blue Protein from
Desulfovibrio aminophilus. 113
Figure III.3.2 Electrophoretic pattern (a) and UV-visible spectra (b) of pure Blue Protein from
Desulfovibrio alaskensis. 114
Figure III.3.3 Mass spectra of Blue Protein from Desulfovibrio aminophilus. 115
Figure III.3.4 MALDI spectra of Desulfovibrio alaskensis Blue Protein. Peaks at 16.95 and 12.36 kDa
correspond to apomyoglobin and cytochrome c used for internal calibration. 116
Figure III.3.5 DNA and deduced amino acid sequence from Desulfovibrio aminophilus Blue Protein.
Upperlined sequence: potential Ribosomal Binding Site (RBS), light grey sequence: ATG initiator
codon, ▼: signal peptide cleavage site, arrows: peptides sequenced from Blue Protein. Amino acid
sequence of peptide 10 was included at C-termini.
118
Figure III.3.6 Multiple sequence alignment of isolated N-Terminal subunits with DNA deduced amino
acid sequence. DNAdeduced: amino acid sequence deduced from the nucleotide sequence,
RPalpha/beta: N-Terminal sequenced from alpha/beta subunit isolated by phase reverse
chromatography, PAGEalpha/beta: N-Terminal sequenced from alpha/beta subunit isolated by SDS-
PAGE.
120
Figure III.3.7 Alignment of N-Terminal sequences of Blue Protein from Desulfovibrio alaskensis. (PP)
and Zinc resistance-associated protein from Desulfovibrio desulfuricans G20 (Dd) 121
Figure III.3.8 DNA sequence containing the ORF for Blue Protein. Underlined sequence: potential
Ribosomal Binding Site (RBS), light grey sequence: ATG initiator codon of D. alaskensis Blue protein,
▼: signal peptide cleavage site, M and * (at positions 34 and 226, respectively): ORF of D. alaskensis
Blue protein, V and * (at positions 256 and 294, respectively): ORF of hypothetical protein, M (at
position 312): start codon of Ribunucleotido Reductase large subunit.
121

Figure Index
xxii
Figure III.3.9 X-Band EPR spectroscopy on as prepared Blue Protein from Desulfovibrio alaskensis
g=2.012, A=19 G, Frequency: 9.65 GHz, Microwave power: 2 mW, Modulation amplitude: 1 Gpp,
Temperature: 100 K.
123
Figure III.3.10 Iron K-edge near edge spectra of as- prepared Blue Proteins. (a) Da, (b) D. gigas Blue
protein, (c) FeIIO6, and (d) FeIII(SR)4. 124
Figure III.3.11 Fe EXAFS Fourier transforms of as-prepared Blue proteins. Upper panel: D.
aminophilus Blue protein, Lower panel: D. gigas Blue protein. The solid line indicates experimental
data and broken lines show best fits.
125
Figure III.3.12 Copper K-edge near edge spectra of as-prepared Blue Protein. (a) D. aminophilus, (b)
D. gigas Blue protein, (c) CuI(SR)2, (d) CuI(SR)3, and (e) CuI(SR)4. 126
Figure III.3.13 Cu Fe EXAFS Fourier transforms of as prepared Blue proteins. Upper panel: D.
aminophilus Blue protein, Lower panel: D. gigas Blue protein. The solid line indicates experimental
data and broken lines show best fits.
126
Figure III.3.14 Molybdenum K-edge near edge spectra of as-prepared Blue proteins. (a) Da, (b) D.
gigas Blue protein, (c) [MoO4]2-, and (d) [MoS4]
2-. 127
Figure III.3.15 Mo EXAFS Fourier transforms of as-prepared Blue proteins. Broken line: D. aminophilus
Blue protein, and solid line: D. gigas Blue protein. 128
Figure III.3.16 Comparison of the Mo K near-edge spectrum of Blue protein from D. alaskensis (black
lines) with molybdenum-iron-sulfur clusters, molybdate in aqueous solution and (NH4)2MoS4 (red
lines).
129
Figure III.3.17 Comparison of the Fe K-near-edge spectrum of Blue protein from D. alaskensis (black
lines) with molybdenum-iron-sulphur and iron-sulphur clusters (red lines). 130
Figure III.3.18 Mo K-edge k3-weighted EXAFS spectra (top) and the Fourier transforms (bottom) of
Blue protein from D. alaskensis. Solid lines: experimental data, Dashed lines: fit using the best model
given in Table III.3.4.
131
Figure III.3.19 Fe K-edge k3-weighted EXAFS spectra (top) and their Fourier transforms (bottom) of
Blue protein from Desulfovibrio alaskensis. Experimental data are shown by solid lines; calculated
spectra based on the best model given in Table III.3.5 are represented by dashed curves.
134
Figure III.4.1 Comparison of UV-visible spectrum of Blue proteins from Desulfovibrio aminophilus (red
line), Desulfovibrio alaskensis (black line), and Desulfovibrio gigas (Blue line) 137
Figure III.4.2 UV-visible spectrum of Mo-Fe proteins from Desulfovibrio africanus. Reproduced from
reference [1]. 138
Figure III.4.3 Multiple amino acid sequence alignment of Blue proteins. (Dam): D. aminophilus, (Dal):
D. alaskensis, (Dg): D. gigas, (DvH_DVU3384): D. vulgaris Hildenborough, locus tag DVU3384, (*):
identity, (:): strongly similar, and (.) weekly similar.
140
Figure III.4.4 Proposed metals centres in Blue proteins from Desulfovibrio alaskensis (a and b),
Desulfovibrio gigas (c), and Desulfovibrio aminophilus (d). 141

xxiii
TABLE INDEX
Table II.1.1 Fdh gene organization of several organisms. 25
Table II.2.1 Primers used to amplified Fdh DNA fragments from fresh Dd cells. 34
Table II.2.2 Specific primers used in Genome Walker technique. 35
Table II.3.1 Kinetic constants calculated by Michaelis-Menten (MM) model and Direct Linear Plot (DLP)
from experiments. Standard deviation between parentheses. 55
Table II.3.2 Kinetic constants calculated by Michaelis-Menten model and DLP from experiments with
and without β-mercaptoethanol. Standard deviation between parentheses. 57
Table II.3.3. Kinetic parameters calculated for Dd Fdh using HCOONa and DCOONa as substrates.
Standard deviation between parentheses. 60
Table II.3.4 Kinetic parameters calculated from Michaelis-Menten and Direct Linear Plot obtained from
Desulfovibrio gigas Fdh. The numbers in parenthesis are the standard deviations 61
Table II.3.5 Inhibition constants calculated for azide, cyanide and nitrate. 68
Table II.3.6 EPR parameters of Rhombic I and Rhombic II signals. Linewidths (within parentheses) are
given in Gauss. 70
Table II.3.7 EPR parameters for simulations of Mo(V) EPR signals. Linewidth are given in G between
parentheses. The A values are given in cm-1 × 10⁻⁴. Indexes 1 and 2 stand for the non-solvent and
solvent exchangeable protons, respectively.
71
Table II.3.8 EPR parameters for simulations of Azide signals. Linewidth (between parentheses) and A
are given in G and cm-1 × 10⁻⁴, respectively. 74
Table II.3.9 EPR parameters for simulations of FeS I signals. Linewidth (between parentheses) are
given in G. 77
Table II.4.1 Sequence identity percentage between Dd Fdh subunits and another related Fdhs.
Accession number of subunits from different microorganisms are: a, YP_012024, YP_012023 and
YP_012021; b, YP_390001 and YP_390002; c, Q934F5 and Q8GC87; d, YP_387213 and YP_387214;
e, YP_011694 and YP_011693; f, YP_009809 and YP_009810; g, YP_387309 and YP_387308; h,
P24183, P24184 and P24185 ; i, P32176, P32175 and P32174; j, P07658.
81
Table II.4.2 Kinetic parameters of Fdhs isolated from diverse sources 86
Table III.2.1 Growth media composition (per litre). Left column: D. aminophilus medium. Right
column: D. alaskensis medium. 103
Table II.2.2 Primers used in Desulfovibrio aminophilus Blue protein sequencing 111

Table Index
xxiv
Table III.2.3 Primers used in the sequencing of Desulfovibrio alaskensis Blue protein. 112
Table III.3.1 Extinction coefficients for Blue Proteins from Desulfovibrio aminophilus and Desulfovibrio
alaskensis. Values in M-1 cm-1 114
Table III.3.2 Metal ions per monomer for Desulfovibrio aminophilus, Desulfovibrio alaskensis, and
Desulfovibrio gigas Blue Proteins. 116
Table III.3.3 Amino acid sequence of peptides obtained from Desulfovibrio aminophilus Blue Protein.
Numbers in the first column correspond to peptide sequences indicated in Figure III.3.5. Amino acid
sequences aligned on the right column correspond to peptide sequence (upper) and amino acid
deduced sequence from DNA (lower).
119
Table III.3.4 EXAFS refinement parameters of different structural models of the Mo site in Blue protein
from Desulfovibrio alaskensis. The best fit is highlighted in red. The values in parentheses are the
estimated standard deviations obtained from the diagonal elements of the covariance matrix. The
value of F represents the goodness of the fit. N: interatomic distances, R: Debye-Waller factors given
in Å; and σ 2: mean-square deviations in interatomic distance in Å2.
132
Table III.3.5 EXAFS refinement parameters of different structural models of the Fe site in Blue protein
from Desulfovibrio alaskensis.. The best fit is highlighted in red. The values in parentheses are the
estimated standard deviations obtained from the diagonal elements of the covariance matrix. The
value of F represents the goodness of the fit. N: interatomic distances, R: Debye-Waller factors given
in Å; and σ 2: mean-square deviations in interatomic distance in Å2.
135
Table III.4.1 Identity percentages of Blue proteins amino acid sequences including the homologous
protein identified in Desulfovibrio vulgaris Hildenborough. Dam: D. aminophilus, Dg: D. gigas, Dal: D
alaskensis, and DvH: Desulfovibrio vulgaris Hildenborough.
139
1
I. GENERAL INTRODUCTION
Molybdenum is found in biological systems in a mononuclear form or forming part
of multinuclear metal clusters in the active site of a diverse group of enzymes that generally
catalyze electron-transfer reactions [1, 2]. These enzymes are ubiquitous and participate in
several biological processes occurring in nature, such as denitrification, the greenhouse
effect, and pollution of the soil water [3-5].
The best characterized example of an enzyme containing a multinuclear active site is
perhaps the enzyme nitrogenase. This enzyme catalyzes the following reaction:
N2 + 8e- + 8 H+ + 16 MgATP ↔2 NH3 + H2 + 16 MgADP + 16 Pi
The site of substrate activation and reduction has been localized to a complex
cofactor (Figure I.1), called FeMo cofactor. Until now the complexity of the system has
denied information concerning exactly where and how substrates interact with the metal-
sulphur framework of the active site.
Figure I.1 Catalytic active site of MoFe nitrogenase from Azotobacter vinelandii [6].
FeS
Mo
FeS
Mo
I.General Introduction
2
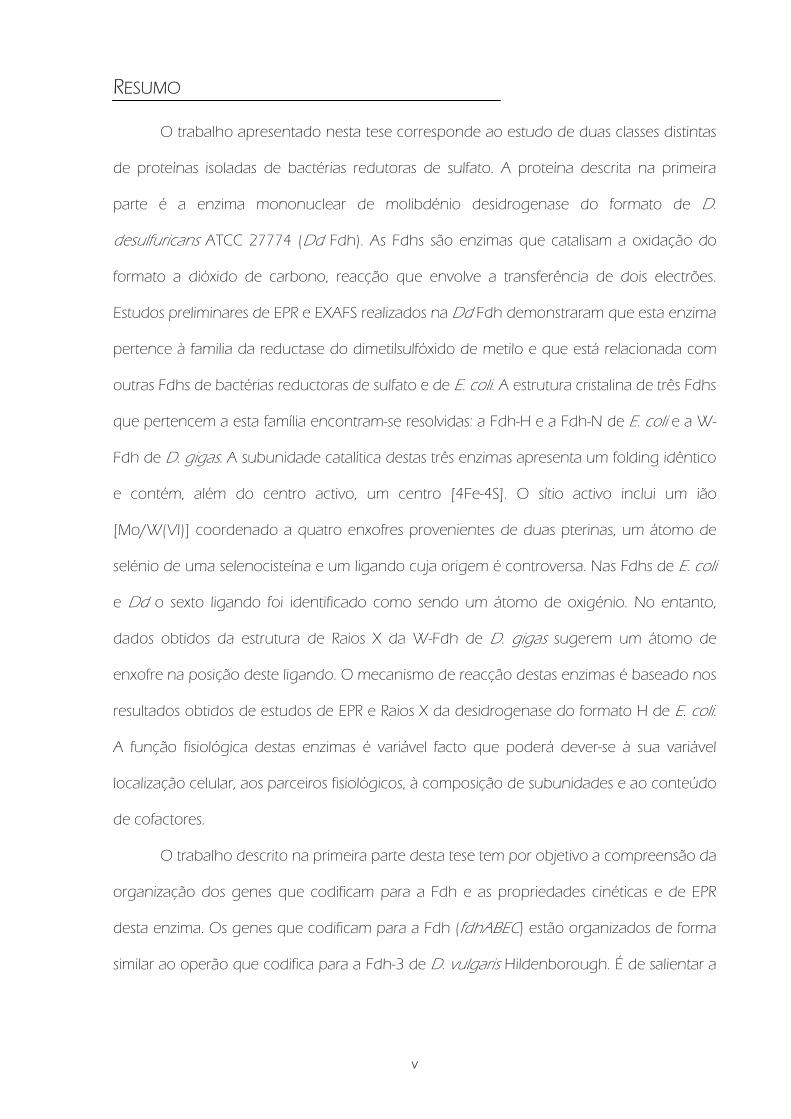
Another example is the heterodimer containing Cu and Mo present in the enzyme
CO dehydrogenase (Figure I.2). This enzyme catalyzes the oxidation of CO according to
the following reaction:
CO + H2O→ CO2 + 2e- + 2H+
The oxidized cluster contains the Mo ion in the +VI oxidation state which upon
incubation with CO or sodium dithionite is reduced to Mo(IV). The Cu ion permanently
remains in the +1 oxidation state.
Figure I.2 Catalytic active site of Cu,Mo-CO Dehydrogenase from Oligotropha carboxidovorans [7].
Molybdenum is also present in a mononuclear form in the active site of distinct types
of enzymes that are classified under the general name of Mononuclear molybdenum
enzymes. These enzymes have been divided into three groups called the xanthine oxidase
(XO), dimethyl sulfoxide reductase (DMSOR), and sulfite oxidase (SO) families [1, 8]. These
three families include not only the enzymes that give the name to the different groups but
also diverse enzymes such as aldehyde oxidoreductases, nitrate reductases, and formate
dehydrogenases among others. The active site of these enzymes (Figure I.3a) includes the
metal atom coordinated to one or two pyranopterin molecules and to a variable number
Mo
OCu
S
Mo
OCu
S

I.General Introduction
3
of ligands such as oxygen (oxo, hydroxo, water, serine, and aspartic acid), sulphur
(cysteines), and selenium (selenocysteines) atoms. The pyranopterin molecule is an organic
ligand that can be either in the monophosphate form or have a nucleotide molecule
attached by a pyrophosphate link (Figure I.3b)[9]. In addition, these proteins may also have
other redox cofactors such as iron-sulphur (FeS) centres, hemes, and flavin groups, which
are involved in intra- and intermolecular electron-transfer processes [10].
Figure I.3 (a) Active-site structure of the three families of mononuclear molybdenum- and tungsten-containing
enzymes. X and Y represent ligands such as oxygen (oxo, hydroxo, water, serine, and aspartic acid), sulphur
(cysteine), and selenium (selenocysteine) atoms. (b) Structure of the pyranopterin molecule.
With a few exceptions, these enzymes catalyze the transfer of an oxygen atom from
water to the product (or vice versa) in reactions that imply a net exchange of two electrons
between the enzyme and substrate and in which the metal ion cycles between the redox
states IV and VI. Figure I.4 shows two representative examples of half-reactions catalyzed by
mononuclear molybdenum enzymes. The members of the XO family catalyze the oxidative
hydroxylation of a diverse range of aldehydes (Figure I.4a) and aromatic heterocycles in
Mo SS
SOH(OH2)
OMoS
S
XS
S
Y
Mo S-CysS
SOH(OH2)
O
O NH
HN
N
NH
O
NH2
-S-S
OP
O
RO
-OS
S
R =
O
HO
N
N
OH
O P
O
O-
O
NH2
The Xanthine Oxidase family The DMSO Reductase family The Sulfite Oxidase family
=
a)
b)
HN
N N
N
O
H2N
MCD
O
HO OH
O P
O
O-
R = MGD
a)
b)
Mo SS
SOH(OH2)
OMoS
S
XS
S
Y
Mo S-CysS
SOH(OH2)
O
O NH
HN
N
NH
O
NH2
-S-S
OP
O
RO
-OS
S
R =
O
HO
N
N
OH
O P
O
O-
O
NH2
The Xanthine Oxidase family The DMSO Reductase family The Sulfite Oxidase family
=
a)
b)
HN
N N
N
O
H2N
MCD
O
HO OH
O P
O
O-
R = MGD
a)
b)
I.General Introduction
4
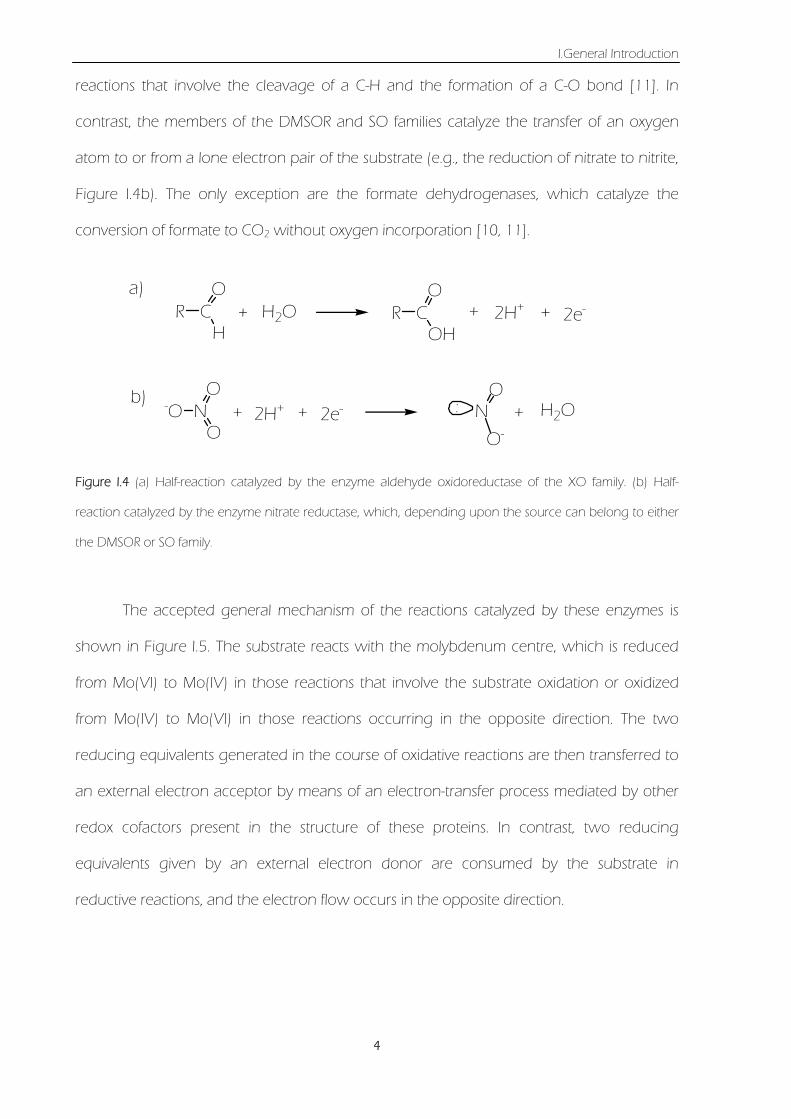
reactions that involve the cleavage of a C-H and the formation of a C-O bond [11]. In
contrast, the members of the DMSOR and SO families catalyze the transfer of an oxygen
atom to or from a lone electron pair of the substrate (e.g., the reduction of nitrate to nitrite,
Figure I.4b). The only exception are the formate dehydrogenases, which catalyze the
conversion of formate to CO2 without oxygen incorporation [10, 11].
Figure I.4 (a) Half-reaction catalyzed by the enzyme aldehyde oxidoreductase of the XO family. (b) Half-
reaction catalyzed by the enzyme nitrate reductase, which, depending upon the source can belong to either
the DMSOR or SO family.
The accepted general mechanism of the reactions catalyzed by these enzymes is
shown in Figure I.5. The substrate reacts with the molybdenum centre, which is reduced
from Mo(VI) to Mo(IV) in those reactions that involve the substrate oxidation or oxidized
from Mo(IV) to Mo(VI) in those reactions occurring in the opposite direction. The two
reducing equivalents generated in the course of oxidative reactions are then transferred to
an external electron acceptor by means of an electron-transfer process mediated by other
redox cofactors present in the structure of these proteins. In contrast, two reducing
equivalents given by an external electron donor are consumed by the substrate in
reductive reactions, and the electron flow occurs in the opposite direction.
a)
b)
R CO
H+ H2O R C
O
OH+ + 2e-
-O NO
O+ + 2e- N
O+ H2O
O-
:
2H+
2H+

I.General Introduction
5
Figure I.5 Accepted general mechanism for oxidative (left) and reductive (right) reactions catalyzed by
mononuclear molybdenum-containing enzymes.
In the last years, a few examples of other types of Mo enzymes have been reported.
Preliminary characterizations suggested the presence of clusters containing Mo among
other metal ions [12, 13]. Furthermore, until now, there are no clues on their function in
the cell though several hypotheses such as Mo transport and storage has been proposed.
The work presented in this thesis corresponds to the study of two different systems
in which the presence of Mo is the only link. In addition, the state of the art is at different
stages; therefore, the work is divided in two parts. The first part involves the study of the
enzyme Fdh from the SRB D. desulfuricans ATCC 27774. Preliminary EPR and EXAFS
characterization of this protein showed that it belong to the family of the DMSO reductase
(Figure I.3) and that is closely related to other Fdhs obtained from other sulphate reducing
organisms [10] and from the E coli Fdhs. The work performed on this enzyme is a
continuation of these studies and are oriented to understand the gene organization and
the kinetic and EPR properties of the as-prepared and inhibited forms of this enzyme.
Oxidative Reactions
Substrate Product
Mo(VI) Mo(VI)Mo(IV) Mo(IV)
Electron flow
Electron flow
EnzymeEnzyme
Acceptor (Oxidized)
Donor (Oxidized)
Donor (Reduced)
Acceptor (Reduced)
+2 e-
+2 e--2 e-
-2 e-
Substrate Product
Reductive reactionsOxidative Reactions
Substrate Product
Mo(VI) Mo(VI)Mo(IV) Mo(IV)
Electron flow
Electron flow
EnzymeEnzyme
Acceptor (Oxidized)
Donor (Oxidized)
Donor (Reduced)
Acceptor (Reduced)
+2 e-
+2 e--2 e-
-2 e-
Substrate Product
Reductive reactions
I.General Introduction
6
The second part of this work is oriented to the characterization of a novel Mo
protein isolated from the sulphate reducer D. alaskensis. A similar protein purified from the
SRB D. aminophilus seems to be a case in which Cu could replace Mo, and, therefore, is
also included in our study. The function of both proteins are still unknown and our work
was oriented to perform their primary characterization, e.g. molecular properties
determination, metal analysis, gene sequencing, and type and structure of the metal
clusters.

II. Molybdenum-containing proteins from Sulphate Reducing
Bacteria: revealing new features of old enzymes.


9
II.1 Introduction
II.1.1 Metabolism of formate in the bacterial cell
Formate can be a substrate (equation II.1.1) or a product (equation II.1.2) of diverse
reactions catalyzed by eukaryotes organisms, bacteria, and archae [14]. In addition, formate
is either required or used by several cells for biosynthesis [15] (equation II.1.3, e.g.
bioshynthesis of purines).
−− ++→ 2eH2CO2HCOO 22 , E=-420mV (equation II.1.1)
formateCoAacetylCoAPyruvate +−→+ , ∆Gº’=-16.3kJ/mol (equation II.1.2)
PiADPFHformyl-NATPFHFormate 410
4 ++−→++ , ∆Gº’=+8.4 3kJ/mol (equation II.1.3)
In prokaryotes formate serves as the major electron donor to a variety of respiratory
pathways which use terminal acceptors other than oxygen [16, 17]. Formate
dehydrogenase catalyzes the two-electron oxidation of formate to carbon dioxide
(equation II.1.1) being the key enzyme in this process. Formate dehydrogenases were
identified in several both prokaryotes and eukaryotes organisms.
The best understood metabolic way for formate in prokaryotes organisms, as well as
the best characterized Fdhs, corresponds to the E coli bacteria.
The genome of E coli contains three enzymes called Fdh-N, Fdh-O, and Fdh–H,
which can oxidize formate in both cytoplasmic and periplasmic sides [18]. Whereas Fdh-N
and Fdh-O are membrane bound enzymes with the catalytic subunit located in the
periplasmic side of the cell, Fdh-H is a cytoplasmic protein (Figure II.1.1). Therefore,
endogenous and exogenous formate must diffuse to periplasm and cytoplasm to be
metabolized. Endogenous formate is derived primarily from pyruvate through a cleavage
reaction catalyzed by pyruvate formate-lyase (PFL) [19].

II.1 Introduction
10
The Fdh-N enzyme is expressed when cells are grown anaerobically in the presence
of nitrate [20] and couples formate oxidation with nitrate reduction through the respiratory
nitrate reductase [21-24]. In this system, formate is oxidized on the periplasmic side and the
two electrons released are transported across the membrane to a bound menaquinone,
which upon reduction takes up two protons from the cytoplasm. The electrons are
transferred to Nar for the nitrate reduction in the cytoplasmic side on the membrane and
the protons are released to the periplasm (Figure II.1.1). In contrast, Fdh-O is induced when
cells are grown aerobically, but the enzyme is also induced under nitrate respiring
conditions [25].
Fdh-H is synthesized only during fermentative conditions, forming part of the
multiprotein formate hydrogen lyase complex (FHL) [19, 26, 27]. The active site of Fdh-H is
located on the cytoplasmic side of the membrane (Figure II.1.1).
Figure II.1.1 Schematic representation of formate metabolism in E coli. (Adapted from reference [28])
In contrast, there is no much information on the formate metabolism in sulphate
reducing bacteria. Most of the work has been performed on the genus Desulfovibrio and
Periplasm
CytoplasmNO3
- + 2 H+ NO2- + H2O
HCOO- CO2- + H+
HCOO- CO2- + H+
HCOO- CO2- + H+
Nitrate Reductase
Fdh-N
Fdh-H
Fdh-O
FHL ?FocA
PFL
Quinone Quinone poolpoolMK
MKH2
HCOO- + AcetylCoa Pyruvate + CoA
HCOO-
HCOO-
H+
H+2 H+
2 H+
Periplasm
CytoplasmNO3
- + 2 H+ NO2- + H2O
HCOO- CO2- + H+
HCOO- CO2- + H+
HCOO- CO2- + H+
Nitrate Reductase
Fdh-N
Fdh-H
Fdh-O
FHL ?FocA
PFL
Quinone Quinone poolpoolMK
MKH2
HCOO- + AcetylCoa Pyruvate + CoA
HCOO-
HCOO-
H+
H+2 H+
2 H+

II.1 Introduction
11
the recent sequence of D. vulgaris Hildenborough genome has given important insights
on the energy transduction and electron transport mechanisms [29].
In the D. vulgaris Hildenborough genome, three periplasmic formate
dehydrogenases were identified. The detection of these Fdhs indicates that formate
endogenous and exogenous must diffuse to periplasm to be metabolized [29]. As shown
in Figure II.1.2, endogenous formate could generate from lactate oxidation to pyruvate,
which could be then oxidized by a putative pyruvate-formate lyase (PFL) identified in its
genome [29]. Subsequently, either the formate diffusing into the periplasm from cytoplasm
or that from external sources is metabolized to CO2 by any of the formate dehydrogenases.
Electrons from formate oxidation would be transferred directly or indirectly to a
cytochrome matrix for subsequent release to cytoplasm where sulphate is reduced (Figure
II.1.2). Additional work is necessary to confirm this supposed pathway.
Figure II.1.2 Schematic representation of formate metabolism in Desulfovibrio vulgaris Hildenborough
(Adapted from [29]).
Periplasm
Cytoplasm
Fdh-3
?
Putative PFL
Pyruvate + CoA HCOO- + AcetylCoa
HCOO-
HCOO-
HCOO- CO2- + H+ + 2 e-
HCOO- CO2- + H+ + 2 e-
HCOO- CO2- + H+ + 2 e-
LDH
Lactate Pyruvate
c553
Fdh-1Fdh-2
Fdh
as
soci
ated
cy
toch
rom
e c
?

II.1 Introduction
12
II.1.2 Biochemical and structural properties of Mo- and W-Formate Dehydrogenases
belonging to the DMSO reductase family
Formate dehydrogenases may be classified into two major families: NAD+-
dependent and NAD+-independent Fdhs. According to the main properties, NAD+-
dependent Fdhs can be also divided in two subgroups. The first group includes enzymes
that resemble the yeast-type Fdh and are in general insensible to oxygen. These enzymes
contain two identical subunits, lack of metal cofactors and shows low affinity for formate.
The second group comprises enzymes that have complex subunit structures, cofactors, and
contains biologically active transition metals like molybdenum or tungsten [30-34].
NAD+-independent Fdhs include a diverse group of microbial metalloproteins
differing in factors such as physiological role, cellular location, substrate specificity, nature of
physiological electron acceptor and content and type of metal cofactors [10, 35]. This
group comprises a wide number of enzymes which can contain Mo or W in their active
site. The most common Formate dehydrogenases belong to the big family of mononuclear
Mo-enzymes and are usually found in anaerobic bacteria. Other W-Fdhs, which are usually
purified from hyperthermophilic organisms and contain a pterin cofactor at the active site,
have been classified in a different family called the W-enzymes [2, 36]. These enzymes are
not analyzed in our study and they will not be discussed any further.
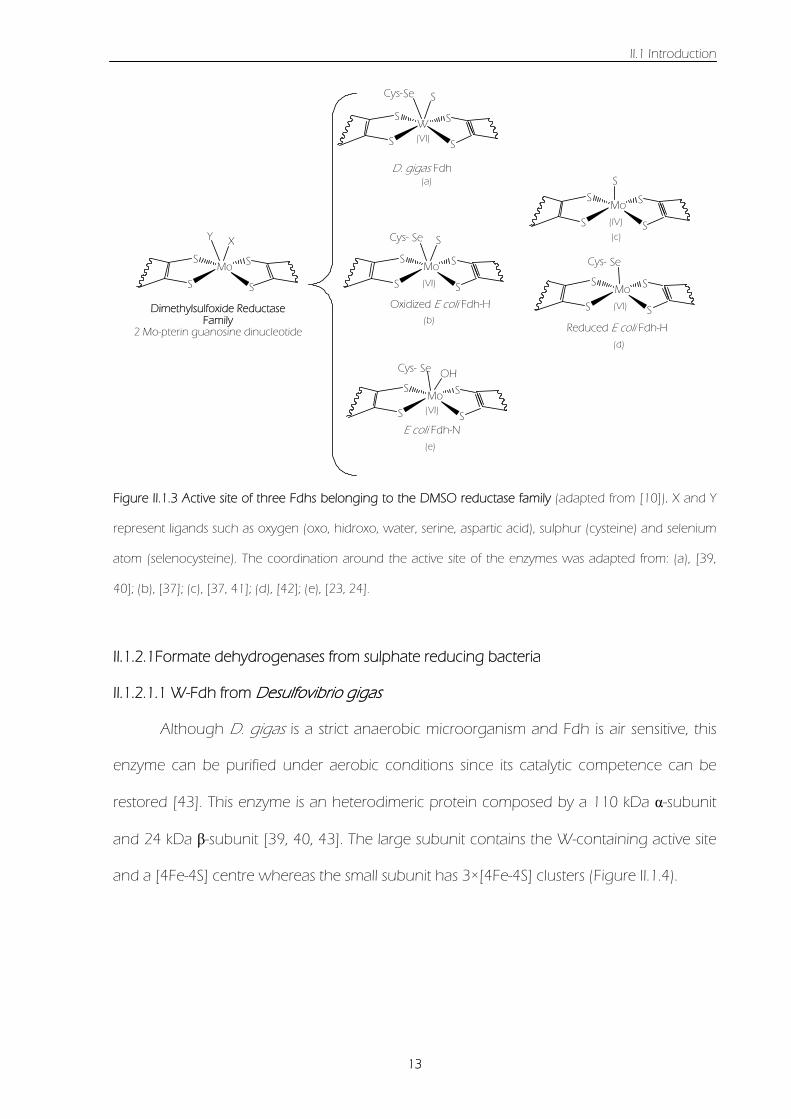
The structures of three Fdhs belonging to the dimethyl sulphoxide (DMSO)
reductase family have been solved so far. Two of them are the Mo-containing Fdhs from E
coli [37, 38] and one W-Fdh from D. gigas [39, 40]. These enzymes show a similar
geometry coordination around Mo(W) ion (Figure II.1.3), but different subunit composition
and cell location [1, 8, 10]. The biochemical and structural properties of these enzymes
together with the best characterized Fdhs from sulphate-reducing bacteria are discussed in
the following sections.
II.1 Introduction
13
Figure II.1.3 Active site of three Fdhs belonging to the DMSO reductase family (adapted from [10]). X and Y
represent ligands such as oxygen (oxo, hidroxo, water, serine, aspartic acid), sulphur (cysteine) and selenium
atom (selenocysteine). The coordination around the active site of the enzymes was adapted from: (a), [39,
40]; (b), [37]; (c), [37, 41]; (d), [42]; (e), [23, 24].
II.1.2.1Formate dehydrogenases from sulphate reducing bacteria
II.1.2.1.1 W-Fdh from Desulfovibrio gigas
Although D. gigas is a strict anaerobic microorganism and Fdh is air sensitive, this
enzyme can be purified under aerobic conditions since its catalytic competence can be
restored [43]. This enzyme is an heterodimeric protein composed by a 110 kDa α-subunit
and 24 kDa β-subunit [39, 40, 43]. The large subunit contains the W-containing active site
and a [4Fe-4S] centre whereas the small subunit has 3×[4Fe-4S] clusters (Figure II.1.4).
MoS
S
X
S
S
Y
Dimethylsulfoxide ReductaseFamily
2 Mo-pterin guanosine dinucleotide
Oxidized E coli Fdh-H
S
E coli Fdh-N
OH
WS
S
S
S
S
SeCys-
D. gigas Fdh
MoS
S
S
S
MoS
S
S
S
SeCys-
(VI)
(VI)
(VI)
Reduced E coli Fdh-H
S
MoS
S
S
S(IV)
SeCys-
MoS
S
S
S
SeCys-
(VI)
(a)
(b)
(c)
(d)
(e)

II.1 Introduction
14
Figure II.1.4 Stereo representation of the overall structure of W-Fdh from Desulfovibrio gigas (a) and the
redox cofactors involved in electron transfer (b) (reproduced from [35, 39, 40]).
The primary structure of the N-terminal large subunit (35 first aminoacids) shows the
presence of a signal peptide with the twin arginine motif RRxFLK [44]. This feature is
characteristic of Sec-independent export to the periplasm and harbored by periplasmic
molybdoproteins. Amino acid sequence of small subunit lacks signal peptide suggesting
that αβ complex is formed in cytoplasm before translocation to the periplasm [40]. A similar
feature was observed for [NiFe] hydrogenases [45]. The amino acid sequence of the α-
subunit shows the presence of conserved residues involved in the stabilization and
orientation of substrate (Arg407), coordination around W center (SeCys158), enzymatic
mechanism (His159) and electron pathway between W and FeS I (Lys56) [40].
D. gigas Fdh is the first representative W-enzyme from a mesophile whose crystal
structure has been solved [39, 40]. Following the classification used for E coli Fdh-H [37]
and Dd 27774 Periplasmic Nitrate Reductase [46], the large subunit was divided in four
ß-subunit
α-subunit
W-bisMGD
FeS I
FeS II
FeS III
FeS IV
a) b)
ß-subunit
α-subunit
W-bisMGD
FeS I
FeS II
FeS III
FeS IV
a) b)

II.1 Introduction
15
domains (I, II, III, and IV). The W-active site is buried inside the protein and is stabilized by
hydrogen bonding interactions to residues of mainly domains II, III and IV. Domain I carries
the characteristic cysteine motif that binds the first [4Fe-4S] center (-CX2CXnCXmC-). The N
terminus of the large subunit wraps around the smaller subunit and contributes to the
stability of the functional heterodimer. Like other Fdhs, coordination around W in the
oxidized state includes four sulphurs, a SeCys and a sixth ligand that refined better as a
sulphur than a oxygen atom, which is in contrast with that reported for the E coli enzymes
(Figure II.1.5) [10].
Figure II.1.5 Coordination around W atom in the oxidized Fdh from Desulfovibrio gigas.
II.1.2.1.2 Formate dehydrogenases from Desulfovibrio vulgaris Hildenborough
D. vulgaris Hildenborough contains three periplasmic Mo-Fdhs. As already observed
in others Fdhs, the α-subunit of the three enzymes contains the active site and a [4Fe-4S]
cluster. The β-subunit of Fdh-1 and Fdh-2 contains 2× [4Fe-4S] clusters whereas Fdh-3 has
3× [4Fe-4S] centres. Fdh-3, the best characterized DvH Fdh, is a trimeric protein which
contains in the third subunit four hemes type c [47] homologous to the soluble tetrahemic
cytochrome c3 found in Desulfovibrio species [48]. The physiological partner of this Fdh
have been suggested to be the monohemic cytochrome c553 [47, 49, 50]. Fdh-2 is also a
His158
SeCys
W
S
His158
SeCys
W
S

II.1 Introduction
16
trimeric enzyme which includes in the γ-subunit 11 c binding sites and have as redox
partner a membrane bound cytochrome [29].
II.1.2.1.3 Formate dehydrogenase from Desulfovibrio alaskensis NCBI 1391
D. alaskensis Fdh is aerobically purified in two isoforms each containing Mo- or W-
bis MGD at the active site. The protein is constituted by a 93 kDa α-subunit and a 32 kDa β-
subunit. The UV-visible absorption spectrum of this enzyme is typical of an iron-sulphur
protein and is very similar to that of the D. gigas W-Fdh which suggests a similar cofactor
organization for both proteins. The EPR experiments shows at least three different [4Fe-4S]
centres [51], but spin quantification of the FeS signal yields lower values than that expected
for a protein containing 4 × [4Fe-4S] cluster, which suggests that the protein loses some
iron during purification.
II.1.2.1.4 Formate dehydrogenase from Desulfovibrio desulfuricans ATCC 27774
Dd Fdh is a periplasmic trimeric enzyme which can be purified aerobically. The large
subunit (~110 kDa) contains the Mo-bis MGD and one [4Fe-4S] centre [52]. EXAFS studies
on the active centre of this enzyme show a hexacoordination around the Mo atom [53].
Dd Fdh, in its oxidized form, shows that Mo atom is coordinated to four sulphur atoms, an
oxo-group and a Se atom. In addition, these data are consistent with a Se-S bound (Figure
II.1.6a). In the reduced form of the enzyme, the oxo-group is replaced by a des-oxo ligand
and the Se-S bound is reduced (Figure II.1.6b) [53].
A preliminary characterization of Dd Fdh [52] proposed a total of 2×[4Fe-4S]
clusters. This result suggests that β-subunit contains only one [4Fe-4S] cluster which is
unlike when compared with homologous Fdhs [23, 38-40]
As already observed in the closely related DvH Fdh-3, the γ-subunit (~14kDa) is a
cytochrome which was proposed to contain four hemes type c in a low spin configuration.

II.1 Introduction
17
Figure II.1.6 Postulated coordination around Mo active site of Dd Fdh on the basis of EXAFS data [53].
Oxidized (a) and reduced state (b).
II.1.2.2 Formate dehydrogenases from E coli
II.1.2.2.1 Formate dehydrogenase H
Fdh-H is a monomeric cytoplasmic enzyme (79 kDa) which contains a Mo-bis MGD
at active site and a FeS centre of the type [4Fe-4S]. The Fdh-H enzyme is extremely oxygen
sensitive and needs to be purified in presence of high concentrations of azide. Despite this
molecule was demosntrated to be a strong inhibitor of Fdhs, it is though to be necessary to
protect inactivation by oxygen [54].
The structure of this enzyme consists of four αβ domains (Figure II.1.7) [37]. Domain
I coordinates the [4Fe-4S] cluster just bellow to the protein surface. Domain II coordinates
the MGD801 and domain III coordinates MGD802.
Se
MoSS S
S
O
Oxidized active site
[VI]
C
Se
MoSS S
S[IV]
C
Reduced active site
OH2
(a) (b)

II.1 Introduction
18
Figure II.1.7 Stereo view of E coli Fdh-H [37]. Domains I, II, III and IV are shown in blue, green, yellow and red,
respectively. Redox cofactors (Mo bis-MGD and [4Fe-4S] cluster) are represented as balls model.
In the oxidized state, the Mo(VI) ion of the active site is coordinated to the four cis-
dithiolene sulphurs of the MGD cofactors, SeCys140 and a hydroxil ligand (Figure II.1.8). In
contrast, a recent reinterpretation of the E coli Fdh [42] postulates a sulphur atom in the
position of the hydroxyl ligand coordinated to the Mo(VI) specie.
Figure II.1.8 The oxidized active site of E coli Fdh-H.
DDoommaaiinn II
DDoommaaiinn IIII
DDoommaaiinn IIIIII
DDoommaaiinn IIVV
His141
SeCys
Mo(VI)
OH
His141
SeCys
Mo(VI)
OH
His141

II.1 Introduction
19
The X-Ray structure of the reduced enzyme shows that the coordination geometry
around Mo(IV) is closely approximated by a distorted square pyramid where the sulphur
atoms provide the four equatorial ligands and the selenocysteine provides the apical ligand
(Figure II.1.9a) [37]. In contrast, a recent reinterpretation of these data potulates that the
the apical position of the pyramid corresponds to a sulphur atom (Figure II.1.9b) [42].
Figure II.1.9 Coordination around the reduced active site of E coli Fdh-H. (a) Formate reduced form as
determined by Boyington J.C. et al. [37] (b) New interpretation by Raaijmakers & Romão [42].
II.1.2.2.2 Formate Dehydrogenase N
The enzyme Fdh-N and thedissimilatory nitrate reductase cooperate in one of the
major alternative respiratory pathway: the nitrate reduction coupled to a transmembrane
proton gradient (Figure II.1.1 [55]. Fdh-N is a large complex of 600 kDa with a (αβγ)3
structure. This enzyme is a membrane-bound protein that contains a Mo bis-MGD cofactor,
heme and non-heme iron (Figure II.1.10) [38].
The catalytic α-subunit is located on the periplasmic side and harbours the Mo bis-
MGD cofactor, a [4Fe-4S] cluster and the intrinsic SeCys residue. This subunit was divided
into five domains (I-V). Domain I binds the [4Fe-4S] cluster, whereas domains II and III are
His141
SeCys
Mo(IV)
S
Arg333
His141
SeCys
Mo(IV)
(a) (b)
His141
SeCys
Mo(IV)
S
Arg333
His141
SeCys
Mo(IV)
(a)
His141
SeCys
Mo(IV)
(a) (b)

II.1 Introduction
20
mainly involved in the coordination of the active site. The overall fold of this subunit is
similar to the structures of D. gigas W-Fdh [40] and E coli Fdh-H [10, 23].
The β-subunit of Fdh-N has 4×[4Fe-4S] clusters and contains transmembrane helix in
its C-terminal region. The N and C termini of the subunit are on the periplasmic and
cytoplasmic sides, respectively. The subunit is divided into two subdomains each containing
2×[4Fe-4S] centres. This arrangement is similar to that of the small subunit of D. gigas W-
Fdh, but the difference is that one of the subdomains only contains one [4Fe-4S] centre
[39, 40].
The γ-subunit is a membrane bound cytchrome b with four transmembrane helices.
This subunit contains two heme b groups (bc and bp) and a menaquinone reduction site.
All four transmembrane helices are involved in maintaining the two heme groups;
however, only three provide the heme ligands. Heme bp, which is in the periplasmic side,
receives electrons from the β-subunit. The electrons are then given to heme bc, which is in
the cytoplasmic side, to be finally transferred to the menaquinone.
Since edge-to-edge distances between redox centres (6 to11 Å) are shorter than the
reported limit of physiological transfer (14 Å) [56] and than adjacent monomers (26.5 Å),
the electrons transfer occurs within the monomer being each monomer a functional unit.

II.1 Introduction
21
Figure II.1.10 Fdh-N from E coli. Left: overall stereo view with redox cofactors represented as balls model.
Right: Arrangement of redox cofactors involved in electron pathway from formate to oxidized menaquinone.
II.1.3 Oxidation of formate to carbon dioxide: The proposed reaction mechanisms
Most of the enzymes containing molybdopterin are involved in catalysis of reactions
in which an oxygen atom is transferred from the water to the product (equation II.1.4) [1,
57]. Fdh should be considered an oxotransferase if bicarbonate would be the direct
product of formate oxidation (equation II.1.5). Nevertheless, mass spectrometric studies on
E coli Fdh-H demonstrated that CO2 rather than bicarbonate is the primary product of
Periplasm
Cytoplasm
Mo bis-MGD
FeS-0
FeS-IV
FeS-II
FeS-II
FeS-III
β-subunit
α-subunit
γ-subunit
heme bp
heme bc

II.1 Introduction
22
formate oxidation (equation II.1.6) [41]. Consequently, Fdh is an exception in terms of
reaction mechanism.
+− ++⇔+ 2H2eXOOHX 2 (equation II.1.4)
+−−− ++⎯→⎯+ 2H2eHCOHCOOOH 3Fdh
2 (equation II.1.5)
−− ++→ 2eH2CO2HCOO 22 (equation II.1.6)
Figure II.1.11 shows two proposed reaction mechanisms for Fdhs based on the
crystal structure data of the E coli enzyme. The mechanism in black includes the species
proposed by Boyington et al [37, 41] whereas the one in red the species by Raaijmakers &
Romão [42]. In the mechanism of Boyington et al. [37, 41] the cycle begins when the
formate molecule binds to the Mo(VI) site replacing the oxygen ligand. In doing this, it is
though that the residues Arg333 and His141 are necessary to stabilize and to orient the
substrate molecule (Figure II.1.12). The oxidation of the formate molecule implies the lost of
the α-proton of formate, which is transferred to the nearby His141[41], and the concomitant
transfer of the two electrons to the Mo ion, after which, the CO2 molecule is released. The
next step is to shuttle electrons from the square pyramidal Mo(IV) site to the external
electron acceptor through the [4Fe-4S] centre and thus catalytic cycle is completed. The
residue Lys44, which is well conserved in Fdhs, it is though to be essential in this process
(Figure II.1.12). A similar mechanism was proposed by Raaijmakers and Romão but differs in
that the formate molecule coordinates in the position of SeCys (Figure II.1.11, red arrows).

II.1 Introduction
23
Figure II.1.11 Schematic representation of the reaction mechanism. Black line: proposed reaction mechanism
for E coli Fdh-H by references [37, 41]. Red line: proposal for the reaction mechanism deduced from the
reanalysis of the X-ray data of formate-reduced Fdh-H [42].
MoS
S SS
O
Arg333+
COH
HCOO-
CO2
SH(OH)SeCys
MoSS S
S
SH(OH)
Reduced active site
Oxidized active site
Substrate-bound active site
MoSS S
S
SH(OH)
[IV]
MoS
S SS
O
CO
H
SH(OH)
[VI]
SeH
MoSS S
S
HisN
NH
Cys
Se
MoS
S SS
HisNH
NH+
Cys
[IV][V]
CO2
HCOO-
[VI]
[VI]
SeCys HCOO-
SeCys140
Arg+SeCys-
H+
His141
Arg+SeCys -
+His141
MoSS S
S
SH(OH)
[IV]
Arg+SeCys -
+His141
Reduced active site

II.1 Introduction
24
Figure II.1.12 The nitrite/formate binding site. Nitrite molecule replaces the OH/SH ligand being stabilized by
Arg333. The postulated electron transfer pathway is shown by grey arrows.
II.1.4 Gene organization of Formate Dehydrogenases
Table II.1.1 shows operons encoding NAD+-independent Fdhs identified in several
bacteria.
The operons present variability in both composition and organization. In addition,
some bacteria contain in the same genome up to three fdh-coding operons [29].
4Fe-4S
Lys44
MPT802
MPT801
Arg333
Mo(VI)
SeCys140
His141
H2O
NO2-

II.1 Introduction
25
Table II.1.1 Fdh gene organization of several organisms.
The fdhA gene (fdhf and fdnG in E coli Fdh-H [27] and Fdh-N [20], respectively)
codifies for the catalytic subunit which contain the active site, a Mo or Wbis-MGD, and one
FeS centre.
In periplasmic enzymes, FdhA contains a signal peptide with a twin-arginine motif
(SRRxFL/IK). Targeted proteins are substrate for the twin-arginine transport (Tat) system. This
is a protein-targeting pathway found in the cytoplasmic membranes of many prokaryotes
and the thylakoid membranes of chloroplasts [58, 59] whose function is transport fully
folded proteins. In addition, the Tat translocase itself is thought to accept or reject proteins
for transport through a quality control activity [60].
Another important feature in fdhA is the presence of a UGA codon. UGA, usually a
stop codon, can also direct the incorporation of the modified amino acid selenocysteine
[27, 61]. The mechanism of distinguishing between a selenocysteine insertion into a
polypeptide and a termination polypeptide synthesis depends on the presence of a 40-base
sequence downstream of the UGA codon [62]. This sequence fold into a stem-loop
structure called SECIS element. The SECIS element contains a conserved cytosine, adjacent
to the UGA codon, which prevents UGA reading. Furthermore, a bulged timine, which
Organism Gene organization
fdhCAB
fdhAB
fdhBA
fdhABED
fdhAB
fdhBACD
fdhCEBA
fdnGHI
hycABCDEFGHI
Sulfurospirillum multivorans fdhEABCD
Desulfitobacterium hafniense fdhGHIE SelA SelB
Pseudomonas fluorescens fdhABCE
Desulfovibrio desulfuricans G20
Desulfovibrio vulgaris Hildenborough
Escherichia coli K12

II.1 Introduction
26
interacts with a protein homologous to the elongation factor (SELB), is included (Figure
II.1.13). Both cytosine and timine provide the additional information required for SeCys
incorporation In E coli, SECIS element and selA, selB, selC and selD gene products are
necessary for selenocysteine insertion [63, 64]. The presence of SECIS element was also
detected in D. gigas W-Fdh [65].
Figure II.1.13 Postulated SECIS element for: a) D. gigas fdhA [65] and b) Escherichia coli K12 fdhF [63]. C:
single C that prevents UGA read through, T/U: bulged U/T that interacts with SELB.
The fdhB gene product (fdnH in E coli) is a ferredoxin-like protein. The fdhB product
(FdhB) lacks signal peptide which suggests that, in periplasmic proteins, the formation of a
complex between fdhA and fdhB product in the cytoplasm before translocation to
periplasm [40, 45]. The number of cysteine motifs (-CXXCXnCXmC-) which coordinates the
FeS clusters is variable.
The fdhC gene encodes a c-type cytochrome which is a part of trimeric Fdhs.
Although multimeric Fdhs have been found several bacteria, the presence of low redox
potential c-type cytochromes in Fdhs is specific to sulphate-reducing bacteria [50].

II.1 Introduction
27
The fdnI gene codifies for a b-type cytochrome which is the transmembrane protein
of membrane-associated Fdhs [23, 24, 38]. In E coli Fdh-N, a menaquinone reduction site
was identified in the product of fdhI gene, which is in agreement with the menaquinol
reduction function proposed for this subunit.
The function of fdhD and fdhE genes product is not completely clear. Studies on
Fdh-N from E coli k12 suggest that in vivo role of the fdhD (fdnC in S. typhimurium) gene
product is in enzyme assembly or maturation [66, 67].

28

29
II.2 MATERIALS AND METHODS
II.2.1 Cell growth and protein purification
D. desulfuricans ATCC27774 Fdh was isolated as reported before [52] but with
some modifications. Cells (800 g wet weight) were suspended in 10 mM Tris-HCl buffer
and ruptured in a French press at 9000 psi. After centrifugation (10000 × g, 45 min) and
ultracentrifugation (180000 × g, 60 min) the supernatant was dialyzed against 10 mM Tris-
HCl buffer. The soluble extract was subjected to a four step purification protocol. In the first
purification step soluble extract was loaded onto an anionic exchange column (DEAE-
CelluloseTM, equilibrated with 10 mM Tris-HCl). The proteins were eluted using a Tris-HCl
gradient (10-500 mM) and the fraction containing mainly Fdh was collected at ~200 mM.
The second purification step included another anionic exchange column (Q-Sepharose,
equilibrated with 10 mM Tris-HCl) in which a Tris-HCl gradient (10-250 mM) was applied.
Fdh was eluted at ~200 mM ionic strength. After the first two anionic exchange
chromatography, the major contaminants were Periplasmic nitrate reductase, ATP
sulphurylase, Isadoxin and Split Soret. The third chromatographic step was a
Hydroxyapatite column equilibrated with 100 mM Tris-HCl and eluted with a potassium
phosphate linear gradient from 1 to 200mM. Fdh was eluted at 200 mM potassium
phosphate. In contrast to that previously observed [52], no loss of activity was detected
after the Hydroxyapatite column. In this step, Fdh co-eluted with ATP sulfurylase and Split
Soret. Finally, a Superdex 200 (Pharmacia) column (equilibrated with 300 mM Tris-HCl) was
used and Fdh was obtained pure as judged by SDS-PAGE. All purification procedures were
performed under aerobic conditions at 4 ºC and pH 7.6. This procedure yielded
approximately 30 mg of enzyme with a specific activity of 143(6) μmol/min/mg.

II.2 Materials and Methods
30
II.2.2 Protein and Metal quantification
A modified version of the Lowry/Biuret method [68] and Bicinchoninic Acid Kit
(Sigma) were used for quantification of the protein concentration using bovine serum
albumin as standard protein. In the modified Lowry/Biuret method, 0.4 ml of Biuret reagent
was added to 0.1 ml of sample and incubated for 10 min at room temperature. Then, 3.5
ml of 2.3% Na2CO3 and 0.1 ml of Folin-Ciocalteu's phenol reagent were added and the
sample was incubated for 30 min at room temperature. Finally, the absorbance was
measured at 750 nm.
Mo, Se and Fe were quantified by inductively coupled plasma emission analysis in a
Jobin-Yvon (Ultima) instrument using standards from Reagecom in a concentration range
of 0.05-1.5 ppm.
II.2.3 Molecular weight determination
The molecular mass of the native protein was determined by gel filtration using a
Superdex 200 column (1 x 30 cm) (Pharmacia) with a flow rate of 0.5 ml/min. The volume
of protein or standard injected was 200 μl. The elution buffer was 50 mM potassium
phosphate buffer pH 7.6 with 150 mM NaCl. The standards used were aprotinin (6.5 kDa),
cytochrome c (12.4kDa), ovalbumin (47.2 kDa), aldolase (158 kDa), catalase (232 kDa) and
ferritin (440 kDa) from Amersham Pharmacia.
In order to establish the protein purity and subunit composition, 15% tricine SDS-
PAGE was carried out [69]. The standards used were: α-lactalbumin (14.4 kDa), trypsin
inhibitor (20.1 kDa), carbonic anhydrase (30 kDa), ovalbumin (45 kDa), albumin (66 kDa)
and phospholylase b (97 kDa) from Amersham Pharmacia. Proteins in the gel were stained
with Coomassie Brillant Blue or silver stain [70].

II.2 Materials and Methods
31
II.2.4 Activity assays
Enzymatic assays were performed under anaerobic conditions in a final volume of
1.1ml following the reduction of benzyl viologen at 555 nm as previously described [52]
but with some modifications. Enzyme (35 nM) was pre-incubated for 10 minutes at 37ºC
with a solution containing 130 mM β-mercaptoethanol in 60 mM Tris-HCl, pH 7.6. Then,
enzyme was reduced adding substrate (HCOONa or DCOONa) and incubating for 10
minutes. The reaction was started by the addition of 7.5 mM benzyl viologen. The addition
order of the reagents constitutes the main difference with the previously employed
method. Inhibition studies were performed adding azide, cyanide or nitrate together with
the electron acceptor. All the procedures were performed under strict anaerobic
conditions.
The absorbance changes versus time were recorded on an Agilent 8453 diode
array spectroscopy system (sampling interval 0.9 nm between 190 – 1100 nm), equipped
with a single-cell thermosettable holder in an open sample compartment. Experimental
data were plot and fitted using least square fitted with appropriated models.
II.2.5 EPR spectroscopy
II.2.5.1 X-Band EPR spectroscopy
Spectra were recorded on a Bruker EMX spectrometer equipped with a dual-mode
cavity (Model ER4116DM) and an Oxford Instrument continuous flow cryostat. Simulations
of the Mo(V) signals were performed with the program Q-powa [71, 72]. FeS signals were
simulated with WINEPR Simfonia v1.2 software from Bruker Instruments. Samples for EPR
spectroscopy were prepared in 60 mM Tris- HCl buffer, pH 7.6. The spectra were acquired
in non-saturating conditions. Mo(V) EPR experimental conditions were: Microwave
frequency, 9.65 GHz; Modulation field, 100 kHz, Modulation amplitude, 5 G; Microwave
power, 2 mW; Temperature, 100 K.

II.2 Materials and Methods
32
Mo(V) EPR signals were developed by reducing Dd Fdh samples (200 μM) with
formate (HCOONa or DCOONa, D. 99% from Cambridge Isotopes) or sodium dithionite
using a molar ratio of 30:1 or 20:1 reductant/enzyme, respectively.
Inhibited samples were prepared by dialyzing Dd Fdh (200 μM) against H2O-buffer
and D2O-buffer (D. 99.9% from Cambridge Isotopes) containing inhibitors (cyanide or
azide) with a final concentration of 3 mM. Then samples were reduced with sodium
formate, as explained, to obtain the formate signal (see results). For the formate reduced
samples, the inhibitors were added in anaerobic conditions to reach a concentration of 3
mM.
II.2.5.2 Q-Band EPR spectroscopy
Spectra were recorded on a Bruker ESP 300E spectrometer equipped with an
ER051QG microwave bridge and a SF935 crystotat. EPR simulations were performed as
described in II.2.5.1.
II.2.6 Spin quantification
EPR signals were quantified against a Cu-EDTA standard (1mM) according to the
equation:
Where “C” is the spin concentration (spins/molecule), “A” is the area under the
absorption EPR signal, “M” is the modulation field (G), “P” is the microwave power (W), “G”
is spectrometer gain, “giso” is the isotropic g value, “d” is the diameter of the EPR tube. The
sub-indices “e” and “r” stand for the experimental and reference samples, respectively.
( ) r
2
dd
gg
GG
PP
MM
AA
e CCe
r
eiso,
riso,
e
r
e
r
e
r
r
e ××××××=

II.2 Materials and Methods
33
II.2.7 Fdh operon sequence
II.2.7.1 Gene isolation strategy
In a first step, conserved sequences presents in organisms filogenetically related
were used to design primers to isolate DNA sequences codifying α and β subunits. Multiple
alignments of DNA sequences were performed using MACAW software [73]. The primers
designed, the fragments amplified, and the annealing temperatures used in the
amplification reactions are described in the Table II.2.1.
The DNA sequence located between fdhB and fdhC was amplified using a specific
forward primer designed from of 3’ termini of fdhB and a degenerated reverse primer
designed from N-terminal aminoacid sequence of FdhC (Table II.2.1, primers fFdhDE and
rFdhDE).
When no conserved sequences were available the genome walking technique [74,
75] was used to sequence fdh gen. For each fragment amplified, two specific primers (one
for the primary PCR reaction and another for secondary PCR reaction) were designed using
the sequences obained in the first strategy (Table II.2.2).

II.2 Materials and Methods
34
Tabl
e II.
2.1
Prim
ers
use
d to
am
plify
Fdh
DN
A fr
agm
ents
from
fres
h D
d ce
lls

II.2 Materials and Methods
35
Ta
ble
II.2.
2 Sp
ecifi
c pr
imer
s u
sed
in G
enom
e W
alke
r te
chn
iqu
e.
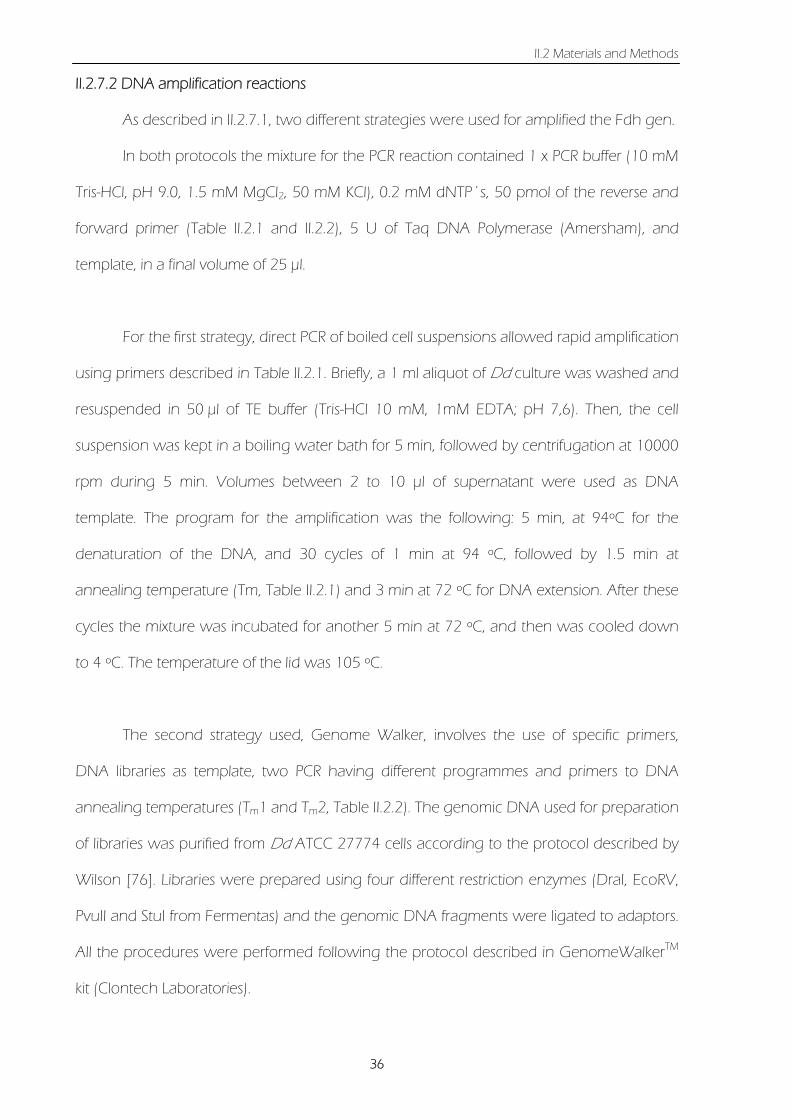
II.2 Materials and Methods
36
II.2.7.2 DNA amplification reactions
As described in II.2.7.1, two different strategies were used for amplified the Fdh gen.
In both protocols the mixture for the PCR reaction contained 1 x PCR buffer (10 mM
Tris-HCl, pH 9.0, 1.5 mM MgCl2, 50 mM KCl), 0.2 mM dNTP´s, 50 pmol of the reverse and
forward primer (Table II.2.1 and II.2.2), 5 U of Taq DNA Polymerase (Amersham), and
template, in a final volume of 25 μl.
For the first strategy, direct PCR of boiled cell suspensions allowed rapid amplification
using primers described in Table II.2.1. Briefly, a 1 ml aliquot of Dd culture was washed and
resuspended in 50 μl of TE buffer (Tris-HCl 10 mM, 1mM EDTA; pH 7,6). Then, the cell
suspension was kept in a boiling water bath for 5 min, followed by centrifugation at 10000
rpm during 5 min. Volumes between 2 to 10 μl of supernatant were used as DNA
template. The program for the amplification was the following: 5 min, at 94ºC for the
denaturation of the DNA, and 30 cycles of 1 min at 94 ºC, followed by 1.5 min at
annealing temperature (Tm, Table II.2.1) and 3 min at 72 ºC for DNA extension. After these
cycles the mixture was incubated for another 5 min at 72 ºC, and then was cooled down
to 4 ºC. The temperature of the lid was 105 ºC.
The second strategy used, Genome Walker, involves the use of specific primers,
DNA libraries as template, two PCR having different programmes and primers to DNA
annealing temperatures (Tm1 and Tm2, Table II.2.2). The genomic DNA used for preparation
of libraries was purified from Dd ATCC 27774 cells according to the protocol described by
Wilson [76]. Libraries were prepared using four different restriction enzymes (DraI, EcoRV,
PvuII and StuI from Fermentas) and the genomic DNA fragments were ligated to adaptors.
All the procedures were performed following the protocol described in GenomeWalkerTM
kit (Clontech Laboratories).

II.2 Materials and Methods
37
The programme for the first PCR amplification was: 5 cycles of 25 sec at 94°C and 3
min at Tm1, followed by 20 cycles of 25 sec at 94°C and 3 min at Tm2. After these cycles the
mixtures were kept for 7 min at 72 ºC.
The primary PCR mixtures were then diluted (1/20) and 1 μl of each dilution was
used as template for the secondary PCR.
The programme for the second PCR was: 7 cycles of 25 sec at 94°C and 3 min at
Tm1, followed by 32 cycles of 25 sec at 94°C and 3 min at Tm2. In the last step the mixtures
were incubated 7 min at 72 ºC.
Fragments amplified by direct PCR from the cells and from libraries were analyzed
by electrophoresis in 1-2% agarose gels and purified from using the QIAquick gel extraction
kit.
II.2.7.3 Cloning and sequencing fdh gen.
The purified DNA fragments were cloned into the pCR2.1-TOPO vector using the
TOPO-TA cloning kit (Invitrogen). Then, One Shot Mach1-T1 chemically competent E coli
(Invitrogen) were transformed with these constructs. Transformants were plated on LB
plates containing 100 μg/ml ampicillin and 40 mg/ml X-Gal for blue-white colour
screening. Colony PCR of white colonies was done to confirm positive selection before
sequencing. PCR products were analyzed by electrophoresis in 1-2% agarose gels. Isolated
positive colonies were growth in LB ampicilin medium and plasmidic DNA was isolated
using QIAprep Spin Miniprep Kit (Qiagen). Most of the molecular biology techniques (as
transformations, isolation of agarose gel fragments, ligation of vector and DNA fragments,
and preparation of DNA sequencing samples) used were performed according to
manufactures’ instructions.

II.2 Materials and Methods
38
Finally, the DNA fragments were sequenced using an ABI3700 DNA Analyzer;
(Perkin-Elmer/Applied Biosystems. Stabvida, Oeiras, Portugal). The obtained sequences
were submitted to GenBank (ABE73760 and ABE73761).
II.2.7.4 Analysis of protein and DNA sequences
Nucleotides sequences were translated into proteins using the TRANSLATE program
at Expasy (http://www.expasy.org/tools/dna.html).
Sequence database search for homology between fragments obtained and fdh
genes sequenced was performed using the BLAST programme at NCBI
(http://www.ncbi.nlm.nih.gov/BLAST/)
The presence of probable signal peptide sequence in the primary sequences was
analyzed using Signal P 3.0 programme (http://www.cbs.dtu.dk/services/SignalP/) [77].
The molecular weight of the mature proteins was calculated using the ProtoParam
programme (http://www.expasy.org/tools/protparam.html) [78].
Multiple protein alignments were performed with CLUSTALW programme at
http://npsa-pbil.ibcp.fr/cgi-bin/npsa_automat.pl?page=npsa_clustalw.html.
II.2.8 Sequencing N-Terminal Fdh Subunits
A 15% tricine SDS-PAGE [79] was used to separate approximately 2.5 ng of pure
Fdh. Gel pieces containing α, β, and γ subunits were excised and incubated in 500μl
Millipore water at 4ºC during 36 hours. After that, the solution was lyophilized and re-
suspended in an appropriated volume for sequencing.
Subunits were sequenced by Edman degradation reaction, in a Protein Sequencer
(Applied Biosystems, model 491, Faculdade de Ciências e Tecnologia, Universidade Nova
de Lisboa, Portugal).

39
II.3 RESULTS
II.3.1 Molecular properties
Molecular weight determination of the as-prepared protein by exclusion molecular
chromatography shows a peak corresponding to 150 kDa.
SDS gel electrophoresis shows three bands at 100 kDa, 30 kDa and 14 kDa
approximately (Figure II.3.1).
Figure II.3.1 Tricine SDS-PAGE (15%) of Dd Fdh after Superdex 200 column.
II.3.2 UV-visible spectroscopy
As was previously published [52], the UV- visible spectrum of the air-oxidized pure
protein (Figure II.3.2) shows a Soret peak at 409 nm. This wavelength, the line shape of the
α,β region (500-600 nm) as well the absence of bands in the 630-650 nm region confirms
that the hemes are in the low spin state. Upon reduction with dithionite, Soret bands shifts
to 416 nm and αβ bands develop at 552 nm and 523 nm, respectively. Metals
quantification reveals the presence of 15.1±0.4 Fe/protein, 1.1±0.2 Mo/protein, and
1.8±0.6 Se/protein. These results are similar to the values previously reported [52].
MW (kDa)
94.0 -- 67.0 --
43.0 --
30.0 --
20.1 --
14.4 --
- FdhA - FdhB - FdhC

II.3 Results
40
Figure II.3.2 UV-visible spectra of as-prepared Dd Fdh (black line) and dithionite reduced form (red line).
II.3.3 Fdh operon sequence
A genomic segment of 6895 bp was sequenced (Figure II.3.3) and found to contain
a cluster of four collinearly oriented open read frames that , on the basis of similarity to
others fdh genes, were designated as genes fdhA, fdhB, fdhE and fdhC (Figure II.3.4).
Furthermore, two gaps located upstream and downstream of the fdhE gene were
observed.
250 300 350 400 450 500 550 600 650 700 750 8000,0
0,1
0,2
0,3
0,4
Ab
sorb
ance
(A.U
.)
Wavelength (nm)

II.3 Results
41
Figure II.3.3 Nucleotide and corresponding aminoacid sequence of the four ORF of Dd Fdh operon.
Underlined sequences show the putative Ribosome Binding Sites (RBS), M and * are the ORF start and end,
respectively.
1 - TTGGTAAATAGTGGAGTAAAATCCGCAGCTTCATATTCTGCTCAACGGCCTGTGAAAAAG - 60 61 - TTTTCGCAGGCCGTTTTTTGGGCGCTTTTGCGGCCGGGGCCGCCCTGTTGACAACGGAAG - 120 121 - TGGAAAAAATTGATGGATAAATAAAATGGTAAAAGAAAAATTCAGTGATTTCGGGCGATA - 180 181 - TTCCATACATGTTTTTTGTGATTTTTCAGCAAAAAATGGACAGCATCAAGGGGGAGTTTA - 240 241 - AGTATCTGGCTGGAATGGTATGACAATTTACCATCTAGGGAAAAATATCACAAACACGTG - 300 301 - AAACTATAATATAAAATGTCGAACAATCTTGCGACATCACGATTTTTGGAATATGGTGAC - 360 361 - CGCAACTCTTTTTATTATCAAGGCGCACACATTGTCGCCAAAGCTTCTTTTGCGCGGCCG - 420 421 - CCTGCCTCGGCCCCGCGCATGTGACAGGCACAAACAAGGAGAGGTCTCATGAAAAGCACT - 480 - M K S T 481 - CGACGGAGTTTTCTCAAAGGTGTCGGTGCAGGGGTATTATGCCTTACGCTGGGGCACCTG - 540 - R R S F L K G V G A G V L C L T L G H L 541 - GGTTTTGACCTGGGCGAGGCCCAGGCATACGCCGGCAAACTCAAGATCGAGGGTGCCAAG - 600 - G F D L G E A Q A Y A G K L K I E G A K 601 - GAAGTATCGAGCATTTGCCCCTTCTGTTCTGTTCAGTGTCAGATCATCGCTTACGTCAAG - 660 - E V S S I C P F C S V Q C Q I I A Y V K 661 - GGCGGCAAGCTTGTCTCCACTGAGGGCGATCCGGACTTTCCCATCACCGAAGGCGCGCTC - 720 - G G K L V S T E G D P D F P I T E G A L 721 - TGCGCCAAGGGCGCGGCGCTGTACTCCATGTACACCAGCGACCACCGCCTGATGAAACCC - 780 - C A K G A A L Y S M Y T S D H R L M K P 781 - ATGTATCGCGCTCCGTTCAGCGACAAGTGGGAAGAAAAAGACTGGGACTGGACCCTTGAG - 840 - M Y R A P F S D K W E E K D W D W T L E 841 - CAAATAGCGCGCCGCGTCAAGGACGCACGCGATAAGGATATGATCCTTAAAAACGACAAA - 900 - Q I A R R V K D A R D K D M I L K N D K 901 - GGGCAGACGGTCAACCGTCTGGAAACCATCTTCTGGATGGGAACCTCGCACGCTTCCAAC - 960 - G Q T V N R L E T I F W M G T S H A S N 961 - GAAGAGTGCGCTGTTATCCATCAAGCCTTGCGCGGCCTGGGTGTTGTCCATATGGACCAC - 1020 - E E C A V I H Q A L R G L G V V H M D H 1021 - CAGGCGCGGGTCTGACACAGCCCCACTGTTGCGGCTCTGGCAGAGTCGTTCGGACGCGGT - 1080 - Q A R V * H S P T V A A L A E S F G R G 1081 - GCAATGACCAACCACTGGATCGACATCAAGAATGCCGATGCGGTGCTTATTATCGGCAGT - 1140 - A M T N H W I D I K N A D A V L I I G S 1141 - AATGCCGCTGAACATCATCCCGTGGCTTTCAAATGGATCATGAAAGCCAAGGACAACGGG - 1200 - N A A E H H P V A F K W I M K A K D N G 1201 - GCCGTGCTCATGCACGTGGACCCCAAGTTCTCGCGCACATCCGCCAGGTGTGATTTCCAT - 1260 - A V L M H V D P K F S R T S A R C D F H 1261 - GTGCCCCTTCGCTCGGGTACGGACATCCCCTTCCTGGGCGGCATGCTCAACTACATCCTT - 1320 - V P L R S G T D I P F L G G M L N Y I L 1321 - GAAAACGGTTTGTACCACAAGGAGTACGTTAACAACTACACCAACGCGGCCTTTGTGGTG - 1380 - E N G L Y H K E Y V N N Y T N A A F V V

II.3 Results
42
1381 - GGTGACGGCTACGCCTTTGAAGACGGGCTTTTCAGCGGCTATGATGCCGCCGCCCGCAAG - 1440 - G D G Y A F E D G L F S G Y D A A A R K 1441 - TATGACAAAAGCAAGTGGGCCTTGGCCAAGGGGCCTGACGGCGGGCCTGTCGTGGATCCC - 1500 - Y D K S K W A L A K G P D G G P V V D P 1501 - ACACACCAGAACCCGCGCTGCGTCATCAACCTCATGAAGGACCATTACTCCCGCTACACG - 1560 - T H Q N P R C V I N L M K D H Y S R Y T 1561 - CTTAAAAACGTCTCCGACGTCACGGGCGTTTCGCAGGACAACCTGCTCAAGGTGTACAAG - 1620 - L K N V S D V T G V S Q D N L L K V Y K 1621 - AACTTCTGCGCTACCGGCAGGCCGGACAAGGCGGGAACCATTCTTTACGCTCTGGGCTGG - 1680 - N F C A T G R P D K A G T I L Y A L G W 1681 - ACACAGCATACAGTAGGCGTGCAGAACATCCGCCTTTCGAGTCTTGTGCAGCTCTTGCTG - 1740 - T Q H T V G V Q N I R L S S L V Q L L L 1741 - GGCAACATAGGCATCGCCGGGGGCGGCATCAACGCGCTACGCGGCGAACCTAACGTGCAG - 1800 - G N I G I A G G G I N A L R G E P N V Q 1801 - GGCTCGACCGACCATGCCCTGCTGTACAACAACATTCCCGGCTACCACGGCACACCCCAG - 1860 - G S T D H A L L Y N N I P G Y H G T P Q 1861 - GCTCCGTGGCAGACCCTGGGCGAATACAACAAGGCCAATACCCCGGTAACGGTGGTGCCT - 1920 - A P W Q T L G E Y N K A N T P V T V V P 1921 - AACAGCGCCAACTGGTGGGGCAACAGGCCCAAGTATGTGACAAGTCTGCTCAAGGGCTGG - 1980 - N S A N W W G N R P K Y V T S L L K G W 1981 - TTCGGCGATGCCGCCACCCCCGAAAACGACTTCTGCTACAGCCTGCTGCCCAAGCTGGAG - 2040 - F G D A A T P E N D F C Y S L L P K L E 2041 - CCGGGCGTGGACTATTCGTACATGTTCGTCATGGACAGGATCTATAACAAGAAGATCAAG - 2100 - P G V D Y S Y M F V M D R I Y N K K I K 2101 - GGCGGCTTCATCATGGGTGTAAACCCCATGAACAGCTTCCCCAACACCAACAAGATGCGG - 2160 - G G F I M G V N P M N S F P N T N K M R 2161 - GCAGCCCTGGACAATCTTGACTGGCTGGTCTGTTCCGAAATCCATAATTCGGAAACCACG - 2220 - A A L D N L D W L V C S E I H N S E T T 2221 - GATAACTGGCAACGCCCCGGCGTGGGCCCCAAGACCAAGAAGACCGAGGTCTTTTTGCTG - 2280 - D N W Q R P G V G P K T K K T E V F L L 2281 - CCTTCGGCCCATCGCATCGAAAAGGCGGGAACCATCAGCAACAGCGGGCGCTGGTTGCAG - 2340 - P S A H R I E K A G T I S N S G R W L Q 2341 - TGGCACTACAAGGCCGTGGAACCCGCCGGAGAGGCGCGCAACTTCGCTGACGTGGTCGTG - 2400 - W H Y K A V E P A G E A R N F A D V V V 2401 - CCGCTCTTCAACACCATCCGCCGCATGTACAAGACAGAGGGCGGGGTACTGCCCGAAGCC - 2460 - P L F N T I R R M Y K T E G G V L P E A 2461 - GTGCTGCAGATGCACTGGACGGACAAGTATGATCCTGAAGACTGGGCCAGGCGCATCAAC - 2520 - V L Q M H W T D K Y D P E D W A R R I N 2521 - GGTTTCTTCTGGGCCGACACCAAGGTGGGCGACAAGACCTATAAGCGCGGGCAGCTTGTA - 2580 - G F F W A D T K V G D K T Y K R G Q L V 2581 - CCCGCCTTCGGCGCGCTCAAGGATGACGGAACCACGTCTTCCCTCAACTGGATATACACC - 2640 - P A F G A L K D D G T T S S L N W I Y T 2641 - GGAAGCTGGACGGAAGAAGACGGCAACAAGTCGCGGCGGCGCGATCCCAGCCAGACGCCC - 2700 - G S W T E E D G N K S R R R D P S Q T P 2701 - ATGCAGGCCAAGATAGGCCTCTTCCCCAACTGGTCGTGGTGCTGGCCGCTCAACAGGCGC - 2760 - M Q A K I G L F P N W S W C W P L N R R

II.3 Results
43
2761 - ATCCTGTACAACCGCGCCTCGGTGGACATGAACGGCAAGCCCTTCAACCCCAACAGGGCT - 2820 - I L Y N R A S V D M N G K P F N P N R A 2821 - GTTATCGAATGGGACGGCAGCAAATGGGTGGGCGACGTGCCCGACGGCCCCTGGCCGCCC - 2880 - V I E W D G S K W V G D V P D G P W P P 2881 - ATGGCTGACCCCAAGGGCAAGCTGCCCTTTATCATGGTCAAGGACGGCCTTGCCCAGTTC - 2940 - M A D P K G K L P F I M V K D G L A Q F 2941 - TATGGTCCCGGCCCGGCTGACGGTCCGTTCCCCGAGCACTACGAACCTGCTGAAACGCCC - 3000 - Y G P G P A D G P F P E H Y E P A E T P 3001 - CTGGCGACCCATCCGTTCTCCAAGCAGCTCAGCAGCCCGGTATATAAATACCACAAGACC - 3060 - L A T H P F S K Q L S S P V Y K Y H K T 3061 - GACATGGACCAGATCGCGCCTCCGGCCGATCCGCGTTACCCCATAGTGCTGACCACCTAC - 3120 - D M D Q I A P P A D P R Y P I V L T T Y 3121 - AGCCTTACCGAGCACTGGTGTGGCGGCGGTGAAACGCGCAACGTGCCCAACCTGCTGGAA - 3180 - S L T E H W C G G G E T R N V P N L L E 3181 - ACAGAGCCGCAGCTTTATGTGGAAATGAGCCACGAGCTGGCCAAGGAAAAGGGCATCAAG - 3240 - T E P Q L Y V E M S H E L A K E K G I K 3241 - AACGGCGACGGGGTCGTGCTTGAAAGCGCGCGCGGCAACTGTGAGGCCATCGCCATGGTA - 3300 - N G D G V V L E S A R G N C E A I A M V 3301 - ACGGTGCGTATACGTCCCTTCACGGTTATGGGCAAAACTGTCCACCTGGTGGGTATGCCC - 3360 - T V R I R P F T V M G K T V H L V G M P 3361 - TTTGCCTTTGGCTGGACAACGCCAAAAACCGGCGACTCCACCAACAGGCTTACCGTTGGC - 3420 - F A F G W T T P K T G D S T N R L T V G 3421 - GCGTATGATCCCAATACTACCATTCCCGAGTCCAAGGCCTGCTGCGTAAACCTGCGCAAG - 3480 - A Y D P N T T I P E S K A C C V N L R K 3481 - GCTGATAAACTCACCGAAATAGGCTAACGAGAAGGGCGCGCCCTTACGGTAGGGCGCGCC - 3540 - A D K L T E I G * 3541 - TGACAAGGAGCATACTATGCCGAAAACATTCTTAGTTGACACCACGCGGTGCACGGCATG - 3600 - M P K T F L V D T T R C T A C 3601 - TCGTGGCTGCCAGTTGGCCTGTAAGGAGTGGCATGATCTGCCTGCCAACCACACCAAGCA - 3660 - R G C Q L A C K E W H D L P A N H T K Q 3661 - GCGCGGCACGCACCAGAATCCGCCGGATCTGAATCCCAACAACCTCAAGATTGTACGCTT - 3720 - R G T H Q N P P D L N P N N L K I V R F 3721 - TCACGAATATATCAATGACGAAGGCAATGTGGTCTGGAACTTCTTTCCCGACCAGTGCCG - 3780 - H E Y I N D E G N V V W N F F P D Q C R 3781 - CCATTGCCTCACGCCGCCCTGTGTGGATGTGGCAGACATGGCGGTGCCGGGAGCCATGAT - 3840 - H C L T P P C V D V A D M A V P G A M I 3841 - ACAGGACAAGAAAACAGGGGCCGTACTGGCTACGGAAAAATCGGCCAAGCTCAGCGAGGA - 3900 - Q D K K T G A V L A T E K S A K L S E D 3901 - CGACGCCCAGGCCATACAGGAGGCCTGCCCCTATAATATTCCCAGGCGCGATCCCGAAAA - 3960 - D A Q A I Q E A C P Y N I P R R D P E N 3961 - CGGCCGCCTGACCAAGTGCGATATGTGCATCGACCGTGTCAGCGCGGGTATGCAGCCTAT - 4020 - G R L T K C D M C I D R V S A G M Q P I 4021 - CTGCGTCAAGACCTGCCCGACAGGGGCCATGGTTTTCGGCGAGCGTGAAGAGGTGCTGCC - 4080 - C V K T C P T G A M V F G E R E E V L P 4081 - CCTGGCCCAGAAACGTCTTGAAAACGCCAAAAAGCGTTGGCCCAAGGCTTTTCTGGCCGA - 4140 - L A Q K R L E N A K K R W P K A F L A D

II.3 Results
44
4141 - TATGGAAGATGTCAGCGTGATCTACCTGCTGGCCGACACCAAGGATAAGTATTACGAGTT - 4200 - M E D V S V I Y L L A D T K D K Y Y E F 4201 - CGCGGCCTTTATGTAGAGTGCTTCAGTCAGGTTTCAGTTTGGCATTGCCATAATTGTCAA - 4260 - A A F M * 4261 - CTGAAATTATGCTGATGCACAGCGTTGCCGTCAGGCCTGTACCGTATTCAACGGCTTCCG - 4320 4321 - GCGTTTTGCCGGAAGCCGGATTCACGGCACAGCCGGGCGGGGCACTTGGGCATATCTCCG - 4380 4381 - GCGGAAACGCCTTTTCGCCGGAAACGGGCAGACCGCTTCGGCGGCAGGGCCTGCGATACG - 4440 4441 - GCATCAAGTGCGGCGCGCGGGAAACAGCCCGCGCGCCGCTATCACCTTTCGGACGGAGGT - 4500 4501 - TCCGGCCTCCGGGTTTGGGAGCATCAATGGCCTCATCCTGCCAAAGCGTGGCAAAAACCC - 4560 4561 - TGGCGGAGGTGGTGGAATGCCGCCCCGTGCTGGAACCCGTGCTACGGGCGTTTGAACCCC - 4620 4621 - TGCTGGCCGCCCAGGCCCAATGGCCGATGATCTGGCCGACAGCATACGCGCTTCGGGGCT - 4680 - M A D D L A D S I R A S G L 4681 - GGAACTGCCTGAAGCGCAGCCCGGCGCCCTGGAGCAGGGTCTTTCATTGCTGGCCGGCGT - 4740 - E L P E A Q P G A L E Q G L S L L A G V 4741 - ACCGTTGACGGGAGCCGCCGCCCCGTTGCGGCAAAGCGCCGAAAAACTGCTGCCGCTTTT - 4800 - P L T G A A A P L R Q S A E K L L P L L 4801 - GGCTACGCTGGAAACCATGGCTCCTCACCTGCCCGCCCTTGAGGCTTTTTTGCTGGCTCC - 4860 - A T L E T M A P H L P A L E A F L L A P 4861 - GGCTGGAGCAGCAAAGAAGGGCAAGGGGGCCAAAACCAGGCAGGATCCGCGCGAAGCACT - 4920 - A G A A K K G K G A K T R Q D P R E A L 4921 - GGCCGAAGCCCTGCTGTCGGGTAACAGCGAAGAAGAAACCCGTCTGGCTGCCGCACATGA - 4980 - A E A L L S G N S E E E T R L A A A H D 4981 - CCTCGATCCTTCAATACTGCATTTTGCCTTCAGTTTTGTGCTGGCCCCGGTTTTACGCGC - 5040 - L D P S I L H F A F S F V L A P V L R A 5041 - AATTGTGTCAGGGAGCCTGCCTGAAGAAGGGGACGCCCCCTGGGATGCGGGCAGCCTGTG - 5100 - I V S G S L P E E G D A P W D A G S L W 5101 - GCGGCAGGGCTATTGCCCCGTATGCGGCAGTTTTGCCACCATCGCCTGGCTCGACAAACC - 5160 - R Q G Y C P V C G S F A T I A W L D K P 5161 - CCTGGTTGACGAAAAAAATGCCTATCTGGCTGGCGGCGGCGGCAAGAAACATCTGCACTG - 5220 - L V D E K N A Y L A G G G G K K H L H C 5221 - CGGCCTGTGCGGCACTGACTGGAAATTCATGCGCGGAACCTGTCCTTCATGTGGCGAGAA - 5280 - G L C G T D W K F M R G T C P S C G E K 5281 - GGGCAGCGGTGTCATCGAAATGCTGCGTGAAAGCGGCTCGGCTCACGGCGAGCGGCTGGA - 5340 - G S G V I E M L R E S G S A H G E R L D 5341 - CTGGTGCACCAAGTGTAAAACCTATTGCCCGACAGTGGACCTGCGTGAACGCGACGGAAA - 5400 - W C T K C K T Y C P T V D L R E R D G K 5401 - GCCGGATATGGACGCGCTGGCCCTGGGGATGATGCACCTGGATATGGTGGCGGCCCGTAA - 5460 - P D M D A L A L G M M H L D M V A A R K 5461 - AAAGCTGCGCCCGCTCAAGGTTTCGTTCTGGAATACTTTTTAGGGCAGCGTAACGCTGAG - 5520 - K L R P L K V S F W N T F * 5521 - ACTGTTCTGAAGGATTGGGAGCAGGCGCCCGCCGCAAGGGCGCTGGCCGCAAGCATGGCG - 5580 5581 - GAGGCAATGGCAGCATGAGGTTCATGCGCCGTGAGCAGCCGCGAGCGCAAAGAGTTGTGT - 5640 5641 - GTAAAAGGCCGGAAGCATGACGGGCCGGGCCAACGGGCAGAAGCGCGCCCGAAAGCCGCC - 5700 5701 - GGGCTGAAGAGAAGCGCCAGCGGCGCGTCAGAGGCCAGGCTGGCCGGATGGTCCGGCATG - 5760

II.3 Results
45
5761 - CGCAGAGACACAAGGGAAACCGTTGCAGTAATGAGGATTTTTGCTCTTTGCCAAGGCTGG - 5820 5821 - CGGCCCGGCGAAGCCTGATGCACCAAAACATGTATGAGGTTTTGCGGTGCGGTCTGCTGC - 5880 5881 - GGGCAGAGAGCAAAGATGATCATTATTCAGGGCTTCCGAAGATTTACTACCTCAGGAGGA - 5940 5941 - GCTTGTTCATGAAAACCCTGGTCATCACTCTTTTTGCCCTGACGTTTCTGTGGGCTGGCG - 6000 - M K T L V I T L F A L T F L W A G G 6001 - GCGCGCAGGCCCGCAGCGTCAAAGAGATGTCGCAAGCCATCAAGGAACCCATTGAAATTG - 6060 - A Q A R S V K E M S Q A I K E P I E I E 6061 - AAGCTTCCGGCTCCAAGCGCATGAACGTCATGTTTCCCCATACCGCACACAAGGGTATTT - 6120 - A S G S K R M N V M F P H T A H K G I S 6121 - CCTGCTTCCACTGCCACCRCGAGGAAGGCAGCGATGGCCGCTATGTRGCCTGTACCGAGT - 6180 - C F H C H X E E G S D G R Y X A C T E C 6181 - GTCACGCCACGCCCGGCGCGCGTGAGCGCGACCCCATGAGTATGTTCATGGCGTTCCACT - 6240 - H A T P G A R E R D P M S M F M A F H S 6241 - CCAAAAACAGCGACCGCTCGTGCCTTGGCTGCCACAAGAAGCTTGCTGCTGAAAATCCGG - 6300 - K N S D R S C L G C H K K L A A E N P G 6301 - GCAAGTTCCCGCAGTTCAAGGGCTGCCGTCCTTGTCACATGAGCCCCGCCGCGCGTGAAG - 6360 - K F P Q F K G C R P C H M S P A A R E A 6361 - CCGCCGAGGCCGCCAAGGCTGCCAAAAAATAGTTTGTATGCACAGTACGGCACTTGTGCC - 6420 - A E A A K A A K K * 6421 - GGATGTTGGATGTCGGTCAGCCGGAGGTTGACCGGCATCCTTGCYTTTATGGACGAAAGC - 6480 6481 - YTGCCGCATAACGGGGACTTCCTGCCGTTACTGCGGGCAGACCGGGATTTTTTACGGTTC - 6540 6541 - TGCTGCGGTTTTTAGCCACAGATTGCCCGTCTGCTGTTCTATGCCTGCCTGGAGGCCCAY - 6600 6601 - CCTCGGTGCTGATTTTTGYGGCGGCGGAACGGGCAGCAATGCTTTTGATGAAGATGCCCG - 6660 6661 - AAGGCGCACGGATAAAGCGATCATGGTAGGGCAGATTTTTTAATCTGGARGCTATATGAC - 6720 6781 - TCTCTTCCTTTGTGTCACCGTAAACGAYAATGAAATTGAATAATGAGATTACAAAGAAAC - 6840 6841 - AACGTGGTGAGATTGAACGTATTTTATCAAACTGGACAAACTATCTTAACAGTGT - 6895
Figure II.3.4 Schematic representation of gene organization for Dd Fdh operon. The ORFs and its transcription
senses are indicated by the arrows.
The fdhA gene encodes a protein of 1013 aminoacids (FdhA) with a predicted
molecular mass of 112.481 kDa (Figure II.3.5). The first 29 aminoacids correspond to a
signal peptide as calculated by SignalP programme. The mature protein has a deduced
molecular mass of 109.36 kDa and a pI=8.17. The sequence RRSFLK (light grey, Figure
II.3.5) corresponds to the twin-arginine motif (R-R-x-F-L/I-K) characteristic of Sec-
fdhA fdhB fdhCfdhE
1 kbp
fdhA fdhB fdhCfdhE
1 kbp

II.3 Results
46
independent export to periplasm and usually found in molybdoprotein precursors [44].
Proteins targeted with twin-arginine sequence are the substrate of the Tat (twin-arginine
translocation) protein export system. This system is found in the cytoplasmic membrane of
most prokaryotes and is dedicated to the transport of folded proteins. During the transport
cycle itself substrate proteins bind to a receptor complex in the membrane which then
recruits a protein-translocating channel to carry out the transport reaction [44, 58, 80].
A comparison of the deduced amino acid sequence (FdhA) with the N-terminal
sequence obtained by chemical sequencing of pure α-subunit (KLKIEGAKEV SSICPFC)
confirms that fdhA gene encodes the Fdh large subunit. A multiple sequence alignment of
FdhA from Dd and related proteins from different Desulfovibrio species revealed the
presence of the sequence motif –CXXCXn-CXmC- involved in [4Fe-4S] centre binding (black
circles, Figure II.3.5). FdhA also contains the SeCys160 residue (light yellow, Figure II.3.5)
codified by the TGA codon which is conserved in all Fdhs studied so far. Conserved
Histidine161 and Arginine333, proposed to be involved in the reaction mechanism [41, 81],
are also present.
Analysis of conserved domains in FdhA reveals two regions: Molybdopterin-Binding
(MopB) and MopB_CT. MopB domain of the MopB superfamily of proteins, in general, bind
molybdopterin as a cofactor. The MopB domain is found in a wide variety of molybdenum-
and tungsten-containing enzymes, including Ec Fdh-H and Ec Fdh-N, several forms of
nitrate reductase (Nap, Nas, NarG), dimethylsulfoxide reductase (DMSOR), thiosulfate
reductase, formylmethanofuran dehydrogenase , and arsenite oxidase [82]. Molybdenum is
present in most of these enzymes in the form of molybdopterin, a modified pterin ring with
a dithiolene side chain, which is responsible for ligating the Mo.
MopB_CT_Formate-Dh-Na-like (start at approximately aminoacid 874 from N-
Terminal) is the conserved molybdopterin_binding C-terminal (MopB_CT) region present in
many, but not all, MopB homologs.

II.3 Results
47
Figure II.3.5 Amino acid sequence alignment of the Dd FdhA with related proteins from different
Desulfovibrio species. Dd27774FdhA: FdhA subunit from D. deulfuricans ATCC 27774, DVU2812FdnG3:
large subunit from D. vulgaris Hilderborough (DVU2812), Dde3513DdG20FdhA4: Fdh large subunit from D.
desulfuricans G20 (Dde3513), Q934F5DgFdhA: Fdh large subunit from D. gigas (Q934F5), light grey: twin
arginine motif, light yellow: conserved SeCys, light blue: conserved residues probably involved in enzymatic
catalysis ▼: signal peptide cleavage site, •: cysteines motifs involved in the coordination of [4Fe-4S] clusters, (*):
identity, (:): strongly similar, and (.) weekly similar.
10 20 30 | | ▼| | | ● ● ●| Dd27774FdhA MKSTRRSFLKGVGAGVLCLTLGHLGFDLGEAQAYAG--KLKIEGAKEVSSICPFCSVQCQ DVU2812FdnG3 MKTTRRSFLKLVGVSVVGLSLGQLGFDLEDAQAYAV--KLKIEGAKEVGTVCPFCSVCCQ Dde3513DdG20FdhA4 MNCTRRGFLKLAGAGAACISLAQLGFSLKEARAFAA--SLKIEGAKEVITVCPFCSVSCH Q934F5DgFdhA MLIKRRAFLKLTAAGATLSAFGGLGVDLAPAKAQAATMALKTVDAKQTTSVCCYCSVGCG * .**.*** ..... ::. **..* *:* * ** .**:. ::* :*** * 40 50 60 70 80 90 | | ●| | | | Dd27774FdhA IIAY--VKGGKLVSTEGDPDFPITEGALCAKGAALYSMYTSDHRLMKPMYRAPFSDKWEE DVU2812FdnG3 VIAY--VRNGKLVSTEGDPDFPVNEGALCAKGAALFSMYTNPHRLTKPLYRAPHSDKWVE Dde3513DdG20FdhA4 IIAY--VKNGKLISTEGDPDYPINEGSLCAKGAALLTMSTSHHRLLKPKYRAPFSDKWEE Q934F5DgFdhA LIVHTDKKTNRAINVEGDPDHPINEGSLCAKGASTWQLAENERRPANPLYRAPGSDQWEE :*.: : .: :..*****.*:.**:******: : . :* :* **** **:* * 100 110 120 130 140 150 | | | | | | Dd27774FdhA KDWDWTLEQIARRVKDARDKDMILKNDKGQTVNRLETIFWMGTSHASNEECAVIHQALRG DVU2812FdnG3 KDWDWTLNQIARRVKDARDKDMILKNDKGQTVNRLESIFMMGTSHASNEECAVIHQAMRG Dde3513DdG20FdhA4 KDWGWTLEQIARRVKDTRDKEIILENNKGQRVNRLESMFLLGTSHADNEECALVHQAMRG Q934F5DgFdhA KSWDWMLDTIAERVAKTREATFVTKNAKGQVVNRCDGIASVGSAAMDNEECWIYQAWLRS *.*.* *: **.** .:*: :: :* *** *** : : :*:: .**** : : :*. 160 170 180 190 200 210 | | | | | | Dd27774FdhA LGVVHMDHQARVCHSPTVAALAESFGRGAMTNHWIDIKNADAVLIIGSNAAEHHPVAFKW DVU2812FdnG3 LGVVHMDHQARVCHSPTVAALAESFGRGAMTNHWIDIKNTDAVLIIGSNAAEHHPVAFKW Dde3513DdG20FdhA4 LGVVHMDHQARI-----------------MTNHWIDIKNADAILIMGSNAAEHHPISFKW Q934F5DgFdhA LGLFYIEHQARICHSATVAALAESYGRGAMTNHWIDLKNSDVILMMGSNPAENHPISFKW **:.:::****: *******:**:*.:*::***.**:**::*** 220 230 240 250 260 270 | | | | | | Dd27774FdhA IMKAKDNGAVLMHVDPKFSRTSARCDFHVPLRSGTDIPFLGGMLNYILENGLYHKEYVNN DVU2812FdnG3 IMRARDNGAVLMHVDPKFSRTSARCDFHVPLRSGTDIAFLGGMVNHIIAKDLYFKDYVAN Dde3513DdG20FdhA4 VLQAKDKGAVVMHVDPKFSRTSARADFHVPLRSGTDIAFMGGMIHYILETESYFRQYVLD Q934F5DgFdhA VMRAKDKGATLIHVDPRYTRTSTKCDLYAPLRSGSDIAFLNGMTKYILEKELYFKDYVVN :::*:*:**.::****:::***::.*::.*****:**.*:.** ::*: . *.::** : 280 290 300 310 320 330 | | | | | | Dd27774FdhA YTNAAFVVGDGYAFEDGLFSGYDAAARKYDKSKWALAKGPDGGPVVDPTHQNPRCVINLM DVU2812FdnG3 YTNAAFVVGKDYAFEDGIFSGYDPKTRTYDRSKWEFEKGPDGGPVMDPTLKNERCVFNLM Dde3513DdG20FdhA4 YTNASFIVGESYGFKDGLFSGYDIHTRSYDRSKWNFETDAQGTPKRDPSLKHPRCVFRLM Q934F5DgFdhA YTNASFIVGEGFAFEEGLFAGYNKETRKYDKSKWGFERDENGNPKRDETLKHPRCVFQIM ****:*:**..:.*::*:*:**: :*.**:*** : . :* * * : :: ***:.:*

II.3 Results
48
340 350 360 370 380 390 | | | | | | Dd27774FdhA KDHYSRYTLKNVSDVTGVSQDNLLKVYKNFCATGRPDKAGTILYALGWTQHTVGVQNIRL DVU2812FdnG3 KKHYERYTLKNVSDVTGVSEENLLRVYDAFCATGRPDKAGTILYALGWTQHTVGVQNIRT Dde3513DdG20FdhA4 QEHYSRYTLDNVSSVTGVTKENLLKVYKAFAATGKPDKAGTMMYALGWTQHTVGVQNIRS Q934F5DgFdhA KKHYERYDLDKISAICGTPKELILKVYDAYCATGKPDKAGTIMYAMGWTQHTVGVQNIRA :.**.** *.::* : *..:: :*:**. :.***:******::**:************* 400 410 420 430 440 450 | | | | | | Dd27774FdhA SSLVQLLLGNIGIAGGGINALRGEPNVQGSTDHALLYNNIPGYHGTPQAPWQTLGEYNKA DVU2812FdnG3 STLIQLLLGNIGVAGGGINALRGEPNVQGSTDHALLYHILPGYNAMPVAQWQTLADYNKA Dde3513DdG20FdhA4 AAIVQLLLGNIGVAGGGINALRGEPNVQGSTDHCLLYHIIPGYMTMPMADWQTYADYNKA Q934F5DgFdhA MSINQLLLGNIGVAGGGVNALRGEANVQGSTDHGLLMHIYPGYLGTARASIPTYEEYTKK :: ********:****:******.******** ** : *** . * * :*.* 460 470 480 490 500 510 | | | | | | Dd27774FdhA NTPVTVVPNSANWWGNRPKYVTSLLKGWFGDAATPENDFCYSLLPKLEPGVDYSYMFVMD DVU2812FdnG3 NTPVTTLKNSANWWSNRPKYVASLLKGWFGDAATPENDFCYEYLPKLEKGEDYSYMYVMD Dde3513DdG20FdhA4 NTPVSADPQSANWWQHKPKYLTSLLKAWFGDAATAENGYCYGLLPKIEKGADHSYMFLFD Q934F5DgFdhA FTPVSKDPQSANWWSNFPKYSASYIKSMWPDADLNEA---YGYLPKGEDGKDYSWLTLFD ***: :***** : *** :* :*. : ** * * *** * * *:*:: ::* 520 530 540 550 560 570 | | | | | | Dd27774FdhA RIYNKKIKGGFIMGVNPMNSFPNTNKMRAALDNLDWLVCSEIHNSETTDNWQRPGVGPKT DVU2812FdnG3 RMYHGKLKGGFIFGVNPMNSFPNTNKMRAALDKLDWLVCSELHNSETTDNWKRPGVDPKA Dde3513DdG20FdhA4 RMYSGKITGGFIIGLNPMNSVPNTNKVRKALDNLDWLVTAELHHSETTDNWRRPGVDPAT Q934F5DgFdhA DMFQGKIKGFFAWGQNPACSGANSNKTREALTKLDWMVNVNIFDNETGSFWRGPDMDPKK :: *:.* * * ** * .*:** * ** :***:* ::...** . *: *.:.* 580 590 600 610 620 630 | | | | | | Dd27774FdhA KKTEVFLLPSAHRIEKAGTISNSGRWLQWHYKAVEPAGEARNFADVVVPLFNTIRRMYKT DVU2812FdnG3 CKTEVFLLPSAHRVEKAGTISNSGRWLQWFDKAVEP-GQARNFADIFVPLVNKIRALYKA Dde3513DdG20FdhA4 VKTEVFLLPSAHRVEKAGSVSNSGRWLVWHHKAVEPEGEARSFGDMFVPLINVVRDLYRK Q934F5DgFdhA IKTEVFFLPCAVAIEKEGSISNSGRWMQWRYVGPEPRKNAIPDGDLIVELAKRVQKLLAK *****:**.* :** *::******: * . ** :* .*:.* * : :: : 640 650 660 670 680 690 | | | | | | Dd27774FdhA EGGVLPEAVLQMH---WT---DKYDPEDWARRINGFFWADTKVGDKTYKRGQLVPAFGAL DVU2812FdnG3 EGGTLPDPVLKLH---WT---DKFDPEEWTRRINGFFWADTKVGDKEYKRGQLVPAFGQL Dde3513DdG20FdhA4 EGGTMPEAVLNLD---WP---QQYDPEEWARRINGFFLKDTTVNGKEYKKGQLVPSFTAL Q934F5DgFdhA TPGKLAAPVTKLKTDYWVNDHGHFDPHKIAKLINGFALKDFKVGDVEYKAGQQIATFGHL * :. .* ::. * ::**.. :: **** * .*.. ** ** :.:* * 700 710 720 730 740 750 | | | | | | Dd27774FdhA KDDGTTSSLNWIYTGSWTEEDGNKSRRRDPSQTPMQAKIGLFPNWSWCWPLNRRILYNRA DVU2812FdnG3 KDDGSTSSLNWLYTGSYTEEDGNKSKRRDARQTPMQANIGLFPNWSWCWPVNRRILYNRA Dde3513DdG20FdhA4 ADDGSTSSLNWLYSGSYTEEDGNKAQRRDPSQTPMQAAIGLYPKWSWCWPVNRRILYNRA Q934F5DgFdhA QADGSTTSGCWIYTGSYTEK-GNMAARRDKTQTDMQAKIGLYPGWTWAWPVNRRIIYNRA **:*:* *:*:**:**: ** : *** ** *** ***:* *:*.**:****:**** 760 770 780 790 800 810 | | | | | | Dd27774FdhA SVDMNGKPFNPNRAVIEWDG--SKWVGDVPDGPWPPMAD-PKGKLPFIMVKDGLAQFYGP DVU2812FdnG3 SVDVNGKPWNPKKAVIEWDG--AKWVGDVPDGPWPPMADKEKGKLPFIMNKDGFAQFYGT Dde3513DdG20FdhA4 SVDAQGKPWNPAKAVISWNG--KKWEGDVPDGGWPPMAT-GKGRHPFIMSKHGFGQLYGT Q934F5DgFdhA SVDLNGKPYAPEKAVVEWNAAEKKWVGDVPDGPWPPQADKEKGKRAFIMKPEGYAYLYGP *** :***: * :**:.*:. ** ****** *** * **: .*** .* . :**. 820 830 840 850 860 870 | | | | | | Dd27774FdhA GPADGPFPEHYEPAETPLATHPFSKQLSSPVYKYHKTDMDQIAPPADPRYPIVLTTYSLT DVU2812FdnG3 GRMDGPFPEHYEPAETPLDSHPFSKQLSSPVYKFHTSDMDQIAKAADPKYPIVLTTYSLT Dde3513DdG20FdhA4 GRMDGPFSEHYEPVETPIDAHPFSKQLSSPVYKFVSSDMDKLARPADPRFPYVLTTYNVT Q934F5DgFdhA GREDGPLPEYYEPMECPVIEHPFSKTLHNPTALHFATEEKAVC---DPRYPFICSTYRVT * ***:.*:*** * *: ***** * .*. . :: . :. **::* : :** :*

II.3 Results
49
880 890 900 910 920 930 | | | | | | Dd27774FdhA EHWCGGGETRNVPNLLETEPQLYVEMSHELAKEKGIKNGDGVVLESARGNCEAIAMVTVR DVU2812FdnG3 EHWCGGGETRNVPNLLETEPQLYIEMSPELAEEKGIKNGDGVIVESIRGRAEAIAMVTVR Dde3513DdG20FdhA4 EHWCGGGETRNVPNLLEAEPQLYVELSPELAEEKGIANGDGVILESARGRVEAIAMVTVR Q934F5DgFdhA EHWQTGLMTRNTPWLLEAEPQMFCEMSEELATLRGIKNGDKVILESVRGKLWAKAIITKR *** * ***.* ***:***:: *:* *** :** *** *::** **. * *::* * 940 950 960 970 980 990 | | | | | | Dd27774FdhA IRPFTVMGKTVHLVGMPFAFGWTTPKTG-DSTNRLTVGAYDPNTTIPESKACCVNLRKAD DVU2812FdnG3 IRPFTVMGKTVHLVGMPFAYGWTTPKCG-DSTNRLTVGAYDPNTTIPESKACLVNVRKAD Dde3513DdG20FdhA4 IRPFTVQGKTVHLVGMPFCFGWTTPGTG-DSTNRLTPSVGDPNTSIPEYKASCVNIRKAD Q934F5DgFdhA IKPFAIQGQQVHMVGIPWHYGWSFPKNGGDAANILTPSVGDPNTGIPETKAFMVNVTKA- *:**:: *: **:**:*: :**: * * *::* ** .. **** *** ** **: ** Dd27774FdhA KLTEIG- DVU2812FdnG3 KLTEIA- Dde3513DdG20FdhA4 TLTEIDR Q934F5DgFdhA -------
The protein encoded by fdhB gene is composed of 219 aminoacids and has a
deduced molecular weight of 24.72 kDa. Aminoacid sequence traduced from fdhB is more
than 60% homologous with N-terminal aminoacid chemical sequence obtained from pure
β-Fdh subunit (KTFLVDTRRD QAGGGFQLK). FdhB lacks of signal peptide suggesting that
αβ complex is formed in the cytoplasm being then transported to periplasm as an
oligomeric structure. This feature was also observed for [NiFe] hidrogenases [45] and W-
Fdh from D. gigas [40]. Multiple alignment of FdhB with related proteins showed the
presence of three cysteines motifs (red, blue and green circles, Figure II.3.6) which are
involved in the [4Fe-4S] cluster binding. This suggests the presence of four [4Fe-4S] centres
in Dd Fdh: one in the α-subunit and three clusters in the β-subunit. Although this result is in
contrast with previously published results [52], it is in agreement with the number of [4Fe-
4S] clusters reported for related Fdhs [39, 83] .

II.3 Results
50
Figure II.3.6 Aminoacid sequence alignment of the Dd FdhB with Fdh homologous subunits from related
organisms. Dd27774FdhB: FdhB subunit from D. deulfuricans ATCC 27774, DVU2811FdnG3B: β-subunit
from D. vulgaris Hilderborough (DVU2811), Dde3514DdG20FdhB: Fdh β-subunit from D. desulfuricans G20
(Dde3514), Q8GC87DgFdhB: Fdh small subunit from D. gigas (Q8GC87), Red, blue and green circles:
cysteine motifs probably involved in the FeSII, FeIII and FeSIV cluster binding, (*): identity, (:): strongly similar,
and (.) weekly similar.
10 20 30 40 50 60 | ● ● ● | ● | | | | Dd27774FdhB MPKTFLVDTTRCTACRGCQLACKEWHDLPANHTKQRGTHQNPPDLNPNNLKIVRFHEYIN DVU2811FdnG3B MPKAFLIDTTRCTACRGCQLACKEWHDLPANVTKQRGSHQNPPDLNPNNLKIVRFNERMN Dde3514DdG20FdhB MSKAIFIDTTRCTACRGCQLACKEWYELPANKTRQTGSHQNPPDLNPNNFKLVRFHEHMI Q8GC87DgFdhB MSKGFFVDTTRCTACRGCQVACKQWHGNPATPTENTGFHQNPPDFNFHTYKLVRMHEQEI *.* :::************:***:*: **. *.: * ******:* :. *:**::* 70 80 90 100 110 120 | ● ● | ● | | | | Dd27774FdhB DEGNVVWNFFPDQCRHCLTPPCVDVADMAVPGAMIQDKKTGAVLATEKSAKLSEDDAQAI DVU2811FdnG3B EKGVVIWNFFPDQCRHCVTPVCVDVADMAVPGAMIKDKKTGAVLATEKSAKLSPADAKAV Dde3514DdG20FdhB DDR-VVWYFFPDQCRHCVNPPCVDIANMIVDGALVHDEETGAVLTTEKSSLLSAEDFQAV Q8GC87DgFdhB DGR-IDWLFFPDQCRHCIAPPCKATADMEDESAIIHDDATGCVLFTPKTKDL--EDYESV : : * *********: * * *:* .*:::*. **.** * *: * * ::: 130 140 150 160 170 180 ● | |● ● | ● ● | | Dd27774FdhB QEACPYNIPRRDPENGRLTKCDMCIDRVSAGMQPICVKTCPTGAMVFGEREEVLPLAQKR DVU2811FdnG3B AEACPYNIPRIDPKTKRITKCDMCFDRVSAGMQPICVKTCPTGTMAFGERDEMLALAEKR Dde3514DdG20FdhB RDACPYDIPRRDEQTGQVKKCVMCFDRIKAGMQPACVKVCPTGTMNFGEREEMLKLARTR Q8GC87DgFdhB ISACPYDVPRKVAESNQMAKCDMCIDRITNGLRPACVTSCPTGAMNFGDLSEMEAMASAR .****::** :. :: ** **:**:. *::* **. ****:* **: .*: :* * 190 200 210 220 230 240 | | | | | | Dd27774FdhB LENAKKRWPKAFLADMEDVSVIYLLADTKDKYYEFAAFM--------------------- DVU2811FdnG3B LADAKTRFPKAHLVDVEDVSVIYLLAEEKEHYYEYAGFM--------------------- Dde3514DdG20FdhB LEKVRKEHPRAMLADPDDVNVIFLLADDPERYHEYSVAQAEPVSRKRLFASLRRPVRAMT Q8GC87DgFdhB LAEIKAAYSDAKLCDPDDVRVIFLTAHNPKLYHEYAVA---------------------- * . : . * * * :** **:* *. . *:*:: Dd27774FdhB --- DVU2811FdnG3B --- Dde3514DdG20FdhB ENS Q8GC87DgFdhB ---
Despite fdhE gene location between fdhB and fdhC, its product (FdhE) is not a
component of Fdh. FdhE is composed by 287 aminoacids and has a calculated molecular
mass of 33.03 kDa. The amino acid sequence of this protein is homologous to FdhE from
D. vulgaris Hildenborough and D. desulfuricans G20 (Figure II.3.7). No signal peptide is
predicted which indicates that FdhE is a cytoplasmic protein. Although the function of
these proteins is unknown, they may possibly be involved in the formation of Fdh [66].

II.3 Results
51
Figure II.3.7 Multiple sequence alignment of FdhE. Dd27774FdhE: FdhE protein from D. desulfuricans ATCC
27774, DVU2810FdnG3E: FdhE protein from D. vulgaris Hilderborough (DVU2810), Dde3515DdG20FdhE:
FdhE protein from D. desulfuricans G20 (Dde3515), (*): identity, (:): strongly similar, and (.) weekly similar.
10 20 30 40 50 60 | | | | | | Dd27774FdhE --------------------------------------MADDLADSIRASGLELPEAQPG DVU2810FdnG3E --------------------------------------MTVALSQTLRDAGLHLPALEGE Dde3515DdG20FdhE MPQSRESVSATLNAIASRRPALHSILSAFEPLLTASAALPDALADELRNGTAPLPQARSE :. *:: :* . ** . 70 80 90 100 110 120 | | | | | | Dd27774FdhE ALEQGLSLLAGVPLTGAAAPLRQSAEKLLPLLATLETMAPHLPALEAFLLAPAGAAKKGK DVU2810FdnG3E RARQGVSLLAGVALPGIAAPMRDVAGVLLPLMGGMQAVAPHMEALQAFFLCPVEPG---- Dde3515DdG20FdhE RLAQGVPVMADAPTQWAAPLMRVAARHLLPVITAHQSLAGSRAGLEK---AFDQDD---- **:.::*... *. :* * ***:: :::* .*: . 130 140 150 160 170 180 | | | | | | Dd27774FdhE GAKTRQDPREALAEALLSGNSEEETRLAAAHDLDPSILHFAFSFVLAPVLRAIVSGSLPE DVU2810FdnG3E ----REDARDALAEAMLAGRSAD--AIAEACGVDADVLTFVTGFVLSPVLHALVAVSMPE Dde3515DdG20FdhE ------TALAGLMSAIVHGDAGALTRAARQHDVPEAVFAFAANAVAGPALHAMTQHHLHD . .* .*:: * : * .: :: *. . * .*.*:*:. : : 190 200 210 220 230 240 | | | | | | Dd27774FdhE EGDAPWDAGSLWRQGYCPVCGSFATIAWLDKPLVDEKNAYLAGGGGKKHLHCGLCGTDWK DVU2810FdnG3E SGEAPWDEGGAWQEGYCPVCGAFPTIGWLDRPMLDEKNAYLAGGGGKKHLHCSMCGADWK Dde3515DdG20FdhE ADFA------AWREGTCPVCGSFPSIAYLGRPDPDQ-SEFLRSGGGKKHLHCSLCTHEWL . * *::* *****:*.:*.:*.:* *: . :* .*********.:* :* 250 260 270 280 290 300 | | | | | | Dd27774FdhE FMRGTCPSCGEKGSGVIEMLRESGSAHGERLDWCTKCKTYCPTVDLRERDGKPDMDALAL DVU2810FdnG3E FLRGACPSCGKDASGTMEILRESEAAHGERLDWCTRCKSYCPTVDLREREAVPNLDALAL Dde3515DdG20FdhE FRRGACPSCGNEDPGALEYLRDPQTPW-ERIDLCRKCNTYCPGVDLRETTENPQMDAMAL * **:*****:. .*.:* **:. :. **:* * :*::*** ***** *::**:** 310 320 | | Dd27774FdhE GMMHLDMVAARKKLRPLKVSFWNTF--- DVU2810FdnG3E GMMHLDMVAARRQLRPLRPSFWNVY--- Dde3515DdG20FdhE GMLHLDLVAAREGLMPLAPSFWNTFDDE **:***:****. * ** ****.:
The fdhC gene encodes a protein of 147 aminoacids (FdhC) with a deduced
molecular mass of 15.89 kDa and pI= 9.10. Analysis of the aminoacid sequence shows a
putative cleavage site between aminoacids 21 and 22 (▼, Figure II.3.8). As result of this
cleavage the mature FdhC protein should have a molecular mass of 13.86 kDa and pI=
8.98. The amino acid sequence of the mature protein deduced from fdhC is in agreement
with N-terminal obtained from Dd Fdh γ-subunit (VKEVSQAIKEPIE). Analysis of amino acid
sequence reveals that FdhC is a c-type cytochrome where the heme is covalently attached
to the protein via two thioether bonds formed between the heme vinyl groups and the
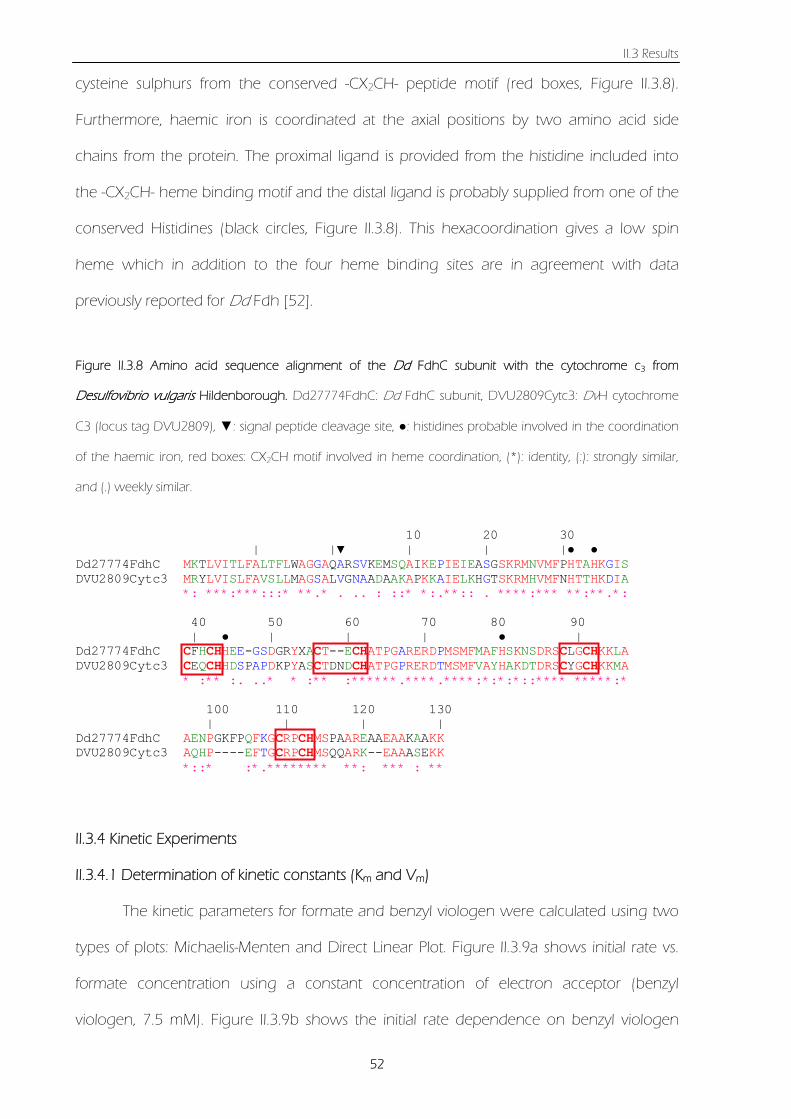
II.3 Results
52
cysteine sulphurs from the conserved -CX2CH- peptide motif (red boxes, Figure II.3.8).
Furthermore, haemic iron is coordinated at the axial positions by two amino acid side
chains from the protein. The proximal ligand is provided from the histidine included into
the -CX2CH- heme binding motif and the distal ligand is probably supplied from one of the
conserved Histidines (black circles, Figure II.3.8). This hexacoordination gives a low spin
heme which in addition to the four heme binding sites are in agreement with data
previously reported for Dd Fdh [52].
Figure II.3.8 Amino acid sequence alignment of the Dd FdhC subunit with the cytochrome c3 from
Desulfovibrio vulgaris Hildenborough. Dd27774FdhC: Dd FdhC subunit, DVU2809Cytc3: DvH cytochrome
C3 (locus tag DVU2809), ▼: signal peptide cleavage site, ●: histidines probable involved in the coordination
of the haemic iron, red boxes: CX2CH motif involved in heme coordination, (*): identity, (:): strongly similar,
and (.) weekly similar.
II.3.4 Kinetic Experiments
II.3.4.1 Determination of kinetic constants (Km and Vm)
The kinetic parameters for formate and benzyl viologen were calculated using two
types of plots: Michaelis-Menten and Direct Linear Plot. Figure II.3.9a shows initial rate vs.
formate concentration using a constant concentration of electron acceptor (benzyl
viologen, 7.5 mM). Figure II.3.9b shows the initial rate dependence on benzyl viologen
10 20 30 | |▼ | | |● ● Dd27774FdhC MKTLVITLFALTFLWAGGAQARSVKEMSQAIKEPIEIEASGSKRMNVMFPHTAHKGIS DVU2809Cytc3 MRYLVISLFAVSLLMAGSALVGNAADAAKAPKKAIELKHGTSKRMHVMFNHTTHKDIA *: ***:***:::* **.* . .. : ::* *:.**:: . ****:*** **:**.*: 40 50 60 70 80 90 | ● | | | ● | Dd27774FdhC CFHCHHEE-GSDGRYXACT--ECHATPGARERDPMSMFMAFHSKNSDRSCLGCHKKLA DVU2809Cytc3 CEQCHHDSPAPDKPYASCTDNDCHATPGPRERDTMSMFVAYHAKDTDRSCYGCHKKMA * :** :. ..* * :** :******.****.****:*:*:*::**** *****:* 100 110 120 130 | | | | Dd27774FdhC AENPGKFPQFKGCRPCHMSPAAREAAEAAKAAKK DVU2809Cytc3 AQHP----EFTGCRPCHMSQQARK--EAAASEKK *::* :*.******** **: *** : **

II.3 Results
53
using 1mM of sodium formate. The experimental data were least square fitted to the
Michaelis-Menten equation:
m
m
KSSVv +
×= (equation II.3.1)
where v is the initial rate, Vm is limiting rate, S is the substrate concentration, and Km is the
Michaelis constant.
Figure II.3.9 Initial rate vs. formate concentration (a) and benzyl viologen concentration (b). The red lines
show the best fit using the Michaelis-Menten model.
Figure II.3.10 shows the Direct Linear Plot for the same data plotted in Figure II.3.9.
a)
b)
0,0 0,2 0,4 0,6 0,8 1,0 1,2 1,4 1,6 1,8 2,00,0
0,1
0,2
0,3
0,4
0,5
0,6
0,7
0,8
0,9
Vm= 0.83(6) μmol/min
Kmformate=68(8) μM
kcat=349(14) sec-1
Specific Activity= 143(6) U/mg
v (μ
mol
es H
CO
ON
a o
xidi
zed/
min
)
Substrate (HCOONa, mM)
0 2 4 6 8 10 12 14
0,00
0,25
0,50
0,75
1,00
1,25
1,50
Vm= 1.3(1) μmol/min
KmBV=87(18) μM
kcat=593.5(1) sec-1
v(μm
oles
HC
OO
Na
oxid
ized
/min
)
Acceptor (benzyl viologen, mM)

II.3 Results
54
Figure II.3.10 Direct linear plot of Vm against Km using equation II.3.2. The slope and ordinate of each line
correspond to each experimental point of Figure II.3.9 which come from the average of three independent
measurements. (a) and (b) plots were constructed at benzyl viologen and formate concentration constant
(7.5 mM and 1 mM, respectively)
In this type of plot the Michaelis-Menten equation is rearranged to show the
dependence of Vm on Km (equation II.3.2):
a)
b)
-7 -6 -5 -4 -3 -2 -1 0 1 20,0
0,3
0,6
0,9
1,2
1,5
1,8
Vm= 1.4(1) μmol/min
KmBv=88(3) μM
kcat=600(46) sec-1
Vm (μmoles HCOONa
oxidized/min)
KBV
m (mM)
-2,0 -1,8 -1,6 -1,4 -1,2 -1,0 -0,8 -0,6 -0,4 -0,2 0,0 0,2 0,40,0
0,2
0,4
0,6
0,8
1,0
1,2
Vm= 0.82(11) μmol/min
Kmformate=64(22) μM
kcat=347(19) sec-1
Specific Activity= 139(6) U/mg
Vm
(μmoles HCOONa oxidized/min)
Km
formate(mM)

II.3 Results
55
mSv
m KvV += (equation II.3.2)
Since v and S have been measured in the experiment, they can be treated as
constants. Consequently, if Vm and Km are considered as variables and v and S as constants,
equation II.3.2 defines a straight line for each v and S set which satisfies one observation.
The intersection point for two different observations defines the unique pair of Km and Vm
values that satisfies both observations exactly. The Km and Vm values determined from
Figure II.3.9 and Figure II.3.10 are included into the figures and summarized in Table II.3.1.
Table II.3.1 Kinetic constants calculated by Michaelis-Menten (MM) model and Direct Linear Plot (DLP) from
experiments. Standard deviation between parentheses.
II.3.4.2 Influence of β-mercaptoethanol on the kinetic assay.
The presence of β-mercaptoethanol (130 mM) was reported as mandatory in
Formate Dehydrogenases kinetic experiments [43, 52]. Although the role of the thiol has
not been elucidated yet, it is thought that β-mercaptoethanol is necessary to remove the
oxygen and drop the redox potential. On the other hand, β-mercaptoethanol has a
denaturating effect on proteins and because of its reductant properties, could also act as a
reductant of benzyl viologen. To check that both effects are not relevant and the
importance of β-mercaptoethanol in the kinetic assays, a set of studies described below
were carried out.
The effect of β-mercaptoethanol on substrate affinity was evaluated by comparison
between kinetic parameters calculated with and without β-mercaptoethanol. Figure II.3.11
Vmformate
(μmol/min)K m
formate
(μM)
k catformate
(sec-1)
Specific Activity (U/mg)
VmBV
(μmol/min)K m
BV
(μM)
k catBV
(sec-1)
MM 0.83(6) 68(8) 349(14) 143(6) 1.3(1) 87(18) 593.5(1)
DLP 0.82(11) 64(22) 347(19) 139(6) 1.4(1) 88(3) 600(46)
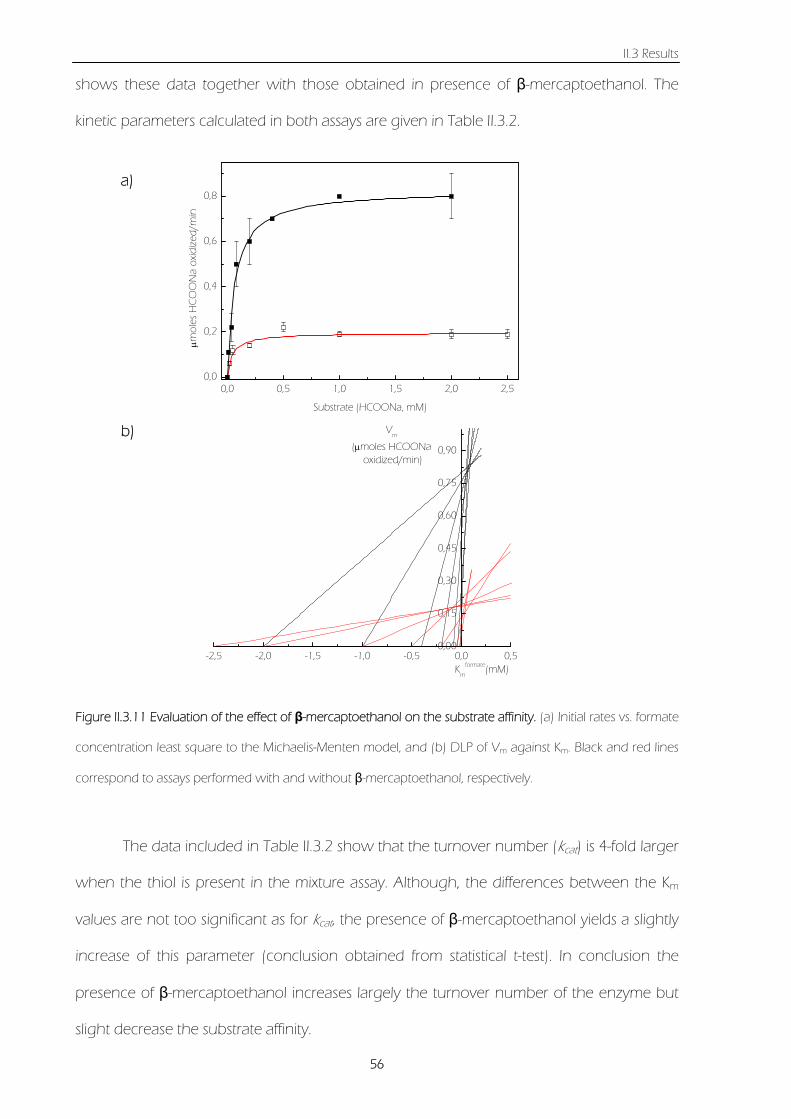
II.3 Results
56
shows these data together with those obtained in presence of β-mercaptoethanol. The
kinetic parameters calculated in both assays are given in Table II.3.2.
Figure II.3.11 Evaluation of the effect of β-mercaptoethanol on the substrate affinity. (a) Initial rates vs. formate
concentration least square to the Michaelis-Menten model, and (b) DLP of Vm against Km. Black and red lines
correspond to assays performed with and without β-mercaptoethanol, respectively.
The data included in Table II.3.2 show that the turnover number (kcat) is 4-fold larger
when the thiol is present in the mixture assay. Although, the differences between the Km
values are not too significant as for kcat, the presence of β-mercaptoethanol yields a slightly
increase of this parameter (conclusion obtained from statistical t-test). In conclusion the
presence of β-mercaptoethanol increases largely the turnover number of the enzyme but
slight decrease the substrate affinity.
a)
b)
0,0 0,5 1,0 1,5 2,0 2,50,0
0,2
0,4
0,6
0,8
μmol
es H
CO
ON
a ox
idiz
ed/m
in
Substrate (HCOONa, mM)
-2,5 -2,0 -1,5 -1,0 -0,5 0,0 0,50,00
0,15
0,30
0,45
0,60
0,75
0,90
Vm
(μmoles HCOONa oxidized/min)
Km
formate(mM)

II.3 Results
57
Table II.3.2 Kinetic constants calculated by Michaelis-Menten model and DLP from experiments with and
without β-mercaptoethanol. Standard deviation between parentheses.
Figure II.3.12 shows the initial rates versus concentration of β-mercaptoethanol in
three different conditions: 1) standard kinetic assay (■), 2) assay in absence of formate (●),
and 3) assay in absence of formate and enzyme (▲).
Figure II.3.12 Initial rates versus concentration of β-mercaptoethanol in different conditions. (■) standard
kinetic assay; (●) assay in absence of formate; (▲) assay in absence of formate and enzyme; (▼)subtraction of
initial rates in absence of formate (●) and in absence of formate and enzyme (▲) to those obtained in
standard conditions (■). The concentration of benzyl viologen used was 7.5 mM.
0 250 500 750 1000 1250 1500 1750 20000,0
0,2
0,4
0,6
0,8
μmol
HC
OO
Na
oxid
ized
/ m
in
β-mercaptoethanol concentration (mM)
Vmformate
(μmol/min)K m
formate
(μM)
k catformate
(sec-1)
Specific Activity (U/mg)
VmBV
(μmol/min)K m
BV
(μM)
k catBV
(sec-1)
MM 0.83(6) 68(8) 349(14) 143(6) 1.3(1) 87(18) 593.5(1)
DLP 0.82(11) 64(22) 347(19) 139(6) 1.4(1) 88(3) 600(46)
MM 0.196(8) 49(10) 84(3) 32(1) n.d. n.d. n..d.
DLP 0.192(70) 44(11) 83(10) 33(5) n.d. n.d. n.d.
With βmercaptoethanol
Without βmercaptoethanol

II.3 Results
58
As shown in Figure II.3.12, the data in condition 1 (■, standard kinetic assay) shows
a decreasing of initial rate at higher concentrations of β-mercaptoethanol. However, this
effect is not statistical significant at the assay conditions (130 mM, β-mercaptoethanol).
In addition, the data in conditions 3 (▲, assay in absence of formate and enzyme)
indicate that the chemical reduction of benzyl viologen increases with the concentration of
β-mercaptoethanol but this is no significant at concentrations lower than 250 mM.
Therefore, the chemical reaction does not affect enzymatic initial rate in a standard reaction
and becomes significant as the β-mercaptoethanol concentration increase.
II.3.4.3 Deuterioformate as substrate
Kinetic isotope effects [84] can be advantageously used to learn on enzyme
mechanistic aspects that would be difficult to obtain by other methodologies. To evaluate
whether the breaking of the C-H bond is the rate limiting step in the conversion of formate
to CO2, kinetic studies using deuterioformate (DCOONa) as substrate were performed. The
results obtained from these experiments were analyzed and compared with those for
protioformate (Figure II.3.13 and Table II.3.3).

II.3 Results
59
Figure II.3.13 Influence of C-H breaking in the limiting rate step. (a) initial rates vs. formate concentration (■,
HCOONa; □, DCOONa). (b) Direct linear plot of turnover number against Km (black and red lines correspond
to HCOONa and DCOONa, respectively).
-2,0 -1,5 -1,0 -0,5 0,0 0,50
100
200
300
400
Km (mM)
Turnover number
(sec-1)
0,0 0,2 0,4 0,6 0,8 1,0 1,2 1,4 1,6 1,8 2,00
50
100
150
200
250
300
350
Turn
over
nu
mb
er (s
ec-1)
Substrate (mM)
a)
b)

II.3 Results
60
Table II.3.3. Kinetic parameters calculated for Dd Fdh using HCOONa and DCOONa as substrates. Standard
deviation between parentheses.
A comparison of the data shown in Figure II.3.13 and in Table II.3.3 indicates that
the use of DCOONa as substrate leads to an important decrease of the turnover number,
which indicates that the breaking of C-H bond is the rate limiting step of formate oxidation.
Furthermore, Dd Fdh shows an increasing of 1.5 times in the Km parameter which is in
agreement results report for E coli Fdh-H [85].
To check this effect in another related protein, the isotope effect was evaluated for
the W-Fdh from D. gigas. The data obtained were least square fitted to the Michaelis-
Menten model (Figure II.3.14) and kinetic constants were calculated (Table II.3.4). A
comparison between constants obtained with both substrates indicates that replacement
of H for D induces a similar effect on both turnover number and Km.
K mformate
(μM)
k catformate (sec-
1)
MM 68(8) 349(14)
DLP 64(22) 347(19)
MM 100(3) 105(1)
DLP 81(20) 104(8)
HCOONa
DCOONa

II.3 Results
61
Figure II.3.14 Influence of C-H breaking in the sodium formate reduction by Desulfovibrio gigas Fdh. (a)
turnover number vs. formate concentration (■, HCOONa; □, DCOONa), and (b) direct linear plot of turnover
number against Km (black and red lines correspond to HCOONa and DCOONa, respectively).
Table II.3.4 Kinetic parameters calculated from
Michaelis-Menten and Direct Linear Plot obtained
from Desulfovibrio gigas Fdh. The numbers in
parenthesis are the standard deviations.
0 1 2 3 4 50
10
20
30
40
50
Turn
over
nu
mbe
r (s
ec-1)
Substrate (mM)
-2,0 -1,5 -1,0 -0,5 0,0 0,50
20
40
60
80
100Turnover number
(sec-1)
Km (mM)
a)
b)
K mformate
(μM)
k catformate (sec-
1)
MM 49(8) 53(3)
DLP 40(11) 51(4)
MM 113(10) 14(3)
DLP 136(31) 16(2)
HCOONa
DCOONa
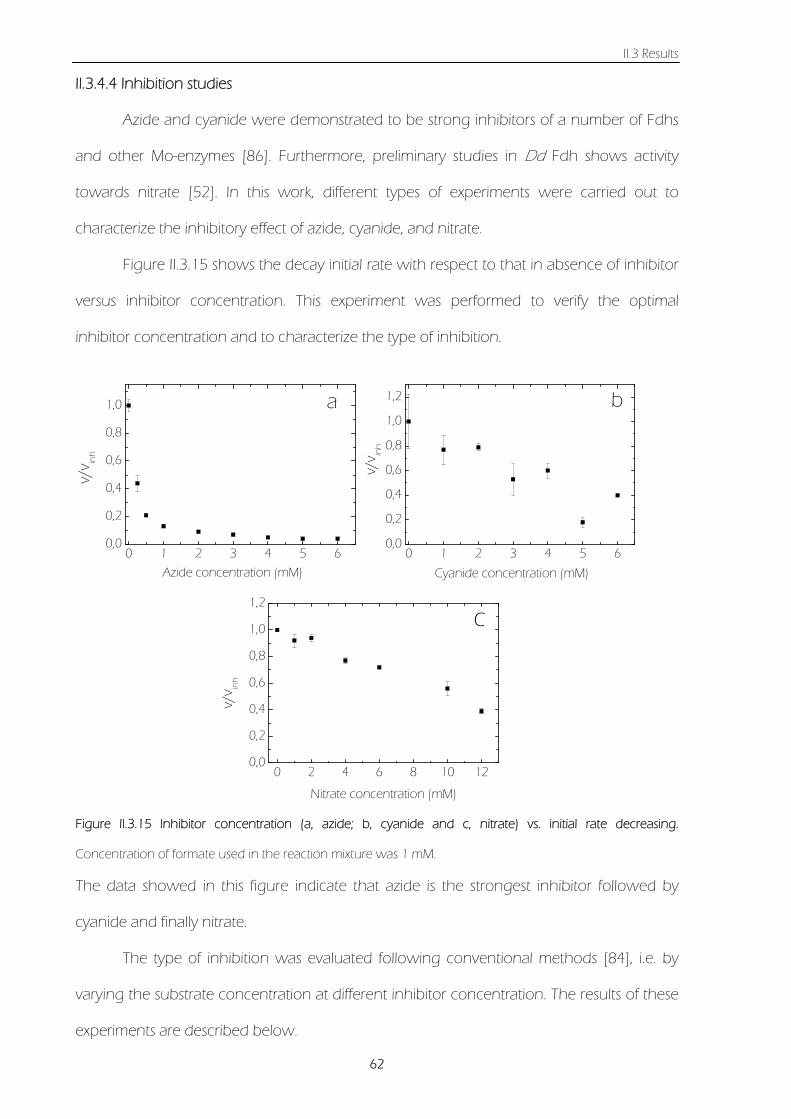
II.3 Results
62
II.3.4.4 Inhibition studies
Azide and cyanide were demonstrated to be strong inhibitors of a number of Fdhs
and other Mo-enzymes [86]. Furthermore, preliminary studies in Dd Fdh shows activity
towards nitrate [52]. In this work, different types of experiments were carried out to
characterize the inhibitory effect of azide, cyanide, and nitrate.
Figure II.3.15 shows the decay initial rate with respect to that in absence of inhibitor
versus inhibitor concentration. This experiment was performed to verify the optimal
inhibitor concentration and to characterize the type of inhibition.
Figure II.3.15 Inhibitor concentration (a, azide; b, cyanide and c, nitrate) vs. initial rate decreasing.
Concentration of formate used in the reaction mixture was 1 mM.
The data showed in this figure indicate that azide is the strongest inhibitor followed by
cyanide and finally nitrate.
The type of inhibition was evaluated following conventional methods [84], i.e. by
varying the substrate concentration at different inhibitor concentration. The results of these
experiments are described below.
0 1 2 3 4 5 60,0
0,2
0,4
0,6
0,8
1,0
v/v in
h
Azide concentration (mM)
a
0 1 2 3 4 5 60,0
0,2
0,4
0,6
0,8
1,0
1,2
v/v in
h
Cyanide concentration (mM)
b
0 2 4 6 8 10 120,0
0,2
0,4
0,6
0,8
1,0
1,2
v/v in
h
Nitrate concentration (mM)
c

II.3 Results
63
II.3.4.4.1 Inhibition by Azide
The inhibitory effect of azide was checked by means of DLP analysis, as explained in
section II.3.4.1. Figure II.3.16 shows the DLP plot obtained with and without inhibitor (black
and red lines, respectively). The results point to a mixed inhibition pattern which is
characterized by the equations:
iuc
mi/K1VappV += (equation II.3.3)
iuc
icmm i/K1
)K(1KappK ++= (equation II.3.4)
ic
mmm i/K1
/KVappapp /KV += (equation II.3.5)
where, Vapp and Kmapp are the apparent values of Vm and Km, i is the inhibitor concentration,
Kic and Kiuc are the competitive and uncompetitive inhibition constants, respectively.
.
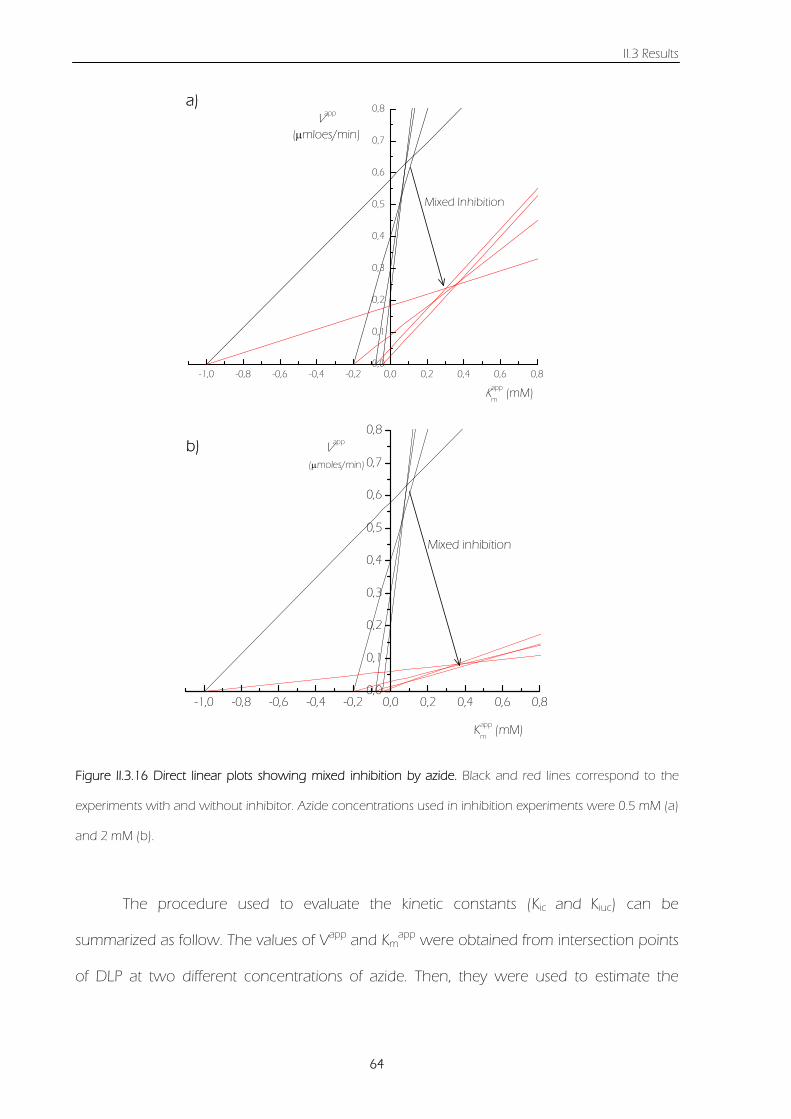
II.3 Results
64
Figure II.3.16 Direct linear plots showing mixed inhibition by azide. Black and red lines correspond to the
experiments with and without inhibitor. Azide concentrations used in inhibition experiments were 0.5 mM (a)
and 2 mM (b).
The procedure used to evaluate the kinetic constants (Kic and Kiuc) can be
summarized as follow. The values of Vapp and Kmapp were obtained from intersection points
of DLP at two different concentrations of azide. Then, they were used to estimate the
-1,0 -0,8 -0,6 -0,4 -0,2 0,0 0,2 0,4 0,6 0,80,0
0,1
0,2
0,3
0,4
0,5
0,6
0,7
0,8Vapp
(μmoles/min)
Kapp
m (mM)
Mixed inhibition
a)
b)
-1,0 -0,8 -0,6 -0,4 -0,2 0,0 0,2 0,4 0,6 0,80,0
0,1
0,2
0,3
0,4
0,5
0,6
0,7
0,8Vapp
(μmloes/min)
Kapp
m (mM)
Mixed Inhibition

II.3 Results
65
constant ratio Vapp/Kmapp and Kic was calculated from equation II.3.5. The remaining Kiuc
value was estimated from equations II.3.3 and II.3.4.
The Kiuc and Kic were calculated to be 214±3 μM and 33±3 μM respectively (Table
II.3.5). These values represent the median and standard deviation calculated from a set of
Kiuc and Kic. Median instead of average was estimated because intersections in DLP not
cross at exactly the same point due experimental errors.
II.3.4.4.2 Inhibition by Nitrate
The inhibition effect of nitrate on the reduction of formate was evaluated by two
types of plots: DLP and S/v vs. inhibitor concentration [87]. Figure II.3.17 shows the
dependence S/v on inhibitor concentration where is clearly visible a competitive inhibition.
At high concentrations of nitrate (20mM), DLP analysis confirms this type of inhibition by
nitrate (Figure II.3.18). The effect of competitive inhibition is to decrease the apparent value
of Vm/Km by the factor (1+ i/Kic).
Figure II.3.17 Competitive inhibition by nitrate (Cornish-Bowden Plot [87]). Formate concentration used were:
(■) 50 μM, (●) 100 μM, (▲) 200 μM and (▼) 1000 μM.
0 5 10 15 200
1
2
3
4
S/v
(min
)
Potassium Nitrate (mM)

II.3 Results
66
Figure II.3.18 Direct linear plot showing competitive inhibition by nitrate. Black lines: without inhibitor, red
lines: 20 mM nitrate.
In this case Kic was calculated by Dixon Plot [84] (Figure II.3.19) disclosing a value of
630±240 μM. (Table II.3.5).
Figure II.3.19 Dixon plot for competitive inhibition by nitrate. Formate concentration used were: (■) 50 μM,
(●) 100 μM, (▲) 200 μM and (▼) 1000 μM.
0 5 10 15 200
10
20
30
40
1/v
(min
/μm
oles
)
Potassium Nitrate (mM)
-900 -600 -300 0 300 600 900 12000
1
2
3
4V (μmoles /min)
Km (μM)
Competitive Inhibition

II.3 Results
67
II.3.4.4.3 Inhibtion by Cyanide
As for azide inhibition, DLP analysis demonstrated that cyanide is a mixed inhibitor
(Figure II.3.20). The Kic and Kiuc were calculated in the same way as azide inhibition
constants (Table II.3.5).
Figure II.3.20 Direct linear plots showing mixed inhibition by cyanide. Black and red lines correspond to the
experiments with and without inhibitor. Cyanide concentration used in inhibition experiments was 1.25 mM
(a) and 2.5 mM (b).
-1,0 -0,8 -0,6 -0,4 -0,2 0,0 0,2 0,40,00
0,25
0,50
0,75
1,00
Kapp
m
vapp (μmol/min)
-1,0 -0,8 -0,6 -0,4 -0,2 0,0 0,2 0,40,00
0,25
0,50
0,75
1,00
Kapp
m
vapp
(μmol/min)a)
b)

II.3 Results
68
Table II.3.5 Inhibition constants calculated for azide, cyanide and nitrate.
II.3.5 EPR Spectroscopy
II.3.5.1 Molybdenum centre
II.3.5.1.1 As-prepared and dithionite reduced enzyme.
Figure II.3.21 shows the EPR spectra taken at 100 K of the as-prepared and dithionite
reduced sample at different incubation times. As already reported [52], as-prepared Dd Fdh
presents a rhombic EPR signal, which was called Rhombic I (Figure II.3.21a, EPR parameters
in Table II.3.6). Furthermore, the dithionite reduced enzyme shows a second signal called
Rhombic II and a signal from radical species (Figure II.3.21b-c, EPR parameters in Table
II.3.6).
A previous redox titration performed on this enzyme [52] revealed that the intensity
and line-shape of Rhombic I signal are insensitive to dithionite addition. Although some
changes were detected in the different experiments carried out in this work, these are not
significant and hence not analyzed. In contrast, Rhombic II species are redox active with a
redox potential of -162 mV [52]. Both Rhombic II species is thought to be not relevant in
catalysis, as it can be obtained only upon dithionite reduction. The radical signal observed
in Figure II.3.21d, which was no observed in the previous characterization, was also
observed in other closely related Fdhs [43, 88].
Kiuc (μM) Kic (μM)
Azide 214(3) 33(3)
Cyanide 1634(156) 420(127)
Nitrate - 630(240)

II.3 Results
69
Figure II.3.21 Mo(V) EPR spectra of as-prepared and dithionite reduced enzyme. (a) As-prepared sample, (b)
Signal obtained after 10 min reduction with 10 times excess of dithionite, (c) Idem (b) but incubated 30 min,
and (d) Signal obtained after 30 min with 25 times excess of dithionite. Frequency: 9.65 GHz, Microwave
power: 2 mW, and Modulation Field: 10 Gpp, Temperature: 100K.
2,04 2 1,96 1,92
3350 3400 3450 3500 3550 3600
g-value
d
c
b
Magnetic Field [G]
a

II.3 Results
70
Table II.3.6 EPR parameters of Rhombic I and Rhombic II signals. Linewidths (within parentheses) are given in
Gauss.
II.3.5.1.2 Formate reduced enzyme.
The reduction of Dd Fdh with sodium formate yields a different signal from the
dithionite reduced enzyme (Figure II.3.22a). This signal, hereafter called formate signal, is
rhombic and shows in addition hyperfine structure, which is originated from nuclear
species with I=1/2. In order to elucidate the nature of these species, EPR spectra were
obtained by reducing Dd Fdh with sodium formate in four conditions: as-prepared enzyme
reduced with (a) HCOONa and (b) DCOONa; and enzyme exchanged into D2O buffer
reduced with (c) HCOONa, and (d) DCOONa (Figure II.3.22a-d). Experiments in conditions
(a) and (c) pursued to detect hyperfine splittings given by solvent exchangeable protons
whereas conditions (b) and (c) splittings from the formate α-proton. Condition (d) was only
for control purposes.
After reductant addition, samples were frozen immediately in liquid nitrogen
followed by spectral acquisition. Then, they were thawed and incubated in anaerobic
conditions for 5 minutes, after which they were immediately frozen for spectral acquisition.
This procedure was repeated 6 times. Longer incubation times showed no significant
changes in the spectra. The Rhombic I signal detected in the as-prepared Dd Fdh samples
(Figure II.3.21a), which keeps line-shape and intensity on reduction with either formate or
dithionite, was subtracted in all the spectra.
Mo (V) EPR signal
gmax gmed gmin
Rhombic I 2.019(8.1) 1.989(6.9) 1.964(10.8)
Rhombic II 2.009(10.8) 1.984(6.7) 1.951(10.8)

II.3 Results
71
Figure II.3.22 Mo(V) EPR signals obtained after 30 minutes of formate addition to Dd Fdh together with
simulations (red lines). a) enzyme in H2O-buffer reduced with HCOONa, b) enzyme in H2O-buffer reduced
with DCOONa, c) enzyme exchanged into D2O-buffer reduced with HCOONa. d) enzyme exchanged into
D2O-buffer reduced with DCOONa. Simulations (red lines) were done with parameters given in Table II.3.7.
Frequency: 9.65 GHz, Microwave power: 2 mW, Modulation amplitude, 5 G; Temperature, 100 K.
Table II.3.7 EPR parameters for simulations of Mo(V) EPR signals. Linewidth are given in G between
parentheses. The A values are given in cm-1 × 10⁻⁴. Indexes 1 and 2 stand for the non-solvent and solvent
exchangeable protons, respectively.
2,06 2,04 2,02 2 1,98 1,96 1,94 1,92
3350 3400 3450 3500 3550
Magnetic Field [G]
ab
c
d
g-value
EPR signal gmax gmid gmin A1max A2
max A2mid A2
min
Formate signal in H2O -buffer 2.012 (12) 1.996 (8) 1.985 (8) 11.7 7.7 10 9.3
Formate signal in D2O -buffer 2.012 (12) 1.996 (8) 1.984 (12) 11.7 - - -
II.3 Results
72
Spectra in conditions (b) an (d) are similar to the spectra in conditions (a) and (c),
respectively. Comparison of Figures II.3.22a and II.3.22c shows that formate signal is split by
two interacting I=1/2 nuclei (EPR parameters in Table II.3.7). One of them is not solvent
exchangeable and splits the gmax feature but not the two lowest g-values (Figure II.3.22ab).
According to the proposed structure for the Mo site of Dd Fdh [53], the closest non-solvent
exchangeable protons to the Mo atom able of giving such hyperfine coupling are situated
on the β-methylene carbon of the Se-Cysteine in the oxidized form of the enzyme, which
suggests that SeCys is also coordinated to the Mo(V) ion. In contrast, the second interacting
nucleus is exchangeable with solvent and produces a splitting detectable at the three
principal g-values. This interaction, which is more isotropic, must be produced by protons of
a solvent molecule bound to the Mo, and, hence it must correspond to ligand –OH2 in
Figure II.1.6. The spectra taken at shorter incubation times, even those obtained
immediately after reductant addition, are similar but with lower intensity. This indicates that,
under these experimental conditions, splittings from formate α-proton can be neither
detected nor solved.
II.3.5.1.3 Azide and cyanide inhibited enzyme.
Since azide and cyanide are inhibitors of Dd Fdh, their effects on formate signal
were investigated by two different experiments. One of them aimed to detect the Mo(V)
species obtained in inhibited enzyme samples followed by formate/dithionite reduction,
whereas the second experiment pursued to check the effect of both inhibitors on the
formate species.
For the first experiment, azide inhibited samples of as-prepared and D2O-exchanged
samples of Dd Fdh were reduced with DCOONa and HCOONa (Figure II.3.23a-d) and
immediately frozen. In contrast to the formate signal, the intensity of these signals reaches
the maximal value immediately after reductant addition (~ 10% of the total molybdenum).
The spectra of Figure II.3.23 show a nearly axial symmetry with resonance lines split with a

II.3 Results
73
solvent exchangeable proton at gmid and gmin when the enzyme is incubated with
HCOONa. This confirms that the splitting at gmid and gmin is originated from the formate α-
proton. Similar spectra were obtained on dithionite reduction. Surprisingly, this signal
corresponds to the 2.094 signal obtained in Ec Fdh-H on dithionite/formate reduction. A
simulation of the 2.094 signal in Ec Fdh-H is shown in Figure II.3.23e for comparison.
Figure II.3.23 EPR signals of azide inhibited samples (black lines) obtained after 15 seconds of formate
reduction to Dd Fdh together with simulations (red lines). a) Inhibited enzyme in H2O-buffer reduced with
HCOONa, b) Inhibited enzyme in H2O-buffer reduced with DCOONa, c) Inhibited enzyme exchanged into
D2O-buffer reduced with HCOONa, d) Inhibited enzyme exchanged into D2O-buffer reduced with DCOONa,
and e) 2.094 signal from E coli Fdh-H. S. Experimental conditions: Microwave frequency, 9.65 GHz;
Modulation field, 100 kHz, Modulation amplitude, 5 G; Microwave power, 2 mW; Temperature, 100 K.
2,12 2,08 2,04 2 1,96 1,92
3300 3400 3500 3600
g-value
Magnetic Field [G]
a
b
c
de

II.3 Results
74
Table II.3.8 EPR parameters for simulations of Azide signals. Linewidth (between parentheses) and A are given
in G and cm-1 × 10⁻⁴, respectively.
The EPR spectra taken at longer incubation times (15 min) reveal additional
information. As-prepared sample reduced with DCOONa (Figure II.3.24a) yielded a
spectrum similar to that of Figure 3.23b after longer incubation times (Figure II.3.24b). In
contrast, D2O-exchanged samples reduced with HCOONa (Figure II.3.24c) yielded a similar
spectrum to that of Figure 3.23d (Figure II.3.24d). These results indicates that the proton
which originates the resonance lines split at gmid and gmin is solvent exchangeable. Similar
results were obtained in Ec Fdh-H [11].
EPR signal gmax gmid gmin A max Amid Amin
Dd Fdh Azide signal (HCOONa)
2.092 (20) 2.000(9) 1.989 (9) nd 7.0 7.0
Dd Fdh Azide signal (DCOONa)
2094(11) 2.000(9) 1.988 (9) nd nd nd
2.094 signal 2.094 2.000 1.989 2.5 6.3 7.0

II.3 Results
75
Figure II.3.24 EPR signals of azide inhibited samples obtained at different incubation times with sodium
formate. a) Inhibited enzyme in H2O-buffer reduced 15 sec with DCOONa, b) Inhibited enzyme in H2O-buffer
reduced 15 min with DCOONa, c) Inhibited enzyme exchanged into D2O-buffer incubated 15 sec with
HCOONa, d) Inhibited enzyme exchanged into D2O-buffer incubated 15 min with HCOONa. Frequency:
9.65 GHz, Modulation field: 100 kHz, Modulation amplitude: 5 G, Microwave power: 2 mW, and
Temperature, 100 K.
For the second experiment, azide or cyanide were added to samples showing the
formate signal. The 2.094 signal was also detected under these conditions and no signs of
both the formate signal and the Rhombic I signal, even in the sample obtained immediately
after inhibitor addition, were observed (not shown).
Similar results were obtained by cyanide as inhibitor (data no shown).
2,12 2,08 2,04 2 1,96 1,92
3300 3400 3500 3600
g-values
Magnetic Field [G]
a
b
c
d

II.3 Results
76
II.3.6.2 Iron-sulphur clusters
Figure II.3.25 shows the EPR spectra taken at 20 K and at 40 K. Both signals have
EPR parameters and relaxation behaviours typical of [4Fe-4S] clusters in a low spin
configuration (s=1/2). The signal observed at 40 K is called FeS I whereas the broader
signal, which is observed at temperatures lower than 20 K, is called FeS II.
Figure II.3.25 EPR spectra of the reduced FeS clusters in Dd Fdh at 20 K and 40K. Frequency: 9.65 GHz,
Modulation field: 100 kHz, Modulation amplitude: 10 G, and Microwave power: 2 mW.
Note that gmid of the FeS I signal feature shows a shoulder, which is marked with an
asterisk, and can be originated from either magnetic coupling between centres or from a
different centre. To elucidate the origin of the shoulder at gmid, EPR measurements at Q-
band were performed (Figure II.3.26). These results show a better resolution of the
shoulder indicating that the FeS I signal is composed by one major rhombic component
and one minor axial component. The simulation of this spectrum was achieved assuming a
ratio 0.84:0.16 between both components (Figure II.3.26, EPR parameters Table II.3.9). The
simulation of the X-band spectrum at 10 K indicates a ratio 1:1 between FeS I and FeS II
3000 3200 3400 3600 3800 4000
2,2 2,1 2 1,9 1,8g value
Magnetic Field [G]

II.3 Results
77
signal. EPR saturation studies of FeS I signal at 30 K (Figure II.3.27) show that both
components have the same saturation behaviour, which points to a single centre in two
different conformations instead of different centres.
Figure II.3.26 Q-band spectra of the reduced FeS clusters in Dd Fdh at 10 K together with its simulations (red
lines). Frequency: 33.94 GHz, Modulation field: 100 kHz, Modulation amplitude: 5G, and Microwave power:
4.256 x 10⁻² mW.
Table II.3.9 EPR parameters for simulations of FeS I signals. Linewidth (between parentheses) are given in G.
2,1 2,05 2 1,95 1,9 1,85
11400 11700 12000 12300 12600 12900 13200
g-value
Magnetic Field [G]
Major component
Minor component
FeSI
EPR signal gmax gmid gmin
Major component 1.893 (60) 1.9405 (25) 2.045 (20)
Minor component 1.943 (50) 1.943 (50) 2.045 (50)

II.3 Results
78
Figure II.3.27 FeS I EPR signal at 63.5 mW and 2 mW. Frequency: 9.65 GHz, Modulation field: 100 kHz,
Modulation amplitude: 10 G, and Temperature: 40 K.
Spin quantification of the spectra at 20 and 40 K taking into account the protein
concentration yielded values close to 2 spins/protein and 1 spin/protein, respectively. This
calculation performed considering the iron content (~15 Fe/protein) raise to values close to
4 spins/protein and 2 spins/protein.
II.3.5.3 Heme centres
The EPR signal associated with heme groups, which is typical of Fe3+ ions in a low
spin configuration, is similar to that previously reported (Figure II.3.28) [52]. This signal was
simulated in reference [52] assuming four different hemes, which is in line with the histidine
motifs observed in the amino acid sequence determined for the small subunit (see section
II.3.3)
3200 3400 3600 3800
2,2 2,1 2 1,9 1,8
63.5 mW
2 mW
g-value
Magnetic Field [G]

II.3 Results
79
Figure II.3.28 EPR spectrum of the as-prepared Dd Fdh associated with the four different heme groups. The
peaks marked with an asterisk correspond to adventitious iron (g~4.3) and Mo signals (g~2). Frequency, 9.65
GHz; Modulation field, 100 kHz; Modulation amplitude, 10 G; Microwave power, 2 mW, and Temperature: 20
K.
1500 2000 2500 3000 3500 4000 4500
4,2 3,6 3 2,4 1,8
∗2
*1
g-values
Magnetic Field [G]

II.3 Results
80

81
II.4. DISCUSSION
II.4.1 Gene organization of Desulfovibrio desulfuricans ATCC 27774 Fdh
The fdh cluster contains four well identified open read frames that were designated
fdhA, fdhB, fdhE, and fdhC. Two gaps upstream and downstream of fdhE could indicate
the presence of additional genes involved in the Fdh assembling, however, no homology
with another annotated sequences have been identified. Futhermore, no termination-like
sequences were found between genes suggesting that fdh genes are more likely
expressed as an operon.
Table II.4.1 shows the sequence identity percentage between Dd Fdh and several
related Fdhs. All the three Dd Fdh subunits revealed high identity percentage with the
homologous enzyme from D. vulgaris Hildenborough.
Table II.4.1 Sequence identity percentage between Dd Fdh subunits and another related Fdhs. Accession
number of subunits from different microorganisms are: a, YP_012024, YP_012023 and YP_012021; b,
YP_390001 and YP_390002; c, Q934F5 and Q8GC87; d, YP_387213 and YP_387214; e, YP_011694 and
YP_011693; f, YP_009809 and YP_009810; g, YP_387309 and YP_387308; h, P24183, P24184 and P24185 ; i,
P32176, P32175 and P32174; j, P07658.
α β γ
Dv H Fdh-3a 83 79 54
Dd G20 Fdhb 73 69 n.p.
Dg W-Fdhc 53 50 n.p.
Dd G20 Fdhd 53 49 n.p.
Dv H Fdhe 50 58 33
Dv H Fdhf 50 53 n.p.
Dd G20 Fdhg 48 53 n.p.
Ec K12 Fdh-Nh 44 25 12
Ec K12 Fdh-Oi 43 24 12
Ec K12 Fdh-Hj 18 n.p. n.p.
Dd Fdh subunits

II.4 Discussion
82
Figure II.4.1 shows the organization of the fdh genes in several bacteria. As shown in this
figure, the organization of Dd fdh genes highly resembles to that of D. vulgaris
Hildenborough fdh-3 operon.
Figure II.4.1 Schematic representation of the fdh gene organization in diverse bacteria. Dde: D. desulfuricans
G20, DVU: D. vulgaris Hildenborough, b14XX: Escherichia coli K12.
The first gene of the operon, fdhA, codifies to FdhA, which is the subunit containing
the active site. A putative ribosome binding site sequence as well as promoter-like regions is
located 9 nucleotides upstream of the ATG codon (Figure II.3.4).
Alignment of FdhA subunit with sequences from different organisms reveals highly
conserved residues (Figure II.3.6). As already described for another Fdhs [27, 38, 40, 47],
FdhA sequence contains a -CX2CXnCXmC- motif which is likely associated with the [4Fe-4S]
centre detected by EPR spectroscopy. The position of this motif is consistent with the
Dde0706
fdhE
Dde0682
fdhADde0680
fdhCDde0681
fdhBDde0706
~20kbp
fdhD
~ ~Dde0706
fdhEDde0682
fdhADde0681
fdhBDde0706
~10kbp
fdhD
~ ~Dde0813
fdhADde0812
fdhB
Dde3515
fdhEDde3513
fdhADde3514
fdhB
Dde3516
fdhD
DVU2810
fdhEDVU2812
fdhADVU2811
fdhB
DVU2809
fdhC
DVU0587
fdhA
DVU0588
fdhB
DVU2483
fdhCDVU2482
fdhADVU2481
fdhB
DVU2484
fdhD
b1474
fdhA
b1475
fdhB
b1476
fdhC
fdhEfdhA fdhB fdhC
~0.4kbp ~0.4kbp
Desulfovibrio desulfuricans ATCC 27774
Dv Hildenborough Fdh-3
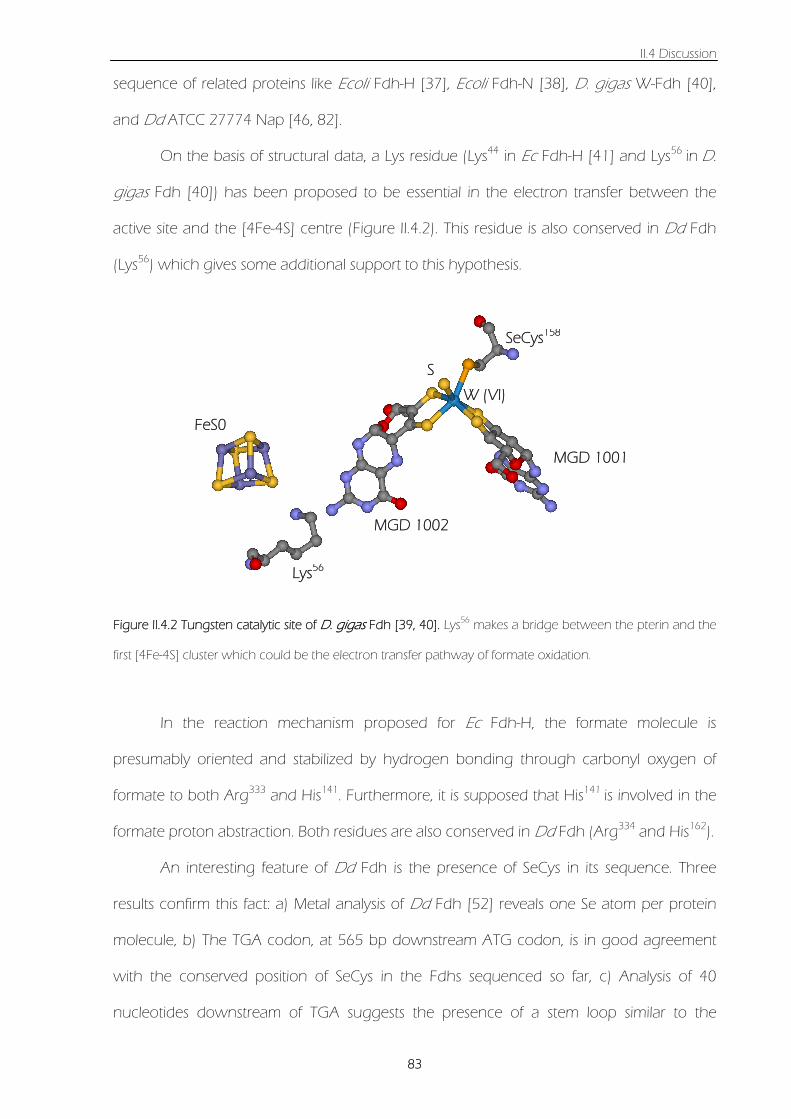
II.4 Discussion
83
sequence of related proteins like Ecoli Fdh-H [37], Ecoli Fdh-N [38], D. gigas W-Fdh [40],
and Dd ATCC 27774 Nap [46, 82].
On the basis of structural data, a Lys residue (Lys44 in Ec Fdh-H [41] and Lys56 in D.
gigas Fdh [40]) has been proposed to be essential in the electron transfer between the
active site and the [4Fe-4S] centre (Figure II.4.2). This residue is also conserved in Dd Fdh
(Lys56) which gives some additional support to this hypothesis.
Figure II.4.2 Tungsten catalytic site of D. gigas Fdh [39, 40]. Lys56 makes a bridge between the pterin and the
first [4Fe-4S] cluster which could be the electron transfer pathway of formate oxidation.
In the reaction mechanism proposed for Ec Fdh-H, the formate molecule is
presumably oriented and stabilized by hydrogen bonding through carbonyl oxygen of
formate to both Arg333 and His141. Furthermore, it is supposed that His141 is involved in the
formate proton abstraction. Both residues are also conserved in Dd Fdh (Arg334 and His162).
An interesting feature of Dd Fdh is the presence of SeCys in its sequence. Three
results confirm this fact: a) Metal analysis of Dd Fdh [52] reveals one Se atom per protein
molecule, b) The TGA codon, at 565 bp downstream ATG codon, is in good agreement
with the conserved position of SeCys in the Fdhs sequenced so far, c) Analysis of 40
nucleotides downstream of TGA suggests the presence of a stem loop similar to the
FeS0
Lys56
MGD 1002
W (VI)
MGD 1001
SeCys158
S

II.4 Discussion
84
proposed for D. gigas fdhA [65], Ec fdhF [27] and fdhG [20]. These 40 nucleotides could
be the selenocysteine insertion sequence (SECIS) necessary to decode the TGA codon
(Figure II.4.3).
Figure II.4.3 Postulated SECIS element for Desulfovibrio desulfuricans fdhA. C: single C that prevents UGA read
through, T: bulged T that interacts with SELB (See section II.1.4).
A putative RBS (AAGGAG) was found 37 bp downstream to the stop codon of
fdhA. In addition, ATG and TAG codons were identified at 12 and 669 bp upstream of this
RBS, respectively. This ORF reveals the presence of a second gene (fdhB) which codifies to
FdhB. The amino acid sequence of this subunit contains three -CX2CXnXmC- motifs in
conserved positions when compared with related Fdhs [38, 40].
The analysis of the 1732 nucleotides downstream to the fdhB stop codon reveals
the presence of several ORFs. However, only one shows a significant homology with
annotated proteins. This ORF seems to codify for a protein called FdhE, which seems to be
involved in the formation of Fdh. Based on the cellular locations of this protein as well as
results obtained from immunoprecipitation assays, it was concluded that fdhE does not
define any structural gene [66, 67].

II.4 Discussion
85
The putative RBS sequence, which is 430 bp downstream from the stop codon of
fdhE, is part of an ORF that codifies for a tetraheme c- type cytochrome (FdhC). This Fdh
subunit is the last component of the electron transfer pathway from formate to the electron
acceptor. The presence of four conserved His located out of the -CX2CH- motifs should
provide the remaining axial ligands for the four hemes of FdhC. This hexa-coordinated iron
site is in line with the low spin heme detected by EPR spectroscopy [52].
II.4.2 Kinetic properties
To establish the best conditions of the enzymatic assays, a set of optimization studies
were performed. The key step of the reaction was demonstrated to be the previous
reduction of the enzyme with its natural substrate. This procedure is essential to eliminate
the lag phase observed in the previously reported conditions [52]. This activation also
produces a shortening of the first order phase, which decreases from 30 min to a few
seconds. The improvement of the assay kinetic conditions allowed a carefully study of the
kinetic properties of Dd Fdh.
There are a few reports about kinetic properties of Fdh containing Mo or W at the
active site. In general, these enzymes display a Michaelian behaviour and the kinetic
parameters vary widely among the different organisms. The kinetic parameters for several
Fdhs are shown in Table II.4.2.

II.4 Discussion
86
Table II.4.2 Kinetic parameters of Fdhs isolated from diverse sources
The differences in kinetic constants could be a consequence of factors such as
variability subunit composition, metal contents, and redox cofactors among others.
Several studies leading to establish the relevance of β-mercaptoethanol in the kinetic
assay were performed. As shown in section II.3.4.2 (Figure II.3.11), the presence of thiol in
the reaction mixture increases approximately four times the turnover number. However,
one point that needs to be elucidated is the function of the thiol in the assay. It is though
that β-mercaptoethanol breaks a disulfide bridge present in the D. gigas Fdh structure,
which would allow the opening and movement of the formate entry cleft [40]. Additional
work should be necessary to confirm this hypothesis.
II.4.2.1 Influence of the C-H break in the rate liming-step
The effect of C-H break on the oxidation of formate was evaluated using DCOONa
as substrate. A 3-fold decrease in the turnover number was observed for both enzymes (D.
gigas and Dd Fdh) when DCOONa is used instead of HCOONa (section II.3.4.3, Table
II.3.3). This result shows a primary isotope effect indicating that the break of the C-H bond is
the rate limiting-step. Although a detailed analysis of this effect can become complicated,
the basic idea could be summarized as follow. At room temperature, the C-H bond is in its
vibrational ground state (n=0), which corresponds to the zero point energy of the bond
Source MetalKm formate
(mM)
k cat formate
(sec-1)
Desulfovibrio desulfuricans Mo 0.06(2) 347(19)
Desulfovibrio gigas W 0.051(4) 54(1)
Escherichia coli K12 Mo 13.3 1367
Syntrophobacter fumaroxidans 1 W 0.04 3792
Syntrophobacter fumaroxidans 2 W 0.01 5625

II.4 Discussion
87
En = h ν (equation II.4.1)
where, h is the Planck constant and ν is the fundamental vibrational frequency.
The fundamental vibrational frequency of the chemical bond between two atoms (in this
case C-H or C-D) is given by
ν = μπk
21
(equation II.4.2)
where, k is the spring constant for the bond and μ is the reduced mass (mC and mH/D stand
for the masses of the carbon and hydrogen/deuterium atoms, respectively)
H/Dc
H/Dc
mm
mm
CH/CD +=μ
This is shown in Figure II.4.4 in which the zero point energy (equation II.4.1) corresponding
to the C-D bond is lower than that of the C-H bond. It means that the lower the zero point
energy, the higher is the energy necessary to overcome the activation energy for the bond
cleavage, which results in lower turnover numbers.
Figure II.4.4. Potential energy as a function of the distance between the atoms involved in a C-H bond (left)
and C-D bond (reproduced from reference [84]). The difference between the energies of the fundamental
vibrational state is indicated.
D

II.4 Discussion
88
II.4.2.2 Effect of inhibitors
Three different compounds were tested as inhibitors. Azide, which shows a mixed
inhibition pattern, is the strongest inhibitor with Kic lower than Kmformate. Similar results were
observed for the E coli Fdh-H [85]. Cyanide is also a mixed inhibitor with Kic and Kiuc around
1.63±0.16 mM and 0.42±0.12 mM, respectively. It has been postulated that the inhibition
by cyanide in Fdh from Methanobacterium formicicum removes a sulphur ligand
coordinated to molybdenum atom releasing thiocyanate [89]. This hypothesis is unlikely for
Dd Fdh because cyanide seems to be a more reversible inhibitor than irreversible.
Fdh is inhibited in a competitive manner by nitrate with Kic=0.63± 0.24 mM. This is
not surprising owing to the high homology between the Fdh and Nitrate reductases active
sites [10]. In addition, although with a very small specific activity, it was reported that Dd
Fdh reduces nitrate to nitrite [52]. Despite the similar active site observed in the Mo-
containing enzymes, it is not common to find examples of crossed reactivities. The
correlation between the structural and kinetic properties of these enzymes could give some
clues on the substrate preference developed by a given enzyme.
II.4.3 EPR of redox cofactors
II.4.3.1 The Fdh active site centre
II.4.3.1.1 The formate species
The Mo(V) EPR signal obtained upon dithionite reduction (Rhombic II signal) is
different from that of the formate reduced enzyme (formate signal) (Figure II.3.21b-c and
Figure II.3.22, respectively). The hyperfine splittings detected for the formate signal (Figure
II.3.22 see EPR parameters in Table II.3.7) suggest that both the SeCys and a hydroxyl/water
ligand are coordinated to molybdenum, which is in agreement with that proposed for the
oxidized and dithionite reduced forms of Dd Fdh [53]. Therefore, these data in conjunction
with the rhombic simetry of this signal suggest a distorted hexa-coordinated site for the
formate species. Our current interpretation for the structure of this species is similar to that

II.4 Discussion
89
shown in Figure II.4.5 for the oxidized form of Ec Fdh-H, in which ligand X should
correspond to an oxygenic species. Formate species could also correspond to a Mo(V)-
substrate complex. However, this possibility is tentatively excluded because formate, in such
a case, should occupy a seventh coordination position, which is unlikely for a member of
the DMSO family [10].
Figure II.4.5 Coordination around Mo centre for E coli. Data obtained from EPR experiments on Dd Fdh
suggests a similar coordination around Mo centre to that proposed for Mo(VI) from E coli Fdh-H, where
ligand X should correspond to an oxygenic species.
II.4.3.1.2 The 2.094 species. Effects of the inhibitors on the coordination around Mo(V)
centre
When azide (cyanide) inhibited samples are reduced with formate or dithionite, or
when formate reduced samples are incubated with any of the two inhibitors, the 2.094
signal is developed (Figure II.3.23). The formate signal is converted into the 2.094 signal
suggesting that the inhibitor molecules change the coordination geometry of the active
site. Furthermore, the fact that the two different inhibitor molecules yield the same EPR
signal indicates that azide (as well as cyanide) is not bound to the Mo active site, which is in
contrast with that proposed for the azide-inhibited form of Ec Fdh-H [37, 41]. Finally, as this
XH
His141
SeCys140
Mo

II.4 Discussion
90
signal can be obtained with any of the reductans (formate or dithionite), the formate
molecule is not bound to Mo in the 2.094 species.
The magnitude of the hyperfine coupling of the proton from formate suggests that
it is bound to a molybdenum ligand. Furthermore, this proton is solvent exchangeable,
which suggests that this ligand could be a hydroxyl/water molecule. Mo(V) EPR signals
having nearly axial symmetry, such as the one observed for the 2.094 signal, are usually
given by penta-coordinated Mo sites as those found in the proteins of the XO family of
enzymes [1]. Figure II.4.6 shows a tentative proposal for the structure of the 2.094 species,
in which a hydroxyl ligand occupies the apical position. This hypothesis is in agreement
with the recent reevaluation of the X-Ray data of formate reduced Ec Fdh-H by Raaijmakers
and Romão [42], which show that a Selenium atom does not occupy the apical position.
These authors postulated for this position a sulphur ligand but, as also stated by them, the
resolution is not good enough and could also correspond to an oxygenic species. A
pentacoordinated site for the 2.094 species was also proposed [37, 41] but with the apical
position been occupied by a SeCys ligand.
Figure II.4.6 Proposed coordination around Mo(V) centre. (a) Hexacoordinated structure proposed on the
basis of EPR data from Dd Fdh. (b) Pentacoordinated structure in agreement with re-evaluation of
crystallographic data obtained from E coli Fdh-H [42].
MoSS S
S
X
Formate species
MoS
S SS
[V][V]
2.094 species
SeCysAzide
(a) (b)
X

II.4 Discussion
91
II.4.4.1.3 Involvement of formate and 2.094 species in the reaction mechanism of formate
oxidation
Figure II.1.11 shows the two proposed reaction mechanisms for Ec Fdh-H. The
mechanism in black was proposed by Khangulov et al [37, 41], in which the 2.094 species
is the intermediate in the reoxidation from Mo(IV) to Mo(VI) [37]. The mechanism in red is a
new proposal by Raaijmakers and Romão [42] from the reevaluation of the X-Ray data.
The data now collected for Dd Fdh demonstrate that the 2.094 species is detected
because of the presence of azide (or cyanide) in the protein solution and hence its
detection in Ec Fdh-H is due to the enzyme needs to be purified in the presence of azide to
preserve inactivation by oxygen [85]. In contrast, Dd Fdh, like other formate
dehydrogenases from sulphate reducing bacteria that can be purified under aerobic
conditions without loss of activity, yields the distinct formate signal on formate reduction. In
this context, the formate signal detected in Dd Fdh could be also considered as a potential
reaction intermediate.
In contrast to any unspecific reductant (e.g. dithionite), formate, the natural
substrate of the enzyme, is a specific reductant of Fdhs. For example, formate cannot
reduce benzyl viologen like dithionite, as well as cannot reduce Mo-containing enzymes of
the same family, e.g. nitrate reductases. It means that the reduction of the enzyme by
formate must be driven by a specific reaction and its reducing effect must necessarily be
accomplished through an interaction between the formate and the Mo active site. Under
these conditions, the electrons given to the enzyme by formate are distributed along the
electron transfer pathway according to their relative values of redox potentials.
Furthermore, as discussed above, both the 2.094 and formate species do not correspond
to a substrate-bound forms, and hence they should correspond to Mo(V) species obtained
after CO2 release. Given the above, it is evident that both formate and 2.094 species are
produced by the specific interaction of the enzyme with substrate. However, whether they
correspond to a reaction intermediate or to Mo(V) species in equilibrium with Mo(VI) and

II.4 Discussion
92
Mo(IV) cannot be concluded with the present data and additional work is necessary to
elucidate this point. In any case, these results show that EPR properties of the Mo(V) ions
depend on the preparation of the sample and hence their structures. The presence of
reduced species showing pyramidal coordination seem to depend on the presence of
azide (or cyanide) in the medium whereas hexacoordianted ones are obtained without
inhibitors. These results are supported by EXAFS data taken in dithionite reduced Dd Fdh
(Figure II.1.6, [53]) which showed hexacoordianted Mo sites. Unfortunately, none of these
studies were carried out using formate as reductant. This experiment could be useful to
clarify this hypothesis.
II.4.3.2 The [4Fe-4S] clusters
The analysis of the amino acid sequence shows that the large subunit of Dd Fdh
contains one [4Fe-4S] cluster, whereas the β-subunit contains three additional centres of
the same type. This cluster composition seems to be conseved in other closely related Fdhs
from sulphate reducing bacteria [10]. All these centres are aligned along an electron
transfer zig-zag pathway. Nevertheless, spin quantification by EPR taking into account the
protein concentration yields 2 spins/protein. This suggests that only two iron sulphur
clusters are in the [4Fe-4S]1+ (s=1/2) reduced form whereas two are in the diamagnetic
[4Fe-4S]2+ redox state. However, taking into account the iron content (15 Fe/protein) and
considering that the haemic iron was determined to be 4 Fe/protein [52], it is evident that
the protein lose some Fe from [4Fe-4S] centres during purification. Recalculation of the spin
concentration of the spectra at 40 K and 20 K taking into account this facts yields 4
spins/protein and 2 spins/protein, respectively. This would indicates that the four FeS
centres are in the [4Fe-4S]1+ reduced form. In summary, there are 4 FeS centres of which
two should give the FeS I signal and the remaining two the FeS II signal. Similar results
were obtained in the closely related D. gigas Fdh [39, 40]

93
II.5 References 1. Hille R, The Mononuclear Molybdenum Enzymes. Chem Rev, 1996. 96(7): p. 2757-2816.
2. Johnson MK, C. RD, and Adams MW, Tungstoenzymes. Chem. Rev., 1996. 96: p. 2817-2840.
3. Moriwaki Y, Yamamoto T, and Higashino K, Distribution and pathophysiologic role of molybdenum-
containing enzymes. Histol Histopathol, 1997. 12(2): p. 513-524.
4. Zumft WG, Cell biology and molecular basis of denitrification. Microbiol. Mol. Biol. Rev., 1997. 61(4):
p. 533-616.
5. Hamilton WA, Microbially influenced corrosion as a model system for the study of metal microbe
interactions: a unifying electron transfer hypothesis. Biofouling, 2003. 19(1): p. 65-76.
6. Einsle O, Tezcan FA, Andrade SLA, Schmid B, Yoshida M, Howard JB, and Rees DC, Nitrogenase
MoFe-Protein at 1.16 A Resolution: A Central Ligand in the FeMo-Cofactor. Science, 2002. 297(5587):
p. 1696-1700.
7. Dobbek H, Gremer L, Kiefersauer R, Huber R, and Meyer O, Catalysis at a dinuclear [CuSMo(==O)OH]
cluster in a CO dehydrogenase resolved at 1.1-A resolution. PNAS, 2002. 99(25): p. 15971-15976.
8. Romao MJ, Knablein J, Huber R, and Moura JJ, Structure and function of molybdopterin containing
enzymes. Prog Biophys Mol Biol, 1997. 68(2-3): p. 121-144.
9. Romao MJ and Huber R, Structure and function of the xanthineoxidase family of molybdenum
enzymes. Springer-Verlag ed. in Metal Sites in Proteins and ModelssRedox Centers, Structure and
Bonding. Vol. 90. 1998, Berlin, Germany. 69-96.
10. Moura JJ, Brondino CD, Trincao J, and Romao MJ, Mo and W bis-MGD enzymes: nitrate reductases
and formate dehydrogenases. J Biol Inorg Chem, 2004. 9(7): p. 791-799.
11. Romao MJ, Cunha CA, Brondino CD, and Moura JJ. ed. MIB Syst. Vol. 39. 2002. 539-570.
12. Bursakov SA, Gavel OY, Di Rocco G, Lampreia J, Calvete J, Pereira AS, Moura JJ, and Moura I,
Antagonists Mo and Cu in a heterometallic cluster present on a novel protein (orange protein)
isolated from Desulfovibrio gigas. J Inorg Biochem, 2004. 98(5): p. 833-840.
13. Fenske D, Gnida M, Schneider K, Meyer-Klaucke W, Schemberg J, Henschel V, Meyer AK, Knochel A,
and Muller A, A new type of metalloprotein: The Mo storage protein from azotobacter vinelandii
contains a polynuclear molybdenum-oxide cluster. Chembiochem, 2005. 6(2): p. 405-413.
14. Ferry JG, Formate dehydrogenase. FEMS Microbiol Rev, 1990. 7(3-4): p. 377-382.
15. Maden BE, Tetrahydrofolate and tetrahydromethanopterin compared: functionally distinct carriers in
C1 metabolism. Biochem J, 2000. 350 Pt 3: p. 609-629.
16. Richardson DJ, Bacterial respiration: a flexible process for a changing environment. Microbiology,
2000. 146(3): p. 551-571.
17. Unden G and Bongaerts J, Alternative respiratory pathways of Escherichia coli: energetics and
transcriptional regulation in response to electron acceptors. Biochim Biophys Acta, 1997. 1320(3): p.
217-234.

II.5 References
94
18. Böck A and Thanbichler M, EcoSal-Escherichia coli and Salmonella. in Cellular and Molecular Biology,
ed. R Curtiss. Vol. 3.6.1.1. 2004, Washington, D.C.: ASM Press.
19. Sawers RG and Clark DP, EcoSal–Escherichia coli and Salmonella. in Cellular and Molecular Biology,
ed. I Curtiss, R. 2004, Washington, D.C.: ASM Press.
20. Berg BL, Li J, Heider J, and Stewart V, Nitrate-inducible formate dehydrogenase in Escherichia coli K-
12. I. Nucleotide sequence of the fdnGHI operon and evidence that opal (UGA) encodes
selenocysteine. J. Biol. Chem., 1991. 266(33): p. 22380-22385.
21. Enoch HG and Lester RL, The purification and properties of formate dehydrogenase and nitrate
reductase from Escherichia coli. J. Biol. Chem., 1975. 250(17): p. 6693-6705.
22. Richardson D and Sawers G, STRUCTURAL BIOLOGY: PMF Through the Redox Loop. Science, 2002.
295(5561): p. 1842-1843.
23. Jormakka M, Byrne B, and Iwata S, Formate dehydrogenase--a versatile enzyme in changing
environments. Curr Opin Struct Biol, 2003. 13(4): p. 418-423.
24. Jormakka M, Byrne B, and Iwata S, Proton motive force generation by a redox loop mechanism. FEBS
Lett, 2003. 545(1): p. 25-30.
25. Sawers G, Heider J, Zehelein E, and Bock A, Expression and operon structure of the sel genes of
Escherichia coli and identification of a third selenium-containing formate dehydrogenase isoenzyme.
J. Bacteriol., 1991. 173(16): p. 4983-4993.
26. Sawers RG, Ballantine SP, and Boxer DH, Differential expression of hydrogenase isoenzymes in
Escherichia coli K-12: evidence for a third isoenzyme. J. Bacteriol., 1985. 164(3): p. 1324-1331.
27. Zinoni F, Birkmann A, Stadtman TC, and Bock A, Nucleotide Sequence and Expression of the
Selenocysteine-Containing Polypeptide of Formate Dehydrogenase (Formate-hydrogen-lyase-Linked)
from Escherichia coli. PNAS, 1986. 83(13): p. 4650-4654.
28. Sawers RG, Formate and its role in hydrogen production in Escherichia coli. Biochem Soc Trans,
2005. 33(Pt 1): p. 42-46.
29. Heidelberg JF, et al., The genome sequence of the anaerobic, sulfate-reducing bacterium
Desulfovibrio vulgaris Hildenborough. Nat Biotechnol, 2004. 22(5): p. 554-559.
30. Friedebold J and Bowien B, Physiological and biochemical characterization of the soluble formate
dehydrogenase, a molybdoenzyme from Alcaligenes eutrophus. J. Bacteriol., 1993. 175(15): p. 4719-
4728.
31. Jollie DR and Lipscomb JD, Formate dehydrogenase from Methylosinus trichosporium OB3b.
Purification and spectroscopic characterization of the cofactors. J. Biol. Chem., 1991. 266(32): p.
21853-21863.
32. Karzanov VV, Bogatsky Yu A, Tishkov VI, and Egorov AM, Evidence for the presence of a new NAD+-
dependent formate dehydrogenase in Pseudomonas sp. 101 cells grown on a molybdenum-
containing medium. FEMS Microbiol Lett, 1989. 51(1): p. 197-200.

II.5 References
95
33. Chistoserdova L, Laukel M, Portais J-C, Vorholt JA, and Lidstrom ME, Multiple Formate
Dehydrogenase Enzymes in the Facultative Methylotroph Methylobacterium extorquens AM1 Are
Dispensable for Growth on Methanol. J. Bacteriol., 2004. 186(1): p. 22-28.
34. Laukel M, Chistoserdova L, Lidstrom ME, and Vorholt JA, The tungsten-containing formate
dehydrogenase from Methylobacterium extorquens AM1: Purification and properties. Eur. J.
Biochem., 2003. 270(2): p. 325-333.
35. Brondino CD, Rivas MG, Romão MJ, Moura JJG, and Moura I, Structural and Electron Paramagnetic
Resonance (EPR) Studies of Mononuclear Molybdenum Enzymes from Sulfate-Reducing Bacteria.
Acc. Chem. Res., 2006: 39(10): p. 788-96.
36. Hagen WR and Arendsen AF, The Bio-Inorganic Chemistry of Tungsten. Structure and Bonding,
1998. 90: p. 161-192.
37. Boyington JC, Gladyshev VN, Khangulov SV, Stadtman TC, and Sun PD, Crystal Structure of Formate
Dehydrogenase H: Catalysis Involving Mo, Molybdopterin, Selenocysteine, and an Fe4S4 Cluster.
Science, 1997. 275(5304): p. 1305-1308.
38. Jormakka M, Tornroth S, Byrne B, and Iwata S, Molecular Basis of Proton Motive Force Generation:
Structure of Formate Dehydrogenase-N. Science, 2002. 295(5561): p. 1863-1868.
39. Raaijmakers H, Teixeira S, Dias JM, Almendra MJ, Brondino CD, Moura I, Moura JJ, and Romao MJ,
Tungsten-containing formate dehydrogenase from Desulfovibrio gigas: metal identification and
preliminary structural data by multi-wavelength crystallography. J Biol Inorg Chem, 2001. 6(4): p.
398-404.
40. Raaijmakers H, Macieira S, Dias JM, Teixeira S, Bursakov S, Huber R, Moura JJ, Moura I, and Romao
MJ, Gene sequence and the 1.8 A crystal structure of the tungsten-containing formate
dehydrogenase from Desulfovibrio gigas. Structure, 2002. 10(9): p. 1261-1272.
41. Khangulov SV, Gladyshev VN, Dismukes GC, and Stadtman TC, Selenium-containing formate
dehydrogenase H from Escherichia coli: a molybdopterin enzyme that catalyzes formate oxidation
without oxygen transfer. Biochemistry, 1998. 37(10): p. 3518-3528.
42. Raaijmakers HC and Romao MJ, Formate-reduced E. coli formate dehydrogenase H: the
reinterpretation of the crystal structure suggests a new reaction mechanism. J Biol Inorg Chem, 2006.
11(7): p. 849-854.
43. Almendra MJ, Brondino CD, Gavel O, Pereira AS, Tavares P, Bursakov S, Duarte R, Caldeira J, Moura
JJ, and Moura I, Purification and characterization of a tungsten-containing formate dehydrogenase
from Desulfovibrio gigas. Biochemistry, 1999. 38(49): p. 16366-16372.
44. Berks BC, A common export pathway for proteins binding complex redox cofactors? Mol Microbiol,
1996. 22(3): p. 393-404.
45. Rodrigue A, Chanal A, Beck K, Muller M, and Wu L-F, Co-translocation of a Periplasmic Enzyme
Complex by a Hitchhiker Mechanism through the Bacterial Tat Pathway. J. Biol. Chem., 1999.
274(19): p. 13223-13228.

II.5 References
96
46. Dias JM, Than ME, Humm A, Huber R, Bourenkov GP, Bartunik HD, Bursakov S, Calvete J, Caldeira J,
Carneiro C, Moura JJ, Moura I, and Romao MJ, Crystal structure of the first dissimilatory nitrate
reductase at 1.9 A solved by MAD methods. Structure, 1999. 7(1): p. 65-79.
47. Sebban C, Blanchard L, Bruschi M, and Guerlesquin F, Purification and characterization of the
formate dehydrogenase from Desulfovibrio vulgaris Hildenborough. FEMS Microbiol Lett, 1995.
133(1-2): p. 143-149.
48. Czjzek M, Payan F, Guerlesquin F, Bruschi M, and Haser R, Crystal structure of cytochrome c3 from
Desulfovibrio desulfuricans Norway at 1.7 A resolution. J Mol Biol, 1994. 243(4): p. 653-667.
49. Sebban-Kreuzer C, Dolla A, and Guerlesquin F, The formate dehydrogenase-cytochrome c553
complex from Desulfovibrio vulgaris Hildenborough. Eur J Biochem, 1998. 253(3): p. 645-652.
50. ElAntak L, Dolla A, Durand MC, Bianco P, and Guerlesquin F, Role of the tetrahemic subunit in
Desulfovibrio vulgaris hildenborough formate dehydrogenase. Biochemistry, 2005. 44(45): p. 14828-
14834.
51. Brondino CD, Passeggi MC, Caldeira J, Almendra MJ, Feio MJ, Moura JJ, and Moura I, Incorporation
of either molybdenum or tungsten into formate dehydrogenase from Desulfovibrio alaskensis NCIMB
13491; EPR assignment of the proximal iron-sulfur cluster to the pterin cofactor in formate
dehydrogenases from sulfate-reducing bacteria. J Biol Inorg Chem, 2004. 9(2): p. 145-151.
52. Costa C, Teixeira M, LeGall J, Moura JJG, and Moura I, Formate dehydrogenase from Desulfovibrio
desulfuricans ATCC 27774: Isolation and spectroscopic characterization of the active sites (heme,
iron-sulfur centers and molybdenum). J. Biol. Inorg. Chem., 1997. 2: p. 198-208.
53. George GN, Costa C, Moura JJG, and Moura I, Observation of Ligand-Based Redox Chemistry at the
Active Site of a Molybdenum Enzyme. J. Am. Chem. Soc., 1999. 121 (11): p. 2625-2626.
54. Axley MJ, Grahame DA, and Stadtman TC, Escherichia coli formate-hydrogen lyase. Purification and
properties of the selenium-dependent formate dehydrogenase component. J. Biol. Chem., 1990.
265(30): p. 18213-18218.
55. Berg BL and Stewart V, Structural Genes for Nitrate-Inducible Formate Dehydrogenase in Escherichia
coli K-12. Genetics, 1990. 125(4): p. 691-702.
56. Page CC, Moser CC, Chen X, and Dutton PL, Natural engineering principles of electron tunnelling in
biological oxidation-reduction. Nature, 1999. 402(6757): p. 47-52.
57. Holm RH, Metal-centered oxygen atom transfer reactions. Chem. Rev., 1987. 87(6): p. 1401-1449.
58. Berks BC, Palmer T, and Sargent F, The Tat protein translocation pathway and its role in microbial
physiology. Adv Microb Physiol, 2003. 47: p. 187-254.
59. Mori H and Cline K, Post-translational protein translocation into thylakoids by the Sec and DeltapH-
dependent pathways. Biochim Biophys Acta, 2001. 1541(1-2): p. 80-90.
60. DeLisa MP, Tullman D, and Georgiou G, Folding quality control in the export of proteins by the
bacterial twin-arginine translocation pathway. PNAS, 2003. 100(10): p. 6115-6120.
61. Stadtman TC, Selenocysteine. Annu Rev Biochem, 1996. 65: p. 83-100.

II.5 References
97
62. Liu Z, Reches M, Groisman I, and Engelberg-Kulka H, The nature of the minimal 'selenocysteine
insertion sequence' (SECIS) in Escherichia coli. Nucleic Acids Res., 1998. 26(4): p. 896-902.
63. Zinoni F, Heider J, and Bock A, Features of the Formate Dehydrogenase mRNA Necessary for
Decoding of the UGA Codon as Selenocysteine. PNAS, 1990. 87(12): p. 4660-4664.
64. Bock A, Forchhammer K, Heider J, Leinfelder W, Sawers G, Veprek B, and Zinoni F, Selenocysteine:
the 21st amino acid. Mol Microbiol, 1991. 5(3): p. 515-520.
65. Macieira S, Isolation of the genes of aldehyde oxidoreductase amd formate dehydrogenase and
Biochemical characterization of coproporphyrinogen-III oxidase, in Chemistry Department. 2002,
New University of Lisbon: Lisbon.
66. Schlindwein C, Giordano G, Santini CL, and Mandrand MA, Identification and expression of the
Escherichia coli fdhD and fdhE genes, which are involved in the formation of respiratory formate
dehydrogenase. J. Bacteriol., 1990. 172(10): p. 6112-6121.
67. Stewart V, Lin JT, and Berg BL, Genetic evidence that genes fdhD and fdhE do not control synthesis
of formate dehydrogenase-N in Escherichia coli K-12. J. Bacteriol., 1991. 173(14): p. 4417-4423.
68. Peterson GL. in Enzyme Structure, ed. CHW Hirs and SN Timasheff. Vol. I. 1983, New York: Academic
Press. 95-119.
69. Laemmli UK, Cleavage of structural proteins during the assembly of the head of bacteriophage T4.
Nature, 1970. 227(5259): p. 680-685.
70. Blum H, Beier H, and Gross HJ, Improved silver staining of plant proteins, RNA and DNA in
polyacrylamide gels. Electrophoresis, 1987. 8: p. 93-99.
71. Nilges MJ. 1979, University of Illinois: Urbana, IL.
72. Maurice AM. 1980, University of Illinois: Urbana, IL.
73. Schuler GD, Altschul SF, and Lipman DJ, A workbench for multiple alignment construction and
analysis. Proteins Struct. Funct. Genet., 1991. 9(3): p. 180-190.
74. Siebert PD, Chenchik A, Kellogg DE, Lukyanov KA, and Lukyanov SA, An improved PCR method for
walking in uncloned genomic DNA. Nucleic Acids Res., 1995. 23(6): p. 1087-1088.
75. Siebert PD, Chen S, and Kellogg DE, The Human GenomeWalker DNA Walking Kit: A new PCR for
walking in uncloned genomic DNA, in CLONOTECHniques. 1995. p. 1-3.
76. Wilson K, Preparation of genomic DNA from bacteria. in Current protocols in molecular biology., ed.
FM Ausubel, et al. Vol. 1. 1994, New York, NY: John Wiley & Sons. 2.4.1-2.4.5.
77. Bendtsen JD, Henrik Nielsen H, von Heijne G, and Brunak S, Improved prediction of signal peptides:
SignalP 3.0. J. Mol. Biol., 2004. 340: p. 783-795.
78. Gasteiger E, Hoogland C, Gattiker A, Duvaud S, Wilkins MR, Appel RD, and Bairoch A, Protein
Identification and Analysis Tools on the ExPASy Server. in The Proteomics Protocols Handbook,
Humana Press, ed. JM Walker. 2005. 571-607.
79. Shagger H and Von Jagow H, Tricine-sodium dodecyl sulfate-polyacrylamide gel electrophoresis for
separation of proteins in the range from 1 to 100 kDa. Anal. Biochem., 1987. 166: p. 368-379.

II.5 References
98
80. Stanley NR, Palmer T, and Berks BC, The Twin Arginine Consensus Motif of Tat Signal Peptides Is
Involved in Sec-independent Protein Targeting in Escherichia coli. J. Biol. Chem., 2000. 275(16): p.
11591-11596.
81. Gladyshev VN, Boyington JC, Khangulov SV, Grahame DA, Stadtman TC, and Sun PD,
Characterization of Crystalline Formate Dehydrogenase H from Escherichia coli. J. Biol. Chem., 1996.
271(14): p. 8095-8100.
82. Gonzalez PJ, Correia C, Moura I, Brondino CD, and Moura JJ, Bacterial nitrate reductases: Molecular
and biological aspects of nitrate reduction. J Inorg Biochem, 2006. 100(5-6): p. 1015-1023.
83. ElAntak L, Analyse Génomique Fonctionnelle par RMN de Cytochromes c3 de la Bactérie
Desulfovibrio vulgaris Hildenborough. 2004, Université de Provence- Aix Marseille I: Marseille.
84. Cornish-Bowden A, Fundamentals of Enzyme Kinetics. 2nd ed. 2001, London: Portland Press.
85. Axley MJ and Grahame DA, Kinetics for formate dehydrogenase of Escherichia coli formate-
hydrogenlyase. J. Biol. Chem., 1991. 266(21): p. 13731-13736.
86. Blanchard JS and Cleland WW, Kinetic and chemical mechanisms of yeast formate dehydrogenase.
Biochemistry, 1980. 19(15): p. 3543-3550.
87. Cornish-Bowden A, A simple graphical method for determining the inhibition constants of mixed,
uncompetitive and non-competitive inhibitors. Biochem J, 1974. 137(1): p. 143-144.
88. Prince RC, Liu C, Morgan TV, and Mortenson LE, Formate dehydrogenase from Clostridium
pasteurianum Electron paramagnetic resonance spectroscopy of the redox active centers. FEBS Lett,
1985. 189(2): p. 263-266.
89. Barber MJ, May HD, and Ferry JG, Inactivation of Formate Dehydrogenase from Methanobacterium
formicicum by Cyanide. Biochemistry, 1986(25): p. 8150-8155.

3
III. Molybdenum-containing proteins from Sulphate Reducing
Bacteria: studying proteins with novel cofactors.


101
III.1. INTRODUCTION
Several years ago two Mo- and Fe-containing proteins were isolated from the
sulphate reducing bacteria D. africanus [1] and D. salexigens [2]. Preliminary
characterization of these proteins identified molybdenum and iron in both of them. More
recently a similar protein was purified from D. gigas, which contains Cu in addition to Mo
and Fe [3]. At present, the information on these proteins is scarce. These proteins have
received the generic name of Blue proteins and questions such as the type of metallic
cofactors included in their structure and function remain elusive.
The protein isolated from D. africanus appears to be a complex multimer of high
molecular weight (112 kDa) composed of 10 subunits (11.5 kDa) each one containing
labile sulphide, 5-6 molybdenum atoms and approximately 20 iron atoms. The UV-visible
spectrum shows peaks at around 615, 410 and 325 nm with a protein peak at 280 nm.
The millimolar extinction coefficients at 615, 410 and 280 nm are 48.4, 64.4 and 14,
respectively. The protein is composed by 106 amino acid residues per subunit and the N-
terminal sequence, which has been determined up to 26 residues, is characterized by its
degree of hydrophobicity. The protein isolated from D. salexigens has an approximate
molecular weight of 110 kDa and is composed by subunits of approximately 13.25 kDa.
Three molybdenum and 20 iron atoms are found associated with each subunit. This
protein shows an absorption spectrum similar to that observed for the Blue protein isolated
from D. africanus. Finally, the Blue protein isolated from D. gigas has a molecular weight of
approximately 162.5 kDa and is composed by 11-12 identical subunits of 14.75 kDa. Metals
analysis shows the presence of 3.8±0.1 Fe/monomer, 0.5±0.1 Mo/monomer, and
surprisingly, 0.6±0.1Cu/monomer. The UV-visible spectrum of as-prepared is similar to the
absorption spectra described above and the millimolar extinction coefficients were
calculated to be 15.1 and 7.8 mM-1cm-1 at 400 and 615 nm, respectively. The sequence of
102
this protein shows an 18.5% homology with a Zn resistance associated protein from D.
vulgaris Hildenborough.
The work carried out in this part deals with the characterization of two proteins
isolated from D. aminophilus and D. alaskensis, respectively, belonging to the Blue proteins
family. In addition to the molecular characterization, EXAFS studies of both proteins are
reported and discussed in comparison with studies performed the D. gigas enzyme. All
these results suggest that this family of proteins contains heteronuclear metallic clusters that
show no resemblance with other clusters with a well-known function present in biology.

103
III.2. MATERIALS AND METHODS
III.2.1 Growth media and culture conditions
D. aminophilus and D. alaskensis cells were grown at 37ºC under anaerobic
conditions using the lactate/sulphate and adapted Postgate C, respectively (Table III.2.1).
Table III.2.1 Growth media composition (per litre). Left column: D. aminophilus medium. Right column: D.
alaskensis medium.
[4]
III.2.2 Purification procedures
All the purification procedures carried out to isolate Blue protein from both
organisms were performed aerobically at 4ºC and pH 7.6. The purity of protein after each
step was followed by electronic absorption spectrum and 15% tricine SDS-PAGE [5, 6].
Lactate/sulphate mediumAdapted Postgate C medium (supplemented with
45 μM of Na2MoO4.2H20)
1.0 g NaCl 25.0 g NaCl
0.4 g CaCl2 . 2 H2O 0.04 g CaCl2.2H2O
2.0 g Yeast extract 1.0 g Yeast extract
6.0 ml Sodium lactate 60% (w/v) 4.615 ml Sodium lactate 60% (w/v)
2.8 g Na2SO4 4.5 g Na2SO4
1.0 g NH4Cl 1.0 g NH4Cl
0.5 g K2HPO4 0.5 g KH2PO4
0.06 g FeCl2 . 4 H2O 0.004 g FeSO4.7 H2O
0.4 g MgCl2 . 6 H2O 0.06 g MgSO4.7H2O
0.5 g KCl 0.3 g Sodium Citrate.2H2O
0.5 g Na2S
1.0 ml Widdel solution
The pH was adjusted to7.2 The pH was adjusted to 7.5.

III.2 Materials and Methods
104
In a typical preparation, 400 g (wet weight) of D. aminophilus cells were suspended
in 10 mM Tris-HCl buffer and passed through a Manton Gaulin press at 9000 psi. Then,
protease inhibitor cocktail (1 tablete/50 ml of Complete EDTA-free inhibitor from Roche)
and DNAse were added. A cell-free extract was obtained by centrifugation of the cellular
suspension at 16000 x g for 60 min, then the pellet was discarded and the supernatant
was ultra-centrifuged at 180000g for 30 min to remove any membrane contamination. A
clear supernatant containing soluble proteins (soluble extract) was dialyzed against 10 mM
Tris-HCl overnight and loaded onto a DEAE-52 column equilibrated with 10 mM Tris-HCl. A
linear Tris-HCl gradient (10-250 mM) was applied with a total volume of 2l. The fraction
containing Blue protein was collected at an ionic strength of 100-150 mM. This fraction
was then loaded onto a hydroxyapatite (HTP) column, equilibrated with 100 mM Tris-HCl
and Blue protein was eluted at 450 mM potassium phosphate buffer (1-500 mM
K2HPO4/KH2PO4 gradient). In the last step, the fraction was concentrated in a Diaflow
apparatus with YM10 membrane and loaded onto a Superdex 200 gel filtration column
equilibrated with 300 mM Tris-HCl. Pure Blue Protein was eluted with the same buffer a
flow rate of 2 ml/min in the second peak. A global purification scheme is shown in Figure
III.2.1.

III.2 Materials and Methods
105
Figure III.2.1 Purification scheme of Blue protein from Desulfovibrio aminophilus.
D. alaskensis cells were collected at the end of logarithmic phase by centrifugation
at 8000 × g during 15 min at 4 ºC (Beckman AvantiTM J-25 centrifuge). Periplasmic fraction
was obtained following protocol described by Brondino et al [7]. Briefly, pellet of cells was
resuspended in 10 mM Tris-HCl buffer (10ml buffer/g cell) containing deoxyribonuclease
Desulfovibrio aminophilus cells
Crude Extract
Soluble Extract
Cell disruption
+ DNAse + Protease inhibitorCentrifugation
Ultracentrifugation
Dialysis (overnight , against 10mM Tris HCl)
DEAE-52 (equilibrated with10 mM TrisHCl)Gradient: 10 mM – 250 mM
Blue protein (major contaminants: APS, ATPS and cytochromes)
(100 mM-150 mM TrisHCl)
HTP (equilibrated 100 mM TrisHCl)Gradient: 1mM – 500 mM KPB
Blue protein (major contaminants:
high molecular weight proteins)(450 mM KPB)
Superdex 200 (equilibrated 300 mM TrisHCl)
Pure Blue protein

III.2 Materials and Methods
106
and ribonuclease and incubated during 1 hour at 4ºC. All cell-free extract was obtained by
centrifugation of the cellular suspension at 5000 × g for 40 min. The supernatant
containing mostly periplasmic proteins was collected and dialyzed overnight against 10
mM Tris-HCl. Periplasmic fraction was loaded onto an anionic exchange column (DEAE 52
cellulose, Whatman 5×45 cm) equilibrated with 10 mM Tris-HCl. Blue protein fraction
containing mainly haemic contaminants was collected in the flowthrough. The next step
was performed on HTP column equilibrated with 10 mM Tris-HCl. Proteins were eluted
using a KH2PO4/K2HPO4 buffer gradient (5-500 mM); the fraction containing pure Blue
protein was collected at 150 mM ionic strength. Figure III.2.2 shows a general scheme of
the purification procedure described above.
Figure III.2.2 Purification scheme of Desulfovibrio alaskensis Blue protein.
Desulfovibrio alaskensis cells
Soluble Extract
+ 10 mM TrisHCl + DNAse + RNAse(1hour at 4ºC).
Centrifugation
Dialysis (overnight , against 10mM Tris HCl)
DEAE-52 (equilibrated with10 mM TrisHCl)
Blue protein (cytochromes as major contaminants)
(Flowthrough)
HTP (equilibrated 100 mM TrisHCl)Gradient: 1mM – 500 mM KPB
Pure Blue protein
III.2 Materials and Methods
107
III.2.3 Protein and Metal quantification
Quantification of metals and protein concentration were carried out as described in
section II.2.2.
Mo, Cu and Fe were quantified by inductively coupled plasma emission analysis in a
Jobin-Yvon (Ultima) instrument using the Reagecom 23 ICP multielements as standard
solution in a concentration range of 0.05 to 1.5 ppm.
The valence state of Cu ions was determined by a modified version of the Hanna et
al. method [8, 9] which is a simple colorimetric test to measure Cu(I) in proteins. Briefly,
samples or standard solutions (100 μl) were reduced by adding 300 μl of 20 mM sodium
ascorbate (in 0.1 M sodium phosphate, pH 6.0), and incubated for 10 min. Another sample
was prepared without addition of reductant. Then, 600 μl of a 2,2’ – biquinoline solution
(0.5 mg/ml), prepared in glacial acetic acid, was added, and the solution was incubated for
10 min prior to measure absorbance at 546 nm. The calibration curve was prepared with
copper (II) acetate (0 to 48 μM Cu (II) acetate).
III.2.4 Molecular mass determination and subunit composition
The molecular mass of the as-prepared Blue protein and the subunit composition
were determined as described in section II.2.3.
Molecular weight of Blue protein subunits was determined using a matrix-assisted
laser desorption/ionization time-of-flight (MALDI-TOF) mass spectrometer. A volume of 10
μl of salt free sample (approximately 10 pmol of protein) was mixed with 10 μl of matrix
solution (10 mg of α-CHCA dissolved in 1 ml of H2O/acetonitrile/TFA). Then, 1μl of sample
was spotted on the 100 well MALDI-TOF-MS sample plate and dried on air.
The molecular weight was then analyzed by MALDI-TOF mass spectrometer (Applied
Byosystems, Foster City, USA) model voyager DE-PRO biospectrometry workstation,
equipped with a nitrogen laser radiating at 337 nm. MALDI mass spectra were acquired as
recommended by the manufacturer. Measurements were taken in reflector positive ion
mode, with a 20 kV accelerating voltage. Three close external calibrations were performed

III.2 Materials and Methods
108
with the monoisotopic peaks of 16952, and 12361 m/z corresponding to apomyoglobin,
and cytochrome C respectively. Mass spectral analysis for each sample was based on the
average of 300 laser shots.
Mass spectrometry acquisition and data analysis were performed in collaboration
with Prof. JJ Calvete (IBV, Valencia, Spain) and Prof. JL Capelo-Martinez (FCT-UNL, Caparica,
Portugal).
III.2.5 Quantification of labile sulphide
Labile sulphide was determined according to the modified method of Fogo [10].
Briefly, 600 μl of 1% zinc acetate and 50 μl of 7% sodium hydroxide were added to 50 μl of
sample and incubated during 2.5 hours at room temperature. After centrifugation, 150 μl
of 0.1% N,N-dimethylenephenylenediamine hydrochloride in 5M of HCl and 150 μl of 10
mM ferric chloride in 1M of HCl were added to each tube and vigorously vortexing. Finally,
the samples were incubated during 1 hour and the absorbance was determined at 670
nm. The tubes were stoppered and open only for the time necessary for each addition of
reagents.
III.2.6 Determination of N-terminal and internal amino acid sequences
N-terminal sequence from both proteins was determined by automated Edman
degradation in an Applied Biosystem model 477A protein sequencer coupled to an
Applied Biosystem 120 analyzer following the manufacturer’s instructions. A total of
approximately 1 nmol of Blue protein was used.
Proteolytic digestion of Blue protein from D. aminophilus was performed during 16
hours at 37 ºC. Degradation with endoproteinase Lys-C was carried out at an enzyme to
substrate ratio 1:50 in 25 mM Tris-HCl buffer pH 8.5 and 1 mM EDTA. Cleavage with Asp-N
was performed at an enzyme to substrate ratio 1:75 in 25 mM Tris-HCl buffer pH 8.5. For
cleavage of Met-Xaa bonds, a small crystal of CNBr was dissolved in a protein solution (25
mg/ml in 70% formic acid) and the mixture was incubated 8 hours at room temperature.

III.2 Materials and Methods
109
Peptides were separated using a reverse-phase HPLC on Lichrosorber RP-18 (Merck)
column (25 x 0.4 cm, C18, 5 mm particle size) and eluted at 1 ml/min with a linear gradient
of 0.1% (v/v) trifluoroacetic acid in water (solution A) and acetonitrile (solution B) (0% A-
70% B during 2 hours). Detection was performed at 220 nm. Peaks were collected
manually and dried in a Speed-Vac (Savant, Holbrook NY, USA). The D. aminophilus
subunits were separated as described in section II.2.8 and using a reverse-phase HPLC
column. Peptides and isolated subunits were sequenced as described above. To perform in-
gel enzymatic digestion Blue protein was loaded in 15% SDS gel and the protein bands
was excised and digested with chymotrypsin using a ProGest digestor (Genomic Solutions,
Chelmsford, MA, USA) following the manufacture’s instructions. The peptide mixture was
dried and a SpeedVac (Savant, Holbrook, NY, USA). Digests were analyzed using an
Applied Biosystems Voyager-DE Pro MALDI-TOF mass spectrometer.
Studies on D. aminophilus Blue protein were performed at the Laboratory of Prof. JJ
Calvete (IBV, Valencia, Spain). Sequencing of N-terminal of the D. alaskensis Blue protein
was carried out in collaboration with Prof. J Lampreia (FCT-UNL, Caparica, Portugal).
III.2.7 DNA sequencing strategies
III.2.7.1 Desulfovibrio aminophilus Blue Protein DNA sequencing
Two different strategies were used to amplify the DNA sequence coding Blue
protein: multiplex and inverse PCR.
Multiplex PCR [11, 12] uses a combination of several different pairs of primers in the
same amplification reaction. Primer sequences and annealing temperatures are described
in Table III.2.2. The DNA used as template (100ng and 200ng) was purified using the
phenol-chloroform extraction protocol [13].
Inverse PCR [14] was used for amplification of DNA sequences that flank the region
of the known sequence. Genomic DNA (1 μg) was digested by the endonuclease Eco130I
from Fermentas (40 units of enzyme, during 2 hours at 37ºC) using the buffer supplied by

III.2 Materials and Methods
110
the restriction enzyme in a final volume of 50 μl. The endonuclease was inactivated by 20
min incubation at 65ºC. Then, fragments were circularized using T4 DNA ligase in final
volume of 500 μl (2.5 units of T4 DNA ligase from Invitrogen, 2 hours at room
temperature). Under low DNA concentration, self-ligation is induced giving a circular DNA
product. After ligation reaction, DNA was purified by precipitation using 70% of ethanol
and centrifuged during 10 min at 14000 rpm. The DNA was resuspended and digested by
an endonuclease known to cut once within the known internal sequence (10 units of CaiI
from Fermentas, in a final volume of 10 μl, during 2 hours at 37ºC). This gave a linear
product with known terminal sequences, suitable for PCR. The primers used in the
amplification reaction were designed pointing away from the recognition site of the
second restriction enzyme. Primers sequences and annealing temperatures are described in
Table III.2.2.
Amplification reactions were loaded using the PCR mixture and programmes
described in first strategy described at section II.2.7.2.
The DNA fragments were isolated, cloned, sequenced, and analyzed following the
procedures described in II.2.7.2, II.2.7.3 and II.2.7.4.

III.2 Materials and Methods
111
Table III.2.2 Primers used in Desulfovibrio aminophilus Blue protein sequencing
III.2.7.2 Desulfovibrio alaskensis Blue Protein DNA sequencing
Since the N-terminal D. alaskensis Blue protein showed to be highly homologous to
the Zinc Resistance-associated Protein from D. desulfuricans G20, two primers were
designed from known proteins sequence upstream (PAS) and downstream
(Ribonucleotido Reductase, large subunit) to the homologous protein (Table III.2.3). Direct
PCR of boiled cell, amplification reactions, PCR mixture and programmes were performed as
described section II.2.7.2 (first strategy). The amplified DNA fragments were isolated, cloned,
sequenced, and analyzed following the procedures described in sections II.2.7.2, II.2.7.3
and II.2.7.4.
Primer Name Orientation Sequence Tm (º C) MethodProduct
fragment size (bp)
G P G P/H G Mggy ccb ggy cmb ggy atg
L F D Q G E Acts ttc gay cag ggy gar gc
E H R K A Vag cac cgc aag gcc gt
A E L D A Vg gcb gar cts gay gcb gt
G H G Y G H Gggy cay ggy tay ggy cay gg
G P G G G Mggy ccb ggy ggy ggy atg
V E R Q Q S P D L Ngtt gag cgt cag cag agc ccg gac ctg aa
D K L F A E H Kac aag ctc ttc gcc gag cac cgca
multiplex PCR
25556
218
54multiplex
PCR300
68 iPCR
NTer2
Ctp14
LysTrp
LysC2
CNBr21
CNBr25
AB1d1
AB1u1
Reverse
Reverse
Forward
Reverse
Forward
Reverse
Reverse
Forward

III.2 Materials and Methods
112
Table III.2.3 Primers used in the sequencing of Desulfovibrio alaskensis Blue protein.
III.2.8 EXAFS data collection and analysis
EXAFS measurements were conducted at the Stanford Synchrotron Radiation
Laboratory in collaboration with Prof. Graham N. George (University of Saskatchewan,
Canada)
Samples analyzed were in a concentration of approximately 1 mM Cu, Mo or Fe.
During data collection, the samples were maintained at a temperature of approximately 10
K using an Oxford instruments liquid helium flow cryostat.
Primer Name Orientation Sequence (5'-3') Tm (º C)Product fragment size
(bp)
DalaF1blue Forward CCTTACGGACACGGATACG
DalaR1blue Reverse CACCCATATGGTAGCCG
Ddg20f2pas Forward CGATATTGCTTCATGTGCGTGTATGG
Ddg20Rrr Reverse CGATGTCATCAGGTCGTAAAATTCACG
55 400
66 1000
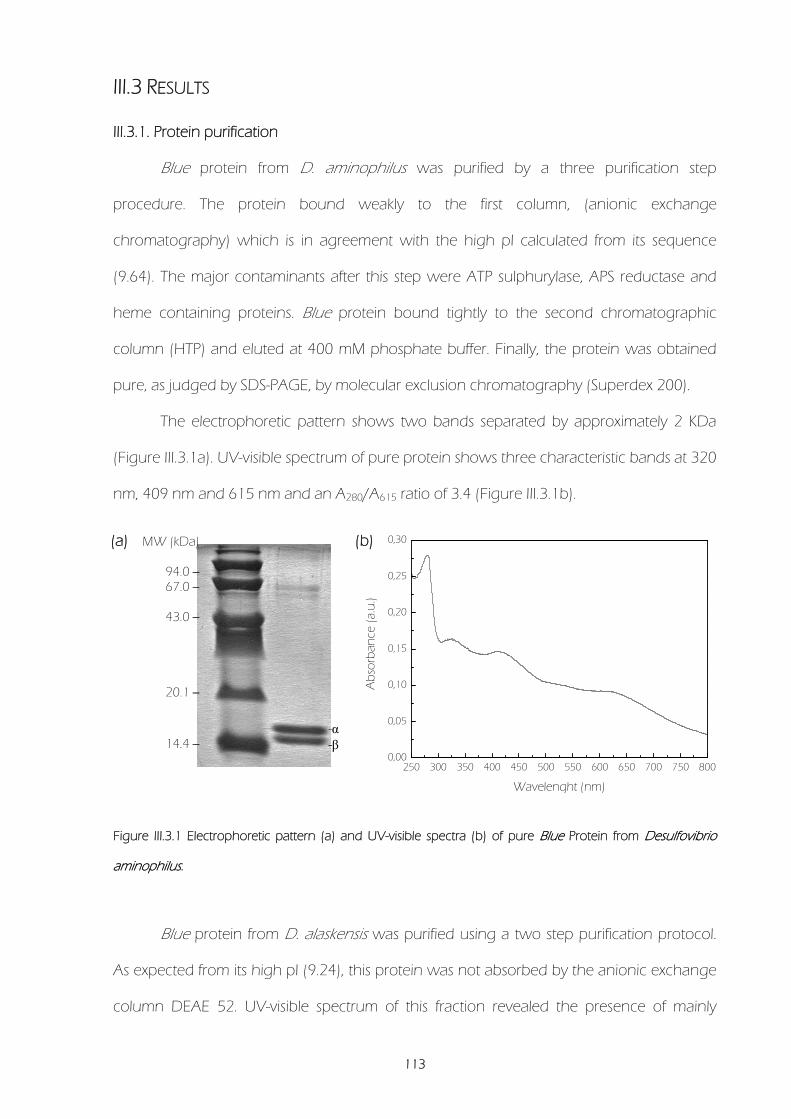
113
III.3 RESULTS
III.3.1. Protein purification
Blue protein from D. aminophilus was purified by a three purification step
procedure. The protein bound weakly to the first column, (anionic exchange
chromatography) which is in agreement with the high pI calculated from its sequence
(9.64). The major contaminants after this step were ATP sulphurylase, APS reductase and
heme containing proteins. Blue protein bound tightly to the second chromatographic
column (HTP) and eluted at 400 mM phosphate buffer. Finally, the protein was obtained
pure, as judged by SDS-PAGE, by molecular exclusion chromatography (Superdex 200).
The electrophoretic pattern shows two bands separated by approximately 2 KDa
(Figure III.3.1a). UV-visible spectrum of pure protein shows three characteristic bands at 320
nm, 409 nm and 615 nm and an A280/A615 ratio of 3.4 (Figure III.3.1b).
Figure III.3.1 Electrophoretic pattern (a) and UV-visible spectra (b) of pure Blue Protein from Desulfovibrio
aminophilus.
Blue protein from D. alaskensis was purified using a two step purification protocol.
As expected from its high pI (9.24), this protein was not absorbed by the anionic exchange
column DEAE 52. UV-visible spectrum of this fraction revealed the presence of mainly
(a) (b)
250 300 350 400 450 500 550 600 650 700 750 8000,00
0,05
0,10
0,15
0,20
0,25
0,30
Ab
sorb
ance
(a.u
.)
Wavelenght (nm)
MW (kDa)
94.0 -- 67.0 --
43.0 --
20.1 --
14.4 -- -α -β

III.3 Results
114
proteins containing hemes which were isolated by a HTP column. As judge by SDS-PAGE,
the protein was in a high purity grade after this step (Figure III.3.2a). The as-prepared
protein from D. alaskensis shows three characteristic peaks at 320 nm, 409 nm and 570
nm. The peak observed at 409 nm is increased by a cytochromic contaminant. The
A280/A570 ratio for the pure protein was 3.5 (Figure III.3.2b).
Figure III.3.2 Electrophoretic pattern (a) and UV-visible spectra (b) of pure Blue Protein from Desulfovibrio
alaskensis.
III.3.2. Determination of molar extinction coefficients
The extinction coefficients calculated for the Blue proteins from D. aminophilus and
D. alaskensis in Tris-HCl 50 mM pH 7.6 are listed in Table III.3.1.
Table III.3.1 Extinction coefficients for Blue Proteins from Desulfovibrio aminophilus and Desulfovibrio
alaskensis. Values in M-1 cm-1
ε275 ε320 ε615 ε570
D.alaskensis 18730 12812 4999
D.aminophilus 21538 10607 6720
(a) (b)
250 300 350 400 450 500 550 600 650 700 750 8000,0
0,1
0,2
0,3
0,4
0,5
0,6
0,7
0,8
A
bso
rban
ce (A
.U.)
Wavelength (nm)
MW (kDa)
--94.0 --67.0
--43.0
--30.0
--20.1
--14.4

III.3 Results
115
III.3.3 Molecular weight determination
In order to determine the D. aminophilus Blue protein molecular weight, a first
approach was performed by using SDS-PAGE. The calculated values for the two bands
observed (13.7±1.2 and 15.5±1.2 kDa, Figure III.3.1a) are in agreement with those
obtained by mass spectrometry (13.5 and 15.4 kDa, Figure III.3.3). A single elution peak of
approximately 200 kDa was found by gel-exclusion chromatography on Superdex 200
indicating that Blue Protein is a multimer of 14-16 subunits.
Figure III.3.3 Mass spectra of Blue Protein from Desulfovibrio aminophilus.
The molecular weight of D. alaskensis Blue protein determined by mass
spectrometry (MALDI-TOF) analysis was 15.30 kDa (Figure III.3.4). In agreement with this
result, the molecular weight of the protein determined by SDS-PAGE was 15.4±1.3 kDa
(Figure III.3.2a).

III.3 Results
116
A peak of approximately 260.2 kDa was found by gel-exclusion chromatography
on a Superdex 200 column. Therefore, it is likely that the as-prepared protein is a multimer
of approximately 16 identical subunits.
Figure III.3.4 MALDI spectra of Desulfovibrio alaskensis Blue Protein. Peaks at 16.95 and 12.36 kDa correspond
to apomyoglobin and cytochrome c used for internal calibration.
III.3.4 Metal quantification
Table III.3.2 shows the metal content per monomer of Blue Protein from D.
aminophilus and D. alaskensis. Values determined for D.gigas protein are including for
comparison. Different preparations of D. aminophilus Blue protein yielded zero or very low
Mo concentration.
Table III.3.2 Metal ions per monomer for Desulfovibrio aminophilus, Desulfovibrio alaskensis, and Desulfovibrio
gigas Blue Proteins.
Fe Cu Mo
D.aminophilus 1.3(6) 0.5(2)
D.alaskensis 1.3 1.3
D.gigas 1.0 0.6 0.35

III.3 Results
117
Determination of copper oxidation state by the modified Hanna, et al. method [8, 9]
on the as-prepared sample, indicates that Cu is present as Cu1+ ions.
III.3.5 Labile sulphide quantification
Quantification of labile sulphide of Blue protein from D. aminophilus yielded 4.5±1.3
sulphur atoms per protein molecule, whereas that of the Blue protein from D. alaskensis
varied from 4 to 8 sulphur atoms per protein molecule in the different determinations..
III.3.6 Protein and gene sequence
III.3.6.1 Desulfovibrio aminophilus Blue Protein
Figure III.3.5 shows a DNA fragment from the D. aminophilus genome containing
the ORF coding for Blue Protein. A potential RBS was identified at -14 bp from ATG initiator
codon (upperlined and light grey sequences in Figure III.3.5, respectively).
The deduced amino acid sequence matches with the peptides chemically
sequenced from the pure Blue protein (arrows in Figure III.3.5 and Table III.3.3). The
analysis of the amino acid sequence indicates high probability of a signal peptide cleavage
site between amino acids 29 and 30 (▼, Figure III.3.5), which suggests that this protein is
located on the periplasmic side of the cytoplasmic membrane. The N-terminal of the
mature protein was in good agreement with the one chemically sequenced (data not
shown).

III.3 Results
118
Figure III.3.5 DNA and deduced amino acid sequence from Desulfovibrio aminophilus Blue Protein.
Upperlined sequence: potential Ribosomal Binding Site (RBS), light grey sequence: ATG initiator codon, ▼:
signal peptide cleavage site, arrows: peptides sequenced from Blue Protein. Amino acid sequence of peptide
10 was included at C-termini.
RBS 1 -AAGGAGGATTTCACGATGAAGACCGCCACCCGTTCCGCCTGGTACGTGGGTTTGGCCCTG-60 1 -K E D F T M K T A T R S A W Y V G L A L -20 61 -AGCATGGTGCTCGGCCTGGCCGCCGCTTCCTACGCCCTCGGAGGCCCGGGTCCCGGTATG-120 21 -S M V L G L A A A S Y A L G ▼G P G P G M -40 121-TACGGAAGAGGCCCCGGCTACGGCATGATGGACCAGTACACACAGCTCACCCCCGAGAAG-180 41 -Y G R G P G Y G M M D Q Y T Q L T P E K -60 1 2 181-CGAGCCGCCGTGGACAAGCTCTTCGCCGAGCACCGCAAGGCCGTGCAGCCCCTGCGCGAC-240 61 -R A A V D K L F A E H R K A V Q P L R D -80 4 3 241-GAACTCTTCGTCAAGCAGGCCGAGCTGGACGCCGTTGAGCGTCAGCAGAGCCCGGACCTG-300 81 -E L F V K Q A E L D A V E R Q Q S P D L -100 4 5 6 301-AACGCCGTGCGCACCCTGGCCAAGGACATCACCACCCTGCGCGGCAAGCTCTTCGACCAG-360 102-N A V R T L A K D I T T L R G K L F D Q -120 5 7 8 361-GGCGAGGCCTTCCGGGCCAAGGTCGAGAAGGAGACCGGCATCGAGATGGGCCCCGGCCGC-420 121-G E A F R A K V E K E T G I E M G P G R -140 8 421-GGCTACGGCATGGGTTACGGTCGCGGCTCCGGCATGGGCTACGGCCACGGCTACGGCCAC-480 141-G Y G M G Y G R G S G M G Y G H G Y G H -160 9 481-GGTTACGGCATGGGTCCCGGCGGCGGCAT-509 160-G Y G M G P G G G X –169
9 G P G G P G R G P G G G M 10

III.3 Results
119
Table III.3.3 Amino acid sequence of peptides obtained from Desulfovibrio aminophilus Blue Protein.
Numbers in the first column correspond to peptide sequences indicated in Figure III.3.5. Amino acid
sequences aligned on the right column correspond to peptide sequence (upper) and amino acid deduced
sequence from DNA (lower).
Although two peaks and two bands were observed by mass spectrometry (Figure
III.3.3) and SDS-PAGE (Figure III.3.1), respectively, the N-terminal amino acid sequencing of
the as-prepared protein seems to be the same sequence with some ambiguities.
Interestingly, the molecular weight calculated for the first 122 amino acids of the mature
protein (13.36 kDa) is in very good agreement with one of the two peaks observed by
mass spectrometry (13.35 kDa, Figure III.3.3). Furthermore, the molecular weight calculated
for the 142 amino acids, taking into account peptide 10, is in good agreement with the
high molecular weight peak observed by mass spectrometry (Figure III.3.3). Consequently,

III.3 Results
120
the two subunits observed could derive from the same gene by alternative splicing and
differ only at their C termini.
To evaluate this hypothesis, the subunits were separated by reverse-phase
chromatography and SDS-PAGE, and chemically sequenced. Figure III.3.6 shows the
multiple sequence alignment of the N-terminal region of the samples obtained as described
above and the one deduced from the DNA sequence. Owing to the ambiguity observed
in many residues, the results obtained are not conclusive and more studies should be
carried out to confirm the proposal.
Figure III.3.6 Multiple sequence alignment of isolated N-Terminal subunits with DNA deduced amino acid
sequence. DNAdeduced: amino acid sequence deduced from the nucleotide sequence, RPalpha/beta: N-
Terminal sequenced from alpha/beta subunit isolated by phase reverse chromatography, PAGEalpha/beta:
N-Terminal sequenced from alpha/beta subunit isolated by SDS-PAGE.
III.3.6.2 Desulfovibrio alaskensis Blue Protein
The N-Terminal of the pure Blue protein from D. alaskensis was chemically
sequenced. The amino acid sequence obtained was submitted to BLAST at the NCBI web
site, and a significant identity (94%) was found with a Zinc resistance-associated protein
from D. desulfuricans G20 (Figure III.3.7). Furthermore, known protein sequences from D.
alaskensis were also aligned with their homologous proteins from D. desulfuricans G20
and high percentage of similarity was found (99.9% 16s rDNA, 94% cytochrome c3 N-
terminal, and 99% cytochrome c553 N-terminal identity). Owing this fact, the DNA fragment
containing the ORF coding the D. alaskensis Blue protein was amplified with primers

III.3 Results
121
designed from D. desulfuricans G20 DNA sequence. The PCR product obtained is shown
in Figure III.3.8.
Figure III.3.7 Alignment of N-Terminal sequences of Blue Protein from Desulfovibrio alaskensis (PP) and Zinc
resistance-associated protein from Desulfovibrio desulfuricans G20 (Dd)
Figure III.3.8 DNA sequence containing the ORF for Blue Protein. Underlined sequence: potential Ribosomal
Binding Site (RBS), light grey sequence: ATG initiator codon of D. alaskensis Blue protein, ▼: signal peptide
cleavage site, M and * (at positions 34 and 226, respectively): ORF of D. alaskensis Blue protein, V and * (at
positions 256 and 294, respectively): ORF of hypothetical protein, M (at position 312): start codon of
Ribunucleotido Reductase large subunit.
1 - CGATATTGCTTCATGTGCGTGTATGGCACGCCTGTTGCTCTATCATGAGCAAATGCAAGC - 60 1 - R Y C F M C V Y G T P V A L S * A N A S - 20 61 - AACGCACCAGAAGGTGCACAAGGTAATCCGGAGGACATTATGAAGACCCGTTCCATTATC - 120 21 - N A P E G A Q G N P E D I M K T R S I I - 40 121 - ACCATAGTAGCAGCCCTCGGTATTTTTGCTCTGGCAGCAGTGGCTTTTGCCGGTCCTTAC - 180 41 - T I V A A L G I F A L A A V A F A G P Y - 60 181 - GGACACGGATACGGCCATCGCGGCGGATACGGTGGCATGGGCTCCGGCGGCGGGGCGGTC - 240 61 - G H G Y G H R G G Y G G M G S G G G A V - 80 241 - GTGTGCCCCTTTGGCGGCAGCGGACCCGGCGGTCAGGCCGCATATGATTCGCTGACACCC - 300 100 - V C P F G G S G P G G Q A A Y D S L T P - 120 301 - GACAAGCAGGCTCTGTATGACAAGATTGTGGCCGAAGCCGACGGCAAGATGACCCCCCTG - 360 121 - D K Q A L Y D K I V A E A D G K M T P L - 140 361 - CGCGACAAGCTGTTTGCCAAGCAGGCAGAATTGAATGCCATGTACAACAATCCGGCCACA - 420 141 - R D K L F A K Q A E L N A M Y N N P A T - 160 421 - GACCCCGCGGCAGTGGGCAAGACTGCCGGTGAAGTGGCCCAGCTGCGCACTCAGCTGCGC - 480 161 - D P A A V G K T A G E V A Q L R T Q L R - 180 481 - AACCTGCACATTGAACTTTCCCAGCGCCTTGAAAAGGAAGTGGGGCTCAAGTCCGGCTTC - 540 181 - N L H I E L S Q R L E K E V G L K S G F - 200 541 - GGACGCGGTCACCGCGGCGGGTTTCATCGGGGCGGCGGCTACCATATGGGTGGCGGCATG - 600 201 - G R G H R G G F H R G G G Y H M G G G M - 220 601 - ATGGGCGGACACTACTAAACAGCACAACGGCGCTGCTTCCTTCACAGCGGCAGCCGCGGC - 660 221 - M G G H Y * T A Q R R C F L H S G S R G - 240

III.3 Results
122
661 - ATACTGCGGGTACAGACCGGCCGGAGCAATTCCGGCCGGTTTTTTTGTGCGCGGTCAGCG - 720 241 - I L R V Q T G R S N S G R F F C A R S A - 260 V R G Q R 721 - GTGTGCCGCGGCGGCAGTGTACGGACACGCACCGTGTCAACAACTGCAGATTGTGATGCG - 780 261 - V C R G G S V R T R T V S T T A D C D A - 280 - C A A A A V Y G H A P C Q Q L Q I V M R 781 - GCAGTGGCTTTTTCCGGCAGGGCATGCTAAGCTCCGTAGCAGGTAGTAAAAGTTGAGAAA - 840 281 - A V A F S G R A C * A P * Q V V K V E K - 300 - Q W L F P A G H A K L R S R * 841 - AACTATAACCAATTGATTTGATACGTTAAAGGGATGACATGAAACAGCCGGAAGACTTGC - 900 301 - N Y N Q L I * Y V K G M T * N S R K T C - 320 M K Q P E D L Q 901 - AGCCCGTTGTGCTCAACCAGAATGCAGAGGTCGTGCTTTCGAAGCGTTATTACCGCAAAG - 960 321 - S P L C S T R M Q R S C F R S V I T A K - 340 - P V V L N Q N A E V V L S K R Y Y R K G 961 - GCCCTGACGGAGAACCGCTGGAAGATGCCACGGGGCTTTTCTGGCGTGTGGCGTCTGCCA -1020 341 - A L T E N R W K M P R G F S G V W R L P - 360 - P D G E P L E D A T G L F W R V A S A I 1021 - TCGCGGCGGAGGAGGGTAAATACCCTGATTCGTCGTGCAGGGCGGACGAACTGGCCCGTG -1080 361 - S R R R R V N T L I R R A G R T N W P V - 380 - A A E E G K Y P D S S C R A D E L A R E 1081 - AATTTTACGACCTGATGACATC - 1102 381 - N F T T * * H X - 388 - F Y D L M T X
A potential ribosomal binding site was identified 10 bases upstream from the ATG
start codon (underlined and grey highlighted sequences in Figure III.3.8, respectively). The
ORF corresponding to the Blue Protein codify for a 171 amino acids proteins with a
calculated molecular weight of 17.65 kDa. Analysis of amino acids sequence shows a high
probability of a signal peptide cleavage site between amino acids 24 and 25 which
suggests that, as the homologous protein isolated from D. aminophilus, this is a periplasmic
protein. The N-Terminal sequence and the molecular weight calculated for mature protein
(15.22 kDa) are in good agreement with the chemically sequenced N-Terminal and the
mass spectrometry results obtained the mature protein, respectively.

III.3 Results
123
III.3.7 EPR spectroscopy
D. aminophilus Blue protein is EPR silent in the as-prepared form and upon
dithionite or ferricyanide addition. In contrast, the as prepared protein from D. alaskensis
shows an isotropic signal with a g-value of 2.012 (Figure III.3.9), which is similar to the one
observed in D. gigas Blue Protein [3]. Reduction of this sample by sodium dithionite does
not significantly change either the intensity or the line-shape of the signal.
Figure III.3.9 X-Band EPR spectroscopy on as prepared Blue Protein from Desulfovibrio alaskensis g=2.012,
A=19 G, Frequency: 9.65 GHz, Microwave power: 2 mW, Modulation amplitude: 1 Gpp, Temperature: 100 K.
III.3.8 X-ray Absorption Spectroscopy of Mo, Cu and Fe site of Blue proteins
III.3.8.1 Desulfovibrio aminophilus and Desulfovibrio gigas Blue protein
III.3.8.1.1 Fe K-Near edge and K-edge EXAFS
Figure III.3.10 compares the Fe K-edge near edge spectra of the D. aminophilus (a)
and D. gigas Blue protein (b) with coordination models (c and d). The results indicate that
the Fe is mostly in the form of iron-sulphur sites, with significant presence of [Fe(OH)6]2+ or
related species for de D. gigas protein. According with these results, the Fe EXAFS spectra
(Figure III.3.11) are also suggestive of a Fe-S cluster for the Blue protein from both
2,08 2,04 2 1,96 1,92
3300 3350 3400 3450 3500 3550 3600
g-values
Magnetic Field [G]

III.3 Results
124
organisms. Nevertheless, the coordination around the Fe ion in the D. aminophilus Blue
protein seems to be different from the one of D. gigas Blue protein.
Figure III.3.10 Iron K-edge near edge spectra of as- prepared Blue Proteins. (a) Da, (b) D. gigas Blue protein,
(c) FeIIO6, and (d) FeIII(SR)4.
a
b
c
d
7100 7110 7120 7130 7140 7150 7160 7170
2.0
1.5
1.0
0.5
0
No
rmal
ized
Abs
orb
ance
Energy (eV)
a
b
c
d
7100 7110 7120 7130 7140 7150 7160 7170
2.0
1.5
1.0
0.5
0
No
rmal
ized
Abs
orb
ance
Energy (eV)
a
b
c
d
7100 7110 7120 7130 7140 7150 7160 7170
2.0
1.5
1.0
0.5
0
No
rmal
ized
Abs
orb
ance
Energy (eV)
a
b
c
d
7100 7110 7120 7130 7140 7150 7160 7170
2.0
1.5
1.0
0.5
0
No
rmal
ized
Abs
orb
ance
Energy (eV)
a
b
c
d
7100 7110 7120 7130 7140 7150 7160 7170
2.0
1.5
1.0
0.5
0
No
rmal
ized
Abs
orb
ance
Energy (eV)
a
b
c
d
7100 7110 7120 7130 7140 7150 7160 7170
2.0
1.5
1.0
0.5
0
No
rmal
ized
Abs
orb
ance
Energy (eV)

III.3 Results
125
Figure III.3.11 Fe EXAFS Fourier transforms of as-prepared Blue proteins. Upper panel: D. aminophilus Blue
protein, Lower panel: D. gigas Blue protein. The solid line indicates experimental data and broken lines show
best fits.
III.3.8.1.2 Cu K-Near edge and K-edge EXAFS
The Cu K-edge near edge spectra is shown in Figure III.3.12. The spectra from both
organisms suggest a cuprous site with four-coordination to thiolate type donors.
Figure III.3.13 shows the Cu EXAFS Fourier transforms for D. gigas Blue protein
(upper panel) and D. aminophilus Blue protein (lower panel), together with the best fits
from the curve-fitting analysis (broken lines). These results also indicate sulphur
coordination and for the D. gigas protein (Figure III.3.13, lower panel) suggest an outer
shell which might be Mo possibly similar to that found in the Orange protein from D. gigas
[15, 16] but, again, different to that of the D. aminophilus Blue protein.
Fe-SFe-Cu or Fe-Mo
0 1 2 3 4 5 6 7 8
R+Δ(Å )
3
2
1
0
Tran
sfor
m M
agn
itude
Fe-SFe-Cu or Fe-Mo
0 1 2 3 4 5 6 7 8
R+Δ(Å )
3
2
1
0
Tran
sfor
m M
agn
itude

III.3 Results
126
Figure III.3.12 Copper K-edge near edge spectra of as-prepared Blue Protein. (a) D. aminophilus, (b) D. gigas
Blue protein, (c) CuI(SR)2, (d) CuI(SR)3, and (e) CuI(SR)4.
Figure III.3.13 Cu Fe EXAFS Fourier transforms of as prepared Blue proteins. Upper panel: D. aminophilus
Blue protein, Lower panel: D. gigas Blue protein. The solid line indicates experimental data and broken lines
show best fits.
a
b
c
e
8960 8970 8980 8990 9000 9010 9020 9030
2.5
2.0
1.5
1.0
0.5
0
Nor
mal
ized
Abs
orba
nce
Energy (eV)
d
a
b
c
e
8960 8970 8980 8990 9000 9010 9020 9030
2.5
2.0
1.5
1.0
0.5
0
Nor
mal
ized
Abs
orba
nce
Energy (eV)
d
Cu-S
Cu-Mo
0 1 2 3 4 5 6 7 8
R+∆(Å )
2.5
2.0
1.5
1.0
0.5
0
Tran
sfor
m M
agn
itude
Cu-S
Cu-Mo
0 1 2 3 4 5 6 7 8
R+∆(Å )
2.5
2.0
1.5
1.0
0.5
0
Tran
sfor
m M
agn
itude

III.3 Results
127
III.3.8.1.3 Mo K-Near edge and K-edge EXAFS
Figure III.3.14 shows Mo K-edge near edge spectra of D. gigas and D. aminophilus
Blue proteins. According with the very low concentration of Mo detected in D. aminophilus
Blue protein, Mo-edge near edge spectrum (a) is very noisy when compared with Dg Blue
protein spectrum (b). Similar to that observed for iron, the results suggest a molybdenum
site with four-coordinated thiolate type donors.
Figure III.3.15 shows Mo EXAFS Fourier transforms of D. aminophilus (broken line)
and D. gigas (solid line) Blue proteins. The double peak in the spectra clearly indicates a
multinuclear cluster, with the first peak being mostly due to Mo-S bond and the second
one to either Mo-Cu or Mo-Fe bonds.
Figure III.3.14 Molybdenum K-edge near edge spectra of as-prepared Blue proteins. (a) Da, (b) D. gigas Blue
protein, (c) [MoO4]2-, and (d) [MoS4]
2-.
a
b
c
19980 20000 20020 20040 20060 20080
2.0
1.5
1.0
0.5
0
Nor
mal
ized
Abs
orba
nce
Energy (eV)
d
a
b
c
19980 20000 20020 20040 20060 20080
2.0
1.5
1.0
0.5
0
Nor
mal
ized
Abs
orba
nce
Energy (eV)
d

III.3 Results
128
Figure III.3.15 Mo EXAFS Fourier transforms of as-prepared Blue proteins. Broken line: D. aminophilus Blue
protein, and solid line: D. gigas Blue protein.
III.3.8.2 D alaskensis Blue protein
III.3.8.2.1 Mo and Fe K- near edge spectra
Figure III.3.16 shows the Mo K-edge of the D. alaskensis Blue protein spectrum
together with the ones of Mo-Fe-S clusters, molybdate in aqueous solution, and
(NH4)2MoS4. The comparison of these spectra suggests that D. alaskensis Blue protein
contains a FeMo cluster. Furthermore, the shoulder at approximately 2008 eV could
indicate the presence of Mo=O ligation.
The Fe K-edge spectrum of the D. alaskensis Blue protein together with Mo-Fe-S and
Fe-S clusters are shown in Figure III.3.17. The comparison of the shape of these spectra
suggests that coordination around the Fe ion is more similar to that of the 2Fe-2S clusters
than that of the Fe-Mo clusters.
Mo-Cu or Mo-Fe
Mo-S
0 1 2 3 4 5 6 7
1.8
1.6
1.4
1.2
1
0.8
0.6
0.4
0.2
0
R+∆(Å )
Tran
sfor
m M
agn
itude
Mo-Cu or Mo-Fe
Mo-S
0 1 2 3 4 5 6 7
1.8
1.6
1.4
1.2
1
0.8
0.6
0.4
0.2
0
R+∆(Å )
Tran
sfor
m M
agn
itude

III.3 Results
129
Figure III.3.16 Comparison of the Mo K near-edge spectrum of Blue protein from D. alaskensis (black lines)
with molybdenum-iron-sulfur clusters, molybdate in aqueous solution and (NH4)2MoS4 (red lines).

III.3 Results
130
Figure III.3.17 Comparison of the Fe K-near-edge spectrum of Blue protein from D. alaskensis (black lines) with
molybdenum-iron-sulphur and iron-sulphur clusters (red lines).
III.3.8.2.2 Fe and Mo K-edge EXAFS
Figure III.3.18 shows the Mo K-edge k3-weighted EXAFS spectra (top panel) and the
Fourier transforms (lower panel) of Blue protein from D. alaskensis. The best fit (dashed
lines) of the experimental data (solid lines) comes from the analysis of several different
coordination models of the Mo site (Table III.3.4). The following interactions were identified:
Mo=O bond at 1.68 Å, Mo-O bond at 2.02 Å, a short Mo-S bond at 2.19 Å, a long Mo-S
bond at 2.35 Å and a Mo-Fe bond at 2.71 Å. The slightly increased Debye-Waller factor of
the single Mo=O contribution (σ2=0.0032 Å2) together with highly elevated Debye-Waller

III.3 Results
131
factor of the single Mo-O contribution (σ2=0.013 Å2) suggested the occupancy of both
ligands to be lower than one. This could be explained by partial reduction of the Fe-Mo
cluster in the analyzed protein, i.e. conversion of the double-bonded oxo group to a
hydroxyl ligand. It was tested it and obtained significantly better fit with 60% occupancy for
the Mo=O group and 40% for the Mo-O ligand. Therefore, the final structural model of the
Mo site in Blue protein consists of 0.6 O at 1.68 Å, 0.4 O at 2.02 Å, 1 S at 2.19 Å, 2 S at 2.35
Å and 1 Fe at 2.71 Å.
Figure III.3.18 Mo K-edge k3-weighted EXAFS spectra (top) and the Fourier transforms (bottom) of Blue
protein from D. alaskensis. Solid lines: experimental data, Dashed lines: fit using the best model given in Table
III.3.4.

III.3 Results
132
Tabl
e 1.
EXA
FS r
efin
emen
t pa
ram
eter
s of
diff
eren
t st
ruct
ura
l mod
els
of t
he
Mo
site
in b
lue
prot
ein
fro
m D
. ala
sken
sis. T
he
best
fit
is h
igh
ligh
ted
in r
ed.
The
valu
es in
pare
nth
eses
are
the
estim
ated
sta
nda
rd d
evia
tion
s ob
tain
ed fr
om th
e di
agon
al e
lem
ents
of t
he
cova
rian
ce m
atrix
. Th
e va
lue
of F
repr
esen
ts th
e g
oodn
ess
of th
e fit
.

III.3 Results
133
Figure III.3.19 shows the Fe K-edge k3-weighted EXAFS spectra (top panel) and the
Fourier transforms (lower panel) of D. alaskensis Blue protein. The magnitude of the Fourier
transform of the EXAFS data exhibits two main peaks at ~2.2 Å and at ~2.6 Å. The first peak
corresponds to iron-first shell ligand backscattering contributions, which, using the best
model given in Table III.3.5, has been modelled as 3 S atoms at 2.25 Å and 1 N atom at
2.02 Å. Based on the Mo K-edge analysis the second peak has been attributed to the Fe-Mo
contribution. However, the EXAFS curve fitting resulted in significantly longer Fe-Mo
distance as compared with that obtained from the Mo K-edge analysis (2.79 Å vs. 2.71 Å)
and the respective Debye-Waller factor was higher (0.006 Å2 vs. 0.003 Å2). These results
prompted the investigation of the presence of an additional metal-metal contribution at
similar distance, which potentially could interfere destructively with the Fe-Mo signal. The
presence of the Fe-Fe bond concomitantly with the Fe-Mo bond was tested and resulted in
better fit. In addition, the refined Fe-Mo distance was consistent with Mo K-edge analysis
(Table III.3.5).
In summary, there is some evidence that the Fe-Mo cluster in Blue protein from D.
alaskensis may consist of 1 Mo ion and more than 1 Fe ion.

III.3 Results
134
Figure III.3.19 Fe K-edge k3-weighted EXAFS spectra (top) and their Fourier transforms (bottom) of Blue
protein from Desulfovibrio alaskensis. Experimental data are shown by solid lines; calculated spectra based on
the best model given in Table III.3.5 are represented by dashed curves.

III.3 Results
135
Tabl
e III
.3.5
. EXA
FS r
efin
emen
t pa
ram
eter
s of
diff
eren
t st
ruct
ura
l mod
els
of t
he
Fe s
ite in
blu
e pr
otei
n f
rom
D. a
lask
ensis
. Th
e be
st f
it is
hig
hlig
hte
d in
red
. Th
e
valu
es i
n p
aren
thes
es a
re t
he
estim
ated
sta
nda
rd d
evia
tion
s ob
tain
ed f
rom
th
e di
agon
al e
lem
ents
of
the
cova
rian
ce m
atrix
. Th
e va
lue
of F
rep
rese
nts
th
e
goo
dnes
s of
the
fit.
*to
limit
the
num
ber o
f ref
ined
par
amet
ers,
the
stru
ctur
al p
aram
eter
s of
the
resp
ectiv
e M
o-Fe
inte
ract
ion
wer
e u
sed
and
kept
con
stan
t du
ring
refin
emen
t

III.3 Results
136

137
III.4 DISCUSSION
III.4.1 Primary characterization of Blue Proteins from Desulfovibrio genus
Blue proteins containing Fe-Cu and Fe-Mo clusters have been isolated from the
sulphate reducing bacteria D. aminophilus and D. alaskensis. The primary characterization
of these proteins indicates that they could belong to the same family of proteins isolated
from D. africanus [1], D. salexigens [2], and D.gigas [3].
A comparison of the UV-visible spectra of Blue proteins is shown in Figure III.4.1. The
bands observed at 320 and 410 nm suggest the presence of iron-sulphur clusters, which is
in agreement with the XAS results. The absorption peak at 615 nm observed in the
electronic spectra of D. aminophilus and D. gigas Blue protein, is absent in the D. alaskensis
Blue protein spectrum. This fact does not seem to be related with Cu deficiency since is
present in UV-visible spectrum of the Mo-Fe protein isolated from D. africanus [1] (Figure
III.4.2).
Figure III.4.1 Comparison of UV-visible spectrum of Blue proteins from Desulfovibrio aminophilus (red line),
Desulfovibrio alaskensis (black line), and Desulfovibrio gigas (Blue line)
250 300 350 400 450 500 550 600 650 700 750 800 8500,0
0,1
0,2
0,3
0,4
0,5
0,6
0,7
0,8
Ab
sorb
ance
(A.U
.)
Wavelength (nm)

III.4 Discussion
138
Figure III.4.2 UV-visible spectrum of Mo-Fe proteins from Desulfovibrio africanus. Reproduced from reference
[1].
In agreement with the homologous proteins previously isolated [1-3], Blue proteins
from D. aminophilus and D. alaskensis are multimers having 14-16 subunits. The mass
spectrometry data (Figure III.3.4) and the electrophoretic pattern (Figure III.3.2) show that
the protein isolated from D. alaskensis is composed by identical subunits. In contrast, the
protein isolated from D. aminophilus shows two components in both electrophoretic
pattern and MALDI-TOF spectra. As analyzed in section III.3.61, this protein could be
composed by subunits which differ at C-termini. Additional work is necessary to confirm this
hypothesis.
III.4.2 Amino acid sequence: conserved motifs and homology with other proteins
A BLAST search of D. aminophilus, D. alaskensis and D gigas amino acid sequence
revealed homology with a Zinc resistance associated protein from D. vulgaris
Hildenborough and D. desulfuricans G20 (Table III.4.1). Despite this fact, preliminary
experiments show no increase of expression levels when D. aminophilus cells are grown
until 45 μM of Zn (data not shown). Additional work should be necessary to elucidate a
putative relation between the metal concentration and expression of Blue proteins.
300 400 500 600 700
1.0
0.8
0.6
0.4
0.2
0.0
Wavelength (nm)
Abs
orba
nce
(A.U
.)
300 400 500 600 700
1.0
0.8
0.6
0.4
0.2
0.0
Wavelength (nm)
Abs
orba
nce
(A.U
.)

III.4 Discussion
139
Furthermore, the high identity percentage between proteins sequenced from D.
alaskensis and D. desulfuricans G20 (section III.3.6.2) suggests that D. desulfuricans G20
should be reclassified.
Table III.4.1 Identity percentages of Blue proteins amino acid sequences including the homologous protein
identified in Desulfovibrio vulgaris Hildenborough. Dam: D. aminophilus, Dg: D. gigas, Dal: D. alaskensis, and
DvH: Desulfovibrio vulgaris Hildenborough
Figure III.4.3 shows amino acid sequence alignment of the Blue proteins purified
from Desulfovibrio including the sequence of a homologous protein identified in D.
vulgaris Hildenborough. Although low identity percentage is observed when amino acid
sequences are compared (Table III.4.1), a segment between amino acids 65 to 85 shows to
be conserved in the analyzed sequences (red box, Figure III.4.3). This sequence could be a
signature of this family of proteins.
DvH Dal Dg
Dam 31.25 32.02 19.51
Dg 18.5 15.52
Dal 36.32

III.4 Discussion
140
Figure III.4.3 Multiple amino acid sequence alignment of Blue proteins. (Dam): D. aminophilus, (Dal): D.
alaskensis, (Dg): D. gigas, (DvH_DVU3384): D. vulgaris Hildenborough, locus tag DVU3384, (*): identity, (:):
strongly similar, and (.) weekly similar.
10 20 30 40 | | | | | | Dam MKTATRSAWYVGLALSMVLGLAAAS-YALGGPGPGMYG-------------RGPGYGMMD Dg ----------------------------MNAPHERFRG----------------CSPLER Dal MKTRSIITIVAALGIFALAAVAFAGPYGHGYGHRGGYGGMGAGGGAAVCPFGGSGPGGQA DvH_DVU3384 MNSK-----RIALGIIALATVVSLGTAANNAFARG-HG-----------NYHGQGQMMGQ . * 50 60 70 80 90 100 | | | | | | Dam QYTQLTPEKRAAVDKLFAEHRKAVQPLRDELFVKQAELDAVERQQSPDLNAVRTLAKDIT Dg LEQFLPPEVRESAKTLLMEHRKAIYPLQERAKGKKHELNALIATPNTSDDTINKLVDEIN Dal AYDSLTPDKQALYDKIVAEADGKMTPLRDKLFAKQAELNAMYNNPATDPAAVGKTAGEVA DvH_DVU3384 AYEALTPEKQAKFDSLIDAFNTKVTPLRDKLWAKHTELNALSSNPNTKPEDIRKLTDEIT *.*: : ..:. : **::. *: **:*: .. : . . :: 110 120 130 140 150 160 | | | | | | Dam TLRGKLFDQGEAFRAKVEKETGIEMGPG-RGYG--MGYGRGSGMG-----YGHGYGHGYG Dg GLHAQIFKANVAMRKEFFKVTGVPLPEK-------P--GRGPR----------------- Dal QLRTQLRNLHIELSQRLEKEVGLKSGFG-RGHR--GGFHRGGGYH-----MGGGMMGGHY DvH_DVU3384 ALRTQYRTEAANLDASMQKEVGIKTHFATMGHRGMGGMGGGCGMMGGKGGMGSGMMQMHD *: : : . * .*: * 170 | Dam -MGPGGG--- Dg ---------- Dal ---------- DvH_DVU3384 GEGPHRGQNM
III.4.3 Novel cofactors in proteins isolated from Desulfovibrio genus
Three different metals have been detected in Blue proteins from Desulfovibrio
genus: Cu, Mo and Fe. Although all these proteins seem to belong to the same family,
EXAFS studies point to a multinuclear cluster with some differences in the coordination
around metal ions (Figure III.4.4).
In addition, some contradictions between XAFS studies and metals quantification
remains to be elucidated. The ratio metal ion per protein molecule is not in agreement with
the XAS studies for the D. aminophilus and the D. alaskensis Blue protein. Therefore, the
studies on the metallic clusters of Blue proteins presented in this work are preliminary and
more work need performed to a better understanding of the metal composition and
structure of these centres.

III.4 Discussion
141
Figure III.4.4 Proposed metals centres in Blue proteins from Desulfovibrio alaskensis (a and b), Desulfovibrio
gigas (c), and Desulfovibrio aminophilus (d).
Fe
S
N
Mo
O OH
1.68
2.19
2.71 2.02
2.35
2.35
2.25
2.25
2.25 2.02
(a) (b)
(c) (d)
Cu

III.4 Discussion
142

143
II.5 REFERENCES 1. Hatchikian EC and Bruschi M, Isolation and characterization of a molybdenum iron-sulfur protein
from Desulfovibrio africanus. Biochem Biophys Res Commun, 1979. 86(3): p. 725-734.
2. Czechowski M, Fauque G, Galliano N, Dimon B, Moura I, Moura JJG, Xavier AV, Barata BAS, Lino AR,
and LeGall J, Purification and characterization of three proteins from a halophilic sulfate reducing
bacterium Desulfovibrio salexigens. J. of Ind.Microb., 1986. 1: p. 139-147.
3. Andrade S, Biochemical and spectroscopic characterization of Mo-containing enzymes from sulfate
reducing bacteria, in Chemistry Department. 2002, New University of Lisbon: Lisbon- Portugal.
4. Widdel F and Pfennig N, A new anaerobic, sporing, acetate-oxidizing, sulfate-reducing bacterium,
Desulfotomaculum (emend.) acetoxidans. Arch Microbiol, 1977. 112(1): p. 119-122.
5. Laemmli UK, Cleavage of structural proteins during the assembly of the head of bacteriophage T4.
Nature, 1970. 227(5259): p. 680-685.
6. Schagger H and von Jagow G, Tricine-sodium dodecyl sulfate-polyacrylamide gel electrophoresis for
the separation of proteins in the range from 1 to 100 kDa. Anal Biochem, 1987. 166(2): p. 368-379.
7. Brondino CD, Passeggi MC, Caldeira J, Almendra MJ, Feio MJ, Moura JJ, and Moura I, Incorporation
of either molybdenum or tungsten into formate dehydrogenase from Desulfovibrio alaskensis NCIMB
13491; EPR assignment of the proximal iron-sulfur cluster to the pterin cofactor in formate
dehydrogenases from sulfate-reducing bacteria. J Biol Inorg Chem, 2004. 9(2): p. 145-151.
8. Hanna PM, Tamilarasan R, and McMillin DR, Cu(I) analysis of blue copper proteins. Biochem J, 1988.
256(3): p. 1001-1004.
9. Pauleta SR, Electron transfer complexes between Paracoccus cytochrome c peroxidase and its
electron donors". 2003, Universidade Nova de Lisboa: Lisbon.
10. Fogo JJ and Popowsky M, Spectrophotometric determination of hydrogen sulfide, methylene blue
method. Anal. Chem., 1949. 21: p. 732-734.
11. Chamberlain JS, Gibbs RA, Rainer JE, Nguyen PN, and Thomas C, Deletion screening of the
Duchenne muscular dystrophy locus via multiplex DNA amplification. Nucleic Acids Res., 1988.
16(23): p. 11141-11156.
12. Henegariu O, Heerema NA, Dlouhy SR, Vance GH, and Vogt PH, Multiplex PCR: critical parameters
and step-by-step protocol. Biotechniques, 1997. 23(3): p. 504-511.

III.5 References
144
13. Wilson K, Preparation of genomic DNA from bacteria. in Current protocols in molecular biology., ed.
FM Ausubel, et al. Vol. 1. 1994, New York, NY: John Wiley & Sons. 2.4.1-2.4.5.
14. Ochman H, Gerber AS, and Hartl DL, Genetic Applications of an Inverse Polymerase Chain Reaction.
Genetics, 1988. 120(3): p. 621-623.
15. Bursakov SA, Gavel OY, Di Rocco G, Lampreia J, Calvete J, Pereira AS, Moura JJ, and Moura I,
Antagonists Mo and Cu in a heterometallic cluster present on a novel protein (orange protein)
isolated from Desulfovibrio gigas. J Inorg Biochem, 2004. 98(5): p. 833-840.
16. George GN, Pickering IJ, Yu EY, Prince RC, Bursakov SA, Gavel OY, Moura I, and J.J.G. M, A Novel
Protein-Bound Copper-Molybdenum Cluster. J. Am. Chem. Soc., 2000. 132: p. 8321-8322.

145
IV. CONCLUDING REMARKS
The present work describes distinct types of studies performed on two different
types of proteins isolated from the Desulfovibrio genus. One of them belongs to the well-
known family of the mononuclear Mo-containing enzymes, the Fdh from the sulphate
reducer Desulfovibrio desulfuricans ATCC 27774. The second type comprises of two
proteins belonging to a family of novel proteins that present heterometallic clusters and
unknown function so far.
The sequencing of the gene cluster of Formate dehydrogenase isolated from
Desulfovibrio desulfuricans ATCC 27774 gave important information about gene
organization and conserved motifs in the different subunits. The presence of the UGA
codon together with the SECIS element in the fdhA gene is in agreement with the SeCys
residue coordinated to the Mo atom at the active site reported in the first characterization
of the enzyme. The presence of a signal peptide containing the twin arginine motif in this
subunit shows that, as for the W-Fdh from D. gigas, it is located on the periplasmic side of
the cytoplasmic membrane being transported by a Sec-independent system. The
conserved residues proposed to be involved in the oxidation of formate were also
identified, which supports a common reaction mechanism for all these Fdhs. Concerning to
the FdhC subunit, four histidine motifs as well as four histidine residues were found which
is in agreement with the number of low spin hemes previously reported.
The improvement of the kinetic assays allowed performing careful studies of the
kinetic properties of Fdh from D. desulfuricans ATCC 27774. The use of deuteroformate as
substrate provided important advances on mechanistic aspects showing that the C-H break
is the rate-limiting step in the formate oxidation. EPR studies of the Mo(V) species obtained
by reducing the enzyme with formate or deuteroformate were important to elucidate the
nature of some of the ligands coordinated to the Mo(V) ion. Furthermore, the
development of a different signal when the formate reduced enzyme is incubated with

IV. Concluding Remarks
146
inhibitor (azide or cyanide) suggests changes in the coordination around the Mo atom in
presence of any of these molecules. The accepted catalytic mechanism for Fdhs is
proposed on the basis of an enzyme purified in presence of azide, but the results obtained
here suggest that the inhibitor induces structural changes of the Mo site. It is evident that
additional work is necessary to understand the enzyme changes induced by the inhibitor
molecule.
The second part of this work is devoted to the characterization of two new proteins
isolated from the sulphate reducing bacteria D. aminophilus and D. alaskensis. Biochemical
analysis confirmed the multimeric character of these proteins and the amino acid sequence
of both D. aminophilus and D. alaskensis Blue proteins confirm their periplasmic location in
the cell. Although X-ray absorption spectroscopy studies are not absolutely conclusive yet, it
is evident that the two analyzed Blue proteins contain multinuclear centres with no
resemblance with other clusters containing a well-known function in biology. Several
points of the results presented here show some controversies, e.g.: whether Mo is present
or not of Mo in the cluster of D. aminophilus Blue protein and the different metal/protein
ratios given by biochemical analysis and EXAFS data. As stated at the beginning of this
manuscript, these data are preliminary and additional work should be carried out to
elucidate all these discrepancies. In this sense, ongoing X-Ray data analysis of some of these
proteins is hopefully awaited for a better understanding of the 3D structure of these
clusters. Another important point that needs additional work is regarding the function.
Preliminary studies showed an increasing of the expression level of the protein from D.
alaskensis as the Mo concentration increase, which suggests a putative involvement of this
protein in response to metal stress. These results are preliminary and not included in this
work.
In the last years, structural and spectroscopic studies on several mononuclear Mo-
containing proteins have provided valuable information on mechanistic aspects of these
metalloproteins. However, it is evident that the exact natures of the molecular processes
IV. Concluding Remarks
147
occurring during catalysis are not well understood yet. Furthermore, the discovery of
proteins containing new metallic cofactors not only open new research fields but also
suggests that the role of Mo is not limited to the well-documented processes of the
reactions catalyzed by mononuclear containing enzymes and nitrogenase. All these points
and others not mentioned here are within the most important challenges for the coming
years.