disposing of unneeded federal real estate may 2011
TRANSCRIPT

Disposing of Unneeded Federal Real Estate
May 2011

• Funding challenges• Executive Order 13327• Space optimization• Energy management and sustainability• Metrics and benchmarks to evaluate performance
and decision making• Excess or underutilized real property
2

Executive Order 13327
3
• EO 13327 directs executive agencies to develop and use Asset Management Plans to determine whether real property holdings are sufficient for or in excess of what is required to satisfactorily fulfill their operational missions.
• Plans must be made to dispose of the excess real property inventory.
• Proceeds from that disposition (if any) are to be returned to the general funds of the Treasury.

Funding challenges
4
YES!
But we need to figure it out!
And we will.

5
$3 billion by 2012
President ‘s June 2010, memo directed Federal agencies to reduce space in a cost conscious manner in order to save $3 billion by 2012 through:– disposing of unneeded Federal real estate, – increasing sales proceeds, – cutting operating costs – innovative workplace strategies and, – improving energy efficiency.

6
Additionally agencies shall
• immediately adopt a policy against expanding data centers beyond current levels
• develop plans to consolidate/significantly reduce data centers within 5 years
• take immediate steps to make better use of remaining real property assets
• eliminate lease arrangements that are not cost effective
• pursue consolidation within and across agencies in common asset types
• increase occupancy rates through innovative approaches
• identify offsetting reductions in inventory when new space is acquired
• align with and support the actions to measure and reduce resource use and greenhouse
gas emissions in Federal facilities pursuant to Executive Order 13514

7
Disposing of Unneeded Federal Real Estate
• We need to look at the way we work differently and adopt policies to reflect that.
• It’s time for the Fed to get creative.
• Increase utilization by engaging a mobile workforce.
• Make technology work for our workforce.
Space Optimization
“When I first saw this memo, I thought it was just
about another way to save money.”
8
But then the pieces fell into place. It brings together so many of our priorities. It is a threshold into an exciting new future.
This is so much more than saving money.
It touches on so many issues: cutting costs are part of it, but only part• it is about introducing a new workplace culture where mobility and
collaboration are the norm• it is about rethinking and redesigning the workplace• its about being green and our green proving ground initiative• it is about implementing new technologies• it is about leadership at a time that requires creative solutions• it is about developing new relationships with our Federal counterparts • it is about introducing new strategies to getting work accomplished• it is about overcoming resistance to change• and, most of all its about increasing productivity for our workforce.
9
• Does your real estate effectively support your mission requirements? – If so, how? If not, what are the issues?
• What innovative ideas are you doing to help you realize cost savings?
• What are you doing to emulate success stories and best practices?
• Can you pilot some of these best practices on one office or bureau?
Setting the Stage

10
Our Approach to Analyzing Opportunities
• Operating $/SF• Energy Use/SF• Low Utilization
(Employees/SF)
• Low Mission Impact
• Low Risk
• High Mission Impact
• High Risk
Step 1: Identify buildings with poor performance and low mission impact/risk
Step 2: Buildings are mapped to look for opportunities:• Consolidation• Improved work space efficiency• Collocation

Impediments
11
Mission
Skilled StaffProcessesGuidance
Resources:• Facilities• IT Infrastructure• Funding
Client Agency
• Disruption to operations (short term risks to mission)
• Aligning improvements/consolidation with agency’s long term strategy
• Inter Office/Bureau/agency cooperation• Cultural resistance to change from staff
• Time required to involve stakeholders in schedule
• Technology required to support improvements/consolidations
• Budget Constraints
Challenges

12
Case Example- GSA Headquarters
• Challenge– Administrator Johnson challenged the agency to combine all GSA
operations into the GSA HQ building, representing a 160% increase in space utilization
• 4 locations, total of 6000 staff, 2600 seats• Mobility
• Response– GSA piloted several concepts to try to find the correct mix of productivity
and office utilization
• Expected Results– The GSA HQ building is being renovated to accommodate an increase in
capacity and a new way of working– 800 GSA staff are residing in the building during the phased renovation
to reduce transition costs of swing space

13
Case Example - FAA
• The Challenge– Consolidate operational air traffic advisory services
provided by 58 Automated Flight Service Stations (AFSSs)
• The Response– Developed plans to discontinue operations at 42 AFSS
locations, many housed in leased buildings at airports
• The Results– FAA reduced AFSS leased space from 515,766 rsf to
115,000 rsf with estimated annual savings of $3,489,935

14
• Short term opportunities– What can be disposed of immediately? – What needs to be done to get the properties
on your FRPP excess list to be disposed or demolished?
– Expiring leases
Opportunities

15
XXX Excess Facilities by GSF –
Data Selection:- using Organization is XXX,Exclusions:- “Land” property type- “Service” (other than buildings)- “Storage” (other than buildings)
property use

16
Number of Facility Leases by Lease Expiration Year

17
Agency Space trends
• Historic Data based on assignable RSF - Active buildings, – Differs from FRPP, which includes GSF(not RSF) for Active and Excess.– Differs from Budget Figures, which are billable RSF only.
FY06 FY07 FY08 FY09 FY10 FY11 FY12 FY13
172.1 175.6177.9
184.4
191.4193.0
199.8
203.7
174.4176.6 176.6 177.1
178.8181.5
183.0 184.1Leased
Owned

18
Average Energy Use per XXX Region
11 8 6 1 10 2 3 5 7 9 40
50000
100000
150000
200000
250000
Average of BTU/GSF
Region

19
Operating Costs of XXX Occupied Owned Space
GSA REGIO
N NIN
E
GSA REGIO
N EIG
HT
GSA REGIO
N TEN
GSA REGIO
N FIV
E
GSA REGIO
N SIX
GSA REGIO
N SEVEN
GSA REGIO
N ONE
GSA REGIO
N FOUR
GSA REGIO
N TW
O
GSA REGIO
N ELE
VEN
GSA REGIO
N THREE
0
1
2
3
4
5
6
Average Operating Costs of XXX Owned Space

20
• Longer term opportunities– Back office functions in high value real estate– Geography opportunities– Technology opportunities– Expiring lease opportunities– Leveraging mobile workplaces– Are there interagency opportunities?
Opportunities (continued)

XXX Low Utilization Properties in High Value Markets

22
-
500,000
1,000,000
1,500,000
2,000,000
2,500,000
3,000,000
11 03 07 04 08 05 09 06 02 10 01Sum of Assigned RSF 2,508,5 1,522,8 577,068520,348501,378501,318494,425457,445347,725262,362223,950
Count of Real Prop ID# 98.00 125.00 239.00 170.00 173.00 126.00 107.00 101.00 88.00 89.00 73.00
Ass
igne
d RS
F
GSA Properties by Region (Owned/Leased) - All Types
Geography of Portfolio

23
Mobility and Space Utilization

• Space per person measure as the key performance metric
• Private Sector Median is 193 USF/person vs. Government Benchmark of 190 USF/person – we need to begin thinking of people per workstation as we become mobile.
• More efficient design of space has reduced the typical workspace since the early 2000s from about 250 USF/person to around 190 USF/person – but the world is now my workplace!
• Alternative workspace strategies and wireless technology have increased associates per workspace, resulting in a reduction in operation and maintenance costs and an increase in workforce morale
• Alternative workspace arrangements have become crucial parts of many organization’s continuity of operations (COOP) strategies
• The President and Congress have strongly encouraged teleworking and federal agencies have responded with positive results – we’re headed beyond telework to mobility!
• Hoteling and Desk Sharing are emerging strategies to connect mobile workers to a permanent office - work is what you do not where you do it .
Utilization Benchmarks & Strategies

Benchmarks vs. Federal Agency Guidelines
Agency Cubicle/Shared Office Source
Business Services/Consulting 40 USF/person 40 USF/person A/E Design FirmTelecommunications 65-90 USF/person
150-225 USF/person CRE Division of Communications Company
Manufacturing 48 USF/person120-380 USF/person
CRE Division of Electronics Manufacturing Company
Domestic Govt. Organization 64-80 USF/person 80-400 USF/person Security Division, HQs of U.S. Gov't Agency
International Govt. Organization 52 USF/person 60-105 USF/person FM Division of Public Health NGOAcademic Institution
30-160 USF/person
160-400 USF/person Large Campus University or College
Northeast County Government 60 USF/person125-250 USF/person Agency of County Government
Diversified Manufacturer 56 USF/person150-400 USF/person Fortune 200 Manufacturing Firm
Media Conglomerate 64 USF/person150-225 USF/person Fortune 100 Television and Internet Company
Business Services/Consulting 70 USF/person140-400 USF/person Leading Management Consulting Firm
NIH NIH Policy ManualFAA FAA Administrative Space GuidanceArmy Army Regulation 405-70, Chapter 5-4Coast Guard USCG RP Asset Management ManualNASA NASA Real Estate Management ProgramUSDA USDA Space Management PolicyFe
dera
l Age
ncy
Gui
delin
esBe
nchm
arks
*
160-190 NASF/person152.5 OSF/person
130 NASF/person or less135 SF/person
110 NSF/person150 SF/person
*Benchmark figures are further discussed in GSA Workspace Utilization and Allocation Benchmark Report
26
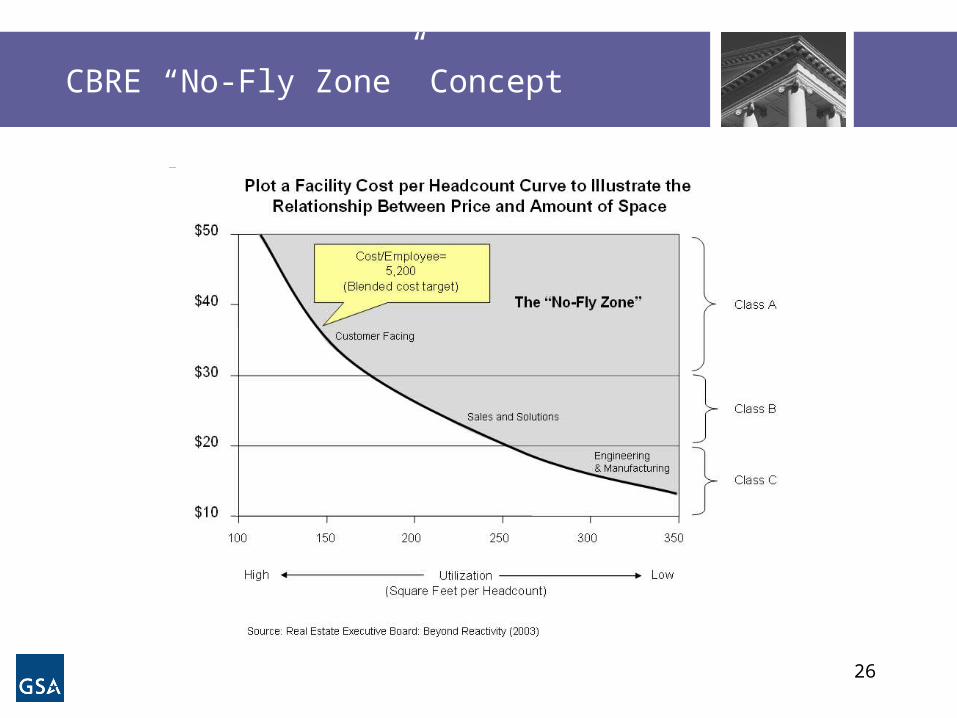
CBRE “No-Fly Zone” Concept

27
• Commitment to refine plans to meet Presidential Memo goals
• Civilian Property Realignment Hearings• Expect OMB to issue targets• Tools/benchmarks
– Census– Resource List
Next Steps