displacement and geometrical characteristics of earthquake
TRANSCRIPT
April 25, 2007 – submitted to BSSA – Aug 20 returned from BSSA – revised & resubmitted Oct. 18.&Dec20
1
Displacement and Geometrical Characteristics of Earthquake Surface Ruptures: Issues and Implications for Seismic Hazard
Analysis and the Process of Earthquake Rupture.
Steven G. Wesnousky Center for Neotectonic Studies
Mail Stop 169 University of Nevada, Reno
Reno, Nevada 89557 [email protected]
Abstract There now exist about 3 dozen historical earthquakes for which investigators have
constructed maps of earthquake rupture traces accompanied by descriptions of the
coseismic slip observed along fault strike. The maps and slip distributions are compiled
here and place observational bounds on aspects of seismic hazard analysis and fault
mechanics. Analysis leads to an initial statistical basis to predict the endpoints of rupture
and the amount of surface slip expected at sites along strike during earthquakes on
mapped faults. The observations also give support to the ideas that there exists a process
zone or volume of about 3-4 km dimension at the fronts of large laterally propagating
earthquake ruptures within which stress changes may be sufficient to trigger slip on
adjacent faults, and that the ultimate length of earthquake ruptures is controlled primarily
by the geometrical complexity of fault traces and variations in accumulated stress levels
along faults that arise due to the location of past earthquakes. To this may be added the
observation that the form of earthquake surface slip distributions is better described by
asymmetric rather than symmetric curve forms and that earthquake epicenters do not
appear to correlate in any systematic manner to regions of maximum surface slip
observed along strike.
Introduction It has become standard practice since Clark’s (1972) early study of the 1968
Borrego Mountain earthquake to map the geometry of rupture traces and assess the
surface-slip distribution of large earthquakes that break the ground surface. The results of
such studies have been a steady source of reference and use in development of seismic
April 25, 2007 – submitted to BSSA – Aug 20 returned from BSSA – revised & resubmitted Oct. 18.&Dec20
2
hazard methodologies (e.g., Wesnousky et al., 1984; Wesnousky, 1986; Petersen and
Wesnousky, 1994; SCEC, 1994; Frankel and Petersen, 2002), engineering design criteria
for critical facilities (e.g., Kramer, 1996; Pezzopane and Dawson, 1996; Fuis and Wald,
2003), and development and discussion of mechanical models to understand physical
factors that control the dynamics of the earthquake source as well as the resulting strong
ground motions (e.g., Scholz, 1982a; Scholz, 1982b; Heaton, 1990; Romanowicz, 1994;
Scholz, 1994; Bodin and Brune, 1996; King and Wesnousky, 2007). There now exist
about 3 dozen historical earthquakes for which investigators have constructed maps of
earthquake rupture traces accompanied by data describing the coseismic slip observed
along fault strike. Here I put forth a compilation of that data set with the aim of placing
observational bounds on aspects of seismic hazard analysis and fault mechanics.
Data Set I limit my attention to the larger surface rupture earthquakes of length dimension
greater than about 15 km and for which there exist both maps and measurements of
coseismic offset along strike of the rupture (Table 1). The map and slip distribution of
the April 9, 1968 Mw 6.1 Borrego Mountain earthquake of California illustrate the
manner of data compilation (Figure 1). The surface slip distribution is placed below and
at the same map scale as the map of the surface rupture trace. Nearby fault traces that
displace Quaternary and younger deposits but did not rupture during the earthquake are
also shown. The location and dimension of fault steps along and at the ends of the
earthquake ruptures and the distances to nearest neighboring active fault traces from the
endpoints of surface rupture traces are annotated. The size of steps in fault trace are
generally taken as the distance between en-echelon strands measured perpendicular to
average fault strike. Steps in fault trace are also labeled as restraining or releasing
depending on whether volumetric changes within the step resulting from fault slip would
produce contractional or dilational strains within the steps, respectively (e.g., Segall and
Pollard, 1980). The epicenter of the earthquake is also shown by a star. The maps and slip
distributions for all the earthquakes in Table 1 are presented in the same manner and
collected in electronic supplement 1. The resolution of the available maps generally
limits observations to discontinuities of about 1 km and greater.

April 25, 2007 – submitted to BSSA – Aug 20 returned from BSSA – revised & resubmitted Oct. 18.&Dec20
3
I have digitized and linearly interpolated between each of the original points in
the slip distributions to form slip distribution curves at a resolution sufficient to reflect
the details of the original slip measurements, at either 0.1 km or 1 km intervals (e.g.
Figure 1). The original and interpolated points of the slip curves for all earthquakes in
Table 1 are presented both graphically and in tabular form in electronic supplement 2.
The seismic moment Mo = µLWS is used here as the primary measure of
earthquake size, where µ = crustal rigidity of the rocks in which the earthquake occurs, L
and W are the length and width of the fault plane, respectively, producing the earthquake,
and S = average coseismic slip during the earthquake (Aki and Richards, 1980). The
value of Mo may be determined from seismological or geodetic measures of seismic
waves or ground deformations resulting from an earthquake, respectively. In such
analyses the value of rigidity µ is assumed independently from seismic velocity models
that describe the crust in the vicinity of the earthquake source, and the depth D to which
rupture extends is generally assigned as the depth of aftershocks or regional background
seismicity. The value Mo may also be determined primarily from geological observations
where estimates of S and L have been obtained from field measurements of offsets along
the surface expression of the causative fault. In this case, the measurement is limited to
earthquakes large enough to break the ground surface and to those for which
independently-derived values of µ and W can be drawn from seismological observations.
For convenience of discussion, estimates of Mo determined in this latter manner are here
labeled MoG and referred to as geologic moments. Similarly, estimates of moment
derived primarily from instrumental measurements are denoted Moinst.
The estimates of geologic moment Mog and the parameters from which the
estimates are calculated are listed for each event in Table 1. Specifically, the digitized
slip curves (Figure 1 and electronic supplement 2) are used to calculate the average S
and maximum Smax coseismic surface slip and rupture length L for each listed event. The
investigations on which values of the depth extent of rupture D, the rigidity µ, and fault
type (mechanism and dip δ) used to estimate the respective geologic moments are also
referenced in Table 1. The basis for assigning the values of µ and rupture depth D for the
respective earthquakes are described in further detail in the notes of Table 1. The value
April 25, 2007 – submitted to BSSA – Aug 20 returned from BSSA – revised & resubmitted Oct. 18.&Dec20
4
of rupture width W used in calculating MoG is D/sin(δ), where δ is dip and listed in the
Type column of Table 1. Because of uncertainties in estimates of µ used in seismic
moment calculations, it has been suggested that geometrical moment or seismic potency
(Po = Mo/µ) may provide a more fundamental scaling parameter for comparing the
relative size of earthquakes (Ben-Menahem and Singh, 1981; Ben-Zion, 2001). To
examine this idea, I calculate and list a value Po for each event.
Instrumentally derived estimates of the seismic moment Moinst of each event are
listed in Table 2 when available. The sources of the estimates are cited and each denoted
according to whether it was derived from seismic body-waves, surface waves, or geodetic
measurements. For each, I have also attempted to extract the value of rigidity µ used by
investigators in calculating the instrumentally-derived seismic moment values. The
values of rigidity µ are then used to convert the measures of seismic moment to potency
Po. The original references and notes describing the basis for the values of rigidity used
in each of the moment calculations are provided in the notes accompanying Table 1. It is
these data that are also the basis for the values of µ used in calculating the geologic
moments of the respective earthquakes in Table 1.
Observations The data set is limited to continental earthquakes. Thirty-seven earthquakes are
listed in Table 1. Twenty-two are primarily strike-slip, 7 are normal slip, and the
remaining 8 are reverse slip. The following section presents the observations summarized
in Tables 1 and 2 graphically. The implications of the observations are then discussed in
the subsequent section. The plots are designed to illustrate how variables in the data set
scale with one another. Curves are fit when applicable to the observations to quantify the
relationships. For each plot the type of curve (e.g., linear, log-linear, power-law), the
parameters leading to the best fit of the curve to the data, and the number of data points
are defined within the plot space. The quality of curve fits are also variously described by
values of Pearson’s regression coefficient R, Chi-square, and standard deviation (Press et
al., 1992).
Rupture Width and Aspect Ratio

April 25, 2007 – submitted to BSSA – Aug 20 returned from BSSA – revised & resubmitted Oct. 18.&Dec20
5
Rupture width W is plotted versus surface rupture length and both the geologic
and instrumental moment in Figure 2. Each plot shows widths of strike-slip ruptures on
vertical or near-vertical faults are generally assigned values between 10 and 15 km, the
width of the seismogenic layer in continental environments. The rupture widths for the
strike-slip earthquakes are thus largely independent of earthquake size though
examination of the plots allows the suggestion that widths of larger earthquakes tend to
be more frequently characterized by relatively larger values of W than do lesser
earthquakes in the data set. Because normal faults dip at relatively smaller angles through
the seismogenic layer, the rupture widths tend to be larger and reach ~20 km width, with
the exception of the 1987 Edgecumbe earthquake (event 27) which occurred in the Taupo
Zone of New Zealand, a region of particularly high heat flow (e.g., Rowland and Sibson,
2004). The range of fault widths is greater for reverse faults, ranging from about 5 to 20
km. Three of the 8 reverse faults in the data set occurred in the intraplate environment of
Australia (events 20, 25, and 28) where rupture depths have been observed to be
particularly shallow (Langston, 1987; Fredrich et al., 1988; Choy and Bowman, 1990).
The three Australian intraplate events define the lower end of the range in both W and L
values for the 8 reverse type earthquakes and appear responsible for the apparent positive
relationship between L and W for reverse type earthquakes.
The same data are recast in a plot of the aspect ratio (rupture length L / rupture
width W) versus rupture length in Figure 3a. The best-fitting curve of form Aspect Ratio
= A * LB to the strike-slip data is characterized by a value of B=1, indicating a linear
relationship between aspect ratio and rupture length. The value B=1 is that which would
be expected by limiting the depth extent of earthquake ruptures to a seismogenic layer of
relatively constant thickness. The normal fault ruptures are similarly characterized but
tend to fall below the strike-slip events. This latter difference arises because the events
share a seismogenic layer of about the same thickness but the normal faults dip through
the layer in contrast to the vertical planes of strike-slip ruptures. The reverse fault data
show a similar tendency for aspect ratio to increase with length but the scatter in the
fewer data yield a poorly fit regression. The aspect ratio is also plotted and similarly fit
to regression curves as a function of MoG and Moinst in Figures 3b and c, respectively. In
these cases, the same patterns arise but the increased scatter in the data leads to poorer
April 25, 2007 – submitted to BSSA – Aug 20 returned from BSSA – revised & resubmitted Oct. 18.&Dec20
6
curve fits. The greater scatter is because estimates of Mo also incorporate uncertainties
and variations in estimates of coseismic displacement S and rigidity µ between the
respective earthquakes. The comparison of MoG to aspect ratio in Figure 3b is somewhat
circular in reasoning in that both MoG and aspect ratio are functions of L. Nonetheless,
limiting comparison of rupture length to instrumental moment Moinst does not appear to
significantly decrease the scatter in the relationship (Figure 3c).
Instrumental vs. Geologic Measures of Earthquake Size: Moment and Potency The range of instrumentally derived values of seismic moment Moinst and potency
Poinst generally span a range of a factor of 2 to 3 for the earthquakes listed in Table 2
(Figure 4). Geological estimates of MoG generally fall within the range of instrumental
estimates for the larger events in the data set (Figure 4). The same is also illustrated in
Figures 5 where the geologic estimates of seismic moment and potency are plotted as a
function of the instrumentally derived values for the respective events. A solid line of
slope 1 is drawn on each plot. The bounding dashed parallel lines fall a factor of 2 in
geologic moment from the line of slope 1. Data points falling on the solid line of slope 1
would indicate perfect agreement between the geological and instrumental measures. The
vertical error bars with each data point span a factor of 3 about the value of geologic
moment. The horizontal error bars for each data point encompass the spread of
instrumentally derived values given for each event and plotted in Figure 4. The majority
of the geologic estimates fall within a factor of 2 of the instrumental measures. Those
with the greatest discrepancy tend to fall well below the respective instrumental
measures, indicating that coseismic slip was probably concentrated at depth for the
particular events. For only one event, the 1915 Pleasant Valley earthquake (event 5), do
the geologic estimates fall well above the instrumental estimates. Doser (1988) points out
the discrepancy may be due in part to problems in the calibration of seismometers or that
energy release during that earthquake occurred at longer periods than recorded by the few
seismograms available for analysis of the event.
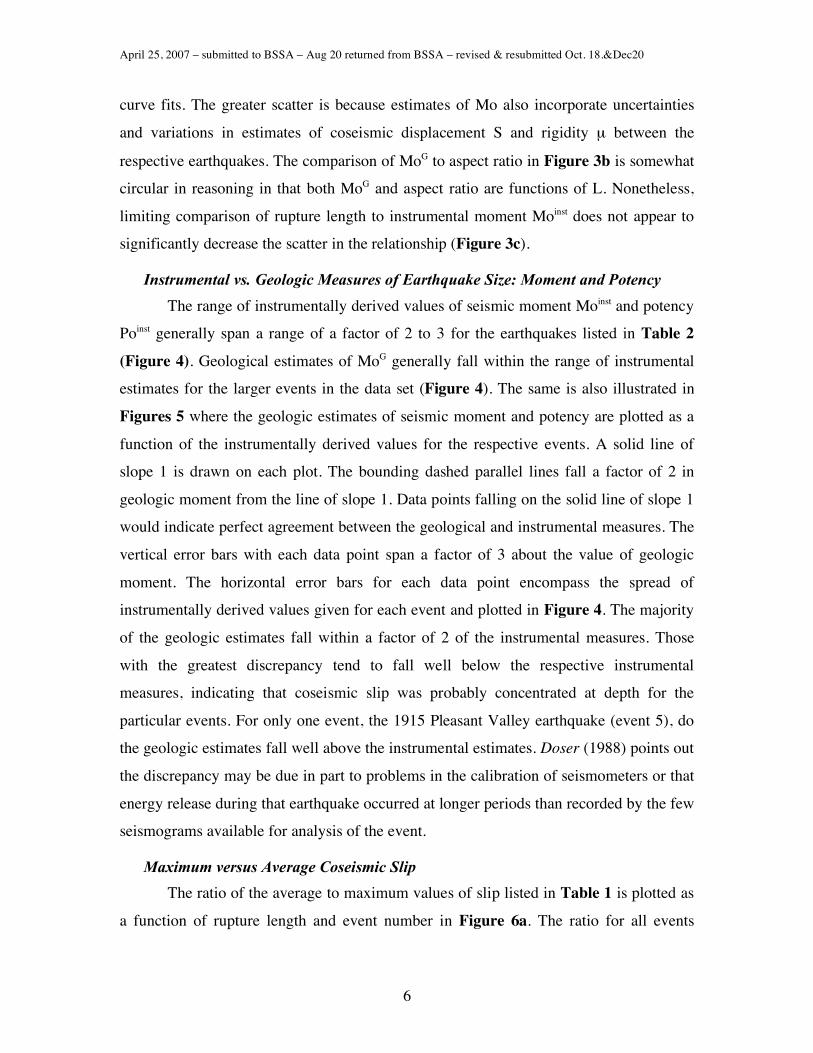
Maximum versus Average Coseismic Slip The ratio of the average to maximum values of slip listed in Table 1 is plotted as
a function of rupture length and event number in Figure 6a. The ratio for all events

April 25, 2007 – submitted to BSSA – Aug 20 returned from BSSA – revised & resubmitted Oct. 18.&Dec20
7
regardless of mechanism is characterized by an average value of 0.41 with a standard
deviation of 0.14. The subsets of strike-slip, reverse and normal mechanisms show ratios
of 0.44±.14, 0.35±.11, and 0.34±.10, respectively (Figure 6b). No clear dependence of
the ratio on rupture length is observed.
Coseismic Slip versus Rupture Length (Average and Maximum) The average and maximum values of coseismic slip as a function of surface
rupture length are shown in Figures 7. Linear curve fits are applied separately to each of
the reverse, normal, and strike-slip earthquakes. The slopes of the linear curve fits are
increasingly greater for the strike-slip, normal, and reverse faults, respectively. While the
reverse and normal fault observations appear reasonably well-fit by a straight line, the
strike-slip data are not. For this reason, I have further fit log-linear [slip S (m)=-C + C *
Log (Length(km)] and power law [slip S (m)= C * Length(km)D] curves to the strike-slip
data. The log-linear fit is formulated to constrain the curve to intersect the point where
both L and S are zero. These latter curves result in a significant reduction in formal
uncertainties of the curve fit to the strike-slip data as compared to a straight line. The
formal measures of uncertainty for the power-law and log-linear curve fits are virtually
equal. The slopes of the lines describing the increase of slip show a decrease in slope as a
function of rupture length without apparently reaching a plateau.
Instrumental Moment and Moment-Magnitude Versus Rupture Length Figure 8 shows the relationships of Mo and Mw to L for the subset of events
studied by instrumental means and listed in Table 2. Each shows a systematic increase
with L though with significant scatter when viewing the entirety of the data set. The
fewer number of observations and limited range of rupture lengths is insufficient to lend
confidence to similar regressions for the subset of normal and reverse earthquakes as
compared to strike-slip earthquakes.
Shape of Surface Slip Distributions To examine whether or not earthquake surface slip distributions are characterized
by any regularities in shape, I have fit various regression curves to the digitized slip
distributions of the earthquakes listed in Table 1. The approach is illustrated in Figure 9
where 3 of the digitized surface slip distributions are displayed along with a set of 6 best-

April 25, 2007 – submitted to BSSA – Aug 20 returned from BSSA – revised & resubmitted Oct. 18.&Dec20
8
fit regression curves. The simplest curve form is that of a flat line and yields the average
displacement of the slip distribution. Additionally curves of the form of a sine and ellipse
are fit to the data. In these latter cases the length is defined by the length of the surface
rupture, the curve-fits by form are symmetric, and the only free variable in fitting the
curves to the observed slip distribution is the amplitude or maximum slip of the curve.
Finally, I fit 3 curves allowing the shape of the fit to be asymmetric. These include a
triangle, an asymmetric sine, and an asymmetric ellipse curve. The asymmetric sine and
ellipse curves are defined by the shapes of the respective functions multiplied by a value
(1 – m ∗ (x/L)) where x is the distance along the fault, L is the rupture length, and m is a
variable of regression. The multiplication reduces the amplitude of the sine and ellipse
curves as a linear function of distance along the slip curve. In each of the asymmetric
curve fits there are then two variables of regression. For the triangle the two variables of
regression may be viewed as the slopes of the two lines that form the triangle, and it is
the parameter m and the amplitude of the ellipse and sine functions for the asymmetric
ellipse and asymmetric sine functions. Similar plots are provided for the digitized slip
distributions of all events in electronic supplement 3.
Each of the curve-fits may be characterized by a standard deviation about the
predicted value. Division of the standard deviation by the average value of the surface
slip distribution for the respective slip curves defines the coefficient of variation (COV)
along fault strike. The higher the value of COV, the poorer the curve-fit. The COVs of
the curve fits to each slip distribution are presented for comparison in Figure 10. The
solid symbols represent values for the asymmetric curve fits and the open symbols are
values for the flat line and symmetric sine and ellipse curves. The plots show that the
asymmetric functions consistently yield a better fit to the observations and the flat-line
consistently yields the worst fit. Among the various asymmetric curve fits, none provide
a consistently better fit to the data than the other. In sum, one may infer that surface slip
distributions are in general characterized by some degree of asymmetry, with the
recognition that the relatively better fit of the asymmetric functions overall is largely the
result of allowing the variation of two rather than one variable in the process of fitting
curves to the observations.
April 25, 2007 – submitted to BSSA – Aug 20 returned from BSSA – revised & resubmitted Oct. 18.&Dec20
9
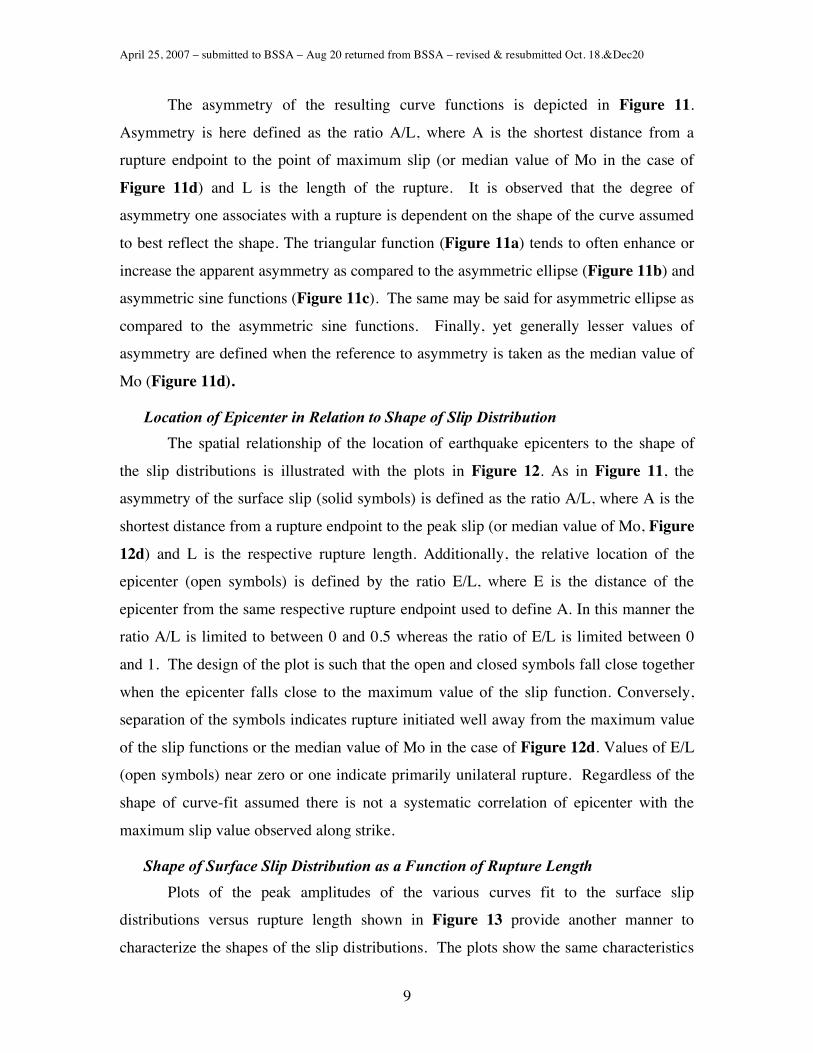
The asymmetry of the resulting curve functions is depicted in Figure 11.
Asymmetry is here defined as the ratio A/L, where A is the shortest distance from a
rupture endpoint to the point of maximum slip (or median value of Mo in the case of
Figure 11d) and L is the length of the rupture. It is observed that the degree of
asymmetry one associates with a rupture is dependent on the shape of the curve assumed
to best reflect the shape. The triangular function (Figure 11a) tends to often enhance or
increase the apparent asymmetry as compared to the asymmetric ellipse (Figure 11b) and
asymmetric sine functions (Figure 11c). The same may be said for asymmetric ellipse as
compared to the asymmetric sine functions. Finally, yet generally lesser values of
asymmetry are defined when the reference to asymmetry is taken as the median value of
Mo (Figure 11d).
Location of Epicenter in Relation to Shape of Slip Distribution The spatial relationship of the location of earthquake epicenters to the shape of
the slip distributions is illustrated with the plots in Figure 12. As in Figure 11, the
asymmetry of the surface slip (solid symbols) is defined as the ratio A/L, where A is the
shortest distance from a rupture endpoint to the peak slip (or median value of Mo, Figure
12d) and L is the respective rupture length. Additionally, the relative location of the
epicenter (open symbols) is defined by the ratio E/L, where E is the distance of the
epicenter from the same respective rupture endpoint used to define A. In this manner the
ratio A/L is limited to between 0 and 0.5 whereas the ratio of E/L is limited between 0
and 1. The design of the plot is such that the open and closed symbols fall close together
when the epicenter falls close to the maximum value of the slip function. Conversely,
separation of the symbols indicates rupture initiated well away from the maximum value
of the slip functions or the median value of Mo in the case of Figure 12d. Values of E/L
(open symbols) near zero or one indicate primarily unilateral rupture. Regardless of the
shape of curve-fit assumed there is not a systematic correlation of epicenter with the
maximum slip value observed along strike.
Shape of Surface Slip Distribution as a Function of Rupture Length Plots of the peak amplitudes of the various curves fit to the surface slip
distributions versus rupture length shown in Figure 13 provide another manner to
characterize the shapes of the slip distributions. The plots show the same characteristics

April 25, 2007 – submitted to BSSA – Aug 20 returned from BSSA – revised & resubmitted Oct. 18.&Dec20
10
as observed in the earlier plots of surface slip versus rupture length presented in Figures
7a and b. Specifically, the fewer number of normal and reverse earthquake data may be
fit by a straight line but the strike-slip earthquakes which cover a wider range of rupture
lengths cannot. The observations for the strike-slip earthquakes (or the data set when
taken as a whole) are better fit by curves that decrease in slope as a function of increasing
rupture length. The result is the same regardless of the slip function (e.g., asymmetric
sine or ellipse) assumed for each of the respective five plots.
Fault Trace Complexity and Earthquake Rupture Length Strike-Slip earthquakes Examining maps of the earthquake surface rupture trace and nearby active fault
traces that did not rupture during the earthquake such as shown for the 1968 Borrego
Mountain event (Figure 1a) provides a basis to examine the relationship between
earthquake rupture length and fault trace complexity. The 1968 earthquake rupture for
example (1) propagated across a 1.5 km restraining step, (2) stopped at a 2.5 km
restraining step or 7 km releasing step at its northwestern (left) limit, and (3) died at its
southeastern (right) limit in the absence of any geometrical discontinuity and at a point
where the active trace can be shown to continue uninterrupted for 20 km or more past the
end of the rupture. Figure 14 is a synopsis of the relationship between the length of
rupture and geometrical discontinuities for all strike-slip earthquakes listed in Table 1
and is largely the same as presented in Wesnousky (2006).
The vertical axis in Figure 14 is the dimension distance in kilometers. Each of the
strike-slip earthquakes listed in Table 1 is spaced evenly and ordered by increasing
rupture length along the horizontal axis. A dotted line extends vertically from each of the
labeled earthquakes. Various symbols that summarize the size and location of
geometrical steps within and at the endpoints of each rupture as well as where earthquake
ruptures have terminated at the ends of active faults are plotted along the dotted lines.
The symbols denote the dimension (km) of steps in surface rupture traces along strike or
the closest distance to the next mapped active fault from the terminus of the respective
ruptures. Separate symbols are used according to whether the steps are releasing or
restraining in nature, and whether they occur within (open squares and diamonds) or at
the endpoints of the rupture trace (large solid symbols). In certain instances, the
April 25, 2007 – submitted to BSSA – Aug 20 returned from BSSA – revised & resubmitted Oct. 18.&Dec20
11
endpoints of rupture are not associated with a discontinuity in fault strike, in which case
the endpoint of rupture is denoted by a separate symbol (gray circles) and annotated with
the distance that the active trace continues beyond the endpoint of rupture. As well, some
earthquakes show gaps in surface rupture along strike and these are depicted as small
solid dots. Because of the complexity of some ruptures and presence of subparallel and
branching fault traces, some earthquakes have more than two ‘ends’. Thus in the case of
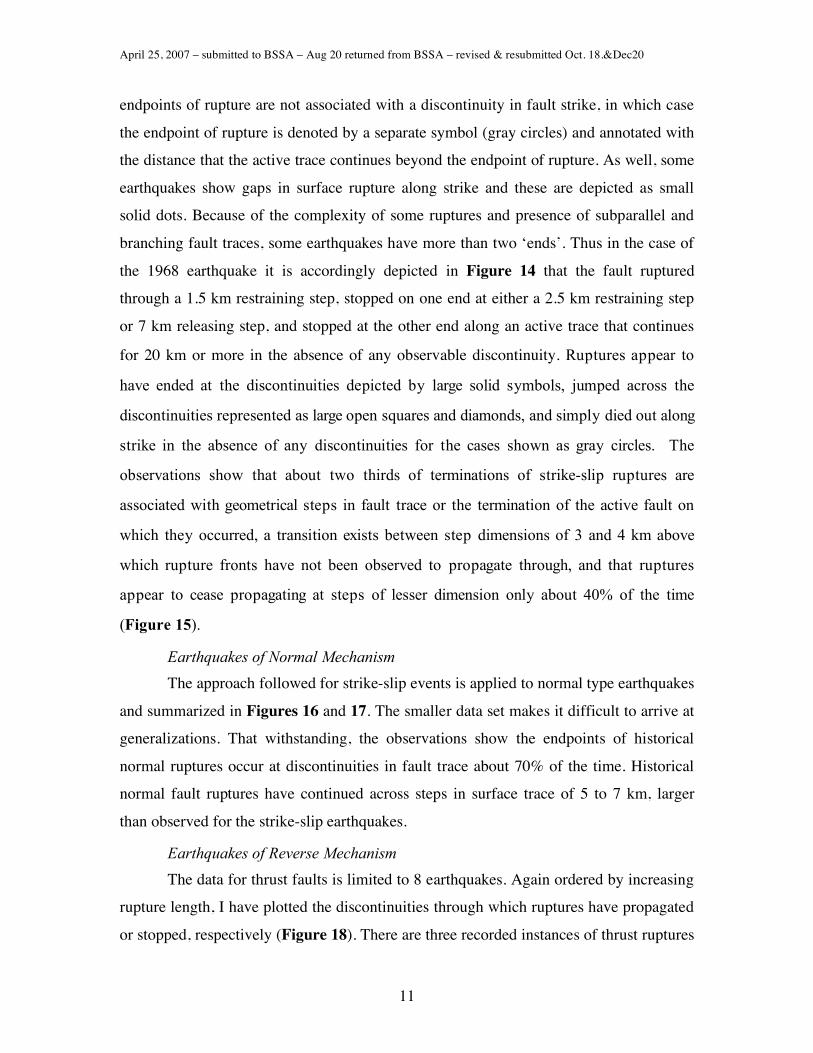
the 1968 earthquake it is accordingly depicted in Figure 14 that the fault ruptured
through a 1.5 km restraining step, stopped on one end at either a 2.5 km restraining step
or 7 km releasing step, and stopped at the other end along an active trace that continues
for 20 km or more in the absence of any observable discontinuity. Ruptures appear to
have ended at the discontinuities depicted by large solid symbols, jumped across the
discontinuities represented as large open squares and diamonds, and simply died out along
strike in the absence of any discontinuities for the cases shown as gray circles. The
observations show that about two thirds of terminations of strike-slip ruptures are
associated with geometrical steps in fault trace or the termination of the active fault on
which they occurred, a transition exists between step dimensions of 3 and 4 km above
which rupture fronts have not been observed to propagate through, and that ruptures
appear to cease propagating at steps of lesser dimension only about 40% of the time
(Figure 15).
Earthquakes of Normal Mechanism The approach followed for strike-slip events is applied to normal type earthquakes
and summarized in Figures 16 and 17. The smaller data set makes it difficult to arrive at
generalizations. That withstanding, the observations show the endpoints of historical
normal ruptures occur at discontinuities in fault trace about 70% of the time. Historical
normal fault ruptures have continued across steps in surface trace of 5 to 7 km, larger
than observed for the strike-slip earthquakes.
Earthquakes of Reverse Mechanism The data for thrust faults is limited to 8 earthquakes. Again ordered by increasing
rupture length, I have plotted the discontinuities through which ruptures have propagated
or stopped, respectively (Figure 18). There are three recorded instances of thrust ruptures
April 25, 2007 – submitted to BSSA – Aug 20 returned from BSSA – revised & resubmitted Oct. 18.&Dec20
12
propagating through mapped steps of 2 and 6 km dimension. In only one case is it clear
that rupture terminated in the absence of a discontinuity at the rupture endpoint. The
remaining cases appear to show termini associated with geometrical discontinuities,
though in several cases and particularly for the Australian earthquakes the mapping
available is insufficient to lend any confidence in the observation.
Implications and Applications Seismic Hazard
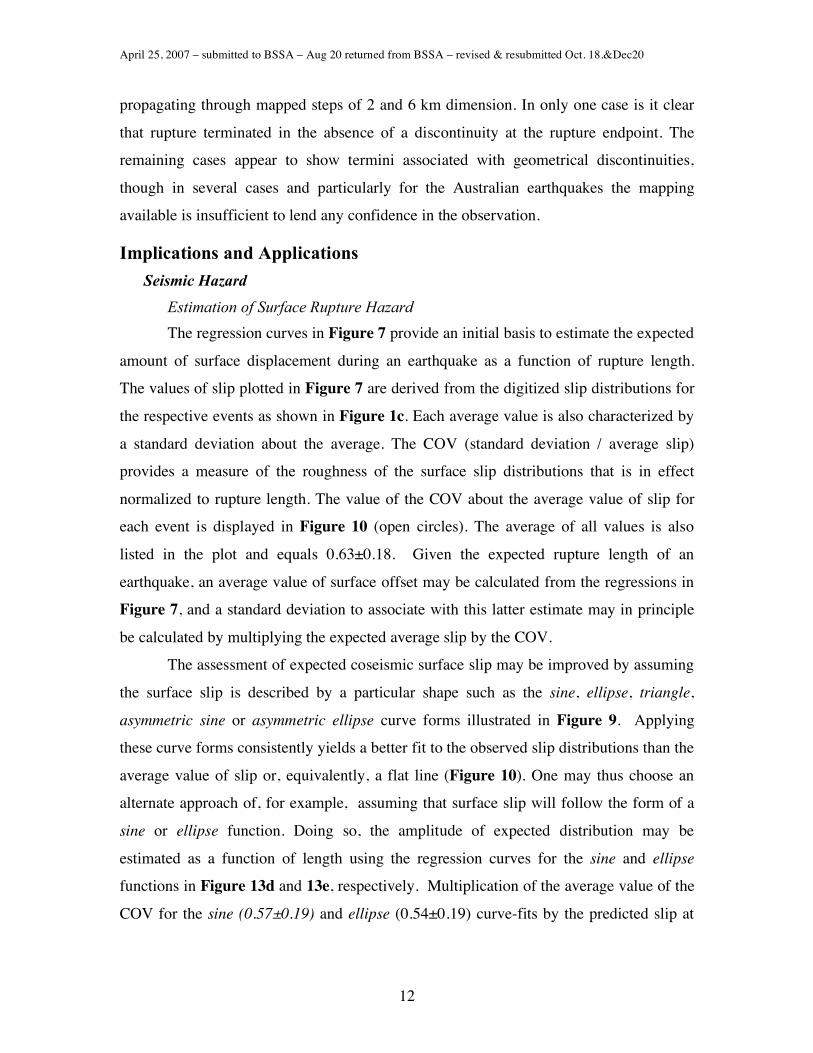
Estimation of Surface Rupture Hazard The regression curves in Figure 7 provide an initial basis to estimate the expected
amount of surface displacement during an earthquake as a function of rupture length.
The values of slip plotted in Figure 7 are derived from the digitized slip distributions for
the respective events as shown in Figure 1c. Each average value is also characterized by
a standard deviation about the average. The COV (standard deviation / average slip)
provides a measure of the roughness of the surface slip distributions that is in effect
normalized to rupture length. The value of the COV about the average value of slip for
each event is displayed in Figure 10 (open circles). The average of all values is also
listed in the plot and equals 0.63±0.18. Given the expected rupture length of an
earthquake, an average value of surface offset may be calculated from the regressions in
Figure 7, and a standard deviation to associate with this latter estimate may in principle
be calculated by multiplying the expected average slip by the COV.
The assessment of expected coseismic surface slip may be improved by assuming
the surface slip is described by a particular shape such as the sine, ellipse, triangle,
asymmetric sine or asymmetric ellipse curve forms illustrated in Figure 9. Applying
these curve forms consistently yields a better fit to the observed slip distributions than the
average value of slip or, equivalently, a flat line (Figure 10). One may thus choose an
alternate approach of, for example, assuming that surface slip will follow the form of a
sine or ellipse function. Doing so, the amplitude of expected distribution may be
estimated as a function of length using the regression curves for the sine and ellipse
functions in Figure 13d and 13e, respectively. Multiplication of the average value of the
COV for the sine (0.57±0.19) and ellipse (0.54±0.19) curve-fits by the predicted slip at

April 25, 2007 – submitted to BSSA – Aug 20 returned from BSSA – revised & resubmitted Oct. 18.&Dec20
13
any point along the fault length yields a standard deviation that may be attached to the
estimate.
The earthquake slip distributions are yet better fit by the use of curves that allow
an asymmetry in the slip distribution (Figure 10) and further reduction in the
uncertainties might be obtained by their use with the consideration that it would require
prior knowledge of the sense of asymmetry along the fault to rupture. That is knowledge
that is not generally available at this time.
A more formal approach than outlined here will incorporate both the uncertainties
attendant to the fitting of curves to the slip versus length data (e.g., Figures 7 and 13)
and the estimates of the Coefficients of Variation (e.g., Figures 9 and 10). That said, the
compilation and analysis of observations shows the feasibility of the approach, which is
the main intent here.
Estimating the Length of Future Earthquake Ruptures on Mapped Faults The distribution and lengths of active faults are generally fundamental input to
assessments of seismic hazard in regions of active tectonics (e.g., Albee and Smith, 1966;
Slemmons, 1977; Bonilla et al., 1984; Wesnousky et al., 1984; SCEC, 1994; Wells and
Coppersmith, 1994; Frankel and Petersen, 2002). Because the lengths of earthquake
ruptures are commonly less than the entire length of the mapped fault on which they
occur, the seismic hazard analyst may encounter the problem in deciding how to place
limits on the probable lengths of future earthquakes on the mapped active faults. It has
been noted previously that faults are not generally continuous but are commonly
composed of segments that appear as steps in map view and that these discontinuities
may play a controlling role in limiting the extent of earthquake ruptures (e.g., Segall and
Pollard, 1980; Sibson, 1985; Wesnousky, 1988). The data collected here and summarized
in Figure 14 show that about two-thirds of the endpoints of strike-slip earthquake
ruptures are associated with fault steps or the termini of active fault traces (Figure 15a),
and that there is a limiting dimension of fault step (3-4 km) above which earthquake
ruptures have not propagated and below which rupture propagations cease only about 40
percent of the time (Figure 15b). The variability of behavior for steps of dimension less
than 3-4 km in part reflects variability in the three-dimensional character of the
discontinuities mapped at the surface. The effect on rupture propagation may vary
April 25, 2007 – submitted to BSSA – Aug 20 returned from BSSA – revised & resubmitted Oct. 18.&Dec20
14
between steps of equal map dimension if, for example, the subsurface structures differ or
do not extend to equal depths through the seismogenic layer (e.g., Graymer et al., 2006;
Simpson et al., 2006). The approach and observations might be useful for placing
probabilistic bounds on the expected endpoints of future earthquake ruptures on mapped
active faults, given that detailed mapping of faults is available in the region of interest.
The observations are fewer for dip-slip earthquakes (Figures 16, 17 and 18). That
withstanding, the normal earthquake rupture endpoints appear to be associated with
discontinuities in mapped fault trace at about the same ~70% frequency as observed for
the strike-slip earthquakes (Figure 17). The data are too few to draw an analogous
generalization from the small number of reverse fault earthquakes. A comparison of the
dip-slip (Figure 16) to strike-slip earthquakes (Figure 14) shows the dip-slip events to
have ruptured through steps in map trace of 5-7 km, greater than observed for strike-slip
earthquakes. The larger value may simply reflect the dipping nature of the faults.
Mechanics of the Rupture Process Slip versus Length: Physical Implications Theoretical models of fault displacements in an elastic medium predict that the
stress drop Δσ resulting from slip S on a fault is of the form Δσ ≅ C∗S/W, where W is the
shortest dimension across the fault area and C is a shape factor generally near unity (e.g.,
Kanamori and Anderson, 1975). Analyses of instrumental recordings of earthquakes have
been the basis to interpret that stress drops for earthquakes are relatively constant and
limited to between 10 and 100 bars over the entire spectrum of observed earthquake sizes
(Kanamori and Anderson, 1975; Hanks, 1977). It is generally assumed that the limiting
depth of coseismic slip is equal to the depth extent of aftershocks or background
seismicity in the vicinity of the earthquakes. The earthquakes of Table 1 share a similar
seismogenic depth of about 12-15 km (Figure 2). It follows that earthquakes of constant
stress drop and rupture width will share a similar ratio of S/W. The systematic increase in
displacement S with rupture length observed in Figure 7 is thus in apparent conflict with
the constant stress drop hypothesis, a point first recognized by (Scholz, 1982a). A number
of observations and hypotheses have been brought forth to reconcile the issue.
Models of earthquake rupture conventionally impose the boundary condition that
coseismic slip be mechanically limited to zero at the base of the seismogenic layer. The

April 25, 2007 – submitted to BSSA – Aug 20 returned from BSSA – revised & resubmitted Oct. 18.&Dec20
15
observed increase in slip with length may be explained by modifying the boundary
condition such that coseismic slip is a rapid upward extension of displacement that has
accumulated below the seismogenic layer prior to the earthquake (Scholz, 1982a).
Physical fault models arising from such an explanation predict that the time for
displacement to occur at any point on a fault should be on the same order as the total
duration of faulting (Scholz, 1982b). The idea is not supported by dislocation time
histories of fault ruptures which are short compared to the overall duration of an
earthquake (Heaton, 1990). Today it appears to remain generally accepted that large
earthquake ruptures are the result of simple elastic failure whereby displacements are
limited to zero at the base of the seismogenic layer. Efforts to explain the enigmatic
increase of S with L generally invoke the idea that large earthquakes commence with
systematically larger stress drops or unusually large slip pulses relative to earthquakes of
lesser size (Heaton, 1990; Bodin and Brune, 1996), and thus have a tendency to
propagate over greater distances. Independent observations of the interaction of
earthquake ruptures and the geometry of faults presented here and in Wesnousky (2006)
are at odds with this latter idea. An alternate explanation is that the base of the
seismogenic zone does not result from the onset of viscous relaxation but rather a
transition to stable sliding in a medium that remains stressed at or close to failure and that
coseismic slip during large earthquakes may extend below the seismogenic layer. The
latter explanation is explored in more detail by King and Wesnousky (2007), satisfies
standard elastic models, and preserves the idea of constant stress drop in light of the
observed increase of S with L.
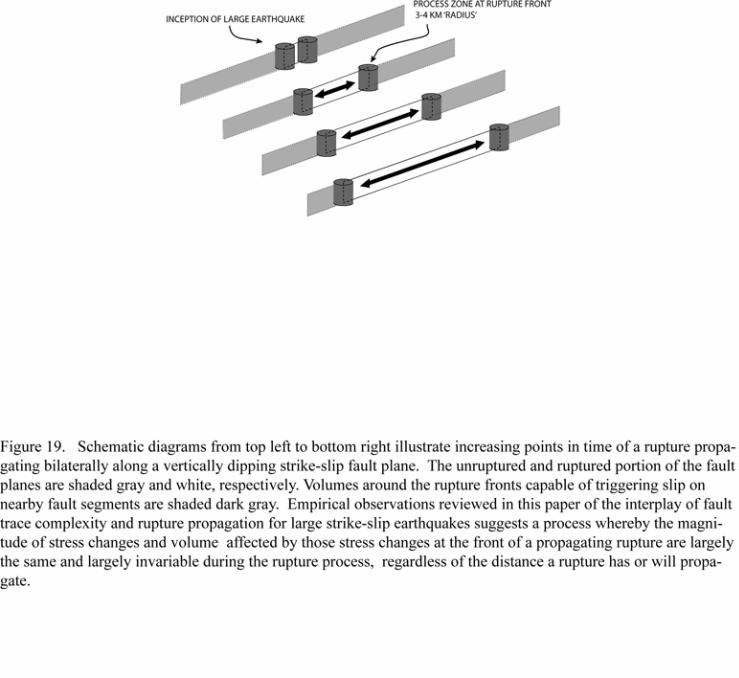
The Growth of Earthquake Ruptures The majority of coseismic slip during continental earthquakes is generally
concentrated in the upper 15 km of the earth’s crust. The length of strike-slip ruptures
considered here ranges from about 15 km to >400 km. The direction of rupture
propagation may be viewed as primarily horizontal for each event. Theoretical and
numerical models and observation support the idea of a causal association between fault
steps and the endpoints of earthquake ruptures (e.g., Segall and Pollard, 1980; Sibson,
1985; Wesnousky, 1988; Harris and Day, 1993; Harris and Day, 1999; Oglesby, 2005;
Duan and Oglesby, 2006). The synopsis of observations in Figure 14 shows that there is

April 25, 2007 – submitted to BSSA – Aug 20 returned from BSSA – revised & resubmitted Oct. 18.&Dec20
16
a transition in step-dimension at 3-4 km above which strike-slip faults appear not to
propagate and that the transition is largely independent of rupture length. The observation
leads me to think that the magnitude of stress changes and the volume effected by those
stress changes at the leading edge of propagating earthquake ruptures are similar at the
initial stages of rupture propagation and largely invariable during the rupture process
(Figure 19). The transition of 3-4 km in step width above which ruptures have not
propagated by analogy places a limit on the dimension of process zone or volume
significantly affected by stress changes at the rupture front. In this context, it appears that
variations in earthquake rupture lengths are not necessarily controlled by the relative size
of initial slip pulses or stress drops (e.g., Brune, 1968; Heaton, 1990) but rather by the
geometrical complexity of fault traces (e.g., Wesnousky, 1988) and variations in
accumulated stress levels along faults that arise due to the location of past earthquakes
(e.g., McCann et al., 1979).
The observations in Figure 12 which summarize the relationship between the
location of earthquake epicenters and the asymmetry of slip distributions also have
bearing on the topic of fault propagation. The observations show no systematic
correlation between the initiation point of an earthquake and the location of maximum
slip along fault trace. The result is independent of which asymmetric curve fit is used to
approximate the shape of the slip distributions and apparently at odds with observations
indicating that earthquake epicenters of subduction zone thrust earthquakes tend to locate
in or immediately adjacent to regions of high moment release (e.g., Thatcher, 1990).
Indeed, while one may examine the figure and point to a number of earthquakes where
the epicenter is spatially correlated to the peak of the slip distribution, there are numerous
events where the epicenter is spatially separated from the peak. The latter observation is
most evident for those events of unilateral rupture where the ratio E/L is close to 0 or 1. I
view the observation to indicate that patterns of slip are also not controlled by the relative
size of initial slip pulses but likely instead by variations in accumulated stress reflecting
variations in fault strength and accumulated stress along strike.
The Shape of Slip Distributions and Self-Similarity The exercise of fitting curves to the slip distributions (Figure 9) shows the
unsurprising result that better fits to the observations are obtained with the increase in

April 25, 2007 – submitted to BSSA – Aug 20 returned from BSSA – revised & resubmitted Oct. 18.&Dec20
17
freely adjustable variables used in the regressions. The average (i.e., flat-line), symmetric
(i.e., sine and ellipse), and asymmetric (i.e., asymmetric sine, asymmetric ellipse and
triangle) functions yield increasingly better fits to the observed slip distributions (Figure
10). Similarly, the asymmetric forms may be viewed as a better approximation to the
general shape of surface slip distributions. The degree of asymmetry that one observes in
fitting asymmetric functions to the slip distributions is dependent on the particular form
of the function (Figure 11). The assumption of a triangle function tends to exaggerate
the asymmetry as compared to the asymmetric sine or ellipse. The exaggeration results
because of the control of the assumed functions on the slope of the curve-fit near the
rupture endpoints. The scatter in values of asymmetry for the triangular and asymmetric
ellipse curves would argue against the suggestion that the slip curves are self-similar in
nature whereas the lessening of scatter in the value for the asymmetric sine fits might
allow it (Figure 11). The statistical differences in the triangle and asymmetric curve-fits
to the observations are insufficient to allow a resolution of the matter.
The systematic changes in slope attendant to the plots of the peak amplitudes of
the curves fit to the surface slip distributions versus rupture length shown in Figure 13
provide another manner to characterize the shapes of the surface slip distributions. The
plots show the same characteristics as observed in the earlier plots of average surface slip
versus rupture length (Figure 7). Specifically, the fewer normal and reverse earthquake
data may be fit by a straight line but the strike-slip earthquakes which cover a wider
range of rupture lengths cannot. The observations for the strike-slip earthquakes and the
entire data set overall are better fit by curves that decreases with slope as a function of
increasing rupture length. The suggestion has been put forth that earthquake slip
distributions are self-similar in form (e.g., Manighetti et al., 2005). The slope of the
curves in Figures 7 and 13 reflects the ratio of amplitude to length of the assumed slip
functions. In this regard, the ratios or in effect the shapes of the prescribed surface slip
distributions vary across the magnitude spectrum and may not be viewed as self similar.
Conclusions I have put forth a compilation of about 3 dozen historical earthquakes for which
there exist both maps of earthquake rupture traces and data describing the coseismic
surface slip observed along fault strike. The analysis presented here may be of use in the

April 25, 2007 – submitted to BSSA – Aug 20 returned from BSSA – revised & resubmitted Oct. 18.&Dec20
18
development and application of seismic hazard methodologies and placing bounds on
physical fault models meant to describe the earthquake source. In these regards,
observations provide the basis for a statistical approach to predicting the endpoints and
surface slip distribution of earthquakes on mapped faults. They also lend support to the
ideas that there exists a process zone at the edges of laterally propagating earthquake
ruptures of no more than about 3-5 km dimension within which stress changes may be
sufficient to trigger slip on adjacent faults, and that the ultimate length of earthquake
ruptures is controlled primarily by the geometrical complexity of fault traces and
variations in accumulated stress levels along faults that arise due to the location of past
earthquakes.
Acknowledgements
Thanks go to David Oglesby, Ivan Wong, and an anonymous reviewer for reviews
of the manuscript, Senthil Kumar for assisting with the collection of maps, and Thorne
Lay for clarifying the uncertainties attendant to the assumption of rigidity in the
calculation of seismic moment. Support for the research was provided by USGS NHERP
award 07HQGR0108 and supplemented by the Southern California Earthquake Center
which is funded by NSF Cooperative Agreement EAR-0106924 and USGS Cooperative
Agreement 02HQAG0008. SCEC contribution no. 1095. Center for Neotectonics
Contribution Number 52.

April 25, 2007 – submitted to BSSA – Aug 20 returned from BSSA – revised & resubmitted Oct. 18.&Dec20
19
Table 1: Geological Observations
Dat
e Lo
catio
n
#
Type
*
Leng
th(k
m)#
S++
Ave
rage
Net
Sl
ip (m
)
Smax
Max
Slip
(m
) D
epth
(km
)
Rig
idity
µ
1011
dyn/
cm2
Mog
1026
dyn-
cm
-Pog
1015
cm
3
Mw
g
Ref
eren
ce&
Not
es+
1857-1-9 San Andreas, CA 1 ssr 360 4.7 9.1 (12) 15 3 76 25.4 7.9 1 a
1887-5-3 Sonora, MX 2 n/60 70 2.2 4.1 15 3 8.0 2.7 7.2 2,3,48 b
1891-10-28 Neo-Dani, JPN 3 ssl 80 3.1 7.9 15 3 11.3 3.8 7.3 4 c
1896-8-31 Rikuu, JPN 4 r/45 37 2.5 [3.5] 6.2 [8.8] 15 3.0 8.2 2.7 7.2 5 d
1915-10-2 Pleasant Val, NV 5 n/45 61 1.8[2.6] 5.8[8.2] 15 3.1 10.3 3.4 7.3 6 e
1930-11-2 Kita-Izu, JPN 6 ssl 35 1.1 3.5 12 3.3 1.6 0.48 6.7 7 f
1939-12-25 Erzincan, TUR 7 ssr 300 4.2 7.4 13 3.2 52.5 16.4 7.7 8 g
1940-5-19 Imperial, CA 8 ssr 60 1.6 3.3 13 2.5 3.0 1.2 6.9 9 h
1942-12-20 Erbaa-Niksar, TUR 9 ssr 28 1.66 1.9 13 3.2 1.8 0.6 6.8 8 i
1943-11-26 Tosya, TUR 10 ssr 275 2.5 4.4 13 3.2 28.7 9.0 7.6 8 j
1943-9-10 Tottori, JPN 11 ssl 10.5 0.6 1.5 15 3.3 0.3 .09 6.3 10 k
1944-2-01 Gerede-Bolu, TUR 12 ssr 155 2.1 3.5 13 3.2 13.3 4.2 7.35 8 l
1945-1-31 Mikawa, JPN 13 r/30 4.0 1.3 2.1 8 3.0 0.24 .08 6.2 11 m
1954-12-16 Fairview Peak, NV 15 nssr
/60 62 1.1 5.2 15 3.0 3.5 1.2 7.0 13 n
1954-12-16 Dixie Valley, NV 16 n/60 47 0.8[0.9] 3.1[3.5] 12 3.0 1.76 0.6 6.8 13 t
1959-8-18 Hebgen Lake, MT
14 n/50 25 2.5 5.4 15 3.0 3.7 1.25 7.0 12 s
1967-7-22 Mudurnu, TUR 17 ssr 60 0.9 2.0 12 2.4 1.6 0.65 6.7 8 u
1968-4-8 Borrego Mtn, CA 18 ssr 31 .13 0.4 12 3.3 .16 0.05 6.1 14 v
1971-02-09 San Fernando, CA 19 r/45 15 0.95 2.5 15 3.4 1.0 0.30 6.7 59 ap
1979-6-02 Cadoux, AUS 20 r/35 10 0.6 1.2 6 3.2 0.20 .06 6.1 49 x
1979-10-15 Imperial V., CA 21 ssr 36 0.28-.41 0.6-.78 13 2.5 .33-.48 0.13-0.19 6.3-6.4 15,16 w
1980-10-10 El Asnam, Algeria 22 r/50 27.3 1.2 6.5 12 3.0 1.55 0.5 6.7 60 aq
1981-7-29 Sirch Iran 23 ss/69 64 .13 .50 15 3.3 0..4
3 .13 6.4 50 aj
1983-10-28 Borah Peak, ID 24 n/45 34 .94[1.3] 2.8[4.0] 14 3.2 2.9 0.89 6.9 17 y
1986-03-03 Marryat, AUS 25 r/35 13 .24(s)[.42]
0.26u[ 0.46] 0.70(s) [1.2]
0.8u[1.4] 3 3.2 .09(s) .10(u)
.03(s) 03(u)
5.9(s) 5.9(u) 46 z
1987-03-02 Edgecumbe, NZ 27 n/60 15.5 .0.6[0.7] 2.6[3.0] 10 2.6 0.33 .13 6.3 19 ao

April 25, 2007 – submitted to BSSA – Aug 20 returned from BSSA – revised & resubmitted Oct. 18.&Dec20
20
1987-11-23 Super. Hills, CA. 26 ssr 25 0.3 - 0.6 .5 - 1.1 12 2.5 .22 - .47 .09-.19 6.2-
6.4 18 aa
1988-01-22 Tennant Crk, AUS
28 r/45 30 0.7 [1.0] 1.8[2.5] 8 3.3 1.1 .34 6.6 43 ab
1990-07-16 Luzon, PHL 29 ssl 112 3.5 6.2 20 3.5 27.4 7.84 7.6 20,21 am
1992-06-28 Landers, CA 30 ssr 77 2.3 6.7 15 3.0 8.1 2.7 7.2 22 ac
1998-03-14 Fandoqa, IRN 31 ssn
/54 25 1.1 3.1 10 3.3 1.2 .36 6.6 50 ag
1999-09-21 Chi-Chi, Taiwan 32 r/70 72 3.5 [ 4.0] 12.7 [16.4] 20 3.0 18.4 6.1 7.4 23 ad
1999-08-17 Izmit, TUR 34 ssr 107
(145) 1.1 5.1 13 3.2 4.9 1.5 7.1 47 ae
1999-10-16 Hector Mine, CA.
33 ssr 44 1.56 5.2 12 3.0 2.5 0.82 6.9 57 an
1999-11-12 Duzce, TUR 35 ssr 40 2.1 5.0 13 3.2 3.5 1.1 7.0 24 af
2001-11-14 Kunlun, China 36 ssl 421 3.3 8.7 15 3.0 62.5 20.8 7.8 53 am
2001-11-14 (spot) Kunlun, China
36a ssl 428 2.4 8.3 15 3.0 46.8 15.6. 7.8 61 al
2002-11-03 Denali, AK 37 ssr 302 3.6 8.9 15 3.2 51.6 16.1 7.7 52 ak
*
Type of earthquake mechanism and dip. Right and left-lateral strike slip are ssr and ssl, respectively. Reverse and normal are r and n, respectively. Right-lateral normal oblique motion is nssr.
++ See Notes column for explanation of calculation for each event. When two values are given, value in square brackets is calculated net slip and other is for type of slip provided in original slip distribution.
# Digitized distance along fault rupture trace.
& See Table 3 for key to references.
+ See electronic supplement 4 for notes bearing on basis for assigning column values and location of epicenter
when plotted.

April 25, 2007 – submitted to BSSA – Aug 20 returned from BSSA – revised & resubmitted Oct. 18.&Dec20
21
Table 2: Seismological Observations
Moinst
_______________________________________ Po
inst __________________________
Dat
e Lo
catio
n
#
Type
MoB
OD
Y
1026
dyn
-cm
MoLO
NG
-PER
OD
1026
dyn
-cm
MoG
EOD
ETIC
1026
dyn
-cm
Ran
ge
1026
dyn
-cm
PoB
OD
Y
1015
cm
3
PoLO
NG
PER
OD
1015
cm
3
PoG
EOD
ETIC
1015
cm
3
Ran
ge
1015
cm
3
Ref
eren
ces
Not
es
1915-Oct-2 Pleasant Val, NV
5 n/60 2.7±0.6 (3.3)
2.7±0.6 .82 .82 27 be
1930-Nov-2 Kita-Izu, JPN
6 ssl 2.7(3.3) - .82 .82 56 bak
1940-May-19 Imperial, CA
8 ssr 2.3 (3.3) 3.0 (3*) 4.4 (3.3)
4.8 (3.3) 8.4 (3.3*)
5.3 ±3.1
.696 1.0 1.3
1.45 2.55
1.62±.92
42 bh
1943-Sep-10 Tottori, JPN
11 ssl 3.6 (3.35)
3.6 1.08 1.08 40 bk
1945-Jan-31 Mikawa, JPN
13 r 1(3) 1(2.5)
0.87(3) 0.94 ±.065
.33
.40 .29 .35±.05 41 bm
1959-Aug-18 Hebgen Lake, MT
14 n/500 10(3.3) 15(3) 13(3.23) 12.5±2.5 3.0 5.0 4.0 4.0 ±1.0
31 bs
1954-Dec-16 Fairview Peak, NV
15 nssr/60
5.5(3) 4.6(3.0) 5.05 ±0.45
1.83 1.53 1.68±.15
35 br
1954-Dec-16 Dixie Valley, NV
16 n/60 1.0(3.3) 2.2(3.0) 1.6±0.6 0.30 0.73 0.52 ±0.22
36 bt
1967-Jul-22 Mudurnu, TUR
17 ssr 8.8(3.3) 11 (2.4) 15(3*)
7.5(3*) 11.25 ±3.75
2.67 4.58 5.0
2.5 3.75 ±1.25
39 bu
1968-Apr-8 Borrego Mtn, CA
18 ssr .9(3) 1.1(3.4) 0.7(3.3) 1.2(3.8)
1.1(3*) 0.95 ±0.25
.3 .32 .21
.315
.37 .29 ±.08
28 bv
1971-2-09 San Fernando, CA
19 r/45 1.3(3*) 0.9(3.5) 1.7(3.3)
1.9(3*)
1.4 ±0.5
0.43 0.23 0.52
0.63 0.38±0.15
59 bam
1979-Jun-02 Cadoux, AUS
20 r/35 .15(3.2) 0.175(4.4) .163 ±.013,
.046 .040 .043 ±.0035
45 bx
1979-Oct-15 Imperial, CA
21 ssr 0.5(2.5) 0.5(2.5)
0.7(3*) .72(2.7)
0.61 ±0.11
.20, .20
.233
.267 .233
±.033 30 bw
1980-10-10 22 r/50 2.5(3) 2.5 0.83 60 ban

April 25, 2007 – submitted to BSSA – Aug 20 returned from BSSA – revised & resubmitted Oct. 18.&Dec20
22
El Asnam
1981-Jul-29 Sirch, IRAN
23 ss/54 3.7(3.3*) 9.0(4.4) 6.35 ±2.65
1.12 2.05 1.58 ±.046
50 bah
1983-Oct-28 Borah Peak, ID
24 n/60 2.1(3.3) 2.3(2.5)
3.5(3*), 3.1(2.7)
2.6(3.2) 2.9(3.2)
2.8 ±0.7
.64
.92 1.2 1.1
.81
.91 .90
±.27 29 by
1986-Mar-3 Marryat, AUS
25 r/35 .06(3.2) .06 .019 .019 45 bz
1987-Nov-23 Superstition Hills, CA.
26 ssr 0.5(3.3)0.8(1.8)0.2(2.3)
1.0(3*) 0.7(4.4)
0.9(2.8) 0.6±..4 .15 .44 .09
.33
.16 .32 .266
±.18 33 baa
1987-Mar-2 Edgecumbe, NZ
27 n/60 0.4(3.5)0.7(3.6)
0.9(3.6) 0.6(4.4)
0.65 ±0.25
.11
.19 .25 .14
.182 ±.067
34 bai
1988-Jan-22 Tennant Creek, AUS
28 r/45 1.6(3.3) 1.5(4.4) 1.55 ±.05
.48 .35 .41 ±.07
44 bab
1990-Jul-16 Luzon, PHL
29 ssl 36(4.0) 39(7.3) 41(4.4)
38.5 ±2.5
9.0, 5.3
9.3 7.3±2.0
32 baj
1992-Jun-28 Landers, CA
30 ssr 7(3*) 7.5(3)
8(3*) 10.6(4.4)
9(3.0) 10(3*)
8.8 ±1.8
2.3 2.5
2.7 2.4
3.0 3.3
2.8±0.5
25 bac
1998-Mar-14 Fandoqa, IRN
31 ssn 0.9 (3.3) 0.95 (4.4) 1.2(3.4) 1.05 ±0.15
.28 .22 .35 .284 ±.07
50 bag
1999-Sep-20 Chi-Chi, Taiwan
32 r/70 29(2.1) 41(3.0)
34(4.4) 27(3) 34±7 13.8 13.7
7.7 9.0 10.8±3.0
26 bad
1999-Oct-16 Hector Mine,CA
33 ssr 6.2(3*) 6.0(4.4) 6.8(3*) 5.9(3*) 7.0(3.)
6.45±0.55
2.1 1.4 2.3 2.0 2.3
1.8±0.45
58 bal
1999-Aug-17 Izmet, TUR
34 ssr 22(3.3 15(3.5)
28.8(4.4) 24(3.3) 18(3.3) 26(3.4)
21.9 ±6.9
6.7 4.3
6.6 7.3 5.4 7.7
5.97±1.7
38 bae
1999-Nov-12 Duzce, TUR
35 ssr 5.0(3*) 6.7H(4.4) 5.4(3.0) 5.4 ±1.3
1.67 1.52 1.80
1.66±.14
37 baf
2002-Nov-14 Kunlun, China
36 ssl 46(3) 50(3.0)
59(4.4) 71(3 *) 58.5 ±12.5
15.3, 16.7
13.4 23.6
18.5±5.1
55 bai
2002-Nov-03 Denali, AK
37 ssr 68(3.3) 38(3*) 49(3*) 56(3)
75(2.6) 56.5 ±18.5
20.1 12.7 16.3 18.7
28.8 20.7±8.1
54 baj
Notes: See electronic supplement 4 for notes and references bearing on assignment of rigidity. References: See Table 3.

April 25, 2007 – submitted to BSSA – Aug 20 returned from BSSA – revised & resubmitted Oct. 18.&Dec20
23
Table 3: References cited in Tables 1 and 2
1. (Sieh, 1978) , 2. (Bull and Pearthree, 2002), 3. (Pezzopane and Dawson, 1996), 4. (Matsuda, 1974),
5. (Matsuda et al., 1980), 6. (Wallace, 1980), 7. (Matsuda, 1972), 8. (Barka, 1996), 9. (Trifunac and Brune, 1970), 10. (Kaneda and Okada, 2002), 11. (Tsuya, 1946), 12. (Witkind, 1964), 13. (Caskey et al., 1996), 14. (Clark, 1972), 15. (Johnson and Hutton, 1982) , 16. (Sharp et al., 1982), 17. (Crone et al., 1987), 18. (Sharp et al., 1989), 19. (Beanland et al., 1989) , 20. (Nakata, 1990), 21. (Yomogida and Nakata, 1994), 22. (Sieh et al., 1993), 23. (Lin et al., 2001), 24. (Akyuz et al., 2002), 25. (Cohee and Beroza, 1994; Dreger, 1994; Freymueller, 1994; Johnson et al., 1994; Wald and Heaton, 1994), 26. (Chi et al., 2001; Wu et al., 2001; Zeng and Chen, 2001) , 27. (Doser, 1988), 28. (Hanks and Wyss, 1972; Burdick and Mellman, 1976; Heaton and Helmberger, 1977; Swanger et al., 1978; Ebel and Helmberger, 1982; Butler, 1983; Vidale et al., 1985), 29. (Hanks and Wyss, 1972; Doser and Smith, 1985; Tanimoto and Kanamori, 1986; Ward and Barrientos, 1986; Mendoza and Hartzell, 1988), 30. (Hartzell and Helmberger, 1982; Kanamori and Reagan, 1982; Hartzell and Heaton, 1983; Doser, 1990), 31. (Doser and Smith, 1985; Barrientos et al., 1987; Doser and Kanamori, 1987), 32. (Yoshida and Abe, 1992; Velasco et al., 1996), 33. (Dziewonki et al., 1989; Frankel and Wennerberg, 1989; Sipkin, 1989; Hwang et al., 1990; Wald et al., 1990; Larsen et al., 1992), 34. (Priestly, 1987; Anderson and Webb, 1989) , 35. (Doser, 1986; Hodgkinson et al., 1996), 36. (Doser, 1985; Hodgkinson et al., 1996), 37. (Burgmann et al., 2002; Umutlu et al., 2004), 38. (Delouis et al., 2002; Li et al., 2002; Sekiguchi and Iwata, 2002) , 39. (Hanks and Wyss, 1972; Stewart and Kanamori, 1982; Taymaz et al., 1991; Pinar et al., 1996) , 40. (Kanamori, 1973) , 41. (Ando, 1974; Kakehi and Iwata, 1992; Kikuchi et al., 2003) , 42. (Trifunac, 1972; Thatcher and Hanks, 1973; Reilinger, 1984; Doser and Kanamori, 1987; Doser, 1990) , 43. (Crone et al., 1992) , 44. (Choy and Bowman, 1990) , 45. (Fredrich et al., 1988) , 46. (Machette et al., 1993) , 47. (Barka et al., 2002) , 48. (Suter and Contreras, 2002) , 49.(Lewis et al., 1981) , 50. (Berberian et al., 2001) , 51. (Eberhart-Phillips et al., 2003) , 52. (Haeussler et al., 2005) , 53. (Lin et al., 2002; Xu et al., 2002; Klinger et al., 2005) , 54. (Choy and Boatwright, 2004; Frankel, 2004; Ozacar and Beck, 2004) , 55. (Antolik et al., 2004; Ozacar and Beck, 2004; Lasserre et al., 2005) , 56. (Abe, 1978), 57. (Treiman et al., 2002), 58. (Ji et al., 2002; Jonsson et al., 2002; Kaverina et al., 2002), 59. (Allen et al., 1971; Wyss, 1971; Allen et al., 1975; Langston, 1978; Heaton, 1982), 60. (Yielding et al., 1981), 61. (Klinger et al., 2006)
April 25, 2007 – submitted to BSSA – Aug 20 returned from BSSA – revised & resubmitted Oct. 18.&Dec20
24
References Abe, K. (1978). Dislocations, source dimensions and stresses associated with earthquakes
in the Izu Peninusula, Japan. Journal of Physics of the Earth, 26, 253-274. Aki, K. and Richards, P.G. (1980). Quantitative Seismology: Theory and Methods. W. H.
Freeman, San Francisco, California, 932 pp. Akyuz, H.S., Hartleb, R., Barka, A., Altunel, E., Sunal, G., Meyer, B. and Armijo, R.
(2002). Surface rupture and slip distribution of the 12 November 1999 Duzce Earthquake (M 7.1), North Anatolian Fault, Bolu, Turkey. Bulletin of Seismological Society of America, 92(1), 61-66.
Albee, A.L. and Smith, J.L. (1966). Earthquake characteristics and fault activity in southern California. In: R. Lung and R. Procter (Editors), Engineering Geology in Southern California. Association of Engineering Geologists, Glendale, Calif., pp. 9-33.
Allen, C.R., Engen, G.R., Hanks, T.C., Nordquist, J.M. and Thatcher, W.R. (1971). Main shock and larger aftershocks of the San Fernando earthquake, February 9 through March 1, 1971, The San Fernando, California, earthquake of February 9, 1971. U. S. Professional Paper 733, Washington, pp. 17-20.
Allen, C.R., Hanks, T.C. and Whitcomb, J.H. (1975). Seismological studies of the San Fernando earthquake and their tectonic implications, San Fernando, California, earthquake of 9 February 1971. Bulletin 196, California Division of Mines and Geology, pp. 257-262.
Anderson, H. and Webb, T. (1989). The rupture process of the 1987 Edgecumbe earthquake, New Zealand. New Zealand Journal of Geology and Geophysics, 32, 43-52.
Ando, M. (1974). Faulting in the Mikawa earthquake of 1945. Tectonophysics, 22, 173-186.
Antolik, M., Abercrombie, R.E. and Ekstrom, G. (2004). The 14 November 2001 Kokoxili (Kunlunshan), Tibet, earthquake: Rupture transfer through a large extensional step-over. Bulletin of the Seismological Society of America, 94(4), 1173-1194.
Barka, A. (1996). Slip distribution along the North Anatolian fault associated with the large earthquakes of the period 1939 to 1967. Bulletin of Seismological Society of America, 86, 1238-1254.
Barka, A., Akyuz, H.S., Altunel, E., Sunal, G., Cakir, Z., Dikbas, A., Yerli, B., Armijo, R., Meyer, B., de Chabalier, J.B., Rockwell, T., Dolan, J.R., Hartleb, R., Dawson, T., Christofferson, S., Tucker, A., Fumal, T., Langridge, R., Stenner, H., Lettis, W., Bachhuber, J. and Page, W. (2002). The surface rupture and slip distribution of the 17 August 1999 Izmit Earthquake (M 7.4), North Anatolian Fault. Bulletin of Seismological Society of America, 92(1), 43-60.
Barrientos, S.E., Stein, R.S. and Ward, S.N. (1987). Comparison of the 1959 Hebgen Lake, Montana and the 1983 Borah Peak, Idaho, earthquakes from geodetic observations. Bulletin of the Seismological Society of America, 77, 784-808.
April 25, 2007 – submitted to BSSA – Aug 20 returned from BSSA – revised & resubmitted Oct. 18.&Dec20
25
Beanland, S., Berryman, K.R. and Blick, G.H. (1989). Geological investigations of the 1987 Edgecumbe earthquake, New Zealand. New Zealand Journal of Geology and Geophysics, 32, 73-91.
Ben-Menahem, A. and Singh, S.J. (1981). Seismic waves and sources. Springer-Verlag, New York, 1108 pp.
Ben-Zion (2001). On quantification of the earthquake source. Seismological Research Letters, 72(2), 1551-152.
Berberian, M., Jackson, J.A., Fielding, E.J., Parsons, B.E., Priestly, K.F., Qorashi, M., Talebian, M., Walker, R., Wright, T.J. and Baker, C. (2001). The 1998 March 14 Fandoqa earthquake (Mw 6.6) in Kerman province, southeast Iran: re-rupture of the 1981 Sirch earthquake fault, triggering of slip on adjacent thrusts and the active tectonics of the Gowk fault zone. Geophy. J. Int., 146, 371-398.
Bodin, P. and Brune, J.N. (1996). On the scaling of slip with rupture length for shallow strike-slip earthquakes: Quasi-static models and dynamic rupture propagation. Bulletin of the Seismological Society of America, 86, 1292-1299.
Bonilla, M.G., Mark, R.K. and Leinkaemper, J.J. (1984). Statistical relations among earthquake magnitude, surface rupture, and surface fault displacement. Bulletin of the Seismological Society of America, 74, 2379-2411.
Brune, J.N. (1968). Seismic moment, seismicity, and rate of slip along major fault zones. Journal of Geophysical Research, 73, 777-784.
Bull, W.B. and Pearthree, P.A. (2002). Frequency and size of Quaternary surface ruptures of the Pitaycachi fault, northeastern Sonora, Mexico. Bulletin of the Seismological Society of America, 78, 956-978.
Burdick, L. and Mellman, G.R. (1976). Inversion of the body waves from the Borrego Mountain earthquake to source mechanism. Bulletin of the Seismological Society of America, 66, 1485-1499.
Burgmann, R., Ayhan, M.E., Fielding, E.J., Wright, T.J., McClusky, S., Aktug, B., Demir, C., Lenk, O. and Turkezer, A. (2002). Deformation during the 12 November 1999 Duzce, Turkey, earthquake, from GPS and InSAR data. Bulletin of the Seismological Society of America, 92, 161-171.
Butler, R. (1983). Surface wave analysis of the 9 April 1968 Borrego mountain earthquake. Bulletin of the Seismological Society of America, 73, 879-883.
Caskey, S.J., Wesnousky, S.G., Zhang, P. and Slemmons, D.B. (1996). Surface faulting of the 1954 Fairview Peak (Ms=7.2) and Dixie Valley (Ms=6.8) earthquakes, central Nevada. Bulletin of the Seismological Society of America, 86, 286-291.
Chi, W.C., Dreger, D. and Kaverina, A. (2001). Finite-source modeling of the 1999 Taiwan (Chi-Chi) earthquake derived from a dense strong-motion network. Bulletin of the Seismological Society of America, 91, 1144-1157.
Choy, G.L. and Boatwright, J. (2004). Radiated energy and the rupture process of the Denali fault earthquake sequence of 2002 from broadband teleseismic body waves. Bulletin of the Seismological Society of America, 94(6B), S269-S277.
Choy, G.L. and Bowman, J.R. (1990). Rupture process of a multiple main shock sequence; analysis of teleseismic, local, and field observations of the Tennant Creek, Australia, earthquakes of Jan 22, 1988. Journal of Geophysical Research, 95, 6867-6882.

April 25, 2007 – submitted to BSSA – Aug 20 returned from BSSA – revised & resubmitted Oct. 18.&Dec20
26
Clark, M.M. (Editor), (1972). Surface rupture along the Coyote Creek fault, the Borrego Mountain Earthquake of April 9, 1968, Professional Paper 787. United States Geological Survey, 55-86 pp.
Cohee, B.P. and Beroza, G.C. (1994). Slip distribution of the 1992 Landers earthquake and its implications for earthquake source mechanics. Bulletin of the Seismological Society of America, 84, 692-712.
Crone, A., Machette, M., Bonilla, D., Lienkamper, J., Pierce, K., Scott, W. and Bucknam, R. (1987). Surface faulting accompanying the Borah Peak earthquake and segmentation of the Lost River Fault, central Idaho. Bulletin of Seismological Society of America, 77, 739-770.
Crone, A.J., Machette, M.N. and Bowman, R.J. (1992). Geologic investigations of the 1988 Tennant Creek, Australia, Earthquakes - Implications for paleoseismicity in stable continental regions. United States Geological Survey Bulletin, 2032-A, A1-A51.
Delouis, B., Giardini, D., Lundgren, P. and Salichon, J. (2002). Joint inversion of InSAR, GPS, Teleseismic, and Strong-motion data for the spatial and temporal distribution of earthquake slip: application to the 1999 Izmit mainshock. Bulletin of the Seismological Society of America, 92, 278-299.
Doser, D.I. (1985). Source parameters and faulting processes of the 1959 Hebgen Lake, Montana, earthquake sequence. Journal of Geophysical Research, 90, 4537-4555.
Doser, D.I. (1986). Earthquake processes in the Rainbow Mountain-Fairview Peak-Dixie Valley, Nevada, region 1954-1959. Journal of Geophysical Research, 91, 12572-12586.
Doser, D.I. (1988). Source parameters of earthquakes in the Nevada seismic zone, 1915-1943. Journal of Geophysical Research, 93, 15001-15015.
Doser, D.I. (1990). Source characteristics of earthquakes along the southern San Jacinto and Imperial fault zones (1937 to 1954). Bulletin of the Seismological Society of America, 80, 1099-1117.
Doser, D.I. and Kanamori, H. (1987). Long period surface waves of four western United States earthquakes recorded by the Pasadena strainmeter. Bulletin of the Seismological Society of America, 77, 236-243.
Doser, D.I. and Smith, R.B. (1985). Source parameters of the 28 October 1983 Borah Peak, Idaho, earthquake from body wave analysis. Bulletin of the Seismological Society of America, 75, 1041-1051.
Dreger, D. (1994). Investigation of the rupture process of the 28 June 1992 Landers earthquake utilizing TERRAscope. Bulletin of the Seismological Society of America, 84, 713-724.
Duan, B. and Oglesby, D.D. (2006). Heterogeneous fault stresses from previous earthquakes and the effect on dynamics of parallel strike-slip faults. Journal of Geophysical Research, 111, doi:10.1029/2006JB004138.
Dziewonki, A.M., Ekstrom, G., woodhouse, J.H. and Zwart, G. (1989). Centroid-moment tensor solutions for October-December 1987. Physics of Earth and Planetary Interiors, 54, 10-21.
Ebel, J.E. and Helmberger, D.V. (1982). P-wave complexity and fault asperities: the Borrego Mountain, California, earhquake of 1968. Bulletin of the Seismological Society of America, 72, 413-437.

April 25, 2007 – submitted to BSSA – Aug 20 returned from BSSA – revised & resubmitted Oct. 18.&Dec20
27
Eberhart-Phillips, D., Haeussler, P.J., Freymueller, J.T., Franckel, A.D., Rubin, C.M., Craw, P., Ratchkovski, N.A., Anderson, G., Carver, G.A., Crone, A.J., Dawsson, T.E., Fletcher, H., Hansen, R., Harp, E.L., Harris, R.A., Hill, D.P., Hreinsdottiir, S., Jibson, R.W., Jones, L.M., Kayen, R., Keefer, D.K., Larsen, C.F., Moran, S.C., Personius, S.F., Plafker, G., Sherrod, B., Sieh, K., Sitar, N. and K., W.W. (2003). The 2002 Denali fault earthquake, Alaska: A large magnitude, slip-partitioned event. Science, 300, 1113-1118.
Frankel, A. (2004). Rupture process of the M 7.9 Denali fault, Alaska, earthquake: Subevents, directivity, and scaling of high-frequency ground motions. Bulletin of the Seismological Society of America, 94(6B), S234-S255.
Frankel, A. and Wennerberg, L. (1989). Ruture process of the Ms 6.6 Superstition Hills earthquake determined from strong-motion recordings: application of tomographic source inversion. Bulletin of the Seismological Society of America, 79, 515-541.
Frankel, A.D. and Petersen, M.D. (2002). Documentation for the 2002 update of the national seismic hazard maps. USGS Open-File Report, OF 02-0420(http://pubs.usgs.gov/of/2002/ofr-02-420), 33 pp.
Fredrich, J., McCaffrey, R. and Denham, D. (1988). Source parameters of seven large Australian earthquakes determined by body waveform inversion. Geophysical Journal of the Royal Astronomical Society, 95, 1-13.
Freymueller, J. (1994). The co-seismic slip distribution of the Landers earthquake. Bulletin of the Seismological Society of America, 84, 646-659.
Fuis, G.S. and Wald, L.A. (2003). Rupture in south-central Alaska - The Denali fault earthquake of 2002. U. S. G. S. Fact Sheet, 014-03(March), 4 p.
Graymer, R.W., Langenheim, V.E., Simpson, R.W., Jachens, R.C. and Ponce, D.A. (2006). Relatively simple throughgoing fault planes at large earthquake depth may be concealed by surface complexity in stepover regions. submitted for special volume of Geological Society of London preprint and personal communication.
Haeussler, P.J., Schwartz, D.P., Dawson, T., Stenner, H., Lienkaemper, J.L., Sherrod, B., Cinti, F.R. and Montone, P. (2005). Surface rupture and slip distribution of the Denali and Totschunda faults in the 3 November 2002 M7.9 earthquake, Alaska. Bulletin of the Seismological Society of America, 94(6B), S23-252.
Hanks, T.C. (1977). Earthquake stress drops, ambient tectonic stresses and stresses that drive plate motion. Pageoph, 115, 441-458.
Hanks, T.C. and Wyss, M. (1972). The use of body-wave spectra in determination of seismic-source parameters. Bulletin of the Seismological Society of America, 62, 561-589.
Harris, R.A. and Day, S.M. (1993). Dynamics of fault interaction - parallel strike-slip faults. Journal of Geophysical Research, 18, 4461-4472.
Harris, R.A. and Day, S.M. (1999). Dynamic 3D simulations of earthquakes on en echelon faults. Geophysical Research Letters, 98, 2089-2092.
Hartzell, S.H. and Heaton, T. (1983). Inversion of strong groundmotion and teleseismic waveform data for the fault rupture history of the 1979 Imperial Valley, California, earthquake sequence. Bulletin of the Seismological Society of America, 73, 1553-1584.
April 25, 2007 – submitted to BSSA – Aug 20 returned from BSSA – revised & resubmitted Oct. 18.&Dec20
28
Hartzell, S.H. and Helmberger, D.V. (1982). Strong-motion modeling of the Imperial Valley earthquake of 1979. Bulletin of the Seismological Society of America, 72, 571-596.
Heaton, T. and Helmberger, D.V. (1977). A study of the strong ground motion of the Borrego Mountain, California earthquake. Bulletin of the Seismological Society of America, 67, 315-330.
Heaton, T.H. (1982). The 1971 San Fernando earthquake: a double event? Bulletin of Seismological Society of America, 72, 2037-2062.
Heaton, T.H. (1990). Evidence for and implication of self-healing pulses of slip in earthquake rupture. Physics of the Earth and Planetary Interiors, 64, 1-20.
Hodgkinson, K.M., Stein, R.S. and Marshall, G. (1996). Geometry of the 1954 Fairview Peak-Dixie Valley earthquake sequence from a joint inversion of leveling and triangulation data. Journal of Geophysical Research, 101, 25437-25457.
Hwang, L.J., Magistrale, H. and Kanamori, H. (1990). Teleseismic source parameters and rupture characteristics of the 24 November 1987, Superstition Hills earthquake. Bulletin of the Seismological Society of America, 80, 43-56.
Ji, C., Wald, D.J. and Helmberger, D.V. (2002). Source description of the 1999 Hector Mine, California, earthquake, Part I: Wavelet domain inversion theory and resolution analysis. Bulletin of the Seismological Society of America, 92(4), 192-1207.
Johnson, C.E. and Hutton, L.K. (1982). Aftershocks and Preearthquake Seismicity in The Imperial Valley California, Earthquake of October 15, 1979. United States Geological Survey Professional Paper, 1254, 59-76.
Johnson, H.O., Agnew, D.C. and Hudnut, K. (1994). Extremal bounds on earthquake movement from geodetic data - application to the Landers earthquake. Bulletin of the Seismological Society of America, 84, 660-667.
Jonsson, S., Zebker, H., Segall, P. and Amelung, F. (2002). Fault slip distribution of the 1999 Mw 7.1 Hector Mine, California earthquake, estimated from satellite radar and gps measurements. Bulletin of the Seismological Society of America, 92(4), 1377-1389.
Kakehi, Y. and Iwata, T. (1992). Rupture process of the 1945 Mikawa earthquake as determined from strong ground motion records. Journal of Physics of the Earth, 40, 635-655.
Kanamori, H. (1973). Mode of strain release associated with major earthquakes in Japan. Annual Review of Earth and Planetary Sciences, 1, 213-239.
Kanamori, H. and Anderson, D. (1975). Theoretical basis of some empirical relations in seismology. Bulletin of Seismological Society of America, 65, 1073-1096.
Kanamori, H. and Reagan, J. (1982). Long-period surface waves. U.S. Geological Survey Professional Paper, 1254, 55-58.
Kaneda, H. and Okada, A. (2002). Surface rupture associated with the 1943 Tottori earthquake: compilation of previous reports and its tectonic geomorphological implications. Active Fault Research, 21, 73-91 (in Japanese with English Abstract).
Kaverina, A., Dreger, D. and Price, E. (2002). The combined inversion of seismic and geodetic data for the source process of the 16 October 1999 Mw 7.1 Hector Mine, earthquake. Bulletin of the Seismological Society of America, 92(4), 1266-1280.
April 25, 2007 – submitted to BSSA – Aug 20 returned from BSSA – revised & resubmitted Oct. 18.&Dec20
29
Kikuchi, M., Nakamura, M. and Yoshikawa, K. (2003). Source rupture processes of the 1944 Tonankai earthquake and the 1945 Mikawa earthquake derived from low-gain seismograms. Earth Planets and Space, 55, 159-172.
King, G.C.P. and Wesnousky, S.G. (2007). Scaling of fault parameters for continental strike-slip earthquakes. Bulletin of Seismological Society of America, 97(6), 1833-1840.
Klinger, Y., Michel, R. and King, G.C.P. (2006). Evidence for an earthquake barrier model from Mw~7.8 Kokozili (Tibet) earthquake slip distribution. Earth and Planetary Science Letters, 242, 354-364.
Klinger, Y., Xu, X., Tapponier, P., Van der Woerd, J., Lasserre, C. and King, G.C.P. (2005). High-resolution satellite imagery mapping of the surface rupture and slip distribution of the Mw ~7.8, 114 November 2001 Kokoxili earthquake, Kunlun fault, northern Tibet, China. Bulletin of the Seismological Society of America, 95, 1970-1987.
Kramer, S.L. (1996). Geotechnical earthquake engineering. Prentice Hall, Upper Saddle River, N. J., 653 pp.
Langston, C.A. (1978). The February 9, 1971 San Fernando earthquake: A study of source finiteness in teleseismic body waves. Bulletin of Seismological Society of America, 68, 1-29.
Langston, C.A. (1987). Depth of faulting during the 1968 Meckering, Australia, earthquake sequence determined from wave form analysis of local seismograms. Journal of Geophysical Research, 92, 11561-11574.
Larsen, S., Reilinger, R., Neugebauer, H. and Strange, W. (1992). Global positioning system measurements of deformations associated with the 1987 Superstition Hills earthquake. Journal of Geophysical Research, 97, 4885-4902.
Lasserre, C., Peltzer, G., Crampe, F., Klinger, Y., Van der Woerd, J. and Tapponnier, P. (2005). Coseismic deformation of the 2001 M-w=7.8 Kokoxili earthquake in Tibet, measured by synthetic aperture radar interferometry. Journal of Geophysical Research-Solid Earth, 110(B12).
Lewis, J.D., Daetwyler, N.A., Bunting, J.A. and Moncrieff, J.S. (1981). The Cadeaux earthquake, 2 June 1979. Geological Survey of Western Australia, Report 11, 134 pp.
Li, X., Cormier, V. and Toksoz, M.N. (2002). Complex source process of the 17 August 1999 Izmit, Turkey, earthquake. Bulletin of the Seismological Society of America, 92, 267-277.
Lin, A., Bihong, F., Guo, J., Zeng, Q., Dang, G., He, W. and Zhao, Y. (2002). Co-seismic strike-slip and rupture length produced by the 2001 Ms 8.1 central Kunlun earthquake. Science, 296, 2015-2017.
Lin, A., Ouchi, T., Chen, A. and Maruyama, T. (2001). Co-seismic displacements, folding and shortening structures along the Chelungpu surface rupture zone occurred during the 1999 Chi-Chi (Taiwan) earthquake. Tectonophysics, 330, 225-244.
Machette, M.N., Crone, A.J. and Bowman, J.R. (1993). Geologic investigations of the 1986 Marryat Creek, Australia, earthquake - implications for paleoseismicity in stable continental regions. United States Geological Survey Bulletin, 2032 B, p. 29p.

April 25, 2007 – submitted to BSSA – Aug 20 returned from BSSA – revised & resubmitted Oct. 18.&Dec20
30
Manighetti, I., Campillo, M., Sammis, C., Mai, P.M. and King, G. (2005). Evidence for self-similar, triangular slip distributions on earthquakes: Implications for earthquake fault mechanics. Journal of Geophysical Research, 110(B05302), doi:10.1029/2004JB003174.
Matsuda, T. (1972). Surface faults associated with Kita-Izu Earthquake of 1930 in Izu Peninsula, Japan. In: M. Hoshino and H. Aoki (Editors), Izu Peninsula. Tokai University Press, Tokyo, pp. 73-102.
Matsuda, T. (1974). Surface faults associated with Nobi (Mino-Owari) Earthquake of 1891, Japan. Bulletin of Earthquake Research Institute, University of Tokyo, 13, 127-162.
Matsuda, T., Yamazaki, H., Nakata, T. and Imaizumi, T. (1980). The surface faults associated with the Rikuu Earthquake of 1896. Bulletin of Earthquake Research Institute, University of Tokyo, 55, 795-855.
McCann, W.R., Nishenko, S.P., Sykes, L.R. and Krause, J. (1979). Seismic gaps and plate tectonics: seismic potential for major boundaries. Pageoph, 117, 1082-1147.
Mendoza, C. and Hartzell, S.H. (1988). Inversion for slip distribution using teleseismic P waveforms: North Palm Springs, Borah Peak, and Michoacan earthquakes. Bulletin of the Seismological Society of America, 78, 1092-1111.
Nakata, T. (1990). Surface faulting associated with the Philippine earthquake of 1990 (in Japanese). Journal of Geography, 99(5), 95-112.
Oglesby, D.D. (2005). The dynamics of strike-slip step-overs with linking dip-slip faults. Bulletin of the Seismological Society of America, 95, 1604-1622.
Ozacar, A.A. and Beck, S.L. (2004). The 2002 Denali fault and 2001 Kunlun fault earthquakes: Complex rupture processes of two large strike-slip events. Bulletin of the Seismological Society of America, 94(6), S278-S292.
Petersen, M.D. and Wesnousky, S.G. (1994). Fault slip rates and earthquake histories for active faults in southern California. Bulletin of the Seismological Society of America, 84, 1608-1649.
Pezzopane, S.K. and Dawson, T.E. (1996). Fault displacement hazard: A summary of issues and information. In: J.W. Whitney (Editor), Seismotectonic Framework and Characterization of Faulting at Yucca Mountain, pp. 9-1 - 9-160.
Pinar, A., Hohkura, Y. and Kikuchi, M. (1996). A rupture model for the 1967 Mudurnu Valley, Turkey earthquake and its implication for seismotectonics in the western part of the North Anatolian fault zone. Geophysical Research Letters, 23, 29-32.
Press, W.H., Teukolsky, S.A., Vetterliing, W.T. and Flannnery, B.P. (1992). Numerical recipes in Fortran: An art of scientific computing. Cambridge University Press, 963 pp.
Priestly, K.F. (1987). Source parameters of the 1987 Edgecumbe earthquake, New Zealand. New Zealand Journal of Geology and Geophysics, 32, 53-59.
Reilinger, R. (1984). Coseismic and postseismic vertical movements associated with the 1940 M 7.1 Imperial Valley, California, earthquake. Journal of Geophysical Research, 89(4531-4538).
Romanowicz, B. (1994). Comment on "A reappraisal of large earthquake scaling". Bulletin of the Seismological Society of America, 84(1675-1676).

April 25, 2007 – submitted to BSSA – Aug 20 returned from BSSA – revised & resubmitted Oct. 18.&Dec20
31
Rowland, J.V. and Sibson, R.H. (2004). Structural controls on hydrothermal flow in a segmented rift system, Taupo Volcanic Zone, New Zealand. Geofluids, 4, 259-283.
SCEC, W.G. (1994). Seismic hazards in southern California: Probable earthquakes, 1994-2024. Bulletin of the Seismological Society of America, 85, 379-439.
Scholz, C. (1982a). Scaling laws for large earthquakes: consequences for physical models. Bulletin of Seismological Society of America, 72, 1-14.
Scholz, C. (1982b). Scaling relations for strong ground motion in large earthquakes. Bulletin of Seismological Society of America, 72, 1903-1909.
Scholz, C.H. (1994). Reply to comment on "A reappraisal of large earthquake scaling". Bulletin of the Seismological Society of America, 84, 1677-1678.
Segall, P. and Pollard, D.D. (1980). Mechanics of discontinuous faults. Journal of Geophysical Research, 85, 4337-4350.
Sekiguchi, H. and Iwata, T. (2002). Rupture process of the 199 Kocaeli, Turkey, earthquake estimated from strong motion waveforms. Bulletin of the Seismological Society of America, 92, 300-311.
Sharp, R., Budding, K., Boatwright, J., Ader, M., Bonilla, M., Clark, M., Fumal, T., Harms, T., Lienkaemper, J., Morton, D., O’Neill, B., Ostergren, C., Ponti, D., Rymer, M., Saxton, J. and Sims, J. (1989). Surface faulting along the Superstition Hills fault zone and nearby faults associated with the earthquakes of 24 November 1987. Bulletin of Seismological Society of America, 79, 252-281.
Sharp, R., Lienkamper, J., Bonilla, D., Burke, D., Fox, B., Herd, D., Miller, D., Morton, D., Ponti, D., Rymer, J., Tinsley, J. and Yount, J. (1982). Surface faulting in the Central Imperial Valley in 'The Imperial Valley California, Earthquake of October 15, 1979. United States Geological Survey Professional Paper, 1254.
Sibson, R.H. (1985). Stopping of earthquake ruptures at dilational fault jogs. Nature, 316(6025), 248-251.
Sieh, K., Jones, L., Hauksson, E., Hudnut, K., Eberhart, P., Heaton, T., Hough, T., Hutton, L., Kanamori, H., Lilje, A., Lindvall, S., McGill, S., Mori, J., Rubin, C., Spotila, J., Stock, J., Thio, H., Treiman, J., Wernicke, B. and Zachariasen, J. (1993). Near-field investigations of the Landers earthquake sequence, April to July 1992. Science, 260, 171-176.
Sieh, K.E. (1978). Slip along the San Andreas Fault associated with the great 1857 earthquake. Bulletin of the Seismological Society of America, 68, 1421-1448.
Simpson, R.W., Barall, M., Langbein, J., Murray, J.R. and Rymer, M.J. (2006). San Andreas fault geometry in the Parkfield, California region. Bulletin of Seismological Society of America, in press.
Sipkin, S.A. (1989). Moment-tensor solutions for the 24 November 1987 Superstition Hills, California earthquake. Bulletin of the Seismological Society of America, 79, 493-499.
Slemmons, D.B. (1977). State of the art for assessing earthquake hazards in the United States: Determination of the design earthquake magnitude from fault length and maximum displacement data, U. S. Army Eng. Waterways Exp. Station, Vicksburg, Miss.
Stewart, G.S. and Kanamori, H. (1982). Complexity of rupture in large strike-slip earthquakes in Turkey. Physics of Earth and Planetary Interiors, 28, 70-84.
April 25, 2007 – submitted to BSSA – Aug 20 returned from BSSA – revised & resubmitted Oct. 18.&Dec20
32
Suter, M. and Contreras, J. (2002). Active tectonics of northeastern Sonora, Mexico (southern Basin and Range Province) and the 3 May 1887 Mw 7.4 Earthquake. Bulletin of the Seismological Society of America, 92, 581-589.
Swanger, H.J., Boore, D.M. and 1978 (1978). Simulation of strong-motion displacements using surface-wave modal superposition. Bulletin of the Seismological Society of America, 68, 907-922.
Tanimoto, T. and Kanamori, H. (1986). Linear programming approach to moment tensor inversion of earthquake sources and some tests on the three-dimensional structure of the upper mantle. Geophy. J. R. Astron. Soc., 84, 413-430.
Taymaz, T., Jackson, J.A. and McKenzie, D. (1991). Active tectonics of the north and central Aegean Sea. Geophy. J. Int., 108, 589-603.
Thatcher, W. (1990). Order and diversity in the modes of Circum-Pacific earthquake recurrence. Journal of Geophysical Research, 95, 2609-2623.
Thatcher, W. and Hanks, T.C. (1973). Source parameters of southern California earthquakes. Journal of Geophysical Research, 78, 8547-8576.
Treiman, J., Kendrick, K.J., Bryant, W.A., Rockwell, T.K. and McGill, S.F. (2002). Primary surface rupture associated with the Mw 7.1 16 October 1999 Hector Mine earthquake, San Bernardino County, California. Bulletin of the Seismological Society of America, 92(4), 1171-1191.
Trifunac, M.D. (1972). Tectonic stress and the source mechanism of the Imperial Valley, California, earthquake of 1940. Bulletin of the Seismological Society of America, 62, 1283-1302.
Trifunac, M.D. and Brune, J. (1970). Complexity of energy release during the Imperial Valley, California, earthquake of 1940. Bulletin of Seismological Society of America, 60, 137-160.
Tsuya, K. (1946). The Fukozu fault. A remarkable earthquake fault formed during the Mikawa earthquake of January 13, 1945. Bull. Earthquake Research Institute, Tokyo University, 24, 59-76 (in Japanese with English abstract).
Umutlu, N., Koketsu, K. and Milkereit, C. (2004). The rupture process during the 1999 Duzce, Turkey, earthquake from joint inversion of teleseismic and strong-motion data. Tectonophysics, 391, 315-324.
Velasco, A.A., Ammon, J.J., Lay, T. and Hagerty, M. (1996). Rupture process of the 1990 Luzon, Phillippines (Mw=7.7) earthquake. Journal of Geophysical Research, 101, 22419-22434.
Vidale, J., Helmberger, D.V. and Clayton, R.W. (1985). Finite difference seismograms for SH waves. Bulletin of the Seismological Society of America, 75, 1765-1782.
Wald, D.J. and Heaton, T. (1994). Spatial and temporal distribution of slip for the 1992 Landers, California, earthquake. Bulletin of the Seismological Society of America, 84, 668-691.
Wald, D.J., Helmberger, D.V. and Hartzell, S.H. (1990). Rupture process of the 1987 Superstition Hills earthquake from the inversion of strong-motion data. Bulletin of the Seismological Society of America, 80, 1079-1098.
Wallace, R.E. (1980). Map of fault scarps formed during earthquake of October 2, 1915, Pleasant Valley, Nevada, and other young fault scarps, U.S. Geological Survey Open File Report. U. S. Geological Survey, Reston, VA.

April 25, 2007 – submitted to BSSA – Aug 20 returned from BSSA – revised & resubmitted Oct. 18.&Dec20
33
Ward, S.N. and Barrientos, S.E. (1986). An inversion for slip distribution and fault shape from geodetic observations of the 1983 Borah Peak, Idaho, earthquake. Journal of Geophysical Research, 91, 4909-4919.
Wells, D.L. and Coppersmith, K.J. (1994). New empirical relationships among magnitude rupture length, rupture width, rupture area, and surface displacement. Bulletin of Seismological Society of America, 75, 939-964.
Wesnousky, S. (1988). Seismological and structural evolution of strike-slip faults. Nature, 335(6188), 340-342.
Wesnousky, S.G. (1986). Earthquakes, Quaternary faults, and seismic hazard in California. Journal of Geophysical Research, 91, 12,587-12,631.
Wesnousky, S.G. (2006). Predicting the endpoints of earthquake ruptures. Nature, 444(16), 358-360.
Wesnousky, S.G., Scholz, C.H., Shimazaki, K. and Matsuda, T. (1984). Integration of geological and seismological data for the analysis of seismic hazard: A case study of Japan. Bulletin of the Seismological Society of America, 74, 687-708.
Witkind, I. J. (1964). Reactivated faults north of Hebgen Lake. U.S. Geological Survey Professional Paper, 435-G, 37-50.
Wu, C.J., Takeo, M. and Ide, S. (2001). Source process of the Chi-Chi earthquake: a joint inversion of strong motion data and global positioning system data with multifault model. Bulletin of the Seismological Society of America, 91, 1128-1143.
Wyss, M. (1971). Preliminary source parameter determination of the San Fernando earthquake, The San Fernando, California, earthquake of February 9, 1971. U. S. Government Printing Office, Washington, pp. 38-40.
Xu, X., Chen, W., Ma, W., Yu, G. and Chen, G. (2002). Surface rupture of the Kunlunshan earthquake (Ms 8.1), northern Tibetan plateau, China. Seismological Research Letters, 73(6), 884-892.
Yielding, G., Jackson, J.A., King, G.C.P., Sinvhal, H., Vita-Finzi, C. and Wood, R.M. (1981). Relations between surface deformation, fault geometry, seismicity, and rupture characteristics during the El Asnam (Algeria) earthquake of 10 October 1980. Earth and Planetary Science Letters, 56, 287-304.
Yomogida, K. and Nakata, T. (1994). Large slip velocity of the surface ruptures associated with the 1990 Luzon earthquake. Geophysical Research Letters, 21, 1799-1802.
Yoshida, Y. and Abe, K. (1992). Source Mechanism of the Luzon, Philippines earthquake of July 16, 1990. Geophysical Research Letters, 19, 545-548.
Zeng, Y. and Chen, C.H. (2001). Fault rupture process of the 20 September 1999 Chi-Chi, Taiwan earthquake. Bulletin of the Seismological Society of America, 91, 1088-1098.
April 25, 2007 – submitted to BSSA – Aug 20 returned from BSSA – revised & resubmitted Oct. 18.&Dec20
34
Figure Captions Figure 1. Illustration of data synthesis and analysis. (A) Map of 1968 Borrego Mountain
earthquake rupture trace shown as bold lines. Adjacent and continuing traces of active faults that did not rupture during the earthquake are shown as thinner dotted lines. Also annotated are the dimensions of fault steps measured approximately perpendicular to fault strike and the distance to the nearest neighboring fault from the 1968 rupture endpoints. (B) Geologic measurements of surface slip along the rupture trace. (C) Plot of digitization of slip curve showing both field measurements (large circles) and interpolated values (small solid circles). Similarly annotated maps and plots for all earthquakes used in study (Table 1) are compiled in Electronic Supplement 1. Reference to map and slip curve sources are given in Table 1.
Figure 2. Rupture width as a function of (A) rupture length and (B) geologic moment
and (C) instrumentally derived seismic moment for events in Table 1. The 1945 Mikawa (13) and 1999 Izmit (34) rupture lengths are minimum because they do not include offshore extent of rupture.
Figure 3. Aspect ratio (L/W) as function of (A) surface rupture length (L) and moment
Mo derived from (B) geological and (C) instrumental measurements, respectively. Numbers correspond to events listed in Table 1. Horizontal bars in (C) represent range of seismic moments reported by independent investigators and listed in Table 2. Parameters describing regression of power-law curve for strike-slip, normal, and reverse faults are listed separately. Regression curve is shown only for strike-slip. The 1945 Mikawa and 1999 Izmet extend offshore and are not plotted or included in regressions.
Figure 4. Geologically and instrumentally derived (A) seismic moments and (B)
potencies plotted versus event number for earthquakes listed in Tables 1 and 2. Geologic values for events 13 (1945 Mikawa) and 34 (1999 Izmit) do not include portions of faults that extended offshore and are for that reason minimum values.
Figure 5. Geologically versus instrumentally derived estimates of (A) moment and (B)
potency. Vertical bars span a factor of 3 in geologic moment. Horizontal bars reflect the spread of multiple measures of seismic moment reported by independent investigators. Perfect correlation would follow solid line of slope 1. Dashed lines span a factor of 3 about solid line of slope 1. The number next to each symbol corresponds to the listing of events in Table 1.
Figure 6. Ratio of average to maximum surface slip as function of (A) rupture length and
(B) event number. Data point symbols differ according to fault mechanism. Average value of ratio, standard deviation, and number of points (pts) are given in key. Event numbers correspond to earthquakes listed in Table 1.
Figure 7. (A) Average and (B) maximum values of coseismic surface slip versus rupture
length for earthquakes listed in Table 1. The 1945 Mikawa earthquake and 1999 Izmit

April 25, 2007 – submitted to BSSA – Aug 20 returned from BSSA – revised & resubmitted Oct. 18.&Dec20
35
earthquake ruptures extended offshore and are not included. Values measured from digitized slip distribution curves.
Figure 8. Instrumental measures of (A) Mw and (B) Log(Mo) versus rupture length L
and Log(L), respectively, for earthquakes listed in Table 1. Figure 9. Examples of best-fitting regression curves to the coseismic surface slip
distributions for 3 or the earthquakes in Table 1. The digitized surface slip and respective types of regression curves are labeled in each plot. Position of epicenter with respect to fault strike indicated by downward pointing arrow. Integration of the digitized values of surface slip allows definition of a point where half the cumulative slip falls on either side. That value is defined for each slip distribution (values in circle) by the distance in km to nearest fault endpoint. The distances (km) of the peak values to the nearest end of the fault rupture are given in parentheses for the asymmetric sine and asymmetric ellipse curve fits. Remainder of events in Table 1 are analyzed in the same manner and compiled in Electronic Supplement 2.
Figure 10. Coefficient of Variation (COV) for various curve-fits to surface slip
distributions plotted as function of the number of the respective earthquake listed in Table 1. Average values and standard deviation are listed for each type of curve fit in the plot header. Asymmetric sine, ellipse, and triangle curves (solid symbols) consistently provide better estimation (lower COV) of observed slip distributions than do flat line or symetric sine and ellipse curves (open symbols).
Figure 11. Asymmetry of earthquake surface slip distributions for earthquakes listed in
Table 1 as defined with curve-fits to observed surface slip distributions using (A) triangular, (B) asymmetric ellipse, (C) asymmetric sine functions and (D) the point along strike where the contribution of slip to seismic moment is divided equally along strike. The asymmetry function is defined as the ratio A/L where A is the shortest distance from a rupture endpoint to the peak slip or in the case of (D) where the contribution of slip to seismic moment is divided equally along strike, and L is the respective rupture length. The function as defined is limited to between 0 and 0.5, whereby a value of 0 indicates peak slip at endpoint of rupture and 0.5 indicates peak slip at the rupture midpoint. Different symbols are used for strike-slip (circles), normal (squares), and reverse (triangles) earthquakes.
Figure 12. Relationship of epicenter location to asymmetry of surface slip distributions
as reflected in curve-fits to surface slip distributions using (A) triangular, (B) asymmetric ellipse, (C) asymmetric sine functions and (D) point along strike where contribution of slip to moment value is divided equally. The asymmetry of the surface slip (solid symbols) is defined as the ratio A/L where A is the shortest distance from a rupture endpoint to the peak slip and L is the respective rupture length. The relative location of the epicenter is defined by ratio E/L where E is the distance of the epicenter from the same rupture endpoint used to define A. In this manner the ratio A/L is limited to between 0 and 0.5 and the ratio E/L is limited between 0 and 1.

April 25, 2007 – submitted to BSSA – Aug 20 returned from BSSA – revised & resubmitted Oct. 18.&Dec20
36
Strike-slip (ss), normal (n), and reverse (r) mechanisms are denoted by appropriate symbols.
Figure 13. Maximum amplitude versus rupture length for (A) triangular, (B) asymmetric
ellipse, (C) asymmetric sine, (D) ellipse, and (E) sine curve-fits to digitized slip distributions of earthquakes listed in Table 1. Events 13 (Mikawa) and 34 (Izmit) extended offshore and are not included in the plots or regressions.
Figure 14. Synopsis of observations bearing on relationship of geometrical
discontinuities along fault strike to the endpoints of historical strike-slip earthquake ruptures. Earthquake date, name and rupture length listed on horizontal axis. The earthquakes are ordered by increasing rupture length (but not scaled to distance along axis). Above the label of each earthquake is a vertical line and symbols along line represent dimension of discontinuities within and at endpoints of each rupture.
Figure 15. Relation of fault trace complexity to rupture length for strike-slip faults. (A)
Pie chart of total number of rupture endpoints divided between whether (yes) or not (no) endpoints are associated with a geometrical discontinuity (step or termination of rupture trace). About 70% of the time rupture endpoints are associated with such discontinuities. The remainder appear to simply die out along an active fault trace. Sample size is 46. (B) Histogram of the total number of geometrical discontinuities located along historical ruptures binned as a function of size (≥1, ≥2, etc.) and shaded according to whether the particular step occurred at the endpoint of rupture or was broken through by the rupture. A transition occurs at 3-4 km above which no events have ruptured through and below which earthquakes have ruptured through in ~40% of the cases.
Figure 16. Synopsis of observations bearing on relationship of geometrical
discontinuities along fault strike to the endpoints of normal mechanism historical earthquake ruptures. See Figure 14 for further explanation.
Figure 17. Relation of fault trace complexity to rupture length for normal faults. See
Figure 15 for explanation. (A) About 75% of time rupture endpoints are associated with discontinuities in fault trace. The remainder appear to end within an active fault trace in the absence of a discontinuity. Sample size is 14. (B) Normal fault ruptures cross steps in fault strike as large as 5 to 7 km., larger than observed for strike-slip earthquakes.
Figure 18. Synopsis of observations bearing on relationship of geometrical
discontinuities along fault strike to the endpoints of thrust mechanism historical earthquake ruptures. Earthquake date, name and rupture length listed on horizontal axis. The earthquakes are ordered by increasing rupture length (but not scaled to distance along axis). Above the label of each earthquake is a vertical line and symbols along line represent dimension and type of discontinuities within and at endpoints of each rupture.
April 25, 2007 – submitted to BSSA – Aug 20 returned from BSSA – revised & resubmitted Oct. 18.&Dec20
37
Figure 19. Schematic diagrams from top left to bottom right illustrate increasing points in time of a rupture propagating bilaterally along a vertically dipping strike-slip fault plane. The unruptured and ruptured portion of the fault planes are shaded gray and white, respectively. Volumes around the rupture fronts capable of triggering slip on nearby fault segments are shaded dark gray. Empirical observations reviewed in this paper of the interplay of fault trace complexity and rupture propagation for large strike-slip earthquakes suggests a process whereby the magnitude of stress changes and volume affected by those stress changes at the front of a propagating rupture are largely the same and largely invariable during the rupture process, regardless of the distance a rupture has or will propagate.

North BreakCentral Break
South Break
NSuperstition Hills fault (cont ->)
Superstion Mtn fault
Clark fault
Coyote Creek fault
1.5 km restraining step
2.5 km restraining step
7 km releasing step 6 km
restraining step(not considered)
fault commonly obscured by young alluvium
Apr 09 1968 Borrego Mountain, California
active trace continues20+ km
Dis
plac
emen
t (m
m)
400350
250
100500
2 4 6 8 10 12 14 16 18 20 22 24 26 28 30 32
150200
300
Central Break
Distance (km)South BreakNorth Break
April 1968June 1968March 1969October 1969 (Estimated total displacement)Estimated displacement
Digitized [
Figure 1. Illustration of data synthesis and analysis. (A) Map of 1968 Borrego Mountain earthquake rupture trace shown as bold lines. Adjacent and continuing traces of active faults that did not rupture during the earthquake are shown as thinner dotted lines. Also annotated are the dimensions of fault steps measured approximately perpendicular to fault strike and the distance to the nearest neighboring fault from the 1968 rupture endpoints. (B) Geologic measurements of surface slip along the rupture trace. (C) Plot of digitization of slip curve showing both field measurements (large circles) and interpo-lated values (small solid circles). Similarly annotated maps and plots for all earthquakes used in study (Table 1) are compiled in Electronic Supplement 1. Reference to map and slip curve sources are given in Table 1.
A
B
C
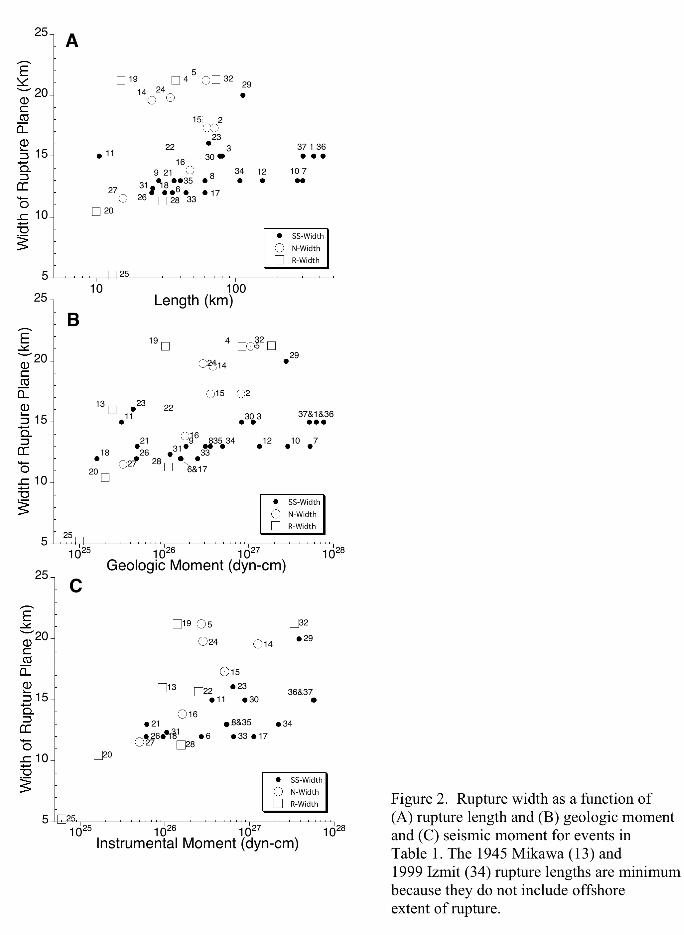


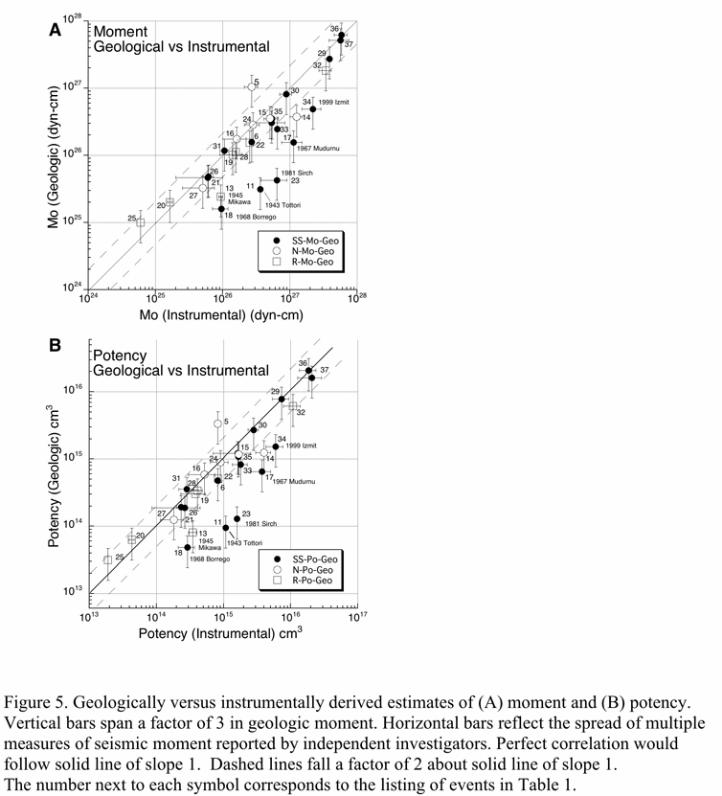

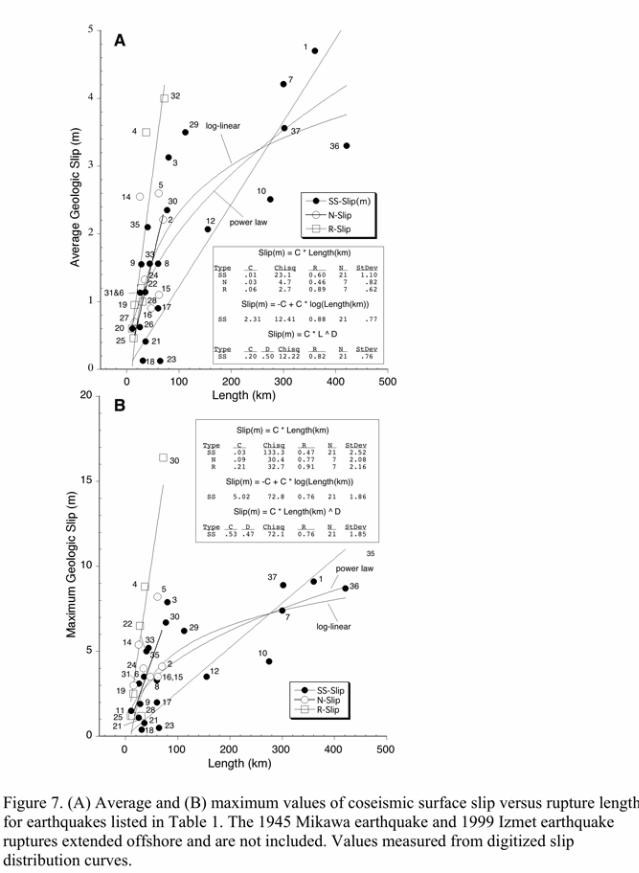

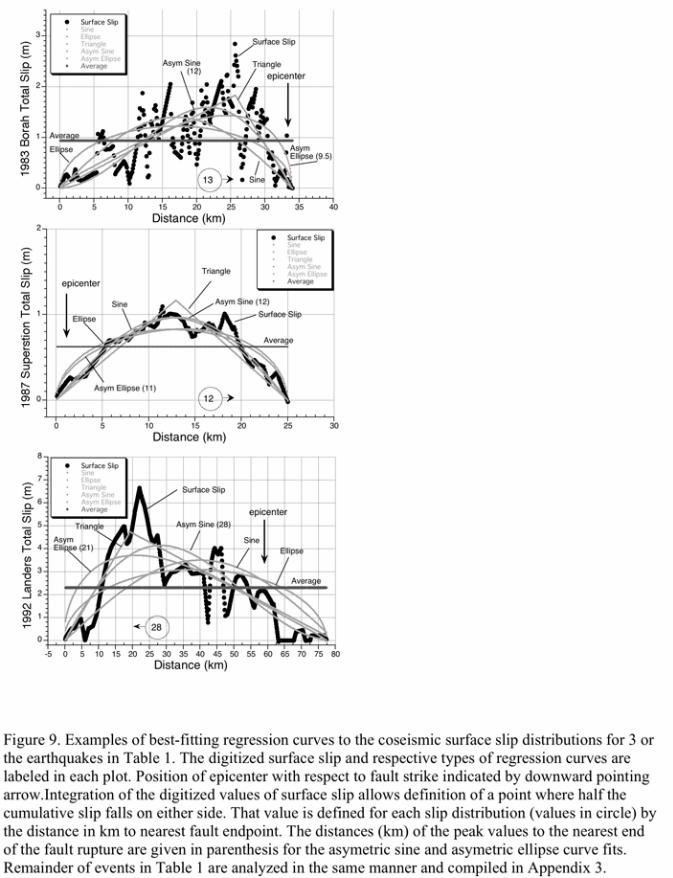
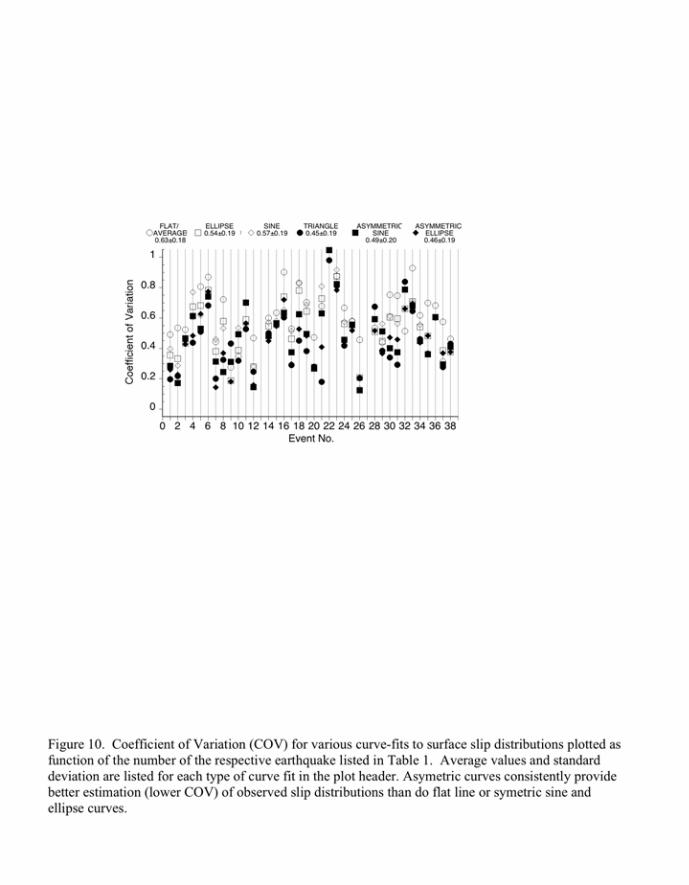
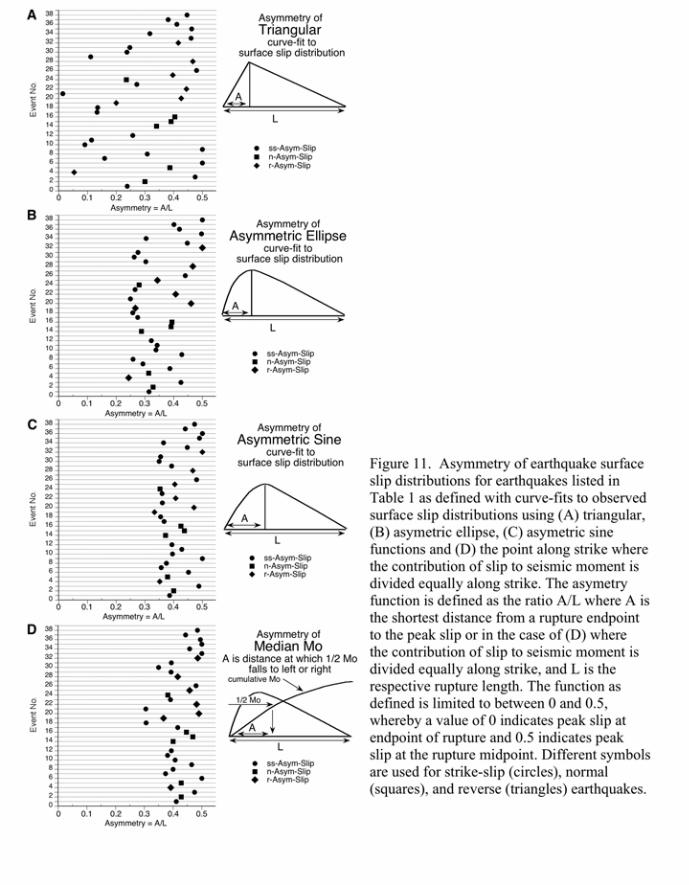
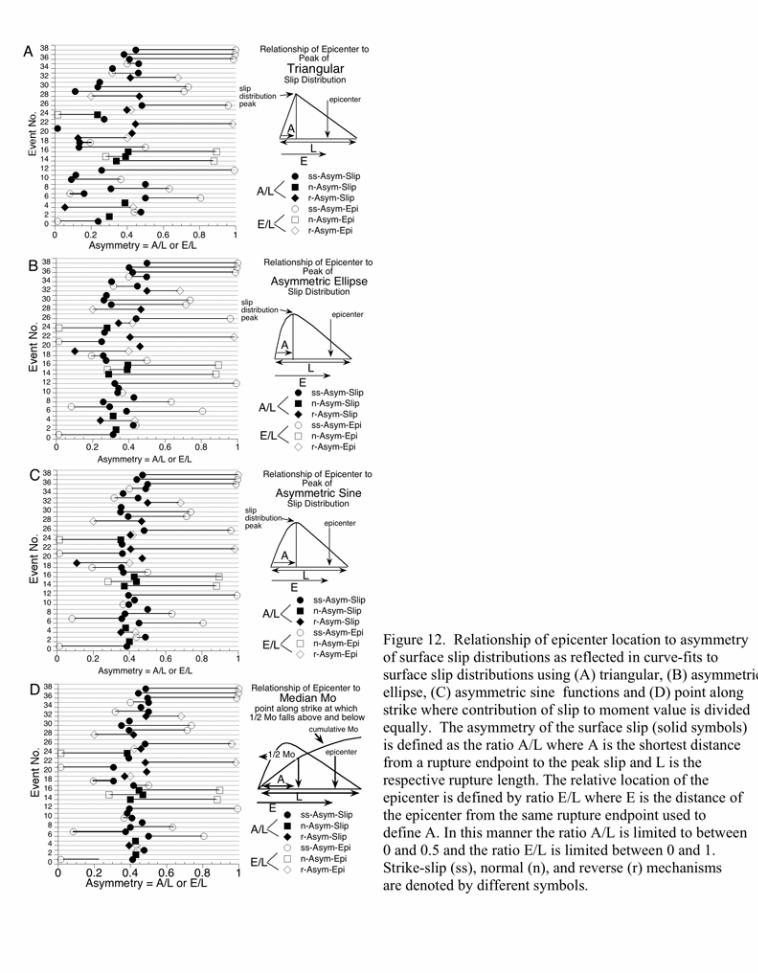


Fault Termination (distance to next active fault)
RUPTURE TERMINATION RUPTURE CONTINUES
Restraining StepRestraining Step
Releasing Step Releasing Step
Gap in continuity ofsurface rupture tracealong strike
(40)
Figure 14. Synopsis of observations bearing on relationship of geometrical discontinuities along fault strike to the endpoints of historical strike-slip earthquake ruptures. Earthquake date, name and rupture length listed on horizontal axis. The earthquakes are ordered by increasing rupture length (but not scaled to distance along axis). Above the label of each earthquake is a vertical line and symbols along line represent dimension of discontinuities within and at endpoints of each rupture.
Rupture terminates - nodiscontinuity - activetrace continues (x km)
Ordered by increasing Rupture Length19
43 To
ttori (
10.5
km)
1998
Fando
qa (2
5 km)
1987
Supers
tition (
25 km
)
1942
Erbaa-N
iksar
(28 km
)
1968
Borreg
o Mtn
(31 km
)
1930
Kita-Iz
u (35
km)
1999
Duzce
(40 k
m )
1999
Hec
tor M
ine (4
4 km)
1940
Impe
rial (
60 km
)
1967
Mud
urnu (
60 km
)
1981
Sirch (
64 km
)
1992
Land
ers (7
7 km)
1891
Neo-D
ani (8
0 km)
1990
Luzo
n (11
2 km)
1944
Gere
de Bolu
(135
km)
1999
Izmit (
145 k
m)
1943
Tosya
(275
km)
1939
Ercinc
an (3
00 km
)
2002
Denali
(302 k
m)
1857
San And
reas (
360 k
m)
2001
Kunlun
(421
km)
Dis
tanc
e (k
m)
0
5
10
1979
Impe
rial (3
6 km)
(40)
(20 km)
extre
mel
y co
mpl
ex
insu
ffici
ent m
appi
ng a
t end
poin
ts
(~20)
?
?
(20 km)
(>10)
(20+)
(15)
(~20)
(>100)
(50+)
(~20)
(20) (15&25)
asei
smic
cr
eep
too
(20+)
?
(>30)(~20 km)
sam
e ru
ptur
e te
rmin
us
sam
e ru
ptur
e te
rmin
us
?sam
e ru
ptur
e te
rmin
us?
Johnson Valley
Camp Rock
?sam
e ru
ptur
e te
rmin
us?


1987
Edgec
umbe
(16 k
m)
1959
Hebge
n Lak
e (25
km)
1954
Dixie Valle
y (47
km)
1915
Pleasa
nt Valle
y (61
km)
1954
Fairvie
w Peak (
62 km
)
1887
Sonora
(70 k
m)
Ordered by increasing Rupture Length
Dis
tanc
e (k
m)
0
5
10
1983
Borah P
eak (
34 km
)
20+ 20+ 1210+2
insu
ffici
ent m
appi
ng a
t end
poin
ts
~>10 ~>10
6
?
end
of s
igni
fican
t slip
?
sam
e en
dp
oin
t
sam
e en
dp
oin
t
Step toward footwall
RUPTURE TERMINATION RUPTURE CONTINUES
Step (left or right)
Fault terminus (distance tonext closest active fault trace)
Step toward hanging wall
Gap in continuity ofsurface rupture trace
(40)
Rupture terminates - no discontinuity - active trace continues (x km)
Step to fault of opposite dip
Step toward hanging wall
Step to fault of opposite dip
Step toward footwall
Figure 16. Synopsis of observations bearing on relationship of geometrical discontinuities along fault strike to the endpoints of normal mechanism historical earthquake ruptures. See Figure 14 for further explanation.

( )
A
B
Figure 17. Relation of fault trace complexity to rupture length for normal faults. See Figure 15 for explanation. (A) About 75% of time rupture endpoints are associated with such discontinuities. The remainder appear to simply die out along an active fault trace. Sample size is 14. (B) Normal fault ruptures cross steps in fault strike as large as 5 to 7 km., larger than observed for strike-slip earthquakes.
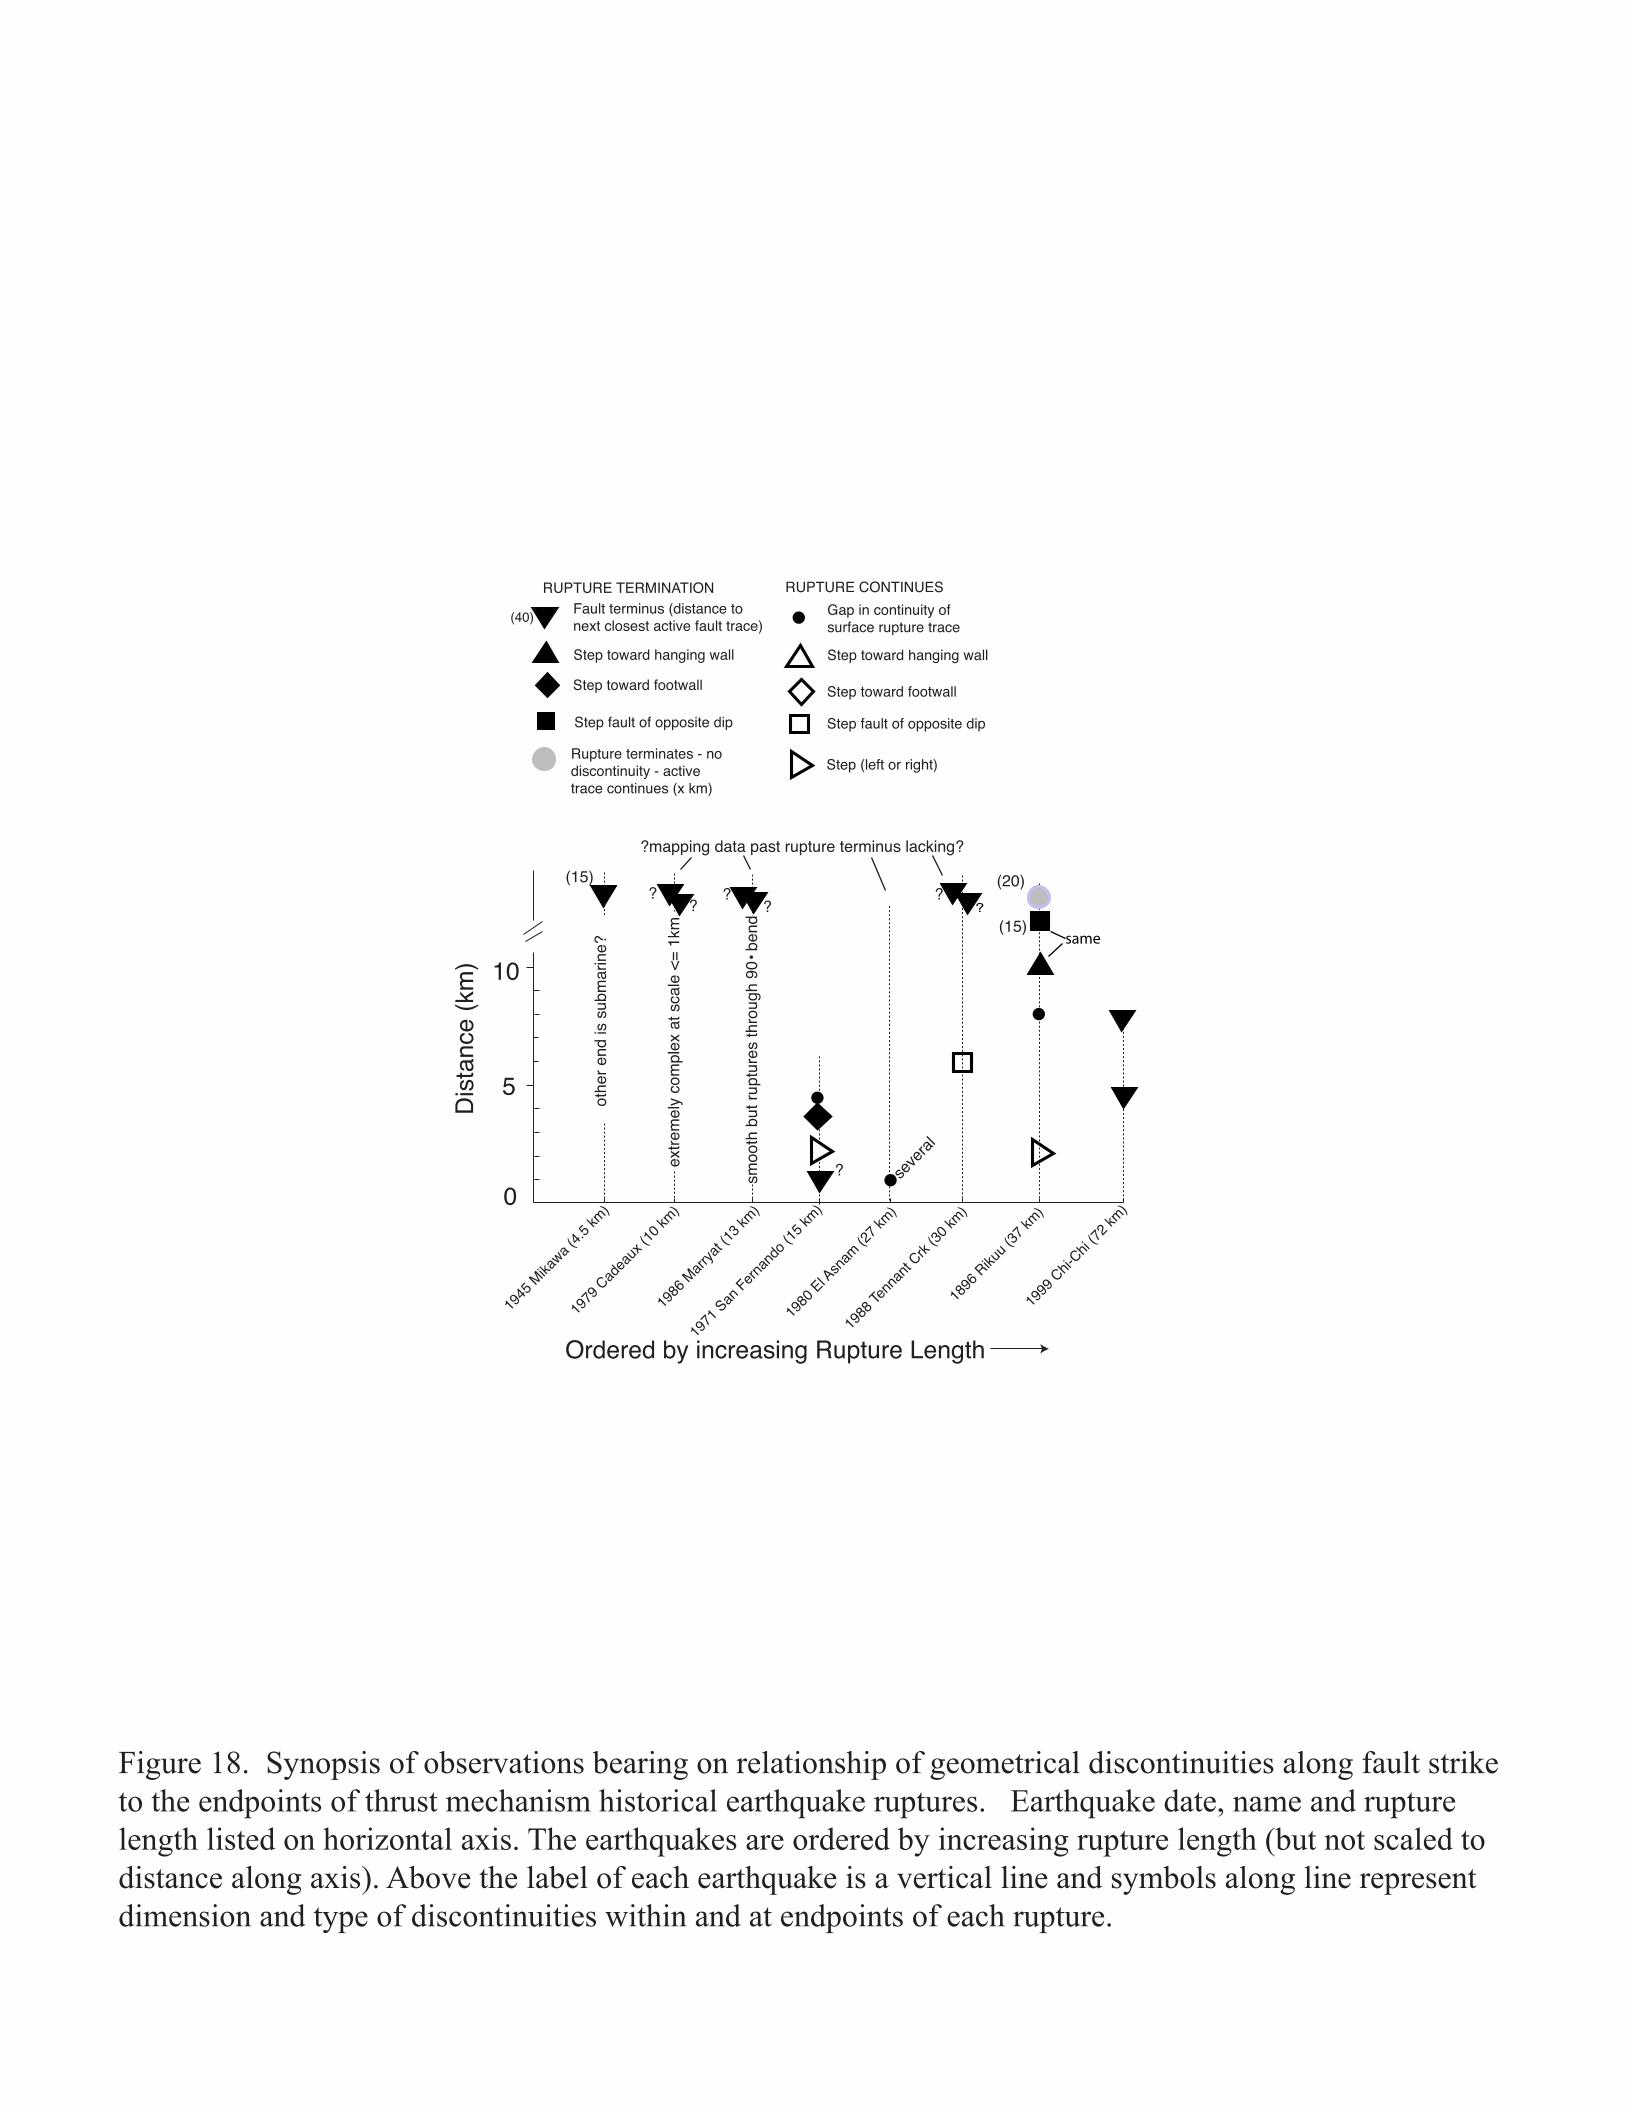
1945
Mika
wa (4.5
km)
1979
Cadea
ux (1
0 km)
1986
Marr
yat (1
3 km)
1988
Tenn
ant C
rk (30
km)
1896
Rikuu (
37 km
)
1999
Chi-Chi
(72 km
)
Ordered by increasing Rupture Length
Dis
tanc
e (k
m)
0
5
10
1971
San Fern
ando
(15 k
m)
1980
El Asn
am (2
7 km)
(15)
?mapping data past rupture terminus lacking?
extre
mel
y co
mpl
ex a
t sca
le <
= 1k
m
??
??
smoo
th b
ut ru
ptur
es th
roug
h 90
• ben
d
??
(20)
(15)
othe
r end
is s
ubm
arin
e? same
? seve
ral
Figure 18. Synopsis of observations bearing on relationship of geometrical discontinuities along fault strike to the endpoints of thrust mechanism historical earthquake ruptures. Earthquake date, name and rupture length listed on horizontal axis. The earthquakes are ordered by increasing rupture length (but not scaled to distance along axis). Above the label of each earthquake is a vertical line and symbols along line represent dimension and type of discontinuities within and at endpoints of each rupture.
Step toward footwall
RUPTURE TERMINATION RUPTURE CONTINUES
Step (left or right)
Fault terminus (distance tonext closest active fault trace)
Step toward hanging wall
Gap in continuity ofsurface rupture trace
(40)
Rupture terminates - no discontinuity - active trace continues (x km)
Step fault of opposite dip
Step toward hanging wall
Step fault of opposite dip
Step toward footwall