dispersion of plasma parameters measured by a sonding satellite during a repeated transit through a...
TRANSCRIPT

DISPERSION OF PLASMA P A R A M E T E R S M E A S U R E D BY A S O N D ‡ SATELLITE D U R I N G A REPEATED
T R ANS IT T H R O U G H A BOW S H O C K WAVE*)
I. Koz~ik, J. Safr~inkov~i, Z. Nœ
Department o f Electroniy and Vacuum Physics, Faeulty o f Mathematics and Physies, Charles University,
V HoleSovi(kdch 2, 180 O0 Praha 8, Czeehoslovakia
The paper deals witb, plasma parameters analyses during crossing bow shock. Statistical evaluation of these parameters is presented; the data laave been obtained from several rapidly following transits of the sat'Alite through slaock waves. The data on which this paper is based were measured by a plasma spectrometer M O N I T O R on board the satellite Prognoz 8 (Balebanov V. M. et al.: Adv. Space Res. 2 (1983) 75).
1. I N T R O D U C T I O N
In the year 1981 an experiment named M O N I T O R , designed to study plasma processes in solar wind and the Earth's magnetosphere, was carricd out on board the satellite Prognoz 8. This experiment offered the possibility of monitoring continually the basic plasma parameters of solar wind, that is ion velocity, density, temperature and the angle of tlae bulk velocity vector and the direction to the Sun. The temperature and the value of bulk velocity were obtained from ion energy spectra measured in 32 points ranging from 0" 16 to 4"1 keV by means of an electrostatic analyser directed to the Sun. A second such analyser deflected by 7 ~ from the Sun direction enabled observation of the angular asymmetry of the distribution function.
The detector system included a Faraday cup with a collector segmented into 3 inde- pendent parts for the measurement of ion density and the angle of solar wind bulk velocity relative to the Sun. The geometrical set-up allowed the determination of tbe ion flux direction in the range of approximately 20 ~ with respect to the Faraday cup axis (oriented to the Sun) as a ratio of the currents collected by the different segments. The sum of these 3 currents together with the value of bulk velocity was sufficient for the determination of ion density.
The data from these analysers can be transmitted to the Earth in one of two forms. In short intervals w hen direct transmission was possible the data were recr as complete real rime spectra from both channels. Most o f the time, however, the spectra were p�9 on board and only 3 parameters from each channel were transmitted to the Earth: the maximum height of the distribution function, Np, the energy corresponding to this maximum NM, and the half width determined from lower energies NL.
*) Presented at the Colloquiunl on Plasma Physics "Topics Common to the Laboratory and the Space Plasma Research", September 10--14, 1984, Horsk~ Kvilda, Czechoslovakia.
568 Czech. J. Phys. B 35 [1985]

I. Koz6k et al.: Dispersion o f plasma parameters . . .
Under assumptions usually made about solar wind ions (Maxwellian distribution, mean thermal velocity negligible with respect to bulk velocity) these parameters enabled the approximative reconstruction of the proton section of the distribution function and the determination of all basic plasma parameters.
2. E X P E R I M E N T A L D A T A A N D T H E I R P R O C E S S I N G
The results presented were obtained mostly in the monitor regime when only three monitored parameters, NL, Np, NM, and three currents Yj, Y2, 113, collected by the Faraday cup collectors, were measured every 1.28 s and later transmitted to the Earth. The data were registered on January 4, 1981 when from 23"40 to 8 : 50 several repeated
Np! 10 000 �9
1000-
100
10 �84
/ . 03:40:00
I I I - - [ l ; I - -
0 1 2 3 4 5 t Im in
NN 30
28
26
Fig. 1. T/te
i l 24 i~ k
18 '�87
,s i 12
10
0 1 2 3
Il
- - - I 4
- r 5 6 t / m i n
evolution of the parameters Np ( u p p e r part) and N M (lower part) in the rough time resolution (scale).
Czecb. J. Phys. B 35 [1985] 5 6 9

I. Koz~ik et al.: Dispersion o f plasrna parameters . . .
transits through a bow shock wave occurred; these transits followed each other usually forming groups of two or three in relatively short intervals (up to 5 rein) and were separated by longer periods. Some portions of the collected data that showed con- siderable fluctuations were selected for further proces.~ing by a computer. To analyse the fluctuations qualitatively the selected portions were first plotted in a rough time scale.
I ! nA
0.(
0.41 0.2 . . . . . . . . . . . . ~ � 8 7 .y --...': ,.
~ . . , . ............ ,.. -..-~..., v __:2_~.- , y187187
0
-05 a)
Np 100000 ™
/
10000~-
100 A
10 �8 k/ < " . i ~ ~ J . b) /
-30 0 30 60 90 t /s NN /
15" I ~' V ,4 , v -
10
5
NL,
30 25
15 ]
ci
dl
Fig . 2. T h e s a m p l e o f t h e p a r a m e t e r s m e a s u r e d d u r i n g tlae c r o s s t h r o u g h the b o w s h o c k w a v e
a t U T = 0 5 . 0 1 . 8 1 - - 03 : 41 : 23 .
An example of such a portion with three consecutive passages through a shock wave is shown in fig. 1. The upper part depicts the parameter Nv standing for the maximum height of distribution function whereas the lower part shows the parameter N M expressing the energy corresponding to this maximum, i.e. to the most probable energy. As can be seen from this picture the region of undisturbed solar wind and the
5'70 Czech. J. Phys. B 35 [1985]

I . K o z d k e t al.." D i s p e r s i o n of plasma parameters . . .
Np 100 0 0 0
1.oooo
1 000
100
10
/ \ Z\ - ~ \ \ /
~~'4~" %j-_vj ,,r . . . . "~4 '~'" Vl y
1 i i i - 3 ' 0 -2~0 -10 0 10 2'0 3JO t / s
/ , .~ v v \ L / v v
, i i i ~ - 3 0 - 2 0 -10 0 10 2'0 3'0 t / s
I / h A /
0-4 l
0 \" ~ / v
0.2�99 I , I I i I I
-30 -20 -10 0 10 20 30 t Is
Fig. 3. The mean values ot the parameters Np and NM together with tlae total Faraday cup ion current for the following crossings: 1, 2, 3.
magnetosheath differ clearly in the nature of time variations of the plasma param- eters. For further processing four sections with two and three transits in quick succession were chosen (altogether 11 transits).
A sample of ail data measured by the apparatus Monitor with the maximum reso- lution is given in fig. 2. The data were registered during a transition that took place at 05.01.81-03 : 41 : 23 UT. In the ]eft-hand part of th is figure is the region o f the solar wind with a constant direction of bulk velocity, the direction causing appreciable modulation of the parameter Np7 (i.e. the maximum height in the channel deflected by 7 ~ from the Sun). The same modulation can be seen in the currents from the separate collectors of the Faraday cup. The parameters NM and NL, which cor-
Czech. J. Phys. B 35 [1985] 571

Np 100 000
10 000
1 0 0 0
100
10
NM 30
25
20
15
10
I . K o z # k e t al.." Dispersion of plasma parameters . . .
i f \\~ i ~#E/I
V rg; "
~ 3~0 / i , r I
-10 0 10 20 30 t / S
/ v z \ . _ _
i [I /At / / "~\ l I \t
I V � 9 9 \ \ I y ~ -
V
-3'0 -210 -1'0 [) lE0 20 30 t / s
l / n A 0.4
0.2
0
-0.2
/~ r �9 / I I ~,
",,. / t k, l A ` - ` ` y -
" \ d t I q l
v
-3'0 -2'0 -110 t3 1'0 2'0 3i0 t / s
Fig. 4. The mean values of the parameters Np and NM together with the total Faraday cup ion current for the following crossings: 7, 8, 9.
respond to the bulk velocity value and the temperature, respectively, are almost constant in time and similar from both channels in the region of solar wind.
A distinct jump on the graphs of all three parameters corresponds to the transit through a shock wave, the transition in this case being of duration comparable to the period of measurement. After baving crossed the skock wave the satellite enters a magnetosheath characterized by a decline of plasma flow, plasma heating and strong turbulence resulting in a hitgh level offluctuations seen oll all the parameters measured. Despite their strongly random character the transits that followed in short time inter- vals exhibited some c o m m o n features. The points belonging to the transits in the saine group were interpolated by a curve to minimize the mean square error in each point.
572 Czech. J. Phys. B 35 [1985]

1. K oz6k et al.." Dispersion o f p l m m a parameters . . .
Np 100 000
10 00(3
1 000 ~
100-
10
1 i 1 -3~0 -2~0 -1'0 0 10
~~t c'x ^ f " ' O E y /" f t zol,,/~, , ~ , , I ~ ,y224 ~, i; If
/ y " !\ /\ll/?-x',~ ,ll~~~
i ' ~' V i l \~ f," 1;) b' v
! ] ' 4- I "4--
- 3 0 - 2 0 - I 0 0 10
t" / 4 I
. i x i I L \ I ™
' 3~0 20 t / s
1 I / I
I I I I
i ', 20 310 t / s
I i n A
0 . 4 - ~ ~ 1 " - . . . . . . . . .
0.2- '~'~x(', ,,i,d/--,_ ,.-c..~.i\ r ~ ~ y \ v / ' \ / - L
0 - " " y \ ~ / \ J " r i ~'"/"
-0.2
-3~0 0 / E - - I I I I - 2 - 10 0 10 20 30 t / S
Fig. 5. The mean values of the parameters N p and N M together witlt the total Faraday cup ion current for tbe tollowing crossings: 10, 11, 12.
The results of this interpretation are plotted in figs. 3, 4, 5, 6. In each figure the average values of the paraineters NM, Np are plotted together with the total eurrent I of the Faraday cup. The dashed curves correspond to the bounds due to the mean square errors. Comparing all these results we can conclude that in the solar wind region the parameters Np, NM and I behave in a similar way in all four cases (see table 1). The situation is more complicated for shock wave crossings. AI1 the crossings have some common features, e.g. a sharp break in all parameter values comparable in duration with the time resolution (the measurement period was 1.28 s), but there are differences in the fine structure close after this break, i.e. after the shock wave front. In figs. 3 and 5 the structure of the parameter Np is very similar - the curves
Czech. J. Phys. B 35 [1985] 5 7 3

Np 100 000
10 000
1 000
100
10
1
NN1 3 0
2 5
20
15
10
5
L K o z d k e t al.." Dispersion ofplasma parameters . . .
~ 4 , y I,I/
L.5'
_3~0 _2~0 _1J0 20 30 t / S
^ - ~ v/,l~ l y A y f"~\
.\ A l / ~ ,t '~ I --S' iV~', , , /A /N �87 t '~ , ,r/,P'X I~ I ~ / V I IW I
_3~0 _2 t0 I I , . I I -10 0 10 20 30 t I s
I / nA
0.4
0,2
0
-0 .2
�9 .:- ™187 -
_3~0 _2~0 ' ~ , , 3 ~ -10 0 10 20 0 t / s
F i g . 6 . The mean values of the parameters Np and NM together with the total Faraday cup ion current for the fol lowing crossings: 13 , 14 .
start from a minimum fol lowed by 2 or 3 oscillations. In figs. 4 and 5, however, the parameter Np exhibits a double structure during the crossing. In the following part of the transient region the parameter Np has a form similar to that in figs. 3 and 6.
The total ion current measured by the Faraday cup and the parameter Np have a similar form as can best be seen from figs. 3 and 6. Greater fluctuations of the parameter I in the transient region (i.e. after the shock wave), leading to an increased dispersion, appear in fig. 4. Of interest is the form of the parameter I in fig. 6 where the lowering of the total flux mean value does not take place (except for some small decrease after the shock wave) - in other figures this lowering is more distinct.
From the plot of the parameter NM it can be seen that a considerable change of
5 7 4 Czech. J. Phys. B 35 [1985]
I . K o z 6 k e t al.." D i s p e r s i o n of plasma parameters . . .
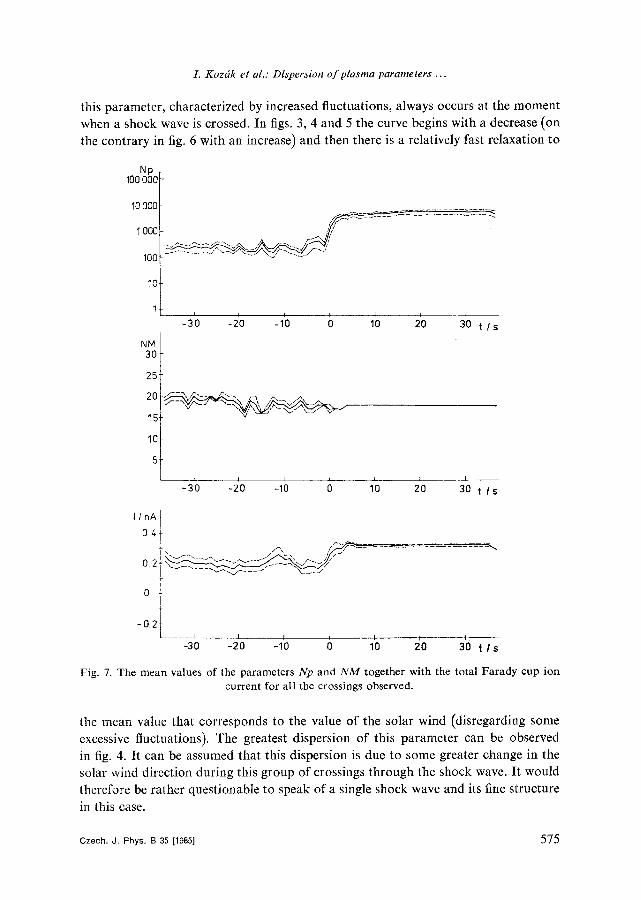
this parameter, characterized by increased fluctuations, always occurs at the moment when a shock wave is crosse& In figs. 3, 4 and 5 the curve begins with a decrease (on the contrary in fig. 6 with an increase) and then there is a relatively fast relaxation to
Np 100 0 0 0
10 000
1 000
100
10
1
Nt4 30
25
20
15
10
5
I I I --
- 3 ' 0 -2'0 -lr0 0 10 2'0 30 t / s
/ - - ~ � 8 7 / - .
i _ I -3() -210 - I0 () lJO - 2'0 30 t l s
I / n A 0.4
0.2
-0"2L~ 1 I I l -30 -20 -IrO 0 10 2t0 30 t l S
Fig. 7. The mean values of the parameters Np and NM together with the total Farady cup ion current for all the crossings observed.
the mean value that corresponds to the value of the solar wind (disregarding some excessive fluctuations). The greatest dispersion o f this parameter can be observed in fig. 4. It can be assumed that this dispersion is due to some greater change in the solar wind direction during this group of crossings through the shock wave. It would therefore be rather questionable to speak of a single shock wave and its fine structure in this case.
Czech. J. Phys. B 35 [1985] 575

"....4
Tab
le
1
Th
y v
alu
es o
f th
e p
aram
eter
s N
p, N
~VI,
NL
an
d
the
corr
esp
on
din
g
ther
mo
dy
nam
ic
pla
sma
par
amet
ers
Vd,
T~i
), N
~i )
for
the
pre
sen
ted
cr
oss-
ings
th
rou
gh
th
e b
ow
sh
ock
wav
e.
Fro
m
the
two
colu
mn
s of
dat
a de
scri
bing
eac
h o
f th
e ex
amin
ed
par
amet
ers
Np,
NM
, N
L,
Y~I,
Vd,
T(i
), N
(i )
the
val
ues
rep
rese
nti
ng
the
sol
ar
win
d p
lasm
a an
d t
he m
agn
eto
shea
th,
resp
ecti
vely
, ar
e p
rese
nte
d
in t
he l
eft
han
d
and
rig
ht
han
d c
olu
mn
s. T
he
arro
ws
at t
he
bo
w s
ho
ck n
um
ber
indi
cate
th
e d
irec
tio
n o
f th
e cr
ossi
ng,
i.e.
th
e ar
row
p
oin
tin
g t
o th
e ri
ght
indi
cate
s th
e cr
oss
ing
fro
m
the
sola
r w
ind
to
the
mag
net
osh
eath
an
d
vice
ver
sa.
-~
Th
e la
st t
hree
dat
a co
lum
ns
spec
ify
the
sate
llit
e p
osi
tio
n
in
the
po
lar
coo
rdin
ates
. R
is
the
dis
tan
ce f
rom
the
Ear
th i
n R
e un
its,
0
is t
he a
ng
le
bet
wee
n t
he s
atte
lite
rad
ius
vect
or a
nd
the
ecl
ipti
cs,
UT
is
the
un
iver
sal
tim
e at
wh
ich
the
cro
ssin
g t
oo
k p
lace
. �9
sho
ckw
ave
Np
NM
N
L
~_I/
nA
Vd
/km
s -1
T
(o/I
O4K
N
(0/c
m-3
R
/RE
O
~ ~
Ur/
s :"
N
o.
~~.
o o ~ r
r -~
1
2 50
0 19
15
0"
28
465
13
4"64
26
"5
30'7
3
: 41
: 2
3"0
~.
+-2
2
200
90
20
20
16
0"30
0"
12
490
490
15
4"86
2"
24
26"5
30
"5
3 :
49 :
58"
9
.E
--�8
7 2
500
20
16
0'28
49
0 I5
4"
54
26'4
30
'6
3 :
54 :
59"
6
--+
7 3
000
19
14
0'29
46
0 20
5'
0 26
"0
30"6
4
: 32
: 2
9"9
~h
<--8
4
000
200
19
~ 18
14
0"
31
0"15
46
0 46
0 20
5"
36
2"56
4
: 43
: 5
8"5
.~
~9
2
200
18
14
0'29
44
5 11
5
q8
4
: 46
: 5
5"2
y 9
000
17
13
0"34
42
0 10
6"
43
24"6
29
"5
7 :
13 :
21"
1 ~'
--~1
1 8
000
120
17
17
13
0'34
0"
30
420
420
10
6"43
5"
6 24
'5
29'1
7
: 25
: 2
8"1
:
.~
+--1
2 9
000
16
13
0'33
40
0 5
6'56
24
'3
29"1
7
: 42
: 5
5"2
W;
17
13
0"35
42
0 10
6"
62
2-24
23
"9
29"0
8
: 20
: 3
3-1
~b
-~1
3
11 0
00
300
16
420
10
6"43
8
: 22
: 2
4.4
~=
-<~1
4 13
000
17
13
0"
34
0-12
42
0 .=
DA
TE
05
. 01
. 81

I. K o z 6 k et al.: Dispersion o f p lasma parameters . . .
To carry out a detailed study of the shock wave fine structure the velocity of this wave with respect to the apparatus should be known. As this velocity could be only roughly estimated from the data collected we decided simply to average all respective data. These averaged values, i.e. Np, I, which give a typical form of the shock wave, are plotted in fig. 7. The measured parameters converted already into the dynamic plasma parameters are presented in table 1. The conversion has been done after the usual model [1, 2]. This model bas been used for the conversion in the remaining parts of the graph (i.e. in the shock wave and in the transient region) as well but we are aware of the fact that this model cannot be fully justified in such a case and that some of the parameters can have a little different interpretation. For instance, the drift velocity represents in fact the most probable velocity in the given direction. In the region after the shock wave i t i s however impossible to compute the temperature meaningfully from the parameters measured because their mean values are comparable to their dispersions. When evaluating densities considerable changes of flux isotrophy in the transient region have to be taken into account. This effect can explain at first sight a contradictory decrease of the density in the region after the shock wave.
It should be pointed out that the averaging covered a relatively long time interval (about 5 hours) and that it was impossible to take account of the mutual velocity of the wave and the satellite. Therefore, the averaged data should be regarded only as an informative picture of the shock wave shape and cannot be used for conclusions about the fine structure.
3. D I S C U S S I O N
The experimental results obtained can be summed up as follows:
1. Tbe duration of the passage of the shock wave front in the satellite vicinity was comparable to the period of out measurement ( ~ 1.28 s).
2. Some shock wave crossings exhibit a double structure of the shock wave front. This double structure could be due to a hf modulation of the shock wave oscillations; this wave could, at least in principle, have both the longitudinal and the transversal components.
3. All the crossings registered show a similar structure of the shock wave front and of the region immediately after the front. In the mean values computed from a group of crossings that followed in short time intervals this structure is still maintained. The mean values of all the crossings registered do not bave this structure, an effect that can be explained by completely random plasma characteristics after the shock wave. We believe that by taking the relative velocity of the shock wave and the satellite into account an analysis of the spatial fine structure could have been carried out.
4. The sharp decrease and the following increase (to a lower value) of the particle density taking place in a time interval of about l s, as registered by the elst. analyser (Np), are indisputable. This decrease could be caused by a change in the ion flux
Czech, J. Phys. B 35 [1985] 577

L Koz6k et al.: Dispersion o fp lasma parameters . . .
direction or by thermalization or by a greater isotrophy of the flux, or by a combina- t ion of all these effects. The same conclusion can be drawn from the results obtained from the Faraday cup where the possible influence of high-energy electrons cannot be, of course, ruled out.
5. Some differences in the measured structure of the shock wave are explainable by a different orientation o f the shock wave velocity vector and the magnetic field vector. Such an explanation would assume the existence of local curved regions on the shock wave front.
CONCLUSION
The results of the study of the shock wave plasma, as presented here, are only preliminary. A detailed analysis of plasma processes would require that the changes of the magnetic field and the fluctuations of the electromagnetic radiation be taken into account.
An exact description of the processes responsible for the plasma temperature and isotrophy would need a three-dimensional measurement with a time resolution one order better than that already accomplished. Moreover, to analyse the spatial structure all measurements should be donc simultaneously at least in two points in space.
Received 9. 11. 1984.
Referenees
[1] Balebanov V. M. et al.: Adv. Space Res. 2 (1983) 75. 12] Zastenker G. N. et al.: Kosmich. issled. 10 (1982) 900. [3] Vaisberg O. L. at al.: Preprint SRI AS USSR, Moscow, PR 915. [4] Eselevich V. G.: Preprint SITMIRWP AS USSR, Irkutsk, 19-- 81 (1981). [5l Nœ Z., Safr/mkov/t J., Koz/tk I., Zastenker G.N., Yermolajev Yu.l.: Czech. J. Phys. 35
(1985) 557.
5 7 8 Czech. J. Phys. B 35 [1985]