disneyland -- a wonderland in the globalized world by...
TRANSCRIPT

DISNEYLAND WONDERLANDDISNEYLAND: WONDERLAND
PREPARED AND PRESENTED BY: PARYMANDYWINKY
SHELSEAANDY

WHAT IS DISNEY WORLD?
F d d 1923 “th h i t l th“• Founded 1923, “the happiest place on earth“
• Anaheim, California, 1955, ,
• cartoons and animation studio, theme park…
“ b “• “cast members“
• Advertureland, Fantasyland, Frontierland, , y , ,Tomorrowland, Mickey's Toontown Fair…
THE ORIGINAL DREAM BY DISNEY
• Live adventure
• Forget, feel, enjoy
• Hidden from viewHidden from view
• …

TWDC INCLUDES:
• Walt Disney PicturesWalt Disney Pictures
• Touchstone Pictures
• Hollywood Pictures (BEEN CANCELLED)
• Miramax FilmsMiramax Films
• Dimension Films
• ESPN
•• …

STOCK HISTORY OF DIS

THE WALT DISNEY COMPANY STOCK QUOTES 1957
DATE CLOSE DATE CLOSE
12/3/1957 13.50 12/18/1957 14.50
12/4/1957 13.25 12/20/1957 14.00/ / / /
12/5/1957 13.25 12/23/1957 13.50
12/6/1957 14 38 12/24/1957 13 5012/6/1957 14.38 12/24/1957 13.50
12/9/1957 14.75 12/25/1957 holiday
12/10/1957 14 50 12/26/1957 13 6312/10/1957 14.50 12/26/1957 13.63
12/11/1957 14.50 12/27/1957 13.88
12/12/1957 14.38 12/30/1957 13.88
… 12/31/1957 13.88
-Based on a resource for investors in the Walt Disney Company on corporate.disney.go.com

STOCK EXCHANGE LISTING 2007DATE CLOSE DATE CLOSE
12/3/2007 33.04 12/19/2007 32.26
12/4/2007 32.75 12/20/2007 32.33/ / / /
12/5/2007 32.75 12/21/2007 32.94
12/6/2007 32.72 12/24/2007 33.24
12/7/2007 32.79 12/25/2007 Holiday
12/10/2007 32.35 12/26/2007 32.8212/10/2007 32.35 12/26/2007 32.82
12/11/2007 31.76 12/27/2007 32.43
12/12/2007 32.28 12/28/2007 32.42
… 12/31/2007 32.28
-Based on a resource for investors in the Walt Disney Company on corporate.disney.go.com

STOCK PERFORMANCE


-Based on http://finance.google.com/finance?q=NYSE:DIS

DISNEY ONLINE INTERNATIONALDISNEY ONLINE INTERNATIONAL


HOTEL!HOTEL!

DISNEY WORLD HOTEL

DISNEY WORLD HOTELDISNEY WORLD HOTEL

WALT DISNEY WORLD COLLEGE PROGRAMWALT DISNEY WORLD COLLEGE PROGRAM
Are you a college student who is looking for:Are you a college student who is looking for:
A paid internship opportunity that will stand out on a résumé? A chance to work with world‐renowned leadership and gain useful, transferable skills?
d d l l h ff ll d ?A custom‐designed learning curriculum that offers opportunity to gain college credit? An opportunity to meet people from around the world, make lifelong friends, and have fun?
As a part of the Disney College Program at the Disneyland® Resort in Anaheim, California, or Walt Disney World® Resort near Orlando, Florida, participants can take part in the internship of a lifetime.
While working in front line roles at our Theme Parks and Resorts, participants will network with leaders, learn transferable skills, gain real‐world experience, and be a part of a team of Cast Members from hundreds of job disciplineshundreds of job disciplines.
Participants on the Disney College Program also custom design a learning curriculum that best suits their needs and interests, complete education courses and specialized learning activities, and can possibly earn college credit while doing so.
Each program offers its own unique opportunities so get started today by exploring which is best suitedEach program offers its own unique opportunities, so get started today by exploring which is best suited for you!

PROBLEMSPROBLEMS

PROBLEM A: COPYRIGHT INFRINGEMENTPROBLEM A: COPYRIGHT INFRINGEMENT
S l ti ASolution A:
In 1998, Congress enacted the Digital Millennium , g gCopyright Act (DMCA), which strengthened copyright protection in the digital medium. The act will protect copyright materials by enforcing rules and regulationscopyright materials by enforcing rules and regulations on the internet service providers (ISP). The act will increase the monitoring of copyrighted materials posted on individual’s websites because ISP’s will have more control over the content users post on their serversservers.

PROBLEM A: COPYRIGHT INFRINGEMENTPROBLEM A: COPYRIGHT INFRINGEMENTSolution B:
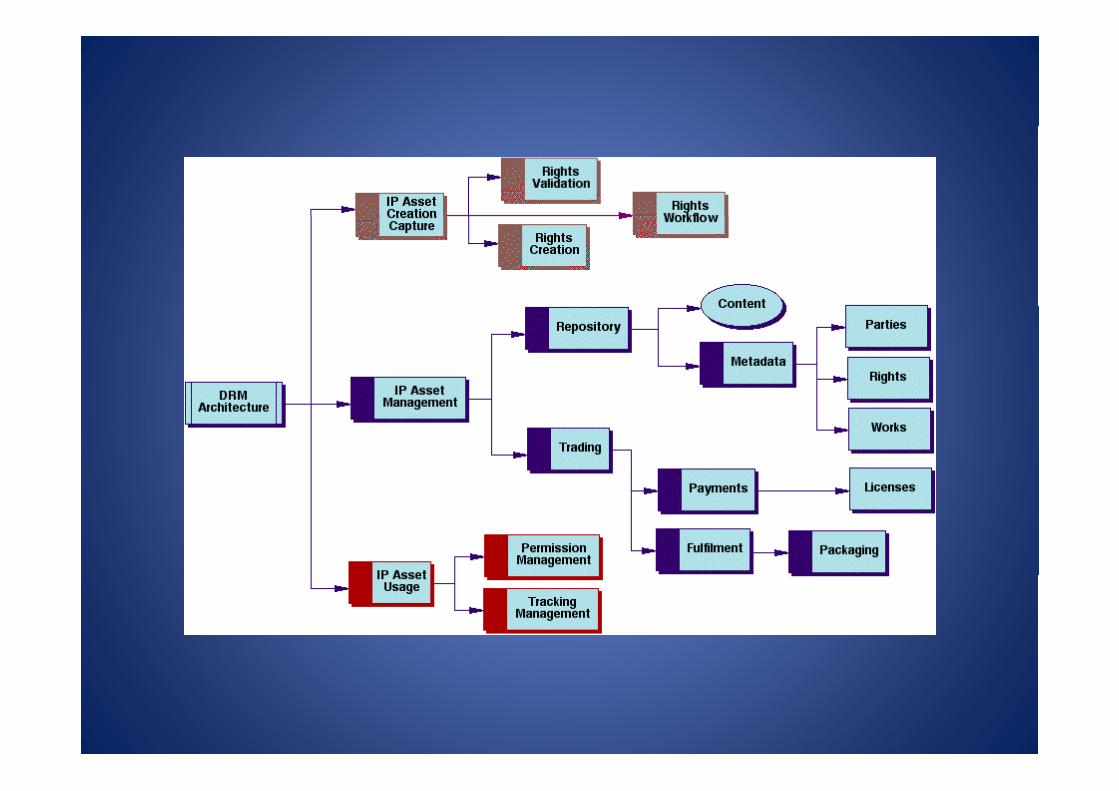
Besides the development of new acts, policies, and regulations, the entertainment industry must incorporate a new business model because their old model is inadequate to address the issues evolving around the digital age. The entertainment industry should incorporate the Digital Rights Management (DRM) model because this model will allow forincorporate the Digital Rights Management (DRM) model because this model will allow for new strategies to combat copyright infringement and file sharing. DRM refers to protecting ownership/copyright of electronic content by restricting what actions an authorized recipient may take in regard to that content. The two approaches the DRM employs to secure content over the digital medium are listed below.
A. “Containment,” an approach where the content is encrypted in a shell so that it can only be accessed by authorized users.
B “M ki ” th ti f l i t k fl X ML t t t i l tB. “Marking,” the practice of placing a watermark, flag, or a XrML tag on content as a signal to a device that the media is copy protected.
Note: The two mentioned approached above are vulnerable to cracking, according to Professor Ed FeltenEd Felten
Song writers and artists benefit from the DRM because they can configure the access of his/her content, for example, a document maybe viewable but not printable, or can only be used for a limited time.

PROBLEM A: COPYRIGHT INFRINGEMENTSolution C:
IBM has developed the Electronic Media Management System (EMMS)(C), which is a software suite helping (in this case) the entertainment industry control the distribution of media and protecting the industries assets. One major benefit of the EMMS software is digital rights management, which protects widely distributed popular digital media assets such as books video games music and software The list below summarizes some of thesuch as books, video games, music and software. The list below summarizes some of the benefits song writers and artists will receive through the implementation of the EMMS.
A. Enables music content owners to implement advanced right‐management capabilities to enforce usage of their assets only by authorized users and processes. g y y p
B. Provides enhanced security features for encrypted digital content and usage rights.
C. Utilizes secure container technology to facilitate downloads of rich media or business data according to license terms specified by content owners.
For years the entertainment industries have battled for control over intellectual assets and property over the digital medium. Now with the implementation of EMMS, the entertainment industry will have more control of what the end – user downloads. The EMMS ill i it l i f th t t i t i d t b th i t dwill increase capital gains for the entertainment industry because the services requested
from song writers and artists will be paid for. In addition, the solutions outlined above will increase the control songwriters and artists have over the digital medium but the entertainment industry must first combat the risks associated with the P2P architecture; y ;notably file sharing.

PROBLEM 2 : P2P ARCHITECTUREPROBLEM 2 : P2P ARCHITECTURE• Peer‐to‐peer (P2P) architecture is a distributed computing network in which
h l h f l d l h heach client computer shares files or computer resources directly with others but not through a central server (as in traditional client/server architecture). The diagram below represents a centralized P2P network (one of three basic P2P architectures), which was adopted by Napster. Since the internet boom and Napster, file sharing has become the most common online activity. According to the Recording Industry Association of America (RIAA), the g g y ( ),number of CD’s shipped in the U.S. fell from 940 million to 800 million or 15% between 2000 and 2002. The decrease in the volume of shipped CD’s and the decline in sales of an estimated $2 5 billion between 2000 and 2003 have alldecline in sales of an estimated $2.5 billion between 2000 and 2003 have all been attributed to file sharing, according to the film and record industry. The entertainment industry has already taken action to stop internet piracy through lawsuits and pressuring congress to pass new laws and regulations Inthrough lawsuits and pressuring congress to pass new laws and regulations. In addition, file sharing will continue to grow unless the entertainment industry adopts the DRM functional architecture to minimize file sharing activities.

ANY OTHER WORLD’S ENTERTAINMENT CORPORATIONS?
• Vivendi UniversalVivendi Universal
• Viacom
• AOL Time Warner
• SonySony
• News Corporation
• ...

DISNEY’S BRANDDISNEY S BRAND
I th d th• In the end, the company that understands it’sunderstands it s proprietary benefit, fills a gap in thefills a gap in the market, and addresses the emotional needs of it’s customers will
t f lcreate a powerful bond that’s price indifferentindifferent.

GENERATING NEW BUSINESSGENERATING NEW BUSINESS
kA. PC Market
B. Indian Market:(1) lower labor costs(1) lower labor costs (2) second largest customer base (3) low competitive environment(4) India’s interest and investment into the(4) India s interest and investment into the entertainment industry.

ENVIRONMENTALITYENVIRONMENTALITY
Ever since Walt Disney expressed his commitment to the environmentEver since Walt Disney expressed his commitment to the environment more than 60 years ago, the Walt Disney Company (TWDC) has upheld a strong commitment and responsibility to conserve natural resources. In 1990, TWDC formed the Environmental Policy Division, which , y ,focuses on the education and maintenance of six key priorities: climate protection, energy conservation, green purchasing, waste minimization, water conservation and wildlife conservation. In addition, Disney introduced their environmental brand: Disney's Environmentality™introduced their environmental brand: Disney s Environmentality™. The brand represents Disney's fundamental ethic that blends business growth with the preservation of nature.
Today, environmental departments Company wide have made progress toward an even stronger environmental commitment by introducing new programs, increasing employee and Guest involvement, and p g , g p y ,positively impacting our communities.
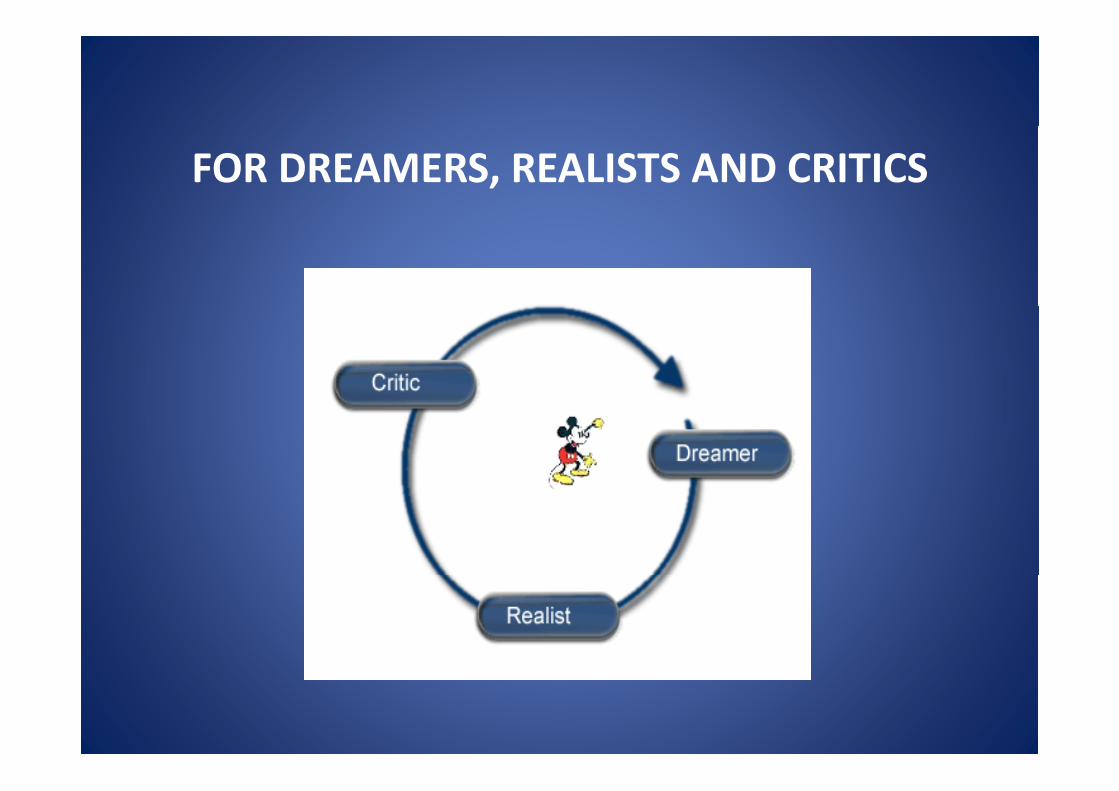
FOR DREAMERS, REALISTS AND CRITICS

FOR DREAMERS, REALISTS AND CRITICS
• The DREAMERS (idea, vision, or outcome creators) e S ( dea, s o , o outco e c eato s)‐ Visual Dissociated Does it look right ? Is it what's wanted ?
• The REALISTS (implementers, resourcers) ‐ Feelings Associated Does it feel right ? Does it work?
• The SPOILERS (critics) ‐ Auditory Associated (inner voice)Does it sound right ? Is it interesting or entertaining ?g g g

WHAT WOULD HAPPEN INWHAT WOULD HAPPEN IN
CHINA?CHINA?

DISNEY’S INTEREST IN CHINA• Long‐term
– Consistently searching for areas of expansion where there are un‐captured markets
• Current – Government relations established through the Hong Kong Disneyland project indicate easier entry into the
i l dmainland
• Competitive – Universal‐Vivendi’s land purchase in Shanghai and proposed expansion into Beijing

HONG KONG DISNEYLANDHONG KONG DISNEYLAND• $1.8 Billion USD Project$1.8 Billion USD Project
• 60% Debt– 80% Government80% Government– 20% Commercial
• 40% Equityq y– 43% Disney– 57% Government (will eventually sell down ownership stake)
• 6 Million Visitors in its first full operating year, and 1.4 Million additional visitors to Hong Kong
• $148 Billion value added boost to the Hong Kong economy over the next 40 years
• 35,800 jobs created in the next 20 years

BACKGROUNDC G OU

BACKGROUND: CHINABACKGROUND: CHINA
L t l ti i th ld ith l ti l l j t d• Largest population in the world with relatively slow projected population growth– 1.26 B (2001) ‐ 1.5 B (2050F)( ) ( )– 63 ‐ 70% Rural
• High growth rates in GDP and foreign direct investment (FDI)g g g ( )– Urban income growth of 17.2% in 2002, – Growth in FDI of 14.8% in 2002
$• 2003F: US$58 B
• 2004F: US$62 B
• Accession to the World Trade Organization in December 2001• Accession to the World Trade Organization in December 2001– Increased support for private and foreign investments– Theme parks still fall under Restricted Foreign Investment Industriesp g

THEME PARKS IN CHINATHEME PARKS IN CHINA• Most parks in China were American‐themed• Most parks in China were American‐themed
• Few have survived mainly because of transportation issues
• Admission Prices: 56 – 100 Yuan ($6 – $12)Admission Prices: 56 100 Yuan ($6 $12)
• Park Sizes: 70 – 150 acres
• Universal‐Vivendi December 2002 agreement to build a park in Shanghaip g– Projected park opening in 2006, with more than 8 million visitors
in the first yearI di i t b ild i il k i B iji– In discussions to build a similar park in Beijing

PARK LOCATION IS KEYPARK LOCATION IS KEY
Expo Site pand Universal Property
Significant infrastructure Significant infrastructure development is occurring to development is occurring to p gp gsupport the 2010 Exposupport the 2010 Expo
BACKGROUND: WHY SHANGHAI?BACKGROUND: WHY SHANGHAI?
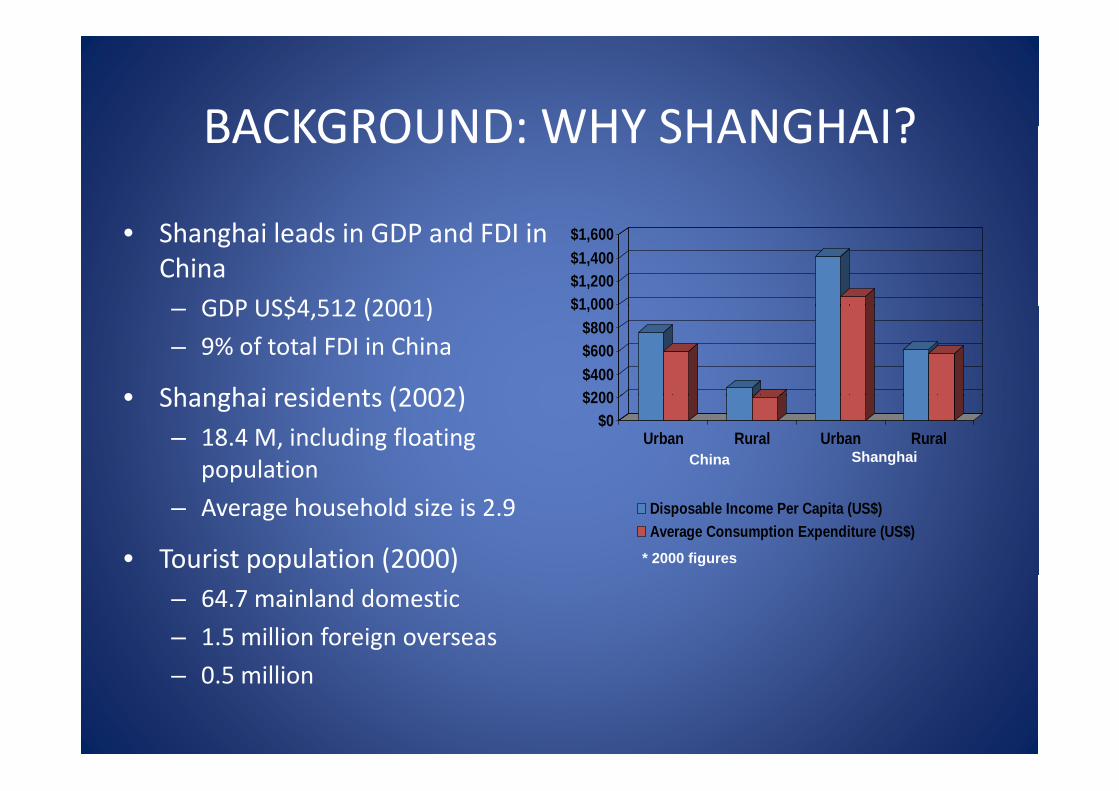
• Shanghai leads in GDP and FDI in China
GDP US$4 512 (2001) $1 000$1,200$1,400$1,600
– GDP US$4,512 (2001)
– 9% of total FDI in China
• Shanghai residents (2002) $200$400$600$800
$1,000
• Shanghai residents (2002)– 18.4 M, including floating
population
$0$200
Urban Rural Urban RuralChina Shanghai
– Average household size is 2.9
• Tourist population (2000)
Disposable Income Per Capita (US$)Average Consumption Expenditure (US$)
* 2000 figures
– 64.7 mainland domestic
– 1.5 million foreign overseas
– 0.5 million

TARGET MARKETTARGET MARKET
Target Local MarketTarget Local Market (million)(million)By Income Level (yuan)By Income Level (yuan)
30,000 30,000 –– 60,00060,000 2.442.4460,000 60,000 –– 90,00090,000 1.621.62> 100 000> 100 000 1 141 14> 100,000> 100,000 1.141.14
Total Local Market (based on income)Total Local Market (based on income) 5.205.20Tourist MarketTourist Market (million)(million)Tourist MarketTourist Market (million)(million)
Domestic (Mainland)Domestic (Mainland) 64.764.7OverseasOverseas -- ForeignForeign 1.51.5Overseas Overseas ForeignForeign 1.51.5Overseas Overseas -- DomesticDomestic 0.500.50
Total Target MarketTotal Target Market 71.9071.90
* Based on * Based on 2008F2008F Population numbersPopulation numbers

PROJECT STRUCTUREPROJECT STRUCTURE
1 27 Billi US$ l i l i• 1.27 Billion US$ total capital investment
• 60% Debt– 80% Government– 20% Commercial
40% E it• 40% Equity– 43% Disney– 57% Government
• 10.6 Million Visitors in its first full operating year and average annual growth of 1.5%g g
• Corporate tax rate of 30%, with tax loss carry‐forwards permitted for five years

OPERATING CASH FLOWSOPERATING CASH FLOWS
• Admissions (50%) • Park labor and overhead
RevenuesRevenues CostsCosts
• Admissions (50%)
• Food and beverage (24 5%)
• Park labor and overhead
• Maintenance materials
• Entertainment (costuming(24.5%)
• Merchandise (24.5%)
• Main entrance (1%)
• Entertainment (costuming, labor, etc.)
• Food and beverage COGS• Main entrance (1%) • Food and beverage COGS
• Merchandise COGS
• Support labor• Support labor
• Miscellaneous
RISK ANALYSISRISK ANALYSIS

RISK ANALYSIS SOVEREIGNRISK ANALYSIS ‐ SOVEREIGN• Currency risk is not mitigated by this project since the majorityCurrency risk is not mitigated by this project since the majority
of cash inflows and outflows are in local currency
• Expropriation risk is mitigated some with the government takingExpropriation risk is mitigated some with the government taking a controlling equity stake
• No other commercial or multi‐lateral agency partners areNo other commercial or multi lateral agency partners are involved in the project
• Because the project is in the tourism industry and involves an• Because the project is in the tourism industry and involves an American cultural icon, the susceptibility to strikes or terrorism is slightly higher than average
• The project’s location in Shanghai reduces the overall risk of natural disasters when compared to country averages

RISK ANALYSIS OPERATING & FINANCIALRISK ANALYSIS – OPERATING & FINANCIAL
Th h l f hi j ill b id d b Di d i• The technology for this project will be provided by Disney and is proven in other locations
ll l h h h h• Potentially lengthy negotiations with the Chinese government increases start‐up risks slightly
• Given the project is very service oriented, there is some risk associated with the level of control assumed by the government, but this is difficult to quantifybut this is difficult to quantify
• There are no financial mitigating factors ― rather, this project is closely tied to the governmentclosely tied to the government
• Real option: A minor amount of cannibalization from the Hong Kong property may be expectedKong property may be expected

COST of CAPITALCOST of CAPITAL
• ICCRC 16 10%• ICCRC 16.10%– U.S. Risk Free 4.00%– U.S. Risk Premium 4.00%– China’s Country Credit Rating 58.9– Anchored to U.S. cost of equity
• Adjustments– Industry beta adjustment ‐0.80%
Expropriation 0 97%– Expropriation ‐0.97%– Start‐up risks assoc. with Gov’t negotiations +0.12%– Sensitivity to strikes, terrorism +0.08%– Sensitivity to natural disasters ‐0.12%– Real option: Cannibalization from HK Disney +0.08%
• Project Cost of Capital 16.09%

CASH FLOW ANALYSISCASH FLOW ANALYSIS2003 2004 2005 2006 2007 2008 2009
Admissions $0 $0 $0 $0 $0 $283,179,483 $296,060,956Merchandise $0 $0 $0 $0 $0 $53 532 494 $55 967 619Merchandise $0 $0 $0 $0 $0 $53,532,494 $55,967,619Food & Beverage $0 $0 $0 $0 $0 $53,532,494 $55,967,619Main Entrance $0 $0 $0 $0 $0 $500,000 $515,000Hotel Revenues $0 $0 $0 $0 $0 $13,687,500 $14,098,125Total Revenue $0 $0 $0 $0 $0 $404,431,972 $422,609,319Park Operating Expenses $0 $0 $0 $0 $0 $133 951 636 $138 405 572Park Operating Expenses $0 $0 $0 $0 $0 $133,951,636 $138,405,572Hotel Operating Expenses $0 $0 $0 $0 $0 $8,896,875 $9,163,781Start Up Costs $0 $0 $0 $0 $0 $20,000,000 $0Royalty Expenses $0 $0 $0 $0 $0 $20,221,599 $21,130,466Total Opertaing Expenses $0 $0 $0 $0 $0 $183,070,109 $168,699,819EBIT $0 $0 $0 $0 $0 $221,361,863 $253,909,500Depreciation $0 $6,350,000 $20,637,500 $42,862,500 $57,150,000 $63,500,000 $63,500,000EBITDA $0 ($6,350,000) ($20,637,500) ($42,862,500) ($57,150,000) $157,861,863 $190,409,500Interest on Debt $0 $0 $0 $0 $0 $46,908,093 $50,028,135Taxable Income $0 ($6,350,000) ($20,637,500) ($42,862,500) ($57,150,000) $110,953,769 $140,381,366Adjusted Taxable Income $0 $0 $0 $0 $0 $0 $124,335,135Less: Taxes $0 $0 $0 $0 $0 $0 ($37,300,540)Less: Debt Principal $0 $0 $0 $0 $0 ($75,679,404) ($72,559,362)Less: Capital Expenditures $0 ($50,800,000) ($114,300,000) ($177,800,000) ($114,300,000) ($50,800,000) ($38,520,000)Plus: Depreciation $0 $6 350 000 $20 637 500 $42 862 500 $57 150 000 $63 500 000 $63 500 000Plus: Depreciation $0 $6,350,000 $20,637,500 $42,862,500 $57,150,000 $63,500,000 $63,500,000Less: NWC $0 $0 $0 $0 $0 $0 $0Free Cash Flow $0 ($50,800,000) ($114,300,000) ($177,800,000) ($114,300,000) $47,974,365 $55,501,463
PV FCF $0 ($43,759,152) ($84,811,864) ($113,644,212) ($62,931,341) $22,752,817 $22,674,387
NPV $19,242,097, ,IRR 17%
* Cash flows analyzed through 2029 (per Disney, typical 20-25 year financial analysis time horizon)

REAL OPTIONSREAL OPTIONS
• Option to wait until Universal Studios opens– Already losing any first mover advantage– Universal’s track record at opening resorts is not on par with Disney’s ―
lessons learned from Universal may be minimal
• Build a resort hotel in conjunction with the park
• Build a “Downtown Disney” entertainment center adjacent to park
• Build another gate after several years of operation (double park size)

RECOMMENDATIONRECOMMENDATION

RECOMMENDATIONRECOMMENDATION• Begin negotiations with Chinese governmentg g g
– Government equity stake and debt provisions– Land and infrastructure provisionsLand and infrastructure provisions
• Disney must make the argument that aDisney must make the argument that a Shanghai Park would not substantially damage Hong Kongg g
• Escalating political tensions on the KoreanEscalating political tensions on the Korean peninsula could change the risk assessment

DEMAND PROJECTIONSDEMAND PROJECTIONS
Captured 2008 Market (million)
30000 - 60000 1.83 1.84 60000 - 90000 1.30 1.23 >100,000 0.97 0.86 Captured Market Based on Income Level 4.09 3.94 Market From Tourism
Local - Domestic Tourists 6.47 7.764Overseas - Foreign Tourists 0.075 0.075O D ti T i t 0 005 0 005Overseas - Domestic Tourists 0.005 0.005
Total Captured 2008 Market for Disney-Shanghai 10.64 11.78 1.14
Total 2008 Market (million)
30000 - 60000 2.44 60000 - 90000 1.62 >100,000 1.14 Total Market Based on Income Level 5.20 Market From Tourism
Local - Domestic Tourists 64.7Overseas - Foreign Tourists 1.5Overseas - Domestic Tourists 0.50
Total 2008 Market for Disney-Shanghai 71.90

REVENUE PROJECTIONSREVENUE PROJECTIONS
R A iRevenue Assumptions
2008 2009 2010 2011 2012 2013Year 0 1 2 3 4 5Expected Demand (Mil) 10.64 10.80 10.96 11.13 11.29 11.46Admissions ($ Mil) $283.18 $296.05 $305.49 $315.31 $325.50 $336.10Admissions ($ Mil) $283.18 $296.05 $305.49 $315.31 $325.50 $336.10Merchandise ($ Mil) $53.53 $55.97 $58.51 $61.17 $63.95 $66.85Food and Beverage ($ Mil) $53.53 $55.97 $58.51 $61.17 $63.95 $66.85Main Entrance ($ Mil) $0.50 $0.52 $0.53 $0.55 $0.56 $0.58
Total Revenue $390.74 $408.50 $423.04 $438.19 $453.96 $470.39
2003 USD 2008 USDF&B Per Cap $4.34 $5.03Merch Per Cap $4.34 $5.03
- Assume Expected Demand Grows 1 5% Annually (Based on Attendance Figures at Other Disney Parks) Assume Expected Demand Grows 1.5% Annually (Based on Attendance Figures at Other Disney Parks)

OPERATING COSTSOPERATING COSTS
Operating Expenses
USD (Millions) Adjusted (2003 Dollars) Adjusted (2008 Dollars) % RevenuePark Labor (Salaried & Hourly) $50.00 $20.00 $23.19Costs Associ. w/ Park Labor $25.00 $25.00 $28.98Maintenance $15.00 $15.00 $17.39Entertainment $25.00 $24.30 $28.17F&B $10.62 $9.77 $11.33 21.16%M h di $17 55 $14 48 $16 78 31 35%Merchandise $17.55 $14.48 $16.78 31.35%Support Labor $5.00 $2.00 $2.32Miscellaneous $5.00 $5.00 $5.80
Total Expenses $153.17 $115.55 $133.95
2008 2009 2010 2011 2012Park Labor (Salaried & Hourly) $23.19 $23.88 $24.60 $25.34 $26.10Costs Associ. w/ Park Labor $28.98 $29.85 $30.75 $31.67 $32.62Maintenance $17.39 $17.91 $18.45 $19.00 $19.57Entertainment $28.17 $29.02 $29.89 $30.78 $31.71F&B $11.33 $11.84 $12.38 $12.94 $13.53Merchandise $16.78 $17.55 $18.34 $19.17 $20.04Support Labor $2.32 $2.39 $2.46 $2.53 $2.61Miscellaneous $5.80 $5.97 $6.15 $6.33 $6.52
Total Expenses $133.95 $138.41 $143.01 $147.76 $152.70

CAPITAL STRUCTURECAPITAL STRUCTURECapital Structure Assumptions
Investment Schedule
Park Investment $1 200 000 000 Year Percent Total Debt EquityPark Investment $1,200,000,000 Year Percent Total Debt EquityHotel Investment $70,000,000 2004 0.1 $127,000,000 $76,200,000 $50,800,000Total Investment $1,270,000,000 2005 0.225 $285,750,000 $171,450,000 $114,300,000% Debt 60% 2006 0.35 $444,500,000 $266,700,000 $177,800,000% Equity 40% 2007 0.225 $285,750,000 $171,450,000 $114,300,000
2008 0.1 $127,000,000 $76,200,000 $50,800,0002008 0.1 $127,000,000 $76,200,000 $50,800,000Debt $762,000,000
Equity $508,000,000% Disney 43% On-Going Capital Expenditures% Government 57%
Assumptions:Disney Equity $218,440,000Government Equity $289,560,000 -US Parks spend approximately $100 Million every 3 years for new attractions
-Assume 10% is local labor-Labor costs are 1/3 of USE ti t Sh h i Di l d ill d i t l $93 Milli 3 (C t D ll )-Estimate Shanghai Disneyland will spend approximately $93 Million every 3 years (Current Dollars)
-With inflation, translates to $37.02 Million for 2009, Grow at rate of inflation-Assume hotel will have $1.5 Million in Cap Ex every year beginning in 2009, Grow at rate of inflation-Total Cap Ex in 2009 is $38.52 Million

DEPRECIATIONDEPRECIATION
Year Cap Ex 2004 Cap Ex 2005 Cap Ex 2006 Cap Ex 2007 Cap Ex 2008 Cap Ex Total2004 $120,000,000 $6,000,000 $0 $0 $0 $0 $6,000,0002005 $270,000,000 $6,000,000 $13,500,000 $0 $0 $0 $19,500,0002006 $420,000,000 $6,000,000 $13,500,000 $21,000,000 $0 $0 $40,500,000
Depreciation Expense
006 $ 0,000,000 $6,000,000 $ 3,500,000 $ ,000,000 $0 $0 $ 0,500,0002007 $270,000,000 $6,000,000 $13,500,000 $21,000,000 $13,500,000 $0 $54,000,0002008 $120,000,000 $6,000,000 $13,500,000 $21,000,000 $13,500,000 $6,000,000 $60,000,0002009 $0 $6,000,000 $13,500,000 $21,000,000 $13,500,000 $6,000,000 $60,000,0002010 $0 $6,000,000 $13,500,000 $21,000,000 $13,500,000 $6,000,000 $60,000,0002011 $0 $6,000,000 $13,500,000 $21,000,000 $13,500,000 $6,000,000 $60,000,0002012 $0 $6 000 000 $13 00 000 $21 000 000 $13 00 000 $6 000 000 $60 000 0002012 $0 $6,000,000 $13,500,000 $21,000,000 $13,500,000 $6,000,000 $60,000,0002013 $0 $6,000,000 $13,500,000 $21,000,000 $13,500,000 $6,000,000 $60,000,0002014 $0 $6,000,000 $13,500,000 $21,000,000 $13,500,000 $6,000,000 $60,000,0002015 $0 $6,000,000 $13,500,000 $21,000,000 $13,500,000 $6,000,000 $60,000,0002016 $0 $6,000,000 $13,500,000 $21,000,000 $13,500,000 $6,000,000 $60,000,0002017 $0 $6,000,000 $13,500,000 $21,000,000 $13,500,000 $6,000,000 $60,000,0002017 $0 $6,000,000 $13,500,000 $21,000,000 $13,500,000 $6,000,000 $60,000,0002018 $0 $6,000,000 $13,500,000 $21,000,000 $13,500,000 $6,000,000 $60,000,0002019 $0 $6,000,000 $13,500,000 $21,000,000 $13,500,000 $6,000,000 $60,000,0002020 $0 $6,000,000 $13,500,000 $21,000,000 $13,500,000 $6,000,000 $60,000,0002021 $0 $6,000,000 $13,500,000 $21,000,000 $13,500,000 $6,000,000 $60,000,0002022 $0 $6,000,000 $13,500,000 $21,000,000 $13,500,000 $6,000,000 $60,000,0002023 $0 $6,000,000 $13,500,000 $21,000,000 $13,500,000 $6,000,000 $60,000,0002024 $0 $0 $13,500,000 $21,000,000 $13,500,000 $6,000,000 $54,000,0002025 $0 $0 $0 $21,000,000 $13,500,000 $6,000,000 $40,500,0002026 $0 $0 $0 $0 $13,500,000 $6,000,000 $19,500,0002027 $0 $0 $0 $0 $0 $6,000,000 $6,000,000

TICKET PRICE PROJECTIONTICKET PRICE PROJECTIONSource: http://www time com/time/europe/magazine/article/0 13005 901020325 218398 00 htmlSource: http://www.time.com/time/europe/magazine/article/0,13005,901020325-218398,00.htmlAll Currency in USD
Orlando ParisAnaheim/Los
Angeles Tokyo Hong Kong ShanghaiAve Annual Temperature (F) 72.4 67 73 60.1 73 60Population (2000) in Millions 0.185984 2.1 3.7 28 7.116 13.2162002 Attendance in Millions 33 12 39.7 0% of Attendance vs. Local 17743% 571% 1073% 0% 0% 0%Ticket Price (1 Day 1 Park Adult)Ticket Price (1 Day 1 Park Adult) No Tax Included 50$ 39$ 47$ 46$ Ticket Price Base MultiDay 192$ 106$ 119$ 81$ Ticket Price Premium MultiDay 307$ 166$ 143$ Ticket Price (Annual Pass) No 369$ 248$ 225$ 332$ Percentage of 1D1P to Annual 14% 16% 21% 14%Annual Income (2000) 42,148$ 32,660$ 42,148$ 37,661$ 20,832$ 5,542$ Annual Disposable Income 25,939$ 5,128$ 25,939$ 3,924$ 13,244$ 1,400$ DI % of Annual Income 61.54% 15.70% 61.54% 10.42% 63.58% 25.26%1D1P % of Disposable Income 0 19% 0 76% 0 18% 1 17%1D1P % of Disposable Income 0.19% 0.76% 0.18% 1.17%Annual Pass % of Disponsable 1.42% 4.84% 0.87% 8.46%
Potential 1D1P Price 155.25 16.41 Potential Annual Park Price 1,120.44 118.45 Potential Attendance (in Millions) 0.00 7Average Attendance Per Day 0 19178

Q&AQ
A. What kind of advertisements do you like orA. What kind of advertisements do you like or dislike?
B. What’s your expectations about Disney
theme park in Shanghai?