dish tv india limited · pdf filedish tv india limited ... the disclosure requirements...
TRANSCRIPT
DISH TV INDIA LIMITED Corporate Presentation

2
Disclaimer This presentation contains certain “forward looking statements.” These forward looking statements that include words or phrases such as Dish TV India Limited (the "Company") or its
management “believes”, “expects”, “anticipates”, “intends”, “plans”, “foresees”, or other words or phrases of similar import. Similarly, statements that describe the Company’s
objectives, plans or goals also are forward-looking statements. All such forward looking statements are subject to certain risks and uncertainties that could cause actual results to differ
materially from those contemplated by the relevant forward-looking statement. Such forward looking statements are made based on management’s current expectations or beliefs as well
as assumptions made by, and information currently available to, management.
Neither the Company nor any of its advisors nor any of their respective affiliates, shareholders, directors, employees, agents or advisers makes expressed or implied representations or
warranties as to the accuracy and completeness of the information contained herein and neither of them shall accept any responsibility or liability (including any third party liability) for
any loss or damage, whether or not arising from any error or omission in compiling such information or as a result of any party’s reliance or use of such information. The information and
opinions in this presentation are subject to change without notice.
This presentation does not constitute a placement document, prospectus or other placement document in whole or in part. This presentation shall not constitute an offer to sell or the
solicitation of an offer to buy any security. There shall be no sale of these securities in any state or jurisdiction in which such offer, solicitation or sale would be unlawful prior to
qualification under securities laws of such state or jurisdiction. This presentation must not be distributed to the press or any media organization.
“This is for informational purposes only and is not a solicitation of any bid from you or any investor. Nothing in the foregoing shall constitute and/or deem to constitute an offer or an
invitation to an offer, to be made to the Indian public or any section thereof through this document, and this document and its contents should not be construed to be a prospectus in India.
This document has not been and will not be reviewed or approved by any statutory or regulatory authority in India or by any stock exchanges in India. This document does not comply with
the disclosure requirements prescribed by the SEBI or any other applicable authority in relation to a public issue of securities on the Indian stock exchanges.
This document and the contents hereof are restricted for only the intended recipient(s). This document and the contents hereof should not be (i) forwarded or delivered or
transmitted in any manner whatsoever, to any other person other than the intended recipient(s); or (ii) reproduced in any manner whatsoever, and in particular, may not be
forwarded to any US person or any address in the United States. Any forwarding, distribution or reproduction of this document in whole or in part is unauthorized. Failure to comply
with this directive may result in a violation of the US Securities Act of 1933, as amended, or the applicable laws of other jurisdictions. The Company or any other parties whose
names appear herein, shall not be liable for any statements made herein or any event or circumstance arising there from.
This document has been made available to you in electronic form. You are reminded that documents transmitted via this medium may be altered or changed during the process of
transmission. In accessing this document, you agree to be bound by the terms and conditions hereof, including any modifications to them any time you receive any information from us as a
result of such access.”
This presentation is not an offer for sale of securities in the United States. The securities of the Company have not been and will not be registered under the U.S. Securities Act of 1933, as
amended (the "Securities Act"). The securities of the Company may not be offered or sold in the United States or to or for the account or benefit of U.S. persons (as such term is defined in
Regulation S under the Securities Act) absent registration under the Securities Act or pursuant to an exemption from registration. There will be no public offering of the Company's
securities in the United States.

DTH Industry Overview

4
Pay-TV market on a growth trajectory
India TV industry and DTH overview
0% 0% 1%3%
9%13 %
17 %2 0% 2 2% 2 4%
55 %59 %
61%64 % 64% 6 4% 6 4% 6 4% 6 3% 63 %
0 .0%
10 .0%
20 .0%
30 .0%
40 .0%
50 .0%
60 .0%
70 .0%
2004 2005 2006 2007 2008 2009p 2010p 2011p 2012p 2013p
% DTH HH to TV HH % Cab le HH to TV HH Source: MPA report 2009
Source: MPA report 2009
Increasing TV Penetration
DTH gaining foothold in TV HHs Share in incremental Pay TV HH added
Source: MPA report 2009
India is a large TV market - 129 mm HH in 2008 and expected to grow at a CAGR of 3.4% (2008-13p)
Pay-TV penetration at 73% of TV HH of which only 14% are Digital HH (2008)
Analog is highly fragmented and with limited ability to finance digitization
DTH expected to garner 60% market share of new Pay-TV HH over next 5 years as per MPA 2009 estimate
99% 96% 89%
67%
28% 26% 18%9%
-5%-17%
9%
27%
60% 62%63%
62%63% 61%
4%1%56%
43%29%19%11%12%7%
2%
-20%
0%
20%
40%
60%
80%
100%2004 2005 2006 2007 2008 2009p 2010p 2011p 2012p 2013p
% s
hare
of i
ncre
men
tal s
ubsc
riber
s
% Analog Cable TV % DTH % Digital + IPTV
5765
7282
94105
115124
131137
56%59%
62%67%
73%77%
81%84%
86% 88%
-
25
50
75
100
125
150
175
2004 2005 2006 2007 2008 2009p 2010p 2011p 2012p 2013p20%
30%
40%
50%
60%
70%
80%
90%
100%
A nalo g Cable TV DTH Digital + IP TV P ay-TV as a % o f To tal TV HH
129 136 142 148 152 155
106 105 104 103 100 96
209 215 220 225 229 233 236 239 241 243
103 110 116 122
888991
9464%63%62%
60%59%
56%54%53%
51%49%
50
75
100
125
150
175
200
225
250
2004 2005 2006 2007 2008 2009p 2010p 2011p 2012p 2013p
No
of H
ouse
hold
s in
MM
40%
45%
50%
55%
60%
65%
70%
TV HH Non-TV HH TV as of % of Total HHSource: MPA report 2009

5
0 0 14
11
18
24
29
34
38
0
10
20
30
40
50
2004 2005 2006 2007 2008 2009p 2010p 2011p 2012p 2013p
No.
of h
ouse
hold
s in
mm
0%
5%
10%
15%
20%
25%
30%
35%
40%
45%
2004 2005 2006 2007 2008 2009p 2010p 2011p 2012p 2013p
% DTH HH to Tota l HH % DTH HH to TV HH
DTH % of Cable HH DTH % of P ay TV HH
DTH – exponential market growth
DTH leading the nation wide digitization wave
DTH HH increased from 1 mm in 2006 to 11 mm in 2008(Source: MPA 2009)
Increased DTH penetration will drive continuous growth of DTH HH
Source: MPA report 2009
Source: MPA report 2009
Rapidly growing - DTH Subscriber base
DTH % of HH’s – Increasing penetration
CAGR: 20.7% (2009p -13p)
Increased competition fueling high growth
High end audio-video quality leading to increased penetration
DTH as a % of TV HH is expected to increase to 24% by 2013 (Source: MPA 2009)

6
Key industry milestones
-
2
4
6
8
10
12
Apr-
05
Aug-
05
Dec-
05
Apr-
06
Aug-
06
Dec-
06
Apr-
07
Aug-
07
Dec-
07
Apr-
08
Aug-
08
Dec-
08
Dish TV (mn) DTH HH (mn)
Launch of DTH Services by Dish TV in select markets
Launch of DTH Services by Dish TV in select markets
Launch of DTH Services by Dish TV in select markets
Launch of DTH services by TataskyLaunch of DTH services by Tatasky
Dispute over content settled between Dish & Star
Dispute over content settled between Dish & Star
DTH subs breach the 2 mn mark between 2 players
DTH subs breach the 2 mn mark between 2 players
Dispute over content with Sun TV settled
Dispute over content with Sun TV settled
DTH subscribe base at ~10 mn subs
DTH subscribe base at ~10 mn subs
Launch of DTH operations by Sun Direct
Launch of DTH operations by Sun Direct
Voluntary Digitization of Cable players started to launch digital cable services
Voluntary Digitization of Cable players started to launch digital cable services
Trigger on Digitization CAS made mandatory in select parts of metros
Trigger on Digitization CAS made mandatory in select parts of metros
Launch of DTH operations by Reliance
Launch of DTH operations by Reliance
Launch of DTH operations by Airtel
Launch of DTH operations by Airtel
Subscribers in mm
Source: Dish TV

7
Current DTH landscape
Source: MPA report 2009 ; 2: Dish TV estimates
Company
Group Zee Group Tatas Sun TV Reliance ADAG Bharti
Launch Date2 Oct 03 Aug 06 Jan 08 Aug 08 Oct 08
Subscribers – Dec 081 4.5 3.2 2.3 1.1 NA
Ownership2 Public Private Private Division of R.com Division of Bharti
Technology2 MPEG2 S1 MPEG2 S1 MPEG4 S1 MPEG4 S1 MPEG4 S2
Geographical Spread2 ***** *** ** ** *
Distributors2 ***** *** ** **** *
Pricing Strategy2 ***** ***** *** ***** *****
Channels tie ups1 225 200 170 200 1502
Services2 40 19 29 54 32

8
Industry -Key regulations
Licensingregulations
Total Foreign investment limit of 49% with a sub limit of maximum 20% for Foreign Direct Investment
Uplink centre in India
Set-top boxes have to be BIS compliant
License Fee at 10% of subscription revenues (Proposed for 6% under approval)
Initial license validity of 10 years; renewable there after
Inter ConnectRegulation
Content providers have to provide content to all broadcasters; Pricing flexible
Prohibits broadcasters from guaranteeing minimum number of subscribers
Quality of Service Regulation
Subscriber to be offered STBs on Rental / Hire purchase / Sale
Mechanism to handle customer complaints & grievances
Reference Interconnect offers
Pricing information on content of the broadcaster
Max 50% of Non CAS Cable Rates
A-la-carte offering to be allowed

DISH – Market leader in DTH

10
Company Business Market cap
(US$m) Revenues (US$m)
Dish TV (73%)
India’s largest Direct to home satellite distribution company 888 153
Zee Entertainment Enterprise Ltd (42%)
22 entertainment channels covering genres GEC, Movies, Sports, Music, Religious, Comedy, Lifestyle
1,575 453
Zee News Ltd (54%)
11 channels covering genres news, business, and regional GECs 204 106
Wire & Wireless India Ltd (49%)
India’s largest Cable distribution company 87 57
ETC Networks (71%)
Music and regional channels, education business 23 14
Dish TV – From India’s largest media conglomerate
Note: The % figures in bracket indicate shareholding by Mr Subhash Chandra & family; M.Cap as of July 30, 09 ; Revenues as per audited statements of FY 2009;Source: Dish TV
Essel Group

11
Dish TV - Business model
Up-front subsidy on set top boxes to acquire subscribers
Subscription revenues received in advance as per the chosen plan by subscribers
Other developing revenue streams TeleportMovies on demandA-la carteCarriage feesAdvertisement
Benefits of economies of scale to accrue – moved from variable payment of content cost to a fixed payment structure
Focus on improving ARPU, reducing churn and subscriber acquisition cost (“SAC”)

12
Dish TV – Key strengths
Largest channel offering with diversified
content
Largest number of channels offered on DTH platform – 240 channels & services (Jun09)
ZEE brand name and content backing ==> One of India’s leading media group
Continuous focus on strong regional content in linguistic zones
Leverage in content tie-ups due to a dominant market leadership position
Sales & Distribution network
Pan-India presence through 800 distributors & ~48,000 dealers across 6600 towns as of Jun 09
Network managed by over 200 sales personnel – 8 zonal and 9 regional offices (Jun 09)
~600 ‘Dish Shoppees’ to provide demo product experience to prospective users as of Jun-09
Incentive of dealers is per STB sold
Advanced infrastructure
Sufficient capacity to broadcast increasing channels – current 9 ku band transponders
Model geared to grow in future – adding to transponder capacity and technologyupgrade on cards
Heavy capex investment enables to deliver a high end audio-video quality
Market Leadership
Perceived as the industry pioneer with largest subscriber base
Carried and distributed by majority third party distributors and dealers
Strong Branding with consumers

13
Dish TV – Strategy
Customer acquisition
strategy
Focused marketing leading to creation of a BRAND – SRK campaign
Largest content offering and digital viewing experience
Aligned dealer incentive structure-Higher incentives for subscriber at higher packs
Competitive pricing, A-la carte offerings and ease of making payments
Distribution and after sales service
Customer retentionstrategy
Promotions and dealer incentives offered on an ongoing basis to retain customers through innovative packages
Over 350 Dish Care Centers (DCCs) & service franchisees providing installation and after sale-service as of Mar-09
In-house call centre, operating 24*7 with capacity of up to 800 operators

14
Select key management personnel
Mr. Subhash ChandraNon-Executive Chairman
Mr.Chandra is the promoter of Essel Group of Companies
His business interests include television networks and film entertainment, cable systems, satellite communications, theme parks, flexible packaging, family entertainment centers and online gaming
Mr. Chandra has been the recipient of numerous honorary degrees, industry awards and civic honors, including being named ‘Global Indian Entertainment Personality of the Year’ by FICCI for 2004, ‘Business Standard’s Businessman of the Year’ in 1999, ‘Entrepreneur of the Year’ by Ernst & Young in 1999 and ‘Enterprise CEO of the Year’ by International Brand Summit.
Mr.Jawahar Lal Goel Managing Director
Jawahar Lal Goel has been the Managing Director of Dish TV since January 6, 2007
Mr. Goel is been actively involved in the creation and expansion of Essel Group of Industries and has been instrumental in establishing Dish TV as a prominent DTH brand in India.
He is the president of the Indian Broadcasting Foundation and is an active member on the Board of various committees and task forces, set up by Ministry of Information & Broadcasting.
Mr.Salil Kapoor Chief Operating Officer
Salil Kapoor has been the Chief Operating Officer since July 2008. He is responsible for sales, marketing, service and overall supervision of the zonal offices of Company.
He has work experience of over 18 years in the industry with various global corporations including Samsung India Elec. Ltd., Microsoft Corp.India (Pvt) Ltd., LG Electronics India, Blue Star Limited and Fedders Llyod Ltd.
Mr. Kapoor holds a bachelor of engineering from Bangalore University and MBA from University of Delhi.
Mr. Rajiv Khattar President Projects
Rajiv Khattar has been the President-Projects of our Company since September 1, 2005. He is responsible for strategic tie-ups and technology upgrades of the DTH platform.
Mr. Khattar has an aggregate work experience of 20 years and experience of 12 years in the telecom industry. Prior to joining Dish, he worked with Reliance Infocom Limited as the President for Netway.
Mr. Amitabh KumarPresident Technology
Since September 2005 Mr. Amitab Kumar is responsible for broadcasting operations of the Company
Prior to joining Dish, he has held various senior positions in the Industry including the position of the acting Chairman and Managing Director of Tata Communications Limited (formerly known as Videsh Sanchar Nigam Limited)
Mr. Kumar has an aggregate work experience of 31 years in the telecom industry and holds a professional certificate in electronic data interchange from All India Management Association and Deakin University, Australia
Mr. Rajeev DalmiaCFO
Mr. Dalmia has an overall work experience of 20 years in the finance industry and is responsible for maintaining finance and accounts of the company
He is a qualified fellow chartered accountant from the Institute of Chartered Accountants of India

15
DISH TV - Competitive position
3.6
11.1
2.7
4.7
75.7%
42.4%
0
2
4
6
8
10
12
Dec-07 Dec-080%
10%
20%
30%
40%
50%
60%
70%
80%
% S
hare
Total DTH HH Dish TV HH Dish TV Market Share
Players with large and stable subscriber base to emerge as winners in the long run…..Dish TV well placed being the largest player in the DTH industry
Source: Dish TV Source :Total DTH HH as per MPA report 2009; Dish TV HH – Gross Subscribers as per Dish TV
Dish market share on total subscriber baseDish TV – Increasing number of subscribers
2.7
3.0
3.4
3.9
4.7
5.1
5.5
5.9
2.2
2.5
2.9
3.4
4.0
4.3
4.6
5.0
2
3
4
5
6
Q3FY08
Q4FY08
Q1FY09
Q2FY09
Q3FY09
Q4FY09
Q1FY10
Q2FY10
Gross Subscriber base MM Net Subscriber Base

Dish TV – Financials

17
Dish TV - Financials
4127
1909
7377
1,000
3,000
5,000
7,000
9,000
FY 07 FY 08 FY 09
INR
MM
-1889
-2196
-1885
-53%
-26%
-99%-2500
-2000
-1500
-1000
-500
0FY 07 FY 08 FY 09
-100%
-80%
-60%
-40%
-20%
0%
Source: Audited financials
Source: Published quarterly results
EBITDA - AnnualRevenues - Annual
Aggressive subscriber acquisition coupled with higher marginsSource: Published quarterly results
Source: Audited financials
CAGR: 56.9%
Revenues - Quarterly EBITDA - Quarterly
1363
1121
1644 1733
19272071
2467 2575
1,000
1,600
2,200
2,800
Q3 FY08 Q4 FY08 Q1 FY09 Q2 FY09 Q3 FY09 Q4 FY09 Q1 FY10 Q2 FY10
INR
MM
-642
-538
-667
-874
-390
145
231
449%
-20%
-50%
-41%-39%
-57%
6%2%
-1000
-750
-500
-250
0
250Q3 FY08 Q4 FY08 Q1 FY09 Q2 FY09 Q3 FY09 Q4 FY09 Q1 FY10 Q2 FY10
-100%
-80%
-60%
-40%
-20%
0%
20%
18
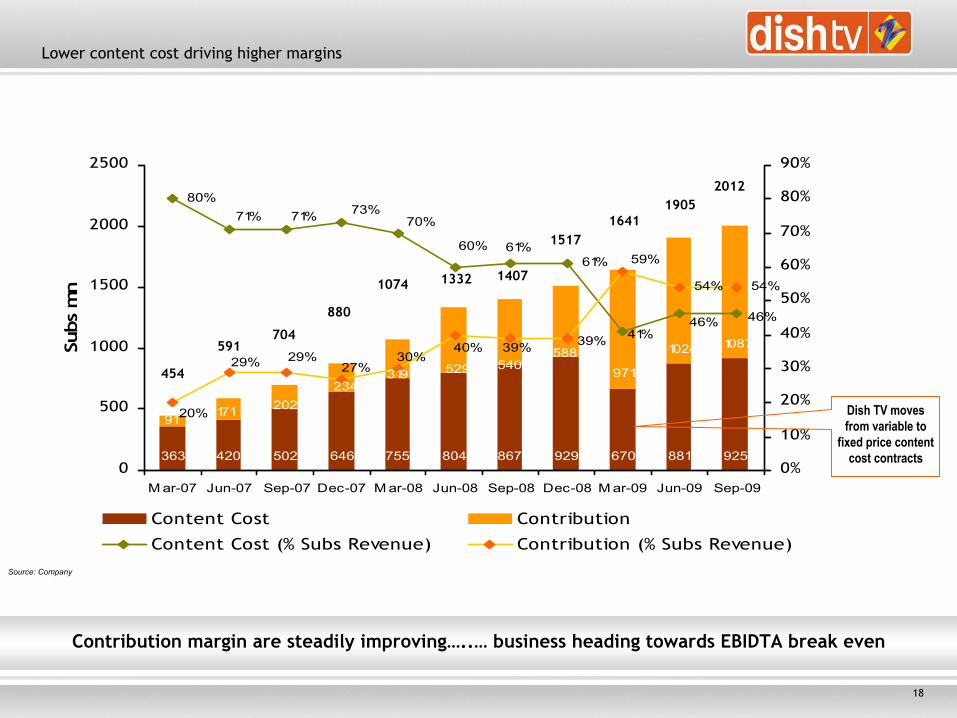
Lower content cost driving higher margins
Source: Company
Contribution margin are steadily improving…..… business heading towards EBIDTA break even
363 420 502 646 755 804 867 929 670 881 925
10871024
319
91171 202
234529 540
588
971
80%
61%
54% 54%
46%46%
71% 71% 73%
60% 61%
70%
41%39%40%
30%27%
29%29%
20%
59%
39%
0
500
1000
1500
2000
2500
M ar-07 Jun-07 Sep-07 Dec-07 M ar-08 Jun-08 Sep-08 Dec-08 M ar-09 Jun-09 Sep-09
Subs
mn
0%
10%
20%
30%
40%
50%
60%
70%
80%
90%
Content Cost Contribution
Content Cost (% Subs Revenue) Contribution (% Subs Revenue)
454
591704
880
1074 1332 1407
2012
1517
Dish TV moves from variable to
fixed price content cost contracts
16411905

19
Key business metricsARPU
ARPU under pressure with increased competition
Rational pricing to prevail as low pricing not sustainable over long term
Source: Dish TV; ARPU = (Subscription revenue + activation charges) / Avg. subscribers during the period; SAC = Subsidy on STB+80% of marketing exp.+Comm. to dealers
Subscriber acquisition cost
Focus on reducing subsidies – Moved to a model of charging for a bare box andun-bundling of the content fees and the Set top boxes
142132
137150
164
142
158139
100
110
120
130
140
150
160
170
180
Q3 FY08 Q4 FY08 Q1 FY09 Q2 FY09 Q3 FY09 Q4 FY09 Q1 FY10 Q2 FY10
INR
2034
1880
26342601
2832
2505 24872635
1,000
1,500
2,000
2,500
3,000
Q3 FY08 Q4 FY08 Q1 FY09 Q2 FY09 Q3 FY09 Q4 FY09 Q1 FY10 Q2 FY10
INR

20
Summary Financials – QuarterlyQuarter ended Sep-08 Mar-09 Sep-09
Gross Operating Revenue 1,733 2,071 2,575
Expenditure 2,607 2,027 2,344
EBITDA (874) 44 231
Add: Other Income 10 4
Less: Depreciation 495 644 730
EBIT (1,368) (590) (495)
Less: Financial Exps 171 217 66
PBT (1,539) (807) (562)
Provision for Tax 2 2 0
PAT (1,541) (809) (561)
Operating metrics Jun-08 Mar-09 Sep-09
Subscribers Added (mm) 0.53 0.35 0.41
SAC ( Rs/sub) 2,601 2,505 2635
ARPU ( INR ) 150 131 139
Source: Dish TV Earnings release and published quarterly results; Amounts in INR MM unless other wise mentioned

21
Investment summaryLarge and growing
DTH marketSubscribers expected to grow from c.17m in 2009 to c. 37mm in 2013 (MPA 2009 report)Competition to fuel growth to the DTH industry – currently only 6 players
Pioneer and leader of DTH services in India
Dish TV is the only player in the listed space in India and has been recognised as a BRANDFirst mover advantage – ~1 year lead over nearest competitor and ~ 3 year lead over othersLeader in the DTH industry - largest subscriber base ~ 5.9 mm (Sep-09)Backed by Zee Group One of India’s leading Media group
Full-servicebusiness model
Basic subscription packsValue added servicesBandwidthTeleport services
Large distribution network
Wide reach to 6,600 towns through 800 distributors and 48,000 dealers (Sep 09)8 Zonal and 9 regional offices (Sep 09)
Largest channel offering with diversified
content
240 channels & ServicesContent tie-ups at fixed rates – largest subscriber base to provide economies of scale
Advanced infrastructure
Only player with sufficient capacity to broadcast increasing channels – current 9ku band transpondersModel geared to grow in future – adding to transponder capacity and technologyupgrade on cards

Questions?

Thank you