dish tv india limited...tata sky 27% airtel 23% sun direct 11% reliance 2% market share (% of net...
TRANSCRIPT

1
2
Dish TV India LimitedInvestor Presentation

Disclaimer
Some of the statements made in this presentation are forward-looking statements and are based on the current beliefs, assumptions, expectations, estimates, objectives and projections of the directors and management of Dish TV India Limited about its business and the industry and markets in which it operates.
These forward-looking statements include, without limitation, statements relating to revenues and earnings. The words “believe”, “anticipate”, “expect”, “estimate", "intend”, “project” and similar expressions are also intended to identify forward looking statements. These statements are not guarantees of future performance and are subject to risks, uncertainties and other factors, some of which are beyond the control of the Company and are difficult to predict.
Consequently, actual results could differ materially from those expressed or forecast in the forward-looking statements as a result of, among other factors, changes in economic and market conditions, changes in the regulatory environment and other business and operational risks. Dish TV India Limited does not undertake to update these forward-looking statements to reflect events or circumstances that may arise after publication.
3
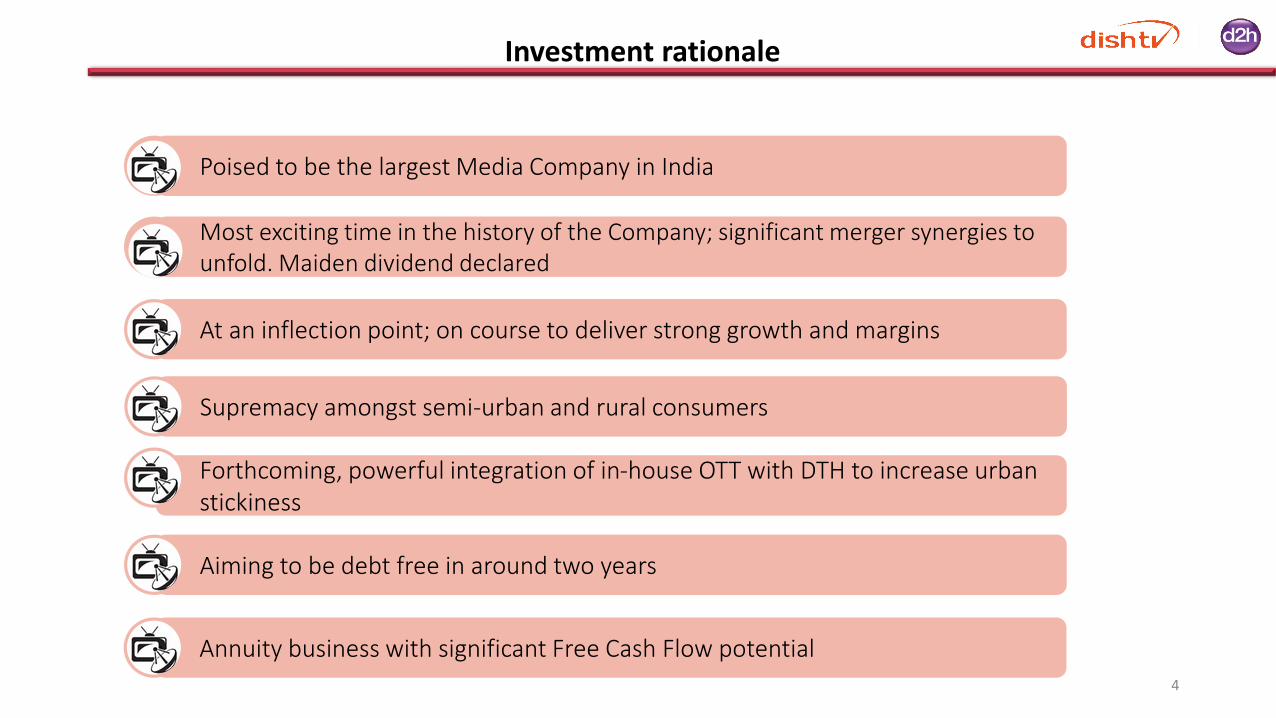
Investment rationale
4
Poised to be the largest Media Company in India1
Most exciting time in the history of the Company; significant merger synergies to unfold. Maiden dividend declared
2
At an inflection point; on course to deliver strong growth and margins3
Forthcoming, powerful integration of in-house OTT with DTH to increase urban stickiness
4
Aiming to be debt free in around two years 5
Annuity business with significant Free Cash Flow potential5
Supremacy amongst semi-urban and rural consumers3

Poised to be the largest media company in India
5
Total Revenue (Rs Bn.)Year ending 31 March 2018
66.962.4
57.250.3
37.6
29.623.7 23.3 23.0
15.4 12.9
0
25
50
75
ZeeEntertainment
Enterprises
Dish TV India Ltd Tata Sky Network 18Media &
Investments
AirtelDigital TV
Sun TVNetwork
PVR D.B.Corp JagranPrakashan
HathwayCable &
Datacom
Den Networks
EBITDA (Rs Bn.)Year ending 31 March 2018
21.0 20.819.7 18.2
14.2
5.8 5.6 4.3 3.5 2.8 1.9
(4)
4
12
20
Sun TVNetwork
ZeeEntertainment
Enterprises
Dish TV India Ltd Tata Sky AirtelDigital TV
JagranPrakashan
D.B.Corp PVR HathwayCable &
Datacom
Den Networks Network18Media &
Investments
Source: Annual reports & company filings

Significant merger synergies to unfold
6
SAMPLE
TEXTSAMPLE
TEXT
~1100 mnCapexsynergies
~700 mnInterest cost synergies
Revenue synergies
Content & administrative cost synergies
Backend services & call centre synergies
~3300 mnabove EBITDA level synergies
5100 mnMerger
synergies
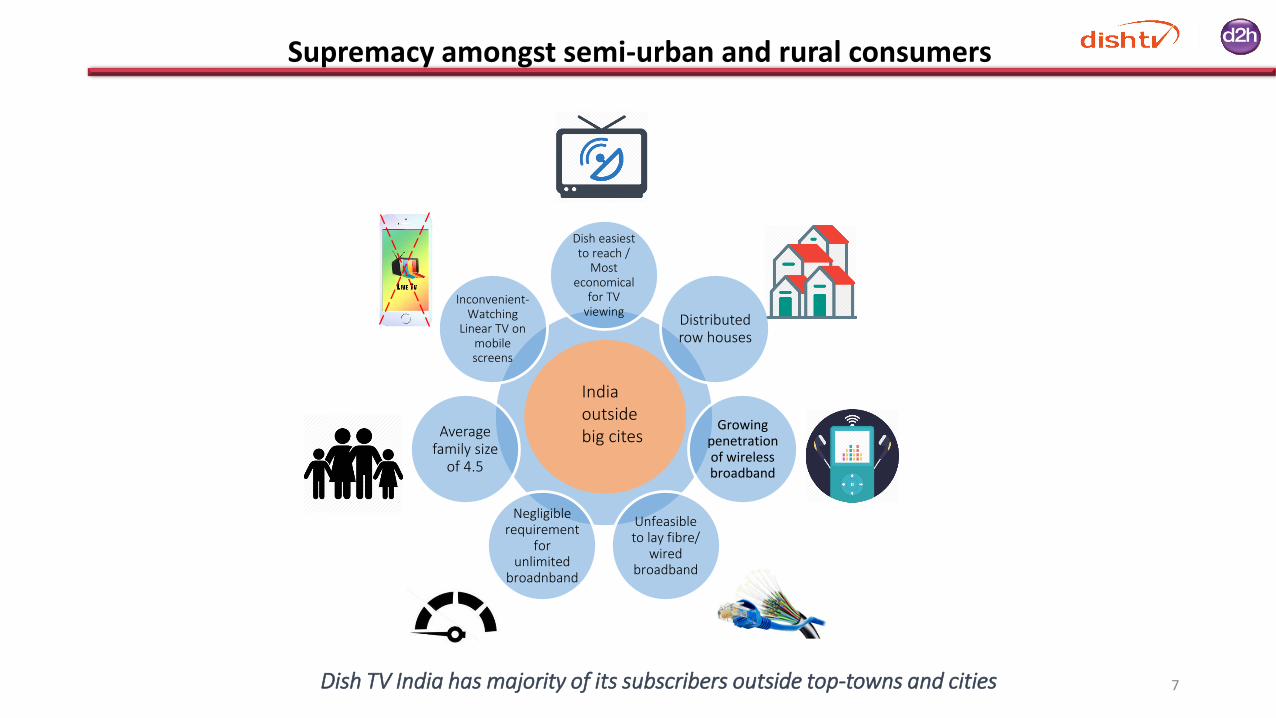
Supremacy amongst semi-urban and rural consumers
7
Dish easiest to reach /
Most economical
for TV viewing
Distributed row houses
Growing penetration of wireless broadband
Unfeasible to lay fibre/
wired broadband
Negligible requirement
for unlimited
broadnband
Average family size
of 4.5
Inconvenient-Watching
Linear TV on mobile screens
India outside big cites
Dish TV India has majority of its subscribers outside top-towns and cities
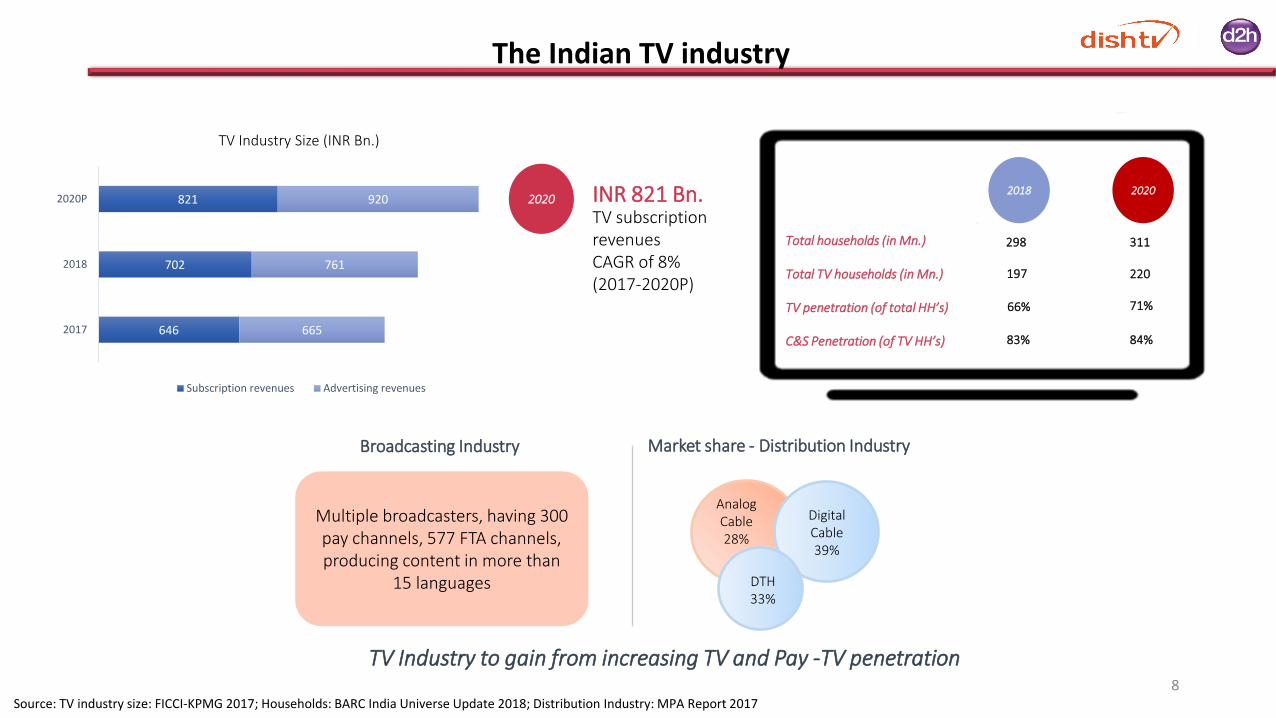
The Indian TV industry
8Source: TV industry size: FICCI-KPMG 2017; Households: BARC India Universe Update 2018; Distribution Industry: MPA Report 2017
AnalogCable28%
Digital Cable39%
Market share - Distribution Industry
DTH33%
2020 INR 821 Bn.TV subscription revenuesCAGR of 8%(2017-2020P)
TV Industry to gain from increasing TV and Pay -TV penetration
Broadcasting Industry
Multiple broadcasters, having 300 pay channels, 577 FTA channels, producing content in more than
15 languages
Total households (in Mn.)
Total TV households (in Mn.)
TV penetration (of total HH’s)
C&S Penetration (of TV HH’s)
2018 2020
298 311
197
66%
83%
220
71%
84%646
702
821
665
761
920
2017
2018
2020P
TV Industry Size (INR Bn.)
Subscription revenues Advertising revenues
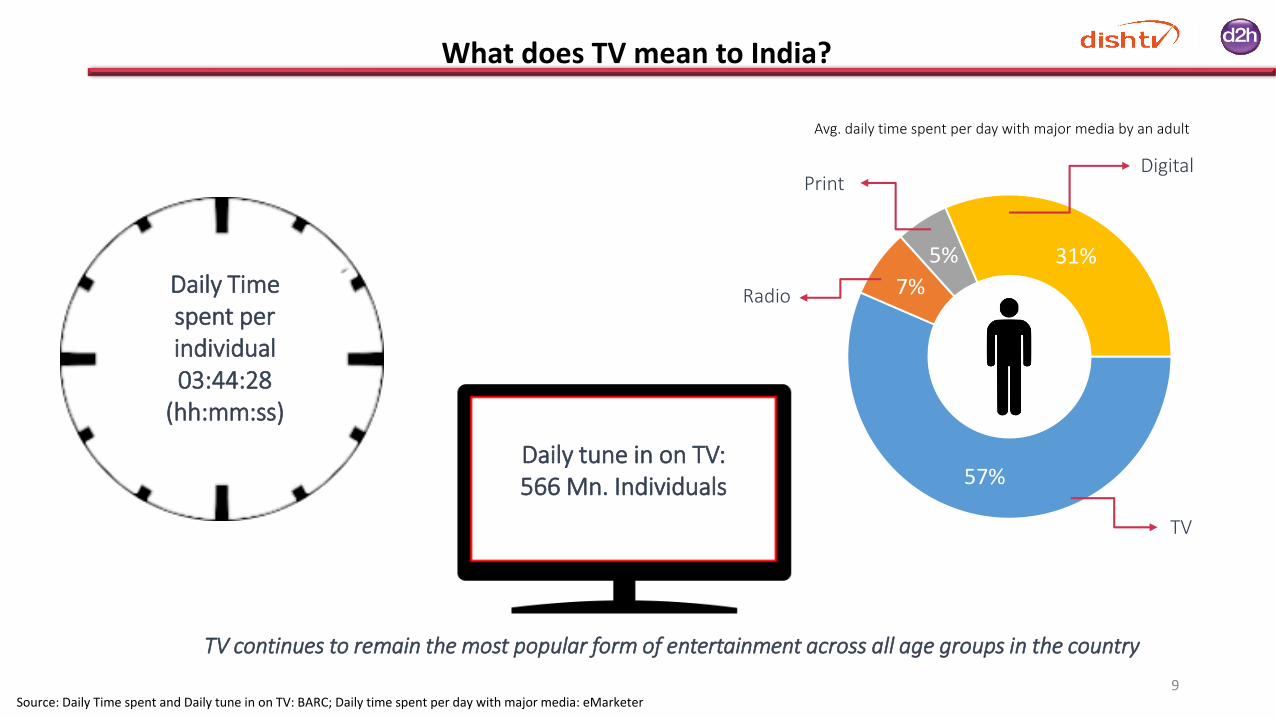
What does TV mean to India?
9Source: Daily Time spent and Daily tune in on TV: BARC; Daily time spent per day with major media: eMarketer
57%
7%
5% 31%
TV
Radio
Avg. daily time spent per day with major media by an adult
Digital
Daily tune in on TV:566 Mn. Individuals
Daily Time spent per individual03:44:28
(hh:mm:ss)
TV continues to remain the most popular form of entertainment across all age groups in the country
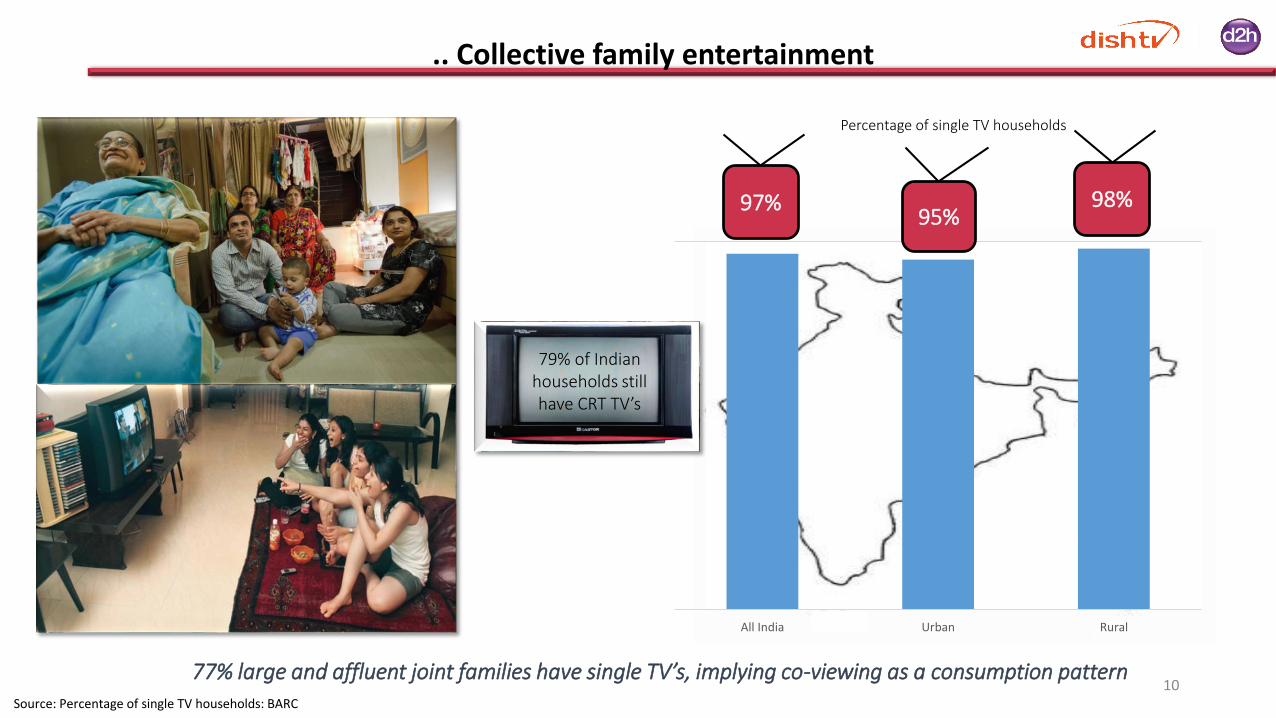
.. Collective family entertainment
10
All India Urban Rural
95%98%97%
Percentage of single TV households
Source: Percentage of single TV households: BARC
77% large and affluent joint families have single TV’s, implying co-viewing as a consumption pattern
79% of Indian households still have CRT TV’s

.. Across age groups
11Source: Share of TV viewership by, and across age groups: BARC
Share of TV viewership universe across age groups
0 1000 2000 3000 4000 5000 6000 7000 8000 9000 10000
51+ yrs
41-50 yrs
31-40 yrs
15-30 yrs
2-14 yrs
2017 2016
22%
Share of TV viewership universe by age groups(in Mn. impressions)
Contrary to popular perception, the youth contributes a massive 33% share of TV viewership, and has seen a growth of 22% in impressions over the year
20%
33%17%
14%
16%
Adults(31-40 yrs)
Youth(15-30 years)
Mature41-50 years
Kids(2-14 years)
Senior(>50 years)

And that is despite increasing internet penetration
12Source: Broadband subscribers: TRAI Subscription Report, December 2017; TV viewership impressions: BARC
20% growth in overall TV viewershipAll India internet penetration- 30%
0 2000 4000 6000 8000 10000
51+ yrs
41-50 yrs
31-40 yrs
15-30 yrs
2-14 yrs
Increasing TV viewership (in Mn. impressions)
2017 2016
40.770.4
120
218
345
14.5 15.3 16.5 18.1 17.9
0
50
100
150
200
250
300
350
400
Dec-13 Dec-14 Dec-15 Dec-16 Dec-17
Broadband subscribers (in Mn.)
Wireless broadband subs (mn) Fixed broadband subs (mn)
13
Pay - TV in India

An overview of the Pay - TV Industry
TV households
197 Mn.
Pay -TV
163 Mn.
Cable Subs
109 Mn.
DTH Subs
54 Mn.
Non - Pay
34 Mn.
Free Dish
22 Mn.
14Source: TV & Pay – TV HH: BARC Universe Update 2018; Distribution by platform: MPA Report 2017; Free Dish subscriber base: MIB Annual Report, 2018

Asymmetry in the Pay - TV Industry
15Source: MPA Report 2017
Abysmally low content cost per subscriber per month in cable is an ARPU dampener for the entire Pay - TV industry
DTH maximized gains from Digitization (initiated in 2012). Majority of cable additions were conversion from Analog to Digital
Despite having only a 32% market share, DTH contributes >53% of subscription revenues earned by broadcasters
Cable DTH
Subscriber market share (%) 67% 33%
Content cost (INR Mn.) 50,938 56,982
Contribution towards subscription revenues of broadcasters 47% 53%
TRAI Orders effective from July 3, 2018. Stakeholders have a period of 180 days to
implement the provisions of the Order.
Subscribers (in Mn.) 2011 2012 2013 2014 2015 2016 2017 2018
Net new additions by DTH 7.3 4.1 3.6 3.9 3.0 3.5 3.7 4.0
New digital additions by Cable 1.1 9.6 13.3 -1.5 9.7 13.5 10.2 6.9
Out of Which Analog seeding 0.0 7.6 11.5 0.0 8.2 12.1 9.0 5.8
Net new additions by Cable 1.1 2.0 1.9 -1.5 1.6 1.4 1.3 1.2
% of new additions by DTH 87% 67% 66% 100% 65% 72% 75% 78%
% of new additions by Cable 13% 33% 34% 0% 35% 28% 25% 22%
DTHCable
16
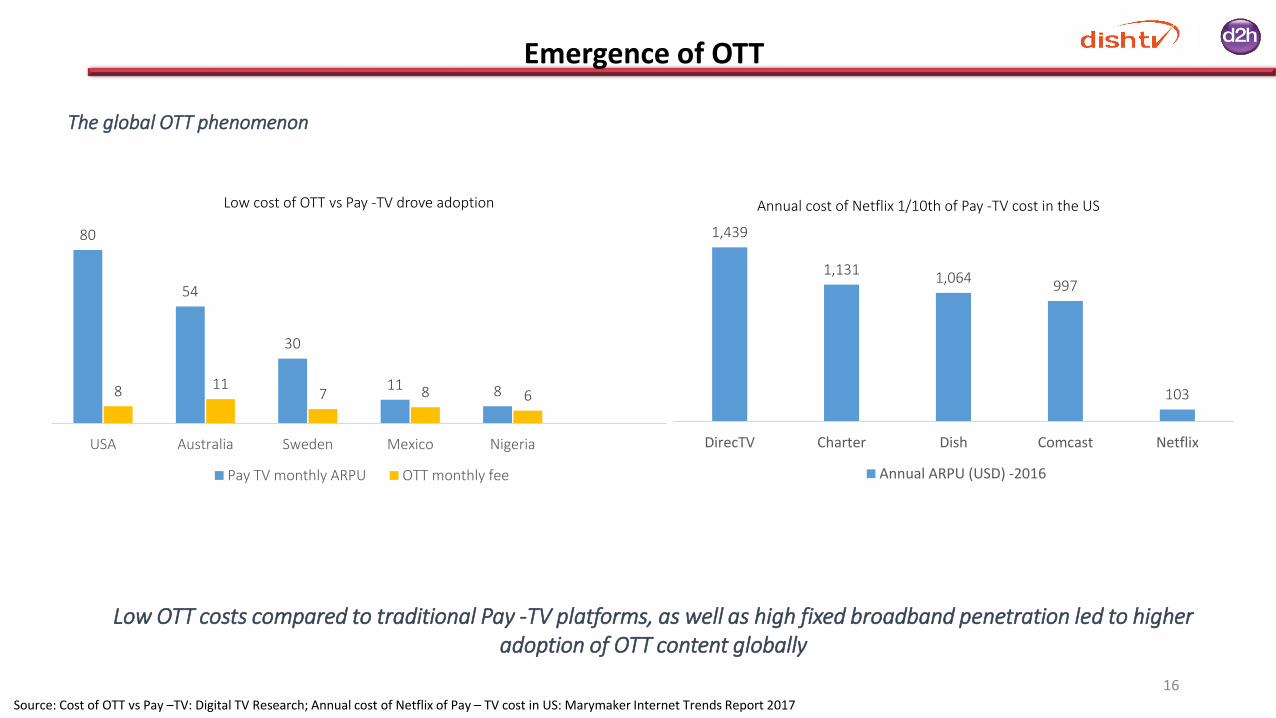
1,439
1,1311,064
997
103
DirecTV Charter Dish Comcast Netflix
Annual cost of Netflix 1/10th of Pay -TV cost in the US
Annual ARPU (USD) -2016
80
54
30
11 88 117 8 6
USA Australia Sweden Mexico Nigeria
Low cost of OTT vs Pay -TV drove adoption
Pay TV monthly ARPU OTT monthly fee
Source: Cost of OTT vs Pay –TV: Digital TV Research; Annual cost of Netflix of Pay – TV cost in US: Marymaker Internet Trends Report 2017
Low OTT costs compared to traditional Pay -TV platforms, as well as high fixed broadband penetration led to higher adoption of OTT content globally
Emergence of OTT
The global OTT phenomenon
17
600
180210
Netflix Cable Pack DTH Basic packs
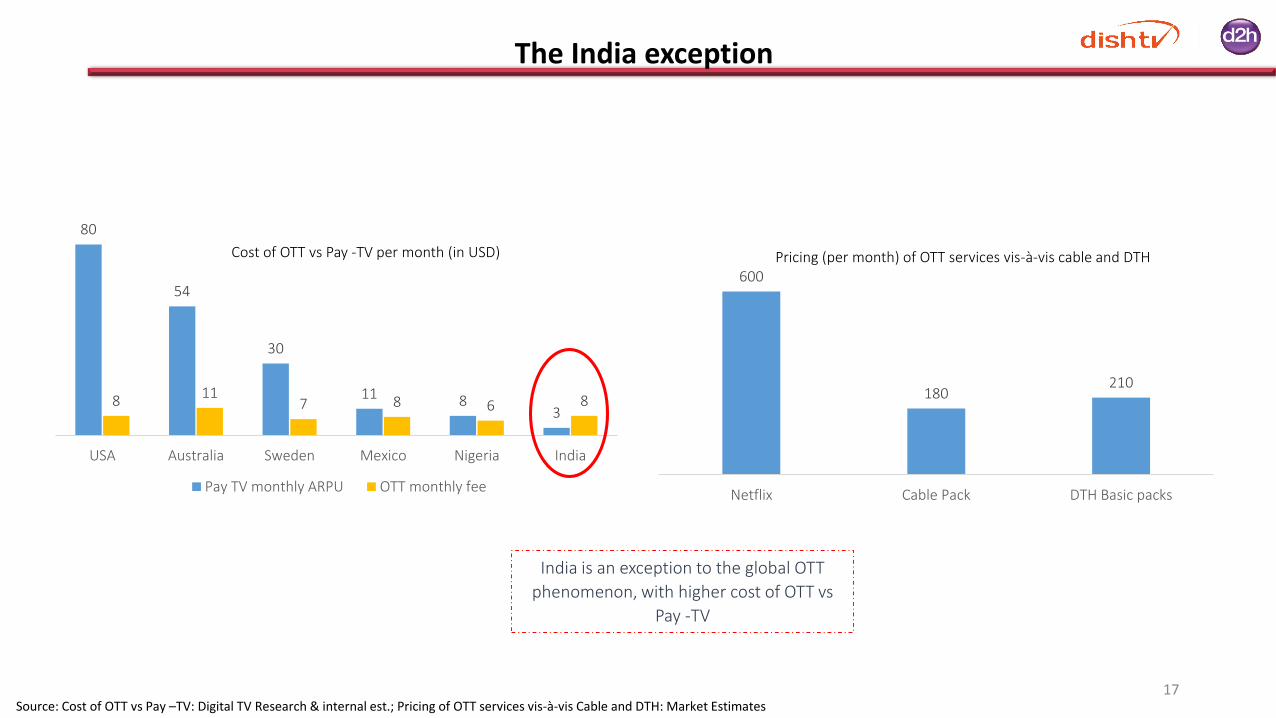
Pricing (per month) of OTT services vis-à-vis cable and DTH
India is an exception to the global OTT
phenomenon, with higher cost of OTT vs
Pay -TV
80
54
30
11 83
8 117 8 6 8
USA Australia Sweden Mexico Nigeria India
Pay TV monthly ARPU OTT monthly fee
Source: Cost of OTT vs Pay –TV: Digital TV Research & internal est.; Pricing of OTT services vis-à-vis Cable and DTH: Market Estimates
The India exception
Cost of OTT vs Pay -TV per month (in USD)
18
1 + 1 = 11

Our core values
19

Consolidation to lead to value creation
20
Dish TV-Videocon
37%
Tata Sky27%
Airtel23%
Sun Direct11%
Reliance2%
Market Share (% of net subscribers)
Source: Market share - TRAI Data, December 2017
Higher market share of the combined entity to create synergies
A combined entity with a significant presence across
India

Value creation through synergies
21
Leveraging strengths of
each company
Cost and financial synergies
Revenue synergies
Adopting best practises
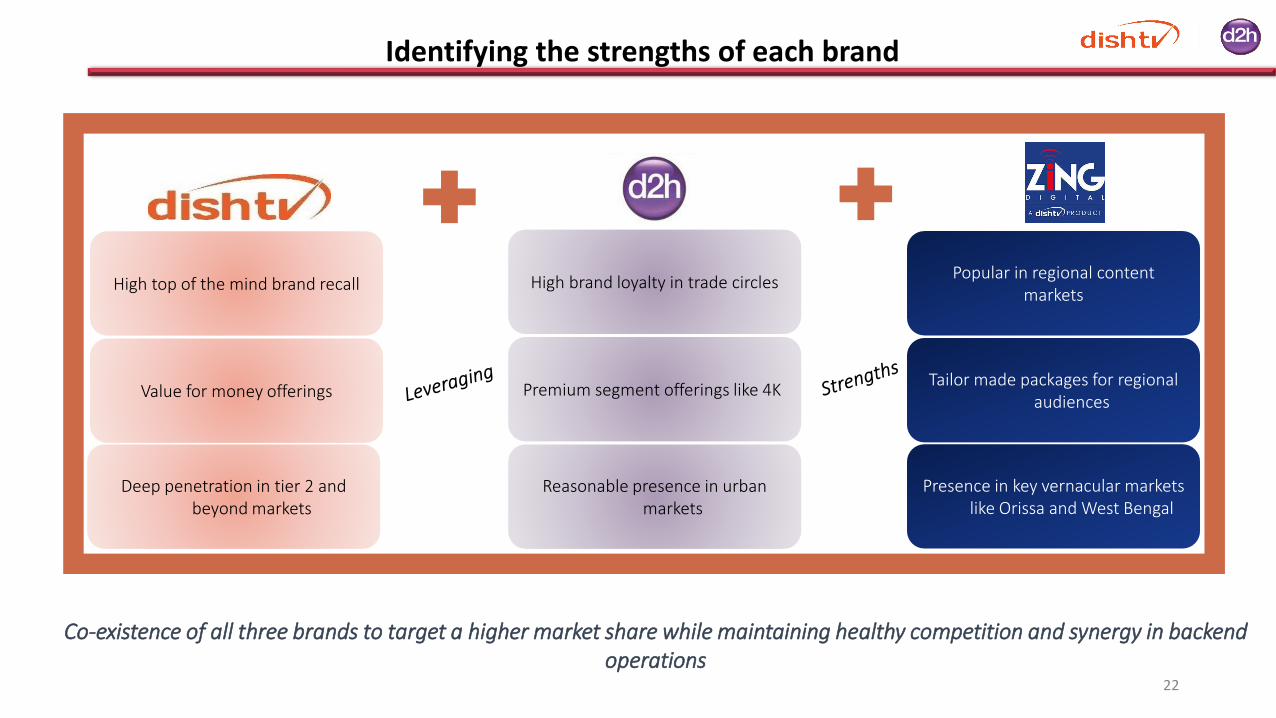
Identifying the strengths of each brand
22
High top of the mind brand recall
Value for money offerings
Deep penetration in tier 2 and beyond markets
High brand loyalty in trade circles
Premium segment offerings like 4K
Reasonable presence in urban markets
Popular in regional content markets
Tailor made packages for regional audiences
Presence in key vernacular markets like Orissa and West Bengal
Co-existence of all three brands to target a higher market share while maintaining healthy competition and synergy in backend operations
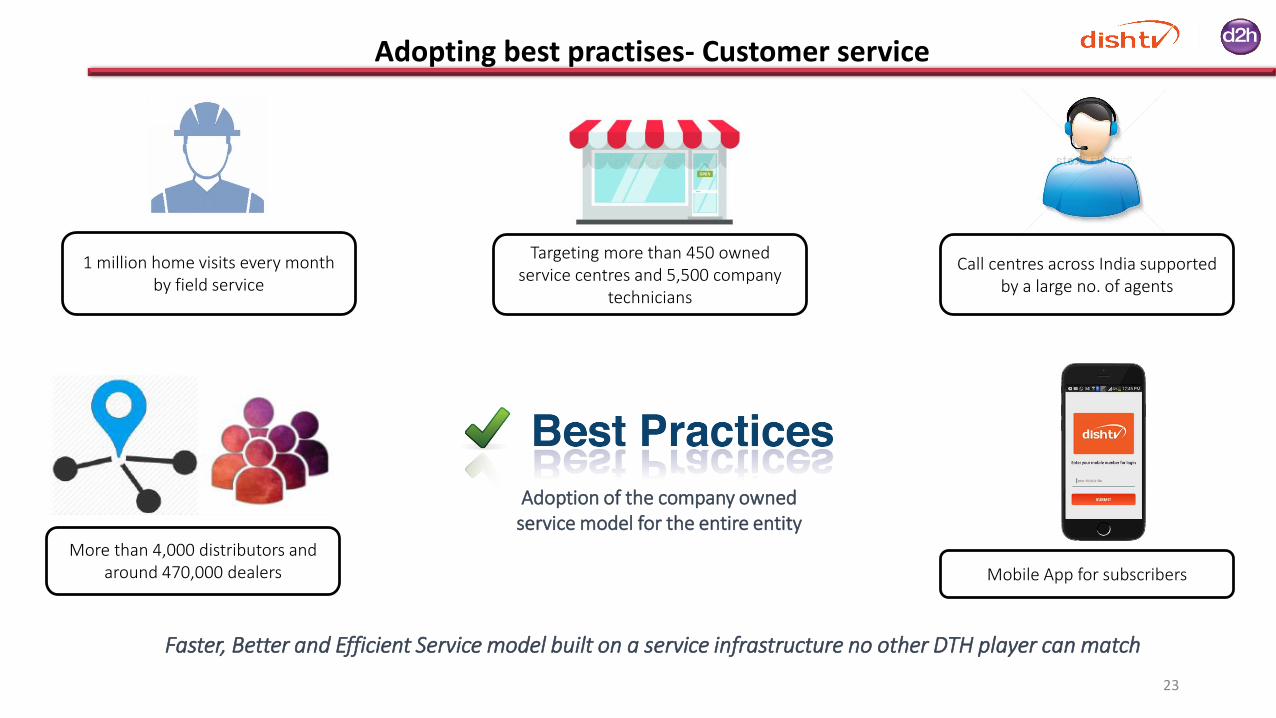
Adopting best practises- Customer service
23
1 million home visits every month by field service
Faster, Better and Efficient Service model built on a service infrastructure no other DTH player can match
Adoption of the company owned service model for the entire entity
More than 4,000 distributors and around 470,000 dealers Mobile App for subscribers
Call centres across India supported by a large no. of agents
Targeting more than 450 owned service centres and 5,500 company
technicians

Adopting best practises - Backend and IT Operations
24
IVR for faster response
Optimising AHT for better customer experience
Cross utilising critical infrastructure for synergies
Inbound/outbound swap
Synergising backend operations to reap long term benefits and faster turnaround time for customer resolutions
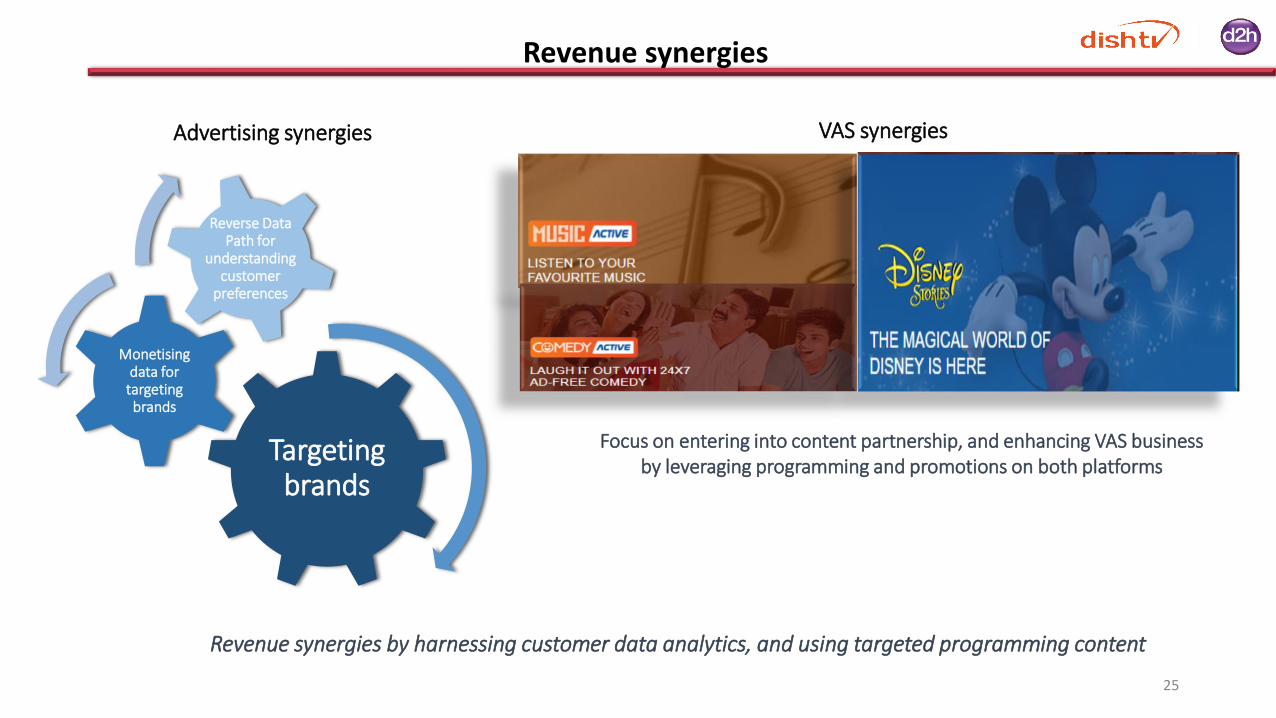
Revenue synergies
25
Targeting brands
Monetising data for
targeting brands
Reverse Data Path for
understanding customer
preferences
Advertising synergies VAS synergies
Focus on entering into content partnership, and enhancing VAS business by leveraging programming and promotions on both platforms
Revenue synergies by harnessing customer data analytics, and using targeted programming content
Cost and financial synergies
26
Re-balancing transponder capacity
Optimising content payout
Minimising borrowing costs
Leveraging scale for better negotiations
Cost and financial synergies

27
Entering the New Era

Reinvigorating the new entity
28
#JeetoSaareHeart
New leadership mix comprising of select professionals from both
entities
Separate sales teams with uniform structures
Fresh campaigns and branding initiatives. New Brand
Ambassador
Taking the lead in the industry with new customer centric packs-
‘Mera Apna Pack’
The beginning of the transformation into India’s most loved DTH brand!

Sharper customer focus with High Definition
29* Exclusive of taxes
Dish TV HD Add-Ons
English Club HD @ 106*
All Sports HD @ 84*
Maxi Sports HD @ 64*
Sports HD South @ 84*
All Sports HD South @ 102*
Sharper than ever focus on boosting HD acquisition and recharges by maximising combined shelf and
retail visibility
Encouraging HD sampling through economical, must-have HD bouquets
Focus on High Definition offerings across brands for ARPU accretion
Launch of new HD compliant STB’s that would be more
economical than the existing STB’s

30
Financials
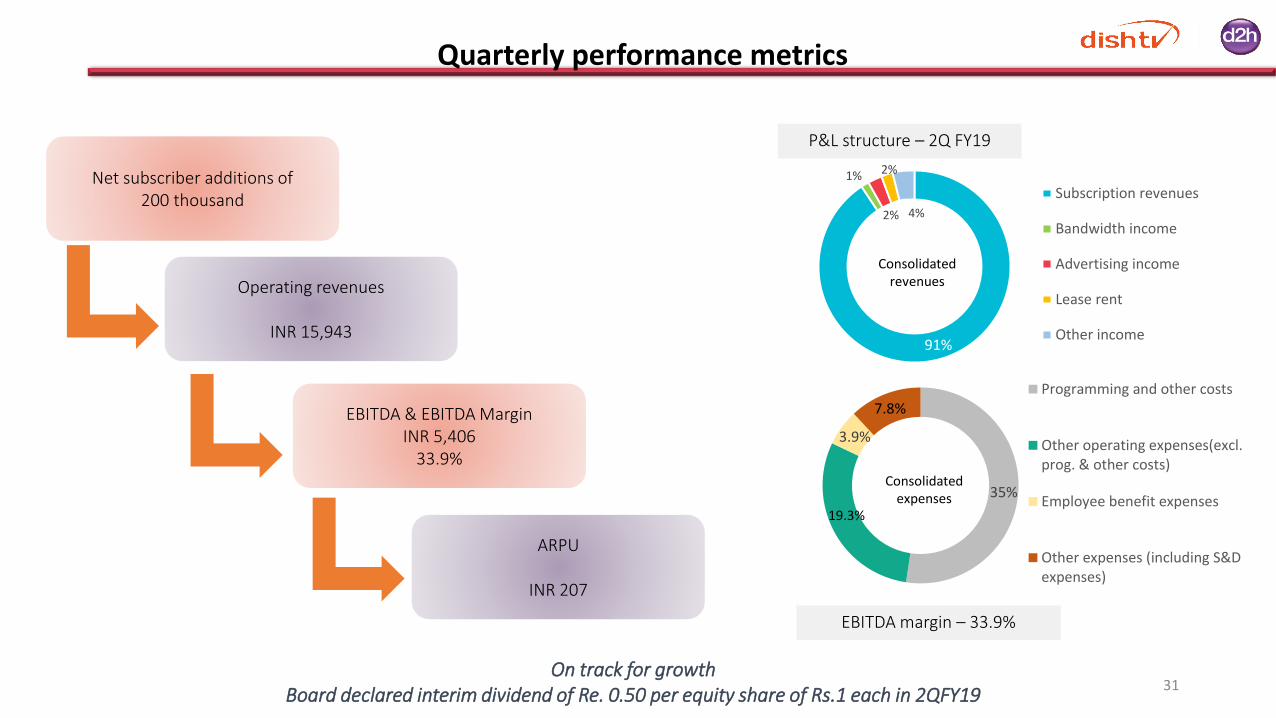
Quarterly performance metrics
31
Net subscriber additions of 200 thousand
EBITDA margin – 33.9%
Operating revenues
INR 15,943
EBITDA & EBITDA MarginINR 5,406
33.9%
ARPU
INR 207
91%
1% 2%
2% 4%
Subscription revenues
Bandwidth income
Advertising income
Lease rent
Other income
Consolidated revenues
35%
19.3%
3.9%
7.8%Programming and other costs
Other operating expenses(excl.prog. & other costs)
Employee benefit expenses
Other expenses (including S&Dexpenses)
Consolidated expenses
P&L structure – 2Q FY19
On track for growthBoard declared interim dividend of Re. 0.50 per equity share of Rs.1 each in 2QFY19
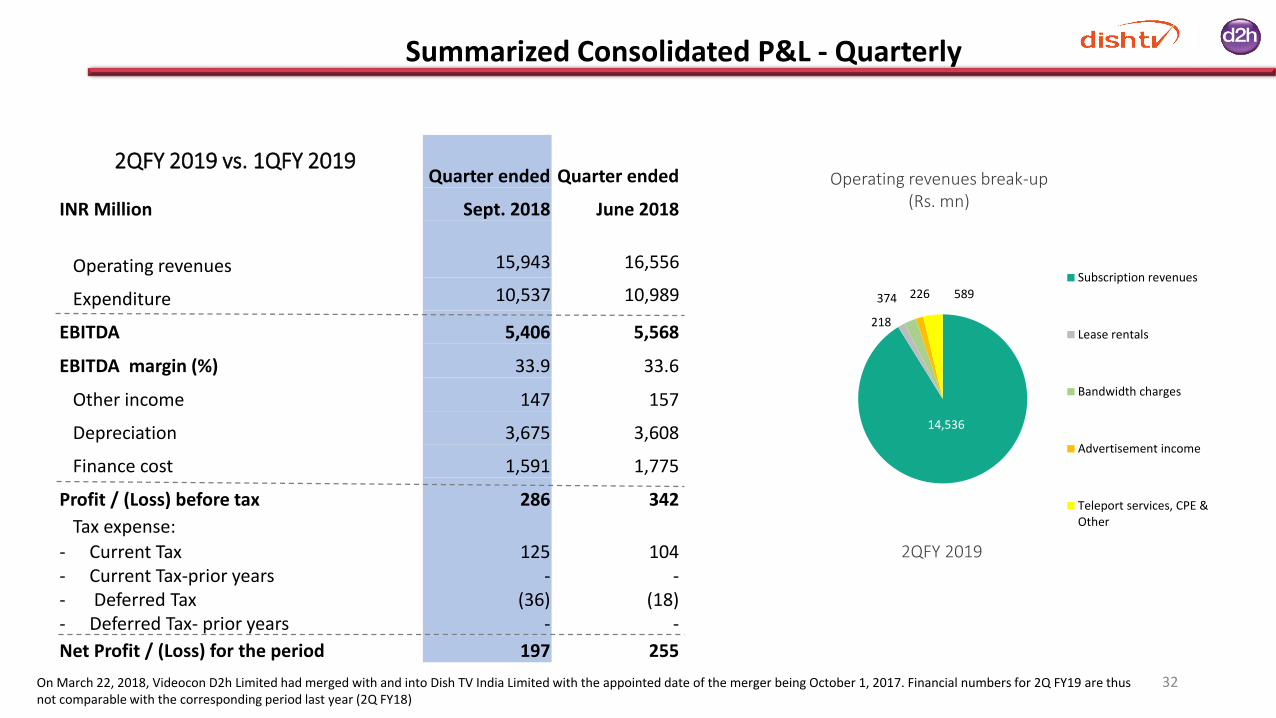
Quarter ended Quarter ended
INR Million Sept. 2018 June 2018
Operating revenues 15,943 16,556
Expenditure 10,537 10,989
EBITDA 5,406 5,568
EBITDA margin (%) 33.9 33.6
Other income 147 157
Depreciation 3,675 3,608
Finance cost 1,591 1,775
Profit / (Loss) before tax 286 342
Tax expense:
- Current Tax- Current Tax-prior years- Deferred Tax- Deferred Tax- prior years
125-
(36)-
104-
(18)-
Net Profit / (Loss) for the period 197 255
2QFY 2019 vs. 1QFY 2019Operating revenues break-up
(Rs. mn)
2QFY 2019
Summarized Consolidated P&L - Quarterly
14,536
218
374 226 589
Subscription revenues
Lease rentals
Bandwidth charges
Advertisement income
Teleport services, CPE &Other
32On March 22, 2018, Videocon D2h Limited had merged with and into Dish TV India Limited with the appointed date of the merger being October 1, 2017. Financial numbers for 2Q FY19 are thus not comparable with the corresponding period last year (2Q FY18)
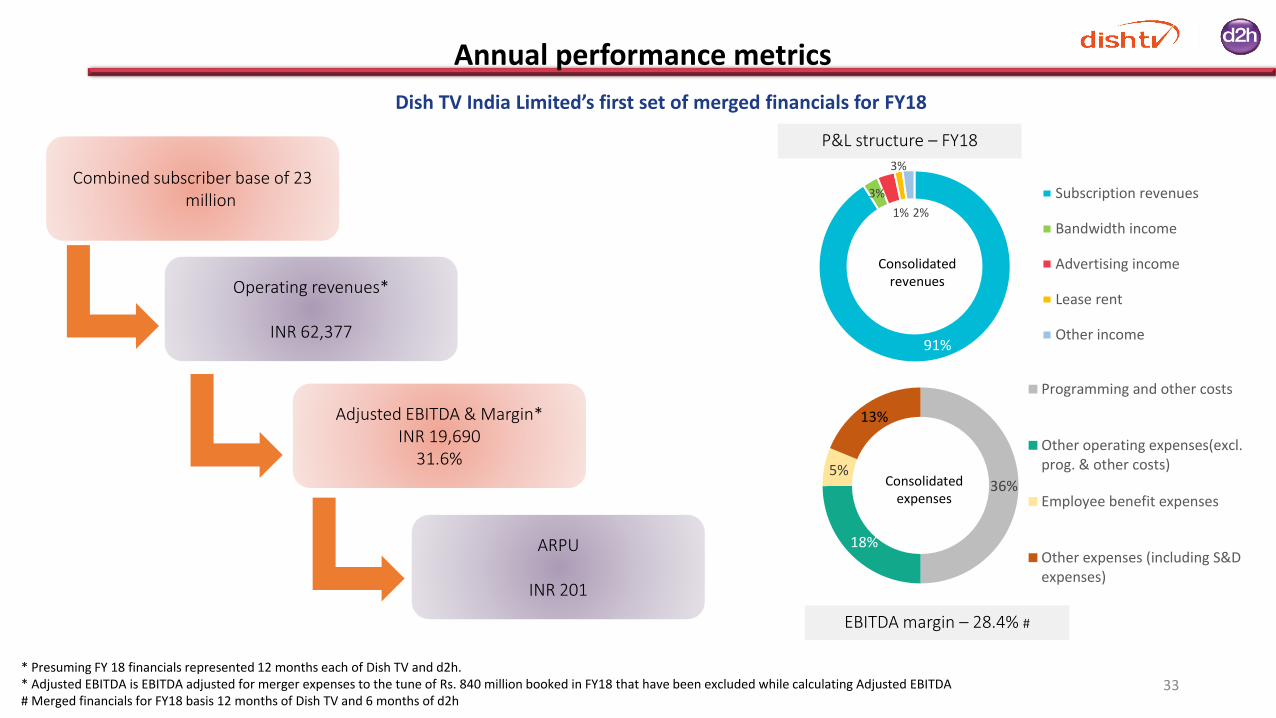
Annual performance metrics
33
Dish TV India Limited’s first set of merged financials for FY18
Combined subscriber base of 23 million
EBITDA margin – 28.4% #
Operating revenues*
INR 62,377
Adjusted EBITDA & Margin*INR 19,690
31.6%
ARPU
INR 201
91%
3%
3%
1% 2%
Subscription revenues
Bandwidth income
Advertising income
Lease rent
Other income
Consolidated revenues
36%
18%
5%
13%
Programming and other costs
Other operating expenses(excl.prog. & other costs)
Employee benefit expenses
Other expenses (including S&Dexpenses)
Consolidated expenses
P&L structure – FY18
* Presuming FY 18 financials represented 12 months each of Dish TV and d2h. * Adjusted EBITDA is EBITDA adjusted for merger expenses to the tune of Rs. 840 million booked in FY18 that have been excluded while calculating Adjusted EBITDA# Merged financials for FY18 basis 12 months of Dish TV and 6 months of d2h

Yearended
Yearended
INR Million Mar. – 2018 Mar. – 2017
Operating revenues 46,342 30,144
Expenditure 33,181 20,464
EBITDA 13,160 9,680
EBITDA margin (%) 28.4 32.1
Other income 542 615
Depreciation 10,717 6,908
Financial expenses 3,964 2,292
Profit / (Loss) before tax (979) 1,095
Current TaxCurrent Tax-prior periodDeferred Tax
53(30)
(166)
9820
(708)
Deferred Tax- prior period 13 -
Net Profit / (Loss) for the period (849) 821
FY 2018 vs. FY 2017Operating revenues break-up
(INR Mn.)
FY 2018
Summarized Consolidated P&L- Annual
42,167
1,225
1,375
670 905
Subscription revenues
Lease rentals
Bandwidth charges
Advertisement income
Teleport services, CPE &Other
34Financials of Dish TV India Limited for the year ended March 31, 2018 represent 12 months financial performance of Dish TV India Limited and 6 months financial performance of Videocon d2h Limited. Financial numbers for FY18 are thus not comparable with FY17. Presuming FY18 financials had represented 12 months each, operating revenues and EBITDA of the Company would have been Rs. 62,377 million and Rs. 19,690 million respectively.

INR Million Sept. 2018 (Unaudited)
Equity and liabilities
Equity
(a) Equity share capital 1,841
(b) Other equity 66,008
(c) Non-controlling interest (277)Liabilities(1) Non-current liabilities
(a) Financial liabilities
(i) Borrowings 20,139
(ii) Other financial liabilities 0
(b) Provisions 419
(c) Other non-current liabilities 557(2) Current liabilities
(a) Financial liabilities
(i) Borrowings 2,334
(ii) Trade payables 10,631
(iii) Other financial liabilities 12,370
(b) Other current liabilities 21,290(c) Provisions(d) Current tax liabilities (net)
30,058229
Total Equity & Liabilities 1,65,600
Consolidated Balance Sheet
35

INR Million Sept. 2018 (Unaudited)Assets(1) Non-current assets
(a) Property, plant & equipment 34,615(b) Capital work in progress 7,471(c) Goodwill 62,754(d) Other intangible assets 22,106(e) Financial assets
(i) Investments 1,500(ii) Loans 153(iii) Other financial assets 94
(f) Deferred tax assets (net) 6,080(g) Current tax assets (net) 1,111(h) Other non-current assets 2,210
(2) Current assets(a) Inventories 467(b) Financial assets
(i) Investments(ii) Trade receivables(iii) Cash and cash equivalents(iv) Bank balances other than (iii) above(v) Loans(vi) Other financial assets
(c) Other current assets
01,6011,0821,440
7315,080
7,762
Total assets 1,65,600
36

Thank You