discussion paper property and wealth taxes in the uk · to tax property and wealth in the uk...
TRANSCRIPT

Institute for Public Policy Research
Kayte Lawton and Howard Reed
March 2013 © IPPR 2013
DISCUSSION PAPER
PROPERTY AND WEALTH TAXES IN THE UK THE CONTEXT FOR REFORM

ABOUT THE AUTHORS
Kayte Lawton is a senior research fellow at IPPR.
Howard Reed is the director of Landman Economics.
ACKNOWLEDGMENTS
The authors would like to thank IPPR colleagues Imogen Parker, for research support, and Tony Dolphin, Graeme Cooke and Nick Pearce for comments on earlier drafts. We would also like to
thank those who participated in a workshop on the IPPR wealth tax model: Rebecca Ambler, Francesca Bastagli, John Cullinane, Howard Glennerster, James Gregory, Horacio Levy,
James Lloyd, Graham Stark and John Whiting.
This project was generously supported by the Nuffield Foundation.
This report contains analysis based on data from the Wealth and Assets Survey. This dataset was created by the Office for National Statistics and data collection was
sponsored by the Department for Work and Pensions, the Department for Business, Innovation and Skills, HM Revenue and Customs, the Department for Communities
and Local Government, the Scottish Government and the Financial Services Authority. The data is distributed by the UK Data Archive and is subject to
Crown copyright. Crown copyright material is reproduced with the permission of the controller of the HMSO and the Queen’s Printer for Scotland. The
original data creators, depositors, copyright holders, funders and the UK Data Archive bear no responsibility for the analysis or interpretation
contained in this report.
ABOUT IPPRIPPR, the Institute for Public Policy Research, is the UK’s leading progressive thinktank. We produce rigorous research and innovative policy ideas for a fair, democratic and sustainable world.
We are open and independent in how we work, and with offices in London and the North of England, IPPR spans a full range of local and national policy debates. Our international partnerships extend IPPR’s influence and reputation across the world.
IPPR 4th Floor 14 Buckingham Street London WC2N 6DF T: +44 (0)20 7470 6100 E: [email protected] www.ippr.org Registered charity no. 800065
This paper was first published in March 2013. © 2013 The contents and opinions expressed in this paper are those of the author(s) only.
BOLD IDEASfor CHANGE
ABOUT THE NUFFIELD FOUNDATIONThis project was generously supported by the Nuffield Foundation.
The Nuffield Foundation is an endowed charitable trust that aims to improve social wellbeing in the widest sense. It funds research and innovation in education and social policy and also works to build capacity in education, science and social science research. More information is available at www.nuffieldfoundation.org
The Nuffield Foundation has funded this project, but the views expressed are those of the authors and not necessarily those of the Foundation.

IPPR | Property and wealth taxes in the UK: The context for reform1
Introduction...................................................................................................................2
The IPPR wealth tax model .........................................................................................3
1..Why.should.wealth.be.taxed?...................................................................................4
1.1 Revenues .............................................................................................................4
1.2 Social justice ........................................................................................................7
1.3 Economic efficiency ..............................................................................................8
2..UK.property.and.wealth.taxes:.the.case.for.reform................................................10
2.1 Council tax .........................................................................................................10
2.2 Stamp duty ........................................................................................................12
2.3 Inheritance tax ....................................................................................................12
2.4 Conclusion .........................................................................................................13
3..Reforming.property.and.wealth.taxes.....................................................................14
3.1 Property and land taxes ......................................................................................14
3.2 A net wealth tax ..................................................................................................24
3.3 Estates, gifts and inheritances .............................................................................26
4..Conclusions.and.areas.for.further.research............................................................28
Further development of the IPPR wealth tax model ....................................................29
References..................................................................................................................30
Annex.1:.Technical.details.of.the.IPPR.wealth.tax.model...........................................33
1. Data used in the model .........................................................................................33
2. Scope and coverage of the IPPR wealth tax model ................................................36
Annex.2:.The.WAS.data...............................................................................................39
1. Comparison of WAS and FRS data .......................................................................39
2. Comparing modelled income and wealth in the WAS dataset .................................42
CONTENTS
ErratumDecember 2014: figure 3.1 on page 17 has been revised to correctly identify the £ effect income and wealth decile series.

IPPR | Property and wealth taxes in the UK: The context for reform2
The 2008 financial crash, weak recovery and demands of deficit reduction have pushed wealth taxes further up the political agenda, yet the question of how best to tax property and wealth in the UK remains unresolved. Private households in the UK own an estimated £10.3 trillion in property and other assets, much of which is very unevenly distributed and some of which attracts little taxation. The need to find additional public resources to lessen the pace of spending cuts in the short term and fund growing demand for public services in the long term makes this an attractive potential tax base, which partly explains the interest in a ‘mansion tax’ shown by both Labour and the Liberal Democrats. However, while it is generally accepted that the current system of property and wealth taxation in the UK is highly flawed – suggesting this is an area ripe for reform – there is no broad political consensus on whether and how different forms of wealth should be taxed. There is also a lack of evidence about the potential impact of different approaches.
The purpose of this report is to provide a critical assessment of the options for reforming wealth taxes in the UK, drawing on new analysis using the IPPR wealth tax model together with comparative analysis of wealth tax regimes in other OECD countries. The IPPR wealth tax model is a microsimulation of household wealth for the UK, which assesses the impact of changes to the taxation of wealth on the incomes and assets of households and on the public finances. Designed to help policymakers and other stakeholders better understand the effect of different reforms, the model is unique in the UK and this is the first report to publish analysis using it.
The case for wealth taxes is often made on theoretical grounds, focusing on arguments of economic efficiency and social justice. While these remain critical arguments, and are discussed in this report, analysis of the political context in which politicians would have to seek to advance reform is often missing. By drawing on historical and international experiences of taxing wealth and providing new analysis of the potential fiscal and distributional impacts of reform, we aim to provide a more balanced picture of the scope for reforming wealth taxes in the UK. In future work, we will develop concrete policy proposals in the priority areas identified in this report.
We use the term ‘wealth taxes’ to cover taxes on property and land as well as other assets, which could include private pension wealth, savings, financial investments and physical assets like vehicles and fine art. We include taxes on the value of wealth holdings as well as on the transfer or sale of assets.
The report begins by setting out the theoretical case for taxing different forms of wealth, whether to raise revenue, advance social justice or improve economic efficiency. Chapter 2 outlines the weaknesses of the current UK wealth tax regime, making the case for the reform or replacement of council tax, stamp duty and inheritance tax. We then examine alternative options for reform in chapter 3, and the concluding chapter 4 sets out the priorities for further analysis and policy development.
INTRODUCTION

IPPR | Property and wealth taxes in the UK: The context for reform3
The IPPR wealth tax modelThe IPPR wealth tax model is a computer programme that estimates the effects of changes to the taxation of wealth on household budgets and on aggregate tax revenues. It does this using detailed and representative micro-data about the ownership of different kinds of assets by private households. The main dataset used in the model is the Wealth and Assets Survey (WAS) of around 30,000 households in England, Scotland and Wales (but excluding Northern Ireland). The analysis detailed in this report uses data collected by the WAS between July 2006 and June 2008, referred to as ‘wave one’. Prices are uprated to 2012 values (further details in annex 1). The WAS is the most authoritative source of micro-data on household wealth holdings in Britain and collects detailed information on four groups of assets: property, private pensions, financial assets and physical assets. The IPPR model also makes use of WAS data on demographics, region, housing tenure, employment status and income, as well as data from other sources including the British Household Panel Survey (BHPS).
The model can currently be used to analyse the impact of taxes on the capital value of wealth holdings (net or gross and applied to total wealth or specific kinds of wealth, such as property) and on property transactions. The impact of changes to inheritance tax can also be assessed, however the number of households receiving an inheritance in the data is very small so the value of the results are limited. The results produced by the model show the average effect on household income or wealth holdings (currently excluding pension and physical wealth) by income or wealth decile. Pension assets are excluded because they are normally taxed in different ways to other forms of wealth; physical assets are excluded because the WAS only asks questions about physical wealth to half the sample (see annex 1 for more details). The distributional analysis can also be performed by household type and work status.
Although the WAS data is the best source of micro-data on household wealth, it also has some limitations that make it difficult to model some kinds of wealth taxes. Since it is a survey of private households, it does not capture all wealth holdings. This makes it difficult to accurately analyse the full effects of some property and land taxes, because a substantial share of property and land is owned by companies and trusts. Wave one of the WAS also contains little information about wealth transactions other than property purchases, which makes it less useful for modelling the impact of taxes on financial transactions or on the capital gains associated with the sale of some assets, for example. With the release of further waves of longitudinal WAS data and improvements to the questionnaire design, some of these issues can be resolved through further development of the model.

IPPR | Property and wealth taxes in the UK: The context for reform4
Before considering how wealth taxes should be reformed, it is important to understand the rationale for taxing wealth and how this varies for different kinds of assets and activities. In this chapter, we examine the theoretical case for wealth taxes under three broad headings: their ability to raise revenues, their impact on social justice and their role in improving the functioning of the economy.
1.1 RevenuesThe most important rationale for any tax is that it raises revenues to be spent on the things we choose to provide collectively, such as public services and benefits. Table 1.1 shows that the major sources of revenue in the UK are income tax, national insurance contributions (NICs) and VAT. Together, these taxes are forecast to contribute 60 per cent of all government receipts in 2012–13. By contrast, taxes on property and other forms of wealth are expected to make up just 7 per cent of revenues in the same year. Of these, council tax is the most important, bringing in around £26 billion or 4.4 per cent of aggregate revenues. Stamp duties, inheritance tax and capital gains tax together are forecast to account for less than three per cent of total revenues.
Revenue.2012–13.(forecast)
%.of..total.receipts
Income tax £154bn 25.9
NICs £104bn 17.5
VAT £101bn 17.0
Corporation tax £40bn 6.7
Fuel duties £26bn 4.4
Business rates £26bn 4.3
Alcohol and tobacco duties £20bn 3.4
Property and wealth taxes £42bn 7.1
Council tax £26.3bn 4.4
Stamp duty land tax £6.5bn 1.1
Inheritance tax £3.1bn 0.5
Capital gains tax £3.7bn 0.6
Stamp duty on shares £2.4bn 0.4
Other taxes and receipts £81bn 13.7
Total.receipts £594bn –
Source: OBR 2012
Revenues from stamp duties and inheritance tax tend to rise and fall with the business cycle whereas revenues from council tax and its predecessors have been relatively stable. Stamp duties have increased in importance since the mid-1990s, partly due to house price rises that outstripped increases in tax thresholds, and partly because of the introduction of higher rates for more expensive properties from 1997. Stamp duties rose to 2.6 per cent of revenues in 2007–08 before falling sharply at the start of the 2008–09 recession, due to a drop in house prices and sales. Inheritance tax revenues fell by around 0.2 points as a share of revenue in 2008–09, although from a low base of just 0.7 per cent. Historically, estate taxes and other property taxes were much more important in the UK, but over the last century, taxes on income and consumption have become the dominant source of revenue, and have become much more accepted as sources of taxation than wealth.
1. WHYSHOULDWEALTHBETAXED?
Table.1.1..UK government revenues
and receipts, 2012–13

IPPR | Property and wealth taxes in the UK: The context for reform5
0%
1%
2%
3%
4%
5%
6%
7%
8%
2012
–13
2010
–11
2008
–09
2006
–07
2004
–05
2002
–03
2000
–01
1998
–99
1996
–97
1994
–95
1992
–93
1990
–91
1988
–89
1986
–87
1984
–85
1982
–83
1980
–81
1978
–79
Council tax / Community charge / Domestic rates
Stamp duties
Inheritance tax / Capital transfer tax / Estate duty
Source: IFS revenue tables, http://www.ifs.org.uk/fiscalFacts/fiscalAggregates Note: Stamp duties include stamp duty land tax and stamp duty on shares, as separate figures are not available prior to 2002.
Figure 1.2 shows that property and wealth taxes are not a major source of revenue in any OECD country, although they remain more important for the UK than elsewhere. Only France collected a larger share of GDP in property and wealth taxes than the UK in 2010 and France was the only country to raise more than three per cent of GDP in this way. The importance of property and wealth taxes to the UK’s tax base compared to other OECD countries means that the scope for the UK to raise a substantially larger share of revenues from property and wealth taxes is unclear. Prior to the 2008–09 global downturn, property taxes made a greater contribution to revenues in countries that had experienced particularly large housing market booms, including Spain and Ireland, but this was ultimately unsustainable.
0% 1% 2% 3% 4%
OECD totalNew Zealand
USCanadaAustriaIceland
IsraelDenmarkPortugal
JapanGermany
GreeceSweden
IrelandFinland
NetherlandsAustraliaNorway
ItalySwitzerland
SpainKorea
BelgiumUK
France
Transactions
Gift and estate
Annual recurrent
Immovable property
Source: Author’s calculations using data from http://stats.oecd.org/
Figure.1.1..Property and wealth
taxes as a share of total revenues, 1978–2012 (UK)
Figure.1.2..Property and wealth taxes as a share of
GDP in selected OECD countries, 2010

IPPR | Property and wealth taxes in the UK: The context for reform6
Figure 1.2 also highlights the high degree of variation in the structure of property and wealth taxes across OECD countries, whereas the structure of labour and consumption taxes are relatively consistent across advanced economies (Boadway et al 2010). This suggests that there is either a lack of political legitimacy for wealth taxes or an ongoing debate on how best to design these taxes, or a combination of both.
There are a number of possible roles for wealth taxes in contributing to resolving both short-term and long-term fiscal challenges, which will depend in part on the scale of revenues that can be raised. A number of commentators and politicians have proposed new forms of wealth taxation to contribute to the ongoing process of deficit reduction, with a particular focus on taxes that target the very wealthy. The proposal for a ‘mansion tax’ on the most expensive residential properties, put forward by both the Liberal Democrats and Labour, and expected to raise around £2 billion a year, is the most high-profile example. Proposals for additional council tax bands have also been put forward. Although there may be a case for these reforms as short-term measures to lessen the need for spending cuts, their impact on overall revenues would be small. In practice, it may also be difficult to introduce new taxes or reform existing ones quickly to fill a short-term hole in the public finances. Designing and implementing new taxes is complex and new valuations would need to be carried out.
In the longer term, the Office for Budget Responsibility (OBR) has forecast falling revenues from a number of sources, driven by decarbonisation, behavioural change and the run-down of oil and gas fields in the North Sea. OBR modelling suggests that improved fuel efficiency in vehicles could see fuel duty revenues fall from 1.8 per cent to 1.0 per cent of GDP by 2040 (OBR 2012). Likewise, North Sea oil and gas revenues are projected to drop from 0.7 to just 0.05 per cent of GDP over the next three decades. The continued decline in smoking, meanwhile, is expected to halve the value of tobacco duties from its current level of 0.6 per cent of GDP by 2040. These long-term trends imply that aggregate revenues will be on a mildly downward trajectory over the next 30 years (Lawton and Silim 2012). New or reformed taxes on property and wealth could have a role in keeping revenues relatively stable in the long term.
Population ageing and long-run improvements in per capita GDP are also pushing up demand for core public services as well as for a range of pensioner and working-age benefits. These long-term trends have increasingly shifted the balance of public spending towards health, education and social security over the last 50 years, leaving other areas, such as capital investment, more difficult to fund (ibid). Projections by the OBR imply rising demand for public spending on the NHS and state pensions over the next half century, while revenues are forecast to remain relatively stable (OBR 2012). One way to resolve this challenge would be to identify additional sources of revenue, which could include raising considerably more money from property and wealth taxes than we currently do. These resources could be used either to meet rising long-term demand in existing high-spend areas, such as healthcare and pensions, or to increase investment in less well-funded areas, for example early years services, social care or housebuilding. There have also been proposals for a hypothecated property or wealth tax to fund an expansion of free or low-cost social care (Lloyd 2011).
A number of commentators have also raised the prospect of a long-term shift in the burden of taxation away from labour, with property and wealth taxes helping to make up the lost revenue. Income tax and employee NICs weaken financial work incentives, while employer NICs add to the cost of labour and therefore may reduce the incentive to hire

IPPR | Property and wealth taxes in the UK: The context for reform7
among employers. This implies that lowering labour taxes could raise employment levels, but new sources of revenue would be needed if total government receipts were not to fall. Additional taxes on property and wealth could help to fill this gap. However, since these taxes make up only a relatively small amount of total revenues in the UK, the contribution they can make to shifting the burden of taxation away from labour may be limited.
1.2 Social justiceOwnership of land, property and other forms of wealth can contribute to household resources alongside income, and can therefore be an important contributor to living standards. The scale of wealth inequality in the UK suggests that taxing wealth may have a role in reducing inequalities in economic resources. Figure 1.3 shows that the distribution of household wealth is highly skewed towards the wealthiest 10 per cent of households, who owned 44 per cent of all household wealth in 2008–10,1 equivalent to £4.5 trillion. By comparison, the top 10 per cent of households by income received 27 per cent of all income in 2010–11, one indication that the distribution of wealth is more uneven than the distribution of income in the UK (DWP 2012a). Wealth ownership became more equal between the 1920s and 1970s in the UK and remained fairly stable in the 1980s and 1990s, at a time when income inequality was rising quickly (Hills 2004). However, there is some evidence that wealth ownership became more unequal from the late 1990s (Hills et al 2009).
£0
£500,000
£1,000,000
£1,500,000
£2,000,000
£2,500,000
£3,000,000
£3,500,000
£4,000,000
£4,500,000
£5,000,000
Richest9th8th7th6th5th4th3rd2ndPoorest
Property wealth (net)
Financial wealth (net)
Physical wealth
Private pension wealth
Source: Black 2012 Note: Net property and financial wealth is negative for the first decile. The chart shows total wealth in each decile, not average wealth.
Inequalities in wealth across age groups are inevitable because of the way that households tend to build up assets over their working life and then run them down in retirement, so it is unsurprising that households headed by people around retirement age are more wealthy than households headed by younger (and older) people. Two-thirds of households in the wealthiest 10 per cent of households are headed by an adult aged 45 to 64 (Adam et al 2013). Yet there are significant inequalities in wealth ownership within age groups, indicating that age is not the only driver of the very unequal distribution of wealth in the UK (Mirrlees et al 2011).
1 The data is based on wave two of the Wealth and Assets Survey, which ran from July 2008 to June 2010.
Figure.1.3..The distribution of
aggregate household wealth, by decile, Great
Britain, 2008–10

IPPR | Property and wealth taxes in the UK: The context for reform8
The concentration of wealth among the wealthiest tenth of households is driven in particular by private pension wealth, which accounts for over half (56 per cent) of the wealth held by this group. Property wealth is more important for households around the middle of the wealth distribution, while the bottom third of households have very little or negative property wealth on average. Rising real house prices have driven a substantial increase in overall household wealth over the last three decades, which has had the largest impact on the wealth of households in the middle of the distribution (Karagiannaki 2011). This is also likely to have an impact on the number and size of inheritances among mid-to-high-wealth households in future. Understanding the distribution of the components of wealth as well as the distribution of total wealth is important for assessing how specific tax policies will affect different kinds of households.
An additional argument for wealth taxes is that many of the gains associated with owning land and property arise without any effort on the part of the owner. For example, house prices often rise in an area if local schools or transport links improve. These unearned increases in wealth are usually funded by the state, and ultimately by other taxpayers, so there is a strong social justice argument for taxing these gains. In the UK, the value of domestic properties has risen in real terms by an average 2.9 per cent a year since 1975, outstripping the rate of economic growth (Boadway et al 2010). A significant chunk of these gains have resulted from the failure of both the market and successive governments to ensure an adequate supply of housing rather than from investment or effort on the part of homeowners.
Similarly, there is a social justice argument that inherited wealth should be taxed because it is unearned. Inherited wealth also acts against the principle of equality of opportunity and a series of studies have found that both the probability and the value of inheritance is positively associated with other forms of economic advantage (Karagiannaki 2011). For example, a 2004 survey found that, among adults in professional occupations, 70 per cent had inherited wealth or their partner had, compared to less than half of skilled manual workers and less than one-third of unskilled or unemployed workers (Rowlingson and Appleyard 2010). People in higher social classes were also likely to inherit larger sums than those in lower classes. While there are many other routes through which families pass on advantage (and disadvantage), most are intangible (like a stable home life) and not suitable for taxation (Mirrlees et al 2011).
1.3 Economic efficiencyAll taxes affect people’s choices about work, saving, consumption and investment. An important argument for some forms of property and wealth taxes is that they tend to have smaller distortionary effects than taxes on labour or profits. This is particularly true for taxes on the capital value of property and land, since the supply of property and land is not very responsive to price (ibid). A number of economists therefore assert that taxes on property and land could have a positive effect on growth if accompanied by a reduction in taxes on labour or profits. Similar arguments are made for consumption taxes, since people’s propensity to consume is relatively fixed for a given level of income, but these taxes tend to be less progressive than property and land taxes.
Using data from OECD countries between 1970 and 2005, Johansson et al (2008) estimate that a shift of one per cent of tax revenues from income taxes to consumption or property taxes would result in a long-term increase in GDP per capita of between 0.25 and one per cent. The precise impact depends on a number of country-specific factors. The effect was also found to be larger for property taxes than for consumption taxes, and

IPPR | Property and wealth taxes in the UK: The context for reform9
in particular for recurrent taxes on stocks of property wealth (akin to council tax in the UK). Johansson et al (2008) also argue that achieving such a shift in the tax base by increasing property taxes would have better distributional outcomes than if achieved by raising consumption taxes.
Conversely, if property, land or other kinds of assets are ‘undertaxed’, they will be more attractive to investors and their price is likely to rise relative to other forms of investment. This produces windfall gains for current owners but makes it more difficult for prospective owners to acquire these assets. This is most problematic for housing, since the windfall gains are not taxed through capital gains tax, while the undertaxation of housing may reduce incentives to invest in more productive areas like business. Undertaxed housing also encourages first-time buyers to purchase properties that are at the margins of affordability, because they are eager to benefit from rising prices (OECD 2012). Undertaxing property and land can also incentivise their more inefficient use by encouraging underoccupation or underdevelopment.
In theory, land and property are also difficult to move or conceal, suggesting that tax evasion and avoidance should be low. However, in practice, the ownership of land and property can be organised so as to facilitate tax avoidance, for example where high-value residential properties are formally owned by offshore companies or trusts.
Some forms of property and wealth taxes are likely to weaken economic efficiency. Transaction taxes like stamp duty land tax reduce incentives to buy or sell assets, which discourages the most efficient allocation of resources and seem to have no strong economic justification (Mirrlees et al 2011). However, there are valid economic arguments for taxing inheritances, since such taxes are likely to have only a small impact on decisions about work, saving and investment. Taxes on inheritances may increase work incentives among potential inheritors (if the size of their inheritance is likely to be diminished), while having little effect on incentives to build up sufficient savings for retirement on the part of the donor.

IPPR | Property and wealth taxes in the UK: The context for reform10
While there are strong theoretical arguments for taxing some forms of wealth, it is widely agreed that the current regime of wealth taxation in the UK is flawed, producing a number of inconsistencies and inefficiencies. This chapter outlines how council tax, stamp duty and inheritance tax work, highlighting the purpose and weakness of each tax. We conclude with an assessment of the combined impact of the overall system on different kinds of households.
2.1 Council taxCouncil tax is a hybrid property and consumption tax, which is levied against property values (albeit very old values) but falls on tenants as well as property owners and is used to pay for local services. The tax is levied by local authorities on the basis of the council tax band into which properties are placed, based on their value in 1991, apart from in Wales where a revaluation exercise was completed in 2003. England and Scotland use eight council tax bands and Wales added an extra band for high-value properties as part of reforms in the mid-2000s.
Council tax is regressive in relation to property values. Figure 2.1 shows average council tax charges in England for 2012–13, as a proportion of 1991 property values. The lowest-value properties, those towards the bottom of band A, have very high effective tax rates, which fall sharply until property values reach band B. Effective tax rates then fall more gently, with some small spikes when property values cross bands. After properties crossover into the highest band, effective tax rates gradually decline as property values rise. The result is that council tax is charged at 2.4 per cent on average for a property worth £40,000 in 1991, at 1.8 per cent for a property valued at £100,000 in 1991, and at just 0.3 per cent for a property worth £1 million in 1991.
0%
1%
2%
3%
4%
5%
6%
7%
8%
9%
10%
£1,41
0,000
£1,31
0,000
£1,21
0,000
£1,11
0,000
£1,01
0,000
£910
,000
£810
,000
£710
,000
£610
,000
£510
,000
£410
,000
£310
,000
£210
,000
£110
,000
£10,0
00
Property value in 1991
Cou
ncil
tax
as %
of v
alue
Source: CLG 2012
The larger effective tax rate (relative to property values) faced by people living in smaller and cheaper homes means that council tax places a greater burden on younger and
2. UKPROPERTYANDWEALTHTAXES:THECASEFORREFORM
Figure.2.1..Average council tax
charge as a proportion of 1991 property values,
England, 2012–13

IPPR | Property and wealth taxes in the UK: The context for reform11
poorer households relative to older and richer households, and on households in less prosperous regions compared to more affluent areas. Council tax also encourages people to buy and remain in larger homes (Evans 2009). While it is not essential that every tax is progressive as long as the overall tax system has some level of progressivity, a property tax that is explicitly regressive in relation to property value would strike many as unjust. Council tax benefit is available for low-income households, but take-up is relatively low – just 62–69 per cent of eligible households claim the benefit (DWP 2012b). Council tax benefit is also being reformed so that many low-income non-pensioner households will have to make a contribution to their council tax bills for the first time since its introduction.
The council tax band structure was flawed when it was introduced in 1993 but since the bands have not been updated to reflect changing property values since 1991, the system also fails to sufficiently differentiate between homes of different value. The lower bands cover too many properties while the higher bands cover properties of hugely different values. Figure 2.2 shows that two-thirds of all properties in England are in the bottom three council tax bands, while all properties valued at more than £320,000 in 1991 are in the same band. It has been estimated that around 3.7 million households, 17 per cent of the total, are worse off as a result of the failure to update council tax bands in line with changing house prices (Lyons 2007). If this had been done regularly, they would have moved down into lower bands because the value of their property has fallen relative to others in the same local authority area. Conversely, many households should be paying more council tax because the relative value of their property is now higher than in 1991.
0
1
2
3
4
5
6
0
500
1,000
1,500
2,000
2,500
3,000
HGFEDCBA
Council tax band
Properties (m
)
Ave
rage
cha
rge
(£)
Number of propertiesAverage charge
Source: CLG 2012 and Council Tax Valuation Lists: Summary, 26 April 2012, http://www.voa.gov.uk/corporate/statisticalReleases/120412_CouncilTaxValuationListSummary.html
The system of discounts in council tax also encourages the inefficient use of properties. Discounts of 25 per cent are available for households containing only one adult or 50 per cent for those with no qualifying adult. Councils are also able to give discounts of between 10 and 50 per cent for second homes, while homes that are empty for up to six months attract no council tax. Councils may offer a discount of up to 50 per cent for homes that are empty for longer.
Figure.2.2..Average council tax
charges and number of properties in each band,
England, 2012–13

IPPR | Property and wealth taxes in the UK: The context for reform12
2.2 Stamp dutyStamp duty land tax (commonly referred to as ‘stamp duty’) is a tax on property transactions and is levied on the purchaser. Stamp duty rates for 2012–13 are set out in table 2.1 and are charged on the whole property price rather than on the marginal value above the relevant threshold. This means that a relatively small difference in property price can lead to large differences in the amount of stamp duty levied. For example, a property bought for £250,000 attracts stamp duty of £2,500 but this rises to £7,500 if the property is valued at just £1 more. The current structure of stamp duty therefore encourages purchasers and sellers to keep house prices just below the relevant threshold.
Purchase.price.of.propertyRate.of.stamp.duty.(%.of.the.total.purchase.price)
£125,000 or less 0%
£125,001 to £250,000 1%
£250,001 to £500,000 3%
£500,001 to £1 million 4%
Over £1 million, less than £2 million 5%
Over £2 million 7%
Note: A 15 per cent rate applies to properties worth more than £2 million that are bought by corporations. A separate stamp duty regime operates for commercial property
Even if the band structure in stamp duty was reformed to remove these incentives, many economists argue that a property transaction tax has no sound economic basis. It is essentially a charge on moving house, which may reduce people’s ability to move for work or encourage people to live in homes that are too large (or too small) for them. Stamp duty could therefore be adding unnecessary inflexibilities to the labour market and incentivising the inefficient use of residential properties. However, despite their lack of economic rationale, property transaction taxes have remained popular with governments because they are easy to collect and relatively difficult to avoid.
Stamp duty may also have a role in lessening volatility in the housing market; since the amount of tax levied rises with house prices, this could dampen demand as prices increase. The limited international evidence suggests that property transaction taxes can affect the number of housing transactions, which in turn can affect house prices (Stephens 2011). UK governments have used stamp duty ‘holidays’ in the early 1990s and in the 2008–09 recession to try to shore up the housing market during slumps, but the evidence on their impact is mixed.
2.3 Inheritance taxInheritance tax in the UK is charged on the estates of the deceased and, far less often, on gifts and trusts made during the seven years before death. Tax is paid at a rate of 40 per cent of the value of the estate above the threshold, which in 2012–13 was £325,000. No tax is due on assets left to spouses or registered civil partners and since October 2007, when the first spouse or partner dies, his or her unused inheritance tax nil rate band can be transferred to the second partner. In effect, this doubles the threshold for married couples and couples in civil partnerships. Reliefs of up to 100 per cent are available for agricultural and business assets, although there are rules about how long business assets must be kept in the family.
In 2010–11, a total of 16,000 estates (representing three per cent of all deaths) paid inheritance tax. The number of estates on which the tax is levied, and aggregate revenues,
Table.2.1..Stamp duty land tax
rates and thresholds, 2012–13

IPPR | Property and wealth taxes in the UK: The context for reform13
fell significantly after the change to inheritance tax rules for married and civil partnership couples in 2007. In 2006–07, 34,000 estates were liable for inheritance tax. Since its introduction in 1986, the threshold for inheritance tax has more than kept pace with real house prices and has become much more generous for couples relative to average house prices after the 2007 reforms.
The current inheritance tax regime in the UK has a number of weaknesses. It can largely be avoided by the ‘healthy, (very) wealthy and well advised’, who can give away chunks of their wealth tax free if they do so more than seven years before death, or make use of trust arrangements to reduce their tax liability. These options are not available to the less wealthy, since most of their assets are tied up in their home. HMRC statistics suggest that a relatively large proportion of estates are able to avoid inheritance tax by making use of various loopholes (Dolphin 2010). A tax designed to be levied on the wealthy is not fair or efficient if it can be routinely avoided by the very wealthy.
A further criticism of inheritance tax in the UK is that it is levied on estates rather than individual recipients. A large estate left to many recipients would be liable for inheritance tax even if each inheritor received only a relatively small bequest, whereas an estate valued at just less than the married couples threshold of £650,000 and left to a single child would not attract any tax. Inheritance tax also takes no account of the cumulative gifts and bequests that an individual has received over their lifetime.
2.4 ConclusionOverall, it does not appear that housing is particularly undertaxed as an investment in the UK on average, although it is probably undertaxed as a consumption good because no VAT is charged on the construction of new homes (OECD 2011). This is particularly true if the UK’s relatively restrictive planning system is taken into account, since this acts like a tax on housing in effect (Evans 2009). It is also likely that the distortions caused by stamp duty, weaknesses in inheritance tax, the lack of capital gains tax on residential properties and the absence of VAT on new homes are relatively small.
The major distortion within the UK property and wealth tax regime is in council tax. The current system of council tax means that, overall, property and wealth held by households living in larger and more expensive properties (typically older and richer people) is undertaxed while households in smaller and cheaper properties (typically younger and poorer people) are overtaxed. The tax-like effect of the planning system compounds this distributional pattern since it raises the value of existing homes (owned by older and richer people) and pushes up the housing costs of people who do not own their own home (typically younger and less affluent people).

IPPR | Property and wealth taxes in the UK: The context for reform14
In chapter 1, we identified strong arguments for some forms of wealth taxation on grounds of both economic efficiency and social justice, but found in chapter 2 that the current regime of wealth taxes is not working well in the UK. In this chapter, we consider the options for reforming taxes on property and wealth, focusing on empirical evidence about the potential impact of different reforms and the practical and political challenges to progress. We outline options for reforming or replacing existing taxes and also discuss the case for additional taxes on property and wealth that are not currently part of the UK tax regime. For a number of reform options, we demonstrate the potential impact on households and the public finances using the IPPR wealth tax model. We also draw on analysis of the tax systems and experiences of other OECD countries in order to identify the reform strategies likely to be most effective for the UK.
We begin by examining the options for reforming the system of property and land tax in the UK, including council tax and stamp duty. We also consider the case for new forms of taxation, including capital gains tax on the sale of primary residences, the taxation of imputed rents and a land value tax. Subsequent sections of this chapter discuss the case for a new annual tax on net wealth holdings and the options for reforming inheritance tax.
3.1 Property and land taxesCouncil.taxThere are broadly three options for reforming or replacing council tax. First, reforms could be made that retain the basic band structure of council tax, including increasing rates for higher value properties. This would be a relatively straightforward option which would seek to reduce some of the unfairness in council tax without requiring radical reform of the current system. However, the tax would still be levied against very out-of-date property values while there would be no reduction in tax bills among overtaxed households in lower value properties.
A more radical option would be to revise council tax bands based on updated property values and redistribute properties across the new bands, or at the very least, create additional bands at the top and bottom. The band structure could be made less regressive to the point where it was relatively neutral across most of the property distribution. This would require a greater number of bands covering lower value properties and substantially higher tax bills for more expensive properties. But the tax would remain regressive within bands and would still be capped for the most expensive properties. A band structure is also relatively complex to design and lacks a clear rationale.
Second, council tax could be replaced by a housing consumption tax designed to fund local services and levied on both owners and tenants. The tax could be designed in a number of different ways, but a flat-rate charge levied as a proportion of current property values would be the simplest option. The Mirrlees Review proposed replacing council tax with a housing consumption tax, which if charged at 0.6 per cent of property values, would raise a similar amount to council tax in aggregate (Mirrlees et al 2011). Households in properties worth less than £250,000 would pay less while those in more expensive houses would face a larger tax bill than under the current council tax system. As with the existing council tax formula, a housing consumption tax would be designed to raise a consistent amount each year. This means that the tax rate would need to vary over time as real house prices rose (or fell), so that the total amount of revenue raised stayed relatively consistent, making it a good way to raise money to pay for local services. Replacing council tax with a housing consumption tax would also have implications for local government finances. Given the range of property values across the UK, the new tax
3. REFORMINGPROPERTYANDWEALTHTAXES

IPPR | Property and wealth taxes in the UK: The context for reform15
would not necessarily produce the same revenue as council tax within each local authority area. This would require some adjustment to the distribution of revenues so that local authorities received a comparable amount of funding as under the current system.
Third, council tax could be replaced by a genuine property value tax levied only on property owners. The purpose of a property tax, unlike a consumption tax, is partly to raise more money as real house prices rise, so the tax rate stays the same regardless of fluctuations in property values. Households that see their property value rise faster than others end up paying more tax in absolute terms. One goal of a property tax is to dampen house price volatility: the total tax burden on a property rises with the value of the property, pushing up the overall purchase price and therefore making the property less attractive as an investment. A property tax linked to market values has been widely recommended for the UK (Barker 2004, OECD 2011, Stephens 2011). The OECD has argued for the introduction of a property tax in the UK (as well as in a number of other countries) to lessen the attractiveness of housing as an investment and discourage people from leaving properties empty. The OECD estimates that a property tax would have lowered house prices by around 20 per cent at the peak of the housing market in 2007 (OECD 2011). However, fluctuating revenues would make it a less appropriate source of funding for local services. The distributional impacts would also vary over time since it is likely that some households would see their properties rise in value faster than others.
Many OECD countries (14 out of 34) operate some form of recurrent tax on the value of residential property, often run by municipal governments and used at least in part to fund local services. Property taxes are typically charged as a proportion (usually one per cent or less) of assessed property values, are based on gross values (that is, they do not take account of mortgages and debts linked to the property) and properties are revalued relatively frequently in most countries. Generally, there are no tax thresholds for property taxes but many countries operate a range of exemptions or reliefs for particular kinds of properties and particular groups. In most cases, property taxes are levied on the owner rather than the occupier.
Country Description Taxpayer
Austria Up to 1% of property value Owner
Belgium Between 30% and 50% of notional rental income Owner
Denmark Up to 1% of property value Owner
Finland Up to 0.75% of property value Owner
France Residence tax based on notional rental income Occupier
Ownership tax based on notional rental income Owner
Germany Based on notional rental income (but rental valuations not changed since 1964)
Owner
Netherlands Up to 0.3% of property value (but rates fall with prices because it funds local services)
Occupier
Taxation of notional rental income Owner
Norway Up to 0.7% of property value Owner
Spain Up to 1% of property value, with rates and thresholds set by local government Owner
Sweden Flat-rate charge with discounts for properties built since 2001 Owner
Switzerland Progressive net wealth tax of between 0.1% and 1% including on real estate Owner
US Local real estate tax of between 0.4% and 4% of property value Owner
Source: Oxley and Haffner 2010, Johansson et al 2008, Pippin et al 2010 Note: OECD countries not listed have no property tax or similar, except Czech Republic, Slovenia and Slovakia.
Table.3.1..Property taxes in
selected OECD countries

IPPR | Property and wealth taxes in the UK: The context for reform16
The IPPR wealth tax model allows us to consider the impact of a property tax, with some important limitations. The Wealth and Assets Survey (WAS) data that underpins the model does not capture the value of residential properties that are owned by entities other than private individuals and households. It is difficult to ascertain the proportion of residential properties owned by companies and trusts, but HMRC stamp duty statistics show that the share of properties whose buyers were not private individuals tends to rise with property value. For example, two-thirds of properties bought for more than £2 million in 2011 in the UK were purchased by companies or trusts, compared to around 10 per cent of properties worth less than £500,000.2 It is also likely that a relatively large share of high-value properties are owned by foreign nationals who are not permanently resident in the UK and are therefore unlikely to be captured in household surveys. In the ‘prime central London’ market,3 where the majority of high-value properties are located, foreign buyers accounted for more than half of property transactions in 2010 (Griffith et al 2012).
The implications of these data limitations for our results depend on the design and implementation of any new tax on residential property. If such a tax was levied on all residential property regardless of the legal form of the owner, then our analysis will underestimate the revenue that such a tax could raise. It is also likely that a tax paid by property owners will be passed on to tenants, for example, through higher rents. If this was the case, our analysis will underestimate the distributional effects on tenants (and overestimate the impact on private individuals who own rental properties). The results described here only show the first-round impact on owner-occupiers and people who own rental properties in their own name.
We have modelled the effects of a flat-rate 0.5 per cent annual tax on the gross value of all residential property owned by private individuals, with no threshold or tax-free allowance. We estimate that this tax would raise approximately £20.8 billion a year.4 Council tax receipts for 2012–13 are estimated at £25.9 billion so if council tax were to be entirely replaced by a new property tax in a revenue-neutral reform, the rate may need to be a little higher. However, if the property tax was applied to companies, trusts and foreign owners, it would probably raise at least as much as council tax if levied at around 0.5 per cent.
Figure 3.1 (over) shows the average annual charge under these parameters in cash terms and in proportion to average incomes, for households ordered by income and by wealth. If implemented in isolation (that is, not taking into account the fact that it might be introduced as a replacement for council tax), this tax would be very progressive when households are ordered by wealth. The cash charge and the charge as a proportion of household income rises with wealth.
2 http://www.hmrc.gov.uk/statistics/transactions/table16-4.pdf . The Coalition government plans to introduce a new annual residential property tax for properties held by ‘non-natural persons’ as a way of tackling tax avoidance in this area.
3 This is a loose definition used by estate agents to cover parts of central and west London. 4 Official statistics using WAS 2006–08 data estimate total household gross property wealth at £4,460 billion
(Black 2012). A 0.5% levy on this value of aggregate property would produce revenues of £22.3 billion. Our slightly lower estimate reflects the fact that the model uprates property values to 2012 prices, and values are known to have fallen since 2006–08.

IPPR | Property and wealth taxes in the UK: The context for reform17
Income decile (£ effect)
Wealth decile (£ effect)
£0
500
1,000
1,500
2,000
2,500
3,000
3,500
4,000
Richest9th8th7th6th5th4th3rd2ndPoorest0
1
2
3
4
5
6
7
8
Income decile (% effect)
Wealth decile (% effect)
Value of tax (% of incom
e)
Valu
e of
tax
(£)
Source: Author’s calculations using the IPPR wealth tax model and ONS 2010
The impact is particularly large on the wealthiest 10 per cent of households, who would face an average charge of £3,357, equivalent to almost seven per cent of average annual net incomes for these households. Although this is not significantly higher than the average council tax in band H (£2,878 a year), there are currently only 100,000 households in the top council tax band, whereas there are approximately 2.5 million households in each wealth decile. This suggests that many more high-wealth households would face substantially higher average tax bills than in the current system. However, the average charge in each decile for the least wealthiest half of households (between £11 and £710 a year) is lower than the average council tax bill in the lowest council tax band, at £959 a year. This is likely to be in part because people living in rental properties do not have to pay the tax in our model, but also because a property tax is much more closely linked to actual current properties than council tax.
If households are ordered according to their net incomes rather than their wealth holdings, the average charge for households in the bottom half of the income distribution is relatively flat, at between £580 and £750 a year. This means that the tax is regressive across the poorest half of households (it takes the same in cash terms which means it takes more as a proportion of incomes from the poorest households). This will reflect the presence of ‘asset-rich, income-poor’ households towards the bottom of the income scale, which would be an important consideration in any reform plans. However, this regressivity is also present in the current council tax system, but on a larger scale.
If a decision was taken to reform or replace council tax, whichever specific option was chosen, a regular system of updating property values would be required. Otherwise, the tax burden on households living in properties that experience slower increases in value would rise relative to those in properties whose values rose faster. This has been a considerable barrier to reform in the past and the main reason that council tax has not been reformed over the last 20 years despite its obvious flaws. On a technical level, regularly updating property values for the purposes of a property tax is not excessively difficult or costly, and at least nine other OECD countries do this at least every five years (OECD 2011).
Figure.3.1..The distributional
effects of a new annual property tax

IPPR | Property and wealth taxes in the UK: The context for reform18
The political challenges are greater. Politicians in the UK have been wary of ordering a revaluation that ultimately raises taxes on those who have seen the greatest increase in the value of their property since 1991. This applies primarily to people living in the greater south east area, where property values have risen much faster than in other parts of the country. The more progressive any new system is, the greater number of apparent winners and losers will be created, and the more noise the losers will make (Brooks 2005).
The gradual phasing in of a new tax alongside short-term transitional protections might help. Even once a sensible system is in place, governments may come under pressure to limit tax increases when property values rise substantially. For example, increases in the amount of property tax levied have been limited or frozen in Denmark since 2001 following rapid rises in property values (Oxley and Haffner 2010). This limits the effectiveness of the tax in dampening house price volatility and disproportionately benefits households that have experienced the largest increases in property values, but was felt to be politically necessary.
A further challenge in reforming or replacing council tax is how to treat those who are ‘asset-rich, income-poor’; that is, people living in expensive properties but with relatively low annual incomes. However, the disproportionate tax burden on low-income families living in low-value houses in the current system is far greater in terms of the number of households affected than the problem of asset-rich, income-poor households. Orton (2006) identified around 2 million households that were struggling to pay their council tax but less than one-tenth (181,000 households) lived in properties in the top three council tax bands. Nevertheless, public concern about this latter group will need to be addressed, for example by policies that allow the tax to be paid on the sale of the house or on death, or that provide greater support for retired households to downsize or release equity from their property.
Mansion.taxOne variant of a property tax is a special tax on high-value properties, commonly referred to in the UK as a ‘mansion tax’. This was first proposed by the Liberal Democrats in September 2009 and has been supported by the Labour party more recently to offset the introduction of a 10p income tax band. The original Liberal Democrat proposal was for a 0.5 per cent levy on property values above a threshold of £1 million, which they estimated would apply to around 240,000 properties and would raise around £1 billion. In November 2009, the proposal was adjusted so that a one per cent levy would be applied to properties worth more than £2 million. The Liberal Democrats estimated that this would affect around 70,000 properties worth an average £4.4 million and would raise £1.7 billion. The charge would be implemented by revaluing all properties in council tax band H (the highest council tax band) and applying the tax to those valued at more than £2 million (Adam et al 2010).
The 2006–08 WAS data contains a substantially smaller number of properties valued at more than £2 million than assumed by the Liberal Democrats, approximately 27,000, making it difficult to model variants of a mansion tax. This is likely to be because of the high proportion of expensive properties that are owned by foreign nationals and by companies and trusts, as discussed above. The Institute for Fiscal Studies concluded that the revenue estimates produced by the Liberal Democrats appear to be relatively robust but there is considerable uncertainty given the lack of data about the distribution of property values in the UK.

IPPR | Property and wealth taxes in the UK: The context for reform19
An alternative to a mansion tax would be to add additional higher bands to the existing council tax system, which could be done relatively easily if the new bands were based on 1991 property values as with the rest of the council tax system. There might be some political fallout given the differential increases in property prices; people living in properties with similar 1991 values but very different current values would find themselves paying a similar, higher council tax charge. The benefit of a mansion tax is that it is based on current rather than 1991 property values, and could be a first step towards a more comprehensive revaluation of residential properties to create a more up-to-date tax base.
Stamp.dutyAlthough stamp duty and property transfer taxes lack a clear economic rationale, they are the most common form of property taxation in the OECD, with 31 advanced economies operating a tax on real estate transfers, usually levied on the purchaser as in the UK. Abolishing stamp duty altogether would cut an average of £5 billion a year from revenues,5 which would have to be found from other sources if aggregate government income was to be maintained. This could come from a reformed council tax. However, in practice it is unlikely that a future government would abolish a tax that provides an important source of revenue, is easy to collect and is far less politically unpopular than council tax.
If stamp duty is to be retained, there is a case for reforming the structure of the tax so that it applies to the value of a property above a threshold rather than the whole value. Using the IPPR wealth tax model, we analyse two alternative reforms. In the first scenario, we simply apply the current tax rates to the value of properties above the relevant thresholds, retaining the existing thresholds (as set out in table 2.1 above). In the second scenario, we apply stamp duty to the value of property above the relevant threshold but double the rates in order to recoup some of the lost revenue.
The IPPR wealth tax model produces an estimate of aggregate stamp duty revenue under the current system of £4.2 billion compared to Treasury estimates for 2012–13 of £6.5 billion. This is likely to be primarily due to the large number of high-value properties that are purchased by companies or trusts rather than individuals, as already discussed. In addition, using data from 2006–08 and uprating it to 2012 using average regional house price indices may underestimate the growth in property values at the top end.
The lower baseline revenue estimates produced by our model will feed into the revenue estimates in the reform scenarios. For scenario one, where stamp duty is applied to the marginal property value rather than the full value, we estimate that revenues fall by around 57 per cent to £1.8 billion. This is in line with other estimates that have found that revenues would fall by around a half under this reform.6 In scenario two, where stamp duty is levied on marginal values but the rates are doubled, revenues fall by around 14 per cent to £3.6 billion. This may be considered a relatively revenue-neutral reform under current housing market conditions.
Figure 3.2 shows the tax paid on properties worth less than £1 million in the current system and under the two reform scenarios. In the first scenario, the amount of tax paid
5 Annual figures fluctuate with the housing market. The Council of Mortgage Lenders estimates that annual revenues of £4.5–£5bn represent a 10-year average.
6 See for example analysis by the Council of Mortgage Lenders: http://www.cml.org.uk/cml/publications/newsandviews/116/436

IPPR | Property and wealth taxes in the UK: The context for reform20
is lower than in the current system for all properties. In the second scenario, the tax is lower for properties worth less than £400,000 and higher for almost all properties worth more, with the difference widening considerably as the value of a property rises.
£0
£10,000
£20,000
£30,000
£40,000
£50,000
£60,000
£1,00
0,000
£950
,000
£900
,000
£850
,000
£800
,000
£750
,000
£700
,000
£650
,000
£600
,000
£550
,000
£500
,000
£450
,000
£400
,000
£350
,000
£300
,000
£250
,000
£200
,000
£150
,000
£100
,000
£50,0
00£0
Property value
Current stamp duty
Reform 1
Reform 2
Sta
mp
duty
cha
rge
Source: Authors’ calculations using the IPPR wealth tax model
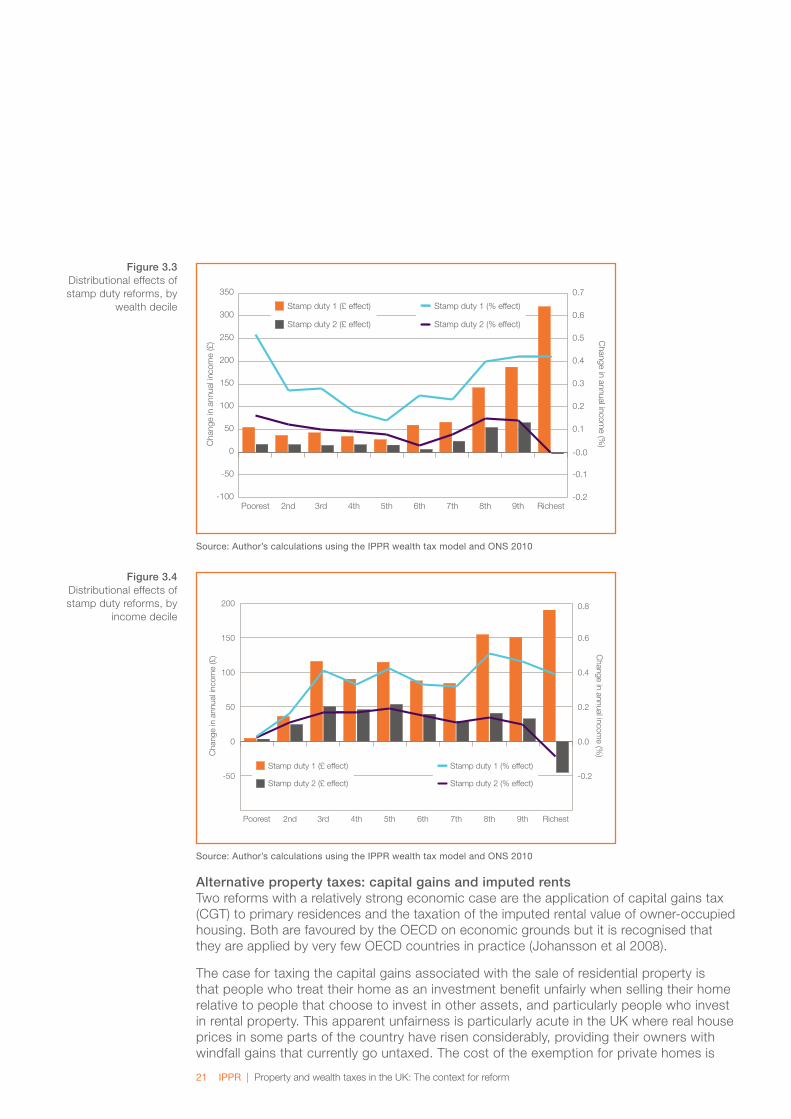
Figure 3.3 (over) shows the distributional effects of the two stamp duty reforms by household wealth decile using the IPPR wealth tax model. The impact is not smooth (probably because there are relatively few households affected by the change in any one year) but they broadly follow the pattern suggested by the change in tax liability shown in figure 3.2 above. In the first reform, all households are better off because the reform is a straightforward tax cut, but the largest cash gains accrue to the wealthiest households, particularly those in the top three wealth deciles. In the second reform, the impact is broadly flat and positive across the second to ninth wealth deciles but negative for the wealthiest tenth of the households on average because the duty on properties worth more than £550,000 rises steeply compared to the current system. In both reforms the least wealthiest 10 per cent of households see very little change because they are either purchasing properties below the tax threshold or are not purchasing homes at all. In both scenarios, the actual impact on family budgets is small, at less than 0.5 per cent of annual income in almost all cases.
When households are ordered by income rather than wealth, the effects of the two stamp duty reforms are more clearly regressive across most of the income scale in cash terms, in that the largest reduction in tax liability is enjoyed by higher income households. If stamp duty were to become a marginal-rate tax (stamp duty reform one), the cash value of the reduction in tax would rise steeply for the richest 30 per cent of households, with the richest 10 per cent of households benefiting by an average £320. Under the second reform option, the gains for all households would be substantially smaller, with no benefits for the richest 10 per cent of households.
Figure.3.2..Tax paid under
current stamp duty and alternative reform options
IPPR | Property and wealth taxes in the UK: The context for reform21
-100
-50
0
50
100
150
200
250
300
350
Richest9th8th7th6th5th4th3rd2ndPoorest-0.2
-0.1
-0.0
0.1
0.2
0.3
0.4
0.5
0.6
0.7
Cha
nge
in a
nnua
l inc
ome
(£) C
hange in annual income (%
)
Stamp duty 1 (£ effect)
Stamp duty 2 (£ effect)
Stamp duty 1 (% effect)
Stamp duty 2 (% effect)
Source: Author’s calculations using the IPPR wealth tax model and ONS 2010
-50
0
50
100
150
200
Richest9th8th7th6th5th4th3rd2ndPoorest
-0.2
0.0
0.2
0.4
0.6
0.8
Cha
nge
in a
nnua
l inc
ome
(£) C
hange in annual income (%
)
Stamp duty 1 (£ effect)
Stamp duty 2 (£ effect)
Stamp duty 1 (% effect)
Stamp duty 2 (% effect)
Source: Author’s calculations using the IPPR wealth tax model and ONS 2010
Alternative.property.taxes:.capital.gains.and.imputed.rentsTwo reforms with a relatively strong economic case are the application of capital gains tax (CGT) to primary residences and the taxation of the imputed rental value of owner-occupied housing. Both are favoured by the OECD on economic grounds but it is recognised that they are applied by very few OECD countries in practice (Johansson et al 2008).
The case for taxing the capital gains associated with the sale of residential property is that people who treat their home as an investment benefit unfairly when selling their home relative to people that choose to invest in other assets, and particularly people who invest in rental property. This apparent unfairness is particularly acute in the UK where real house prices in some parts of the country have risen considerably, providing their owners with windfall gains that currently go untaxed. The cost of the exemption for private homes is
Figure.3.3..Distributional effects of stamp duty reforms, by
wealth decile
Figure.3.4..Distributional effects of stamp duty reforms, by
income decile

IPPR | Property and wealth taxes in the UK: The context for reform22
estimated at £9.9 billion in 2012–13, more than double the expected total CGT revenue for that year, so the exemption has a significant impact on the public finances.
However, in practice very few countries apply capital gains tax to primary residences suggesting that the political difficulties are too large. Imposing CGT on main homes would also discourage people from selling their homes, creating similar distortions to stamp duty. Where CGT is charged, it is often in a limited form. In the US, CGT can be rolled over if the seller uses the proceeds of the sale to buy another property, so in effect the tax is often never paid (Oxley and Haffner 2010). In Germany, CGT is only due if a property is sold within 10 years of purchase. In addition, in the UK, CGT on investment property can be rolled over if the proceeds of the sale are reinvested in similar assets, while the rate of CGT is relatively low, suggesting that homeowners are not receiving as large a benefit relative to landlords as may be implied (Evans 2009).
The taxation of imputed rents rests on the idea that owner-occupiers benefit from housing services that they would otherwise have to pay for (by renting a property). By not paying rent, homeowners have higher cash resources and so imputed rents can be seen as a form of income that should be taxed. Suppose someone rents their own home but invests their capital in another property that they rent out. They would have to pay income tax on the rental income from the first property and rent on the second property, as well as the upfront or mortgage costs of buying the first property. If that person decided to live in the home they owned (and sell the second property), they would no longer be paying rent on the first property or income tax on their rental income from the second property, so they are clearly better off (ibid). A tax on imputed rents attempts to correct this difference between owner-occupied and rental property. Such a tax existed in the UK as part of the income tax system until 1963, when it was abolished for a mix of practical and political reasons. Only four OECD countries currently tax imputed rents in this way. Although an economic justification exists in theory, explaining the case for such a tax to voters is very difficult in practice.
The IPPR wealth tax model cannot assess the impacts of either tax well as it stands. CGT on primary residences is difficult to model because the WAS dataset contains no direct measure of the number or value of property disposals and the capital gains achieved. As further waves of WAS data become available, this may be easier to resolve in the model. The WAS data also contains no information on imputed rents for owner-occupied housing and carrying out an imputation process was beyond the scope of this project, although this functionality could be added to the model in future.
Land.value.taxA land value tax is a tax on the underlying value of land regardless of the value of any property or development on the land, and is favoured by most economists as one of the most efficient ways for the state to raise revenue. Land is vital for economic activity but since it simply exists and is not produced by anyone, the value of land arises through no effort on the part of the landowner. Taxing land is therefore the equivalent of taxing an economic rent, an excessive return generated by scarcity rather than investment (Maxwell and Vigor 2005). The supply of land is largely fixed (although in practice it can be altered by planning regulations), so if land becomes more expensive because it is taxed, the consumer will not be prepared to pay any more for it so the actual price will not change. The landowner would suffer a windfall loss in the post-tax value of their land, but the incentive to buy, use or develop the land would not diminish, since a tax on the value of land separate from the buildings on it has no disincentive effect on development.
IPPR | Property and wealth taxes in the UK: The context for reform23
In fact, a land value tax could incentivise the more efficient use of land if some kinds of undeveloped land were to be taxed at the same rate as developed land.
Despite the strong economic (and social justice) case for land value tax, it is applied in relatively few countries. Austria charges a one per cent tax on land without buildings, and Denmark operates a land value tax of between 1.6 and 3.4 per cent. Some states in Australia, Canada and the US also levy a land value tax, as do some Caribbean countries and a number of African countries including South Africa and Kenya. New Zealand used a land value tax until 1991 when it was abandoned following a sharp increase in commercial land values in 1989.
The likely explanations for the relatively low take-up of land value tax are partly practical and partly political. Landowners are typically powerful voices capable of lobbying against a new tax that imposes a windfall loss on them. Numerous attempts to introduce various forms of taxation on land in the past have failed in the UK, although this may have been in part because they were taxes on land transactions rather than on capital values (Muellbauer 2005). The experience of New Zealand (and Denmark in the case of property taxes) shows that governments can find it difficult to maintain taxes on land when land values rise considerably. McClean (2005) suggests that some important sources of opposition could be reduced if a threshold for a land value tax was applied, which at around £10,000 per hectare would exclude most agricultural land; and if exemptions were allowed for some public access land and ‘operational’ land used for roads and railways. Hull and Cooke (2012) proposed a tax on undeveloped land worth more than £2 million as a first step towards the creation of a more comprehensive land value tax.
As with property taxes, the practical challenge is how to value land and ensure values are updated regularly. Valuing residential property is relatively straightforward because there are many transactions each year but land changes hands much less frequently. The value of property would have to be separated from the value of the land on which it sits, which can be difficult in practice. In addition, around 30 per cent of land in England and Wales is not registered with the Land Registry, making it difficult to ascertain its ownership and value.7 These are not necessarily insurmountable problems but it would take a lot of detailed work to devise a robust and sustainable system of land value taxation for the UK. Countries with a functioning land value tax have dealt with some of these issues. For example, land in Denmark is valued using a ‘hedonic’ pricing model based on the compulsory registration of all land transactions. This model uses information about the characteristics of land (location, transport links and so on) that is sold to estimate the value of other land.
A land value tax cannot be modelled by the IPPR wealth tax model. This is partly because land is owned by a mix of private individuals and companies, with the assets of the latter being outside the scope of the IPPR model. In addition, the WAS data does not provide an estimate of the value of developed land owned by WAS respondents, which accounts for the majority of landholdings in the data. The WAS records the value of undeveloped land owned by respondents but only a relatively small number of households own such land. There is no straightforward way to decompose the property values recorded in the WAS into separate values for land and buildings. Future work could see the creation of imputed land values in the IPPR model.
Distributional analysis of the impact of a land value tax in the UK (by income, family type and geography for example) is vital to enable policymakers to consider the case for reform.
7 http://www.publications.parliament.uk/pa/cm200910/cmhansrd/cm100128/text/100128w0009.htm

IPPR | Property and wealth taxes in the UK: The context for reform24
One of the barriers to progressing land value tax is that it has been promoted by ‘“enthusiasts” who can border on the obsessive’ (Maxwell and Vigor 2005) and who tend to focus mainly on the theoretical case. Little detailed policy analysis has been undertaken to show what the tax might mean for different kinds of families (and business owners) in the UK or for the fiscal position of both local and central government.
3.2 A net wealth taxThe IPPR wealth tax model can also be used to analyse new taxes that currently do not feature in the UK tax system. The 2008 financial crash reignited calls for a recurrent tax on total wealth holdings, something that has never existed in the UK. Annual net wealth taxes differ from property taxes because an offset is made for debts and other liabilities associated with wealth holdings. In most cases, the tax is applied to total worldwide assets including property, savings, insurance plans, private pensions and trusts. It is typically levied at the level of the household. Within the OECD, only three countries have a permanent annual net wealth tax:
• France applies a progressive annual tax of between 0.55 and 1.8 per cent of total net household assets worth more than €1.3m (Bräuninger 2012).
• Norway charges an annual tax of up to 1.1 per cent on net wealth above NOK 750,000 (approximately £87,000), affecting around 17 per cent of adults (Denk 2012).8
• Switzerland levies a progressive annual tax of between 0.1 and one per cent on net wealth above thresholds that depend on family status and canton.
Many countries have abandoned a net wealth tax in the last 20 years, including Austria, Denmark, Finland, Germany, Iceland, Luxembourg, the Netherlands, Spain and Sweden. In many cases, this was due to concerns about the costs of identifying and measuring net assets and of collecting the tax, particularly when dealing with worldwide assets. Net wealth taxes also typically include exemptions deemed to be politically necessary but these create opportunities for avoidance among very wealthy people with access to expensive tax advice. The Labour government’s attempt to introduce a wealth tax in the UK in 1974 ultimately failed in part because it proved difficult to design a tax that yielded sufficient revenue to outweigh collection costs (Glennerster 2012). Problems in identifying the tax base also increase the risk that the tax is paid by the fairly wealthy, whose main asset is residential property held in the country of residence, but avoided by the very wealthy, who hold a complex mix of assets, often abroad. This diminishes public support for the tax, as with the UK’s inheritance tax.
The economic case for an annual net wealth tax is also not particularly strong. Taxing wealth holdings rather than returns means that assets producing very different rates of return are taxed at the same rate, so that investments generating a ‘normal’ rate of return are taxed at the same rate as those producing ‘above-normal’ returns. Economists argue that it is more appropriate to leave ‘normal’ returns untaxed but to tax ‘above-normal’ returns because they are effectively economic rents so taxation will create fewer distortions (Mirrlees et al 2011, Denk 2012). Therefore taxing the returns associated with assets, with an exemption for ‘normal’ returns, is more efficient than taxing stocks of wealth.
However, there are signs that the financial crash, deficit reduction plans and sluggish recovery have reinvigorated the appeal of taxes levied on the wealthy in many European countries. Iceland and Spain have both temporarily reinstated an annual net wealth tax,
8 There are a number of exemptions that lower the tax take, including reductions on owner-occupied and rental housing, and full exemptions for authorised private pensions.

IPPR | Property and wealth taxes in the UK: The context for reform25
while in France, President Hollande has reversed cuts in the wealth tax imposed by President Sarkozy in 2011 (Bräuninger 2012). In the last year, social democratic parties in countries including Austria and Germany have put forward concrete proposals for reintroducing a net wealth tax in response to current economic and fiscal challenges.
Using the IPPR wealth tax model, we have modelled an annual net wealth tax charged at one per cent of all non-pension assets exceeding a household threshold of £500,000. We estimate that this would raise approximately £6.9 billion a year if applied only to assets owned by private individuals and held in Britain. This represents merely the ‘mechanical’ effect of levying such a charge on the relevant stock of assets and the actual net revenue generated in practice would be subject to the issues surrounding compliance and collection costs outlined above. This estimate is therefore highly uncertain.
An annual net wealth tax can be designed to cover a sizeable share of taxpayers or to target the very wealthy. In most countries, the tax has focused on the very wealthy and the parameters used in the example presented here follow this approach. This means that the tax is highly targeted at the wealthiest households. Figure 3.5 shows that only households in the wealthiest 10 per cent of households (shown by the red bar) would have to pay the tax and the average charge would be £3,680. Although this is equivalent to just 0.3 per cent of the value of non-pension wealth held by these households, it represents 7.5 per cent of their post-tax income on average. This could create significant political challenges, particularly as a substantial share will probably be pensioner households, although not necessarily low-income pensioners.
-4,000
-3,500
-3,000
-2,500
-2,000
-1,500
-1,000
-500
0Richest9th8th7th6th5th4th3rd2ndPoorest
-8
-7
-6
-5
-4
-3
-2
-1
0
Cha
nge
in a
nnua
l inc
ome
(£) C
hange in annual income (%
)
Income decile (£ effect)
Wealth decile (£ effect)
Income decile (% effect)
Wealth decile (% effect)
Source: Author’s calculations using the IPPR wealth tax model and ONS 2010
The impact of a net wealth tax also looks somewhat different if households are ordered according to income rather than wealth, which is shown in the blue bar in figure 3.5. A minority of less affluent households would be subject to the tax (‘asset-rich, income-poor’ households), so that on average the poorest half of households (measured by income) would face a charge of £166 a year. This charge is averaged out over many households in each decile and in practice a small number of households in each decile would face a substantially higher tax liability while most households would pay nothing.
Figure.3.5..The distributional
effects of an annual net wealth tax

IPPR | Property and wealth taxes in the UK: The context for reform26
The tax is still strongly progressive towards the top of the income distribution since the average charge increases for the richest fifth of households, and particularly for the richest 10 per cent. The average charge for the richest tenth of households would be £2,267, equivalent to 3 per cent of their annual net income. Nevertheless, imposing a new tax that affects a minority of relatively low-income households would be likely to be very unpopular. This could be resolved by allowing people to defer payment of the tax until death or assets are sold, or using an income threshold as well as an asset threshold to assess liability. These measures would add complexity and reduce the level of revenue collected.
Since the WAS data does not capture assets held by companies and trusts we cannot model a scenario in which a net wealth tax is levied on such organisations. If corporate landlords were also subject to a net wealth tax, the revenue raised may be higher but it might also be assumed that landlords would pass on the charge to tenants, probably creating different distributional effects to those shown here.
3.3 Estates, gifts and inheritancesThe majority of OECD countries levy a tax on estates, gifts or inheritances and, unlike the UK system, in most cases the tax falls on the recipient rather than the donor or estate (Naess-Schmidt et al 2010).9 Many countries also impose a tax on gifts given prior to death as a tax-avoidance measure. Some countries, such as Ireland, apply a tax to all gifts and inheritances received over a lifetime, which is designed to ensure that all gifts receive equal tax treatment. Several countries also vary either the tax rate or the tax-free allowance depending on the relationship between the donor and recipient. Typically, offspring benefit from more generous allowances or rates, while transfers between spouses are not taxed.
Taxes on estates and inheritances typically include large tax-free allowances so that only high-value estates or gifts are taxed. Despite this, these taxes remain unpopular in most countries and a number of countries have lowered tax rates or increased thresholds recently, including Denmark, Finland , Greece, Italy and the US (ibid). Some countries, including Sweden and Austria, have abolished inheritance or estate taxes entirely within the last decade.
There are a number of options for reforming or replacing inheritance tax. Since the 2007 reforms, inheritance tax is no longer a significant source of revenue and, given the enduring unpopularity of the tax, it is unlikely that policymakers will introduce reforms that see revenues rise in future. It is more conceivable that inheritance tax would be abandoned in future. While this may be desirable given the weakness of the current tax, the strong case for taxing inheritances means that alternative models should be considered.
A number of reports have recommended some form of capital receipts tax where all gifts received over an individual’s lifetime are taxed in a consistent way (Commission on Taxation and Citizenship 2000, Prabhakar et al 2008, Dolphin 2010). This would help to reduce tax avoidance and ensure that different kinds of gifts and inheritances are taxed fairly. It could also help to lessen the unpopularity of inheritance taxes if it was presented as a tax on unearned income received over a person’s lifetime rather than a tax on bequests or on the deceased (Dolphin 2010). Every adult would have a lifetime threshold
9 Austria, Australia, Canada, Estonia, Israel, Mexico, New Zealand, Portugal, Slovakia and Sweden currently have no estate or inheritance tax.

IPPR | Property and wealth taxes in the UK: The context for reform27
for tax-free gifts and gifts exceeding this threshold would be taxed. The tax could be made more complicated, for example by exempting gifts below a certain value, having a progressive tax-rate scale, or setting different thresholds according to the relationship between the donor and the recipient.
It is not possible to model the revenue or distributional effects of a capital receipts tax in the current iteration of the IPPR wealth tax model since there are no accurate sources of data on the receipt of lifetime gifts in the UK. The biggest challenge to implementing such a tax would probably be the administrative costs associated with accurately recording the value of gifts received over a lifetime. This would have to be done for all adults even though many will never amass total gifts that exceed the threshold and therefore will never be liable for capital receipts tax. Ireland has a similar model and, although the administration costs are higher than for the UK’s inheritance tax, they do not appear to be prohibitive and the tax has survived for more than 35 years (Boadway et al 2010).
IPPR | Property and wealth taxes in the UK: The context for reform28
The UK is currently facing a high public deficit and there are demands across the political spectrum to reign in public spending, sometimes in combination with calls for higher taxes. Together with a pervading sense that the ‘super-rich’ helped to foment the financial crash but are not contributing to the clear up, it is not surprising that many people are looking to taxes on wealth to make a larger contribution to the public finances. However, while there is considerable scope for reforming the UK’s system of wealth taxation, this report has identified a number of challenges that require serious policy and political analysis before reform can be confidently advanced. While these challenges are not insurmountable, they suggest that wealth taxes are not a panacea for either our short-term or long-term fiscal pressures or a silver bullet for achieving greater social justice.
The central challenges raised in this report include:
• The.scale.and.purpose.of.revenues: property and wealth taxes currently make up less than 10 per cent of the UK’s total revenues, and the UK already collects more money through property and wealth taxes than almost any other OECD country. This does not mean we could not raise a great deal more through property and wealth taxes, but there are relatively few countries we can draw on to understand how to do this. The scale of potential revenues will in turn help to determine the ultimate purpose of reforming wealth taxes, whether to improve their efficiency but on a revenue-neutral basis, to fill in for falling revenues elsewhere or to support a major shift in the tax base away from earned income. Receipts from some forms of wealth taxation can also be more volatile than other sources because they move in line with asset prices. This will affect whether such taxes can be used to support local services and the extent to which the Treasury will want to rely on their contribution to the public finances.
• Economic.and.distributional.impacts: taxes on property and some other forms of wealth often have an impact on the affordability and price stability of housing and other assets, with knock-on effects for the wider economy. Council tax and stamp duty may have contributed to high house price volatility in the UK over the last 20 years, but well-designed property taxes could enhance market stability and increase rates of housebuilding. Supporters of tax reform need to have a strong account of how alternative forms of taxation might affect the property market, investment behaviour and the wider economy. Similarly, robust analysis of the distributional effects of tax changes, demonstrated here with the IPPR wealth tax model, are vital for helping policymakers understand the opportunities and constraints on reform.
• Trade-offs.and.political.implications: targeting the ‘super-rich’ is politically attractive, and may have a role in securing our public finances, but raising substantially more money through wealth taxes and ensuring relatively sustainable revenues may require a much wider tax base. Replacing our incoherent system of wealth taxes with more sensible alternatives (like replacing council tax with a property tax) would improve efficiency and make the tax system fairer, but may make many people worse off compared to the current system. New options like a land value tax would tax resources that have not previously featured in the tax base. Across the OECD, there is no clear consensus about how best to tax wealth and popular support for many forms of wealth taxation remain low, particularly if they stretch beyond the very wealthy. The political implications and trade-offs implied by many of these options need to be factored into future plans for reforming wealth taxes.
• Design.and.implementation: in a tax system that rests so heavily on taxing income and consumption, the valuation base necessary for taxing many aspects of property and wealth remains underdeveloped. This is why inefficient taxes like stamp duty remain popular with governments, because the tax base is easy to identify and there
4. CONCLUSIONSANDAREASFORFURTHERRESEARCH

IPPR | Property and wealth taxes in the UK: The context for reform29
is a ready-made mechanism for valuing the asset. New options like a property tax or a land value tax would require new and robust systems of valuation, including processes to regularly update prices. Policy stability is important since individuals will often change their behaviour in the short term if it seems likely that policy will change.
There are dozens of commendable proposals for reforming wealth taxes in the UK, a number of which have been discussed in this report. That none have made much progress over the last 20 years suggests that there are major barriers to reform that go beyond the theoretical case for change or the technical design of policy proposals. There are enormous political challenges inherent in reforming wealth taxes, which must be balanced against reform challenges in other areas, particularly given the lack of a popular demand for changes and the small contribution that wealth taxes make to the public finances. This makes it important to identify priorities for reform.
The evidence in this report suggests reforms in three important areas:
• Replacing.council.tax: council tax is clearly regressive across a number of different measures, is paid by most households and is by far the most important source of revenue among taxes based on wealth. More work is needed to assess whether a housing consumption tax or a property tax is most appropriate, not least in terms of how different models would affect local government finances.
• Gradual.introduction.of.land.value.tax: introducing a new tax on the value of high-value but undeveloped land would help build the infrastructure for a more comprehensive tax in time.
• Replacing.inheritance.tax.with.a.lifetime.receipts.tax: inheritance tax has little popular support and raises little money. Replacing it with a lifetime receipts tax would make the tax system fairer and more efficient.
Further development of the IPPR wealth tax modelThe IPPR wealth tax model makes a unique contribution to our understanding of how alternative tax reforms are likely to affect different kinds of families together with the potential effect on the public finances, helping to support policy debates about tax reform in the UK. There are a number of ways in which the model could be further developed over time to expand its functionality, including:
• Adding cross-sectional data from the second wave of the Wealth and Assets Survey, collected in 2008–10 (which became available in the later stages of this project), and continuing to regularly update the underlying data in the model in future
• Using the longitudinal structure of the WAS to analyse the distribution of wealth across waves, for example, to build up a longer-term measure of household wealth to complement the existing ‘snapshot’ picture.
• Using the improved inheritance information in wave two of the WAS to implement an inheritance tax (and possible alternatives) in the model.
• Making use of the longitudinal data to test the feasibility of using changes in wealth ownership to assess the impact of changes to the capital gains tax regime.
• Incorporating assumptions about behavioural effects, such as the potential for tax avoidance. This would be a substantial and complex task, but would add considerable value to the model.
IPPR | Property and wealth taxes in the UK: The context for reform30
ReferencesAdam S, Brewer M, Browne J and Phillips D (2010) Taxes and Benefits: The Parties’
Plans, 2010 election briefing note no 13, London: Institute for Fiscal Studies
Adam S, Emmerson C and Roantree B (2013) ‘Broad shoulders and tight belts: options for taxing the better-off’, IFS Green Budget 2013, London: Institute for Fiscal Studies
Barker K (2004) Delivering Stability: securing our future housing needs, final report of the review of housing supply, London: HM Treasury
Black O (2011) Wealth in Great Britain. Main Results from the Wealth and Assets Survey: 2008/10, London: Office for National Statistics
Black O (2012) Wealth in Great Britain 2008–10 part two, Newport: Office for National Statistics
Boadway R, Chamberlain E and Emmerson C (2010) Taxation of wealth and wealth transfers: Appendices, London: Institute for Fiscal Studies
Bräuninger D (2012) Income and wealth taxes in the euro area: an initial overview, European integration research briefing, Frankfurt: Deutsche Bank
Brooks R (2005) ‘Commentary’ in Maxwell D and Vigor A (eds) Time for a Land Value Tax?, London: IPPR. http://www.ippr.org/publication/55/1380/time-for-land-value-tax
Commission on Taxation and Citizenship (2000) Paying for Progress: A new politics of tax for public spending, London: Fabian Society
Communities and Local Government [CLG] (2012) Council Tax Levels Set by Local Authorities in England, 2012–13. https://www.gov.uk/government/uploads/system/uploads/attachment_data/file/6638/2110513.pdf
Denk O (2012) Tax reform in Norway: a focus on capital taxation, OECD Economics Department working paper no 950, Paris: OECD
Department for Work and Pensions [DWP] (2012a) Households Below Average Income 1994/95–2010/11, London
Department for Work and Pensions [DWP] (2012b) Income-related Benefits: Estimates of take-up in 2009–10, London
Dolphin T (2010) Death and taxes: Why inheritance tax should be replaced with a capital receipts tax, London: IPPR. http://www.ippr.org/publication/55/1818/death-and-taxes-why-inheritance-tax-should-be-replaced-with-a-capital-receipts-tax
Evans A (2009) Optimal Taxation Theory and the Taxation of Housing, Report to the Department of Communities and Local Government, Reading: Centre for Spatial and Real Estate Research, University of Reading
Glennerster H (2012) ‘Why was a wealth tax for the UK abandoned? Lessons for the policy process and tackling wealth inequality’, Journal of Social Policy, 41(2): 233–249
Griffith M, McCarvill P and Gaffney D (2012) Affordable capital? Housing in London, London: IPPR. http://www.ippr.org/publication/55/9064/affordable-capital-housing-in-london
Hills J (2004) Inequality and the State, Oxford: Oxford University Press
Hills J, Sefton T and Stewart K (2009) Towards a More Equal Society? Poverty, inequality and policy since 1997, Bristol: Policy Press

IPPR | Property and wealth taxes in the UK: The context for reform31
Hull A and Cooke G (2012) Together at home: A new strategy for housing, London: IPPR. http://www.ippr.org/publication/55/9279/together-at-home-a-new-strategy-for-housing
Johansson A, Heady C, Arnold J, Brys B and Varia L (2008) Tax and Economic Growth, OECD Economics Department working paper no 620, Paris: OECD
Karagiannaki E (2011) The Impact of Inheritance on the Distribution of Wealth: Evidence from the UK, London: Centre for Analysis of Social Exclusion, London School of Economics
Lawton K (2011) Coalition tax policy, London: IPPR. http://www.ippr.org/publication/55/7971/coalition-tax-policy
Lawton K and Silim A (2012) Pressures and priorities: The long-term outlook for Britain’s public finances, London: IPPR. http://www.ippr.org/publication/55/9633/pressures-and-priorities-the-long-term-outlook-for-britains-public-finances
Lloyd J (2011) Charges, Taxes, Estates and Care: A comparative analysis, London: Strategic Society Centre
Lyons M (2007) Lyons Inquiry into Local Government, London: The Stationery Office
Maxwell D and Vigor A (2005) Time for Land Value Tax?, London: IPPR. http://www.ippr.org/publication/55/1380/time-for-land-value-tax
McClean I (2005) ‘The politics of land tax – then and now’ in Maxwell D and Vigor A (eds) Time for a Land Value Tax?, London: IPPR. http://www.ippr.org/publication/55/1380/time-for-land-value-tax
Mirrlees J, Adam S, Besley T, Blundell R, Bond S, Chote R, Gammie M, Johnson P, Myles G and Poterba J (2011) Tax by Design: The Mirrlees Review, Oxford: Oxford University Press
Muellbauer J (2005) ‘Property taxation and the economy’ in Maxwell D and Vigor A (eds) Time for a Land Value Tax?, London: IPPR. http://www.ippr.org/publication/55/1380/time-for-land-value-tax
Oxley M and Haffner M (2010) Housing taxation and subsidies: international comparisons and the options for reform, York: Joseph Rowntree Foundation
Naess-Schmidt HS, Pedersen TT, Harhoff F, Winiarczyk M, Jervelund C (2010) Study on inheritance taxes in EU member states and possible mechanisms to resolve problems of double inheritance taxation in the EU, Copenhagen Economics, commissioned for the European Commission Taxation and Customs Union Directorate General. http://ec.€pa.eu/taxation_customs/resources/documents/common/consultations/tax/2010/08/inheritance_taxes_report_2010_08_26_en.pdf
OECD (2006) Taxation of Capital Gains of Individuals: policy considerations and approaches, Paris
OECD (2011) OECD Economic Surveys: United Kingdom 2011, Paris
OECD (2012) OECD Economic Surveys: Norway 2012, Paris
Office for National Statistics [ONS] (2010) Wealth and Assets Survey, Waves 1, 2006–2008: Special Licence Access, first edition, Colchester: UK Data Archive
Office for Budget Responsibility [OBR] (2012) Fiscal Sustainability Report 2012, London
Orton M (2006) Struggling to Pay Council Tax: A new perspective on the debate about local taxation, York: Joseph Rowntree Foundation

IPPR | Property and wealth taxes in the UK: The context for reform32
Pippin S, Tosun M, Carslaw C and Mason R (2010) ‘Property tax and other wealth taxes internationally: evidence from OECD countries’, Advances in Taxation, 19: 145–169
Prabhakar R, Rowlingsone K and White S (2008) How to Defend Inheritance Tax, London: Fabian Society
Rowlingson K and Appleyard L (2010) Home-ownership and the Distribution of Personal Wealth, JRF programme paper. http://www.jrf.org.uk/publications/home-ownership-distribution-personal-wealth
Stephens M (2011) Tackling Housing Market Volatility in the UK, York: Joseph Rowntree Foundation
Zipfel F (2007) Wealth Tax Revisited, Deutsche Bank Research, 15 March 2007. http://www.dbresearch.com/PROD/DBR_INTERNET_EN-PROD/PROD0000000000208139/Wealth+tax+revisited.PDF

IPPR | Property and wealth taxes in the UK: The context for reform33
1. Data used in the model
The.Wealth.and.Assets.SurveyThe main dataset used in the IPPR wealth tax model (hereafter called ‘the model’) is the Wealth and Assets Survey (WAS). This is a dataset of just over 30,000 households in England, Scotland and Wales (but not Northern Ireland). The WAS has a panel structure and households are reinterviewed every two years. However, as the model only used wave one of the WAS data for the purposes of this report, the panel dimension of the data has not yet been exploited. We plan to use wave two and future waves of the WAS in subsequent development of the model.
The WAS divides wealth into four categories: physical, financial, property and pension. The model uses various measures of wealth in the WAS. The following wealth measures are available for use for distributional analysis:
• total household wealth including pension wealth
• total household wealth excluding pension wealth
• household physical wealth
• total household wealth excluding physical wealth but including pension wealth
• total household wealth excluding physical wealth and pension wealth
• gross household financial wealth
• net household financial wealth
• household property wealth (banded measure).
The physical wealth questions in the model are only asked of just over half the sample (17,316 households out of 30,595) and so any distributional analyses using the wealth measures which include physical wealth (the first three measures in the list above) are carried out only on this part-sample.
The WAS is a survey of private households. This means it excludes property, land and wealth owned by other entities, such as companies and trusts. Some households will benefit directly from wealth formally owned on their behalf by companies and trusts, but this will not be reflected in the data gathered by the WAS. In addition, some wealth taxes (such as land value taxes) are usually levied on the value of all holdings regardless of the legal form of the owner. This means that for some kinds of taxes, the results produced from the IPPR wealth tax model will underestimate the total revenue effects of reforms to the UK tax regime.
Additional data from the WAS is also used in the model, including:
• demographic data, such as the number and age of adults in the household and the number and age of children in the household
• nation or region of residence
• housing tenure
• employment status of adults in the household
• receipt of various benefits and tax credits.
These other variables are used for three purposes:
• to provide additional information on household circumstances to use in modelling certain specifications for wealth taxes (for example, applying wealth taxes to households where the adult(s) are above or below a specified age threshold)
ANNEX1TECHNICALDETAILSOFTHEIPPRWEALTHTAXMODEL

IPPR | Property and wealth taxes in the UK: The context for reform34
• to provide additional breakdowns for distributional results (for example, household work status and family type)
• to provide additional information to use in constructing a disposable income measure for the WAS (see below).
Imputing.a.measure.of.disposable.income.in.the.WAS.dataOne drawback of wave one of the WAS is that the dataset contains no comprehensive measure of household disposable income because of problems with the survey questionnaire. This makes it harder to analyse the distributional results of wealth taxes on the household income distribution. It is relatively straightforward to analyse the impact of wealth taxes on the wealth distribution, but the IPPR wealth tax model becomes much more useful if we can combine distributional analysis on the WAS by income decile with results from the IPPR income-based tax and benefit model (which runs on the Family Resources Survey (FRS) for analysis of direct taxes and benefits and the Living Costs and Food Survey (LCF) for analysis of indirect taxes).
Combining results from the WAS and the FRS (or LCF) in this way requires a measure of household disposable income to be available in the WAS, and since no such disposable income measure was collected at the household interview stage or at the post-interview data processing and derivation stage, one of our tasks in this project was to derive a disposable income measure for the WAS. Deriving the household income measure for the survey involves a three-stage process:
Stage 1: calculating gross incomesInformation on most aspects of gross income (income before taxes and transfer payments from the government) is included in the WAS data, at the individual adult level. The components which are included are as follows:
• gross earned income (from employment or self-employment – the WAS also includes an employment status variable for each adult so that we know whether the adult was employed or self-employed)
• maintenance or alimony payments from a partner or ex-partner
• allowances received from non-partners, for example, other family members
• royalty payments
• income from private pensions
• income from property (for example rental income).
Regular income from investments is not collected in the WAS but information on the stocks of investments held by individuals (such as balances in bank, building society accounts and ISAs, the value of stocks, shares and gilts held) is collected in detail. Therefore we use data from the Bank of England on typical interest rates in different kinds of bank accounts,10 and data from the London Stock Exchange average dividend payments in the FTSE All Share index, to derive annual incomes from the stock of investments held by each household.
10 Specifically, the data series used from the Bank of England are: IUMWTTA (average monthly interest rates on savings accounts with notice periods for access); IUMTHAK (average monthly interest rates on instant access savings accounts; IUMWTIS (average monthly interest rates on cash ISAs); IUMWTFA (average monthly interest rates on fixed-term bonds).

IPPR | Property and wealth taxes in the UK: The context for reform35
Stage 2: imputing rent payments for tenantsThe WAS contains information on the housing tenure of each household in the sample and data on mortgage payments for owner-occupier households, but it contains no data on rent payments for tenant households. This means that an imputation procedure has to be used to produce a weekly rent variable for each tenant that can be used to derive housing benefit payments for low-income households (which are an important component of before housing costs income).
The imputation of rents for the WAS tenant sample is achieved using a conditional cold-deck imputation procedure with the Family Resources Survey for the same period as WAS wave one (that is, the 2006–07 and 2007–08 FRS waves). FRS respondents are divided into 396 ‘cells’ conditional on:
• region/nation (11 in total: nine government office regions in England, plus Wales and Scotland)
• whether the household is a local authority or housing association tenant or a private sector tenant
• number of adults (one or more than one)
• whether the adults in the household are in work
• if in work, what part of the gross earnings distribution the adults in the household are in (bottom 25 per cent or top 75 per cent)11
• whether the household has no children, one child or two or more children.
Tenant households in the WAS are then divided into 396 cells according to the same characteristics. Each WAS household is then allocated a weekly rental value randomly drawn from the FRS cell with the same characteristics.
Information on council tax band, which is also missing for tenants in the WAS, is imputed at the same time as rent for tenants. For homeowners, an imputation is done using the information in the WAS on current property values and extrapolating back to 1993 (when council tax valuation was last carried out in England) using data on regional house prices from the Halifax database.
Stage 3: direct taxes, national insurance contributions, benefits and tax creditsIncome from means-tested benefits and tax credits, and payments of income tax and national insurance contributions, are calculated using the IPPR’s income-based tax and benefit model with the relevant routines adapted to run on the WAS data sample. For non-means-tested benefits such as child benefit, state retirement pension, disability living allowance and invalidity benefit, eligibility for these benefits is derived from a combination of household characteristics (for example whether the household has any children or not) and data from the WAS on whether anyone in the household receives the benefit or not.
This technique produces an imputed income measure from the WAS which appears to have a reasonably similar distribution to the FRS for the same time period (see annex 2 for more details).
11 Originally the four quartiles of gross earnings were used as separate ‘cells’, but the number of tenants in social housing above the 25th percentile of gross earnings is relatively low, resulting in a large number of empty ‘cells’. Consequently, the top three earnings quartiles were amalgamated into one cell.

IPPR | Property and wealth taxes in the UK: The context for reform36
The.British.Household.Panel.SurveyThe Wealth and Assets Survey is the best dataset to use for modelling all of the wealth taxes featured in this project, with the exception of inheritance tax (IHT). Due to a routing problem in the questionnaire, the information collected on inheritances in wave one of the WAS is not usable for analysis. Instead, we have used data from the British Household Panel Survey (BHPS) to model IHT. The BHPS ran from 1991 to 2008 and collected data on inheritances received by adults in the panel every five years, in 1995, 2000 and 2005.
The BHPS also collected data on property and financial wealth in the 2005 wave (but not pen-sion or physical wealth) and so this can be used to construct decile measures for distributional analysis of these variables, which can be combined with the WAS (provided the 2005 data is suitably uprated). Reasonably accurate disposable income measures for the BHPS have also been calculated by Professor Stephen Jenkins and colleagues at the University of Essex.
The BHPS contains similar demographic variables to the WAS and these can be used to provide further breakdowns of results by household type, which can be combined with the WAS data.
Uprating.the.model.dataBecause the WAS data used in the model is from 2006–08 they need to be uprated to 2013 levels to be usable for making accurate forecasts of the distributional impact and yield of wealth taxes. Different components of wealth and incomes are uprated using the appropriate indices:
• earned incomes: using the Average Weekly Earnings (AWE index)
• stocks and shares: using the FTSE All Share index
• property using the Halifax property index (which is differentiated by region)
• most other components of wealth are uprated using the Consumer Prices Index (CPI) as we do not have any reliable information on how holdings of these assets change over time, except from the WAS (which is the dataset we are using in any case).
We plan to add future waves of the WAS to the model soon after they are released (wave two was released in 2012). This will ensure that the information on wealth holdings in the WAS sample is kept as up-to-date as possible.
2. Scope and coverage of the IPPR wealth tax modelIn technical terms we are currently able to model several different kinds of wealth tax, including recurrent taxes on stocks of wealth, taxes on property transactions and inheritance tax (although with limitations in practice). Some forms of wealth taxation are currently beyond the scope of the model due to data issues.
Recurrent.taxes.on.stocks.of.wealthThis includes a number of the taxes discussed in the main report, including the annual net wealth tax, a tax on gross property values and a ‘mansion tax’. Each of these is modelled using the same basic framework, which allows for the following flexibility in terms of available parameters:
• separate rates and thresholds can be set for each of the main components of wealth (financial wealth, physical wealth, property and pensions)
• separate tax-free allowances can be set for each of the main components of wealth
• the various components and sub-components of wealth can be exempted entirely (for example, ISAs can be exempted in the ‘financial wealth’ category).

IPPR | Property and wealth taxes in the UK: The context for reform37
Taxes.on.property.transactionsTaxes on property transactions (currently stamp duty land tax in the UK) can be easily modelled using WAS data as the WAS contains data on the time period when households in the sample bought their homes. As the model is designed to produce results over an annual period, households liable for payments of stamp duty are identified as those who have bought one or more properties in the last 12 months (if the purchase price of the property was in excess of the stamp duty threshold).
Currently, stamp duty is applied to the whole of the purchase price of a residential property at the highest marginal rate applicable to the property. So, for example, a house sold for £300,000 pays (3% x £300,000) = £9,000 of duty. An option is included in the model parameter files to apply stamp duty at the marginal rates corresponding to each tranche of the purchase price (in the same way as personal income tax works for example), rather than at the highest rate. The rates can also be varied.
Inheritance.taxIt is possible to use the BHPS data on inheritances to examine the distributional effects of inheritance tax payments. IHT is levied according to the size of the deceased person’s estate rather than the size of the individual inheritance received by each donee. However, the BHPS only gives us information on the size of the donees’ inheritances, not the size of the estates themselves. Therefore, it is necessary to impute the size of the estates using the BHPS data on the size of inheritances. We do this using an estimate of the average number of donees per estate of 4.6, taken from Karagiannaki (2011). For each recipient of an inheritance in the BHPS it is assumed that the total inheritance is 4.6 times the size of the inheritance received. The total inheritance tax bill for the estate is calculated based on this assumption, and then divided by 4.6 again to give the final estimate of the donee’s inheritance tax liability.
There are three types of tax that we would ideally have wished to model in the wealth taxes model but which we are unable to model due to data limitations in wave one of the WAS.
Capital.gains.taxThe WAS contains information on current holdings of financial assets but not on disposals of financial assets. Hence it is not possible to model capital gains tax (CGT) using the current version of the model. In a future project we plan to add WAS wave two into the model; this should allow us to see how holdings of financial assets change between waves one and two, and to impute capital gains from the change between waves (combined with information on changes in underlying asset prices between waves).
Taxes.on.financial.transactionsBecause the WAS does not have information on the amount of financial assets which households buy and sell over a period of time (rather than their current holdings) it is not possible to model taxes on financial transactions (such as stamp duty on share purchases, or the ‘Robin Hood Tax’ recently proposed by a consortium of NGOs and activist groups) using WAS wave one. However, it may be possible to model taxes on financial transactions using data from two or more waves of the WAS by looking at changes in asset holdings between waves.
Land.value.taxTheoretically, a land value tax is easy to model by applying the same kind of allowance/rate-band structure to an estimate of the value of the land which each household owns (if any) as we do to the various components of wealth to model recurrent taxes on wealth

IPPR | Property and wealth taxes in the UK: The context for reform38
holdings. The problem is that it is not straightforward to estimate the value of most of the land owned by households in the WAS sample. The value of undeveloped land (both in the UK and abroad) is collected in the WAS, for the relatively small number of households in the sample who own such land. But the majority of the land owned by WAS sample members is owned in the form of plots for owner-occupied (or buy-to-let) housing. There is no straightforward way of decomposing property values in the WAS into a land value component and a building value component. We are continuing to explore possible methods for including a reliable imputation of land values when constructing the WAS model dataset and it is hoped that a future version of the model will be capable of modelling the distributional effects of land value taxes.

IPPR | Property and wealth taxes in the UK: The context for reform39
1. Comparison of WAS and FRS dataAs it was necessary to construct a simulated income measure using the WAS data, it is important to compare the WAS data with the FRS to make sure that the two datasets are roughly comparable, and also that the simulated income measure in the WAS data looks comparable to the FRS data.
Tables A1 to A5 below compare the WAS wave one and FRS 2008–09 datasets using a number of demographic variables. Population weights are used in both cases so that the proportions in each category correspond to the population. The FRS analysis excludes Northern Ireland because the WAS data does not cover Northern Ireland.
Tables A1 to A4 show that in terms of the distribution of households by region, housing tenure, number of adults and number of children in each household, the WAS and FRS data look fairly similar. Table A5 shows that the proportion of households with multiple benefit units is somewhat higher in WAS than in the FRS. However, as the distribution of the number of adults and the number of children in each dataset looks reasonably similar, the difference in the family type distribution does not seem to be a major problem.
Proportion.of.households.in.region/nation
WAS.measure FRS.measure
North East 4.4 4.4
North West 11.7 11.8
Yorkshire and the Humber 8.9 8.6
East Midlands 7.5 7.5
West Midlands 8.9 8.8
East of England 9.5 9.5
London 12.1 12.6
South East 13.7 13.8
South West 8.8 8.8
Wales 5.2 5.1
Scotland 9.3 9.1
Total 100.0 100.0
Proportion.of.households.in.tenure.type
WAS.measure FRS.measure
Buying main residence outright 30.1 33.0
Buying main residence with mortgage 37.7 35.5
Shared ownership 0.4 0.4
Renting from housing association/local authority 19.1 17.6
Private renter 11.4 12.4
Rent free/squatting 1.3 1.0
Total 100.0 100.0
ANNEX2THEWASDATA
Table.A1..Comparisons of WAS
(2006–08) and FRS (2008–09) datasets:
region variables
Table.A2..Comparisons of WAS
(2006–08) and FRS (2008–09) datasets:
housing tenure

IPPR | Property and wealth taxes in the UK: The context for reform40
Proportion.of.households
WAS.measure FRS.measure
1 33.4 35.2
2 50.4 50.5
3 10.8 9.6
4 or more 5.4 4.7
Total 100.0 100.0
Proportion.of.households
WAS.measure FRS.measure
1 72.7 71.8
2 13.2 13.5
3 10.5 10.9
4 or more 3.5 3.8
Total 100.0 100.0
Proportion.of.households
WAS.measure FRS.measure
Single, no children 14.6 17.2
Single with children 4.8 5.8
Couple, no children 14.8 18.6
Couple with children 15.8 17.8
Single pensioner 14.1 13.2
Couple pensioner 13.6 10.7
Multiple benefit units 22.5 16.8
Total 100.0 100.0
Table A6 compares the WAS and the FRS on variables related to the labour market. The two datasets are very similar in terms of the proportion of households with at least one adult in work (64.7 per cent for WAS versus 65.2 per cent for FRS). Looking at individual working age adults, the WAS has slightly fewer employees and unemployed adults and slightly more inactive people than the FRS. Both datasets have a similar number of individuals with no (UK-based) qualifications.12
WAS.measure FRS.measure
Proportion of working households 64.7 65.2
Proportion of working age: employees 62.3 64.6
Proportion of working age: self-employed 8.1 8.3
Proportion of working age: unemployed 2.9 4.2
Proportion of working age: inactive 26.7 22.9
Proportion of adults with no qualifications 36.5 36.1
Table A7 compares the proportion of adults claiming various benefits in each dataset. In all cases the proportions claiming each benefit are within a couple of percentage points of each other, and in many cases much closer than this.
12 Because of the way the qualifications questions are asked in the FRS, individuals with non-UK qualifications and no UK qualifications (for example adult immigrants from other EU countries) cannot be identified separately from individuals with no qualifications.
Table.A3..Comparisons of WAS
(2006–08) and FRS (2008–09) datasets: number of adults in
household
Table.A4..Comparisons of WAS
(2006–08) and FRS (2008–09) datasets:
number of children in household
Table.A5..Comparisons of WAS
(2006–08) and FRS (2008–09) datasets:
household type
Table.A6..Comparisons of WAS
(2006–08) and FRS (2008–09) datasets:
labour market-related variables

IPPR | Property and wealth taxes in the UK: The context for reform41
Proportion.of..adults.claiming: WAS.measure FRS.measure
Attendance allowance 1.5 2.0Child tax credit 8.0 9.3Carers allowance 1.1 1.0Child benefit 13.9 15.2DLA (care component) 3.2 4.1DLA (mobility component) 3.0 4.1Incapacity benefit 2.6 2.6Income support 3.5 3.3Jobseeker’s allowance 1.0 1.8Pension credit 3.4 3.8Retirement pension 20.7 22.6
Table A8 compares the WAS and the FRS on gross earnings measures (uprated to April 2008 price levels) for adults in work. In general the earnings distribution for the WAS is slightly below the FRS across most of the distribution. Median earnings in the WAS are only 0.6 per cent below median earnings in the FRS, but at the low and high ends of the distribution the difference is greater: at the fifth percentile, earnings in the WAS are around 18 per cent lower than in the FRS, whereas at the 95th percentile, earnings in the WAS are around six per cent lower than in the FRS.
Adult.gross.earnings..(£/week) WAS.measure FRS.measure1st percentile 843 1,6395th percentile 3,565 4,32610th percentile 5,617 6,12625th percentile 11,472 12,157Median 19,446 19,56275th percentile 29,700 30,66690th percentile 43,072 44,62395th percentile 54,449 58,11499th percentile 91,824 106,029Mean 23,664 24,488
Table A9 compares modelled (equivalised) household disposable (before housing costs (BHC)) income for the WAS and the FRS. Up to the 10th percentile, WAS modelled income is slightly above FRS modelled income, but at the 25th percentile and above this pattern is reversed. Median income in the WAS is around eight per cent lower than in the FRS. In the upper half of the distribution the differences are smaller: at the 95th percentile the WAS and the FRS are virtually identical. Overall, the two datasets look reasonably well matched over most of the income distribution.
Equivalised.BHC.income. WAS.measure FRS.measure1st percentile 6,156 4,0345th percentile 10,940 10,73410th percentile 12,938 12,65525th percentile 15,405 16,329Median 20,644 22,34875th percentile 31,591 32,46690th percentile 46,914 47,21495th percentile 59,666 59,90599th percentile 95,545 100,288Mean 26,553 27,696
Table.A7..Comparisons of WAS
(2006–08) and FRS (2008–09) datasets:
proportion of adults with benefit claims
Table.A8..Comparisons of WAS
(2006–08) and FRS (2008–09) datasets:
analysis of adult gross earnings for people in
employment (in real terms at April 2008
levels)
Table.A9..Comparisons of WAS
(2006–08) and FRS (2008–09) datasets:
equivalised BHC income (in real terms at April
2012 levels)

IPPR | Property and wealth taxes in the UK: The context for reform42
2. Comparing modelled income and wealth in the WAS datasetHaving constructed the WAS income measure, it is instructive to compare income and wealth across the WAS sample.
Figure A1 is a scatterplot of BHC disposable income against net wealth (excluding pension and physical wealth) for most of the WAS sample (people with wealth of less than minus £250,000 or more than £3 million, and people with negative income or income of more than £250,000 per year, are excluded to make the graph more readable.)
Figure A1 shows that there is some positive relationship between wealth and income but it is fairly weak; a linear regression line of best fit is included on the graph, but the R2 statistic from a regression of wealth on income is only 0.11. There are large numbers of people with relatively high wealth but low incomes, and vice versa.
-£250
£0
£250
£500
£750
£1,000
£1,250
£1,500
£1,750
£2,000
£2,250
£2,500
£2,750
£3,000
£0 £50
£100
£150
£200
£250
Net
wea
lth (e
xclu
ding
pen
sion
wea
lth)
BHC disposable income
Figure.A1..Modelled BHC
disposable income and wealth (excluding
pension wealth) in WAS: linear scale

IPPR | Property and wealth taxes in the UK: The context for reform43
Figure A2 shows the same data points as Figure A1 but on a logarithmic scale instead of a linear scale. Negative values of income or wealth cannot be represented on a log scale so the graph is restricted to households with positive wealth and income only. There is a slightly clearer positive relationship between income and wealth using this scale but the relationship is still fairly weak.
£1
£10
£100
£1,000
Net
wea
lth (e
xclu
ding
pen
sion
wea
lth)
BHC disposable income
£1 £10
£100
£1,0
00
Finally, Figure A3 shows the same data as for Figure A2 but splitting the sample into pensioner households (in blue) and non-pensioners (in red). Pensioner households have lower incomes on average than non-pensioner households; it is hard to see any obvious difference in the distribution of wealth from the scatterplot.
£1
£10
£100
£1,000
£1 £10
£100
£1,0
00
Net
wea
lth (e
xclu
ding
pen
sion
wea
lth)
BHC disposable income
Pensioners
Non-pensioners
Figure.A2..Modelled BHC
disposable income and wealth (excluding
pension wealth) in WAS: logarithmic scale
Figure.A3..Modelled BHC
disposable income and wealth (excluding
pension wealth) in WAS: logarithmic scale, pensioners in blue, non-
pensioners in red