discrimination in the european...
TRANSCRIPT

Special Eurobarometer
Discrimination in the European Union Summary
Fieldwork: June – July 2006
Publication: January 2007
Spe
cial
Eur
obar
omet
er 2
63 /
Wav
e 65
.4 –
TN
S O
pini
on &
Soc
ial
This survey was requested by the Directorate-General Employment, Social Affairs and Equal Opportunities and coordinated by the Directorate-General Communication.
This document does not represent the point of view of the European Commission. The interpretations and opinions contained in it are solely those of the authors.
European Commission


Special EUROBAROMETER 263 “Discrimination in the European Union” Summary
- 2 -
Table of contents
INTRODUCTION............................................................................................. 3
1. Discrimination in Europe: perception and attitudes .................... 4
1.1 Overview......................................................................................4 1.2 Ethnic Origin .................................................................................7 1.3 Disability ....................................................................................10 1.4 Sexual orientation........................................................................11 1.5 Age ...........................................................................................13 1.6 Religion or beliefs ........................................................................14 1.7 Gender.......................................................................................16 1.8 Representation and participation in society......................................17
2. Views about equal opportunities in employment ...................... 18
2.1 Criteria which put people at a disadvantage.....................................18 2.2 Employment, training and chances for promotion .............................19 2.3 Support for measures to provide equal opportunities in employment ...20
3. Combating discrimination ........................................................ 21
3.1 Assessment of efforts made to fight discrimination ...........................21 3.2 Actors having a role to play in combating discrimination....................22 3.3 The willingness to provide sensitive personal information in certain
conditions...................................................................................23
4. Raising awareness................................................................... 24
4.1 Awareness of the laws prohibiting discrimination ..............................24 4.2 Knowledge of one’s right as a victim of discrimination .......................25
CONCLUSION............................................................................................... 26
Annex: technical specifications

Special EUROBAROMETER 263 “Discrimination in the European Union” Summary
- 3 -
INTRODUCTION
Two European Community Directives, the Racial Equality Directive and the Employment Framework Directive, define a set of principles that offer everyone in the EU a common minimum level of legal protection against discrimination1. The directives prevent people in the European Union from being discriminated against on grounds of race and ethnic origin and on grounds of religion or belief, disability, age or sexual orientation, primarily in the workplace. This comes in addition to the numerous laws adopted in the past 30 years to fight discrimination based on sex and to allow for equal treatment between women and men in the workplace.
Despite widespread legal protection, discrimination continues to exist and further efforts are needed to ensure that the right not to be discriminated against is implemented effectively in an enlarged European Union that from 1 January 2007 also includes Bulgaria and Romania. To build upon information campaigns launched in 2003 to raise awareness of the right to equal treatment and non-discrimination in all Member States, 2007 has been designated as the “European Year of Equal Opportunities for All”. The aim of the Year will be to inform people of their rights, to celebrate diversity and to promote equal opportunities for everyone in the European Union.
In this summary we present the findings from a survey about discrimination and inequality in Europe that was carried out by TNS Opinion & Social on behalf of the European Commission DG Employment, Social Affairs and Equal Opportunities in the twenty-five Member States of the European Union and in the two acceding countries between 7 June and 12 July 2006.
The methodology used is that of the Standard Eurobarometer surveys of the Directorate General Communication (“Public Opinion and Media Monitoring” Unit). A technical note concerning the interviews, carried out by the institutes of the TNS Opinion & Social network, is annexed to this report. This note specifies the interview method used, as well as the confidence intervals2. In this summary the six legally prohibited forms of discrimination in the EU are examined: discrimination on the basis of sex, ethnic origin, religion or beliefs, age, disability and sexual orientation.
Abbreviations used in this summary correspond to:
EU25 European Union - 25 Member States at the time of the survey and prior to the accession of Bulgaria and Romania
EU15 European Union - 15 Member States before the most recent enlargement (1st May 2004)
DK Don’t know
Readers are reminded that survey results are estimations, the accuracy of which rests upon the sample size and upon the observed percentages.
1 Directive 2000/43/EC of 29 June 2000 and Directive 2000/78/EC of 27 November 2000. Both directives follow directly from Article 13 of the Amsterdam Treaty establishing the European Community which reads: "the Council, acting unanimously on a proposal from the Commission and after consulting the European Parliament, may take appropriate action to combat discrimination based on sex, racial or ethnic origin, religion or belief, disability, age or sexual orientation". Discrimination occurring in the workplace on the ground of sex is prohibited by several other directives that have been adopted since 1975. 2 The results tables are included in the annex. The totals indicated may show a one point difference with the sum of the individual units. It should also be noted that the total of the percentages in the tables of this report may exceed 100% when the respondent has the possibility to give several answers to the same question.


Special EUROBAROMETER 263 “Discrimination in the European Union” Summary
- 4 -
1. Discrimination in Europe: perception and attitudes 1.1 Overview Discrimination is widespread, according to a large proportion of Europeans. In particular, discrimination on the basis of ethnic origin, disability and sexual orientation is considered by citizens to be widespread.
Q1 Perception of discrimination on the basis of ...EU25 (%)
64
53
50
46
44
40
6
6
9
7
8
853
47
48
41
42
30…ethnic origin
…disability
…sexual orientation
…age
…religion or beliefs
…gender
Rare Widespread DK/NE
These averages hide considerable discrepancies between countries. These differences by country result from different factors: socio-economic, historic and cultural ones. The presence and proportion of people from a different ethnic origin, or different religion and beliefs than the rest of the population also impact on the results. We will present these differences hereunder. It is difficult to explain the differences between countries. Firstly, people’s perceptions and opinions about discrimination are formed on the basis of personal experiences and beliefs as well as on actual contextual events. Furthermore, people’s perceptions and opinions about discrimination are formed on the basis of norms and standards. The term “widespread” can therefore be interpreted quite differently depending on what people perceive as the norm. Nonetheless, there are some patterns in the results which provide some insight.

Special EUROBAROMETER 263 “Discrimination in the European Union” Summary
- 5 -
The perceived position of different groups in society On average, a broad majority of European Union citizens believe that being disabled, being a Roma, being older, belonging to an ethnic minority or being homosexual tends to be a disadvantage in their country. Close to 8 out of 10 EU citizens believe this to be the case when a person is disabled (79%) or when a person is a Roma (77%).
Q6 - Would you say that the fact of belonging to the following groups tends to be an advantage or a disadvantage, or neither,
in (NATIONALITY) society at the current time? EU25 (%)
15
15
24
30
39
54
54
38
45
3
3
5
4
2
3
11
39
494
20
33
39
54
62
69
77
79Being disabled
Being a Roma
Being aged over 50
Being a person of a different ethnic origin than the restof the population
Being homosexual
Being part of a religion that is different from the mainreligion in the country
Being a woman
Being aged under 25
Being a man
Disadvantage Neither Advantage
Attitudes towards vulnerable groups in society The survey shows further that, on average, European Union citizens recognise the disadvantages faced on the basis of disability, sexual orientation, gender and ethnic origin. Europeans empathise most with the disabled, with nearly all EU citizens supporting the suggestion that more money should be spent on eliminating physical obstacles which make the lives of those who have a disability difficult (91%). The view that it is difficult for homosexuals to state their sexual orientation is shared by 68% of European Union citizens, as is the view that for a woman, family responsibilities are an obstacle to accessing management positions. 44% of the respondents feel that it is harder for people of a different ethnic origin than for the rest of the population to get into a night club against 34% who disagree. Finally, we find that over half of the European public feels that the wearing of visible religious symbols in the workplace is acceptable (54%) but a significant minority opposes this (40%).

Special EUROBAROMETER 263 “Discrimination in the European Union” Summary
- 6 -
Q4 - Attitudes towards disadvantaged groups in societyEU25 (%)
91
68
68
65
54
44
2
9
4
6
6
23
7
22
29
29
40
34
More money should be spent on eliminating physicalobstacles which make the lives of those who have a
disability difficult (Q4.6)
It is difficult for a homosexual to state his(her) sexualorientation in the workplace (Q4.4)
For a woman, family responsibilities are an obstacle toaccessing management positions (Q4.3)
People of different ethnic origin than the rest of thepopulation living in (OUR COUNTRY) enrich the
(NATIONALITY) culture (Q4.1)
The wearing of visible religious symbols in theworkplace is acceptable (Q4.5)
Getting into night clubs is harder for people of differentethnic origin than for the rest of the population (Q4.2)
Disagree Agree DK
Special EUROBAROMETER 263 “Discrimination in the European Union” Summary
- 7 -
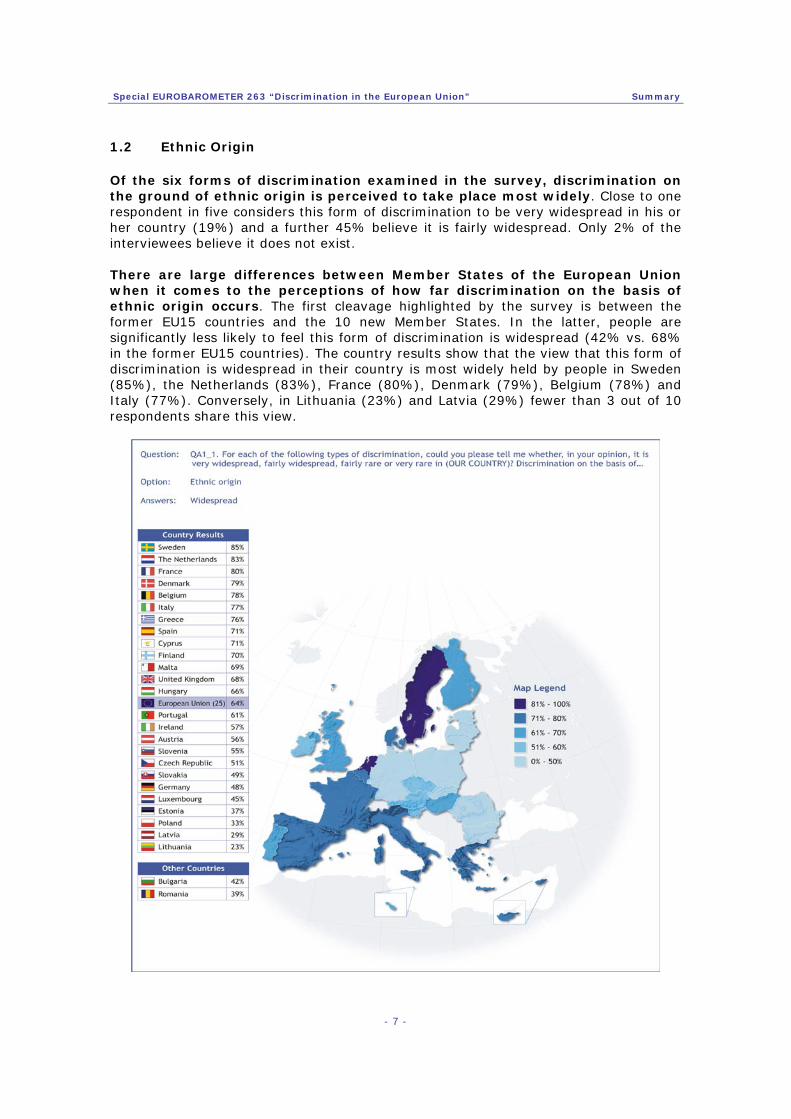
1.2 Ethnic Origin Of the six forms of discrimination examined in the survey, discrimination on the ground of ethnic origin is perceived to take place most widely. Close to one respondent in five considers this form of discrimination to be very widespread in his or her country (19%) and a further 45% believe it is fairly widespread. Only 2% of the interviewees believe it does not exist. There are large differences between Member States of the European Union when it comes to the perceptions of how far discrimination on the basis of ethnic origin occurs. The first cleavage highlighted by the survey is between the former EU15 countries and the 10 new Member States. In the latter, people are significantly less likely to feel this form of discrimination is widespread (42% vs. 68% in the former EU15 countries). The country results show that the view that this form of discrimination is widespread in their country is most widely held by people in Sweden (85%), the Netherlands (83%), France (80%), Denmark (79%), Belgium (78%) and Italy (77%). Conversely, in Lithuania (23%) and Latvia (29%) fewer than 3 out of 10 respondents share this view.

Special EUROBAROMETER 263 “Discrimination in the European Union” Summary
- 8 -
In the two acceding countries, the view that discrimination on the basis of ethnic origin is widespread is held by around 4 out of 10 respondents. Having looked at macro-level data, we next look at the relationship between people’s own situation and their attitudes. The survey shows that views vary somewhat depending on people’s age: 58% of people aged 55 and over feel that discrimination on the ground of ethnic origin is widespread, compared to 69% of the youngest respondents. Another factor that appears to influence people’s views is whether or not they have friends from other ethnic origins3. Those who do are much more likely to feel that discrimination is widespread than are those who don’t (71% vs. 56%). They are also more inclined to feel that discrimination on this basis has increased over the past five years (53% vs. 44%). In other words, proximity to the issue has an impact on perceptions. Furthermore, the survey shows that people who feel that other forms of discrimination are widespread are more likely to feel that discrimination on the basis of ethnic origin is widespread. This is particularly the case for discrimination on the basis of religion and beliefs. 85% of those who feel this type of discrimination is widespread believe that discrimination on the ground of ethnic origin is also widespread (compared to 49% of those who feel that discrimination on the basis of religion and beliefs is rare). In all but 4 Member States, a majority of citizens find that people of another ethnic origin enrich the national culture. However, the survey reveals very large differences between the Member States in the extent to which people can be said to embrace the concept of a multi-cultural society. In Sweden (86%) and Finland (81%) the view that people of different ethnic origin than the rest of the population enrich the culture of their respective countries is widely embraced. At the other extreme, less than 4 out of 10 respondents share this opinion in Malta (32%) and Cyprus (39%). People’s attitude towards a multi-cultural society is strongly related to their socio-demographic characteristics, with education acting as the most powerful predictor: the longer people benefited from education, the more they favour the concept of a multicultural society. Having friends or acquaintances from other ethnic origins also appears to influence people’s views. Those who do are more likely to agree that people of a different ethnic origin enrich their country’s culture than are those who don’t (73% vs. 56%).
3 On average 55% of the respondents replied having friends or acquaintances of a different origin than they are.

Special EUROBAROMETER 263 “Discrimination in the European Union” Summary
- 9 -
With regard to the Roma, who collectively form the largest ethnic minority in the enlarged EU, 77% of Europeans think that being a Roma is a disadvantage in society. These proportions vary quite significantly among the countries surveyed. Nine out of ten Swedish respondents hold the view that being a Roma is a disadvantage in their society4, compared to around 6 out of 10 respondents in the two acceding countries, namely Bulgaria and Romania.
4 QA6 Would you say that the fact of belonging to the following groups tends to be an advantage or a disadvantage, or neither, in (NATIONALITY) society at the current time? The fact of…

Special EUROBAROMETER 263 “Discrimination in the European Union” Summary
- 10 -
1.3 Disability Views about the existence of discrimination on the grounds of disability vary quite significantly among the countries surveyed. On average, there is little difference between the former EU15 countries and the 10 new Member States (53% and 52%, respectively). However, there are nonetheless considerable differences in opinion between the countries surveyed. Discrimination on the basis of disability is perceived to be most widespread in Italy (68%) and France (66%) and least so in Denmark (32%). In the two acceding countries, close to half of the interviewees feel that discrimination on the basis of disability is widespread.
Special EUROBAROMETER 263 “Discrimination in the European Union” Summary
- 11 -
The analysis of the socio-demographic characteristics of respondents shows that views about the existence of discrimination on the basis of disability vary somewhat depending on people’s gender and their age. Women are more likely than men to feel that this form of discrimination is widespread (56% versus 49%). Furthermore, the older people are, the less likely they are to feel it is widespread (48% among those aged 55+ compared to 57% among those aged 15-24). Finally, although people with disabled friends or acquaintances5 are slightly more likely to feel that discrimination on the basis of disability is widespread (55% versus 50%), it is interesting to find out that views do not differ so much. The same phenomenon can be observed regarding people suffering from chronic physical or mental problems6: their opinions on this issue are the same as those of people who do not suffer from such health problems (both 53%). In line with the widespread public acceptance of the plight of the disabled, the survey reveals a clear sense of consensus in all the Member States that more money should be spent on improving accessibility (91%). 1.4 Sexual orientation A very varied picture is found to exist across the European Union when it comes to the extent to which people perceive discrimination on the basis of sexual orientation. Although on average, the difference between the former EU15 countries and the 10 new Member States is small (51% and 48%, respectively) the differences between individual nations are quite large. The view that discrimination on the basis of sexual orientation is widespread in their country is most widely held by people in Italy (73%), Cyprus (72%), Greece (68%) and Portugal (67%) and least so in Estonia (26%) and Denmark (27%). It can be noted that in all three Baltic States, the proportion of ‘don’t know’ responses is quite high (22% in Estonia, 20% in Lithuania and 14% in Latvia). An examination of the results in the two acceding countries shows that discrimination on the basis of sexual orientation is more widely perceived in Romania (47%) than it is in Bulgaria (25%). The analysis of the socio-demographic characteristics of respondents shows that views about the existence of discrimination on the basis of sexual orientation vary most significantly depending on people’s age. Young people are far more likely than those aged 55 and over are to feel that this form of discrimination is widespread (59% vs. 45%).
5 On average, 55% of the respondents replied having disabled friends or acquaintances. 6 On average, 21% of the respondents replied suffering from a chronic physical or mental health problem.

Special EUROBAROMETER 263 “Discrimination in the European Union” Summary
- 12 -
Having homosexual friends7 is another factor that influences people’s views, although it is less important than age is. 56% of people with homosexual friends feel that discrimination is widespread compared to 48% of those who don’t have homosexual friends. We should however note that in the Southern European countries, and particularly so in Cyprus (86%), Greece (85%) and Portugal (83%), the wide majority of the population feels that homosexuality in their country is still a taboo8. Spanish results differ from this geographical pattern, with 46% of the population stating that they think that homosexuality is still a taboo (2 points below the EU average of 48%).
7 On average, 35% of the respondents replied having homosexual friends or acquaintances. 8 QA3.2 Please tell me whether you personally totally agree, tend to agree, tend to disagree or totally disagree with each of the following statement. Homosexuality is still a taboo in [OUR COUNTRY]

Special EUROBAROMETER 263 “Discrimination in the European Union” Summary
- 13 -
1.5 Age 46% of Europeans think that discrimination on the basis of age is widespread. At the country level, we find that this view is most widely held in Hungary (66%) and the Czech Republic (63%) and least so in Ireland (30%) and Luxembourg (31%). On average, people in the 10 new Member States are slightly more inclined to feel that age discrimination is widespread than are people in the former EU15 countries (49% vs. 45%).
An examination of the results in the two acceding countries shows that age discrimination is more widely perceived in Bulgaria than in Romania.

Special EUROBAROMETER 263 “Discrimination in the European Union” Summary
- 14 -
1.6 Religion or beliefs European public opinion is divided when it comes to discrimination on the basis of religion or belief. On average, 44% believe it is widespread against 47% who feel it is rare. Five percent of the interviewees believe it is non-existent.
Though less extensively perceived as being widespread, the country pattern for this form of discrimination somewhat matches that of discrimination on the basis of ethnic origin. Here as well, public opinion differs between the former EU15 nations and the 10 new Member States, where people are far less likely to feel this form of discrimination is widespread (24% vs. 49% in the former EU15 nations). Age is an important factor in determining differences in opinion, with 52% of people aged 15 to 24 perceiving discrimination on the basis of religion or beliefs to be widespread, compared to 39% of people aged 55 and over (the percentages for people aged 25 to 39 and those aged 40 to 54 are 48% and 43%, respectively).

Special EUROBAROMETER 263 “Discrimination in the European Union” Summary
- 15 -
Having friends or acquaintances with a different religion or belief also influences how people perceive the extent of discrimination on the basis of religion or beliefs9, although it is less important than age is. 47% of people with such friends feel that discrimination is widespread compared to 40% of those who don’t have friends with a different religion or belief. When it comes to the acceptance of wearing religious symbols in the workplace, results vary widely. Just 36% of French and 29 % of Lithuanian respondents agree that the wearing of religious symbols in the workplace is acceptable whereas in Malta, close to 8 out of 10 respondents are of the same view (79%).
9 On average, 44% of the respondents replied having friends or acquaintances with a different religion or belief

Special EUROBAROMETER 263 “Discrimination in the European Union” Summary
- 16 -
1.7 Gender Discrimination on the basis of gender is perceived by an average of 40 % of the EU population. However, this figure is considerably higher in some countries such as Italy (56%) and Spain (55%), where more than half of the interviewees feel it is widespread. At 21%, people in Germany and Latvia are least inclined to hold the view that discrimination on the basis of gender is widespread in their respective countries.
As one might expect, women are more inclined than men to say that discrimination on the basis of gender is widespread (43% vs. 36%). We can also observe that people who feel that gender discrimination is widespread are far more likely to hold the opinion that being a woman is a disadvantage (46% vs. 24% of those who think that gender discrimination is rare).

Special EUROBAROMETER 263 “Discrimination in the European Union” Summary
- 17 -
1.8 Representation and participation in society Our survey also measures people’s views about the equal representation of various groups in society, and shows that some groups are seen to be underrepresented10. As the graph below shows, a large segment of the European Union population is of the view that women, disabled people and older people are underrepresented in the workplace. 72% of Europeans say that more female MPs are needed and 44% are in favour of having more MP’s from different ethnic backgrounds (one must bear in mind that women compose half the population whereas people from a different ethnic origin represent statistically a much smaller proportion of the population).
Q8. Would you say that we need more…? EU25 (%)
77
74
72
72
44
5
8
6
5
8
18
19
22
22
48
Women in managementpositions in the workplace
Disabled people in theworkplace
People aged over 50 incompanies
Female MPs
MPs of a different ethnicorigin than the rest of the
population
No Yes DK
10 QA8 Would you say that we need more …?

Special EUROBAROMETER 263 “Discrimination in the European Union” Summary
- 18 -
2. Views about equal opportunities in employment 2.1 Criteria which put people at a disadvantage Asked which criteria may put people at a disadvantage when a company can choose between two candidates with equal skills and qualifications, at 51%, respondents most frequently chose the candidate’s look, dress-sense and presentation. However, in the EU, people are almost as likely to regard a disability or the candidate’s age as criteria which may put people at a disadvantage. These two factors were both chosen by 49% of the respondents. Ethnic origin was the fourth most frequently chosen criteria (45%). People’s religious beliefs (22%), gender (22%) and their sexual orientation (19%) are viewed by far fewer respondents as criteria which may put people at a disadvantage in this context.
Q5 - Criteria which may put people at a disadvantage when a company can choose between two candidates with equal skills
and qualifications EU25 (%)
1%2%3%
9%13%
17%19%
22%22%
34%39%
45%49%49%
51%
Others (SPONTANEOUS)
None of those (SPONTANEOUS)
DK
The candidate’s address
The candidate’s name
Whether the candidate is a smoker or not
The candidate's sexual orientation
The candidate’s gender
The expression of a religious belief
The candidate’s w ay of speaking, accent
The candidate’s general physical appearance
The candidate’s skin colour or ethnic origin
The candidate's age
A disability
The candidate’s look, dress-sense or presentation
Special EUROBAROMETER 263 “Discrimination in the European Union” Summary
- 19 -
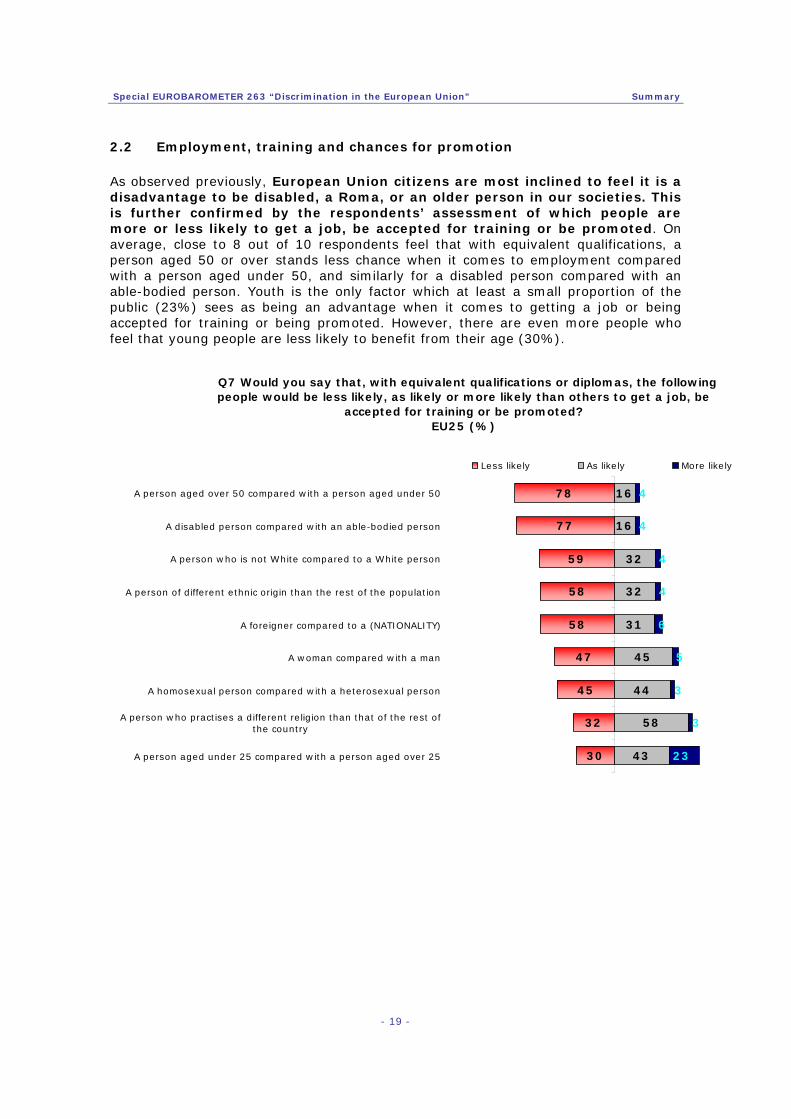
2.2 Employment, training and chances for promotion As observed previously, European Union citizens are most inclined to feel it is a disadvantage to be disabled, a Roma, or an older person in our societies. This is further confirmed by the respondents’ assessment of which people are more or less likely to get a job, be accepted for training or be promoted. On average, close to 8 out of 10 respondents feel that with equivalent qualifications, a person aged 50 or over stands less chance when it comes to employment compared with a person aged under 50, and similarly for a disabled person compared with an able-bodied person. Youth is the only factor which at least a small proportion of the public (23%) sees as being an advantage when it comes to getting a job or being accepted for training or being promoted. However, there are even more people who feel that young people are less likely to benefit from their age (30%).
Q7 Would you say that, with equivalent qualifications or diplomas, the following people would be less likely, as likely or more likely than others to get a job, be
accepted for training or be promoted? EU25 (%)
16
16
32
32
31
45
44
58
43
4
4
4
4
6
5
3
3
2330
32
45
47
58
58
59
77
78A person aged over 50 compared with a person aged under 50
A disabled person compared with an able-bodied person
A person who is not White compared to a White person
A person of different ethnic origin than the rest of the population
A foreigner compared to a (NATIONALITY)
A woman compared with a man
A homosexual person compared with a heterosexual person
A person who practises a different religion than that of the rest ofthe country
A person aged under 25 compared with a person aged over 25
Less likely As likely More likely

Special EUROBAROMETER 263 “Discrimination in the European Union” Summary
- 20 -
2.3 Support for measures to provide equal opportunities in employment There is broad support among European Union citizens to adopt measures that provide equal opportunities for everyone in the field of employment, ranging from 87% for specific measures for disabled people and older people to 66% when it comes to adopting specific measures depending on people’s sexual orientation.
Q9 Measures being adopted to provide equal opportunities for everyone in the field of employment
In favour of or opposed to measures depending on …? EU25 (%)
87
84
79
70
70
66
4
4
5
6
7
9
10
12
16
23
23
25
…disability
…age
…gender
…ethnic origin
…religious beliefs orconvictions
…sexual orientation
Opposed In favour DK
Analysis of the results of the former EU15 countries and the ten new Member States reveals slight differences in opinion, particularly when it comes to adopting measures on the basis of sexual orientation, religious beliefs, gender and ethnic origin. People’s age also somewhat affects their likelihood to support measures when it comes to sexual orientation, ethnic origin, religious beliefs or convictions and gender. The youngest respondents are more inclined to favour these measures. The breakdown by education reveals fewer differences.

Special EUROBAROMETER 263 “Discrimination in the European Union” Summary
- 21 -
3. Combating discrimination 3.1 Assessment of efforts made to fight discrimination On average, 51% of respondents think that not enough effort is being made in their country to fight discrimination, while 45% take the opposite view. People’s assessment of the efforts made to combat discrimination varies significantly between the Member States. Looking at the countries individually shows that, at 67%, Cyprus has the highest percentage of people feeling that enough effort is made to fight all forms of discrimination, followed by Finland (64%) and Austria (61%). Conversely, in Sweden and Poland close to 7 out of 10 respondents disagree (69% and 68%, respectively).
An analysis of the respondents’ socio-demographic characteristics reveals differences depending on age and education. Young people and people who

Special EUROBAROMETER 263 “Discrimination in the European Union” Summary
- 22 -
stayed in full-time education until the age of 20 or older are most critical in their assessment of the efforts made to combat discrimination in their country. People’s assessment about the efforts made to fight discrimination also depends very much on how widespread they perceive the various forms of discrimination to be. 3.2 Actors having a role to play in combating discrimination On average, schools and universities are most seen as having to play an important role in combating discrimination. 42% of respondents chose educational institutions when presented with a list of actors in the fight against discrimination. Parents were selected by four out of ten respondents, indicating that young people are thought of as the principal target group in the fight against discrimination. The results furthermore show that around a third of European Union citizens find that the media (34%) and their national government (31%) have an important role to play.
QA11 In your opinion, which of the following have an important role to play in combating discrimination?
EU25 (%)
6%
7%
8%
8%
10%
10%
11%
12%
13%
20%
31%
34%
40%
42%
Other/None/DK
NGO’s, associations
Trade unions
International institutions
Local or regional authorities
The European Union
Religious authorities
(NATIONALITY) Parliament
Political parties
Employers\ Companies
The (NATIONALITY) Government
The media
Parents
Schools and universities

Special EUROBAROMETER 263 “Discrimination in the European Union” Summary
- 23 -
3.3 The willingness to provide sensitive personal information in certain conditions Europeans citizens agree to provide personal information in order to combat discrimination11. Providing such information as part of a census, on an anonymous basis, is one way of ensuring that information about people potentially at risk of discrimination is available to assist efforts to better understand and prevent discrimination. On average, there is a broad degree of willingness among the European public to provide personal information as part of a census on an anonymous basis to combat discrimination, and relatively little resistance. Three out of four European Union citizens would be willing to provide personal information about their ethnic origin (75%) and their religion or beliefs (74%). Willingness to provide information about one’s sexual orientation (65%) and health situation (71%) is only somewhat less widespread.
Q15 Willingness to provide personal information as part of a census to help combat discrimination
In favour of or opposed to providing information about one's … EU25 (%)
75
74
71
65
6
5
5
6
19
21
25
28
…ethnic origin
…religion or beliefs
…health situation
…sexual orientation
Opposed In favour DK
On this question, differences in opinion between the former EU15 nations, the ten new Member States and the two acceding countries are minor.
11 QA15 Would you be in favour or opposed to providing, on an anonymous basis, information about (INSERT ITEM) as part of a census, if that could help to combat discrimination in (OUR COUNTRY)?

Special EUROBAROMETER 263 “Discrimination in the European Union” Summary
- 24 -
4. Raising awareness 4.1 Awareness of the laws prohibiting discrimination On average, awareness of the existence of anti-discrimination laws is quite low in the European Union. Disability is the only type of discrimination which more than half of the European public knows is prohibited by law when hiring new employees (51%). Four out of ten citizens or fewer know that discrimination on the basis of the other five strands is also prohibited by law. The public is least aware of legislation prohibiting discrimination on the basis of sexual orientation (30%) and age (31%).
Q12 Does country have a law prohibiting discrimination when hiring new employees on the basis of…
EU25 (%)
51
40
36
35
31
30
19
20
25
23
22
2545
47
42
39
39
30…disability
…gender
…ethnic origin
…religion or beliefs
…age
…sexual orientation
No Yes DK
Awareness levels vary greatly between the former EU15 nations and the ten new Member States. The lower awareness levels in the new countries are not surprising as they only had to incorporate the rules in their national laws upon joining the European Union.

Special EUROBAROMETER 263 “Discrimination in the European Union” Summary
- 25 -
4.2 Knowledge of one’s right as a victim of discrimination On average only one third of European Union citizens claim to know their rights should they be the victim of discrimination or harassment (32%). However, the national results show very large variations. Finland stands out, with 65% of respondents indicating that they know their rights. Cyprus is the only other country where over half of the respondents answered the question affirmatively. At the other extreme, the survey shows that less than a quarter of people in Austria (17%), Estonia (19%) and Spain (23%) feel they know their rights. With scores of 26% in Romania and 21% in Bulgaria, awareness levels in the two acceding countries are also below the European Union average.

Special EUROBAROMETER 263 “Discrimination in the European Union” Summary
- 26 -
CONCLUSION A large proportion of Europeans are of the opinion that discrimination is widespread in their country. Discrimination based on ethnic origin is felt to be the most widespread (almost 2 Europeans out of 3, 64%; however, results vary widely between countries). Around one in two Europeans considers discrimination based on disability and sexual orientation to be widespread. Discrimination on the basis of age (46%), religion or beliefs (44%) and gender (40%) are also felt to occur, albeit at to slightly lesser extent. A broad majority of European citizens believe that being disabled (79%), being a Roma (77%), being over 50 (69%) or having a different ethnic origin (62%) is a disadvantage in their society. At the same time, in all but four Member States, a majority of citizens find that people of a different ethnic origin than the rest of the population enrich the national culture. A large majority of the European Union population is of the view that more women are needed in management positions (77%) and as MPs (72 %). A large majority also think that disabled people (74%) and people over 50 (72%) are underrepresented in the workplace, and they would agree to see this situation improve. When it comes to getting a job, disability and age are the two factors which European Union citizens believe put people most at a disadvantage. Close to 8 out of 10 respondents feel that with equivalent qualifications, a person aged 50 or over stands less chance when it comes to employment or promotion compared with a person aged under 50, and similarly a disabled person compared with an able-bodied person. Whilst still cited by a majority, skin colour (59%) and ethnic origin (58%) are stated to a lesser extent as causes of disadvantage. There is very broad support among European Union citizens for adopting measures that provide equal opportunities for everyone in the field of employment, ranging from 87% of Europeans in favour of specific measures for disabled people and older people to 66% when it comes to adopting specific measures depending on people’s sexual orientation.- On average, 51 % of Europeans think that not enough effort is made in their country to fight discrimination. Public opinion about efforts made to combat discrimination varies significantly between the Member States. Educational institutions and parents are most often seen as having to play an important role in combating discrimination, indicating that Europeans consider young people to be a principal target group in the fight against discrimination. Around a third of European Union citizens find that the media and their national government have an important role to play. A large majority of European Union citizens are willing to provide personal information relating to ethnic origin (75%), religion or beliefs (74%), health situation (71%) and sexual orientation (65%) on an anonymous basis as part of a census in order to combat discrimination. Finally, the survey highlights that awareness of the existence of anti-discrimination laws remains quite low in the European Union. Disability is the only type of discrimination which more than half of the European public knows is prohibited by law when hiring employees. The public is least aware of legislation prohibiting discrimination on the basis of age (31%) and sexual orientation (30%). Only one third of European Union citizens (32%) know their rights should they become a victim of discrimination or harassment.


ANNEXES


TECHNICAL SPECIFICATIONS


SPECIAL EUROBAROMETER N°263 “Discrimination in the European Union”
TECHNICAL SPECIFICATIONS Between the 7th of June and the 12th of July 2006, TNS Opinion & Social, a consortium created between Taylor Nelson Sofres and EOS Gallup Europe, carried out wave 65.4 of the EUROBAROMETER, on request of the EUROPEAN COMMISSION, Directorate-General Communication, “Public Opinion and Media Monitoring”. The SPECIAL EUROBAROMETER N°263 is part of wave 65.4 and covers the population of the respective nationalities of the European Union Member States, resident in each of the Member States and aged 15 years and over. The SPECIAL EUROBAROMETER N°263 has also been conducted in the two acceding countries (Bulgaria and Romania). In these countries, the survey covers the national population of citizens of the respective nationalities and the population of citizens of all the European Union Member States that are residents in those countries and have a sufficient command of one of the respective national language(s) to answer the questionnaire. The basic sample design applied in all states is a multi-stage, random (probability) one. In each country, a number of sampling points was drawn with probability proportional to population size (for a total coverage of the country) and to population density. In order to do so, the sampling points were drawn systematically from each of the "administrative regional units", after stratification by individual unit and type of area. They thus represent the whole territory of the countries surveyed according to the EUROSTAT NUTS II (or equivalent) and according to the distribution of the resident population of the respective nationalities in terms of metropolitan, urban and rural areas. In each of the selected sampling points, a starting address was drawn, at random. Further addresses (every Nth address) were selected by standard "random route" procedures, from the initial address. In each household, the respondent was drawn, at random (following the "closest birthday rule"). All interviews were conducted face-to-face in people's homes and in the appropriate national language. As far as the data capture is concerned, CAPI (Computer Assisted Personal Interview) was used in those countries where this technique was available.

For each country a comparison between the sample and the universe was carried out. The Universe description was derived from Eurostat population data or from national statistics offices. For all countries surveyed, a national weighting procedure, using marginal and intercellular weighting, was carried out based on this Universe description. In all countries, gender, age, region and size of locality were introduced in the iteration procedure. For international weighting (i.e. EU averages), TNS Opinion & Social applies the official population figures as provided by EUROSTAT or national statistic offices. The total population figures for input in this post-weighting procedure are listed above. Readers are reminded that survey results are estimations, the accuracy of which, everything being equal, rests upon the sample size and upon the observed percentage. With samples of about 1,000 interviews, the real percentages vary within the following confidence limits:
ABBREVIATIONS COUNTRIES INSTITUTES N° INTERVIEWS
FIELDWORK DATES
POPULATION 15+
BE Belgium TNS Dimarso 1.032 14/06/2006 05/07/2006 8.598.982 CZ Czech Rep. TNS Aisa 1.011 13/06/2006 02/07/2006 8.571.710 DK Denmark TNS Gallup DK 1.045 12/06/2006 10/07/2006 4.380.063 DE Germany TNS Infratest 1.570 13/06/2006 08/07/2006 64.174.295 EE Estonia Emor 1.004 09/06/2006 03/07/2006 887.094 EL Greece TNS ICAP 1.000 12/06/2006 08/07/2006 8.674.230 ES Spain TNS Demoscopia 1.012 11/06/2006 08/07/2006 35.882.820 FR France TNS Sofres 1.009 13/06/2006 10/07/2006 44.010.619 IE Ireland TNS MRBI 1.000 07/06/2006 05/07/2006 3.089.775 IT Italy TNS Abacus 1.019 09/06/2006 10/07/2006 49.208.000 CY Rep. of Cyprus Synovate 504 07/06/2006 04/07/2006 552.213 LV Latvia TNS Latvia 1.019 13/06/2006 12/07/2006 1.394.351
LT Lithuania TNS Gallup Lithuania
1.004 13/06/2006 04/07/2006 2.803.661
LU Luxembourg TNS ILReS 506 07/06/2006 04/07/2006 367.199 HU Hungary TNS Hungary 1.015 10/06/2006 30/06/2006 8.503.379 MT Malta MISCO 500 09/06/2006 06/07/2006 322.917 NL Netherlands TNS NIPO 1.019 10/06/2006 04/07/2006 13.242.328
AT Austria Österreichisches Gallup-Institut
1.000 08/06/2006 02/07/2006 6.679.444
PL Poland TNS OBOP 1.000 10/06/2006 04/07/2006 31.610.437 PT Portugal TNS EUROTESTE 1.011 09/06/2006 07/07/2006 8.080.915 SI Slovenia RM PLUS 1.027 10/06/2006 10/07/2006 1.663.869 SK Slovakia TNS AISA SK 1.143 13/06/2006 29/06/2006 4.316.438 FI Finland TNS Gallup Oy 1.031 07/06/2006 06/07/2006 4.279.286 SE Sweden TNS GALLUP 1.002 13/06/2006 10/07/2006 7.376.680
UK United Kingdom
TNS UK 1.313 08/06/2006 08/07/2006 47.685.578
BG Bulgaria TNS BBSS 1.025 07/06/2006 20/06/2006 6.695.512 RO Romania TNS CSOP 1.001 13/06/2006 30/06/2006 18.145.036
TOTAL 26.822 07/06/2006 12/07/2006 391.196.831
Observed percentages 10% or 90% 20% or 80% 30% or 70% 40% or 60% 50%
Confidence limits ± 1.9 points ± 2.5 points ± 2.7 points ± 3.0 points ± 3.1 points