discrimination in america: experiences … in america: experiences and ... summary: personal...
TRANSCRIPT

0
DISCRIMINATION IN AMERICA: EXPERIENCES AND VIEWS OF LATINOS
October 2017
1
EXECUTIVE SUMMARY
Survey Background This report is part of a series titled “Discrimination in America.” The series is based on a survey conducted for National Public Radio, the Robert Wood Johnson Foundation, and Harvard T.H. Chan School of Public Health. The survey was conducted January 26 – April 9, 2017, among a nationally representative, probability-based telephone (cell and landline) sample of 3,453 adults age 18 or older. The survey included nationally representative samples of African Americans, Latinos, Asian Americans, Native Americans, whites, men, women, and LGBTQ adults. This report presents the results specifically for a nationally representative probability sample of 803 Latino adults. Other reports analyze each other group, and the final report will discuss major highlights from the series. Discrimination is a prominent and critically important matter in American life and throughout American history. While many surveys have explored Americans’ beliefs about discrimination, this survey asks people about their own personal experiences with discrimination.
Summary: Personal Experiences of Discrimination Overall, Latinos report substantial and significant personal experiences of discrimination. In the context of institutional forms of discrimination, nearly a third of Latinos say they have been personally discriminated against because they are Latino when applying for jobs (33%), when being paid equally or considered for promotions (32%), and when trying to rent a room or apartment or buy a house (31%). Additionally, at least one in five Latinos say they or a family member have been treated unfairly by the courts (20%) or unfairly stopped or treated by the police (27%) because they are Latino. Non-immigrant Latinos are nearly twice as likely as immigrant Latinos to report that they or a family member have been stopped or unfairly treated by the police because they are Latino. In the context of individual or interpersonal forms of discrimination, a third or more of Latinos say they have personally experienced racial or ethnic slurs (37%) and people making insensitive or offensive comments or negative assumptions about their race or ethnicity (33%). Non-immigrant Latinos and Latinos with a college degree are both more likely to report various forms of individual discrimination. Latinos also report efforts to avoid discrimination: nearly one in five Latinos report that they have avoided medical care (17%) or calling the police (17%), even when in need, due to concern that they or a family member would be discriminated against because they are Latino.
Summary: Perceptions of Local Community Consistent with personal experiences of discrimination, the top situations where Latinos most frequently say discrimination “often” happens to other Latinos in their local community are in the workplace, when seeking housing, and additionally when interacting with police. Latinos
2
living in low-income areas are more likely than Latinos in middle-income areas to perceive discrimination in their neighborhood. In a separate question, nearly half (47%) of Latinos say that, where they live, other Latinos have fewer employment opportunities simply because they are Latino. Latinos were also asked whether elements of their neighborhood are better, worse, or about the same as other places to live. Latinos most frequently rate the amount of crime and the availability of parks, green spaces, and recreational areas as “better.” The availability of public transportation and local employment opportunities are most frequently rated as “worse.” Non-immigrant Latinos are more likely than immigrant Latinos to negatively evaluate their area.
Summary: National Beliefs & Political Contact Overall, 78% of Latinos believe that there is discrimination against Latinos in America today. Among those who believe such discrimination exists, nearly half (47%) say that discrimination based on the prejudice of individual people is the bigger problem, compared to 37% of Latinos who say discrimination based in laws and government policies is the bigger problem. Another 14% say both are equally problematic. Finally, 42% of Latinos say that in the past year, they have been personally contacted by representatives of a political party, candidate, organization, or ballot issue encouraging them to vote or support their cause in an election. Being personally contacted in this way may lead to increased likelihood of voting or other forms of civic or political participation. Low income Latinos are much less likely to have been contacted than their higher-earning peers.
---
Overall, these findings illustrate that Latinos perceive significant discrimination across a wide range of areas of life. They also highlight that younger Latinos, non-immigrant Latinos, and Latinos with college degrees are significantly more likely to report personal experiences of many forms of discrimination.

3
1
1 See for example, Fred Pincus (1996), “Discrimination Comes in Many Forms,” American Behavioral Scientist 40(2):186-194, for distinctions between structural, institutional, and individual forms of discrimination.
Notes on Report Language Participants were not asked about their citizenship status. They were asked only whether they were born in the U.S., Puerto Rico, or in another country. This report refers to those born in the U.S. and Puerto Rico as non-immigrant Latinos, and to those born in another country as immigrant Latinos. This report distinguishes between institutional and individual forms of discrimination, though discrimination comes in many forms.1 In this report, the term “institutional discrimination” refers to forms of discrimination based on laws, policies, institutions, and the related behavior of individuals who work in or control those laws, policies, or institutions. The term “individual discrimination” refers to forms of discrimination based in individual people’s prejudicial beliefs, words, and behavior. These are not necessarily mutually exclusive; the distinction is used for organizing purposes. In this survey, people were asked whether they had ever personally experienced discrimination related to racism, sexism, and – for LGBTQ people – homophobia and transphobia. Questions about these experiences were asked in the same way, differing only in the perceived motivation for the discrimination (i.e., racism, sexism, homophobia). For example, respondents were asked, “Do you believe you have ever personally experienced discrimination when applying for jobs because you are Latino?” and “Do you believe you have ever personally experienced discrimination when applying for jobs because you are a woman?” Therefore, to mirror the question wording used in the survey, this report uses phrases such as “because of their race or ethnicity,” or “because they are Latino.” These phrases describe respondents’ impressions of the motivating prejudice behind their experiences, and they do not imply blaming respondents for others’ discriminatory actions. Additionally, these questions did not ask about the identity of the perceived discriminator. Respondents’ answers could therefore refer to experiences of discrimination committed by individuals of any race or ethnicity (or any other identity category). As with other forms of self-reported data, these findings rely on respondents’ perceptions. While these experiences could be related to other factors, the fact that respondents believe they are due to racial or ethnic discrimination is significant. Any references to gender are based on respondents’ self-identified gender.

4
INTRODUCTION This report is part of a series titled “Discrimination in America.” The series is based on a survey conducted for National Public Radio, the Robert Wood Johnson Foundation, and Harvard T.H. Chan School of Public Health. Discrimination is a prominent and critically important matter in American life and throughout American history. While many surveys have explored Americans’ beliefs about discrimination, this survey asks people about their own personal experiences with discrimination. This report presents Latinos’ personal experiences of racism, ethnocentrism, and discrimination, as well as their perceptions of discrimination in their local area and in the nation.
Table of Contents
I. Personal Experiences of Discrimination ......................................................5 i. Personal Experiences of Institutional Discrimination................5
ii. Personal Experiences of Individual Discrimination ................10 iii. Avoidance of Discrimination ...................................................13 iv. Differences by Education .........................................................15
II. Perceptions of Local Community ..............................................................16 i. Perceptions of Local Discrimination .......................................16
ii. Perceptions of Local Opportunity ............................................18 iii. Perceptions of Local Police & Government ............................19 iv. Perceptions & Evaluations of Community Environment.........20
III. National Beliefs & Political Contact..........................................................24 i. Institutional vs. Individual Discrimination ..............................24
ii. Political Contact .......................................................................25 IV. Conclusion .................................................................................................26 V. Methodology ..............................................................................................27
Respondents of any race, with the exception of those who identified as American Indian/Alaska Native (AIAN), are included in this sample if they identified as Hispanic or Latino in the initial screening questions. Any references to gender are based on respondents’ self-identified gender. All reported differences are statistically significant. This survey was conducted in both English and Spanish, January 26 – April 9, 2017, among a nationally representative, probability-based telephone (cell and landline) sample that included 803 Latino U.S. adults. Thirty-one percent (31%) of the Latino surveys were conducted in Spanish. The margin of error at the 95% confidence interval for the Latino sample in this report is r 4.5%. Further methodological information is included at the end of the report.

5
I. Personal Experiences of Discrimination
In this survey, Latinos were asked about their personal experiences with racism, sexism, and discrimination, across a range of areas of life. Overall, Latinos report substantial and significant experiences of both institutional and individual forms of discrimination. Non-immigrant Latinos and Latinos with college degrees are more likely than their respective counterparts to report individual forms of discrimination.
Personal Experiences of Institutional Discrimination People were asked whether they believe they have ever personally experienced discrimination because they are Latino, across a variety of situations. In the context of institutional discrimination, these areas were: when applying to jobs; when it comes to being paid equally or considered for promotions; when interacting with police; when trying to vote or participate in politics; when going to a doctor or health clinic; when applying to college or while at college; or when trying to rent a room or apartment or buy a house. People were only asked about situations in which they had personally participated. For example, people were only asked if they had been discriminated against when applying to college if they had ever applied to college. Among all Latinos, 85% have ever applied for a job; 89% have ever been employed for pay; 49% have ever applied to or attended college for any amount of time; and 56% have ever tried to rent a room or apartment or to apply for a mortgage or buy a home. For the remaining situations, screening questions were not used, but people could volunteer that they had never had these experiences.2 Immigrant Latinos are less likely than non-immigrant Latinos to have participated in some of these situations: 29% of immigrant Latinos have ever applied to or attended college, compared to 69% of non-immigrant Latinos. Additionally, 47% of immigrant Latinos have ever tried to rent a room or apartment or buy a house, compared to 64% of non-immigrant Latinos.
Roughly a third of Latinos report personally experiencing anti-Latino discrimination in the workplace or when seeking housing
Figure 1 shows the overall reporting of perceived experiences of discrimination in each situation. More than three in ten Latinos report having personally experienced discrimination because they are Latino when it comes to applying for jobs (33%), being paid equally or considered for promotion (32%), or when trying to rent a room or apartment or buy a house (31%) (Figure 1).
2 Screening questions were not used for interacting with police given the potential sensitivity of the question; for going to the doctor, given that 83% of adults have seen a doctor in the last year alone (Centers for Disease Control and Prevention (2015), “Summary Health Statistics Tables for U.S. Adults: National Health Interview Survey, Table A-18,” https://goo.gl/AVfJPq) and this question covers a lifetime span; or for trying to vote or participate in politics, as the question was worded intentionally broadly to capture a wide range of what might constitute political participation to the respondent.

6
NPR/Robert Wood Johnson Foundation/Harvard T.H. Chan School of Public Health, Discrimination in America: Experiences and Views of Latinos, January 26 – April 9, 2017. S5/Q13, S6/Q15, Q17, Q19, Q21, S7/Q23, S8/Q25. Each question asked of half-sample and of those who have participated in each situation (e.g., among those who have ever applied for a job). Total N=803 Latino U.S. adults.
Roughly a quarter (27%) of all Latinos say they have been personally discriminated against because they are Latino when interacting with police (Figure 1). One in five (20%) Latinos report being personally discriminated against because they are Latino when going to a doctor or health clinic (Figure 1). Similarly, 19% of Latinos who have ever applied to or attended college for any amount of time say that they personally experienced discrimination while applying to or while at college because they are Latino (Figure 1). Fifteen percent (15%) of Latinos say they have been personally discriminated against because they are Latino when trying to vote or participate in politics (Figure 1). Younger Latinos are more likely to say they have been discriminated against when trying to vote or participate in politics: 19% of Latinos ages 18-29 and 18% of those 30-49 report such experiences, compared to only 3% of Latinos ages 65 and older.
15
19
20
27
31
32
33
Trying to vote or participate in politics
Applying to or attending college
Going to doctor or health clinic
Interacting with police
Trying to rent or buy housing
Being paid or promoted equally
Applying for jobs
Figure 1:Percent of Latinos Saying They Have Ever Been Personally
Discriminated Against In Each Situation Because They Are Latino

7
Demographic differences in reported experiences of discrimination in equal pay and promotion are presented in Table 1.
Lower income Latinos more than twice
as likely to report discrimination in housing and equal pay or promotion
Importantly, there are significant differences between low-income and high-income Latinos in personal experiences of discrimination. As Figure 2 shows, lower earning Latinos (those earning less than $25,000 or less per year) are more than twice as likely as their higher earning peers (those earning $75,000 or more per year) to report personal experiences of discrimination when it comes to being paid equally or
considered for promotions, and when seeking housing. In the context of equal pay or promotion, 35% of Latinos earning less than $25,000 per year say they have been discriminated against because they are Latino, compared to 17% of Latinos earning $75,000 or more per year (Figure 2).
NPR/Robert Wood Johnson Foundation/Harvard T.H. Chan School of Public Health, Discrimination in America: Experiences and Views of Latinos, January 26 – April 9, 2017. S6/Q15, S8/Q25. Each question asked of half-sample. Total N=803 Latino U.S. adults.
32 3135
43
17 16
Being paid or promoted equally Trying to rent or buy housing
Figure 2:Percent of Latinos, By Income Level, Saying They Have Ever Been
Personally Discriminated Against In Each Situation Because They Are Latino
All Latinos Latinos earning <$25,000 Latinos earning $75,000+
Table 1: Percent of Latinos Saying They Have Been Personally Discriminated Against in Equal
Pay and Promotion Because They Are Latino
All Latinos 32%
Immigrant Latinos 43% Non-immigrant Latinos 20%
Latinos who live in…
Majority Latino area 40% Non-majority Latino area 26%
Latinos who are…
Employed full time 37% Employed part time 15%
NPR/Robert Wood Johnson Foundation/ Harvard T.H.
Chan School of Public Health, Discrimination in America: Experiences and Views of Latinos, Jan 26 – Apr 9, 2017. S6/Q15. Total N=803 Latino U.S. adults.

8
Among Latinos who have ever tried to rent a room or apartment or buy a house, lower income Latinos are again more than twice as likely (43%) as higher income Latinos (16%) to say they have been discriminated against in the process (Figure 2).
Latino men and women report different experiences of discrimination in police interactions and when seeking medical care
As Figure 3 shows, Latino men and women report differing experiences of discrimination in the context of police and medical care. One third of Latino men (33%) say they have been personally discriminated against because they are Latino when interacting with police, compared to 21% of Latina women (Figure 3).
NPR/Robert Wood Johnson Foundation/Harvard T.H. Chan School of Public Health, Discrimination in America: Experiences and Views of Latinos, January 26 – April 9, 2017. Q17, Q21. Each question asked of half-sample. Total N=803 Latino U.S. adults.
In contrast, 25% of Latina women report being discriminated against because they are Latino when going to a doctor or health clinic, compared to 14% of Latino men (Figure 3).
At least one in five Latinos report unfair police or court treatment; Younger and more educated Latinos more likely to report unfair police treatment
In a separate question, people were asked whether they believe they or a family member had experienced unfair treatment by the police or by the court system because they are Latino.3 This 3 These questions asked whether “you or a family member” had experienced these forms of violence or discrimination. Respondents may be less willing to answer sensitive questions about their personal experiences, so family members’ experiences are included in the question to provide respondents an opportunity to indirectly disclose their own experiences, while also potentially capturing experiences of violence and discrimination in respondents’ immediate family. See Roger Tourangeau and Ting Yan (2007), “Sensitive Questions in Surveys,” Psychological Bulletin 133(5): 859-883, DOI: 10.1037/0033-2909.133.5.859.
27
20
33
14
2125
Interacting with police Going to doctor or health clinic
Figure 3:Percent of Latinos, By Gender, Saying They Have Ever Been Personally
Discriminated Against In Each Situation Because They Are Latino
All Latinos Latino men Latina women

9
question referred to unfair treatment rather than discrimination to capture potential differences in perception of individuals’ experiences (i.e., people who might perceive an experience as unfair but would not call it discriminatory). Overall, 27% of Latinos say that they or a family member has been unfairly stopped or treated by the police because they are Latino, while 20% say they or a family member have been treated unfairly by the courts because they are Latino. Non-immigrant Latinos are nearly twice as likely (36%) as immigrant Latinos (19%) to say they or a family member have been unfairly stopped or treated by the police because they are Latino. Figure 4 shows that younger Latinos and Latinos with a college degree are more likely to report unfair police treatment. For example, 37% of Latinos ages 18-29 say they have been unfairly stopped or treated by police, compared to 9% of Latinos ages 65 and over. Similarly, 42% of Latinos with a college degree say they have been unfairly stopped or treated by the police, compared to 25% of Latinos with a high school degree or less.
NPR/Robert Wood Johnson Foundation/Harvard T.H. Chan School of Public Health, Discrimination in America: Experiences and Views of Latinos, January 26 – April 9, 2017. Q91. Question asked of half-sample. Total N=803 Latino U.S. adults.
There are no significant demographic differences regarding unfair treatment by the courts.
27
37
29
19
9
25
42
All Latinos Latinos18-29
Latinos30-49
Latinos50-64
Latinos65+
Latinoswith high
schooldegree or
less
Latinoswith college
degree ormore
Figure 4:Percent of Latinos, By Age Group and Education Level, Saying They
or a Family Member Have Been Unfairly Stopped or Treated By Police Because They Are Latino

10
Personal Experiences of Individual Discrimination People were asked experiences of individual or interpersonal forms of discrimination, such as slurs, insensitive or offensive comments or negative assumptions, sexual harassment, threats or non-sexual harassment, and violence. At least a third of Latinos have experienced slurs and offensive comments about their ethnicity;
Non-immigrant Latinos more likely to report these experiences Recall that in this report, phrases such as “because of their race or ethnicity” or “because they are Latino” are used to mirror the question wording and to describe individuals’ impressions of the prejudice behind these experiences, and are not intended to place blame on those who have been discriminated against. Figure 5 shows that 37% of all Latinos report that someone has used slurs or other negative words about them or a group they belong to specifically because of their race or ethnicity. Similarly, 33% of Latinos say that someone has made insensitive or offensive comments or negative assumptions about their race or ethnicity. Fifteen percent (15%) say someone has acted afraid of them because of their race or ethnicity.4
NPR/Robert Wood Johnson Foundation/Harvard T.H. Chan School of Public Health, Discrimination in America: Experiences and Views of Latinos, January 26 – April 9, 2017. Q63a/Q64a, Q63b/Q64b, Q63c/Q64c. Each question asked of half-sample. Total N=803 Latino U.S. adults.
4 Multiple responses were allowed; respondents could answer that these occurrences were based on their race or ethnicity, their gender, their sexual orientation or gender identity, and/or some other reason. The category of “Some other reason” includes volunteered responses such as religion, personal appearance (e.g., weight), political affiliation, disability, and not knowing the basis of the slur, negative comment, or expression of fear.
3733
15
4944
2425 23
5
Slurs Insensitive or offensive commentsor negative assumptions
People acting afraid of them
Figure 5:Percent of Latinos, By Immigrant Status, Saying They Have
Personally Experienced Various Forms of Individual Discrimination Because of Their Race or Ethnicity
All Latinos Non-immigrant Latinos Immigrant Latinos
11
Figure 5 also shows that non-immigrant Latinos are more likely to report all three experiences compared to immigrant Latinos. For example, nearly half (49%) of non-immigrant Latinos report experiencing anti-Latino slurs, compared to 25% of immigrant Latinos. Additionally, younger Latinos are nearly three times more likely than older Latinos to report having personally experienced slurs and insensitive or offensive comments about their race or ethnicity. Roughly four in ten Latinos ages 18-29 report slurs (41%) and insensitive comments (39%) because of their race or ethnicity. Among Latinos ages 65 and older, 15% report experiencing slurs and 11% report negative assumptions or comments because of their race or ethnicity.
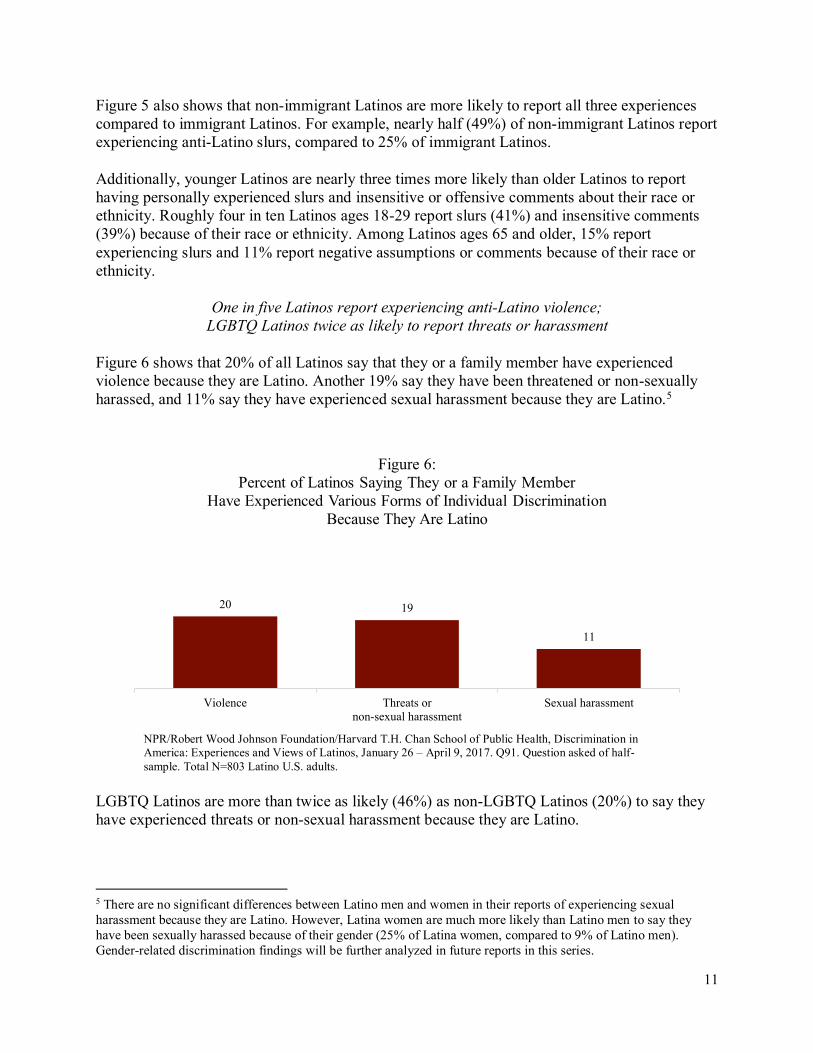
One in five Latinos report experiencing anti-Latino violence; LGBTQ Latinos twice as likely to report threats or harassment
Figure 6 shows that 20% of all Latinos say that they or a family member have experienced violence because they are Latino. Another 19% say they have been threatened or non-sexually harassed, and 11% say they have experienced sexual harassment because they are Latino.5
NPR/Robert Wood Johnson Foundation/Harvard T.H. Chan School of Public Health, Discrimination in America: Experiences and Views of Latinos, January 26 – April 9, 2017. Q91. Question asked of half-sample. Total N=803 Latino U.S. adults.
LGBTQ Latinos are more than twice as likely (46%) as non-LGBTQ Latinos (20%) to say they have experienced threats or non-sexual harassment because they are Latino.
5 There are no significant differences between Latino men and women in their reports of experiencing sexual harassment because they are Latino. However, Latina women are much more likely than Latino men to say they have been sexually harassed because of their gender (25% of Latina women, compared to 9% of Latino men). Gender-related discrimination findings will be further analyzed in future reports in this series.
20 19
11
Violence Threats ornon-sexual harassment
Sexual harassment
Figure 6:Percent of Latinos Saying They or a Family Member
Have Experienced Various Forms of Individual Discrimination Because They Are Latino
12
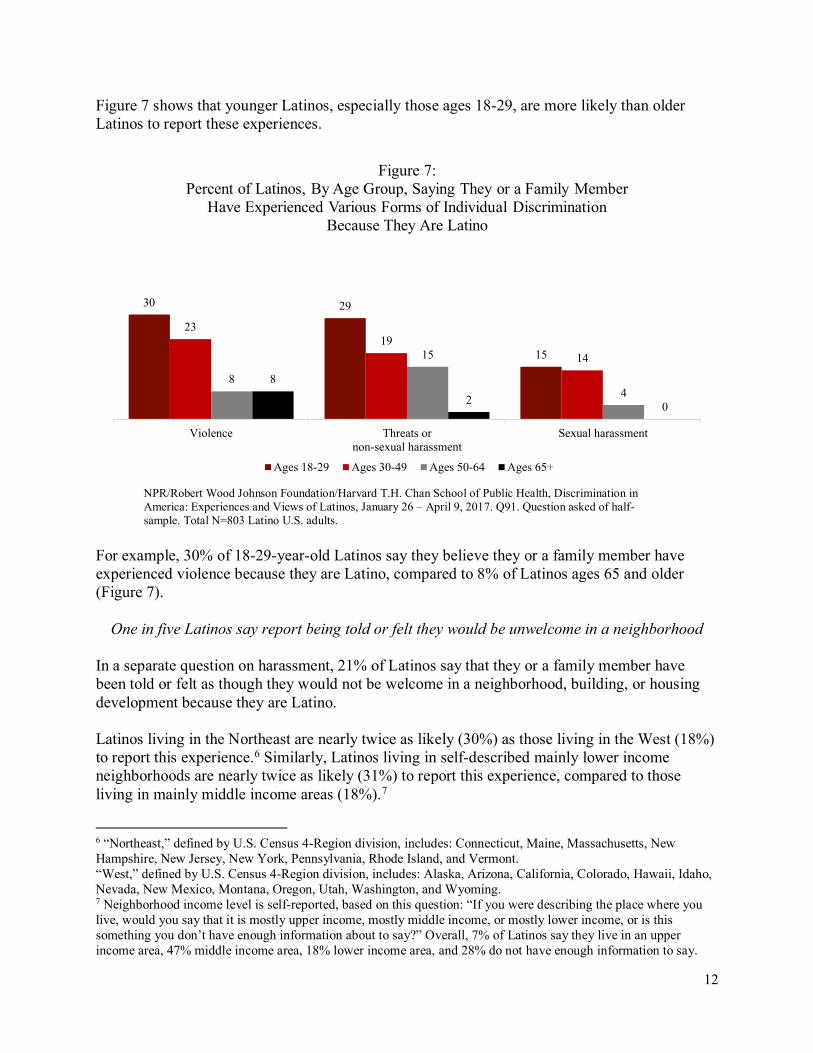
Figure 7 shows that younger Latinos, especially those ages 18-29, are more likely than older Latinos to report these experiences.
NPR/Robert Wood Johnson Foundation/Harvard T.H. Chan School of Public Health, Discrimination in America: Experiences and Views of Latinos, January 26 – April 9, 2017. Q91. Question asked of half-sample. Total N=803 Latino U.S. adults.
For example, 30% of 18-29-year-old Latinos say they believe they or a family member have experienced violence because they are Latino, compared to 8% of Latinos ages 65 and older (Figure 7).
One in five Latinos say report being told or felt they would be unwelcome in a neighborhood In a separate question on harassment, 21% of Latinos say that they or a family member have been told or felt as though they would not be welcome in a neighborhood, building, or housing development because they are Latino. Latinos living in the Northeast are nearly twice as likely (30%) as those living in the West (18%) to report this experience.6 Similarly, Latinos living in self-described mainly lower income neighborhoods are nearly twice as likely (31%) to report this experience, compared to those living in mainly middle income areas (18%).7
6 “Northeast,” defined by U.S. Census 4-Region division, includes: Connecticut, Maine, Massachusetts, New Hampshire, New Jersey, New York, Pennsylvania, Rhode Island, and Vermont. “West,” defined by U.S. Census 4-Region division, includes: Alaska, Arizona, California, Colorado, Hawaii, Idaho, Nevada, New Mexico, Montana, Oregon, Utah, Washington, and Wyoming. 7 Neighborhood income level is self-reported, based on this question: “If you were describing the place where you live, would you say that it is mostly upper income, mostly middle income, or mostly lower income, or is this something you don’t have enough information about to say?” Overall, 7% of Latinos say they live in an upper income area, 47% middle income area, 18% lower income area, and 28% do not have enough information to say.
30 29
15
2319
14
8
15
48
2 0
Violence Threats ornon-sexual harassment
Sexual harassment
Figure 7:Percent of Latinos, By Age Group, Saying They or a Family Member
Have Experienced Various Forms of Individual Discrimination Because They Are Latino
Ages 18-29 Ages 30-49 Ages 50-64 Ages 65+

13
Avoidance of Discrimination People were asked whether they ever avoid engaging in certain behaviors, such as seeking medical care or calling the police when in need, to avoid potential anti-Latino discrimination.
Nearly one in five Latinos have avoided medical care and calling police,
even when in need due to concern of discrimination As Figure 8 shows, nearly one in five (17%) Latinos say they have avoided going to a doctor or seeking health care out of concern that they would be discriminated against or treated poorly because they are Latino. Similarly, 17% of Latinos also say they have avoided calling the police or other authority figures, even when in need, out of concern they would be discriminated against because they are Latino (Figure 8).
NPR/Robert Wood Johnson Foundation/Harvard T.H. Chan School of Public Health, Discrimination in America: Experiences and Views of Latinos, January 26 – April 9, 2017. Q62a, Q88a. Each question asked of half-sample. Total N=803 Latino U.S. adults.
Tables 2 and 3 show demographic differences in avoidance of medical care or calling the police when in need due to concern of discrimination.
17 17
Avoided medical care due toconcern for discrimination
Avoided calling police when in needdue to concern for discrimination
Figure 8:Percent of Latinos Who Have Avoided Medical Care or
Calling the Police When In Need Due to Concern for Discrimination

14
One in six Latinos say they have considered moving because of discrimination Furthermore, 16% of Latinos say they have thought about moving or relocating because of discrimination where they live. LGBTQ Latinos are more than twice as likely to have considered moving because of discrimination (29%) compared to their heterosexual and cisgender counterparts (14%).8
One in six Latinos avoid normal tasks such as using a car or seeking medical care
to avoid possibly interacting with police or government authority figures People were also asked, “Have you ever avoided doing things that you might normally do, such as using a car or public transportation, seeking medical care, or participating in political or social events, because you wanted to avoid possibly interacting with the police or government authority figures?” One in six (16%) Latinos say they have avoided these normal day-to-day tasks to avoid possibly interacting with the police or authority figures.
A majority of Latinos have avoided going to a doctor due to concern for the cost
In a separate question not related to discrimination, nearly six in ten (58%) Latinos say they have avoided seeking medical care for themselves or a member of their family out of concern for cost.
8 “Cisgender” describes individuals who identify as the sex they were assigned at birth (i.e., people who are not transgender). The total number of LGBTQ-identified Latinos in this survey is 87.
Table 3: Percent of Latinos Who Have Avoided Calling the Police When in Need Due to Fear of Discrimination
All Latinos 17%
Latinos who live in…
Western U.S. 23% Northeastern U.S. 6%
Latinos who are ages…
18-29 21% 30-49 18% 50-64 18%
65+ 4%
NPR/Robert Wood Johnson Foundation/ Harvard T.H. Chan School of Public Health, Discrimination in America: Experiences and Views of Latinos,
Jan 26 – Apr 9, 2017. Q88a. Total N=803 Latino U.S. adults.
Table 2: Percent of Latinos Who Have Avoided Seeking Medical Care When in
Need Due to Fear of Discrimination
All Latinos 17% Latinos who are…
Employed part time 31% Employed full time 11%
Latinos who earn…
<$25,000 per year 28% $75,000+ per year 9%
NPR/Robert Wood Johnson Foundation/
Harvard T.H. Chan School of Public Health, Discrimination in America: Experiences and Views of Latinos,
Jan 26 – Apr 9, 2017. Q62a. Total N=803 Latino U.S. adults.
15
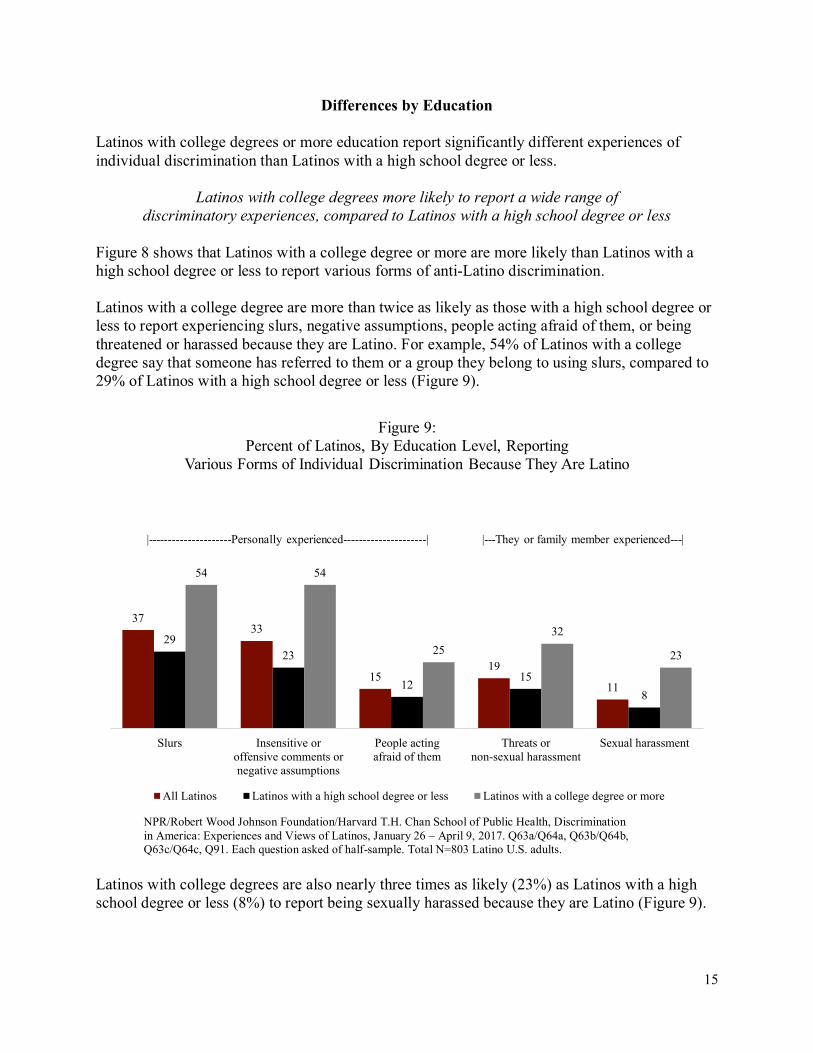
Differences by Education Latinos with college degrees or more education report significantly different experiences of individual discrimination than Latinos with a high school degree or less.
Latinos with college degrees more likely to report a wide range of discriminatory experiences, compared to Latinos with a high school degree or less
Figure 8 shows that Latinos with a college degree or more are more likely than Latinos with a high school degree or less to report various forms of anti-Latino discrimination. Latinos with a college degree are more than twice as likely as those with a high school degree or less to report experiencing slurs, negative assumptions, people acting afraid of them, or being threatened or harassed because they are Latino. For example, 54% of Latinos with a college degree say that someone has referred to them or a group they belong to using slurs, compared to 29% of Latinos with a high school degree or less (Figure 9).
NPR/Robert Wood Johnson Foundation/Harvard T.H. Chan School of Public Health, Discrimination in America: Experiences and Views of Latinos, January 26 – April 9, 2017. Q63a/Q64a, Q63b/Q64b, Q63c/Q64c, Q91. Each question asked of half-sample. Total N=803 Latino U.S. adults.
Latinos with college degrees are also nearly three times as likely (23%) as Latinos with a high school degree or less (8%) to report being sexually harassed because they are Latino (Figure 9).
3733
1519
11
2923
1215
8
54 54
2532
23
Slurs Insensitive oroffensive comments ornegative assumptions
People actingafraid of them
Threats ornon-sexual harassment
Sexual harassment
Figure 9:Percent of Latinos, By Education Level, Reporting
Various Forms of Individual Discrimination Because They Are Latino
All Latinos Latinos with a high school degree or less Latinos with a college degree or more
|---------------------Personally experienced---------------------| |---They or family member experienced---|
16
II. Perceptions of Local Community People were asked to evaluate aspects of life where they live, including how often discrimination happens to other Latinos there, local employment opportunities, and how their neighborhood compares to other places to live. Low income Latinos are more likely to perceive frequent discrimination in their neighborhoods, and non-immigrant Latinos are more likely than immigrant Latinos to negatively evaluate elements of their neighborhood.
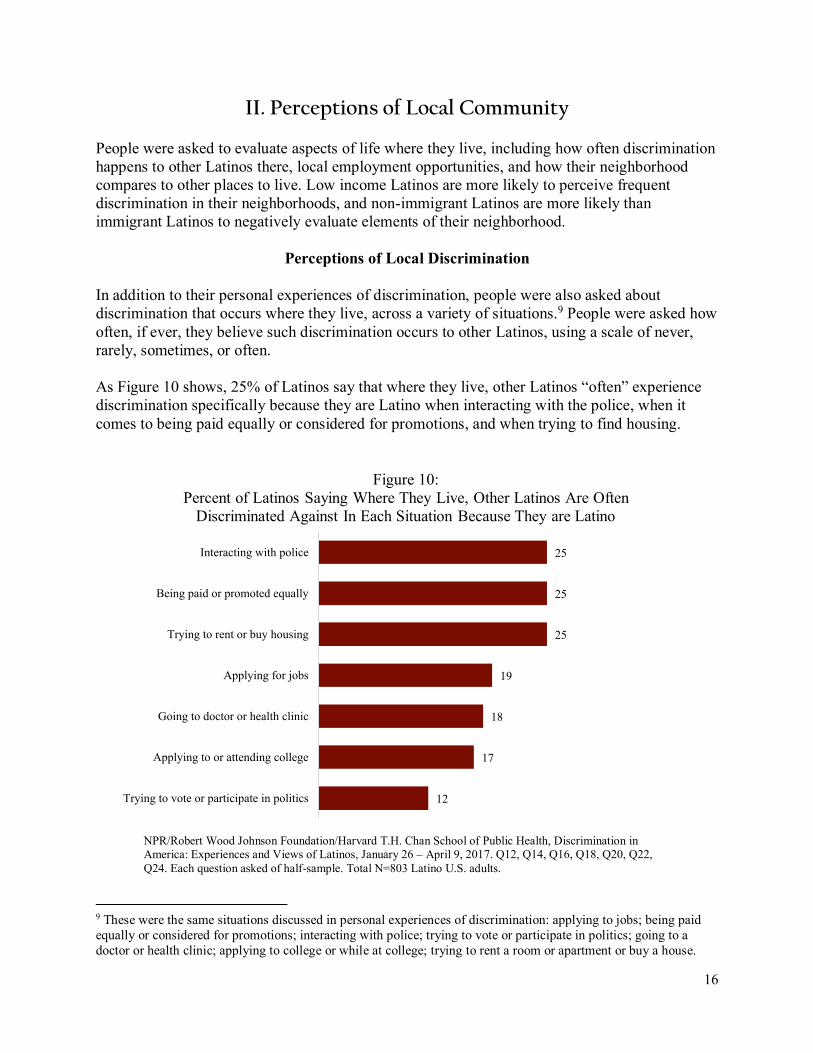
Perceptions of Local Discrimination In addition to their personal experiences of discrimination, people were also asked about discrimination that occurs where they live, across a variety of situations.9 People were asked how often, if ever, they believe such discrimination occurs to other Latinos, using a scale of never, rarely, sometimes, or often. As Figure 10 shows, 25% of Latinos say that where they live, other Latinos “often” experience discrimination specifically because they are Latino when interacting with the police, when it comes to being paid equally or considered for promotions, and when trying to find housing.
NPR/Robert Wood Johnson Foundation/Harvard T.H. Chan School of Public Health, Discrimination in America: Experiences and Views of Latinos, January 26 – April 9, 2017. Q12, Q14, Q16, Q18, Q20, Q22, Q24. Each question asked of half-sample. Total N=803 Latino U.S. adults.
9 These were the same situations discussed in personal experiences of discrimination: applying to jobs; being paid equally or considered for promotions; interacting with police; trying to vote or participate in politics; going to a doctor or health clinic; applying to college or while at college; trying to rent a room or apartment or buy a house.
12
17
18
19
25
25
25
Trying to vote or participate in politics
Applying to or attending college
Going to doctor or health clinic
Applying for jobs
Trying to rent or buy housing
Being paid or promoted equally
Interacting with police
Figure 10:Percent of Latinos Saying Where They Live, Other Latinos Are Often
Discriminated Against In Each Situation Because They are Latino

17
Additionally, more than one in six Latinos say that other Latinos often experience discrimination when applying for jobs (19%), when going to a doctor or health clinic (18%), or applying to or attending college (17%) (Figure 10). Figure 11 shows that Latinos living in what they describe as predominantly lower income areas are also more likely to perceive discrimination against other Latinos in their neighborhood, compared to Latinos living in self-described middle income areas.
NPR/Robert Wood Johnson Foundation/Harvard T.H. Chan School of Public Health, Discrimination in America: Experiences and Views of Latinos, January 26 – April 9, 2017. Q14, Q16, Q24. Each question asked of half-sample. Total N=803 Latino U.S. adults.
Just over four in ten Latinos living in lower income areas say that other Latinos in their area often experience discrimination when being paid or promoted equally (42%), when interacting with police (44%), and when trying to rent or buy housing (44%). In contrast, just under a quarter of Latinos living in middle income areas perceive that such discrimination happens often in pay (22%), police interactions (24%), or housing (23%) (Figure 11). LGBTQ Latinos are more likely than non-LGBTQ Latinos to say that other Latinos in their area often experience discrimination in equal pay and promotion (43% LGBTQ vs. 25% non-LGBTQ Latinos) and when interacting with police (46% LGBTQ vs. 25% non-LGBTQ Latinos).
25 25 25
42 44 44
22 24 23
Being paid or promoted equally Interacting with police Trying to rent or buy housing
Figure 11:Percent of Latinos, By Perceived Neighborhood Income, Saying Where
They Live, Other Latinos Often Experience Discrimination in Each Context
All Latinos Latinos in low income areas Latinos in middle income areas

18
Perceptions of Local Opportunity People were asked to agree or disagree with statements about local employment opportunities, and whether they were encouraged while growing up to apply for college. Overall, 47% of Latinos agree with the statement, “Latino people where I live have fewer employment opportunities, just because they are Latino.” In contrast, 53% disagree.
For majority of Latinos, applying for college was never discussed while growing up In a separate question related to educational opportunity, people were asked if, while growing up, they were encouraged to apply for college, discouraged from applying, or whether this was never discussed. Overall, a majority (52%) of all Latinos say that applying to college was never discussed while growing up. Another 42% of all Latinos say they were encouraged to apply to college, while 5% say they were discouraged from applying. Figure 12 shows that a 54% majority of non-immigrant Latinos were encouraged while growing up to apply for college, compared to 30% of immigrant Latinos.
NPR/Robert Wood Johnson Foundation/Harvard T.H. Chan School of Public Health, Discrimination in America: Experiences and Views of Latinos, January 26 – April 9, 2017. Q76. Question asked of half-sample. Total N=803 Latino U.S. adults.
Latinos currently living in majority Latino neighborhoods are less likely to say they were encouraged to apply to college (33%) than are their peers in non-majority Latino (48%) areas. More than one in ten (11%) Latinos who currently make under $25,000 or less say they were actively discouraged from applying for college while growing up, compared to only 1% of those earning $25,000-$50,000 per year.
42
54
30
Encouraged to apply to college
Figure 12:Percent of Latinos, By Immigrant Status,
Who Were Encouraged to Apply to College While Growing Up
All Latinos Non-immigrant Latinos Immigrant Latinos
19
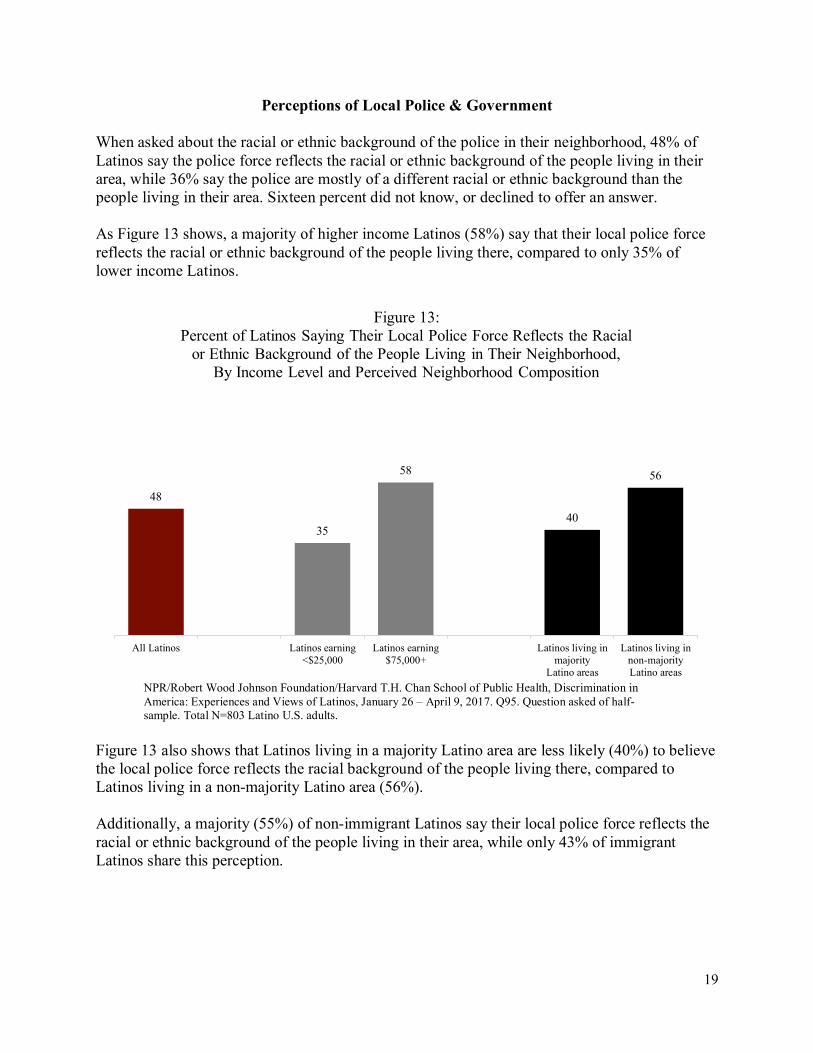
Perceptions of Local Police & Government When asked about the racial or ethnic background of the police in their neighborhood, 48% of Latinos say the police force reflects the racial or ethnic background of the people living in their area, while 36% say the police are mostly of a different racial or ethnic background than the people living in their area. Sixteen percent did not know, or declined to offer an answer. As Figure 13 shows, a majority of higher income Latinos (58%) say that their local police force reflects the racial or ethnic background of the people living there, compared to only 35% of lower income Latinos.
NPR/Robert Wood Johnson Foundation/Harvard T.H. Chan School of Public Health, Discrimination in America: Experiences and Views of Latinos, January 26 – April 9, 2017. Q95. Question asked of half-sample. Total N=803 Latino U.S. adults.
Figure 13 also shows that Latinos living in a majority Latino area are less likely (40%) to believe the local police force reflects the racial background of the people living there, compared to Latinos living in a non-majority Latino area (56%). Additionally, a majority (55%) of non-immigrant Latinos say their local police force reflects the racial or ethnic background of the people living in their area, while only 43% of immigrant Latinos share this perception.
48
35
58
40
56
All Latinos Latinos earning<$25,000
Latinos earning$75,000+
Latinos living inmajority
Latino areas
Latinos living innon-majorityLatino areas
Figure 13:Percent of Latinos Saying Their Local Police Force Reflects the Racial
or Ethnic Background of the People Living in Their Neighborhood,By Income Level and Perceived Neighborhood Composition
20
61% of Latinos believe local government represents their views well, and that they can affect what local government does
When asked, “How well do you feel that your local government represents the views of people like you,” 61% of Latinos say their local government represents these views somewhat or very well. Thirty-six percent (36%) say not too well or not well at all. Latinos living in self-described upper and middle income areas are more likely (64% upper, 65% middle) to say they believe their local government represents their views very or somewhat well, compared to 50% of Latinos living in lower income areas who share this view. Additionally, when asked, “How much can people like you affect what your local government does,” 61% of Latinos say some or a great deal. Those with a college degree are more likely to say this than other Latinos with less education: 73% of those with a college degree say some or a great deal, compared to 58% of Latinos those with a high school education or less.
Perceptions & Evaluations of Community Environment
People were asked to describe and evaluate aspects of the area where they live, including its racial composition and the general economic and health status of the neighborhood. Overall, 44% of Latinos say they live in an area or neighborhood that is predominantly Latino. A majority (55%) of immigrant Latinos say they live in an area that is predominantly Latino, compared to 32% of non-immigrant Latinos. When describing the general economic status of the area in which they live, 7% say they live in a mostly upper income area, while 47% say they live in a mostly middle income area. Another 18% say they live in a mainly lower income area, and 28% say they do not have enough information to say. Similarly, people were asked to describe the overall health and well-being of the place they live. Forty-four percent (44%) say their neighborhood is in excellent or good health, 19% say fair or poor health, and 37% say they do not have enough information to say.
Latinos most frequently rate availability of public transportation, local employment
opportunities, and amount of crime as worse in their neighborhood than in other places to live Latinos were asked to describe and evaluate environmental aspects of the area in which they live. Specifically, they were asked to consider ten elements that affect quality of life, and to compare these elements to other places to live: “Compared to other places to live, do you think the (element) where you live is better, worse, or about the same as other places to live?” These elements include: availability of grocery stores; air quality; quality of drinking water; quality of available housing; quality of available doctors or health care services; quality of public schools; availability of local employment opportunities; amount of crime; availability of parks, green spaces, and recreational areas; and, availability of public transportation options.

21
In most cases, either the majority or plurality of Latinos says that these aspects of their neighborhood are about the same as in other places to live. However, as Figure 14 shows, the top three aspects of community environment that Latinos rated as worse in their neighborhood than in other places to live are: availability of public transportation options (22%), availability of local employment opportunities (21%), and amount of crime (17%).
NPR/Robert Wood Johnson Foundation/Harvard T.H. Chan School of Public Health, Discrimination in America: Experiences and Views of Latinos, January 26 – April 9, 2017. Q85a/b/c/d/e/f/g/h/i/j. Each question asked of half-sample. Total N=803 Latino U.S. adults.
Just under one in six Latinos rank the quality of available housing (15%) and the availability of parks, green spaces, and recreational areas (14%) in their area as worse than in other places to live (Figure 14). At least one in ten Latinos rank the quality of local public schools (11%), the availability of grocery stores (11%), the quality of available doctors or health services (11%), and air quality (10%) as worse than in other places to live (Figure 14).
8
10
11
11
11
14
15
17
21
22
Quality of drinking water
Air quality
Quality of available doctorsor health care services
Availability of grocery stores
Quality of public schools
Availability of parks, greenspaces, & recreational areas
Quality of available housing
Amount of crime
Availability of localemployment opportunities
Availability of publictransportation options
Figure 14:Percent of Latinos Saying Each Element of Their
Community Environment Is Worse Than Other Places to Live

22
Non-immigrant Latinos evaluate their neighborhoods more negatively than immigrant Latinos
Non-immigrant Latinos have significantly different – and more negative – beliefs about their neighborhoods. Figure 15 shows that for seven of the ten studied neighborhood elements, non-immigrant Latinos were more likely to rate their neighborhood as worse than other places to live, compared to immigrant Latinos.
NPR/Robert Wood Johnson Foundation/Harvard T.H. Chan School of Public Health, Discrimination in America: Experiences and Views of Latinos, January 26 – April 9, 2017. Q85a/b/c/d/e/f/g/h/i/j. Each question asked of half-sample. Total N=803 Latino U.S. adults.
Immigrant and non-immigrant Latinos rank elements in roughly similar order: they are both most likely to rate availability of public transportation and availability of local employment opportunities as worse than other places to live (Figure 15). However, non-immigrant Latinos are at least twice as likely as immigrant Latinos to rate each of these seven elements as worse: for example, 30% of non-immigrant Latinos say public transportation options in their area as worse than in other places to live, compared to 14% of immigrant Latinos (Figure 15).
4
5
8
4
8
13
14
12
17
19
19
21
28
30
Quality of drinking water
Quality of public schools
Availability of parks, greenspaces, & recreational areas
Quality of available doctorsor health care services
Quality of available housing
Availability of localemployment opportunities
Availability of publictransportation options
Figure 15:Percent of Latinos, By Immigrant Status, Saying Each Element of
Their Community Environment is Worse Than Other Places to Live
Non-immigrant Latinos Immigrant Latinos

23
Latinos most likely to rate amount of crime, availability of parks, and air quality as better in their neighborhood than in other places to live
Figure 16 shows the elements of their neighborhoods that Latinos rate as “better” than in other places to live.
NPR/Robert Wood Johnson Foundation/Harvard T.H. Chan School of Public Health, Discrimination in America: Experiences and Views of Latinos, January 26 – April 9, 2017. Q85a/b/c/d/e/f/g/h/i/j. Each question asked of half-sample. Total N=803 Latino U.S. adults.
The top three elements that Latinos most frequently say are better in their neighborhoods than in other places to live are the amount of crime (44%), the availability of parks, green spaces, and recreational areas (43%), and the air quality (41%) (Figure 16).
28
28
30
33
35
37
38
41
43
44
Availability of localemployment opportunities
Availability of publictransportation options
Quality of available housing
Quality of available doctorsor health care services
Quality of drinking water
Availability of grocery stores
Quality of public schools
Air quality
Availability of parks, greenspaces, & recreational areas
Amount of crime
Figure 16:Percent of Latinos Saying Each Element of Their
Community Environment Is Better Than Other Places to Live

24
III. National Beliefs & Political Contact Overall, 78% of Latinos believe that there is discrimination against Latinos in America today. Latinos with a college degree are more likely (87%) to believe there is discrimination against Latinos in America today, compared to 77% of Latinos with a high school degree or less. Latinos living in suburban areas are also more likely (81%) to believe discrimination exists today, compared to rural-dwelling Latinos (68%).
Institutional vs. Individual Discrimination Those who believe discrimination exists today were also asked: “When it comes to discrimination against Latino people in America today, which do you think is the bigger problem? Discrimination that is based in laws and government policies, or discrimination that is based on the prejudice of individual people?” Nearly half of Latinos (47%) say discrimination based on individuals’ prejudice is a bigger problem, while 37% say the bigger problem is discrimination based in laws and government policies. Another 14% say that both forms of discrimination are equally a problem (Figure 17).
NPR/Robert Wood Johnson Foundation/Harvard T.H. Chan School of Public Health, Discrimination in America: Experiences and Views of Latinos, January 26 – April 9, 2017. Q2. Question asked of those who believe there is discrimination among total sample. Total N=803 Latino U.S. adults.
Immigrant Latinos are significantly more likely (47%) to say that discrimination based in laws and government policies is the larger problem, compared to 28% of non-immigrant Latinos.
Discrimination based in laws and
government policies37%
Both equally (Vol)14%
Discrimination based on the prejudice of individual people
47%
Figure 17:Latinos' Perceptions of Which is the Larger Problem:Discrimination Based on Individuals' Prejudice, or
Discrimination Based in Laws and Government Policies

25
Lower income Latinos are more likely to identify discrimination based in laws and policies as the larger problem: 38% of Latinos earning under $25,000 per year identify laws and government policies, compared to 18% of Latinos earning $75,000 or more per year. Similarly, 47% of Latinos with a high school degree or less say discrimination based in laws and government policies is the larger problem, compared to 24% of those with some college experience and 20% of those with a college degree or more.
Political Contact Overall, 42% of Latinos say that in the past year, they have been personally contacted by representatives of a political party, candidate, community organization or ballot issue encouraging them to vote or support their cause during an election. Being personally contacted in this way may lead to increased likelihood of voting or other forms of civic or political participation, particularly among racial and ethnic minority communities.10 Latinos earning less than $25,000 per year are significantly less likely to be contacted than their higher income peers: only 32% of those earning under $25,000 they have been contacted in the last year, compared to 64% of those earning $75,000 or more per year. Latinos in the Midwest are more likely than Latinos in any other part of the country to say they were contacted (67% Midwest, 45% West, 38% Northeast, 38% South).11 With regard to party affiliation, 39% of Latinos describe themselves as Democrat, while 28% identify as Independent, 14% as Republican, and 8% as other.
10 See, for example, Lisa García Bedolla and Melissa R. Michelson’s Mobilizing Inclusion: Transforming the Electorate through Get-Out-the-Vote Campaigns (2012, Yale University Press), and Donald P. Green and Alan S. Gerber’s Get Out the Vote: How to Increase Voter Turnout (2008, Brookings Institution Press). 11 “Midwest,” as defined by U.S. Census 4-Region division, includes: Illinois, Indiana, Iowa, Kansas, Michigan, Minnesota, Missouri, Nebraska, North Dakota, Ohio, South Dakota, and Wisconsin. “South,” as defined by U.S. Census 4-Region division, includes: Alabama, Arkansas, Delaware, District of Columbia, Florida, Georgia, Kentucky, Louisiana, Maryland, Mississippi, North Carolina, Oklahoma, South Carolina, Tennessee, Texas, Virginia, and West Virginia.
26
Conclusion Latinos in America report significant discrimination in their own lives. One-third of Latinos report being personally discriminated against because they are Latino when applying to jobs and when being paid equally or considered for promotions. Thirty-one percent (31%) report experiencing anti-Latino discrimination when seeking housing. Latinos further report discriminatory experiences at the hands of the legal system: 27% say they have been personally discriminated against because they are Latino when interacting with police, and 20% say they or a family member have been unfairly treated by the courts. Additionally, Latinos report extensive individual or interpersonal discrimination: a third or more say they have personally experienced racial or ethnic slurs and people making negative assumptions or insensitive comments about their race or ethnicity. Roughly one in five say they have experienced violence or threats because they are Latino. With respect to their neighborhoods, fewer than half (48%) of Latinos say that their local police force reflects the racial or ethnic background of the people living there. Additionally, Latinos most frequently rate the availability of public transportation and local employment opportunities as worse in their area than in other places to live. However, at least 4 in 10 Latinos rate the amount of crime, the availability of parks, and the air quality as better. Despite the discrimination that many Latinos report, 61% believe they can influence what their local government does. In the context of beliefs about the national environment, 78% of Latinos believe that discrimination against Latinos exists in America today. Nearly half (47%) of Latinos who believe this discrimination exists say that discrimination based on the prejudice of individual people is the bigger problem, compared to 37% of Latinos who say discrimination based in laws and government policies is the bigger problem. Another 14% say both are equally problematic. Demographically, younger Latinos are more likely to say: they have been personally discriminated against because they are Latino when trying to vote or participate in politics; they have been unfairly stopped or treated by the police; they have avoided calling the police, even when in need, out of concern that they would be discriminated against; and that they have experienced many forms of individual discrimination, including violence, threats, and slurs. Non-immigrant Latinos are more likely than immigrant Latinos to report various experiences of individual discrimination, including slurs and negative assumptions about their race or ethnicity. Non-immigrant Latinos are also more likely to say they or a family member have been unfairly stopped or treated by the police because they are Latino, and they are more likely to negatively evaluate aspects of their community environment. Similarly, Latinos with a college degree are more likely than Latinos with a high school degree or less to report individual discrimination, including slurs, threats, and harassment. They are also more likely to believe that discrimination against Latinos exists in America today. The findings illustrate Latinos’ significant experiences and perceptions of discrimination across a wide range of areas of life in America today.

27
Methodology
The poll in this study is part of an on-going series of surveys developed by researchers at the Harvard Opinion Research Program (HORP) at Harvard T.H. Chan School of Public Health in partnership with the Robert Wood Johnson Foundation and National Public Radio. The research team consists of the following members at each institution.
Harvard T.H. Chan School of Public Health: Robert J. Blendon, Professor of Health Policy and Political Analysis and Executive Director of HORP; Logan S. Casey, Research Associate in Public Opinion; John M. Benson, Senior Research Scientist and Managing Director of HORP; Justin M. Sayde, Administrative and Research Manager; and Tiffany Chan, Research Fellow.
Robert Wood Johnson Foundation: Carolyn Miller, Senior Program Officer, Research and Evaluation; Jordan Reese, Director of Media Relations; and Dwayne Proctor, Director, Achieving Health Equity Portfolio.
NPR: Anne Gudenkauf, Senior Supervising Editor, Science Desk; Joe Neel, Deputy Senior Supervising Editor, Science Desk; Keith Woods, Vice President, Diversity in News and Operations; Sara Goo, Acting Managing Editor, Digital News; Vickie Walton-James, Senior Supervising Editor, National Desk; Luis Clemens, Supervising Editor, National Desk; Alison Macadam, Senior Editorial Specialist; Alison Kodjak, Correspondent, Science Desk; and Rae Ellen Bichell, Reporter, Science Desk.
Interviews were conducted by SSRS of Glen Mills (PA) via telephone (including both landline and cell phone) using random-digit dialing, January 26 – April 9, 2017, among a nationally representative probability-based sample of 3,453 adults age 18 or older. The survey included nationally representative samples of Latinos, African Americans, Asian Americans, and Native Americans, as well as white Americans;12 men and women, and LGBTQ adults.
This report presents the results specifically for a nationally representative probability-based telephone (cell and landline) sample of 803 Latinos. The margin of error for total Latino respondents is ±4.5 percentage points at the 95% confidence level.
Possible sources of non-sampling error include non-response bias, as well as question wording and ordering effects. Non-response in telephone surveys produces some known biases in survey-derived estimates because participation tends to vary for different subgroups of the population. To compensate for these known biases and for variations in probability of selection within and across households, sample data are weighted by cell phone/landline use and demographics (sex, age, education, and Census region) to reflect the true population. Other techniques, including random-digit dialing, replicate subsamples, and systematic respondent selection within households, are used to ensure that the sample is representative.
12 African American, Asian American, and white American respondents who also identified as Hispanic or Latino were included only in the Latino sample.
28
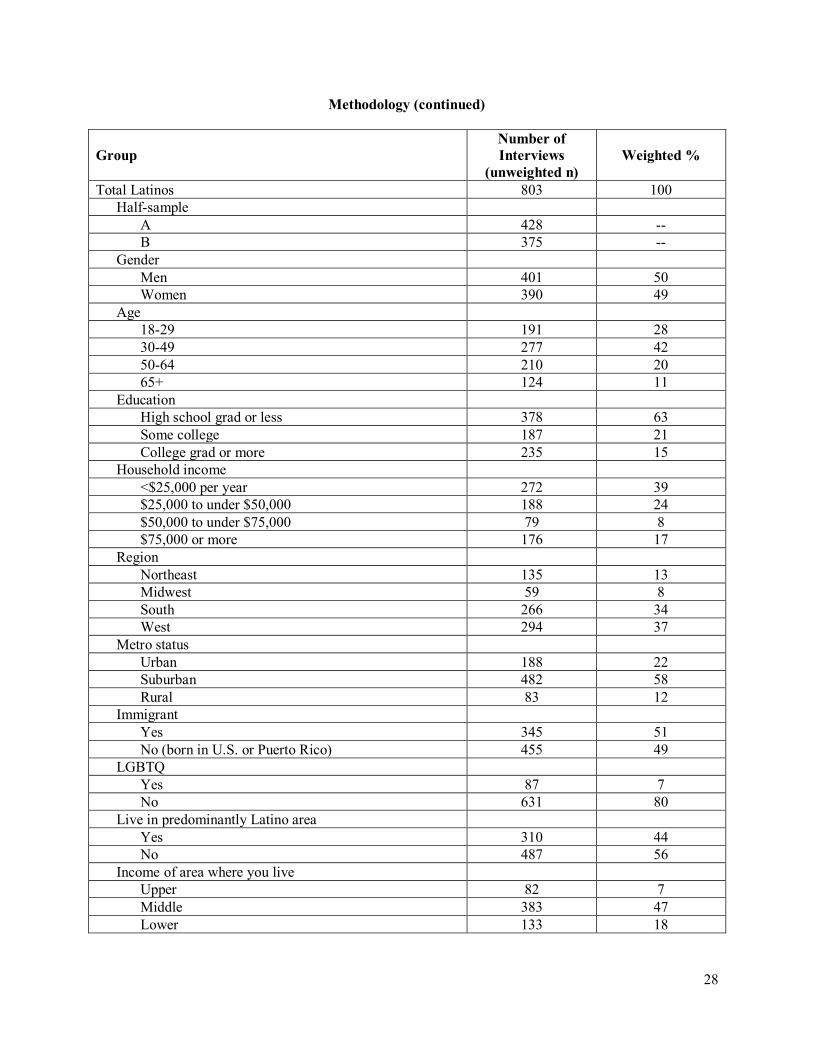
Methodology (continued)
Group Number of Interviews
(unweighted n) Weighted %
Total Latinos 803 100 Half-sample
A 428 -- B 375 --
Gender Men 401 50 Women 390 49
Age 18-29 191 28 30-49 277 42 50-64 210 20 65+ 124 11
Education High school grad or less 378 63 Some college 187 21 College grad or more 235 15
Household income <$25,000 per year 272 39 $25,000 to under $50,000 188 24 $50,000 to under $75,000 79 8 $75,000 or more 176 17
Region Northeast 135 13 Midwest 59 8 South 266 34 West 294 37
Metro status Urban 188 22 Suburban 482 58 Rural 83 12
Immigrant Yes 345 51 No (born in U.S. or Puerto Rico) 455 49
LGBTQ Yes 87 7 No 631 80
Live in predominantly Latino area Yes 310 44 No 487 56
Income of area where you live Upper 82 7 Middle 383 47 Lower 133 18
1
NPR ROBERT WOOD JOHNSON FOUNDATION
HARVARD T.H. CHAN SCHOOL OF PUBLIC HEALTH
Discrimination in America: Experiences and Views of Latinos
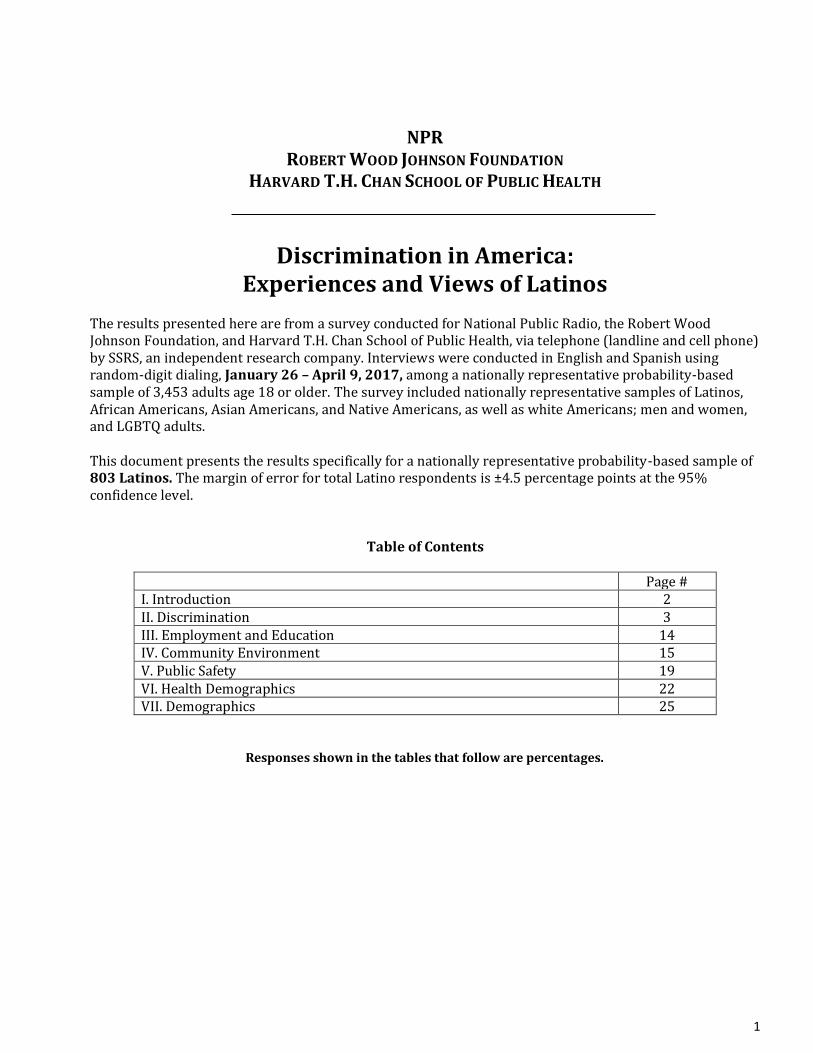
The results presented here are from a survey conducted for National Public Radio, the Robert Wood Johnson Foundation, and Harvard T.H. Chan School of Public Health, via telephone (landline and cell phone) by SSRS, an independent research company. Interviews were conducted in English and Spanish using random-digit dialing, January 26 – April 9, 2017, among a nationally representative probability-based sample of 3,453 adults age 18 or older. The survey included nationally representative samples of Latinos, African Americans, Asian Americans, and Native Americans, as well as white Americans; men and women, and LGBTQ adults. This document presents the results specifically for a nationally representative probability-based sample of 803 Latinos. The margin of error for total Latino respondents is ±4.5 percentage points at the 95% confidence level.
Table of Contents
Page # I. Introduction 2 II. Discrimination 3 III. Employment and Education 14 IV. Community Environment 15 V. Public Safety 19 VI. Health Demographics 22 VII. Demographics 25
Responses shown in the tables that follow are percentages.

2
I. Introduction
(Asked of half-sample A; n= 428) S5. Have you ever applied for a job?
Latinos Yes, has applied for a job 85 No, has not applied for a job 15 DK/Ref -
(Asked of half-sample A; n= 428) S6. Have you ever been employed for pay?
Latinos Yes, has been employed for pay 89 No, has not been employed for pay 11 DK/Ref -
(Asked of half-sample B; n= 375) S7. Have you ever applied for college or attended college for any amount of time?
Latinos Yes, has applied for or attended college 49
No, has not applied for or attended college 50
DK/Ref 1 (Asked of half-sample B; n= 375) S8. Have you ever tried to rent a room or apartment or to apply for a mortgage or buy a home?
Latinos Yes, has tried 56 No, has not tried 44 DK/Ref -

3
II. Discrimination Q1. Generally speaking, do you believe there is or is not discrimination against Latino people in America today?
Latinos Yes 78 No 20 DK/Ref 2
(Asked of Lainos who believe discrimination against Latinos exists in America today; n= 638) Q2. When it comes to discrimination against Latino people in America today, which do you think is the bigger problem?
Latinos Discrimination that is based in laws and government policies 37
Discrimination that is based on the prejudice of individual people 47
Both equally (vol) 14 DK/Ref 2

4
Now we’d like to ask you some questions more specifically about what goes on in the general area where you live, as well as your personal experiences. When we say “the area where you live,” we just mean the general neighborhood, town, or part of town where you live.
Q10. How well do you feel that your local government represents the views of people like you?
Latinos Very well 26 Somewhat well 35 Not too well 23 Not well at all 13 DK/Ref 3
Q11. How much can people like you affect what your local government does? Would you say…?
Latinos A great deal 28 Some 33 Only a little 25 Not at all 11 DK/Ref 3

5
Now I have some questions about issues that may be facing people where you live. For each of the following, please tell me how frequently you think this happens to people where you live, using the scale OFTEN, SOMETIMES, RARELY, or NEVER. Then I’ll ask if you’ve ever personally experienced this, not just where you currently live. (Asked of half-sample A; n=428) Q12. How often, if ever, do you believe Latino people where you live experience discrimination when applying for jobs?
Latinos Often 19 Sometimes 40 Rarely 26 Never 14 DK/Ref 1
(Asked of half-sample A respondents who have ever applied for a job; n=376) Q13. What about you? Do you believe you have ever personally experienced discrimination because you are Latino when applying for jobs?
Latinos Yes 33 No 67 DK/Ref -
(Asked of half-sample A; n=428) Q14. How often, if ever, do you believe Latino people where you live experience discrimination when it comes to being paid equally or considered for promotions?
Latinos Often 25 Sometimes 37 Rarely 23 Never 13 DK/Ref 2
(Asked of Latinos in half-sample A who have ever been employed; n=386) Q15. What about you? Do you believe you have ever personally experienced discrimination because you are Latino when it comes to being paid equally or considered for promotions?
Latinos Yes 32 No 67 DK/Ref 1
6
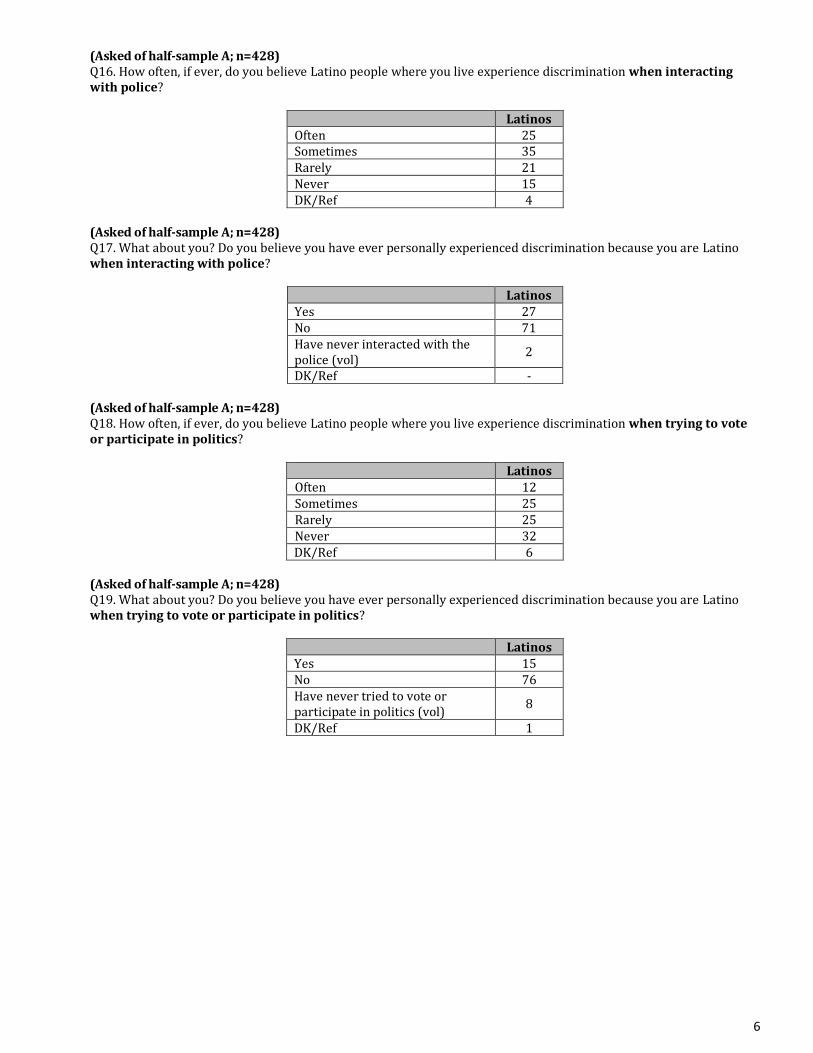
(Asked of half-sample A; n=428) Q16. How often, if ever, do you believe Latino people where you live experience discrimination when interacting with police?
Latinos Often 25 Sometimes 35 Rarely 21 Never 15 DK/Ref 4
(Asked of half-sample A; n=428) Q17. What about you? Do you believe you have ever personally experienced discrimination because you are Latino when interacting with police?
Latinos Yes 27 No 71 Have never interacted with the police (vol) 2
DK/Ref - (Asked of half-sample A; n=428) Q18. How often, if ever, do you believe Latino people where you live experience discrimination when trying to vote or participate in politics?
Latinos Often 12 Sometimes 25 Rarely 25 Never 32 DK/Ref 6
(Asked of half-sample A; n=428) Q19. What about you? Do you believe you have ever personally experienced discrimination because you are Latino when trying to vote or participate in politics?
Latinos Yes 15 No 76 Have never tried to vote or participate in politics (vol) 8
DK/Ref 1

7
(Asked of half-sample B; n=375 ) Q20. How often, if ever, do you believe Latino people where you live experience discrimination when going to a doctor or health clinic?
Latinos Often 18 Sometimes 26 Rarely 30 Never 21 DK/Ref 5
(Asked of half-sample B; n=375) Q21. What about you? Do you believe you have ever personally experienced discrimination because you are Latino when going to a doctor or health clinic?
Latinos Yes 20 No 80 DK/Ref -
(Asked of half-sample B; n=375) Q22. How often, if ever, do you believe Latino people where you live experience discrimination when applying to college or while at college?
Latinos Often 17 Sometimes 33 Rarely 21 Never 22 DK/Ref 7
(Asked of Latinos in half-sample B who have ever applied to or attended college; n=220 ) Q23. What about you? Do you believe you have ever personally experienced discrimination because you are Latino when applying to college or while at college?
Latinos Yes 19 No 81 DK/Ref -

8
(Asked of half-sample B; n=375) Q24. How often, if ever, do you believe Latino people where you live experience discrimination when trying to rent a room or apartment or buy a house?
Latinos Often 25 Sometimes 32 Rarely 19 Never 20 DK/Ref 4
(Asked of Latinos in half-sample B who have ever tried to rent or buy a place to live; n=241) Q25. What about you? Do you believe you have ever personally experienced discrimination because you are Latino when trying to rent a room or apartment or buy a house?
Latinos Yes 31 No 69 DK/Ref -

9
(Asked of half-sample B; n=375) Q61. Have you ever avoided going to a doctor or seeking health care for you or others in your family out of concern for the cost?
Latinos Yes 58 No 41 DK/Ref 1
(Asked of half-sample B; n=375) Q62a. Have you ever avoided going to a doctor or seeking health care for you or others in your family out of concern that you would be discriminated against or treated poorly because you or they are Latino?
Latinos Yes 17 No 83 DK/Ref *

10
(Asked of half-sample B; n=375) Q63. In your day-to-day life, have any of the following things ever happened to you, or not? a. Someone referred to you or a group you belong to using a slur or other negative word
Latinos Yes, has happened 43 No, has not happened 57 DK/Ref *
b. Someone made negative assumptions or insensitive or offensive comments about you
Latinos Yes, has happened 50 No, has not happened 50 DK/Ref *
c. People acted as if they were afraid of you
Latinos Yes, has happened 24 No, has not happened 76 DK/Ref *

11
Q63a. In your day-to-day life, have any of the following things ever happened to you, or not? Someone referred to you or a group you belong to using a slur or other negative word If Yes, ask: Q64a. Do you believe this happened to you because of your race or ethnicity, your gender, or was it for some other reason? Q63a/Q64a Combo Table Based on total half-sample B; n=375
Latinos Someone has referred to you or a group you belong to using a slur or other negative word (total) 43
...and you believe it happened to you because... Race or ethnicity 37 Gender 6 Sexual orientation 3 Gender identity 1 Religion/Religious views (vol) 1 My appearance (weight, height, the way I dressed, hair, etc) (vol) 1 Political reasons/Political affiliation (vol) - Mean/angry/rude/being a bully (vol) * Envy/Jealousy (vol) * Work position/authoritative position/other work reasons (vol) * Handicap/disability (vol) - Personality (vol) - Social Reasons (vol) - Some other reason 1 DK/Ref 1
No, has not happened 57 DK/Ref *
12
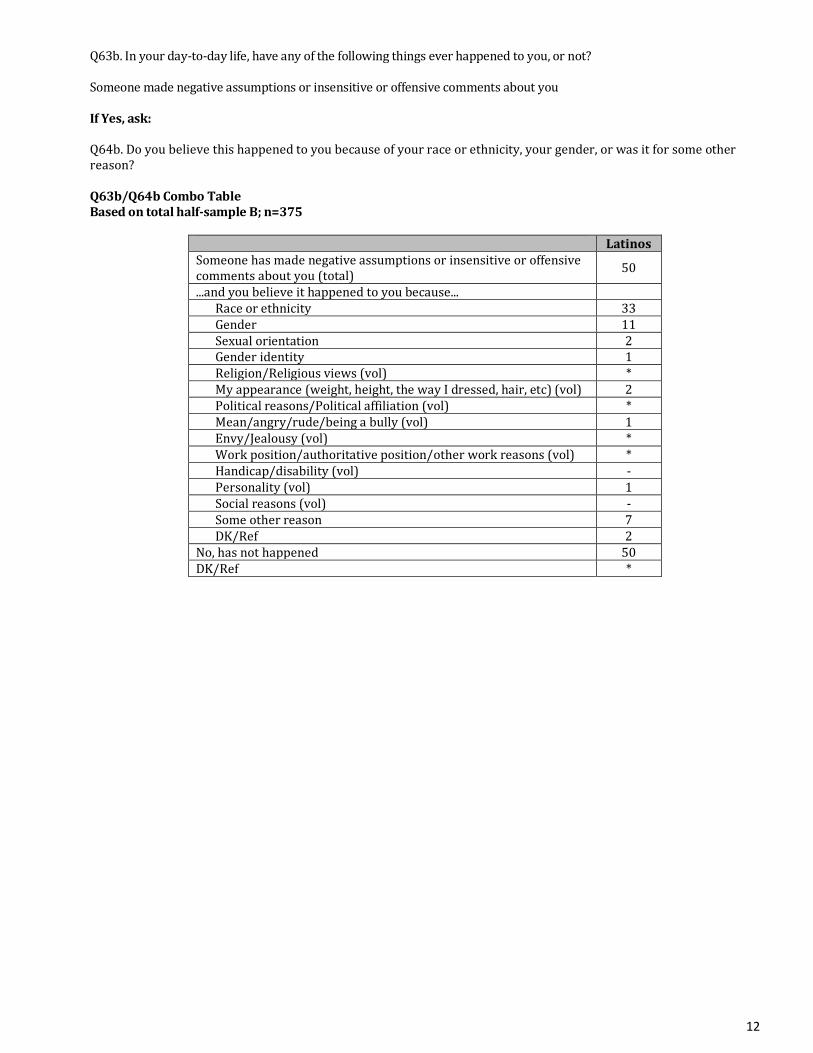
Q63b. In your day-to-day life, have any of the following things ever happened to you, or not? Someone made negative assumptions or insensitive or offensive comments about you If Yes, ask: Q64b. Do you believe this happened to you because of your race or ethnicity, your gender, or was it for some other reason? Q63b/Q64b Combo Table Based on total half-sample B; n=375
Latinos Someone has made negative assumptions or insensitive or offensive comments about you (total) 50
...and you believe it happened to you because... Race or ethnicity 33 Gender 11 Sexual orientation 2 Gender identity 1 Religion/Religious views (vol) * My appearance (weight, height, the way I dressed, hair, etc) (vol) 2 Political reasons/Political affiliation (vol) * Mean/angry/rude/being a bully (vol) 1 Envy/Jealousy (vol) * Work position/authoritative position/other work reasons (vol) * Handicap/disability (vol) - Personality (vol) 1 Social reasons (vol) - Some other reason 7 DK/Ref 2
No, has not happened 50 DK/Ref *

13
Q63c. In your day-to-day life, have any of the following things ever happened to you, or not? People acted as if they were afraid of you If Yes, ask: Q64c. Do you believe this happened to you because of your race or ethnicity, your gender, or was it for some other reason? Q63c/Q64c Combo Table Based on total half-sample B; n=375
Latinos People have acted as if they were afraid to you (total) 24 ...and you believe it happened to you because...
Race or ethnicity 15 Gender 8 Sexual orientation 1 Gender identity * Religion/Religious views (vol) * My appearance (weight, height, the way I dressed, hair, etc) (vol) 2 Political reasons/Political affiliation (vol) - Mean/angry/rude/being a bully (vol) 1 Envy/Jealousy - Work position/authoritative position/other work reasons (vol) * Handicap/disability (vol) - Personality (vol) 1 Social reasons (vol) - Some other reason 2 DK/Ref 1
No, has not happened 76 DK/Ref *

14
III. Employment & Education Please tell me whether you agree or disagree with the following statement about employment opportunities. Do you STRONGLY AGREE, SOMEWHAT AGREE, SOMEWHAT DISAGREE, OR STRONGLY DISAGEE: (Asked of half-sample A; n=428) Q65. Latino people where I live have fewer employment opportunities just because they are Latino. Do you…?
Latinos Strongly agree 17 Somewhat agree 30 Somewhat disagree 25 Strongly disagree 28 DK/Ref *
(Asked of half-sample B; n=375) Q76. When you were growing up, were you encouraged to apply to college, discouraged from applying for college, or was this never discussed?
Latinos Encouraged to apply to college 42 Discouraged from applying for college 5 Never discussed 52 DK/Ref 1
15
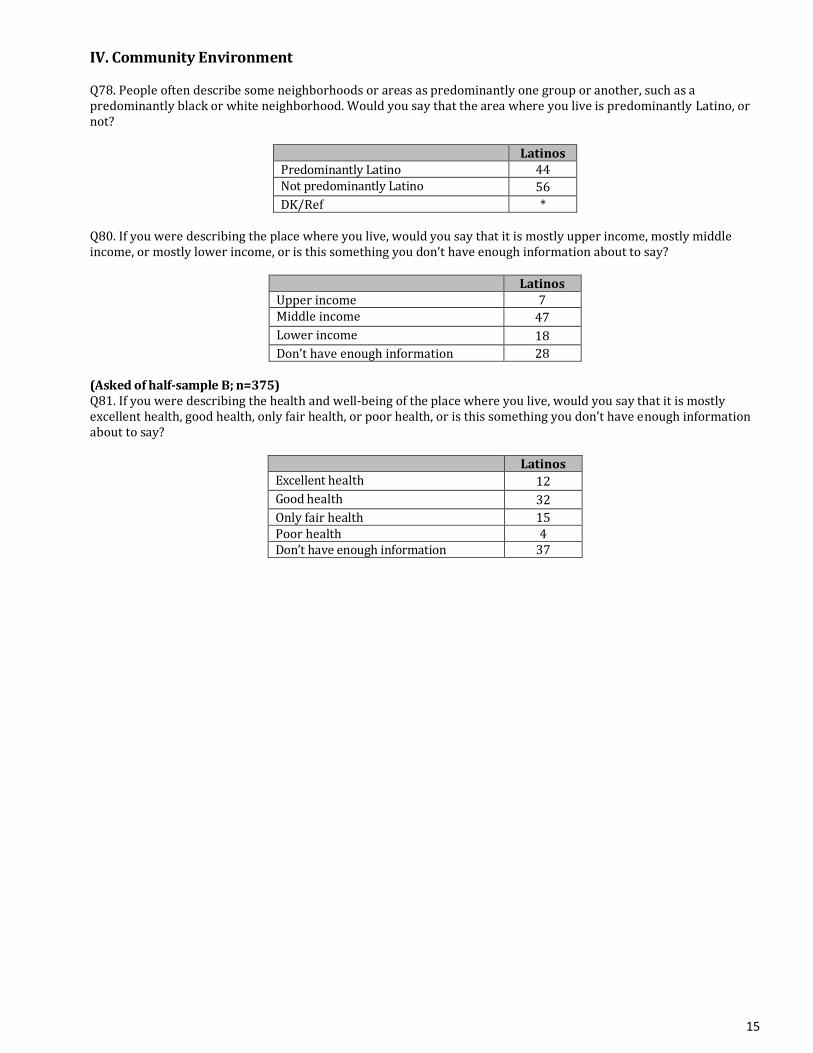
IV. Community Environment Q78. People often describe some neighborhoods or areas as predominantly one group or another, such as a predominantly black or white neighborhood. Would you say that the area where you live is predominantly Latino, or not?
Latinos Predominantly Latino 44 Not predominantly Latino 56 DK/Ref *
Q80. If you were describing the place where you live, would you say that it is mostly upper income, mostly middle income, or mostly lower income, or is this something you don’t have enough information about to say?
Latinos Upper income 7 Middle income 47 Lower income 18 Don’t have enough information 28
(Asked of half-sample B; n=375) Q81. If you were describing the health and well-being of the place where you live, would you say that it is mostly excellent health, good health, only fair health, or poor health, or is this something you don’t have enough information about to say?
Latinos Excellent health 12 Good health 32 Only fair health 15 Poor health 4 Don’t have enough information 37
16
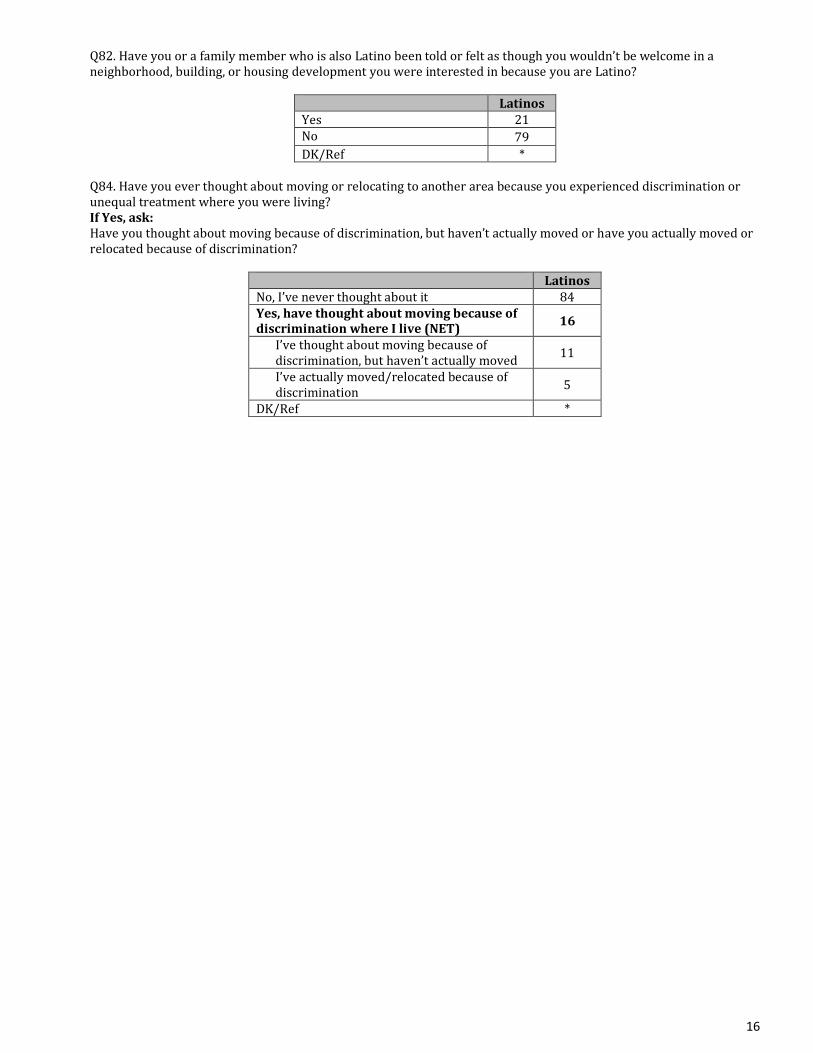
Q82. Have you or a family member who is also Latino been told or felt as though you wouldn’t be welcome in a neighborhood, building, or housing development you were interested in because you are Latino?
Latinos Yes 21 No 79 DK/Ref *
Q84. Have you ever thought about moving or relocating to another area because you experienced discrimination or unequal treatment where you were living? If Yes, ask: Have you thought about moving because of discrimination, but haven’t actually moved or have you actually moved or relocated because of discrimination?
Latinos No, I’ve never thought about it 84 Yes, have thought about moving because of discrimination where I live (NET) 16
I’ve thought about moving because of discrimination, but haven’t actually moved 11
I’ve actually moved/relocated because of discrimination 5
DK/Ref *
17
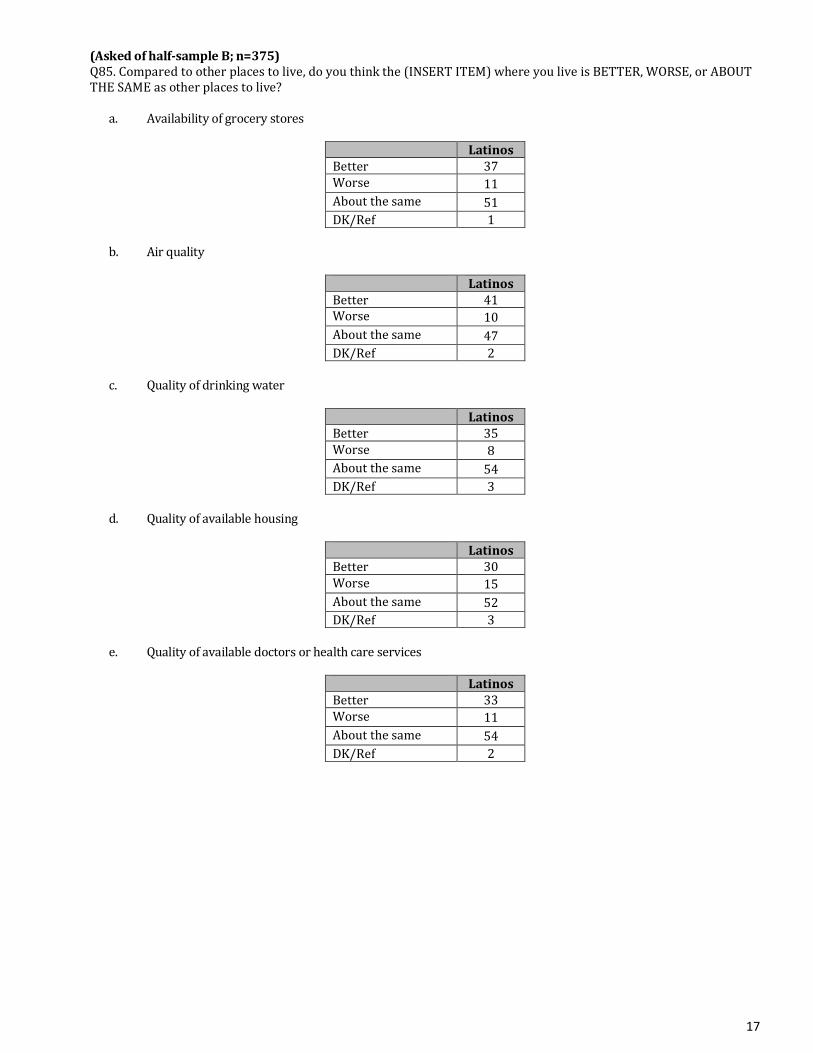
(Asked of half-sample B; n=375) Q85. Compared to other places to live, do you think the (INSERT ITEM) where you live is BETTER, WORSE, or ABOUT THE SAME as other places to live? a. Availability of grocery stores
Latinos Better 37 Worse 11 About the same 51 DK/Ref 1
b. Air quality
Latinos Better 41 Worse 10 About the same 47 DK/Ref 2
c. Quality of drinking water
Latinos Better 35 Worse 8 About the same 54 DK/Ref 3
d. Quality of available housing
Latinos Better 30 Worse 15 About the same 52 DK/Ref 3
e. Quality of available doctors or health care services
Latinos Better 33 Worse 11 About the same 54 DK/Ref 2

18
f. Quality of public schools
Latinos Better 38 Worse 11 About the same 44 DK/Ref 7
g. Availability of local employment opportunities
Latinos Better 28 Worse 21 About the same 49 DK/Ref 2
h. Amount of crime
Latinos Better 44 Worse 17 About the same 37 DK/Ref 2
i. Availability of parks, green spaces, and recreational areas
Latinos Better 43 Worse 14 About the same 42 DK/Ref 1
j. Availability of public transportation options
Latinos Better 28 Worse 22 About the same 48 DK/Ref 2

19
V. Public Safety Now I’d like to ask you some questions about public safety. Some of these questions will ask about the police in the area where you live. Many news events over the past few years have highlighted some of the tensions between police and the communities they work in. We want you to think about the place where you live and your own personal experience, rather than events nationwide. (Asked of half-sample A; n=428) Q88. Have you ever avoided calling the police or other authority figures, even when in need, out of concern that you or others in your family would be discriminated against because you or they are Latino?
Latinos Yes 17 No 83 DK/Ref *
(Asked of half-sample A; n=428) Q89. Have you ever avoided doing things that you might normally do, such as using a car or public transportation, seeking medical care, or participating in political or social events, because you wanted to avoid possibly interacting with the police or government authority figures?
Latinos Yes 16 No 84 DK/Ref -
(Asked of half-sample A; n=428) Q89. Have you ever avoided doing things that you might normally do, such as using a car or public transportation, seeking medical care, or participating in political or social events, because you wanted to avoid possibly interacting with the police or government authority figures? If yes, ask: Q90. How often would you say you avoided doing things you might normally do, to avoid the police or government authority figures? Q89/Q90 Combo Table Based on total half-sample; n=428
Latinos Have ever avoided doing things they might normally do because they wanted to avoid possibly interacting with the police or government authority figures
16
Frequently 4 Sometimes 8 Not often 4
No, have not 84 DK/Ref -

20
Now I’m going to ask you a few questions about things that may have ever happened to you. Some of these may be difficult to think or talk about, but please do your best. Your honest answers can really help. (Asked of half-sample A; n=428) Q91. Do you believe that you or someone in your family has (INSERT ITEM) because you or they are Latino? Q91 Summary Table: % saying “Yes”
Latinos Experienced sexual harassment 11 Been threatened or non-sexually harassed 19
Been unfairly stopped or treated by the police 27
Been unfairly treated by the courts 20 Experienced violence 20
(Asked of half-sample A; n=428) Q95. Do you believe that the police force in your area reflects the racial or ethnic background of the people living in your area, or are the police mostly of a different racial or ethnic background than the people living in your area?
Latinos Police force reflects the racial or ethnic background of the people living in your area
48
Police mostly of a different racial or ethnic background than the people living in your area
36
DK/Ref 16

21
Q96. In the past year, have you been personally contacted by representatives of a political party, candidate, community organization, or ballot issue encouraging you to vote or support their cause during an election? For example, someone knocking on your door or calling you on the phone?
Latinos Yes 42 No 57 DK/Ref 1
Q97. Are you registered to vote at your current address, registered to vote somewhere else, or are you not registered to vote?
Latinos Registered to vote 58
Registered at current address 51 Registered somewhere else 7
Not registered to vote 42 DK/Ref *
Q97. Are you registered to vote at your current address, registered to vote somewhere else, or are you not registered to vote? If registered to vote, ask: Q98. Did you vote in the 2016 presidential election when Hillary Clinton ran against Donald Trump, did something prevent you from voting, or did you choose not to vote? Q97/Q98 Combo Table Based on total respondents
Latinos Registered to vote 58
Yes, voted 45 No, did not vote 13
Not registered to vote 42 DK/Ref *

22
VI. Health Demographics Q99. In general, how would you describe your own physical health – excellent, very good, good, fair, or poor?
Latinos Excellent 24 Very good 22 Good 25 Fair 24 Poor 5 DK/Ref -
Q100. In general, how would you describe your own mental health – excellent, very good, good, fair, or poor?
Latinos Excellent 33 Very good 25 Good 26 Fair 14 Poor 2 DK/Ref -
Q101. Does any disability keep you from participating fully in work, school, housework, or other activities?
Latinos Yes 15 No 85 DK/Ref -
Q102. Has a doctor or other health care professional ever told you that you have a chronic illness, such as heart disease, lung disease, cancer, diabetes, high blood pressure, asthma or a mental health condition, or haven’t they?
Latinos Yes 29 No 71 DK/Ref -

23
Q103. Do you receive regular care from the Veterans Administration?
Latinos Yes 5 No 95 DK/Ref *
Q105. Do you have a regular doctor or health care professional that provides most of your health care when you are sick or have a health concern, or do you not?
Latinos Yes 68 No 32 DK/Ref *
Q106. Where do you usually go when you are sick or when you need advice about your health? Is it a hospital emergency room, a clinic at a hospital, a neighborhood clinic or health center, a private doctor’s office, or do you have no usual place of care?
Latinos Hospital emergency room 10 Clinic at a hospital 13 Neighborhood clinic or health center 29 Private doctor’s office 35 No usual place of care 11 Urgent Care (vol) * Veterans Administration/Military care (vol) * Other 1 DK/Ref 1

24
Q107. Are you, yourself, now covered by any form of health insurance or health plan? This would include any private insurance plan through your employer or that you purchased yourself, as well as a government program like Medicare or Medicaid.
Latinos Yes 78 No 22 DK/Ref *
Q107. Are you, yourself, now covered by any form of health insurance or health plan? This would include any private insurance plan through your employer or that you purchased yourself, as well as a government program like Medicare or Medicaid. If covered by health insurance, ask: Q108. Which of the following is your main source of health insurance coverage? Is it a plan through your employer, a plan through your spouse’s employer, a plan you purchased yourself either from an insurance company or a state or federal marketplace, are you covered by Medicare or Medicaid, a plan through your parents, or do you get your health insurance from somewhere else? Q107/Q108 Combo Table Based on total respondents
Latinos Yes, covered by health insurance 78
Plan through your employer 28 Plan through your spouse’s employer 7 Plan you purchased yourself either through an insurance company or state or federal marketplace
10
Medicare 12 Medicaid 11 Plan through your parents 6 Veterans administrative/Military (vol) 1 Somewhere else 2 DK/Ref 1
No, not covered by health insurance 22 DK/Ref *
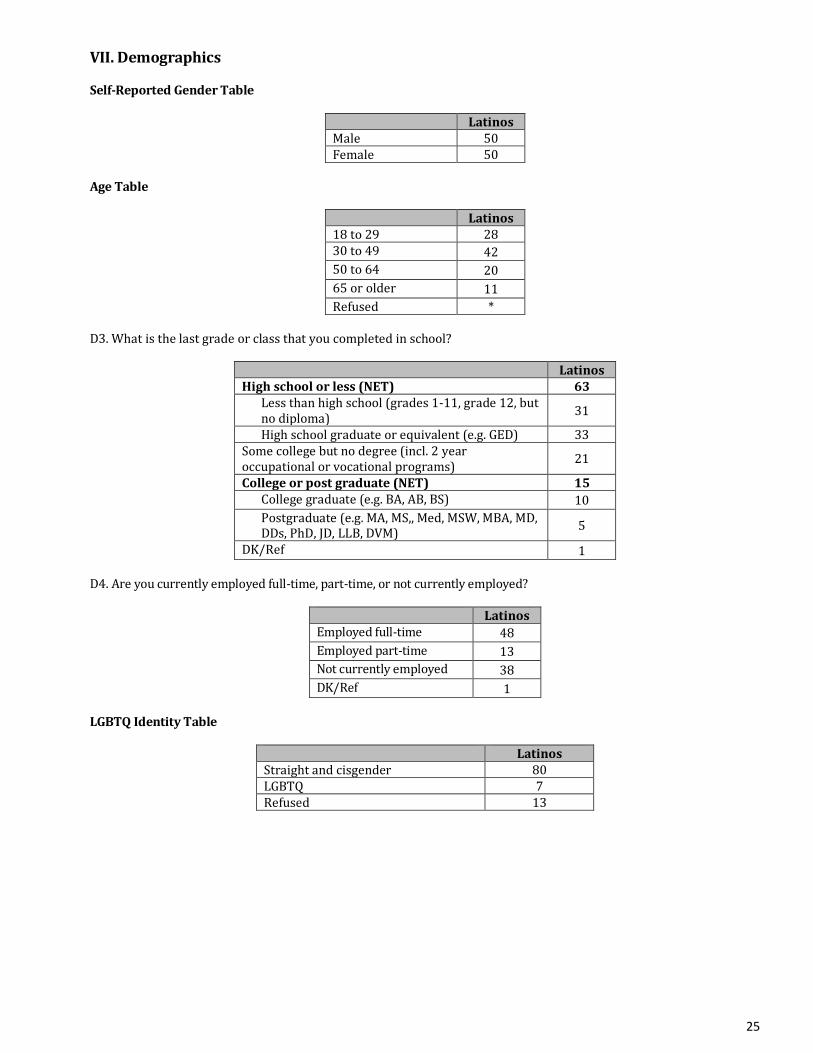
25
VII. Demographics Self-Reported Gender Table
Latinos Male 50 Female 50
Age Table
Latinos 18 to 29 28 30 to 49 42 50 to 64 20 65 or older 11 Refused *
D3. What is the last grade or class that you completed in school?
Latinos High school or less (NET) 63
Less than high school (grades 1-11, grade 12, but no diploma) 31
High school graduate or equivalent (e.g. GED) 33 Some college but no degree (incl. 2 year occupational or vocational programs) 21
College or post graduate (NET) 15 College graduate (e.g. BA, AB, BS) 10 Postgraduate (e.g. MA, MS,, Med, MSW, MBA, MD, DDs, PhD, JD, LLB, DVM) 5
DK/Ref 1 D4. Are you currently employed full-time, part-time, or not currently employed?
Latinos Employed full-time 48 Employed part-time 13 Not currently employed 38 DK/Ref 1
LGBTQ Identity Table
Latinos Straight and cisgender 80 LGBTQ 7 Refused 13

26
D5. Were you born in the United States, on the island of Puerto Rico, or in another country?
Latinos Non-immigrant (NET) 49
U.S. 46 Puerto Rico 3
Another country 51 DK/Ref *
D6. How about you and your family’s heritage. Are you Mexican, Puerto Rican, Cuban, Dominican, or are you and your ancestors from another country?
Latinos Mexican 59 Puerto Rican 9 Cuban 3 Dominican 5 Central American (NET) 12
Salvadoran 5 Other Central American 7
South American 6 European/Spanish 2 Other 2 DK/Ref 2

27
D11. Are you currently married, living with a partner, divorced, separated, widowed or have you never been married?
Latinos Married 45 Living with a partner 8 Divorced 7 Separated 7 Widowed 4 Never been married 29 Refused *
D12/D12a/D12b Income Summary Table
Latinos <$25,000 per year 39 $25,000 to under $50,000 24 $50,000 to under $75,000 8 $75,000 or more 17 Unspecified under $100,000 5 Don’t know 5 Refused 2
D15. In politics today, do you consider yourself a Republican, Democrat, an Independent, or what?
Latinos Republican 14 Democrat 39 Independent 28 Other 8 DK/Ref 11