discovering the configurations of the factors affecting … · discovering the configurations of...
TRANSCRIPT

Academy of Entrepreneurship Journal Volume 23, Issue 2, 2017
1 1528-2686-23-2-103
DISCOVERING THE CONFIGURATIONS OF THE
FACTORS AFFECTING COMMUNITY WELL-BEING IN
KOREA USING QCA METHOD
Young-Chool Choi, Chungbuk National University
Ji-Hyun Jang, Sangmyung University
ABSTRACT
This study was conducted to ascertain what combinations of conditions are associated
with community well-being, which is crucial for enhancing national well-being in every country,
and to put forward policy suggestions whereby each local authority may raise the level of its
community well-being. The community well-being score of 17 second-tier local authorities at
provincial level in Korea was selected as an indicator of community well-being, and some
independent variables such as per-capita GRDP and local financial autonomy were included in
the analysis. The Qualitative Comparative Analysis (QCA) method was employed to analyze the
complex causal relationships among the factors affecting community well-being. The research
results show that there is one significant combination of variables affecting community
well-being. They suggest that each local authority should endeavor to enhance its own
community’s well-being, considering how the different factors associated with this relate to each
other.
Keywords: Community Well-Being, Qualitative Comparative Analysis (QCA)
INTRODUCTION
Many factors affecting well-being operate at community level, not at central level. For
example, levels of employment, access to education, and quality of environment vary by
community. Differences between communities within a country are as important as differences
between countries (OECD, 2013). Recently, there has been a consensus that macro-economic
statistics on well-being at national level do not reflect the genuine well-being of people and their
aspirations. Accordingly, it is said that there is need for evidence enabling us to explain people’s
well-being in a variety of areas. From this point of view, in order for us to show the full picture
of people’s well-being, we need to explain how people think of the community in which they live,
how they respond when the community does not meet their needs, and whether access to services
influences people’s choices of community to live in. In this regard, we can say that investigating
community well-being can contribute toward discovering problems hidden behind well-being at
national level. An overview of well-being at community level helps communities with low levels
of well-being benchmark other communities with high levels of well-being within a country or in
other countries. Furthermore, indicators of community well-being help policymakers and
academics evaluate the extent to which community achievements and performances affect
national prosperity and diverse social challenges. Understanding well-being in communities
Academy of Entrepreneurship Journal Volume 23, Issue 2, 2017
2 1528-2686-23-2-103
where people live and comprehending what factors determine levels of community well-being
matters to community policymaking and design at both central and local level, because
policymakers can thereby identify which elements are poor in communities with low levels of
well-being and what should be done to strengthen them.
Under this background, this research aims to identify which communities can be
included in the category of those meeting the requirements for community well-being in Korea,
to discover the combinations of conditions that affect those communities which have deficiencies
in the area of community well-being, and to t forward policy suggestions for policymakers in
each community aimed at enhancing that community’s well-being.
THEORETICAL DISCUSSION
The lexical meaning of well-being is ‘a state of emotion reaching avid pleasure through
satisfaction’ (Kim et al., 2008). The concept of well-being has been defined differently at
different times according to different philosophies and religious perspectives. Scholars argue that
the factors affecting well-being are diverse, and that their effects and relationships differ. In
determining a well-being index at national or individual level, economic factors have been
considered important in the past. Recently, however, other factors, such as social or
environmental factors, have been regarded as essential, indicating that perspectives on
well-being and methods of measuring it vary according to period. In addition, in certain periods
objective conditions have primarily been taken into account in measuring well-being, whereas at
other times subjective conditions have been looked upon as essential. It is also true that many
scholars have been conducting research work investigating precisely what well-being and a state
of well-being mean (Choi and Moon, 2011).
The word ‘well-being’ has sometimes been used interchangeably with ‘happiness’,
‘quality of life’, ‘subjective happiness’, ‘life satisfaction’, and ‘psychological happiness’. More
specifically, the word has the following three characteristics. First, it has subjective aspects.
Scholars argue that well-being exists within the scope of individual experience. This means that
external conditions such as health, wealth, prestige, and physical comfort may affect well-being,
but they do not include the intrinsic elements of it. Second, well-being reflects positive and
optimistic aspects relating to life (Choi, 2008). Third, well-being includes an evaluation of the
general aspects of individual life. Even though well-being seems to embrace specific aspects of
life, its core value relates to an evaluation of general aspects of individual life.
A community can be defined as a small or large social unit (a group of people) who have
something in common, such as norms, religion, values, or identity. Often - but not always -
communities share a sense of place that is situated in a given geographical area (e.g. a country,
village, town, or neighborhood). Durable relations that extend beyond immediate genealogical
ties also define a sense of community. People tend to define those social ties as important to their
identity, practice, and roles in social institutions like family, home, work, government, society, or
humanity, at large. Although communities are usually small relative to personal social ties
(micro-level "community" may also refer to large group affiliations (or macro-level), such as
Academy of Entrepreneurship Journal Volume 23, Issue 2, 2017
3 1528-2686-23-2-103
national communities, international communities, and virtual communities (Wikipedia; Kee et al.,
2016). Here, we define community well-being as a state of condition reaching avid pleasure
through satisfaction at individual level as well as at community level, reflecting individual and
collective interests together within community (Kee et al., 2016).
From an empirical point of view, some studies of community well-being and community
development have been conducted to date. Most of these have focused primarily on people’s
satisfaction in diverse areas of their lives, but without considering the levels of disparity in their
satisfaction. In other words, mean scores for satisfaction have been considered, but differences in
satisfaction levels have not been. Something that has also not been considered is people’s
perceptions of their community, especially in terms of conditions affecting diverse areas of their
lives. Most studies have focused on people’s perceptions of their individual satisfaction levels,
not on their perception of their communities themselves. This study, based on the definition of
community well-being mentioned above, attempts to remedy these shortcomings, considering the
differences among people’s satisfaction with life-areas such as health and education as well as
the mean scores for their satisfaction with different life-areas. It also includes an analysis of
people’ perceptions of their individual levels of satisfaction with specific life-areas, and of their
satisfaction with their communities.
RESEARCH DESIGN
The analysis subjects of this research are the 17 regions in Korea. The sample consisted
of 2,723 respondents living in Korea, collected by Young-hwa Kee and Seung-Jong Lee’s SSK
research team in 2015. The questionnaire consists of six dimensions of capital. These are:
Human Capital; Economic Capital; Natural Capital; Infrastructural Capital; Cultural Capital; and
Social Capital. Human Capital consists of three sub-dimensions (health, welfare, education), and
includes nine questions (indicators). Economic Capital includes six questions, Natural Capital
five questions, Infrastructural Capital six questions, and Social Capital eight questions. For the
analysis, Qualitative Comparative Analysis (QCA) was employed. Qualitative Comparative
Analysis (QCA) was used. QCA is a comparative technique (Vink and Van Vliet, 2009) that is
used to explain large social events concisely by using a small number of cases (5-55). Although
QCA does not provide statistical results for generalization, it is a useful method that categorizes
cases by their characteristics in a simple manner (Luck et al., 2006; Poveda, 2013; Rihoux,
2006). QCA, developed by Ragin (1987), has not provoked much interest until now. The main
purpose of this method is to provide meaningful and concise interpretations on the causal
patterns of the cases that are examined. This method aims to find the various causal conditions or
condition factors that can fundamentally affect the result. That is, it begins with the assumption
that one outcome does not belong to a set of one variable, but can belong to a set of many
variables (Wagner and Shneider, 2010; Rihoux, 2006). Other characteristics of this methodology
are the use of set theory, Boolean algebra, its formation of a truth table, and a concise approach
to research data (Donnelly and Wiechula, 2013). The QCA method is of three broad kinds: crisp
set QCA (CSQCA), fuzzy set QCA (FSQCA), and multi-value QCA (MVQCA). This research
will use CSQCA, since this method processes data by changing independent variables and
dependent variables into 0 or 1 according to a certain threshold. It is more convenient to set a
threshold and categorize the independent values that affect the well-being score of communities

Academy of Entrepreneurship Journal Volume 23, Issue 2, 2017
4 1528-2686-23-2-103
(here second tier regions) included in this research into 0 and 1. This research will use the
CSQCA program and the TOSMANA program.
ANALYSIS
It is hypothesized that the best community in terms of community well-being is one in
which people’s satisfaction (mean score) in the six life-areas and with their community is high,
and where differences (s.d.) in their levels of satisfaction with these life-areas and with their
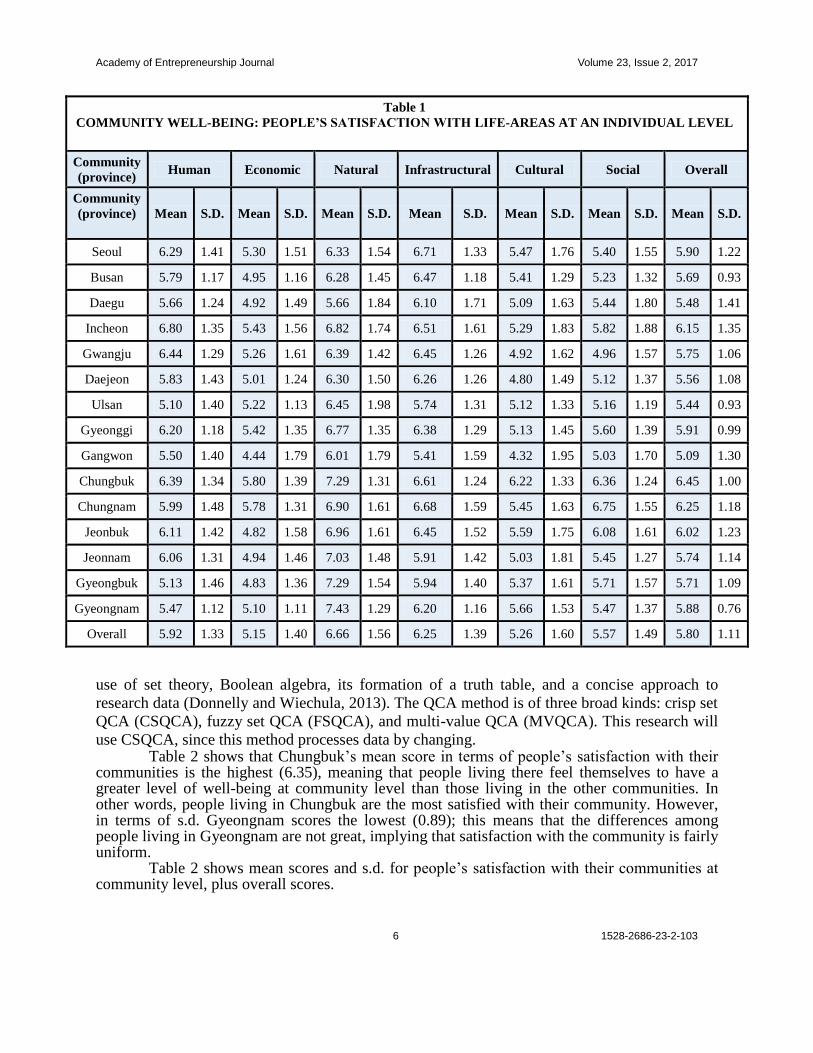
community are low. Table 1 shows the mean scores and s.d. (standard deviations) for people’s
satisfaction in the six life-areas at individual level by 17 communities (provinces), and overall
scores. It shows that Chungbuk has the highest mean score (6.45) in terms of overall score,
followed by Chungnam (6.25). In terms of s.d. (differences in people’s satisfaction levels),
Gyeongnam scores the lowest, implying that people living there feel they live together in similar
ways and on an equal basis.
The word ‘well-being’ has sometimes been used interchangeably with ‘happiness’,
‘quality of life’, ‘subjective happiness’, ‘life satisfaction’, and ‘psychological happiness’. More
specifically, the word has the following three characteristics. First, it has subjective aspects.
Scholars argue that well-being exists within the scope of individual experience. This means that
external conditions such as health, wealth, prestige, and physical comfort may affect well-being,
but they do not include the intrinsic elements of it. Second, well-being reflects positive and
optimistic aspects relating to life (Choi, 2008). Third, well-being includes an evaluation of the
general aspects of individual life. Even though well-being seems to embrace specific aspects of
life, its core value relates to an evaluation of general aspects of individual life.
A community can be defined as a small or large social unit (a group of people) who have
something in common, such as norms, religion, values, or identity. Often - but not always -
communities share a sense of place that is situated in a given geographical area (e.g. a country,
village, town, or neighborhood). Durable relations that extend beyond immediate genealogical
ties also define a sense of community. People tend to define those social ties as important to their
identity, practice, and roles in social institutions like family, home, work, government, society, or
humanity, at large. Although communities are usually small relative to personal social ties
(micro-level "community" may also refer to large group affiliations (or macro-level), such as
national communities, international communities, and virtual communities (Wikipedia; Kee et al.,
2016). Here, we define community well-being as a state of condition reaching avid pleasure
through satisfaction at individual level as well as at community level, reflecting individual and
collective interests together within community (Kee et al., 2016).
From an empirical point of view, some studies of community well-being and community
development have been conducted to date. Most of these have focused primarily on people’s
satisfaction in diverse areas of their lives, but without considering the levels of disparity in their
satisfaction. In other words, mean scores for satisfaction have been considered, but differences in
satisfaction levels have not been. Something that has also not been considered is people’s
perceptions of their community, especially in terms of conditions affecting diverse areas of their
lives. Most studies have focused on people’s perceptions of their individual satisfaction levels,
not on their perception of their communities themselves. This study, based on the definition of
community well-being mentioned above, attempts to remedy these shortcomings, considering the

Academy of Entrepreneurship Journal Volume 23, Issue 2, 2017
5 1528-2686-23-2-103
differences among people’s satisfaction with life-areas such as health and education as well as
the mean scores for their satisfaction with different life-areas. It also includes an analysis of
people’ perceptions of their individual levels of satisfaction with specific life-areas, and of their
satisfaction with their communities.
RESEARCH DESIGN
The analysis subjects of this research are the 17 regions in Korea. The sample consisted
of 2,723 respondents living in Korea, collected by Young-hwa Kee and Seung-Jong Lee’s SSK
research team in 2015. The questionnaire consists of six dimensions of capital. These are:
Human Capital; Economic Capital; Natural Capital; Infrastructural Capital; Cultural Capital; and
Social Capital. Human Capital consists of three sub-dimensions (health, welfare, education), and
includes nine questions (indicators). Economic Capital includes six questions, Natural Capital
five questions, Infrastructural Capital six questions, and Social Capital eight questions. For the
analysis, Qualitative Comparative Analysis (QCA) was employed. Qualitative Comparative
Analysis (QCA) was used. QCA is a comparative technique (Vink and Van Vliet, 2009) that is
used to explain large social events concisely by using a small number of cases (5-55). Although
QCA does not provide statistical results for generalization, it is a useful method that categorizes
cases by their characteristics in a simple manner (Luck et al., 2006; Poveda, 2013; Rihoux, 2006).
QCA, developed by Ragin (1987), has not provoked much interest until now. The main purpose
of this method is to provide meaningful and concise interpretations on the causal patterns of the
cases that are examined. This method aims to find the various causal conditions or condition
factors that can fundamentally affect the result. That is, it begins with the assumption that one
outcome does not belong to a set of one variable, but can belong to a set of many variables
(Wagner and Shneider, 2010; Rihoux, 2006). Other characteristics of this methodology are the.
Academy of Entrepreneurship Journal Volume 23, Issue 2, 2017
6 1528-2686-23-2-103
Table 1
COMMUNITY WELL-BEING: PEOPLE’S SATISFACTION WITH LIFE-AREAS AT AN INDIVIDUAL LEVEL
Community
(province) Human Economic Natural Infrastructural Cultural Social Overall
Community
(province)
Mean S.D. Mean S.D. Mean S.D. Mean S.D. Mean S.D. Mean S.D. Mean S.D.
Seoul 6.29 1.41 5.30 1.51 6.33 1.54 6.71 1.33 5.47 1.76 5.40 1.55 5.90 1.22
Busan 5.79 1.17 4.95 1.16 6.28 1.45 6.47 1.18 5.41 1.29 5.23 1.32 5.69 0.93
Daegu 5.66 1.24 4.92 1.49 5.66 1.84 6.10 1.71 5.09 1.63 5.44 1.80 5.48 1.41
Incheon 6.80 1.35 5.43 1.56 6.82 1.74 6.51 1.61 5.29 1.83 5.82 1.88 6.15 1.35
Gwangju 6.44 1.29 5.26 1.61 6.39 1.42 6.45 1.26 4.92 1.62 4.96 1.57 5.75 1.06
Daejeon 5.83 1.43 5.01 1.24 6.30 1.50 6.26 1.26 4.80 1.49 5.12 1.37 5.56 1.08
Ulsan 5.10 1.40 5.22 1.13 6.45 1.98 5.74 1.31 5.12 1.33 5.16 1.19 5.44 0.93
Gyeonggi 6.20 1.18 5.42 1.35 6.77 1.35 6.38 1.29 5.13 1.45 5.60 1.39 5.91 0.99
Gangwon 5.50 1.40 4.44 1.79 6.01 1.79 5.41 1.59 4.32 1.95 5.03 1.70 5.09 1.30
Chungbuk 6.39 1.34 5.80 1.39 7.29 1.31 6.61 1.24 6.22 1.33 6.36 1.24 6.45 1.00
Chungnam 5.99 1.48 5.78 1.31 6.90 1.61 6.68 1.59 5.45 1.63 6.75 1.55 6.25 1.18
Jeonbuk 6.11 1.42 4.82 1.58 6.96 1.61 6.45 1.52 5.59 1.75 6.08 1.61 6.02 1.23
Jeonnam 6.06 1.31 4.94 1.46 7.03 1.48 5.91 1.42 5.03 1.81 5.45 1.27 5.74 1.14
Gyeongbuk 5.13 1.46 4.83 1.36 7.29 1.54 5.94 1.40 5.37 1.61 5.71 1.57 5.71 1.09
Gyeongnam 5.47 1.12 5.10 1.11 7.43 1.29 6.20 1.16 5.66 1.53 5.47 1.37 5.88 0.76
Overall 5.92 1.33 5.15 1.40 6.66 1.56 6.25 1.39 5.26 1.60 5.57 1.49 5.80 1.11
use of set theory, Boolean algebra, its formation of a truth table, and a concise approach to
research data (Donnelly and Wiechula, 2013). The QCA method is of three broad kinds: crisp set
QCA (CSQCA), fuzzy set QCA (FSQCA), and multi-value QCA (MVQCA). This research will
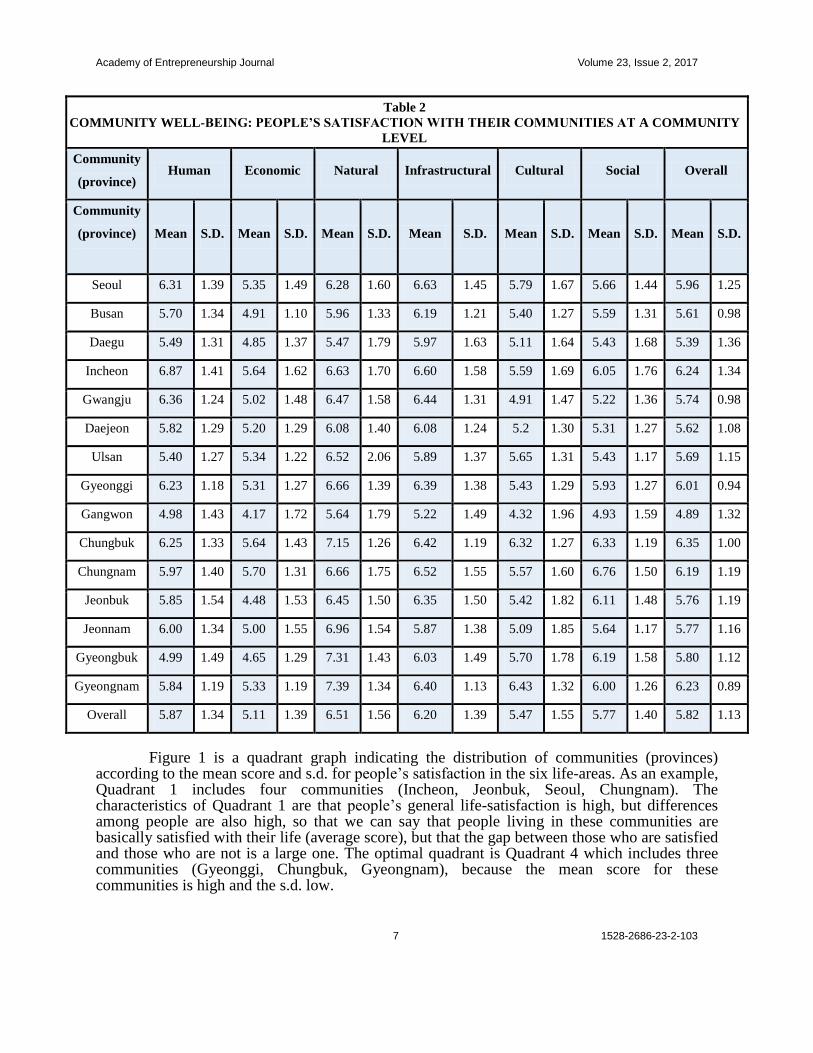
use CSQCA, since this method processes data by changing. Table 2 shows that Chungbuk’s mean score in terms of people’s satisfaction with their communities is the highest (6.35), meaning that people living there feel themselves to have a greater level of well-being at community level than those living in the other communities. In other words, people living in Chungbuk are the most satisfied with their community. However, in terms of s.d. Gyeongnam scores the lowest (0.89); this means that the differences among people living in Gyeongnam are not great, implying that satisfaction with the community is fairly uniform. Table 2 shows mean scores and s.d. for people’s satisfaction with their communities at community level, plus overall scores.
Academy of Entrepreneurship Journal Volume 23, Issue 2, 2017
7 1528-2686-23-2-103
Table 2
COMMUNITY WELL-BEING: PEOPLE’S SATISFACTION WITH THEIR COMMUNITIES AT A COMMUNITY
LEVEL
Community
(province) Human Economic Natural Infrastructural Cultural Social Overall
Community
(province)
Mean S.D. Mean S.D. Mean S.D. Mean S.D. Mean S.D. Mean S.D. Mean S.D.
Seoul 6.31 1.39 5.35 1.49 6.28 1.60 6.63 1.45 5.79 1.67 5.66 1.44 5.96 1.25
Busan 5.70 1.34 4.91 1.10 5.96 1.33 6.19 1.21 5.40 1.27 5.59 1.31 5.61 0.98
Daegu 5.49 1.31 4.85 1.37 5.47 1.79 5.97 1.63 5.11 1.64 5.43 1.68 5.39 1.36
Incheon 6.87 1.41 5.64 1.62 6.63 1.70 6.60 1.58 5.59 1.69 6.05 1.76 6.24 1.34
Gwangju 6.36 1.24 5.02 1.48 6.47 1.58 6.44 1.31 4.91 1.47 5.22 1.36 5.74 0.98
Daejeon 5.82 1.29 5.20 1.29 6.08 1.40 6.08 1.24 5.2 1.30 5.31 1.27 5.62 1.08
Ulsan 5.40 1.27 5.34 1.22 6.52 2.06 5.89 1.37 5.65 1.31 5.43 1.17 5.69 1.15
Gyeonggi 6.23 1.18 5.31 1.27 6.66 1.39 6.39 1.38 5.43 1.29 5.93 1.27 6.01 0.94
Gangwon 4.98 1.43 4.17 1.72 5.64 1.79 5.22 1.49 4.32 1.96 4.93 1.59 4.89 1.32
Chungbuk 6.25 1.33 5.64 1.43 7.15 1.26 6.42 1.19 6.32 1.27 6.33 1.19 6.35 1.00
Chungnam 5.97 1.40 5.70 1.31 6.66 1.75 6.52 1.55 5.57 1.60 6.76 1.50 6.19 1.19
Jeonbuk 5.85 1.54 4.48 1.53 6.45 1.50 6.35 1.50 5.42 1.82 6.11 1.48 5.76 1.19
Jeonnam 6.00 1.34 5.00 1.55 6.96 1.54 5.87 1.38 5.09 1.85 5.64 1.17 5.77 1.16
Gyeongbuk 4.99 1.49 4.65 1.29 7.31 1.43 6.03 1.49 5.70 1.78 6.19 1.58 5.80 1.12
Gyeongnam 5.84 1.19 5.33 1.19 7.39 1.34 6.40 1.13 6.43 1.32 6.00 1.26 6.23 0.89
Overall 5.87 1.34 5.11 1.39 6.51 1.56 6.20 1.39 5.47 1.55 5.77 1.40 5.82 1.13
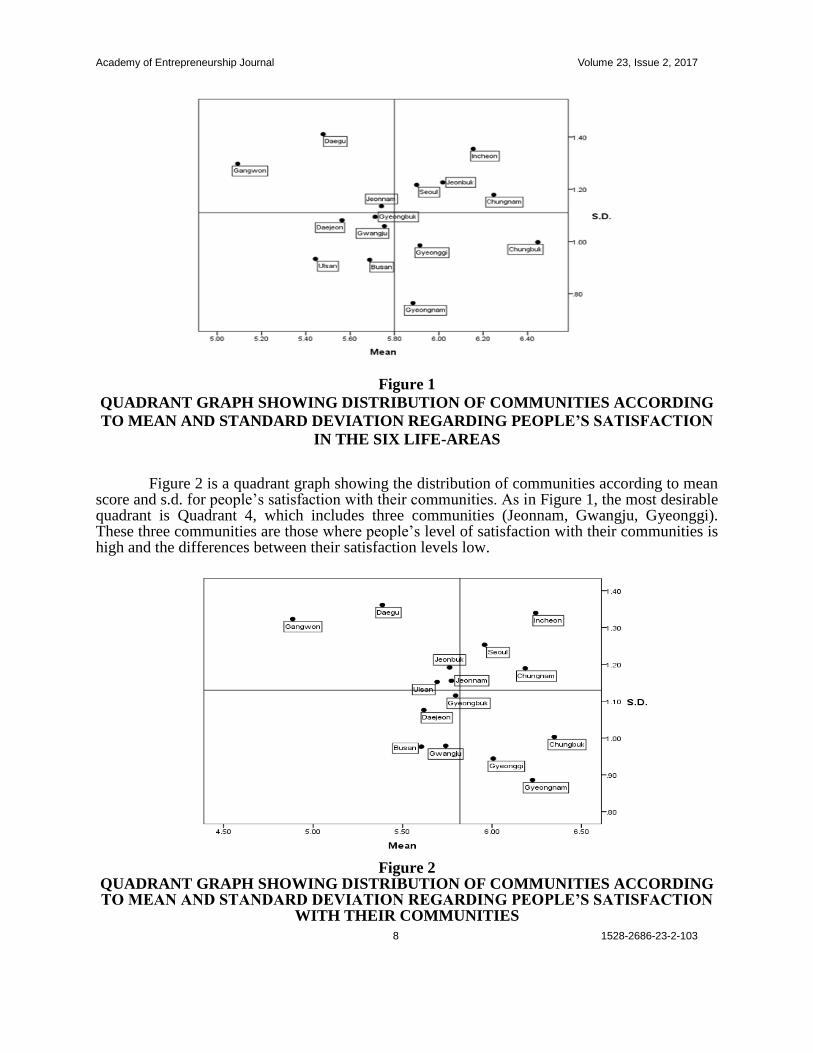
Figure 1 is a quadrant graph indicating the distribution of communities (provinces) according to the mean score and s.d. for people’s satisfaction in the six life-areas. As an example, Quadrant 1 includes four communities (Incheon, Jeonbuk, Seoul, Chungnam). The characteristics of Quadrant 1 are that people’s general life-satisfaction is high, but differences among people are also high, so that we can say that people living in these communities are basically satisfied with their life (average score), but that the gap between those who are satisfied and those who are not is a large one. The optimal quadrant is Quadrant 4 which includes three communities (Gyeonggi, Chungbuk, Gyeongnam), because the mean score for these communities is high and the s.d. low.
Academy of Entrepreneurship Journal Volume 23, Issue 2, 2017
8 1528-2686-23-2-103
Figure 1
QUADRANT GRAPH SHOWING DISTRIBUTION OF COMMUNITIES ACCORDING
TO MEAN AND STANDARD DEVIATION REGARDING PEOPLE’S SATISFACTION
IN THE SIX LIFE-AREAS
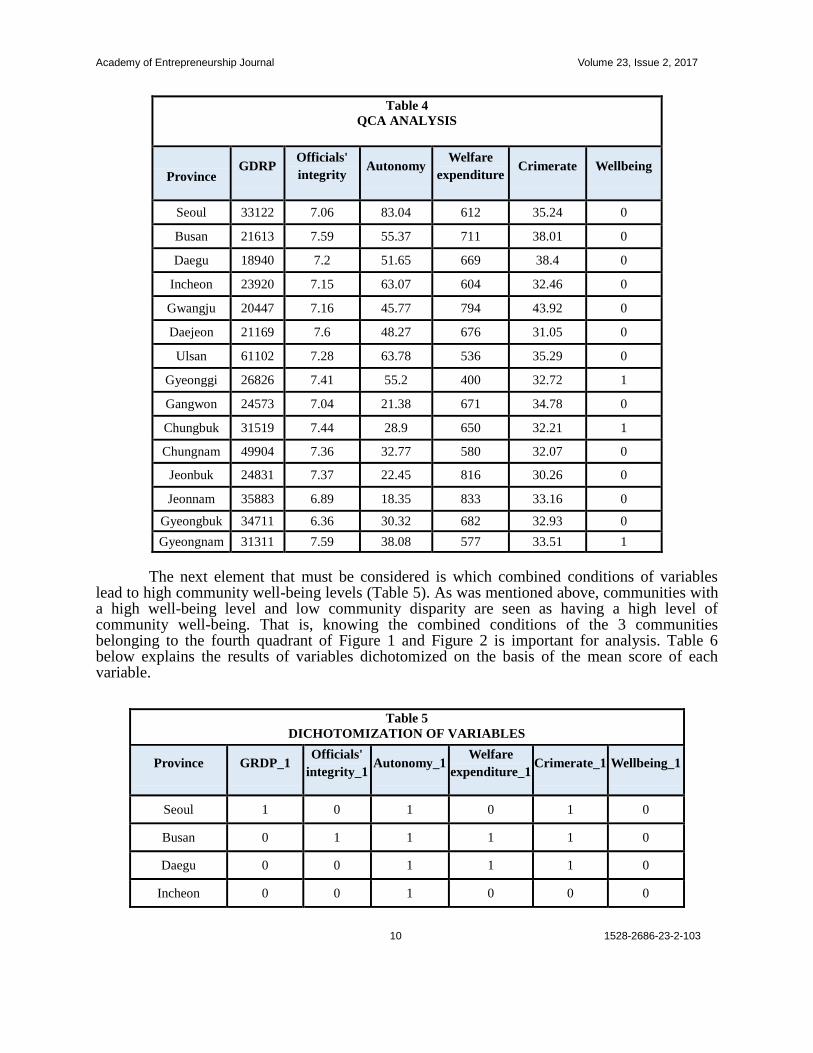
Figure 2 is a quadrant graph showing the distribution of communities according to mean score and s.d. for people’s satisfaction with their communities. As in Figure 1, the most desirable quadrant is Quadrant 4, which includes three communities (Jeonnam, Gwangju, Gyeonggi). These three communities are those where people’s level of satisfaction with their communities is high and the differences between their satisfaction levels low.
Figure 2 QUADRANT GRAPH SHOWING DISTRIBUTION OF COMMUNITIES ACCORDING TO MEAN AND STANDARD DEVIATION REGARDING PEOPLE’S SATISFACTION
WITH THEIR COMMUNITIES

Academy of Entrepreneurship Journal Volume 23, Issue 2, 2017
9 1528-2686-23-2-103
Table 3 below shows how people are satisfied with their individual lives and with their communities. Note. A value of 1 for each community in Mean means that a community’s mean
satisfaction score is higher than the average for all communities, and a value of 0 means that its
score is lower than the average for all communities. Similarly, a value of 1 for each community
in S.D. means that the S.D. value for each community is higher than the average for all
communities, and a value of 0 means that its score is lower than the average for all communities.
Comprehensively speaking, the most desirable community in terms of community
well-being is one which can meet four criteria: high levels of satisfaction with the life-areas; low
differences in levels of satisfaction with the life-areas; high levels of satisfaction with the
community; and low differences in levels of satisfaction with the community. There is only one
such community in Korea: Gyeonggi, with a value of 1,0,1,0, as shown in Table 3.
Table 3
PEOPLE’S SATISFACTION WITH THEIR LIVES AND COMMUNITIES
Community
(province)
Satisfaction with lives Satisfaction with communities Overall
Mean S.D. Mean S.D.
Seoul 1 1 1 1 0
Busan 0 0 0 0 0
Daegu 0 1 0 1 0
Incheon 1 1 1 1 0
Gwangju 0 0 0 0 0
Daejeon 0 0 0 0 0
Ulsan 0 0 0 1 0
Gyeonggi 1 0 1 0 1
Gangwon 0 1 0 1 0
Chungbuk 1 0 1 0 1
Chungnam 1 1 1 1 0
Jeonbuk 1 1 0 1 0
Jeonnam 0 1 0 1 0
Gyeongbuk 0 0 0 0 0
Gyeongnam 1 0 1 0 1
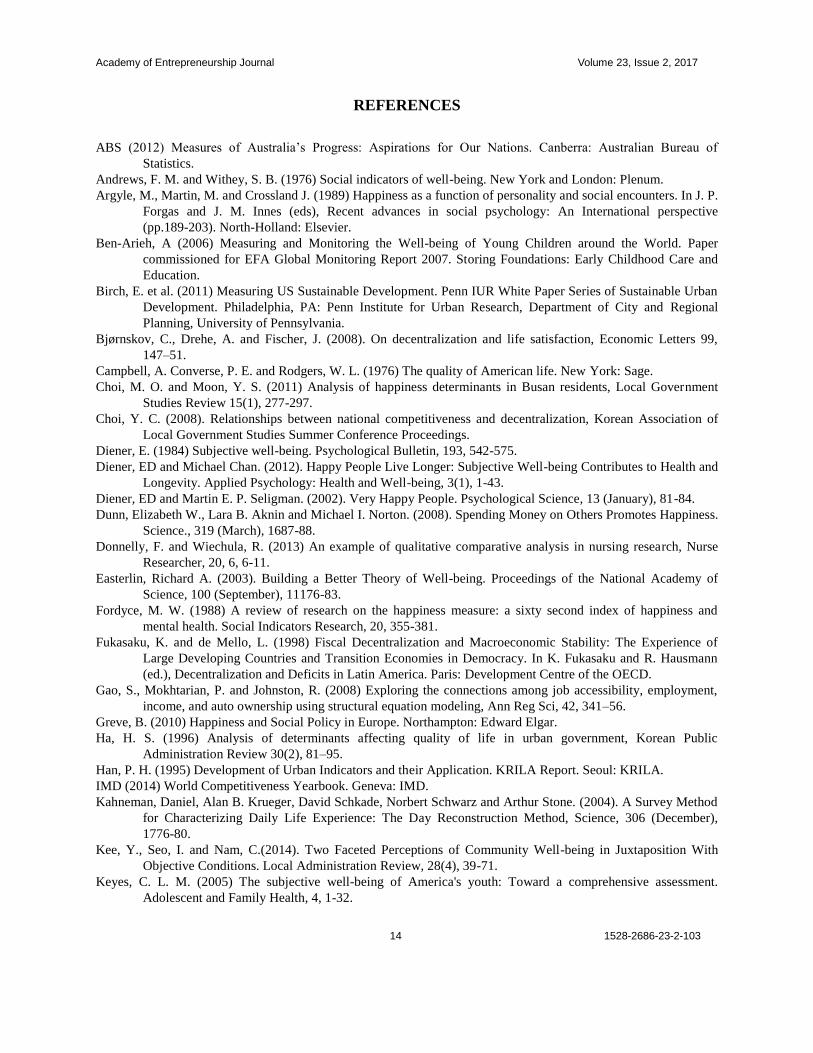
Table 4 below shows the values of variables included in the QCA.
Table 3
Academy of Entrepreneurship Journal Volume 23, Issue 2, 2017
10 1528-2686-23-2-103
Table 4
QCA ANALYSIS
Province GDRP
Officials'
integrity Autonomy
Welfare
expenditure Crimerate Wellbeing
Seoul 33122 7.06 83.04 612 35.24 0
Busan 21613 7.59 55.37 711 38.01 0
Daegu 18940 7.2 51.65 669 38.4 0
Incheon 23920 7.15 63.07 604 32.46 0
Gwangju 20447 7.16 45.77 794 43.92 0
Daejeon 21169 7.6 48.27 676 31.05 0
Ulsan 61102 7.28 63.78 536 35.29 0
Gyeonggi 26826 7.41 55.2 400 32.72 1
Gangwon 24573 7.04 21.38 671 34.78 0
Chungbuk 31519 7.44 28.9 650 32.21 1
Chungnam 49904 7.36 32.77 580 32.07 0
Jeonbuk 24831 7.37 22.45 816 30.26 0
Jeonnam 35883 6.89 18.35 833 33.16 0
Gyeongbuk 34711 6.36 30.32 682 32.93 0
Gyeongnam 31311 7.59 38.08 577 33.51 1
The next element that must be considered is which combined conditions of variables lead to high community well-being levels (Table 5). As was mentioned above, communities with a high well-being level and low community disparity are seen as having a high level of community well-being. That is, knowing the combined conditions of the 3 communities belonging to the fourth quadrant of Figure 1 and Figure 2 is important for analysis. Table 6 below explains the results of variables dichotomized on the basis of the mean score of each variable.
Table 5
DICHOTOMIZATION OF VARIABLES
Province GRDP_1 Officials'
integrity_1 Autonomy_1
Welfare
expenditure_1 Crimerate_1 Wellbeing_1
Seoul 1 0 1 0 1 0
Busan 0 1 1 1 1 0
Daegu 0 0 1 1 1 0
Incheon 0 0 1 0 0 0

Academy of Entrepreneurship Journal Volume 23, Issue 2, 2017
11 1528-2686-23-2-103
Gwangju 0 0 1 1 1 0
Daejeon 0 1 1 1 0 0
Ulsan 1 1 1 0 1 0
Gyeonggi 0 1 1 0 0 1
Gangwon 0 0 0 1 1 0
Chungbuk 1 1 0 0 0 1
Chungnam 1 1 0 0 0 0
Jeonbuk 0 1 0 1 0 0
Jeonnam 1 0 0 1 0 0
Gyeongbuk 1 0 0 1 0 0
Gyeongnam 1 1 0 0 0 1
In a truth table (Table 6) produced using the TOSMANA 1.3 program, various conditions can be compared against each other, and ideally against an outcome, a high level of community well-being. The Venn diagrams presented in Figure 3 illustrate the logical relationships between conditions. Each space in a diagram can be color coded, shaded or patterned. Figure 3 is a graphical depiction of the configurations from the truth values presented in Table 6, and was produced by TOSMANA 1.3’s ‘visualizer’ tool. Note. Variables starting with a large capital letter have a positive meaning or a value of 1,
and those starting with a small capital letter have a negative meaning or a value of 0. As the truth table analysis results indicate, there is 1 sufficient conditions that affect a high community well-being level. It is the configuration in which Gyeonggi is included, which is formed of a low GRDP level, a low level of welfare expenditure, and a low level of crime rate
Table 6
TRUTH TABLE ANALYSIS
Truth Table:
V1 GRDP_1 V2 Officials’ Integrity-1
V3 Autonomy_1 V4 Welfare Expenditure_1
V5 Crimerate_1
o Wellbing_1 Id Province

Academy of Entrepreneurship Journal Volume 23, Issue 2, 2017
12 1528-2686-23-2-103
Figure 1
Venn Diagram
The research results implies that provinces with low levels of community well-being
need to benchmark province with high level of community well-being (Table 1) and
socio-economic conditions similar to their own, instead of trying to follow the provinces with
high levels of well-being but socio-economic conditions which are different from theirs.
CONCLUSION The main purpose of this study is to demonstrate specific configuration models
explaining community well-being in 17 provinces in Korea, in order to (1) portray the causal
connections among factors affecting community well-being and (2) to put forward policy
implications whereby each province can strengthen its community well-being level. Following
the requirements of the QCA model specification, we converted the actual value of each variable
to membership (1) and non-membership score (0) using the TOSMANA software program,
produced a truth table, and derived the one configuration explaining community well-being in
Korean provinces.
QCA is an alternative approach to the analysis of community well-being that involves
truth tables, Boolean algebra, and a search for a greater understanding of causal conditions. The
use of QCA in community well-being studies has rarely been reported, and there are likely to be
conceptual and paradigmatic challenges to its adoption in some settings. The potential of QCA to
refocus research questions and to offer a logical interpretation of combinations of qualitative and

Academy of Entrepreneurship Journal Volume 23, Issue 2, 2017
13 1528-2686-23-2-103
quantitative data may be especially useful for many small case studies.
Some limitations of this study can be identified. First, it is important to remember that
this study has focused primarily on 17 provinces in Korea. Even though this research result
supports the theoretical assumptions, it could result in a narrow view of the effects of community
well-being effects, one that it might not be possible to extrapolate to other country groups less
sensitive to the influence of economic and financial factors. Second, many variables exist which
could influence the variables considered in the study, but which are not present in the study’s
conceptual model. More interesting and valid conclusions could be drawn from a more global
study that could consider social and non-economic factors, such as civic organizational structure.
The research results are summarized as follows.
First, the most desirable community in terms of community well-being is one which can
meet four criteria: high levels of satisfaction with the life-areas; low differences in levels of
satisfaction with the life-areas; high levels of satisfaction with the community; and low
differences in levels of satisfaction with the community. There is only one such community in
Korea: Gyeonggi, with a value of 1,0,1,0, as shown in Table 3. Second, there is only one
configuration of variables affecting the most desirable community in terms of community
well-being. This paper emphasizes the importance of community well-being, describes the
usefulness of QCA in examining what causal conditions can influence high levels of community
well-being in Korea, and attempts to discover configurations associated with community
well-being. In this analysis, one configuration affecting community well-being, which is sets of
conditions suggesting a relationship or solution between the conditions, is derived. QCA is an
alternative approach to analysis in community well-being that involves truth tables, Boolean
algebra, and a search for a greater understanding of causal conditions. The use of QCA has rarely
been reported in regional well-being studies, and there are likely to be conceptual and
paradigmatic challenges to its adoption in some settings. Future research will be required to
measure not only objective community well-being but also subjective community well-being.
This research covered only the subjective aspect of community well-being and did not cover
objective community well-being. Research that measures community well-being using a
comprehensive approach that covers both objective and subjective aspects and discovers the
combined conditions that affect community well-being.is needed in the future.
To sum up, the research result implies that in order for the provinces with a low level of
community well-being to enhance their community well-being level, they may choose one path,
considering their socio-economic conditions in terms of similarity with conditions of the
province having high level of community well-being. This is because QCA here detects the
conditioning effects of independent variables and specifies different paths to the outcome, a high
level of community well-being.
ACKNOWLEDGEMENT This work was supported by the National Research Foundation of Korea Grant funded by the Korean Governmen(NRF-2015S1A5B8046954).
Academy of Entrepreneurship Journal Volume 23, Issue 2, 2017
14 1528-2686-23-2-103
REFERENCES
ABS (2012) Measures of Australia’s Progress: Aspirations for Our Nations. Canberra: Australian Bureau of
Statistics.
Andrews, F. M. and Withey, S. B. (1976) Social indicators of well-being. New York and London: Plenum.
Argyle, M., Martin, M. and Crossland J. (1989) Happiness as a function of personality and social encounters. In J. P.
Forgas and J. M. Innes (eds), Recent advances in social psychology: An International perspective
(pp.189-203). North-Holland: Elsevier.
Ben-Arieh, A (2006) Measuring and Monitoring the Well-being of Young Children around the World. Paper
commissioned for EFA Global Monitoring Report 2007. Storing Foundations: Early Childhood Care and
Education.
Birch, E. et al. (2011) Measuring US Sustainable Development. Penn IUR White Paper Series of Sustainable Urban
Development. Philadelphia, PA: Penn Institute for Urban Research, Department of City and Regional
Planning, University of Pennsylvania.
Bjørnskov, C., Drehe, A. and Fischer, J. (2008). On decentralization and life satisfaction, Economic Letters 99,
147–51.
Campbell, A. Converse, P. E. and Rodgers, W. L. (1976) The quality of American life. New York: Sage.
Choi, M. O. and Moon, Y. S. (2011) Analysis of happiness determinants in Busan residents, Local Government
Studies Review 15(1), 277-297.
Choi, Y. C. (2008). Relationships between national competitiveness and decentralization, Korean Association of
Local Government Studies Summer Conference Proceedings.
Diener, E. (1984) Subjective well-being. Psychological Bulletin, 193, 542-575.
Diener, ED and Michael Chan. (2012). Happy People Live Longer: Subjective Well-being Contributes to Health and
Longevity. Applied Psychology: Health and Well-being, 3(1), 1-43.
Diener, ED and Martin E. P. Seligman. (2002). Very Happy People. Psychological Science, 13 (January), 81-84.
Dunn, Elizabeth W., Lara B. Aknin and Michael I. Norton. (2008). Spending Money on Others Promotes Happiness.
Science., 319 (March), 1687-88.
Donnelly, F. and Wiechula, R. (2013) An example of qualitative comparative analysis in nursing research, Nurse
Researcher, 20, 6, 6-11.
Easterlin, Richard A. (2003). Building a Better Theory of Well-being. Proceedings of the National Academy of
Science, 100 (September), 11176-83.
Fordyce, M. W. (1988) A review of research on the happiness measure: a sixty second index of happiness and
mental health. Social Indicators Research, 20, 355-381.
Fukasaku, K. and de Mello, L. (1998) Fiscal Decentralization and Macroeconomic Stability: The Experience of
Large Developing Countries and Transition Economies in Democracy. In K. Fukasaku and R. Hausmann
(ed.), Decentralization and Deficits in Latin America. Paris: Development Centre of the OECD.
Gao, S., Mokhtarian, P. and Johnston, R. (2008) Exploring the connections among job accessibility, employment,
income, and auto ownership using structural equation modeling, Ann Reg Sci, 42, 341–56.
Greve, B. (2010) Happiness and Social Policy in Europe. Northampton: Edward Elgar.
Ha, H. S. (1996) Analysis of determinants affecting quality of life in urban government, Korean Public
Administration Review 30(2), 81–95.
Han, P. H. (1995) Development of Urban Indicators and their Application. KRILA Report. Seoul: KRILA.
IMD (2014) World Competitiveness Yearbook. Geneva: IMD.
Kahneman, Daniel, Alan B. Krueger, David Schkade, Norbert Schwarz and Arthur Stone. (2004). A Survey Method
for Characterizing Daily Life Experience: The Day Reconstruction Method, Science, 306 (December),
1776-80.
Kee, Y., Seo, I. and Nam, C.(2014). Two Faceted Perceptions of Community Well-being in Juxtaposition With
Objective Conditions. Local Administration Review, 28(4), 39-71.
Keyes, C. L. M. (2005) The subjective well-being of America's youth: Toward a comprehensive assessment.
Adolescent and Family Health, 4, 1-32.
Academy of Entrepreneurship Journal Volume 23, Issue 2, 2017
15 1528-2686-23-2-103
Kim Shin-Young and Baek Hye-Jeong. (2008) Developing Happiness Index for Korean Adolescents. Korean
Sociology, 42(6), 140-173.
Kim, S. K., Jang, Y. S., Cho, H. S. and Cha, M. S. (2008) Happiness Index and Happiness Determinants. Korea
Health and Society Research Institute Report. Seoul: KHSR.
Lee, T. J., Park, C. M. and Song, K. S. (2005) Analysis of quality of life of local residents, Korean Local
Government Review, 12(4), 75-92.
Lim, H. S. (1996) Conceptual discussions on quality of life, Korean Public Administration Review, 5(1), 5-18.
Lyubomirsky, S., Ken M. Sheldon and David A. Schkade. (2005) Pursuing Happiness: The Architecture of
Sustainable Change, Review of General Psychology, 9 (2), 111-131.
Mogilner, Cassie. (2010). The Pursuit of Happiness: Time, Money, and Social Connection, Psychological Science,
21 (1), 1348-54.
Mogilner, Cassie, Sepandar D. Kamvar and Jennifer Aaker. (2011). The Shifting Meaning of Happiness, Social
Psychological and Personality Science, 2 (4), 395-402.
OECD. (2013) OECD Guidelines on Measuring Subjective Well-being. Paris: OECD.
OECD. (2014) How’s Life in Your Region? Paris: OECD.
OECD. (2014). OECD Database. Paris: OECD.
Poveda, A.C. (2013) Qualitative comparative analysis: an application for industry. Qual Quant, 47, 1,315-1321.
Ragin, CC. (1987). The Comparative Method: Moving Beyond Qualitative and Quantitative Strategies. Berkeley
CA: University of California Press.
Rihoux, B. (2006) Qualitative comparative analysis (QCA) and related systematic methods: recent advances and
remaining challenges for social sciences research. International Sociology. 21, 5, 679–706.
Seligman, E. P. (2004) Can happiness be taught?, Daedalus, spring.
Soh, J. K. (1998) Definition of quality of life and its policy implications for urban policy, Regional Community
Development Review, 23(1), 65–84.
Tanzi, V. and Schuknecht, L. (1998) Can Small Governments Secure Economic and Social Wellbeing? In Grubel,
H. (ed.), How To Spend the Fiscal Dividend: What is the optimal size of government? Vancouver: Fraser
Institute.
UN (2013) World Happiness Report 2013. N.Y.: United Nations.
Van Boven, Leaf and Thomas Gilovich. (2003). To Do or To Have: That is the Question. Journal of Personality and
Social Psychology, 85(December), 1193-202.
Vink, M. P. and Van Vliet, O. (2009) Not quite crisp, not yet fuzzy? Assessing the potential and pitfalls of
multi-value QCA, Field Methods, 21, 3, 265–289.
Wager, C. and Schneider, C. (2010) Qualitative comparative analysis(QCA) and fuzzy sets: agenda for a research
approach and a data analysis technique. Comparative Sociology, 9. 376-396.
Wiechula, D. (2012) An example of qualitative comparative analysis in nursing research, Nurse Researcher, 206,
6-11.
World Economic Forum (2013) Global Competitiveness Report.
Xie, D., Zou, H. and Davoodi, H. (1999) Fiscal decentralization and economic growth in the United States, Journal
of Urban Economics, 45, 228–39.
Yang, Y. (2008) Social Inequalities in happiness in the U.S. 1972–2004: An Age-Period-Cohort Analysis. American
Sociological Review, 73(2), 204–226.
Zhang, T. and H. Zou (1998). Fiscal decentralization, public spending and economic growth in China, Journal of
Public Economics, 67(2), 221–240. http://www.businessdictionary.com/