discovering community structure by optimizing community quality metrics mingming chen department of...
TRANSCRIPT

Discovering Community Structure by Optimizing Community Quality Metrics
Mingming ChenDepartment of Computer ScienceRensselaer Polytechnic Institute
09/28/2015

2/50
Community Structure Community is the basic structure in many networks
Community is a group of people that are similar to each other Community is a group of nodes that are more densely
connected with each other than to the rest of the network
Disjoint community structure Each node belongs to one and only one community
Overlapping community structure Each node belongs to one or more communities
OverlappingDisjoint

3/50
Community StructureStrong community: each node has more connections inside its community than with the rest of the network
Weak community: the total internal degree of c exceeds its total external degree
Radicchi et al., Proc. Natl. Acad. Sci. 101, 2658–2663 (2004)

4/50
Zachary’s Karate Club Network
Nodes: Club membersEdges: Interactions

5/50
American College Football Network
Nodes: Football teamsEdges: Games played
NCAA conferences

6/50
Collaboration Network between Scientists at Santa Fe Institute
Research divisions
Nodes: ScientistsEdges: Collaboration

7/50
Facebook Network
High school Summer internship
Stanford (Squash)
Stanford (Basketball)
Nodes: Facebook usersEdges: Friendships
Social communities

8/50
Protein-Protein Interactions
Nodes: ProteinsEdges: Physical interactions
Functional modules

Modularity Density: A New Community Quality Metric
Mingming Chen, Tommy Nguyen, and Boleslaw K. Szymanski, “A New Metric for Quality of Network Community Structure”, ASE Human Journal, vol. 2, no. 4, Sep. 2013, pp. 226-240.
Mingming Chen, Tommy Nguyen, and Boleslaw K. Szymanski, “On Measuring the Quality of a Network Community Structure”, The ASE/IEEE International Conference on Social Computing (SocialCom), Washington D.C., Sep. 2013, pp. 122-127.
10/50
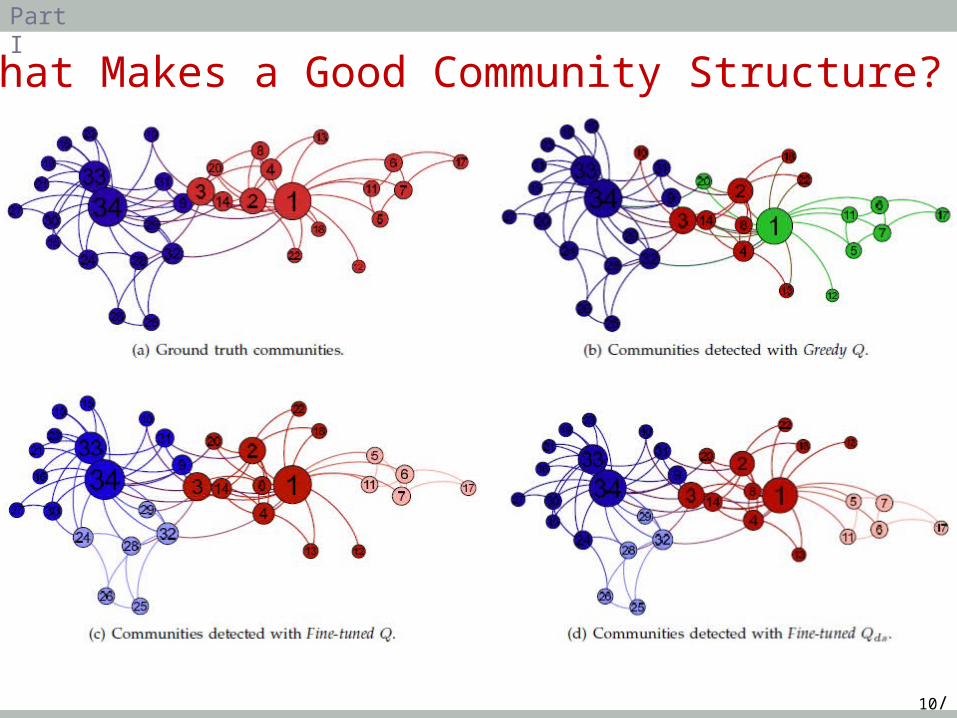
What Makes a Good Community Structure?
Part I

11/50
Community Quality Metrics
How to measure the quality of the community structure found with community detection algorithms
Community quality metrics: modularity
Part I

12/50
Modularity
Modularity (Q): the fraction of edges inside the communities minus the expected value in an equivalent network with edges placed at random
22
,| | 2 | |
: the number of edges inside community
| |
|
;
: the number of boundary edges of communit
| | | |
| |
y | .
outc
outc
c C
in inc c
inc
E E
c
c
E
E
E
E
EQ
Newman, Proc. Natl. Acad. Sci. 103, 8577–8582 (2006)
Newman and Girvan, Phys. Rev. E 69, 026113 (2004)
Part I

13/50
Two Problems of Modularity Maximization
In some cases, it splits large communities by favoring small communities
In other cases, it favors large communities by failing to discover communities smaller than a certain size even when such communities are well defined This size depends on the total number of edges in the network
and the degree of interconnectedness of communities Also known as the resolution limit problem of modularity
Fortunato et al., 2008; Li et al., 2008; Arenas et al., 2008; Berry et al., 2009; Good et al., 2010; Ronhovde et al., 2010; Fortunato, 2010; Lancichinetti et al., 2011; Traag et al., 2011; Darst et al., 2013.
Part I

14/50
Multi-resolution Modularity
Part I
22
,| | 2 | |
is the resolution parameter
| || | | |
.
c
in inc c
outc
C
E E E
E EQ
Multi-resolution modularity (Qλ): introduce the resolution parameter λ into modularity High values of λ lead to smaller communities Low values of λ lead to larger communities
Lancichinetti and Fortunato, Phys. Rev. E 84, 066122 (2011)

15/50
Multi-resolution Modularity
Schematic network with a random subgraph and two cliques
Qλ still suffers from the two opposite yet coexisting issues Favoring small communities: e.g. split random graph Resolution limit problem: e.g. merge loosely connected cliques
Often very difficult and impossible to tune the resolution parameter so as to avoid both problems simultaneously Heterogonous distribution of community sizes
Lancichinetti and Fortunato, Phys. Rev. E 84, 066122 (2011)

16/50
Modularity with Split Penalty Split penalty (SP): the fraction of edges that connect
nodes of different communities
Qs = Q – SP: solving the problem of favoring small communities of modularity
,
'
'
'
,2 | |
| |
c C c Cc
c
c
cESPE
2
, '
''
| || | 2 | | | |.
| | 2 | | 2 | |
in in outc cc c c
c C c Cc c
EE E EQ SP
E E EsQ
, ' : the number of edges between communities an '.| d| c cE c c
Part I

17/50
Qs with Community Density: Modularity Density
Supplement both modularity and split penalty with edge densities to arrive at Modularity Density
Modularity Density solves both problems of modularity: the resolution limit problem and favoring small communities problem
2
, ', '
''
, ', '
| || | 2 | | | |.
| | 2 | | 2 | |
2 | | ;
| | (| | 1)
| | .
| || ' |
in in outc cc c c
c c c cc C c C
c c
inc
c
c cc c
EE E Ed d d
E E E
Ed
c c
Ed
c c
dsQ
Part I

18/50
Two Very Well-Separated Communities
Modularity (Q) Split Penalty (SP) Qs = Q – SP Qds
2 communities 0.5 0 0.5 0.51 community 0 0 0 0.245
Part I

19/50
Two Well-Separated Communities
Modularity (Q) Split Penalty (SP) Qs = Q – SP Qds
2 communities 0.357 0.143 0.214 0.3391 community 0 0 0 0.25
Part I

20/50
Two Weakly Connected Communities
Modularity (Q) Split Penalty (SP) Qs = Q – SP Qds
2 communities 0.3 0.2 0.1 0.2631 community 0 0 0 0.249
Part I

21/50
Ambiguity between One and Two Communities
Modularity (Q) Split Penalty (SP) Qs = Q – SP Qds
2 communities 0.25 0.25 0 0.1881 community 0 0 0 0.245
Part I

22/50
One Well Connected Community
Modularity (Q) Split Penalty (SP) Qs = Q – SP Qds
2 communities 0.167 0.333 -0.167 0.04171 community 0 0 0 0.23
Part I

23/50
One Very Well Connected Community
Modularity (Q) Split Penalty (SP) Qs = Q – SP Qds
2 communities 0.0455 0.455 -0.409 -0.2391 community 0 0 0 0.168
Part I

24/50
One Complete Graph
Community quality on a complete graph with 8 nodes Modularity (Q) Split Penalty (SP) Qs = Q – SP Qds
2 communities -0.0714 0.571 -0.643 -0.6431 community 0 0 0 0
Part I

25/50
Modularity Has Nothing to Do with #Nodes
2
2
2
12 13(clique) (tree) 2* 0.4231;
26 26
12 13 1(clique) (tree) 2* 0.3462;
26 26 26
12 13 1 1(clique) 2* *1 *1 * 0.4183;
26 26 26 4*4
12 2 13 2(tree) 2* * *
26 7 26 7
s s
ds
ds
Q Q
Q Q
Q
Q
21 1
* 0.2214.26 7*7
Part I

26/50
Example of Resolution Limit Problem
Modularity (Q) Split Penalty (SP) Qs = Q – SP Qds
30 communities
0.8758 0.09091 0.7848 0.8721
15 communities
0.8879 0.04545 0.8424 0.4305∆Qs=(0.8424-0.7848)=0.0576 > ∆Q=(0.8879-0.8758)=0.0121
Part I

27/50
Proof of Solving Resolution Limit Problem (a) Modularity density Qds does not merge two or more
consecutive clqiues.
(b) Qds does not merge two small communities.
Part I

28/50
Proof of Solving the Two Problems
Modularity density does not split the random subgraph
Modularity density does not merge the two cliques
Part I
Schematic network with a random subgraph and two cliques

29/50
Other Community Quality Metrics
The number of Intra-edges:
Contraction: , average number of edges per node inside community c
The number of Inter-edges:
Expansion: , average number of edges per node that point outside community c
Conductance: , the fraction of the total number of edges that point outside community c
| |outcE
| |incE
2 | | / | |incE c
| | / | |outcE c
| |
2 | | | |
outc
in outc c
E
E E
Part I

30/50
Evaluation and Analysis Senate dataset
Totally 111 snapshots over 220 years Nodes are senators; weight on the edge between two senators
is the fraction of times they voted similarly
Reality mining Bluetooth scan data Each week is a snapshot, totally 43 snapshots Nodes are subjects; weight on the edge is the number of
Bluetooth scans between two subjects
Q Qs Qds #Intra-edges Contraction #Inter-edges Expansion Conductance
Senate 0.2 0.6 0.7, 0.8 0.7, 0.8 0.7, 0.8 0.7, 0.8 0.7, 0.8 0.7, 0.8
Reality mining
0.5 0.6 0.6 0.7 0.6 0.6 0.6 0.6
Part I
Best value of parameter q (0.05≤q≤0.95) of LabelRankT compared with Estrangement

31/50
Summary
Modularity density solves the two issues simultaneously without the trouble of specifying any particular parameter
We demonstrated with proofs and experiments on real dynamic datasets that modularity density is an effective alternative to modularity.
Modularity density for overlapping community structure Mingming Chen, Konstantin Kuzmin, and Boleslaw Szymanski, “Extension of
Modularity Density for Overlapping Community Structure”, IEEE/ACM ASONAM Workshop on Social Network Analysis in Applications (SNAA), Beijing, China, Aug. 2014, pp. 856-863.
Mingming Chen and Boleslaw K. Szymanski, “Fuzzy Overlapping Community Quality Metrics”, Social Network Analysis and Mining 5:40, Jul. 2015.

32/50
Thanks!Q & A

Fine-tuned Disjoint Community Detection Algorithm
Mingming Chen, Konstantin Kuzmin, and Boleslaw Szymanski, ``Community Detection via Maximization of Modularity and Its Variants'', IEEE transactions on Computational Social Systems 1(1) Mar. 2014, pp. 46-65.

34/50
Introduction
Optimize community quality metrics to detect communities Community quality metrics: modularity and modularity density Modularity optimization methods
• Greedy algorithms• Spectral algorithms
Fine-tuned disjoint community detection algorithm Iteratively tries to improve the quality metrics by splitting and
merging the given community structure Combines both greedy and spectral methods, but a little more
sophisticated
Part II

35/50
How to Find Communities: Splitting and Merging
Spectral algorithm (top down): split the network (as a whole community) until each node is a community of itself
Greedy algorithm (bottom up): merge two communities until there is only a single community left
Part II

36/50
Spectral Partitioning: Laplacian Matrix
Laplacian matrix (L) |V| |V| symmetric matrix
What is trivial eigenpair? then and so
Important properties: Eigenvalues are non-negative real numbers Eigenvectors are real and orthogonal
𝑳=𝑫−𝑨
1
3
2
5
46
1 2 3 4 5 6
1 3 -1 -1 0 -1 0
2 -1 2 -1 0 0 0
3 -1 -1 3 -1 0 0
4 0 0 -1 3 -1 -1
5 -1 0 0 -1 3 -1
6 0 0 0 -1 -1 2
Part II

37/50
How to Split a Community?
C
C1
C2
1 2,
1 2
| |: (NP-complete)| || |
c cE
c cRatio Cut
Fiedler vector
Approximation
Fiedler vector: the eigenvector of the Laplacian matrix corresponding to the second smallest eigenvalue
Split: put the nodes corresponding to the positive values of the Fiedler vector into one group and the other nodes into the other group
Part II

38/50
Example: Spectral Partitioning
Rank in x2
Val
ue o
f x 2
Components of x2
Part II

39/50
Fine-tuned Algorithm Iteratively split and merge the community structure until
doing so cannot improve the community quality metrics Split stage Merging stage
G
COMMUNITY
STRUCTURE
Part II

40/50
Split Stage
Based on Fiedler vector Sort its elements in decreasing (or increasing) order, then cut
them into two groups in each of the |c| - 1 possible ways Choose the one that improves the metric the largest
X2 = [-0.95 -0.9 -0.85 -0.05 -0.02 0.01 0.05 0.1 0.2]
Fiedler vector
Clique Clique
Part II
0.030.8
41/50
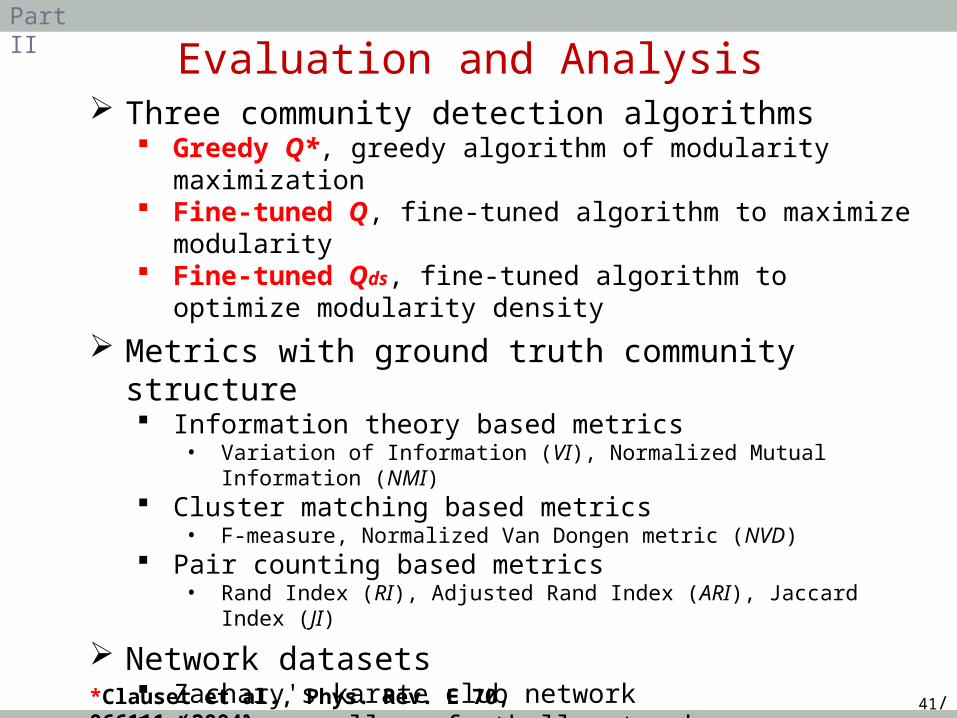
Evaluation and Analysis Three community detection algorithms
Greedy Q*, greedy algorithm of modularity maximization Fine-tuned Q, fine-tuned algorithm to maximize modularity Fine-tuned Qds, fine-tuned algorithm to optimize modularity
density
Metrics with ground truth community structure Information theory based metrics
• Variation of Information (VI), Normalized Mutual Information (NMI) Cluster matching based metrics
• F-measure, Normalized Van Dongen metric (NVD) Pair counting based metrics
• Rand Index (RI), Adjusted Rand Index (ARI), Jaccard Index (JI)
Network datasets Zachary's karate club network American college football network Clique network for resolution limit problem LFR benchmark networks (0.1 ≤μ≤0.5)
Part II
*Clauset et al., Phys. Rev. E 70, 066111 (2004)

42/50
Zachary’s Karate Club NetworkPart II

43/50
American College Football Network
American college football network: the schedule of games between American college football teams in a single season 115 nodes and 613 edges 12 ground truth communities
Part II

44/50
12 communities 7 communities
9 communities 12 communities
Part II

45/50
Clique NetworkPart II

46/50
LFR Benchmark NetworksPart II
μ is the mixing parameter. Low values of μ indicate strong community structure.

47/50
LFR Benchmark NetworksPart II

48/50
Summary
Fine-tuned Qds performs the best among all the three algorithms, followed by fine-tuned Q, and both are much more effective than Greedy Q
Fine-tuned Qds can be used to significantly improve the community detection results of other algorithms
All the seven quality metrics based on ground truth community structure are consistent with Qds, but not consistent with Q Superiority of Qds over Q as a community quality metric
Part II
49/50
Resources Papers and book chapters worth to read
S. Fortunato, “Community detection in graphs,” Physics Reports, vol. 486, pp. 75–174, 2010.
http://barabasi.com/networksciencebook/content/book_chapter_9.pdf J. Xie, S. Kelley, and B. K. Szymanski, “Overlapping community detection in networks: The
state-of-the-art and comparative study,” ACM Comput. Surv., vol. 45, no. 4, pp. 43:1–43:35, Aug. 2013.
M. Chen, K. Kuzmin, and B. K. Szymanski, “Community detection via maximization of modularity and its variants,” IEEE Trans. Comput. Soc. Syst., vol. 1, no. 1, pp. 46–65, 2014.
Community Detection Algorithms Greedy Q or Fast Modularity: http://www.cs.unm.edu/~aaron/research/fastmodularity.htm Fine-tuned Algorithm: https://github.com/chenmingming/FineTunedAlg Louvain Algorithm: https://sites.google.com/site/findcommunities/ GANXiS: https://sites.google.com/site/communitydetectionslpa/ CFinder: http://www.cfinder.org/
Datasets: http://www-personal.umich.edu/~mejn/netdata/ http://snap.stanford.edu/data/#communities http://www.cc.gatech.edu/dimacs10/archive/clustering.shtml http://deim.urv.cat/~alexandre.arenas/data/welcome.htm https://sites.google.com/site/santofortunato/inthepress2
Visualization tools Gephi: http://gephi.github.io/ Cytoscape: http://www.cytoscape.org/

50/50
Thanks!Q & A