discounting financial literacy time preferences and ... · discounting financial literacy: time...
TRANSCRIPT

IZA DP No. 3507
Discounting Financial Literacy: Time Preferencesand Participation in Financial Education Programs
Stephan MeierCharles Sprenger
DI
SC
US
SI
ON
PA
PE
R S
ER
IE
S
Forschungsinstitutzur Zukunft der ArbeitInstitute for the Studyof Labor
May 2008

Discounting Financial Literacy:
Time Preferences and Participation in Financial Education Programs
Stephan Meier Federal Reserve Bank of Boston
and IZA
Charles Sprenger University of California, San Diego
Discussion Paper No. 3507 May 2008
IZA
P.O. Box 7240 53072 Bonn
Germany
Phone: +49-228-3894-0 Fax: +49-228-3894-180
E-mail: [email protected]
Any opinions expressed here are those of the author(s) and not those of IZA. Research published in this series may include views on policy, but the institute itself takes no institutional policy positions. The Institute for the Study of Labor (IZA) in Bonn is a local and virtual international research center and a place of communication between science, politics and business. IZA is an independent nonprofit organization supported by Deutsche Post World Net. The center is associated with the University of Bonn and offers a stimulating research environment through its international network, workshops and conferences, data service, project support, research visits and doctoral program. IZA engages in (i) original and internationally competitive research in all fields of labor economics, (ii) development of policy concepts, and (iii) dissemination of research results and concepts to the interested public. IZA Discussion Papers often represent preliminary work and are circulated to encourage discussion. Citation of such a paper should account for its provisional character. A revised version may be available directly from the author.

IZA Discussion Paper No. 3507 May 2008
ABSTRACT
Discounting Financial Literacy: Time Preferences and Participation in Financial Education Programs*
Many policy makers and economists argue that financial literacy is key to financial well-being. But why do many individuals remain financially illiterate despite the apparent importance of being financially informed? This paper presents results of a field study linking individual decisions to acquire personal financial information to a critical, and normally unobservable, characteristic: time preferences. We offered a short, free credit counseling and information program to more than 870 individuals. About 55 percent chose to participate. Independently, we elicited time preferences using incentivized choice experiments both for individuals who selected into the program and those who did not. Our results show that the two groups differ sharply in their measured discount factors. Individuals who choose to acquire personal financial information through the credit counseling program discount the future less than individuals who choose not to participate. Our results suggest that individual time preference may explain who will and who will not choose to become financially literate. This has implications for the validity of studies evaluating voluntary financial education programs and policy efforts focused on expanding financial education. JEL Classification: D14, D91, C93 Keywords: financial literacy, time preferences, selection, field experiment Corresponding author: Stephan Meier Research Center for Behavioral Economics and Decision-Making Federal Reserve Bank of Boston 600 Atlantic Avenue Boston, MA 02210 USA E-mail: [email protected]
* We are grateful to Daniel Benjamin, Chris Foote, Andreas Fuster, Lorenz Goette, Glenn Harrison, Simon Luechinger, Joanna Stavins, and Alois Stutzer. This paper was previously entitled “Selection into Financial Literacy Programs: Evidence from a Field Study”. The views expressed in this paper are those of the authors and not necessarily those of the Federal Reserve System or the Federal Reserve Bank of Boston.

1 Introduction
In personal finance, as in other areas of decision-making, information is thought to be
a good thing. Financially literate individuals make fewer mistakes and are in better
financial condition than financial illiterates (for surveys, see Lusardi and Mitchell,
2007; Bernanke, 2006). Based on the positive association between financial outcomes
and financial knowledge, policymakers promote educational programs, such as credit
counseling, homeownership classes, and retirement seminars. The fact that the new
bankruptcy law in the U.S. requires individuals to undergo credit counseling illustrates
the importance that policymakers place on providing information about personal fi-
nance.1
Despite the apparent importance of financial literacy, many individuals remain fi-
nancially illiterate. Evidence shows that a large number of individuals lack even basic
financial understanding. Individuals generally score poorly on financial literacy exams
(see, for example, National Council on Economic Education, 2005; Mandell, 2004) and
fail to understand financial instruments (see, John Hancock Financial Services, 2002).2
Furthermore, Lusardi and Mitchell (2007) show that only around half of individuals in
the Health and Retirement Survey are able to answer two simple questions on inflation
and compound interest. It remains an open question why, if acquiring financial infor-
mation is so critical to financial well-being, many individuals do not choose to become
more financially informed.
Very little evidence exists exploring the decision processes underlying the acquisi-
tion of financial information. The acquisition of financial information, like voluntary
education in general, can be viewed as an investment in human capital. Individuals be-
come financially literate, incurring costs in the present, with an expectation of returns
1A debtor may be eligible for bankruptcy under Chapter 7 law only if he or she has participated inan approved credit counseling session in the previous 180 days. See 11 U.S.C. §§ 109, 111 for details.
2For a survey on the state of financial literacy, see Lusardi (2006) and papers cited therein.
2

on this human capital investment in future periods. As such, time preference should
play a role in determining whether or not an individual chooses to acquire personal
financial information. Individuals who heavily discount the future should be less likely
to invest in financial education than those who don’t discount the future as much. In
this paper, we test this hypothesis and show that an individual’s discount factor is
highly correlated with the acquisition of personal financial information.
Our evidence comes from a field study implemented in cooperation with the City
of Boston and a large credit counseling firm that offered financial information, in the
form of a short credit counseling session, to more than 870 individuals. The counseling
session included an overview of the individual’s credit report, with their credit score,
along with useful credit information. Independently, we elicited the time preferences of
all individuals to whom the program was offered, using incentivized choice experiments.
The design of the study allows us to correlate measured discount factors with the
decision to take-up the offered credit counseling program.
Analyzing the acquisition of financial information in this framework has several
advantages. First, the outcome variable (that is, whether individuals choose to receive
the counseling session) is an objectively observable behavioral measure. The partic-
ipation decision does not depend on cognitive or learning abilities (as some financial
literacy tests do), and the program is designed to have very low costs for participants
(described below). Second, the topic is particularly relevant. Knowledge about credit
scoring and one’s credit score is very important in the United States for financial deci-
sions, since credit scores are used to determine not only whether one gets a loan, but
also the interest rate. In addition, credit reports may legally be used by employers,
landlords, and insurance companies in their decision-making (see 15 U.S.C. §1681b).
In the field study, only about 55 percent of individuals chose to receive a free
credit score and participate in the short credit counseling session. We show that this
3
participation decision is highly correlated with individual time preference; individuals
who have higher discount factors are more likely to opt into the program. This result is
robust to controlling for a number of socio-demographic characteristics, such as income
and education.
Additionally, we show that time preference influences information acquisition prior
to receipt of the offer of the small intervention in the field study. More patient individu-
als are more likely to know what a credit score is. Controlling for this prior information
acquisition, however, has little effect on the strong correlation between time preference
and the participation decision.
That we find a positive correlation between patience and acquisition of financial
information may help to explain why some individuals remain financially illiterate.
Financial literacy is an investment in human capital. Those who heavily discount the
future will heavily discount the benefit of being financially literate and so will find
acquiring financial information not to be an attractive investment.
Our results have at least two further implications. First, our results speak to the
presence of selection effects in the evaluation of financial programs. Previous research
has found that, in general, more patient individuals have better financial outcomes,
since they search longer for a good job (DellaVigna and Paserman, 2005), experience
steeper wage growth (Munasinghe and Sicherman, 2006), take up welfare programs ear-
lier (Fang and Silverman, 2006), have higher credit scores, and are less likely to default
on their loans (Meier and Sprenger, 2006). This indicates that patient individuals who
acquire financial information are already on the path to better outcomes. If the mea-
sured effects of financial information interventions do not rely on randomization, then
their observed educational effects are most likely overestimated. Because few studies
can solve this selection problem,3 we believe there is very limited unbiased evidence on
3There are a few notable exceptions. For example, Bernheim et al. (2001) and Cole and Shastry(2007) use changes in state level mandates for financial curriculum in high schools as an identification
4
whether financial information interventions have a positive effect.
Second, an expansion of voluntary financial programs will continue to miss certain
consumers. Voluntary programs are considered by some to be a helpful step in creating
better financial outcomes for an increasing number of people (see, for example, Braun-
stein and Welch, 2002). We suggest not only that the expansion of these programs
may reach only a limited number of individuals, but also that such programs will not
be attractive to the target population of financial illiterates. If this is the case, policy
makers face significant difficulty in addressing financial illiteracy.
The rest of the paper is organized as follows: Section 2 presents the design of the
field study and of the choice experiments, Section 3 presents the results, and Section 4
concludes by elaborating on the paper’s policy implications.
2 Design of Field Study
Our results are based on a unique field study that measures an individual’s discount
factor regardless of his or her decision to participate in a financial education program,
and investigates who selects into the educational program.
2.1 Design of Financial Education Program
The study took place at a Volunteer Income Tax Assistance (VITA) site in Roxbury, a
neighborhood in Boston, Massachusetts.4 Jointly with the City of Boston and a large
credit counseling corporation, we offered 872 individuals a free TransUnion & Co. credit
strategy and come to differing conclusions about the effect of financial education on future savings. Du-flo and Saez (2003) offer randomized incentives to participate in a savings seminar and show that theeffects, although positive, are extremely small. See also Lusardi and Mitchell (2007) for a survey.
4There are currently 23 VITA sites in and around Boston, MA. Coordinated by a city-wide coalitionof government and business leaders, VITA sites provide free tax preparation assistance to low-to-moderate income (LMI) households. Taxes are prepared by volunteers throughout tax season, fromlate January to mid-April each year.
5

report (including their Fair Issac Corporation (FICO) score), a short overview of how
to read a credit report (for information about credit reports, see Avery et al. (2003)),
and several key steps they could take to improve or maintain their credit rating. All
tax filers entering the VITA site were offered the short credit session.
The exact procedure in the field study was as follows: first, all taxpayers entering
the Roxbury VITA site during the times we conducted the study were asked whether
they wanted to receive a free, short credit counseling session (including their credit
score) while waiting for a volunteer to help them with their taxes. Participation was
almost costless in the sense that we paid for the monetary cost of the credit report;
individuals were explicitly informed that the credit report involved was a so-called “soft
inquiry” that would not affect their score; and most individuals already had to wait
quite a long time at the tax sites for their taxes to be prepared (so opportunity costs
of participating were minimal). Furthermore, concerns about identity theft are very
unlikely to affect the decision to receive counseling since individuals come to the VITA
site voluntarily and entrust all their personal information to the volunteers at the site
for tax filing purposes. Individuals could choose to receive the short counseling session
at any point in the process.
Second, independent of whether they opted to receive the counseling session, indi-
viduals received a preparatory packet with forms for their taxes, a survey with some
socio-demographic and other information, and a set of multiple price lists to enable us
to measure time preferences.
Third, we explained to all individuals how to fill in the price lists and how the
payment mechanism for the price lists would work (more details about the price lists
are given below).
Fourth, individuals filled out the surveys and completed the price lists. Those who
elected to participate then received a short one-on-one credit counseling session. The
6

session lasted no more than 15 minutes, and individuals had been informed of this fact
before deciding to participate. Upon completion of the credit counseling session, a tax
preparation volunteer helped the individual to file his or her taxes. Individuals who
decided to receive the free credit counseling did not lose their place in the line for tax
preparation, and all individuals were informed of this in advance.
We acquired the following information for 872 individuals: (i) whether they partic-
ipated in the short credit counseling program, (ii) a measure of their time preferences,
and (iii) their income situation, from their tax filing. Additionally, we obtain informa-
tion on the day when individuals were offered the financial education program in the
VITA site. This enables us to control for day-specific waiting times and potential social
interaction effects. (iv) For a substantial number of the individuals in our study, we
also have a complete record of the socio-demographic characteristics reported from the
preparatory survey mentioned above. This survey included questions on the individ-
ual’s gender, race, education, whether the individual has at least one credit card, the
outstanding balances on all credit cards, information on knowledge of English, whether
the individual expects to move in the next seven months, and the individual’s willing-
ness to take risks. The survey also includes a question on prior financial knowledge.
Individuals were asked: “Do you know what a credit score is?” The answers to this
yes/no question are used to determine whether time preferences correlate with infor-
mation acquisition prior to the field study, and whether inclusion of prior knowledge
can explain the association between time preferences and the decision to participate in
the credit counseling program.
The average individual in the field study is around 38 years of age, African-
American, female, has no college experience, annual disposable income of around
$17,000, and 0.5 dependents (see Column (1) of Table 1). The study therefore fo-
cuses on low-to-moderate-income (LMI) individuals. This non-standard subject pool
7

is of particular interest for the research question at hand, first, as there are very few
experimental studies focusing solely on the behavior of LMI families in developed coun-
tries (an exception is Eckel et al., 2005) and, second, as their relatively insecure financial
position puts them at great financial risk to health and income shocks (see Bertrand et
al., 2004). As Campbell (2006, p. 1554) notes “. . . for many households, the discrep-
ancies between observed and ideal behavior have relatively minor consequences . . . ; for
a minority of households, particularly poorer and less educated households, there are
larger discrepancies with potentially serious consequences.”
2.2 Measuring Time Preferences
Participants’ time preferences were measured with incentivized choice experiments (for
similar approaches, see Harrison et al., 2002; McClure et al., 2004; Dohmen et al., 2006;
Meier and Sprenger, 2006; Benjamin et al., 2007, and for a survey on measuring time
preferences, see Frederick et al. (2002)). Individuals were asked to make 22 choices
between a smaller reward ($X < $50) in period t and a larger reward ($50) in period
t + τ > t. The amount X varied from $49 to $14. We use three time sets. In two of
the price lists, t is the present (t = 0) and τ , the delay, is either one month (τ = 1) or
six months (τ = 6). In the third price list, t is delayed six months (t = 6) and τ is one
month (τ = 1). (See the appendix for the instructions and the multiple price lists.)
The multiple price list setup (see, for example, Harrison et al., 2005) enables us
to measure an individual’s discount factor (IDF )5 for three different time frames by
looking at the point, X∗, at which individuals switch from opting for the smaller,
sooner payment to the larger, later payment, in a given price list. That is, a discount
factor is taken from the last point at which an individual prefers the sooner, smaller
5In the paper, we use the individual discount factor (IDF ) instead of the individual discount rate(IDR): IDF=1/(1+IDR).
8

payment. For example, if an individual prefers $45 today over $50 in one month, but
prefers $50 in one month over $40 today, we take $45 as the switching point and the
corresponding monthly discount factor as 0.9.6 We use the average across the three
choice sets of the calculated monthly discount factors, IDF, in the main analysis.7 We
also test for the fact that we elicit an interval and not a point estimation of IDF s (see
below). Importantly, the research question at hand needs only a reliable measure of the
heterogeneity in IDF s across individuals and not necessarily precise point estimates of
the level of the IDF s.
The order of the three time frames was randomized, and the same three experi-
menters explained the choices to the subjects. The researchers told the subjects that
they were required to choose either the smaller, earlier reward or the larger, later
reward for each decision pair. The experimenters also explained that 10 percent of
individuals would be randomly paid one of their choices. This was done by giving
subjects, at the end of their tax filing, raffle tickets that indicated which choice, if
any, would be effective. To ensure credibility of the payments, we filled out money
orders for the winning amounts on the spot in the presence of the participants, put
them in labeled, pre-stamped envelopes, and sealed the envelopes. The payments were
guaranteed by the Federal Reserve Bank of Boston, and individuals were informed that
they could always return to the VITA site where the experiment was run to report any
problems receiving the payments.8 Money orders were sent by mail to the winners’
home addresses, either on that day (if t = 0) or in one, six, or seven months, depending
on the winner’s choice. The payment procedure therefore mimicked a front-end-delay
design (Harrison et al., 2005).9
6Therefore, individuals’ discount factors are calculated: IDF τ = X∗/50.7We also test whether IDF s measured in each of the three price lists are associated with becoming
informed, and indeed they are.8In fact, one participant returned to the VITA site, almost seven months after the experiment to
ask about his payment. He was, however, three days too early, and received the payment on time.9If individuals expect to move in the next seven months, they may question the likelihood of their
9

Measuring time preferences with incentivized multiple price lists has many advan-
tages over other approaches (Frederick et al., 2002), but the method also has challenges
that must be addressed.
First, the price lists do not elicit point estimates of the IDF s but rather ranges
of where the IDF s lie (see Coller and Williams, 1999, for details). Especially for
individuals who accept the smaller, earlier payment in all choices, the interval will be
relatively large, as the subjects might have accepted even lower amounts than offered at
the earlier time. To address this issue, we show that the results are robust to estimation
with interval regressions (as suggested by Harrison et al., 2005).
Second, individuals’ decisions concerning the price lists may be affected by either
their outside lending or their outside borrowing opportunities (see Harrison et al.,
2005). On the one hand, an individual who can lend at an interest rate higher than the
implied interest rate offered in the multiple price list should arbitrage the experiment
by taking earlier payments. However, the lowest implied interest rate offered in the
choice experiment for τ = 1 was 27 percent per year, which is difficult to match in
the real world. Some of the interest rates for τ = 6 were substantially lower, making
it is easier to find more favorable investment opportunities outside the experiment. If
outside investment opportunities play a role, individuals should appear more impatient
if τ = 6 than if τ = 1. But individuals exhibit higher (not lower) IDF s if τ =
6 than if τ = 1 (p < 0.001). Outside investment opportunities, therefore, do not
seem to drive the experimental results. On the other hand, a person who can borrow
at a rate lower than the experimentally offered rate should arbitrage the experiment
by waiting for later payments. The individual may appear patient while actually
arbitraging the experiment by borrowing externally at a lower rate and repaying later
mail being forwarded to their new address in a timely manner. As movers might therefore preferpayments in the present for logistical reasons and not for reasons related to their underlying timepreference, we ask individuals “Do you expect to move in the next 7 months?” Including the answerto this question does not affect our results.
10

with earnings from the experiment. Because the implied interest rates in the experiment
are large (especially in the case of τ = 1), this is relatively easy to do. However, not
many individuals consistently choose the later, larger payments to take advantage of
the apparent arbitrage opportunity. Since the implied IDF s are rather small and
significantly less than one (p < 0.001), outside borrowing opportunities do not seem to
drive the experimental results.
Third, the measurement of IDF s by observing individuals’ switching points in price
lists implicitly assumes that utility is linear over the payments in question. This proce-
dure simplifies the analysis considerably and is consistent with expected utility theory,
which implies that consumers are approximately risk neutral over small stakes outcomes
(Rabin, 2000). However, some researchers have argued that parameters estimated from
price lists may also capture differences across individuals in the degree of curvature of
the utility function (Andersen et al., 2008).10 We therefore test whether differences
in risk aversion affect our results using a question on general risk attitudes previously
validated with a large, representative sample (Dohmen et al., 2005). The question
reads as follows: “How willing are you to take risks in general? (on a scale from 0
“unwilling” to 10“fully prepared”). While risk aversion is correlated with measured
time preferences, it does not affect the results of this paper.
Fourth, in order to measure an IDF, an individual must exhibit a unique switching
point in each choice set. Around 11 percent do not exhibit a unique switching point in
one or more price lists. In the main analysis we focus on the 778 individuals who show
a unique switching point in all choice sets. Individuals who have multiple switching
points within a choice set are neither more nor less likely to sign up for the counseling
sessions. When we include these individuals in a robustness test by taking their first
10Attributing our experimental responses to risk preferences alone yields unrealistically high levelsof risk aversion. For a discussion of the high stakes implications of even moderate risk aversion oversmall stakes see Rabin (2000).
11

switching point, the results do not change.
3 Results
Of all individuals offered the short credit counseling session, only 55 percent opted to
acquire financial information, while the rest declined. The role of individuals’ time
preferences in this decision is presented in three steps. First, we present descriptive
statistics of the difference between participants and non-participants. Second, the
direct association between time preferences and the decision to participate in the credit
counseling program is investigated in a multivariate regression analysis. Third, we
present the association between time preferences and prior financial knowledge and the
joint effect of time preferences and prior knowledge on the decision to participate in
the program.
3.1 Descriptive Statistics
There is a clear difference in time preferences between individuals who select into
acquiring information and those who decide not to become informed. Table 1 shows
that individuals who choose to participate in the counseling session have an IDF of
0.85, compared with an IDF of 0.78 for individuals who choose not to participate
(p < 0.001).11 Figure 1 shows the cumulative distribution of the IDF s for the two
groups. The figure illustrates that individuals who select to acquire information have
substantially higher IDF s. To put it differently, individuals who selected into credit
counseling chose the $50 in the future an average of 12 times out of 22 choices, while
individuals who selected not to receive counseling chose the larger, later reward only 9
times.
11We use t-tests to compare means until otherwise noted.
12

[Table 1 and Figure 1 about here]
Table 1 compares other characteristics of the individuals who choose to receive the
short counseling session and those who decline the offer.12 The comparison of the two
self-selected groups shows that they hardly differ in observable basic demographic char-
acteristics. Also, the two groups do not differ in income levels. Therefore, the variables
regularly controlled for in evaluation studies of educational programs (demographics
and income), do not seem to differ sharply between the two groups.
The two groups, however, differ starkly in both educational level and whether they
know what a credit score is. Participants in the educational program are more likely
to have college experience (p < 0.01) and are more likely to know what a credit score
is (p < 0.01). Both variables are potentially correlated with time preferences (because
their levels reflect investments in human capital) and appear to be correlated with the
participation decision. Controlling for education is important, since it could be a proxy
for cognitive abilities, which might influence IDF s (Benjamin et al., 2006). To avoid
omitted variable bias in our analysis, in the next sections we control for education,
whether people knowing what a credit score is and additional control variables.
3.2 The Effect of Time Preferences on Participation
As shown in the descriptive statistics, time preferences are highly correlated with the
decision to participate in a financial education program. As other factors also correlate
with this decision, especially education, in the following analysis we control for socio-
demographic variables. Table 2 presents logit regressions where the dependent variable
is 1 if the individual participated in the credit counseling program and 0 otherwise. To
the basic regression in column (1) we add exogenous demographic characteristics age,
12The number of observation differs due to availability of information for certain questions. Impor-tantly, even though the number of observations varies depending on the control variables we use, theeffect of time preferences on acquiring information remains the same for each sample.
13

race and gender in column (2); and then in column (3) additional socio-demographic
variables education, income and number of dependents, which may be endogenous to
an individual’s discount factor. In all regressions, we also control for the day individuals
were offered the education program.
Column (1) shows the simple association between IDF and the counseling partici-
pation decision. The marginal effect (not shown) is 0.59 for a change in the IDF from
0 to 1. This means that a change in the IDF of one standard deviation increases the
probability that a person acquires information by about 10 percentage points. Adding
control variables has little effect on this association. The coefficients range from 2.4
to 2.7, and the respective marginal effects range from 0.59 to 0.66. Column (2) shows
that the effect of IDF on the decision to participate in the counseling program holds
when controlling for basic demographic characteristics. The probability of acquiring
information increases with age and for African-Americans. Column (3) adds additional
socio-demographic variables. The results show that, among these additional variables,
only education is significantly associated with the decision to acquire information. The
relationship between time preferences and counseling participation is, however, little
changed by the inclusion of education and income variables.
[Table 2 about here]
Column (4) in Table 2 extends the list of control variables. The regression controls
for whether the individual is a native English speaker, whether he or she expects to
move in the next seven months, his or her attitudes toward risk (on a scale from 0,
“unwilling,” to 10, “fully prepared”),13 whether he or she holds at least one credit
card, and whether his or her current outstanding balance is greater than $1,000. The
results in column (4) show that none of the newly added variables is significant. In the
13The risk measure is treated as a continuous variable. The result does not change, however, if weuse dummies for each of the points on the 11-point scale.
14

remainder of the analysis we do not present results including these additional control
variables. The results of each regression, however, are maintained with their inclusion.14
As our method of measuring time preferences produces an interval rather than a
point estimate of an individual’s IDF, we test whether the results hold in an interval
regression (Stewart, 1983). Table 3 has the interval of IDF as the dependent variable.
Column (1) in Table 3 shows that the previous result is also supported in an interval
regression. Individuals who participate in the credit counseling program have higher
discount factors, i.e. discount the future less. The association remains when we control
for socio-demographic characteristics.
[Table 3 about here]
Previous research using interval regression techniques for a representative sample
of Danish consumers has shown that some socio-deomographic variables and and the
time horizons over which time preferences are elicited correlate with measured discount
factors (Harrison et al., 2002). Column (3) of Table 3 allows us to compare whether
the same factors correlate with our estimated discount factors for a sample of LMI
individuals as those for a representative sample in Denmark (Harrison et al., 2002,
: Table 2). The results for the two samples show similar qualitative patterns: the
longer the time period, τ , the higher the discount factor; the relationship between
age and discount factors is u-shaped; more educated individuals have higher discount
factors; and income is positively associated with discount factors. The one notable
difference is in the effect of gender. Our results, unlike those of the Danish sample,
show that females are significantly more patient than males. In general, however, socio-
demographic characteristics seem to have similar effects in both our LMI sample of US
consumers and the representative sample of Danish consumers.
14These results can be obtained from the authors on request.
15

The result that individuals with higher IDF choose to participate in the credit
counseling program is also robust to a number of additional tests. First, the association
between IDF and self-selection into credit counseling does not depend on which price
list we use to measure individual discount factors. In the main analysis, we take the
average, IDF , but all three separate measures of IDF are strongly associated with
the decision to acquire personal financial information (see Table A1 in the appendix).
Second, instead of using IDF to measure time preferences, we use the number of
patient decisions (that is, out of 22 choices, the number of times that the individual
opts for $50 later) and still find a strong association between information acquisition
and individuals’ patience (see Table A2 in the appendix). Third, taking individuals’
first switching point, the results are robust to including individuals who do not exhibit
unique switching points (see Table A3 in the appendix).
In sum, the results show that choosing to receive a credit counseling session is
strongly associated with individuals’ discount factors. This association holds when
controlling for socio-demographic variables and for further characteristics potentially
correlated with time preferences. In the following subsection we analyze whether time
preferences are also associated with prior financial information acquisition and whether
this prior knowledge can explain the relationship between time preference and the
decision to acquire information in our field study.
3.3 Time Preferences and Prior Financial Knowledge
Time preferences should not only explain who will select into becoming informed in our
field study, but also influence the acquisition of personal financial information prior to
the field study. To test this claim, we analyze responses to a simple question, in which
individuals self-report their knowledge about credit scoring. We create a dummy, Know
what score is, which is set equal to 1 for individuals’ reporting that they know what
16

a credit score is, and 0 otherwise. Of the 568 individuals who answered the question,
had non-missing basic control variables, and exhibited a unique switching point in the
choice experiments, a substantial share (42 percent) did not know what a credit score
is.
[Table 4 about here]
Table 4 presents the association between time preferences and prior financial knowl-
edge, that is, whether individuals know what a credit score is. Column (1) shows results
of a regression in which Know what score is is the dependent variable. The results show
that IDF is associated with prior knowledge. The more patient an individual, that is,
the higher an individual’s IDF , the more likely it is that she knows what a credit score
is. Not surprisingly, education and income are also substantial predictors of whether
individuals know what a score is. Better-educated and wealthier individuals are more
likely to know what a score is. The results, therefore, indicate that more patient
individuals are more knowledgable about personal finance prior to the field study.
Columns (2) and (3) in Table 4 show the results of regressions in which the depen-
dent variable is the decision to participate in the counseling program. ‘Prior financial
knowledge’ (Know What Score Is) is one of the independent variables. Column (2)
shows that without controlling for differences in time preferences, individuals who
have prior financial knowledge are more likely to participate in the educational pro-
gram. Adding IDF to the equation does not substantially lower the influence of prior
financial knowledge on the decision to participate. More importantly, however, con-
trolling for prior financial knowledge does not substantially change the relationship
between time preferences and the decision to acquire information in the field study.
In sum, patient individuals are more likely to acquire financial information through
the short credit counseling program offered in the field study and are more knowledgable
17

prior to the field study. But given one’s prior financial knowledge, time preferences are
still important for the decision to acquire further personal financial information.
4 Discussion and Conclusions
This paper presents evidence that time preferences strongly matter for whether or not
individuals choose to inform themselves about personal finance. In a unique field study,
we show that the more individuals discount the future, the lower is the probability
that they participate in a short, free financial education program. The result holds
when controlling for prior investment in human capital—both general (for example,
education) and specific to financial knowledge (for example, knowledge of credit scores).
The paper is able to at least partially answer the question of why, if financial
information is so important, many individuals do not become financially literate. If
becoming financially literate is an investment in human capital, individuals who heavily
discount the future will be less likely to find the investment to be attractive, and so
will remain financially illiterate.
Our results have important implications for the evaluation of financial education
programs and voluntary educational programs in general. Self-selection on time prefer-
ences in attending financial education programs will affect the results of most program
evaluation studies. For example, evidence on the positive effect of credit counseling
programs (for example, Elliehausen et al., 2007; Hartarska and Gonzalez-Vega, 2006)
are most likely biased upwards. Our results indicate that individuals entering voluntary
financial education programs care more about the future than those who decide not to
enter. Previous research has shown that these more patient, “treated” individuals are
more likely to have improved financial outcomes regardless of whether they participate
in education programs. Measured effects of “treatment” are therefore biased and the
18

direction of the bias is towards overestimation of positive effects.
Unbiased evidence on the effect of financial educational programs therefore requires
randomized treatment. Given the bias noted above, the estimated effects should be
expected to be much smaller. In fact, Duflo and Saez (2003) find very small effects
in a randomized study. Additional, unbiased studies such as this one are needed to
evaluate whether promotion of educational programs will indeed have positive effects
on individual financial decision-making.
A second implication concerns efforts to improve financial decisions through ed-
ucational programs. Our results show that even when participation costs for such
programs are minimal, individuals who heavily discount the future choose to not par-
ticipate, preferring not to invest in financial education. This implies that relying on
voluntary educational programs will not greatly affect financial literacy. These pro-
grams will likely not be taken up by the target population of financial illiterates.
If, however, significant externalities exist to low levels of individual financial literacy
such as higher levels of bankruptcy discharge and low levels of retirement security (the
costs of which are at least partially borne by the general public), policy makers may be
well founded in desiring individuals to become more financially informed. Concerned
policy makers are left with two options: either make financial education mandatory or
find a way to alter individual preferences with respect to the acquisition of financial
information. Both approaches are problematic.
Making financial education mandatory risks both irritating responsible consumers
and having little effect on individuals who would have ignored the offer of financial
education had it been voluntary. Furthermore, there is very little evidence as to how,
and whether, mandatory programs, like the one introduced in the new U.S. bankruptcy
law, work. Bernheim et al. (2001), find that state mandated financial education for high
school students does increase future savings. Cole and Shastry (2007) show, however,
19

that this result is sensitive both to the data used and the estimation techniques em-
ployed. Their findings do not support the conclusion that state mandated financial
education increases future savings.
Maybe time preferences are not fixed but can be altered to make the acquisition
of financial information a more attractive investment. Becker and Mulligan (1997)
argue not only that time preferences influence investment in education, but also that
education can influence time preferences by making it easier for individuals to imagine
the future. Policy makers appear at times to organize efforts aimed at changing the way
people think about the future. As it is unclear and unproven whether time preferences
can actually be changed, future research should investigate the relationship between
time preferences and abilities like planning and imagination. This will be crucial in
order to think about how time preferences are formed and, in turn, how to increase
financial information acquisition for all consumers.
20

References
Andersen, Steffen, Glenn W. Harrison, Morten I. Lau, and Elisabet E. Rutstrom,“Eliciting risk and time preferences,” Econometrica, 2008, p. Forthcoming.
Avery, Robert B., Raphael W. Bostic, Paul S. Calem, and Glenn G. Canner,“An overview of consumer data and credit reporting,” Federal Reserve Bulletin, 2003, 89,47–73.
Becker, Gary S. and Casey B. Mulligan, “The endogenous determination of time pref-erences,” Quarterly Journal of Economics, 1997, 112 (3), 729–758.
Benjamin, Daniel, James Choi, and Joshua Strickland, “Social identify and prefer-ences,” Working Paper, 2007.
, Sebastian Brown, and Jesse Shapiro, “Who is ’Behavioral’? Cognitive Ability andAnomalous Preferences,” Working Paper, 2006.
Bernanke, Ben, “Financial literacy,” Testimony before the Committee on Banking, Hous-ing, and Urban Affairs of the United States Senate on May 23 2006.
Bernheim, Douglas B., Daniel M. Garrett, and Dean M. Maki, “Education andsaving: The long-term effect of high school financial curriculum mandates,” Journal ofPublic Economics, 2001, 80 (3), 435–465.
Bertrand, Marianne, Sendhil Mullainathan, and Eldar Shafir, “A behavioral-economics view of poverty,” American Economic Review, Papers and Proceedings, 2004,94 (2), 419–423.
Braunstein, Sandra and Carolyn Welch, “Financial literacy: An overview of practice,research, and policy,” Federal Reserve Bulletin, 2002, 88 (11), 445–457.
Campbell, John Y., “Household Finance,” The Journal of Finance, 2006, 61 (4), 1553–1604.
Cole, Shawn and Gauri Kartini Shastry, “If You Are So Smart, Why Aren’t You Rich?The Effects of Education, Financial Literacy and Cognitive Ability on Financial MarketParticipation,” Working Paper, 2007.
Coller, Maribeth and Melonie B. Williams, “Eliciting individual discount rates,” Ex-perimental Economics, 1999, 2, 107–127.
DellaVigna, Stefano and Daniele M. Paserman, “Job search and impatience,” Journalof Labor Economics, 2005, 23 (3), 527–588.
Dohmen, Thomas, Armin Falk, David Huffman, and Uwe Sunde, “Dynamic incon-sistency predicts self-control problems in humans,” Working Paper, 2006.
, , , , Juergen Schupp, and Gert G. Wagner, “Individual risk attitudes: Newevidence from a large, representative, experimentally-validated survey,” Working Paper,2005.
21

Duflo, Esther and Emmanuel Saez, “The role of information and social interaction inretirement plan decisions: Evidence from a randomized experiment,” Quarterly Journal ofEconomics, 2003, 118 (3), 815–841.
Eckel, Catherine C., Cathleen Johnson, and Claude Monmarquette, “Saving deci-sions of the working poor: Short and long-term horizons,” in Jeffrey Carpenter, Glenn W.Harrison, and John A. List, eds., Field Experiments in Economics, Vol. Vol. 10 (Researchin Experimental Economics), Greenwich and London: JAI Press, 2005.
Elliehausen, Gregory, E. Christopher Lundquist, and Michael E. Staten, “The im-pact of credit counseling on subsequent borrower behavior,” Journal of Consumer Affairs,2007, 41 (1), 1–28.
Fang, Hamming and Dan Silverman, “Time-inconsistency and welfare program partici-pation: Evidence from the NLSY,” Working Paper, 2006.
Frederick, Shane, George Loewenstein, and Ted O’Donoghue, “Time discountingand time preference: A critical review,” Journal of Economic Literature, 2002, 40 (2),351–401.
Harrison, Glenn W., Morten I. Lau, and Melonie B. Williams, “Estimating individ-ual discount rates in Denmark: A field experiment,” American Economic Review, 2002, 92(5), 1606–1617.
, , Elisabet E. Rutstrom, and Melonie B. Williams, “Eliciting risk and timepreferences using field experiments: Some methodological issues,” in Jeffrey Carpenter,Glenn W. Harrison, and John A. List, eds., Field experiments in economics, Vol. Vol. 10(Research in Experimental Economics), Greenwich and London: JAI Press, 2005.
Hartarska, Valentina and Claudio Gonzalez-Vega, “Evidence on the effect of creditcounseling on mortage loan default by low-income households,” Journal of Housing Eco-nomics, 2006, 15 (1), 63–79.
Lusardi, Annamaria, “Financial Literacy and Financial Education: Review and PolicyImplications,” NFI Policy Brief No. 2006-PB-11, 2006.
and Olivia S. Mitchell, “Financial Literacy and Retirenment Preparedness: Evidenceand Implications for Financial Education Programs,” Business Economics, 2007, January,35–44.
Mandell, Lewis, “Financial Literacy: Are We Improving?,” Washington, D.C.: JumpStartCoalition for Personal Financial Literacy, 2004.
McClure, Samuel, David Laibson, George Loewenstein, and Jonathan Cohen,“Separate neural systems value immediate and delayed monetary rewards,” Science, 2004,306, 503–507.
Meier, Stephan and Charles Sprenger, “Impatience and credit behavior: Evidence froma field experiment,” Working Paper, 2006.
22

Munasinghe, Lalith and Nachum Sicherman, “Why dancers smoke? Smoking, timepreferences, and wage dynamics,” Eastern Economic Journal, 2006, 32 (4), 595–616.
on Economic Education, The National Council, “What American Teens and AdultsKnow About Economics,” Mimeo, 2005.
Rabin, Matthew, “Risk aversion and expected utility theory: A calibration theorem,”Econometrica, 2000, 68 (5), 1281–1292.
Services, John Hancock Financial, “Insights into Participant Investment Knowledge andBehavior; Eighth Defined Contribution Plan Survey,” Mimeo, 2002.
Stewart, Mark B., “On Least Squares Estimation when the Dependent Variable isGrouped,” The Review of Economic Studies, 1983, 50 (4), 737–753.
23

0
20
40
60
80
100
0.56 0.62 0.67 0.71 0.75 0.79 0.83 0.87 0.91 0.95 0.99Individual Discount Factors
Cum
ulat
ive
Dis
trib
utio
n Participants
Non-Participants
Figure 1: Cumulative Distribution of IDF
24

Table 1: Summary Statistics
(1) (2) (3)Total Non-Participants Participants t-tests
Individual Discount Factor
# of Observations 778 350 428
IDF 0.82 0.78 0.85 p < 0.001(0.17) (0.17) (0.16)
Basic demographic variables
# of Observations 677 310 367
Age 37.74 38.81 36.83 p < 0.10(14.88) (16.25) (13.57)
Race (African-American=1) 0.77 0.74 0.80 p < 0.10(0.42) (0.44) (0.40)
Gender (Female = 1) 0.63 0.61 0.65 p = 0.26(0.48) (0.49) (0.48)
Additional socio-demographic variables
# of Observations 618 286 332
College Experience (=1) 0.45 0.36 0.52 p < 0.01(0.50) (0.48) (0.50)
Adjusted Gross Income 16,924 16,135 17,603 p = 0.19(13,759) (13,926) (13,600)
Number of Dependents 0.47 0.44 0.50 p = 0.36(0.81) (0.79) (0.83)
Prior financial knowledge
# of Observations 568 255 313
Know What Score Is (=1) 0.57 0.50 0.64 p < 0.01(0.49) (0.50) (0.48)
Notes: Means for sample with unique switching points in the choice experiments, with non-missing variables for the respective block of variables plus non-missing variables in the blocksabove. Standard errors in parentheses. The last column shows p-value for a t-test of equalmeans for participant and non-participant samples.
25

Table 2: Time Preferences and Participation in Counseling Program
(1) (2) (3) (4)
IDF 2.4*** 2.32*** 2.36*** 2.87***(.484) (.551) (.603) (.945)
Age .11*** .0807* .165**(.04) (.0446) (.0821)
Age Squared -.001*** -.001* -.002**(.0005) (.0005) (.001)
Race .399** .46** .599*(.199) (.212) (.317)
Gender (Female=1) .185 .078 .327(.179) (.198) (.326)
College Experience (=1) .399** .12(.195) (.304)
Ln(Income) .0161 .0073(.0903) (.137)
# of Dependents .0987 .0229(.121) (.196)
Hold Credit Card (=1) .276(.353)
CC Debt > $1000 .76(.496)
Native English (=1) -.0326(.476)
Risk Attitudes -.00887(.0517)
Expect to Move (=1) .333(.327)
Constant -1.75*** -3.8*** -3.77*** -5.06***(.499) (.999) (1.2) (1.96)
Day dummies Yes Yes Yes Yes
Log Likelihood -488.02 -415.61 -371.77 -371.77# of Observations 778 677 618 317
Notes: Dependent variable: Participated in credit counseling program (=1).Logit regressions. Robust standard errors in parentheses.Level of significance: * p <0.1, ** p <0.05, *** p <0.01.
26

Table 3: Time Preferences and Participation in Counseling Pro-gram (Interval Regressions)
(1) (2) (3)
Participate in Program (=1) .096*** .076*** .073***(.017) (.018) (.018)
Delta Time (τ=6) .033*** .033*** .033***(.001) (.001) (.001)
Has Present (t=0) -.074*** -.078*** -.081***(.009) (.009) (.010)
Age -.004 -.011***(.003) (.004)
Age Squared .00002 .0001*(.00004) (.00005)
Race -.010 -.009(.019) (.019)
Gender (Female=1) .085*** .067***(.018) (.019)
College Experience (=1) .048**(.019)
Ln(Income) .023**(.009)
# of Dependents .023*(.012)
Constant .663*** .73*** .623***(.016) (.076) (.103)
Day dummies Yes Yes Yes
Log Pseudolikelihood -6556.46 -5692.29 -5024.99# of Observations 2,334 2,031 1,854# of Individuals 778 677 618
Notes: Interval regressions (Stewart, 1983). Standard errors clustered onindividual level in parentheses.Dependent variable: Interval of IDF. The interval of IDF is calculated asfollows (see also, Harrison et al., 2002): For each of the three price listsand for each individual, we observe a range of possible IDF s from IDFlowto IDFhigh. This results in three interval observations per individual. Wecontrol for the differences in t and τ of the underlying price lists using thevariables Delta Time and Has Present which indicate whether the pricelist involves a time delay of six months and whether the price list involvesthe present, respectively.Level of significance: * p <0.1, ** p <0.05, *** p <0.01.
27
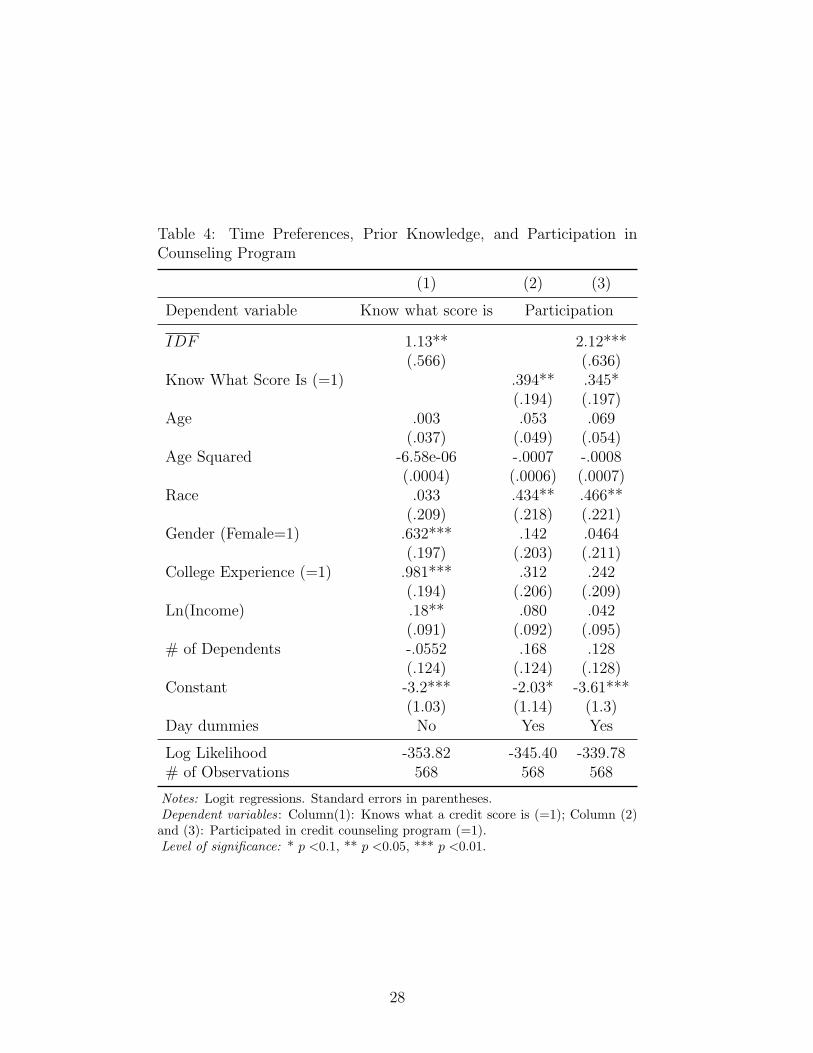
Table 4: Time Preferences, Prior Knowledge, and Participation inCounseling Program
(1) (2) (3)
Dependent variable Know what score is Participation
IDF 1.13** 2.12***(.566) (.636)
Know What Score Is (=1) .394** .345*(.194) (.197)
Age .003 .053 .069(.037) (.049) (.054)
Age Squared -6.58e-06 -.0007 -.0008(.0004) (.0006) (.0007)
Race .033 .434** .466**(.209) (.218) (.221)
Gender (Female=1) .632*** .142 .0464(.197) (.203) (.211)
College Experience (=1) .981*** .312 .242(.194) (.206) (.209)
Ln(Income) .18** .080 .042(.091) (.092) (.095)
# of Dependents -.0552 .168 .128(.124) (.124) (.128)
Constant -3.2*** -2.03* -3.61***(1.03) (1.14) (1.3)
Day dummies No Yes Yes
Log Likelihood -353.82 -345.40 -339.78# of Observations 568 568 568
Notes: Logit regressions. Standard errors in parentheses.Dependent variables: Column(1): Knows what a credit score is (=1); Column (2)and (3): Participated in credit counseling program (=1).Level of significance: * p <0.1, ** p <0.05, *** p <0.01.
28

A Appendix
A.1 Instructions
As a tax filer at this Volunteer Income Tax Assistance site you are automatically entered in a rafflein which you could win up to $50. Just follow the directions below:
How It Works: In the boxes below you are asked to choose between smaller payments closer totoday and larger payments further in the future. For each row, choose one payment: either the smaller,sooner payment or the later, larger payment. When you return this completed form, you will receive araffle ticket. If you are a winner, the raffle ticket will have a number on it from 1 to 22. These numberscorrespond to the numbered choices below. You will be paid your chosen payment. The choices youmake could mean a difference in payment of more than $35, so CHOOSE CAREFULLY!!!RED BLOCK (Numbers 1 through 7): Decide between payment today and payment in one monthBLACK BLOCK (Numbers 8 through 15): Decide between payment today and payment in sixmonthsBLUE BLOCK (Numbers 16 through 22): Decide between payment in six months and payment inseven months
Rules and Eligibility: For each possible number below, state whether you would like the earlier,smaller payment or the later, larger payment. Only completed raffle forms are eligible for the raffle.All prizes will be sent to you by normal mail and will be paid by money order. One out of ten raffletickets will be a winner. You can obtain your raffle ticket as soon as your tax filing is complete. Youmay not participate in the raffle if you are associated with the EITC campaign (volunteer, businessassociate, etc.) or an employee (or relative of an employee) of the Federal Reserve Bank of Boston orthe Federal Reserve System.
[Red Block; t = 0, τ = 1]TODAY VS. ONE MONTH FROM TODAY WHAT WILL YOU DO IF YOU GET A NUMBERBETWEEN 1 AND 7? Decide for each possible number if you would like the smaller payment forsure today or the larger payment for sure in one month? Please answer for each possible number(1) through (7) by filling in one box for each possible number.Example: If you prefer $49 today in Question 1 mark as follows: X $49 today or $50 in one monthIf you prefer $50 in one month in Question 1, mark as follows: $49 today or X $50 in one monthIf you get number (1): Would you like to receive $49 today or $50 in one monthIf you get number (2): Would you like to receive $47 today or $50 in one monthIf you get number (3): Would you like to receive $44 today or $50 in one monthIf you get number (4): Would you like to receive $40 today or $50 in one monthIf you get number (5): Would you like to receive $35 today or $50 in one monthIf you get number (6): Would you like to receive $29 today or $50 in one monthIf you get number (7): Would you like to receive $22 today or $50 in one month
[Black Block; t = 0, τ = 6]TODAY VS. SIX MONTHS FROM TODAY WHAT WILL YOU DO IF YOU GET A NUMBERBETWEEN 8 AND 15? Now, decide for each possible number if you would like the smaller paymentfor sure today or the larger payment for sure in six months? Please answer each possible number(8) through (15) by filling in one box for each possible number.If you get number (8): Would you like to receive $49 today or $50 in six monthsIf you get number (9): Would you like to receive $47 today or $50 in six monthsIf you get number (10): Would you like to receive $44 today or $50 in six monthsIf you get number (11): Would you like to receive $40 today or $50 in six monthsIf you get number (12): Would you like to receive $35 today or $50 in six monthsIf you get number (13): Would you like to receive $29 today or $50 in six monthsIf you get number (14): Would you like to receive $22 today or $50 in six months
29

If you get number (15): Would you like to receive $14 today or $50 in six months
[Blue Block; t = 6, τ = 1]SIX MONTHS FROM TODAY VS. SEVEN MONTHS FROM TODAY WHAT WILL YOU DO IFYOU GET A NUMBER BETWEEN 16 AND 22? Decide for each possible number if you wouldlike the smaller payment for sure in six months or the larger payment for sure in seven months?Please answer for each possible number (16) through (22) by filling in one box for each possiblenumber.If you get number (16): Would you like to receive $49 in six months or $50 in seven monthsIf you get number (17): Would you like to receive $47 in six months or $50 in seven monthsIf you get number (18): Would you like to receive $44 in six months or $50 in seven monthsIf you get number (19): Would you like to receive $40 in six months or $50 in seven monthsIf you get number (20): Would you like to receive $35 in six months or $50 in seven monthsIf you get number (21): Would you like to receive $29 in six months or $50 in seven monthsIf you get number (22): Would you like to receive $22 in six months or $50 in seven months
30

A.2 Appendix tables
Table A1: IDF from Each Time Frame and Participationin Counseling Program
(1) (2) (3)
IDFt=0,τ=1 1.27***(.409)
IDFt=0,τ=6 3.64***(1.18)
IDFt=6,τ=1 1.72***(.418)
Age .072* .075* .082*(.043) (.043) (.045)
Age Squared -.0009* -.001* -.001*(.0005) (.0005) (.0005)
Race .469** .433** .447**(.212) (.211) (.212)
Gender (Female=1) .103 .108 .102(.196) (.196) (.196)
College Experience (=1) .432** .438** .392**(.194) (.195) (.195)
Ln(Income) .0265 .031 .0233(.090) (.089) (.089)
# of Dependents .129 .113 .079(.119) (.119) (.122)
Constant -2.79** -5.24*** -3.26***(1.12) (1.57) (1.15)
Day dummies Yes Yes Yes
Log Likelihood -374.79 -374.88 -371.26# of Observations 618 618 618
Notes: Dependent variable: Participated in credit counseling pro-gram (=1). Logit regressions. Robust standard errors in parentheses.Level of significance: * p <0.1, ** p <0.05, *** p <0.01.
31

Table A2: Participation in Counseling Program and # of Pa-tient Choices
(1) (2) (3)
# of Patient Choices .0418*** .0405*** .0404***(.0103) (.0116) (.0128)
Age .107*** .0759*(.0396) (.0438)
Age Squared -.00141*** -.000961*(.000488) (.00053)
Race .398** .453**(.199) (.213)
Gender (Female=1) .212 .0995(.178) (.197)
College Experience (=1) .427**(.195)
Ln(Income) .0193(.09)
# of Dependents .107(.12)
Constant -.256 -2.28*** -2.21**(.337) (.844) (1.07)
Day dummies Yes Yes Yes
Log Likelihood -492.10 -419.22 -374.33# of Observations 778 677 618
Notes: Dependent variable: Participated in credit counseling program(=1). Logit regressions. Robust standard errors in parentheses.Level of significance: * p <0.1, ** p <0.05, *** p <0.01.
32

Table A3: IDF and Participation in Counseling Program(Including Multiple Switchers)
(1) (2) (3)
IDF 2.24*** 2.18*** 2.2***(.46) (.524) (.563)
Age .070** .043(.033) (.039)
Age Squared -.0009** -.0005(.0004) (.0005)
Race .361* .439**(.188) (.203)
Gender (Female=1) .189 .067(.167) (.186)
College Experience (=1) .435**(.185)
Ln(Income) .0147(.082)
# of Dependents .128(.113)
Constant -1.82*** -3.13*** -3.17***(.482) (.855) (1.09)
Day dummies Yes Yes Yes
Log Likelihood -552.08 -470.38 -421.28# of Observations 872 751 687
Notes: Dependent variable: Participated in credit counseling pro-gram (=1). Logit regressions. Robust standard errors in parentheses.Level of significance: * p <0.1, ** p <0.05, *** p <0.01.
33