discounted cash flow valuation of pandora a/s
TRANSCRIPT

DISCOUNTED CASH FLOW VALUATION OF
PANDORA A/S
ANANTAPORN LAPSAKKARN
A THEMATIC PAPER SUBMITTED IN PARTIAL
FULFILLMENT OF THE REQUIREMENTS FOR
THE DEGREE OF MASTER OF MANAGEMENT
COLLEGE OF MANAGEMENT
MAHIDOL UNIVERSITY
2018
COPYRIGHT OF MAHIDOL UNIVERSITY

Thematic paper
entitled
DISCOUNTED CASH FLOW VALUATION OF
PANDORA A/S
was submitted to the College of Management, Mahidol University
for the degree of Master of Management
on
January 6, 2018
………………………..…...………......
Mr. Anantaporn Lapsakkarn
Candidate
.............................................................. ..............................................................
Asst. Prof. Nareerat Taechapiroontong, Asst. Prof. Piyapas Tharavanij,
Ph.D. Ph.D.
Advisor Chairperson
.............................................................. ..............................................................
Duangporn Arbhasil, Assoc. Prof. Tatre Jantarakolica,
Ph.D. Ph.D.
Dean Committee member
College of Management
Mahidol University
ii
ACKNOWLEDGEMENTS
I wish to take this opportunity to express my gratitude to individuals who
supported me throughout my Master degree program.
I would like to show my warm thanks to my advisor, Ajarn Nareerrat
Taechapiroontong, and Asst. Prof. Piyapas Tharavanij for their valuable advice and
precious time given for my study and paper. They helped me learn and understand more
about relative and discounted cash flow valuations, and I would not have completed this
paper without all their support.
My great thanks and appreciations also go to all of my friends and classmates,
who always support and encourage me during my study
Most importantly, I am greatly indebted to my mom, Ms. Suda Promnoi for
her life-long support in any way to bestow this journey to be proudly achieved. At last,
I would like to thank Mr. Bhon Wongsrisakul for being confident, corporation, and broad-
mindedness through the completion of the project.
Anantaporn Lapsakkarn

iii
DISCOUNTED CASH FLOW VALUATION OF PANDORA A/S
ANANTAPORN LAPSAKKARN 5949010
M.M. (FINANCIAL MANAGEMENT)
THEMATIC PAPER ADVISORY COMMITTEE: ASST. PROF. NAREERAT
TAECHAPIROONTONG, Ph.D., ASSOC. PROF. TATRE JANTARAKOLICA,
Ph.D., ASST. PROF. PIYAPAS THARAVANIJ, Ph.D.
ABSTRACT
This thematic paper demonstrated how to value the stock price of PANDORA
A/S which applied the concept of discounted cash flow to firm model, creating a forecast
and calculating a reasonable valuation of the firm’s share price and at the end making a
decision whether to buy/hold/sell the company’s stock.
Pandora A/S is a Denmark-based company engaged in the design, manufacture,
and marketing of jewelry. Its product offering is divided into five categories: charms
and bracelets, earrings, rings, watches, and necklaces and pendants. The company had
very impressive growth rate during the past 5 years. Moreover, the company had invested
in the new factory at Lamphun which worth than 1.8 Billion DKK and started the
commercial production in early 2017 which will increase the production capacity to
reach 200 million units/year. The new investment is expected to support their expansion
strategy and deliver better earnings for the company
The result from this paper shows the value of PNDORA share price is
expected to be valued at 16% higher than the current share price. Additional with the
potential growth and their strong business model. This result leads to my recommendation of
“Hold/Buy”.
KEY WORDS: PNDORA/ Discounted Cash Flow/ Jewelry Industry
60 pages

iv
CONTENTS
Page
ACKNOWLEDGEMENTS ii
ABSTRACT iii
LIST OF TABLES vi
LIST OF FIGURES vii
LIST OF ABBREVIATIONS ix
CHAPTER I INTRODUCTION 1
1.1 Highlights 1
1.1.1 Strong revenue growth 1
1.1.2 High and sGross margin and EBITDA margin 1
1.1.3 High Dividend pay-out and share buyback 1
1.1.4 High investment in the factory 2
1.1.5 Strong no. of brand shop expansion 2
1.2 Business Description 4
1.2.1 Company Strategies 5
1.2.2 Product Portfolio 7
1.3 Macro-Economic Analysis 9
1.3.1 EMEA 10
1.3.2 America 11
1.3.3 The Asia Pacific 11
1.4 Industry Analysis 12
1.4.1 Internationalization of brands and industry
consolidation 13
1.4.2 Growth of branded jewelry 14
1.4.3 Reconfiguration of the channel landscape 15
1.4.4 Fashionability and acceleration 16
1.4.5 Brand Position 17

v
CONTENTS (cont.)
Page
1.5 Competition Analysis 18
1.5.1 Pandora’s Competitive position 19
1.5.2 Peer Comparison 20
1.6 Investment Summary 24
1.6.1 Strong Revenue and EBITDA growth 24
1.6.2 Huge Dividend pay-out and share buyback 24
1.6.3 High gross profit margin 25
1.6.4 Strong business model 25
1.6.5 Plenty room for opportunities 25
CHAPTER II FINANCIAL STATEMENT ANALYSIS 26
2.1 Highlights 26
2.1.1 Revenue growth 26
2.1.2 Improvement in gross profit margin 27
2.2 Key financial ratio analysis 27
2.2.1 ROA and ROE 27
2.2.2 Current Ratio and DE ratio 28
2.2.3 Days Inventory Outstanding and Days Sales
Outstanding 29
2.3 Investment Risk and Downside Possibilities 31
2.3.1 Financial Risk 31
2.3.2 Operational Risk 32
2.3.3 Strategic risk 32
2.3.4 Other risk 33
CHAPTER III COMPANY VALUATION 35
3.1 Methodology 35
3.2 Key Assumptions 35
3.2.1 Revenue and growth rate 35
3.2.2 Cost of Sales 37

vi
CONTENTS (cont.)
Page
3.2.3 Sales and Administration cost 38
3.2.4 Capital Expenditure 39
3.2.5 Working Capital 39
3.2.6 Weighted Average Cost of Capital (WACC) 39
3.3 Discounted Cashflow Valuation 41
3.4 Sensitivity and scenario analysis 41
CHAPTER IV DATA 43
4.1 The Business Structure 43
4.2 CORPORATE GOVERNANCE 44
4.2.1 Board of Directors And Executive Management 44
4.2.2 Board Activities In 2016 45
4.2.3 The Audit Committee 45
4.2.4 The Remuneration Committee 46
4.2.5 The Nomination Committee 46
4.2.6 Board self-evaluation 47
4.3 SWOT Analysis 48
4.4 Five Forces Analysis 50
4.5 Income Statement 52
4.6 Balance sheet 52
4.7 Statement of Cash Flow 53
4.8 Common size analysis 53
4.9 Trend and Growth analysis 54
4.10 Key financial ratio 56
REFERENCES 59
BIOGRAPHY 60

vii
LIST OF TABLES
Table Page
1.1 Overall share summary 2
2.1 Revenue growth 26
2.2 Risk Matrix 31
2.3 Company hedging strategy 32
2.4 Store Network and number of Points of Sale 33
3.1 Average growth 35
3.2 Comparison of growth rate and correlation of estimated growth 37
3.3 Cost of sale Forecast 38
3.4 Cost of Debt 40
3.5 Cost of Equity 40
3.6 WACC 40
3.7 DCF table 41
3.8 Two ways sensitivity analysis 42
3.9 Scenario Summary 42
4.1 Major Shareholders and Free-Float 43
4.2 Projected Income Statement 53
4.3 Projected Balance Sheet 53
4.4 Projected Cash Flow statement 54
4.5 Income Statement 54
4.6 Balance Sheet 55
4.7 Income statement – trend 55
4.8 Income statement - growt 56
4.9 Balance sheet - trend 56
4.10 Balance sheet – growth 57
4.11 Key financial ratios 57

viii
LIST OF FIGURES
Figure Page
1.1 Price movement 3
1.2 EBITDA Margin 3
1.3 Dividend and Share buyback 3
1.4 Total Concept store at the end of 2017 4
1.5 Revenue from other Categories 8
1.6 Revenue Breakdown by Geography 9
1.7 Percentage of Branded jewelry 15
1.8 Brand awareness development 18
1.9 Competitive Positioning 24
2.1 Gross profit margin 27
2.2 ROA 28
1.3 ROE 28
2.4 Current Ratio 29
2.5 D/E Ratio 29
2.6 Days Inventory Outstanding 30
2.7 Days Sales Outstanding 30
3.1 Growth pattern 36
3.2 Growth forecast 36
3.3 Stable growth rate 37
3.4 Silver price Forecast 38
3.5 Number of employee and cost 39
3.6 Sensitivity graph 42
4.1 Management Board 44
4.2 SWOT Analysis 49
4.3 Five Forces Analysis 51

ix
LIST OF ABBREVIATIONS
BV Book Value
CAGR Compound Annual Growth Rate
CAPEX Capital Expenditure
COGS Cost of Goods Sold
D/E Debt/ Equity
EBIT Earnings before Interest and Taxes
EBITDA Earnings before Interest, Taxes and Depreciation
EPS Earning Per Share
EV Enterprise Value
GDP Gross Domestic Product
N/I Net Income
NOPAT Net Operating Profit after Taxes
NOWC Net Operating Working Capital
P/E Price/ Earnings
QoQ Quarter on Quarter
ROA Return on Assets
ROE Return on Equity
SG&A Selling, General and Administrative Expense
SWOT Strength, Weakness, Opportunity and Threats
YoY Year on Year

1
CHAPTER I
INTRODUCTION
1.1 Highlights
1.1.1 Strong revenue growth
The company revenue growth astonishingly. In 2016, Group revenue was
DKK 20,281 million or increase 21% compared with DKK 16,737 million in 2015. The
continued growth in revenue was driven by all regions. In terms of CAGR, the company
revenue CAGR was 36.8%
1.1.2 High and stable Gross margin and EBITDA margin
As we know, to increase Gross margin, a company need to choose whether
increase their price or reduce their cost. For Pandora, it tends to be latter. Due to the
vertical integration, which allows them to manage almost all of their supply and value
chain. Therefore, Pandora can control their cost of production. Ultimately, they can
maintain high and stable Gross Margin as well as EBITDA margin. This figure also
reflects their cost managed during the risen of silver price in 2012. Despite the increase in
the silver price Pandora still maintain the impressive Gross Margin and EBITDA margin.
1.1.3 High Dividend pay-out and share buyback
Since 2013, the company aggressive paid dividend and buy back stock to
favor the investor. In 2016 Pandora paid 5.5 billion DKK in total for their dividend
payout and stock buyback program. In 2017, the company plans to changes dividend
payout policy, they will pay 9 DKK/ share for every quarter, given that the investor will
get 36 DKK/ share in total on 2017

2
1.1.4 High investment in the factory
The new crafting facility in Thailand is setting new standards for the jewelry
industry in terms of scale and speed – and is one of the most environmentally friendly
jewelry-crafting facilities ever built. The total investment is DKK 1.8 billion. The new
facility opened internally in October 2016, with commercial production beginning in
early 2017. This investment will increase the company production capacity from current
122 million units/ year to reach 200 million units/ year on 2019. Due to the factory
investment, this capacity increase should be able to cover the production demand until
the end of 2026
1.1.5 Strong no. of brand shop expansion
In 2017, PANDORA plans to continue to expand the store network and
expects to add more than 275 new concept stores during the year of which roughly 50% are
expected to be opened in EMEA, 25% in Americas and 25% in the Asia Pacific.
PANDORA expects around half of the concept store openings to be PANDORA owned
stores, which is in line with the Company’s intentions to increase the owned and operated
retail footprint. The shop expansion also align with their strategy as the concept store
will help them to increase both control and margin over the 3rd parties shop. Base on
their plan we expect the firm will have 2,413 concept stores in total at the end of 2017
Table 1.1 Overall share summary

3
Figure 1.1 Price movement
Source: Bloomberg
Figure 1.2 EBITDA Margin
Figure 1.3 Dividend and Share buyback

4
Figure 1.4 Total Concept store at the end of 2017
Date: 21 December 2017
Ticker: CPH: PNDORA
Recommendation: Hold/Buy
Price: 659 DKK
Target Price: 762 DKK
Upside: 15.6%
1.2 Business Description
Pandora A/S is a Denmark-based company engaged in the design, manufacture,
and marketing of jewelry. Its product offering is divided into five categories: charms
and bracelets, earrings, rings, watches, and necklaces and pendants, among others. Its
products are made of gold, silver, leather, and textile. Among others. The Company’s
products are sold globally through such points of sale, as concept stores, shop- in-shops,
gold stores, silver stores, white and travel retail stores, third- party stores and a number
of unbranded boutiques. The Company is present in more than 70 countries in such
geographical regions, as Europe, the Middle East, Africa, North America, South and
Central America and the Asia Pacific.
656
1,344
413
Total concept store at the end of 2017
America EMEA Asia Pacific
America EMEA Asia Pacific Total
Total concept store at the end of 2017 656 1,344 413 2,413
588 1,206 344 2,138
68 138 69 275
No. of concept store in 2016
Increase of concept store in 2017

5
1.2.1 Company Strategies
In order to become the world’s most loved jewelry brand, Pandora has designed
their strategy around four strategic pillars. These form the basis of their work, and they
are convinced that they can achieve their aspiration by executing on these pillars in all
they do.
1.2.1.1 Full Jewelry offering
PANDORA offers a full assortment of jewelry. Charms and
Bracelets are still their strongest products and they will continue to protect and grow
this category. At the same time, however, they are continuing to develop other jewelry
categories, one at a time.
To strengthen this strategy, Pandora tries to diverse and increase
their sales to other accessories. in the example, they successfully built their Rings category
over the last few years On 2016, rings made up 13% of their total revenue. They also
expand their product line to the earring. Approximately10% of new product launched
in 2016 are earring and this could benefit with their sales and future growth.
Their product is Consumer- centric design, innovation and
produces high skill crafting in Thailand. To strengthen their front-end design process in
2016 to increase innovation and customer-focus in our designs. This included creating two
new departments – Commercial Innovation and Product Innovation
Their launching strategy is seven product launches a year, arranged
around traditional fashion and gift-giving seasons, to ensure consumers have a constant
variety of new PANDORA products to choose from their launching 7 times per year.
This launching strategy also plays the significant role in their growth.
1.2.1.2 One brand – Targeted Segments
They maintain one brand across the globe that is instantly
recognizable and known to offer a full range of jewelry products. However, they also
employ a segmented approach that addresses consumers in a more targeted way. The
PANDORA brand is unique. Through their employee, products, stores, the marketing
they have created a brand that not only celebrates the individuality of every woman but
also lets her express this uniqueness in her own special way.
To preserve the strength of the brand and ensure they maintain
a unique connection with consumers, they maintain one brand across the globe that is

6
instantly recognizable. However, they target group of women between 18 and 49 years
of age is broad, and there are several different consumer segments within this target
group, each with individual characteristics. As each of the main markets has identified
primary consumer segments, as well as secondary consumer segments that represent
their strongest growth opportunities Pandora also adopt a segmented approach to a
marketing campaign to target each group of customers.
On the previous year, they strengthen their marketing team by
established a Marketing Board, that includes our regional marketing vice presidents.
The Marketing Board meets regularly to ensure that they will capture feedback, listen
to the customer need and understand the difference of the customer in each market
They spent 9% of their revenue in 2016 to marketing campaigns
and channel. They increase their online advertising through social media in order to
connect, interact and engage with their customer. Additionally, they also enhanced
CRM by continuous online engagement via a variety of social media platforms such as
Facebook, the PANDORA Club, and Instagram.
1.2.1.3 Branded Retail Excellence
They offer their consumers a unique PANDORA shopping
experience through excellent retail execution. In some cases, stores are run by franchisees; in
other cases, they own and operate stores their selves. Since their goal is to ensure the
consumers will have a unique PANDORA shopping experience they invested a lot in
their Branded store and Concept store network. Their concept stores have been designed to
show their universe of jewelry at its best. From window displays to product zones and
interaction with sales staff, the entire experience reinforces Pandora brand. As they have
expanded their concept store, the customer could visit these stores in most shopping
malls in the world.
The brand store allows them to have full control over the
consumer shopping experience, and this also has the significant impact on their sales.
In 2016, sales from the brand store increased 5% compared with 2015. From all of above
benefit, Pandora will continually increase brand store. On the other hand, we could expect
that Multibranded stored which historically been an important part of their strategy in the
beginning period will be decreased

7
1.2.1.4 Balanced global business
They ensure balance in their geographical footprint by sustaining
strong performance in developed markets while also increasing their revenue share in
new and emerging markets. As the global jewelry market expected to continually grow.
Pandora ensures they have a balanced global business in which they grow their presence in
new markets while also increasing revenue in developed markets such as China, Italy,
and France.
This strategy also reflects on their 2016 performance, as they
increase their group revenue in the Asia Pacific to offset the decrease of sales in Americas
region. The increase of sales support by the growth of middle class in China which is
the important emerging market for Pandora. In fact, China is the world’s largest jewelry
market. To show they effort, in 2016, they opened a total of 44 new concept stores,
entering five new cities as well as the eSTORE to capture more customer from the
mainland.
Despite the sales decreased, US remains their largest market in
terms of revenue, and PANDORA has extremely high brand awareness among US
consumers. In order to further strengthen their sales and brand image, they upgraded
more than 200 of their established shop and opened 264 brands stored in 2016.
The other important market is Italy; one of the largest jewelry
markets in Europe, but it remains fragmented. This market is the huge opportunity for
them to strength and expands their brand. In 2016 they opened 23 concept stores, giving
them to have a total network of 75 concept stores at the end of 2016
1.2.2 Product Portfolio
Currently, their product could be separated into 3 subcategories. Ranking by
share 1st is Bracelets and Charm, Ring, Other Jewelry (Necklace and Earring).
However, Pandora try to diversify their portfolio by increasing the share of another
product category as shown in Figure 1.5 to reduce the sales concentration in Bracelets
and Charm category

8
Figure 1.5 Revenue from other Categories
Source: Pandora Annual Report
Brace and Charm, this product has been the original product line of their
brand which makes they become a famous brand all over the world. The concept of
brace and charm allow them to get the repeat customer. Once the customer purchases
the Pandora brace, they will continue to buy (at least) several charms. As the concept of
a product that “Charm” will be the storyteller. Hence customer could combination their
charms to make their Brace and Charm unique.
Since, they aware of the rapid change of fashion trend, Pandora continually
offer the new and innovative collection of charm to their customer. At the end of 2015.
Pandora launched the PANDORA Rose collection globally as well as the introduction
of the Disney collection in the Asia Pacific.
Additionally, Charm is considered as the valuable, easy and safe gift to the
Pandora owner. Hence, they could boost up their sales during gift-giving seasons and
special occasions around the year
Rings, to strengthen their brand and as a part of their “FULL JEWELRY
PRODUCT OFFERING” strategy. Pandora included the ring in their portfolio since
2013. Ring sales increased by 28% in 2016, and this product becomes the 2nd rank of
sales in their portfolio
Other Jewelry, in 2016, they had a special focus on earrings. They increase
their marketing campaign to increase the customer awareness. Out of a total of 426 new
products which were launched in 2016, 46 were earrings. Revenue from earrings accounted
for 5% of their total sales, an increase of around 80% compared with 2015.

9
The other products are Necklaces and Pendants which made up 5% of their
total revenue in 2016, compared with 3% in 2015
1.3 Macro-Economic Analysis
After the financial crisis in 2008, the global economy becomes more stable.
The average expected annual real growth until 2020 will be 3-4%. The main factors are
including the lower commodity and fuel price, combination of these lower input price
provide a boost up in aggregate demand and global growth.
We expect the growth rate in emerging market will be more than 4% which
fuel by 2020-Seven group, the fast-growing markets China, Malaysia, Chile, Peru, Mexico,
and the Philippines. In additionally the high-potential Sub-Saharan Africa markets will
be a big contribution to the global economy. On the other hand, the growth in an advanced
market expected to be 2%. This conservative figure is due to the uncertain situation in
the European Union.
However, there are some of the negative factors that we need to including it
for consideration, in the example the turmoil of politics between some big countries will
have significantly affected with sustainable growth. The other main consideration in
global climate, especially the huge natural disaster in major countries. Some of it create
a huge impact and slow down the potential growth
Figure 1.6 Revenue Breakdown by Geography
Source: Pandora Annual Report
47%
34%
19%
Revenue Breakdown by Geography
EMEA America Asia Pacific

10
1.3.1 EMEA
EMEA is Europe, Middle East, and Africa. The region classification for a
division of an international company that operates in Europe, the Middle East, and Africa.
The total estimated population of the EMEA region is between 2.1 and 2.2 billion people
occupying the land from the most northern parts of Europe all the way to the southern
tip of Africa. EMEA makes up about $27.5 Trillion in Gross Domestic Product every
year. This is about 38% of the world GDP. Base from both figure, we could say that
EMEA is one of the very important markets and any firm shouldn’t ignore this potential
market.
For Pandora. EMEA is the biggest source of company revenue as it represents
DKK 9,556 million almost half of the firm revenue in 2016. The growth of the revenue in
this market is about 33% in local currency. The strong revenue and growth are driven
by major markets in this region.
Starting by PANDORA’s largest market in Europe, UK is accounting for
28% of the revenue of EMEA or DKK 2,704 million, it was 25% growth (in the local
currency) from the previous year. Growth in the UK was driven by a positive sales-out
performance, as well as the expansion of the store network, including net 33 new concept
stores opened in 2016, taking the total number of concept stores to 228. The real GDP
growth in England is expected to be 1.4% and inflation(CPI) around 2.8% on 2017-2018.
The low GDP is affected by the uncertainty situation on Brexit and low household
spending power from higher inflation and sluggish wage growth.
Next is Italy, representing around 20% of revenue from EMEA, increased
54% compared with 2015. The development was primarily driven by a strong performance
in the existing store network, supported by the addition of net 23 concept stores to a
total of 75 at the end of 2016.
Revenue in France and Germany represented around 10% of revenue, the
increase was primarily driven by a strong like-for-like performance in concept stores
from EMEA and increased by 59%

11
1.3.2 America
The US remains Pandora largest single market, delivering 25% of our total
revenue in 2016. they also have a strong presence in the Canadian market with 78 concept
stores and making up 12% of revenue in the region. There is still great untapped.
As part of their expansion, they opened net 264 branded stores, including
net 27 concept stores. Pandora closed net 829 multibranded stores including an upgrade
of their presence in more than 200 stores run by the US jewelry chain Jared to shop-in-
shops. This strengthening of the PANDORA brand is certainly working. Data from
ShopperTrak Market Intelligence shows footfall traffic to US malls was 6.9% lower in
2016 compared with 2015. Despite this slow traffic to US malls, they delivered 5%
growth in 2016, with both our physical stores and their eSTORE, which opened in 2015,
performing well.
On 2016 revenue in the Americas was DKK 6,852 million in total or increase
5% from 2015. The increase was driven by continued growth in North America, while
revenue from Latin America decreased due to a difficult business environment. During
2016, the number of branded stores in the Americas increased by net 302 to a total of
1,484 stores, while net 957 of PANDORA’s multi-branded stores were closed in the
same period.
The GDP growth rate of America is around 2% or above during the couples of
years. This will support the growth of Pandora in US market. Additionally, with the
increasing of Pandora Concept store, they should be able to increase the brand awareness and
boost up firm margin in US market
1.3.3 The Asia Pacific
The Asia Pacific was the fastest-growing region of Pandora in 2016. However,
this region still holds significant potential. In many countries in the region, Pandora
presence is still limited, including large jewelry markets such as China.
China is the world’s largest jewelry market, with an estimated value of
around DKK 700 billion. This makes it an important emerging market for PANDORA.
The brand awareness is of high importance for Chinese consumer and in 2016 Pandora
concentrated on growing their presence and brand awareness across the country. They
plan to open around 40 new concept stores in China every year and will continue to do

12
so for the next couple of years. In 2016, They opened a total of 44 new concept stores,
entering five new cities. In addition, they opened an eSTORE and entered into an
agreement with Alibaba Group to sell their products on its Tmall.com website. These
efforts are clearly working. In 2016, aided brand awareness among women increased to
53% in Beijing and Shanghai, compared with 35% in 2015, and their revenue grew by
175%. All this has given them a strong foundation in China. But China still holds great
potential for PANDORA, and They will continue to expand over the coming years at a
controlled but ambitious pace. The economic outlook for China is pretty well. As their
GDP continually increase at two digits over the decade and still have potential growth
in the further coming years. One of the upside factors is the transition from
manufacturing and investment to the consumption-driven country will give benefit to
the jewelry business. Also the increasing of medium class in China who tend to spend
more on the luxury product than their predecessor. This group of people will be one of
the very important targets customer for Pandora.
Beside of the major country like China, Asia Pacific also includes a number of
developed markets and they continued to grow in these markets in 2016. Australia, for
example, saw revenue grow by 37%, benefit from the increase of 11 concept stores and
driven by increasing sales in all product categories. Revenue in Australia, constituting around
40% of revenue from the Asia Pacific. The economic outlook for Australia is pretty well.
As the consumption expenditure in Australia is account for 57% of the total gross national
turnover of goods and services. Beside of this figure, the average total consumption
expenditure growth since 1987 is about 3%. Given these figures, we could understand that
Australia is one of the big consumption driven country. This reflects the potential
opportunity for the Pandora to growth in this market.
1.4 Industry Analysis
The global fine jewelry market is estimated to be worth approx. EUR 250
billion (DKK 1,860 billion) in 2016, and it has grown at some 5%+ CAGR historically.
As of today, it remains a fairly local and fragmented business. The top-10 players capture
less than 15% of the total market

13
The jewelry industry is still shined in future. Annual global sales of EUR
148 billion (DKK 1,100 billion) are expected to grow at a healthy rate of 5 to 6 percent
each year, totaling EUR 250 billion by 2020. Jewelry consuming was dampened by the
global recession and now seem to be recovered. But the industry is as dynamic as it is
fast growing. So, jewelry players can’t simply do business as usual and expect to grow;
they must be alert and responsive to important trends and developments or the risks and
competitors.
According to the analysis of publicly available data, studied companies’
annual reports, and interviewed 20 executives at global fine-jewelry and fashion-jewelry
companies and industry associations performed by McKinsey’s. The research indicates
that five trends that shaped jewelry industry:
1. Internationalization and consolidation,
2. The growth of branded products,
3. A reconfigured channel landscape,
4. “hybrid” consumption
5. Fast fashion.
1.4.1 Internationalization of brands and industry consolidation
Today, many national brands have been outpaced by international brands
such as Zara and H&M. Others have built or expanded their international presence. Hugo
Boss’s sales outside Germany, for example, grew from 50 percent of its total sales in
1990 to more than 80 percent today. Apparel has become a truly global business. And
it is expected that jewelry to follow a similar path. Today, the jewelry industry is still
primarily local.
The ten biggest jewelry groups capture a mere 12 percent of the worldwide
market, and only two—Cartier and Tiffany & Co.—are in Interbrand’s ranking of the
top 100 global brands. The rest of the market consists of strong national retail brands,
such as Christ in Germany or Chow Tai Fook in China, and small or midsize enterprises
that operate single-branch stores.
Industry experts expect that a lot of national or regional jewelry brands will
join the ranks of top global brands by 2020 - Swarovski is an example. In addition, some
local brands will almost certainly become known globally as a result of industry consolidation:

14
international retail groups will acquire small, local jewelers. Some industry observers
project that the ten largest jewelry houses will double their market share by 2020, primarily
by acquiring local players.
1.4.2 Growth of branded jewelry
Branded items already account for 60 percent of sales in the watch market.
While branded jewelry accounts for only 20 percent of the overall jewelry market today, its
share has doubled since 2003 (Exhibit 1). Industry experts believe branded jewelry will
claim a higher share of the market by 2020, but their views differ on how quickly this
shift will occur. Most expect that the branded segment will account for 30 to 40 percent
of the market in 2020.
The research identified three types of consumers driving the growth of
branded jewelry:
• “New money” consumers who wear branded jewelry to show off their
newly acquired wealth (in contrast to old-money consumers, who prefer heirlooms or
estate jewelry)
• Emerging-market consumers, for whom established brands inspire trust
and the sense of an upgraded lifestyle—a purchasing factor quoted by 80 percent of our
interviewees
• Young consumers who turn to brands as a means of self-expression and
self-realization
In the past, most of the growth in branded jewelry came from the expansion of
established jewelry brands, such as Cartier and Tiffany & Co., and new entrants such as
Pandora and David Yurman. By contrast, future growth in branded jewelry is likely to
come from non-jewelry players in categories such as high-end apparel or leather goods
companies like Dior, Hermès, and Louis Vuitton—introducing jewelry collections or
expanding their assortment.

15
Figure 1.7 Percentage of Branded jewelry
Source: McKinsey & Company
1.4.3 Reconfiguration of the channel landscape
In all major markets over the past decade, online sales of apparel have grown at
double-digit rates; in the United Kingdom, for instance, online sales now account for 14
percent of total apparel sales, up from approximately 1 percent in 2003. Today, online
jewelry sales are only 4 to 5 percent of the market, with substantial variations across
regions, brands, and types of jewelry. The industry experts believe this number will
reach 10 percent by 2020 for fine jewelry and won’t grow much beyond that. Their
rationale: most consumers prefer to buy expensive items from brick-and-mortar stores,
which are perceived as more reliable and which provide the opportunity to touch and
feel the merchandise. This is a crucial factor in a high-involvement category driven by
sensory experience. As for fashion jewelry, the industry experts predict a slightly higher
online share of sales, in the neighborhood of 10 to 15 percent by 2020.
Jewelry manufacturers can use digital media as a platform for conveying
information, shaping brand identity, and building customer relationships. According to
a recent McKinsey survey, two-thirds of luxury shoppers say they engage in online
research prior to an in-store purchase; one- to two-thirds say they frequently turn to
social media for information and advice. The offline landscape is also evolving. In
apparel, mono-brand stores have been gaining ground and some multibrand boutiques;
department-store sales are stagnating. The same is happening in jewelry. Pandora, for
example, quadrupled the size of its store network in just four years—from 200 locations
19% 20%40%
0%
20%
40%
60%
80%
100%
120%
2020E
% of Brand jewelry
Brand Unbrand

16
in 2009 to more than 800 in 2012. In 1990, there were just 2 Swarovski boutiques; by
2012, there were 860.
Jewelry players might consider focusing on mono-brand retail, which gives
them more control over their brands, closer contact with consumers, and higher margin
potential. Another potentially promising channel is multibrand boutique chains that provide a
carefully curated assortment of brands and products as well as a unique shopping
experience.
In light of this trend, fine jewelers might consider introducing new product
lines at affordable prices to entice younger or less affluent consumers, giving them an
entry point into the brand. Alternatively, fine-jewelry players could decide to play
exclusively in the high end and communicate that message strongly through its advertising,
in-store experience, and customer service. A brand like Harry Winston, for instance, is
very clear about what it stands for; a lower-priced offering would be dissonant with its
image and dilute its brand.
1.4.4 Fashionability and acceleration
Fine jewelry has so far been immune to the effects of fast fashion, but the
same can’t be said of the fashion-jewelry market. An example of fashionability: H&M, as
part of its guest-designer collaborations, introduced a flamboyant jewelry and accessories
collection by Vogue Japan editor Anna Dello Russo in December 2012, with item prices
ranging from €20 to €300. And an example of acceleration: Beeline, a German branded
jewelry player, is adding hundreds of new items to its assortment every month.
In the fast-fashion world, flexible companies with adaptive business systems
reap disproportionate rewards. Innovative jewelry players will emulate fast-fashion
apparel companies: they will react to trends quickly and reduce their product development
cycle times. Doing so will require closer collaboration with partners along the entire
value chain, from suppliers to designers to logistics providers. The evolution of the
apparel industry provides an interesting template for how the jewelry industry might
develop. To what degree the two industries will mirror each other remains to be seen, but it
seems likely that the jewelry market of 2020 will be highly dynamic, truly globalized, and
intensely competitive. Those jewelry companies that can best anticipate and capitalize on

17
industry-changing trends, particularly the five described above will shine brighter than
the rest.
Base from “A multifaceted future: The jewelry industry in 2020” from
McKinsey & Company, they expected Jewelry market to grow at a healthy clip of 5 to
6 percent each year, totaling €250 billion by 2020. Currently, only 20% of the jewelry
market is branded (in contrast to watches, leather goods, and eyewear, which are
significantly higher). This could mean, in the Jewelry business there is some potential
growth by seizing market share from unbranded. Since, jewelry market is a fragment, a
combination of the local and international brand. Therefore, instead of competing with
each other, this should consider as the opportunity for the international brand to gain
their market share from local and unbranded jeweler
1.4.5 Brand Position
In Jewelry market, we could break down it into 3 main segments. 1st segment is
affordable price level which price tag less than $1,500 Pandora has operated in this
segment. The 1st segment is considerate as the biggest part of Jewelry business as it
accounts for 57% of total market. The 2nd segment is Luxury, which price tag ranging
from $1,500 - $10,000 and the 3rd segment is high-end jewelry which price above
$10,000
Below perceptual mapping demonstrates the brand position of Pandora and
their peers. This only includes “Affordable segment” and “Luxury segment”, since,
high-end jewelry focus on different target customer, and beyond the scope.
Within “Affordable segment” Pandora has continually increased their brand
awareness, from 36% in 2010 and reach 73% in 2015 more than twice time in only 5
years. According to the information shown on company financial report. Their brand
recognition is rank 2nd highest globally, higher than their competitors Tiffany & Co and
Cartier

18
Figure 1.8 Brand awareness development
Source: Pandora Annual Report
1.5 Competition Analysis
Women constitute half the world’s population, the demand for jewelry is
always there in any geography or culture. And, going by the demand for luxury goods,
the jewelry and watches industry comes next to the apparel industry.
The report titled “Global Luxury Jewelry Industry Situation and Prospects
Research report 2017” forecasts good growth for the luxury jewelry industry thanks to
rising exports of jewelry from India and China. In the economic growth of the developing
countries including India, the jewelry industry plays a vital role. It generates a lot of
work for the people who have associated with it apart from contributing substantially to
the country’s GDP.
The luxury jewelry industry’s growth avenues have been broadened with the
increasing use of jewels in other luxury products such as watches, bags, and apparels. Thus,
the rising indirect market for luxury jewelry is expected to give a further boost to the
luxury jewelry industry.
The luxury jewellery industry has a competitive landscape where some of
the major players are: Bulgari, DAMIANI, De Beers Diamond Jewellers, FJD, FOLLI
FOLLIE JAPAN LTD, Georg Jensen, GUCCI Group, Harry Winston, JOAQUIN BERAO
JAPAN, MUSEO, Richemont, San Freres S A, Tiffany & Co, UNO A ERRE JAPAN,
URAI
73%71%
65%
78%
60%
65%
70%
75%
80%
Pandora Tiffany&Co Cartier Swarovski
Brand awareness

19
1.5.1 Pandora’s Competitive position
Vertical integration, by using vertical integration, they can manage almost
all of their supply and value chain. The benefit of integration can demonstrate as below
• Allow them to control the cost of goods sold especially during the period
that the commodity price rises
• Improve product quality, due to the fact that all of factories and R&D lab
are owned by them, they can closely monitor and improve product quality
• Fast to change and implement a new strategy, this one of very important
benefit from their integration. Most of the companies which outsourcing production will
face the delay response in change or implement as it related to many stakeholders.
Vertical integration can reduce this complexity and allow the company to agile with the
change
• Shortening lead time in each process, as all of their plant and R&D lab
locates in Thailand. In fact, all of their factories located in the North of Thailand. This
geography concentrate allows them to shorten the lead time in each of process.
Strong brand, as we know, the brand is one of a big important asset for the
firm, especially in the luxury goods. The brand power can affect product position, sales
price and mark up. PANDORA has a very strong brand, especially in the brace and
charm market, which they’re considered as the biggest player in the market. Their
product was sales globally and continually expansion. Additionally, they also expand
their product line to another kind of accessories. This not only expands their product
category but also strengthen their brand.
As the nature of global jewelry market is a fragment, including with a lot of
small and local brand which striving and try to build up their brand name. Due to tiny
resources and negotiate power the small brands are facing a challenge from both supplier
and customer. On the other hand, the global brand like Pandora has benefited from their
customer base and negotiate power over the supplier.
When we compare with the similar player like Folli Follie, Pandora seems
to be more recognized in the jewelry market and well known than their competitors.
The high quality of craftsman product, the quality product, and trust is one
of the keys to maintaining customer loyalty. As Pandora control all of the production
process by vertical integration. They could easier to control the product quality than the
20
competitors who use outsourcing. The other main factors are their employee and skillful
craftsmanship at the North of Thailand, they are a lot of silver factory there. So, this means
they will be able to recruit the high experience staff locally. Pandora has very high
product quality, as they received the Quality Best Practices Award from the European
Society for Quality Research Responsible Jewellery Council, ISO 9001 (Quality
Management) and ISO 50001 (Energy Management. Additionally, their consumer return
rate is also very low level (about 3%)
Repeat purchases from their business model, this is one of biggest competitive
of their product and business model. Especially in their main product Brace and Charm.
Once, the customer buys the bracelet, they tend to spend more on the charm. As the
concept of the product that the charm is a storyteller. Customer will buy more charm in
the special event or occasionally around the year. In fact, many customers collect
different type of charms to change and combine it to make their bracelet become unique.
By this kind of concept and business model, Pandora also gets benefit from their non -
target group. They can buy it as an ideal gift to the Pandora owner There also has some
of the very impressive figures, even after 10 years from the first bought, customer tend
to repeat buy Pandora product
1.5.2 Peer Comparison
Folli Follie Commercial Manufacturing and Technical SA, formerly Duty-
Free Shops an Operating Duty-Free Shops and Large and Small Scale Industrial Operations
Technical and Commercial SA Corp Co, is a Greece-based company engaged in the
fields of jewelry manufacturing, department stores operation, as well as in apparel and
footwear industry.
It operates in the following business segments: Jewelry-Watches-Accessories,
Department Stores, and Retail-Wholesale. The Jewelry-Watches-Accessories segment
deals with the design, manufacturing, processing, and marketing of jewelry, watches
and other similar fashion accessories like handbags, belts, and sunglasses, among others.
The Department Stores segment operates department stores, under the brand name
Attica. The Retail-Wholesale segment includes wholesale of clothing, shoes, accessories,
and fragrances, as well as retail sales of footwear, clothing accessories for mono-brand/
and multi-brand retail apparel, footwear-accessories, and perfumes.

21
In addition, Folli Follie has a strong presence in the travel retail market with
points of sale in numerous airports duty free shops around the world, such as Beijing, Hong
Kong, Seoul, Athens, Vancouver, Taipei, Hawaii and Guam among others, whereas Folli
Follie products are also available in-flight in major international airlines, such as,
Cathay Pacific, Air China, China Eastern, Qantas, China Airlines, EVA Airlines, ANA
Airlines, Korean Airlines, Qatar Airways, United Airlines etc. Folli Follie opened in
2014 a flagship store in Haitang Bay, Hainan Island, China, the world’s largest duty-
free shopping center.
FolliFollie’s product line and category:
• Jewelry
• Bags
• Watches
• Accessories
Tiffany & Co. is a holding company that operates through its subsidiary
companies. The Company's principal subsidiary, Tiffany, and Company (Tiffany) is a
jeweler and specialty retailer. The Company's segments include Americas, Asia-Pacific,
Japan, Europe and Other. Through its subsidiaries, the Company designs and manufactures
products and operates TIFFANY & CO. retail stores around the world, and also sells its
products through Internet, catalog, business-to-business and wholesale operations.
The Company also sells timepieces, leather goods, sterling silverware, china,
crystal, stationery, fragrances, and accessories. The Americas segment includes the sale of
Company-operated TIFFANY & CO. stores in the United States, Canada, and Latin
America. As of January 31, 2017, the Asia-Pacific segment included 85 Company-operated
TIFFANY & CO. stores. As of January 31, 2017, the Japan segment included 55 Company-
operated TIFFANY & CO. stores. Tiffany was founded in 1837 when Charles Lewis
Tiffany opened a store in downtown Manhattan. Today, more than 300 TIFFANY & CO.
stores serve customers around the world.
Tiffany was founded in 1837 when Charles Lewis Tiffany opened a store in
downtown Manhattan. Today, more than 300 TIFFANY & CO. stores serve customers
around the world.

22
Tiffany & Co’s product line and category:
• Engagement
• Watch
• Jewelry
• Fragrance
• High jewelry
• Home and Accessory
Cartier is the largest part of Richemont's "jewelry houses" this segment
represents more than 50% of the total sales of Richemont group. Also, its non-watch
jewelry segment was the highest-growth category for the company. Cartier is one of a
big player in luxury segment their product placement at a higher position than Pandora
from the customer perspective.
Compagnie Financiere Richemont SA (Richemont) is a Switzerland-based
jewelry company. The Company's segments include Jewelry Maisons and Specialist
Watchmakers. The Jewelry Maisons segment includes businesses, which are engaged
in the design, manufacture, and distribution of jewelry products.
The businesses include Cartier, Van Cleef & Arpels and Giampiero Bodino. Its
Specialist Watchmakers segment includes businesses whose primary activity includes the
design, manufacture, and distribution of precision timepieces. The businesses in the
Watchmakers segment include Piaget, A. Lange & Sohne, Jaeger-LeCoultre, Vacheron
Constantin, Officine Panerai, IWC Schaffhausen, Baume & Mercier and Roger Dubuis.
The Company's other operating segments include Montblanc, Alfred Dunhill, Lancel,
Chloe, Purdey, Shanghai Tang, Peter Millar, investment property companies and other
manufacturing entities.
Cartier’s product line and category:
• Jewelry
• Leather good
• Engagement
• Eyewear
• Accessory
• Fragrance

23
Swarovski is an Austrian producer of crystal headquartered in Wattens,
Austria. The company is split into three major industry areas: the Swarovski Crystal
Business, that primarily produces crystal jewelry and accessories; Swarovski Optik,
which produces optical instruments such as telescopes and binoculars; Tyrolit, a leading
manufacturer of grinding, sawing, drilling, and dressing tools, as well as a supplier of
tools and machines. Today, Swarovski Crystal Business is the highest grossing business
unit with a global reach of approximately 2,800 stores in around 170 countries, more
than 27,000 employees, and a revenue of about 2.6 billion euros (in 2016).
The Swarovski Crystal range includes crystal glass sculptures and miniature,
jewelry and couture, home decor, and chandeliers. It is best known for its small animal
figurines, which have loyal and longstanding collectors and fans All sculptures are marked
with a logo. The original Swarovski logo was an edelweiss flower, which was replaced
by an S.A.L. logo, which was finally replaced with the current swan logo in 1988
Swarovski designs manufacture and markets crystals, genuine gemstones &
created stones and finished products such as jewelry and accessories, beauty products,
and lighting. Our diverse product portfolio also incorporates precision optical instruments
such as telescopes and binoculars, grinding, drilling and sawing tools, and industrial
lighting. Other activities include Swarovski Entertainment, the company’s film division,
which collaborates with exceptional talent and industry partners to develop, finance, and
produce original and artistically accomplished feature films, Swarovski Kristallwelten, a
dazzling interactive crystal experience in Wattens, Austria, and the Swarovski Crystal
Society and publications and apps, that illuminate the many different facets of the
Swarovski business
Swarovki’s product line and category:
• Jewelry
• Accessory
• Watch
• Decorations

24
Figure 1.9 Competitive Positioning
1.6 Investment Summary
1.6.1 Strong Revenue and EBITDA growth
In 2016, Group revenue was DKK 20,281 million or increase 21% compared
with DKK 16,737 million in 2015. The continued growth in revenue was driven by all
regions. In terms of CAGR, the company revenue CAGR is 36.8%. Beside of the revenue
growth, EBITDA of the firm is also higher than their peer. Their EBITDA/ Sales have
increased the since 2012 and stable during a couple of previous years
1.6.2 Huge Dividend pay-out and share buyback
Since 2013, the company aggressive paid dividend and buy back stock to
favor the investor. In 2016 Pandora paid 5.5 billion DKK in total for their dividend
payout and stock buyback program. In 2017, the company plans to change dividend
payout policy, they will pay 9 DKK/ share for every quarter, given that the investor will
get 36 DKK/ share in total on 2017

25
1.6.3 High gross profit margin
Pandora had higher gross profit margin compared with its peer. One of the
main reason might be the benefit from their vertical integration which allows them to
have cost controlling across their supply chain. Starting from the source of raw material
to the production line. Also, their forward and options contract that they use to hedging
commodity prices, as Silver and Gold are the main part of their cost using these financial
instruments allow them to reduce the effect from cost fluctuation of the raw material
1.6.4 Strong business model
The combination of Pandora 4 strategic pillars plays an important role in
their business model. Starting from the Full Jewelry offering and One brand target segment
these strategies not only help them to maintain the sales growth but also reduce the
revenue concentration in Charm & Brace which tend to slower growth in the long run.
Next is Branded Retail Excellence, the increasing number of the brand store allows them
to have full control over the consumer shopping experience, and this also has the
significant impact on their sales and profit. The last one is Balanced global business, by
sustaining strong performance in developed markets while also increasing their revenue
share in new and emerging markets. This integration will support fundamental of the
firm from various perspectives
1.6.5 Plenty room for opportunities
As we mentioned in the previous part. Jewelry market is fragment; the big
companies will have high market power. Since only 20% of jewelry is brand, it has
plenty of the opportunity for the international brand to gain their market share from the
local and unbranded jeweler. Base from research by McKinsey & Company, the proportion
of brand-named jewelry is expected to reach 40% in 2020. Additionally, the product
expansion to other jewelry types will help them to increase their customer base while
maintaining sales with their existing customers

26
CHAPTER II
FINANCIAL STATEMENT ANALYSIS
2.1 Highlights
2.1.1 Revenue growth
Pandora generated revenue of DKK 20.3 billion in 2016. This was aided by
strong double-digit growth in all four quarters and, in total, revenue increased by 21%
compared with 2015.
Revenue growth was driven by good performances across all geographical
regions. The Americas increased revenue by 5%, EMEA by 27% and Asia Pacific by
46%. In addition, revenue from all product categories experienced positive growth,
driven by new as well as existing products. Around half of our revenue growth in 2016
can be attributed to the expansion of our store network, which included the addition of
net 336 new concept stores in 2016. Together with the closing of multi-branded stores,
this gave us a stronger and much more branded store network compared with the
beginning of the year.
Table 2.1 Revenue growth

27
2.1.2 Improvement in gross profit margin
In 2016, the gross margin shows 75% compared with 73% in 2015. The
increase was mainly driven by a tailwind from more favorable raw material prices
(approximately 1.5 percentage points) and an increase in revenue from PANDORA
owned stores (approximately 1.5 percentage points). An increase in production complexity
had a negative impact of approximately 1 percentage points. Additionally, as a positive one
off, PANDORA reclaimed duties regarding prior years in the Americas region
(approximately 1 percentage point).
Figure 2.1 Gross profit margin
2.2 Key financial ratio analysis
2.2.1 ROA and ROE
The continuously increase in the ROA and ROE of Pandora is mainly from
treasury share buy-back activity. From the high profit margin, Pandora returns the profit in
from of dividend and share buy-back, this causes the level of equity lower than other
competitors and reflects in significantly high in the ratio. When we compare with Tiffany &
CO, both ROA, and ROE of Pandora significantly higher in every year

28
Figure 2.2 ROA
Source: Eikon Financial Analysis | Thomson Reuters
Figure 1.3 ROE
Source: Eikon Financial Analysis | Thomson Reuters
2.2.2 Current Ratio and DE ratio
Tiffany has a better current ratio from its cash on hand and significantly low
of trade payable as it use the loan as a source of the fund in working capital which is
different from Pandora.
The Company’s fund is from its own equity. Therefore the D/E ratio of the
Company is very low comparing to the competitors. Only temporary fund from bank
loan during the investing period. The Company tends to have a medium-term loan (3-5
years) so the D/E ratio suddenly rise.

29
Figure 2.4 Current Ratio
Source: Eikon Financial Analysis | Thomson Reuters
Figure 2.5 D/E Ratio
Source: Eikon Financial Analysis | Thomson Reuters
2.2.3 Days Inventory Outstanding and Days Sales Outstanding
Pandora has a very high turnover of account receivable from direct sell to
end customers and high inventory turnover from attractive and affordable products.
Given that both Days Inventory Outstanding and Days Sales Outstanding of Pandora is
significantly lower than Tiffnay&Co

30
Figure 2.6 Days Inventory Outstanding
Figure 2.7 Days Sales Outstanding

31
2.3 Investment Risk and Downside Possibilities
Table 2.2 Risk Matrix
2.3.1 Financial Risk
Raw material price, due to the fact that Silver and Gold is one of the large
parts of their Cost of Goods sold. Even though the firm can maintain high margin during
the higher price by hedging and vertical integration, but in the time with high fluctuation,
this cost might affect badly with the firm. The raw material risk is the risk of fluctuating
commodity prices resulting in additional production costs. The most important raw
materials are silver and gold, which are priced in USD. Currently, Pandora uses several
different financial tools to minimize the risk, based on a rolling 12-month production
plan, the policy is for Group Treasury to hedge around 100%, 80%, 60% and 40% of the
risk for the following 1-3 months, 4-6 months, 7-9 months and 10-12 months respectively
However, as it’s shown on the chart, commodity price tends to fluctuate
over the time and the hedging tools like Swap or Option can be minimized short-term
risk (1-12 months) only.
Currencies risk, Since, company sold their product globally, they have to
deal with the many different currencies, for example, USD EUR AUD JPY CNY. They
also have large cost in Thailand which is THB currency. This means the currency
fluctuation will affect their revenue and also profitability. Although the firm tries to

32
minimize the risk by using forward and option (similar method as raw material). However,
this kind of tools can reduce only the short-term risk. The significant change in main
currency like USD or EUR will hurt the firm badly.
Table 2.3 Company hedging strategy
Source: Pandora Annual Report
2.3.2 Operational Risk
Geopolitical risk, all of their production facilities located in Thailand if they
face the natural disaster or any incident. Their production plan will ultimately be
affected, also the other part of the supply chain as well. Although the north of Thailand is
usually safe from the natural disaster and political issue. However, the company should have
some of the contingency plans in the worst case scenario as all of their factories located
in the same area and they mainly rely on their production capacity.
2.3.3 Strategic risk
Huge decrease Point of Sales in US and EMEA, As America is one of the
biggest single markets for Pandora, this market represents 25% of total revenue in 2016.
The sharply decrease the number of the point of sales from 3,020 to 2,365 place or 22%
decrease from 2015 will have effected with their sales and growth in the coming years.
This significantly drop might have an effect on their customer base in the US as well
The other main market is EMEA which have a big decrease in the number
of the multibranded shop. Although they have many concepts store around EMEA.
However, we need to concern about it as the biggest source of revenue relies on this
region. A small change of growth in this region will have a big impact on the firm revenue.
Months ahead Commodity
1-3 90-100%
4-6 70-90%
7-9 50-70%
10-12 30-50%
All major Currencies
90-100%
70-90%
50-70%
30-50%

33
Table 2.4 Store Network and number of Points of Sale
Source: Pandora Annual Report
Brand position, one of the biggest doubt is their brand position. As their
concept is affordable jewelry, they will face difficulty if they want to lift up their brand to
be a premium brand in the future. In fact, during the rose of commodity price, Pandora
designed to increase their price and move to a higher position, but they faced with the
huge drawback from this idea and they stick with the affordable price since then.
2.3.4 Other risk
Fashion risk of their main product (Charm and Bracelet). Since bracelet and
charm are the main revenue share in their portfolio (77%) We concern about how long
that Pandora can maintain their popularity. Even though Pandora trying to increase their
sales in the other jewelry but it is still such a low portion of their portfolio and we also
not sure about their success in this product categories. We could say, their growth and
revenue mainly rely on the brace and charm business, any changing of the trend will
have a huge effect on the firm value as well as their share price

34
The copycat product, especially their main product charm and brace. Since
their product is easy to duplicate. We can easily find the similar product or copycat product
from all around the world. Actually, if we type “compatible charm for Pandora” on the
google we will see plenty of silver charm which could be used with the Pandora brace
with 5 times lower price than the original one. As the jewelry product, their profit mainly
from the mark up from brand premium, in Pandora case we should worry about the charm
which gives the firm competitiveness from repeat sales to their existing customer. Therefore,
the copycat of this product category will have a huge negative impact on the firm
competitiveness, growth and ultimately drop their sales and share price

35
CHAPTER III
COMPANY VALUATION
3.1 Methodology
We use the FCFF method, because it takes into account the fundamental
component of the firm such as the ability of the firm to generate free cash flow, Working
of capital and also the Capital expenditure. To make the valuation to be more accurate
we use the H model to valuation Pandora stock price.
3.2 Key Assumptions
3.2.1 Revenue and growth rate
Based on the historical data, Pandora had very high growth since 2013, the
5 years average growth was 25.85% which is significantly higher than the peers
However, in 2016 the growth dropped sharply from 40% in 2015 to 21.17%
in 2016. Additional with the sales target from management 23 Billion DKK or 14%
growth, we expected the firm will slowly decrease their growth year by year and reach
the stable stage on 2022.
To find the growth rate each year we plot the regression line from High to
Stable growth rate and divide it with the transition period. The length of transition period
we use the historical pattern of Tiffany&Co and Cartier which is about 3-4 years.
Table 3.1 Average growth
Pandora 25.85%
Compagnie Financiere Richemont SA 10.46%
Tiffany & Co 9.83%
Follie Follie 6.59%

36
Figure 3.1 Growth pattern
To cross-check the data, we use historical revenue of Pandora since 2009
and then using forecast function from Microsoft Excel to find the forecast revenue on
2017-2021
Figure 3.2 Growth forecast
Then we compare it with our estimated growth. To see the relation of these
2 data we plot the scatter chart and find the correlation. The result is very impressive
with a very high correlation (99%). Hence we presume this information should be reliable.

37
Table 3.2 Comparison of growth rate and correlation of estimated growth
To estimate the stable growth rate we use, an average of long-term GDP
from 2 sources of information. OECD and PWC report “The long view How will the
global economic order change by 2050” Then we average it and multiply by the percentage
of revenue in each region
After we get weighted GDP from all of 3 regions, then we add 1.8% which
is target inflation to get the stable growth rate
Figure 3.3 Stable growth rate
3.2.2 Cost of Sales
The average cost of Sales of Pandora from 2012-2016 is 29.7% lower than
every peer in the group. However, as we know that the price of Silver which is the majority
cost of Jewelry firm have significantly drop during last 3 years and this low Cost of
Sales might be a temporary and won’t be the last longing over the time. To find the
forecast and silver trend we use historical silver price since 1968-2016 additional with
2017 2018 2019 2020 2021
11.94% 10.67% 9.64% 8.80% 8.09%
14.00% 11.98% 9.96% 7.94% 5.92%
13.10% 11.50% 10.10% 6.51%
99.36%
Analyst consensus
Forecast growth from Excel
Estimated growth
Correlation of 2 data

38
the forecast price from Reuter from 2017-2020. Then we use forecast function on excel to
see the trend of silver price and it shows slight increase year by year.
Therefore, we expected the silver price will slightly increase and this means the
Cost of sales of Pandora will slightly increase each year as well. We expected the Cost
of sale of Pandora will slightly increase 1-2% every year and reach the industry average
37% on 2024
Figure 3.4 Silver price Forecast
Table 3.3 Cost of sale Forecast
3.2.3 Sales and Administration cost
The average 5 years Sales and Administration cost of Pandora is around 37%
similar rate with the peers. However, since 2012 the number of staff and cost increase
significantly as they expansion by their own concept store. Additionally, the increase in
their advertisement and sales promotion. We expected their Sales and Administration cost
will increase over the time and reach 47% in the long run
2017 2018 2019 2020 2021 2022 2023 2024
28.00% 30.00% 31.00% 32.00% 34.00% 35.00% 36.00% 37.00%
Assumption
Cost of sale

39
Figure 3.5 Number of employee and cost
Source: Pandora Annual Report
3.2.4 Capital Expenditure
The average 5 years Capital Expenditure from 2012-2016 is 5.2% of revenue.
In 2017 Pandora management expected 5% of revenue as the CAPEX. We use this figure
for 2017. However, starting from 2018 we expected them to spend more on CAPEX as
their expansion strategy. Hence, we use 6% as the constant rate for the firm CAPEX
3.2.5 Working Capital
Working Capital is Inventory plus Account Receivable deduct Account
Payable of the firm. The average 5 year from 2012-2016 of Working Capital is 19%
revenue We expected the firm will maintain the similar proportion of Inventory, Account
Receivable and Account Payable. However, as they plan to increase the sales and expand
their concept store shop. We expected Pandora will increase their Working Capital each
year to 24% of the sales similar to their peers
3.2.6 Weighted Average Cost of Capital (WACC)
In order to find WACC of the firm, we start from finding the cost of Debt
by using interest expense on 2016 divide by Net interest-bearing debt on 2015 which
was 4.27%. The corporate tax rate in Denmark is 22%. Then we get after-tax cost of
debt equal 3.33%

40
Table 3.4 Cost of Debt
The 2nd step, we use CAPM method to find the Cost of equity. Using beta
from Reuter, 10 years Danish Government Bond yield as the Risk-Free rate and Market
Risk premium from Damodaran website. Then we get Ke at 6.15%
Table 3.5 Cost of Equity
The last step is finding the proportion of Debt and Equity of the firm capital
structure. We use the market value of debt and market cap at 20 Dec’17. Then we get
We equal 92% and Wd equal 8%
Base from above data, WACC of Pandora is 5.92%
Table 3.6 WACC
Value
82.00
1,921.00
4.27%
3.33%
NIBD 2015
Kd
Kd after tax
Interest expense
Ke = Rf + beta x (Rm - Rf)
Value
0.477%
0.99
5.730%
6.15%
Remark
Rf 10 years Danish Government Bond yield
Beta From Reuter
Market Risk premium Damadoran website
Ke CAPM method
Wd 8.0%
We 92.0%
Kd 4.27%
Tax rate 22.00%
Kd after tax 3.33%
Ke 6.15%
WACC 5.92%

41
3.3 Discounted Cashflow Valuation
With above assumptions, we get a target price of Pandora A/S at 762 DKK/
Share 16% higher than 659 DKK, the actual market price per share as of 20 Dec 2017
Table 3.7 DCF table
3.4 Sensitivity and scenario analysis
Base from our analysis, there are some of the factors that can affect the target
price (i.e. Terminal growth rate, Cost of sales, CAPEX and WACC. In order to measure
the effect with a stock price, we use sensitivity analysis
The result shows that WACC has the most impact on the stock price. However,
as Denmark is one of the stable countries. Cost of Debt, Market risk premium, and Cost
of equity are very low. Also the stable of the capital structure of Pandora. We expected
WACC will be stable over time. Therefore, we choose terminal growth and cost of sales as
the variables which tend to fluctuate over the time to conduct the scenario analysis
One of the important factors which could dramatically affect the cost of sales
is the price of Silver and Gold. Due to the fact that firm could effectively hedge only
short term. The longer perspective will fluctuate and hard to predict
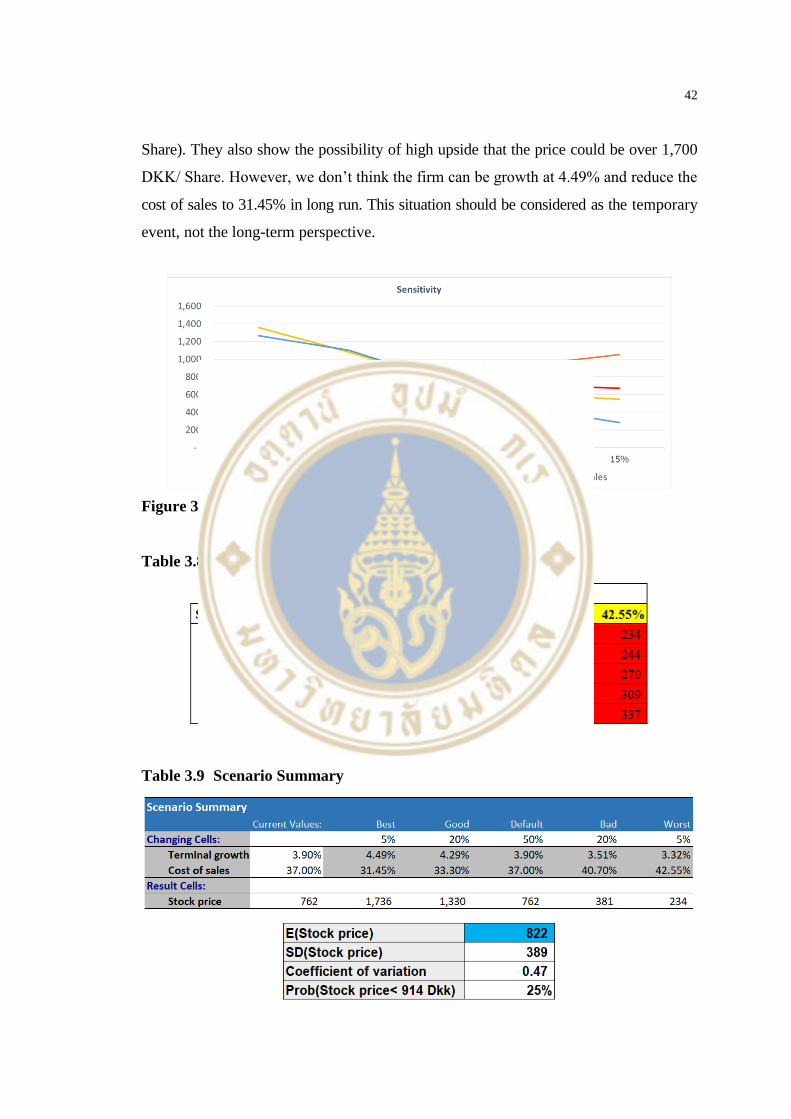
After using the scenario analysis, the expected stock price is 822 DKK/Share
and there is 25% probability that the price will be lower than the current price (659 DKK/
42
Share). They also show the possibility of high upside that the price could be over 1,700
DKK/ Share. However, we don’t think the firm can be growth at 4.49% and reduce the
cost of sales to 31.45% in long run. This situation should be considered as the temporary
event, not the long-term perspective.
Figure 3.6 Sensitivity graph
Table 3.8 Two ways sensitivity analysis
Table 3.9 Scenario Summary

43
CHAPTER IV
DATA
4.1 The Business Structure
There are no major shareholders holding more than 5% of the share capital
and the voting rights in PANDORA Listed on NASDAQ OMX Copenhagen on October
the 5th, 2010.
Table 4.1 Major Shareholders and Free-Float
Trading Symbol PNDORA
Identicication number/ISIN DK0060252690
GICS 25203010
Number of Shares 112,507,391
Sector Apparel, Accessories & Luxury Goods
Segment Large
Share capital 112,507,391
Nominal value 1
Free float (incl. treasury
shares)
100%

44
Figure 4.1 Management Board

45
4.2 CORPORATE GOVERNANCE
PANDORA’s aim regarding good corporate governance is to ensure
transparency and accountability and that the Company meets its obligations to shareholders,
customers, consumers, employees, authorities and other key stakeholders to the best of
its ability in order to maximize long-term value creation. PANDORA intends to exercise
good corporate governance at all times and to assess our practices according to the
corporate governance recommendations of the Danish Committee on Corporate Governance.
As a publicly listed company, PANDORA is subject to the disclosure requirements laid
down by Nasdaq Copenhagen, which has included the recommendations in its ‘Rule
Book for Issuers of Shares’. The Danish corporate governance recommendations were
updated in May 2013 with minor revisions in 2014, which do not impact PANDORA’s
reporting. In 2016, PANDORA chose to deviate partly from Clause 3.4.6 as the Chairman
of the Nomination Committee is not the Chairman of the Board. At PANDORA, the
Nomination Committee elects a chairman, who must be either the Chairman or one of
the Deputy Chairmen of the Board. The Chairmanship is handled in cooperation between
the Chairman of the Board and the Deputy Chairmen and thus, in practice, the Deputy
Chairman represents the Chairman of the Nomination Committee.
4.2.1 Board of Directors And Executive Management
Powers are distributed between the Board of Directors and the Executive
Management and independence exist between these two bodies as is normal practice in
Denmark. The Board of Directors is elected at the Annual General Meeting and all Board
members are up for election every year. The Executive Management is appointed by the
Board.
The Executive Management handles day-to-day management, while the
Board supervises the work of the Executive Management and is responsible for the
general strategic direction. The primary tasks for the Board are to ensure that PANDORA
has a strong management team, an adequate organizational structure, efficient business
processes, an optimal capital structure, transparent bookkeeping and practices, and
responsible asset management. The composition of the Board must be such that, at any
time, the consolidated competencies of the Board enable it to supervise PANDORA’s
46
development and diligently address the specific opportunities and challenges faced by
PANDORA.
The Board and the Executive Management together develop the Company’s
overall strategies and oversee that the competencies and resources are in place to maximize
the likelihood of PANDORA achieving its objectives. Furthermore, the Board oversees
the financial development of PANDORA and the related planning and reporting systems.
4.2.2 Board Activities In 2016
During 2016, the Board held eight ordinary Board meetings.
The total attendance rate was 94%. In 2016, the primary focus area for the
Board was continued growth, geographic expansion, product diversification (full jewelry
brand), IT, expansion of manufacturing footprint and organizational development of the
Company. The Board has established an Audit Committee, a Remuneration Committee, and
a Nomination Committee. The Board appoints Committee members and the Committee
chairman. The Committees’ terms of reference are disclosed via the Company’s website.
4.2.3 The Audit Committee
The current members of the Audit Committee are Birgitta Stymne Göransson
(Chairman), Anders Boyer-Søgaard, Andrea Alvey and Michael Hauge Sørensen. The
Audit Committee reviews and assesses PANDORA’s financial reporting and audit process
as well as internal control systems and evaluates the adequacy of control procedures.
More specifically, the duty of the Audit Committee is to supervise the following areas:
• financial reporting process
• internal control and risk management systems
• independent audit In 2016, the Audit Committee met seven times and
had an attendance rate of 93%. The main activities in 2016 were:
• meetings with the Executive Management and independent auditors to
review the audited annual report
• meetings with the Executive Management to review quarterly financial
statements, the key accounting policies, and significant accounting estimates
• review of the adequacy and effectiveness of PANDORA’s internal controls
and risk management systems

47
• review of significant risks of PANDORA
• re-assessment of the need for an internal audit function and approved
implementation of a Governance, Risk & Compliance function
• recommendation for the selection of independent auditors, including
evaluation of independence, competencies, and compensation
• the Audit Committee’s annual self-assessment
4.2.4 The Remuneration Committee
The current members of the Remuneration Committee are Peder Tuborgh
(Chairman), Christian Frigast, Allan Leighton, Bjørn Gulden and Andrea Alvey. The
main duties of the Remuneration Committee are:
• to prepare recommendations to the Board on the pay and remuneration
policy applicable to the Board and the Management Board, including the Executive
Management with respect to fixed and variable pay components
• to submit proposals to the Board for the total individual pay and remuneration
package of the Board members and PANDORA’s executive managers
• to verify that the information about remuneration in the annual report is
true, accurate and adequate The Remuneration Committee met four times in 2016 and
had an attendance rate of 90%. The main activities were the annual review of the
remuneration policy and guidelines on incentive payments as well as approval of the
company’s overall wage regulation. The Committee also performed a review of the
Long-Term Incentive Programme.
4.2.5 The Nomination Committee
The current members of the Nomination Committee are Christian Frigast
(Chairman), Peder Tuborgh, Anders Boyer-Søgaard, Ronica Wang and Per Bank. The
Nomination Committee assists the Board in fulfilling its responsibilities with regard to
the:
• description of the qualifications and competencies required for members
of the Board and the Executive Management
• nomination of candidates for approval by the Board to fill vacancies on
the Board and the Executive Management

48
• self-evaluation of the Board
• assessment of the performance of the Executive Management and the
cooperation between the Board and the Executive Management
• succession planning for top executive positions
In 2016, the Nomination Committee met twice and had an attendance rate
of 80%. The main activities were the annual self-evaluation, development of a Board
composition assessment tool to ensure the competencies and experiences represented on
the Board are aligned with PANDORA’s strategic objectives, and an in-depth analysis of
the qualifications and competencies required for members of the Board and the
Executive Management.
4.2.6 Board self-evaluation
The Board conducts an annual self-assessment to constantly improve the
performance of the Board and its cooperation with the Executive Management. The
chairman of the Nomination Committee directs the assessment process. The assessment is
carried out by each Board member completing a questionnaire followed by a Board
discussion where improvement areas are defined and agreed upon. Once a year, the CEO
must perform an assessment of the individual members of the Executive Management.
Among the topics covered in the Board, self-assessment are Board composition, the
nomination process, and competencies of the Board. Also covered are, for example, the
Board’s involvement in financial management and control, risk management, the efforts
and time spent on strategic discussions, cooperation with the Executive Management,
personal contributions and committee work.
The self-assessment conducted in 2016 identified the following strengths
and development areas for the Board. In general, the Board demonstrates appropriate
and broad industry knowledge and includes a diversity of experience and backgrounds
well fitted to PANDORA’s business and strategy. The Board structure and committee
work are effective, and the Board considers itself to be sufficiently involved in financial
oversight. The primary focus points for 2016/2017 are a continuation of growth,
geographical expansion, talent management, strategy, expansion of manufacturing
footprint, IT and improvement of the strategy-related processes around Board meetings.
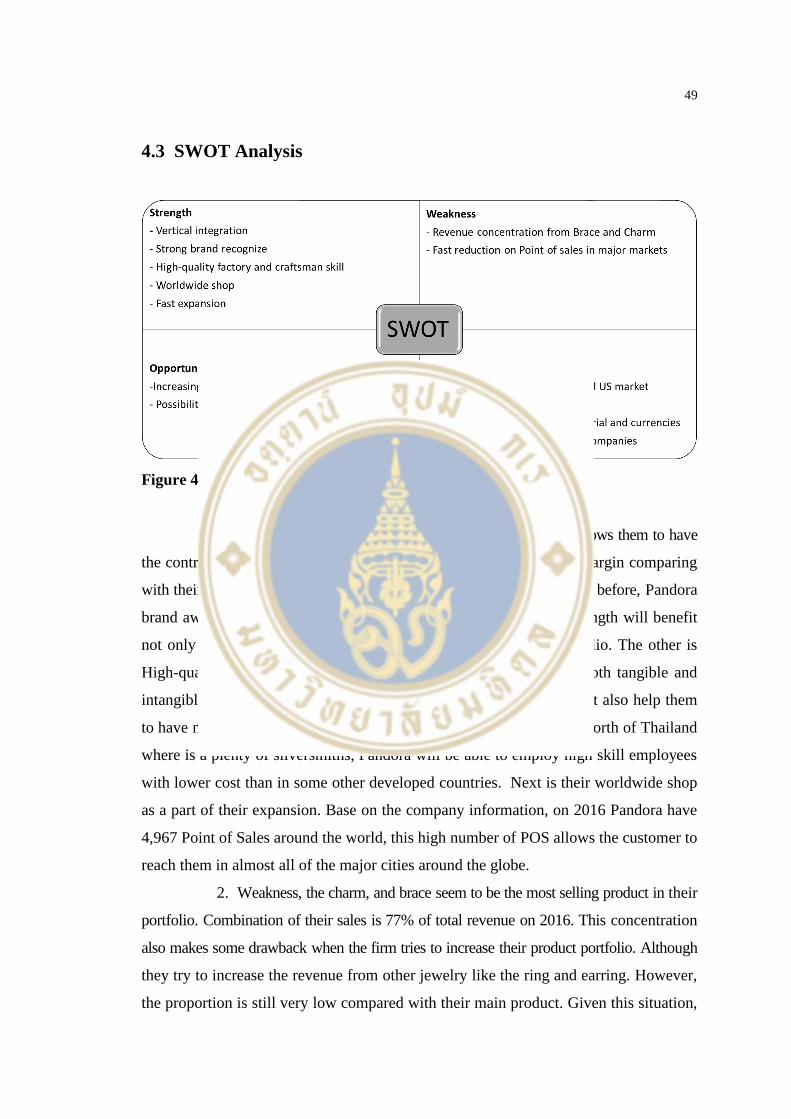
49
4.3 SWOT Analysis
Figure 4.2 SWOT Analysis
1. Strength, the first strength is vertical integration which allows them to have
the control over the main part of supply chain and enjoy the higher margin comparing
with their peers. Next is the strong brand recognition. As we mentioned before, Pandora
brand awareness continually increases in the global market. This strength will benefit
not only the main product but also the other products in their portfolio. The other is
High-quality factory and craftsman skill, as they heavily invest in both tangible and
intangible assets. This not only increases their production capacity but also help them
to have more new products launching, as their factory located in the North of Thailand
where is a plenty of silversmiths, Pandora will be able to employ high skill employees
with lower cost than in some other developed countries. Next is their worldwide shop
as a part of their expansion. Base on the company information, on 2016 Pandora have
4,967 Point of Sales around the world, this high number of POS allows the customer to
reach them in almost all of the major cities around the globe.
2. Weakness, the charm, and brace seem to be the most selling product in their
portfolio. Combination of their sales is 77% of total revenue on 2016. This concentration
also makes some drawback when the firm tries to increase their product portfolio. Although
they try to increase the revenue from other jewelry like the ring and earring. However,
the proportion is still very low compared with their main product. Given this situation,

50
Pandora revenue and growth mainly rely on Brace and Charm, which we doubt about
their popularity in the long run. One of the big weakness is the fast reduction of POS as
they try to decrease the 3rd parties and replace with concept store. This concept is a very
good idea. However, the sharply decrease POS in the major markets will have an effect
on their sales and growth. During 2016 they close 957 POS in the US and 857 POS in
EMEA. They might have some augment as they increase concept stores at the same
time. It shouldn’t have a big effect if they slightly decrease the 3rd parties and building
their concept store at the same time. But one of the big questions is how long they will
need to recover their POS and how much money the firm need to spend for this self-
expansion, also the increase of administration cost which will hit their bottom end.
3. Opportunities. One of the main opportunities of Pandora is the increasing of
the middle class in emerging market which tends to spend on the luxury product than
their predecessors. China as one of the big jewelry market in the world, the increase of
middle class and increase of consumer will fuel both jewelry and luxury market at least
in the next couple of years. Brazil and Latin America are also one of a good potential
market for expansion. Their increase of “new money” will not only increase the firm
revenue but also help Pandora to diversify their revenue from the developed market,
which tends to slow down in the following year. The other opportunity is possible to expand
to other jewelry. If we see the historical data of the firm, we will recognize that Pandora
tries to expansion to the other jewelry. However, they also have many another kind of
jewelry that still not include in their portfolio and expected them to expand to that kind
of product. In this case, we didn’t limit it to type but also material as well. We notice
that most of the Pandora jewelry is silver base and some few stones. Although they
launched some of the gold and rose gold collection, it was very low proportion compared
with the Silver collection. Therefore, we could expect Pandora to increase their product
line in both type and material.
4. Threats, the main threat of Pandora could be from slowdown economic
in EMEA and US market. Starting from EMEA which is the biggest source of their
revenue. Since, EMEA combining with many countries, some of them still maintain
high GDP growth. Unfortunately, the majority of Pandora’s sales come from European
countries which face the slowdown down in economic like UK and Italy. The combination
with Brexit, the European tend to need a longer period to recover from their downturn.

51
One of the other important threat is a copycat product. In fact, most of the jewelry product
was easy to duplicate with a very cheap price. Especially from China where they have
a lot of jewelry factory. Supporting by 3D printing technology, almost all factory can
produce imitate product with comparable quality. In case of Pandora, we concern about
the charm which one of the most selling product and the main source of revenue. Currently,
we can find plenty of charm which compatible with Pandora brace and absolutely cheaper
than the original one. Next is price fluctuation in raw material and currency. Due to the
fact that majority of the cost of sales of the firm come from raw material like silver and
gold. The fluctuation of these precious metal will have a dramatic effect on the firm’s
cost. The exchange rate as well, most of Pandora cost is USD and THB. However, their
revenue mainly from various currencies EUR, AUD, USD, CNY. The change in
currency again DKK will not only impact the revenue but also the growth and cost
structure of the firm. Pandora using many different financial products like forward,
option and swap contract to minimize the risk. Anyway, most of these tools can minimize
only short-term risk. In the long horizon, it’s not only hard to predict but also hedging
the risk. The last main threat is losing their market share to both jewelry and fashion
company. Since Pandora position in an affordable range which has the highest portion
in jewelry market (around 57%). It’s obvious that they will face with many competitors
within the same range, also many fashion companies who try to enter to jewelry market.
4.4 Five Forces Analysis
Figure 4.3 Five Forces Analysis

52
After we analyze related data and information, we summarize each threat as
below
1. The threat of new entrants is a medium force, as jewelry market is a
fragment and easy to join as the newcomer. Small companies and local shops can set up
with a small amount of fund. Some of them might act as a retailer who buys a product from
local factory and sales to both local and international customers. However, this group
of players is not considered as the main threat. Since they have a low customer base and
relatively low brand power. On the other hand, the big fashion and appearance brand
should be considered as the main threat of Pandora, as they have a big fan and strong
customer base.
2. The threat from Competition in the industry is very strong, jewelry
market is highly competitive. The existence international brand and competitors have
their customer base and brand loyalist. Base from the information from McKinsey &
Company report, Jewelry market should be on the same trend but moving at a faster
pace than the past.
3. The threat of substitutes product is strong, most of the jewelry could be
replaced with similar one as they have common feature and trend could be changed easy
and rapid pace. However, brand value is something that can’t imitate. This allows a big
brand like Pandora to sales their product which has high emotional value to the loyalty
customer.
4. Bargaining power of suppliers is low, Pandora getting benefit from vertical
integration. Hence, they can manage almost all of their supply and value chain. This
integration is not only allowing Pandora to control their cost but also improving their
product quality and shortening the lead time in each process. As the high volume buyer,
they also have strong negotiation power over the local suppliers.
5. Bargaining power of buyers is high. The customer has plenty of choices
to choose jewelry, the cost of switching product is low. However, Brace& Charm which is
the biggest sales in their portfolio still have some competitive edges as they’re the biggest
player in this segment and their customer tend to repeat buy additional charm over the
time.

53
4.5 Income Statement
Table 4.2 Projected Income Statement
4.6 Balance sheet
Table 4.3 Projected Balance Sheet

54
4.7 Statement of Cash Flow
Table 4.4 Projected Cash Flow statement
4.8 Common size analysis
Table 4.5 Income Statement
Tiffany & Co
CONSOLIDATED INCOME STATEMENT Year 2016 Year 2015 Year 2014 Year 2013 Year 2012 Year 2016
Revenue 100% 100% 100% 100% 100% 100%
Cost of sales -25% -27% -29% -33% -33% -38%
Gross profit 75% 73% 71% 67% 67% 62%
Gross margin 75.1% 72.9% 70.5% 66.6% 66.6% 62.2%
Other operating income 0% 0% 0% 0% 0% 0%
Sales, distribution and marketing expenses -29% -28% -26% -27% -31% 0%
Administrative expenses -10% -10% -10% -10% -13% -44%
Operating profit 37% 35% 34% 30% 22% 18%
Profit before tax 38% 32% 32% 30% 22% 17%
Income tax expenses -8% -10% -6% -6% -4% -6%
Net profit for the year 30% 22% 26% 25% 18% 11%
Pandora A/S

55
Table 4.6 Balance Sheet
4.9 Trend and Growth analysis
Table 4.7 Income statement – trend
Consolidated Balance sheet Tiffany & Co
ASSETS Year 2016 Year 2015 Year 2014 Year 2013 Year 2012 Year 2016
Total intangible assets 38% 41% 46% 50% 53% 1%
Property, plant and equipment 12% 9% 7% 5% 6% 18%
Total non-current assets 58% 58% 58% 59% 62% 30%
Inventories 18% 18% 16% 16% 16% 42%
Trade receivables 11% 10% 11% 10% 11% 4%
Cash 6% 7% 11% 7% 4% 18%
Total current assets 42% 42% 42% 41% 38% 70%
Total assets 100% 100% 100% 100% 100% 100%
Tiffany & Co
EQUITY AND LIABILITIES Year 2016 Year 2015 Year 2014 Year 2013 Year 2012 Year 2016
Total equity 45% 46% 67% 70% 72% 59%
Loans and borrowing 20% 18% 0% 0% 2% 17%
Total non-current liabilities 26% 23% 5% 5% 8% 28%
Provisions 7% 7% 6% 5% 6% 2%
Trade payables 11% 10% 8% 6% 3% 2%
Total current liabilities 29% 31% 29% 25% 20% 12%
Total liabilities 55% 54% 33% 30% 28% 41%
Total equity and liabilities 100% 100% 100% 100% 100% 100%
Pandora A/S
Pandora A/S

56
Table 4.8 Income statement - growt
Table 4.9 Balance sheet - trend

57
Table 4.10 Balance sheet – growth
4.10 Key financial ratio
Table 4.11 Key financial ratios
Year 2016 Year 2015 Year 2014 Year 2013 Year 2012
Tiffany & Co
Year 2016
Profitability
Gross Margin 75.1% 72.9% 70.5% 66.6% 66.6% 62.2%
EBITDA Margin 39.1% 37.2% 36.0% 32.0% 24.9% 23.2%
Operating Margin 36.5% 34.7% 34.1% 29.8% 22.2% 18.0%
Pretax Margin 37.7% 31.9% 32.4% 30.4% 22.2% 16.9%
Effective Tax Rate 21.2% 31.3% 20.0% 19.0% 18.7% 34.1%
Net Margin 29.7% 22.0% 25.9% 24.6% 18.1% 11.1%
DuPont/Earning Power
Asset Turnover 1.43 1.40 1.20 1.02 0.81 0.78
x Pretax Margin 37.7% 31.9% 32.4% 30.4% 22.2% 16.9%
Pretax ROA 53.9% 44.8% 39.0% 31.0% 18.0% 13.2%
x Leverage (Assets/Equity) 2.22 2.17 1.50 1.44 1.39 1.69
Pretax ROE 118.3% 81.2% 57.4% 43.9% 25.8% 22.8%
x Tax Complement 0.79 0.69 0.80 0.81 0.81 0.66
ROE 93.2% 55.8% 45.9% 35.5% 21.0% 15.1%
x Earnings Retention 0.83 0.59 0.65 0.63 0.41 0.51
Reinvestment Rate 77.6% 32.8% 29.8% 22.4% 8.5% 7.7%
Liquidity
Quick Ratio 0.83 0.79 0.92 1.02 1.15 2.24
Current Ratio 1.45 1.37 1.48 1.67 1.95 5.65
Times Interest Earned 322.0 583.0 1,019.0 536.4 59.0 15.7
Cash Cycle (Days) 121.0 118.8 144.7 190.3 273.3 550.4
Leverage
Assets/Equity 2.22 2.17 1.50 1.44 1.39 1.69
Debt/Equity 0.44 0.42 0.00 0.01 0.03 0.37
% LT Debt to Total Capital 30.7% 26.9% 0.0% 0.0% 2.4% 21.2%
Operating
A/R Turnover 8.4 8.7 7.4 5.6 4.9 18.5
Avg. A/R Days 43.7 42.0 49.5 65.7 74.1 19.8
Inv Turnover 2.0 2.2 2.2 2.1 1.5 0.7
Avg. Inventory Days 184.0 162.7 165.1 170.7 241.0 530.6
Avg. A/P Days 106.8 85.9 69.8 46.1 41.7 0.0
Fixed Asset Turnover 13.50 17.18 19.77 18.60 14.77 4.29
WC / Sales Growth (0.3%) (3.7%) (4.8%) (4.0%) 8.3% 2.9%
Bad Debt Allowance (% of A/R) 1.9% 1.1% 1.5% 2.0% 2.0% 5.1%
ROIC 60.5% 43.9% 42.7% 32.4% 18.3% 10.1%
Revenue per Employee (DKK) DKK1,277,905.5 DKK1,398,946.8 DKK1,416,019.4 DKK1,423,043.5 DKK1,216,198.9 DKK2,286,904.2

58
Table 4.11 Key financial ratios (cont.)
Source: Eikon Financial Analysis | Thomson Reuters
Year 2016 Year 2015 Year 2014 Year 2013 Year 2012
Tiffany & Co
Year 2016
Profitability
Gross Margin 75.1% 72.9% 70.5% 66.6% 66.6% 62.2%
EBITDA Margin 39.1% 37.2% 36.0% 32.0% 24.9% 23.2%
Operating Margin 36.5% 34.7% 34.1% 29.8% 22.2% 18.0%
Pretax Margin 37.7% 31.9% 32.4% 30.4% 22.2% 16.9%
Effective Tax Rate 21.2% 31.3% 20.0% 19.0% 18.7% 34.1%
Net Margin 29.7% 22.0% 25.9% 24.6% 18.1% 11.1%
DuPont/Earning Power
Asset Turnover 1.43 1.40 1.20 1.02 0.81 0.78
x Pretax Margin 37.7% 31.9% 32.4% 30.4% 22.2% 16.9%
Pretax ROA 53.9% 44.8% 39.0% 31.0% 18.0% 13.2%
x Leverage (Assets/Equity) 2.22 2.17 1.50 1.44 1.39 1.69
Pretax ROE 118.3% 81.2% 57.4% 43.9% 25.8% 22.8%
x Tax Complement 0.79 0.69 0.80 0.81 0.81 0.66
ROE 93.2% 55.8% 45.9% 35.5% 21.0% 15.1%
x Earnings Retention 0.83 0.59 0.65 0.63 0.41 0.51
Reinvestment Rate 77.6% 32.8% 29.8% 22.4% 8.5% 7.7%
Liquidity
Quick Ratio 0.83 0.79 0.92 1.02 1.15 2.24
Current Ratio 1.45 1.37 1.48 1.67 1.95 5.65
Times Interest Earned 322.0 583.0 1,019.0 536.4 59.0 15.7
Cash Cycle (Days) 121.0 118.8 144.7 190.3 273.3 550.4
Leverage
Assets/Equity 2.22 2.17 1.50 1.44 1.39 1.69
Debt/Equity 0.44 0.42 0.00 0.01 0.03 0.37
% LT Debt to Total Capital 30.7% 26.9% 0.0% 0.0% 2.4% 21.2%
Operating
A/R Turnover 8.4 8.7 7.4 5.6 4.9 18.5
Avg. A/R Days 43.7 42.0 49.5 65.7 74.1 19.8
Inv Turnover 2.0 2.2 2.2 2.1 1.5 0.7
Avg. Inventory Days 184.0 162.7 165.1 170.7 241.0 530.6
Avg. A/P Days 106.8 85.9 69.8 46.1 41.7 0.0
Fixed Asset Turnover 13.50 17.18 19.77 18.60 14.77 4.29
WC / Sales Growth (0.3%) (3.7%) (4.8%) (4.0%) 8.3% 2.9%
Bad Debt Allowance (% of A/R) 1.9% 1.1% 1.5% 2.0% 2.0% 5.1%
ROIC 60.5% 43.9% 42.7% 32.4% 18.3% 10.1%
Revenue per Employee (DKK) DKK1,277,905.5 DKK1,398,946.8 DKK1,416,019.4 DKK1,423,043.5 DKK1,216,198.9 DKK2,286,904.2

59
REFERENCES
John Hawksworth, Rob Clarry, & Hannah Audino. (2017). The Long View How will
the global economic order change by 2050. Retrieved from http://www.pwc.
com/gx/en/world-2050/assets/pwc-the-world-in-2050-full-report-feb-
2017.pdf.
Linda Dauriz, Nathalie Remy, &Thomas Tochtermann. (2013). A multifaceted future: The
jewelry industry in 2020. McKinsey &Company
Nicola Pianon, Olivier Abtan, &Federico Bonelli. (2017). The True-Luxury Global
Consumer Insight 4th Edition. The Boston Consulting Group
OECD. (2017). GDP long-term forecast. Retrieved from https://data.oecd.org/gdp/
gdp-long-term-forecast.htm#indicator-chart
Pandora. (2012-2016). A/S Annual Report. Retrieved from http://investor.en.pandora.
net/annuals.cfm
Paul Laudicina & Erik Peterson. (2015). Global Economic Outlook 2015-2020, Beyond
the New Mediocre?. ATKearney Global Business Policy Council
Paul Laudicina & Erik Peterson. (2015). Stategic Issue Assessment 2020-Seven Growth
Economies. ATKearney Global Business Policy Council
Phil Ruthven AM. (2017). Australia’s 2017-18 Outlook. IBISWorld Newsletter .
Thomson Reuters Eikon. (2017). Market Data and Financial Benchmark. n.p.
Tiffany & Co. (2016). Tiffany&Co Annual Report. Retrieved from http://investor.
tiffany.com/annuals.cfm

60
BIOGRAPHY
NAME Mr. Anantaporn Lapsakkarn
DATE OF BIRTH 28/02/1990
PLACE OF BIRTH Bangkok, Thailand
INSTITUTE ATTENDED Bachelor of Business Administration
The University of the Thai Chamber of
Commerce, 2012
Master of Management,
Mahidol University, 2018
RESEARCH GRANT -
HOME ADDRESS 24/169 Moo5, Phiboonsongkram rd.,
Nonthaburi 11000, Thailand
Tel. +66 83 299 9286
Email: [email protected]
EMPLOYMENT ADDRESS -
PUBLICATION/ PRESENTATION -