disclaimer this contractor document was prepared for the u
TRANSCRIPT

DISCLAIMER
This contractor document was prepared for the U.S. Department of Enerzv (DOE), but has not
undergone programmatic. policy, or publication review, and is provided for information only.
The document provides preliminary information that may change based on new information or
analysis, and represents a conservative treatment of parameters and assumptions to be used
specifically for Total System Performance Assessment analyses. The document is a preliminary
lower level contractor document and is not intended for publication or wide distribution.
Although this document has undergone technical reviews at the contractor organization, it has not
undergone a DOE policy review. Therefore, the views and opinions of authors expressed may
not state or reflect those of the DOE. However, in the interest of the rapid transfer of
information, we are providing this document for your information per your request.

I
Printed Name Signature Date
8. Originator Mason Pillow 11-- Y- _
9. Checker Ernesto Faillace
10. Lead/Supervisor Dwayne Chesnut
Responsible Manager DwayneChesnut
S12. Remarks: This document was prepared by the Engineered Barrier System Operations (EBSO) as an internal input to the activities related to
the Process Model Report within the EBSO. No external organization that may be affected by this document is identified.
Therefore, a technical review under procedure AP-2.14Q is not required.
Responsible Manager: Dwayne A. Chesnut
IN•&4O Cop
Enclosure 7 ,ev. (
AP-3.1 0Q.3
OFFICE OF CIVILIAN RADIOACTIVE WASTE MANAGEMENT 1. GA: QA
ANALYSIS/MODEL COVER SHEET Puge: 1 of: 30
, i Complete Only Applicable Items
2. Ananysis Engineering 3. Model Conceptual Model Documentation
W1 Performance Assessment L] Model Documentation
L] Scientific [] Model Validation Documentation
4. Title: Invert Diffusion Properties Model
5. Document Identifier (inclucing Rev. No. and Change No., if applcable):
ANL-EBS-MD-000031 REV 00
6. Total Attachments: 7. Attaclhnent Numbers - No. of Pages in Each:
2 1-9, 11-2

OFFICE OF CIVILIAN RADIOACTIVE WASTE MANAGEMENT
ANALYSIS/MODEL REVISION RECORD -1. Page: 2 of: 30
Complete Only Applicable Items
2. Analysis or Model Title: Invert DIffision Properties Model
3. Document Identifier (inclucing Rev. No. and Change No., if applicable):
ANL-EBS-MD-000031 REV 00
4. Revision/Change No.
Rev OOA
Rev OOB
Rev 00
5. Description of Revision/Change
Initial Issue (Check Copy).
Re-issued to incorporate checkers comments. Final check copy.
Initial issue.
AP-3.1 00.4 Key. UbfJU/I�i�'
AP-3.1 0Q.4
I
Rev. 06/301999

CONTENTS
Page
1. PU R PO SE ................................................................................................................................. 5 2. QUALITY ASSURANCE ................................................................................................... 6 3. COMPUTER SOFTWARE AND MODEL USAGE .......................................................... 7 4. IN P U T S ..................................................................................................................................... 8
4.1 DATA AND PARAMETERS .................................................................................. 8 4.1.1 Archie's Formula for Saturated Conditions ..................................................... 8 4.1.2 Cementation Factor for Unconsolidated Sand ................................................. 8 4.1.3 Archie's Formula for Unsaturated Conditions ................................................. 9 4.1.4 Saturation Exponent for Unconsolidated Sand................................................. 9 4.1.5 Nernst-Einstein Equation for Diffusivity ......................................................... 9 4.1.6 Equation Relating Equivalent Conductance and Conductivity ...................... 11
4.1.7 Conductance as a Function of Conductivity ....................................................... 11
4.1.8 Concentration Corrected for Activity ................................................................. 11 4.1.9 Viscosity of Water at 20 Degrees Celsius ..................................................... 12
4.1.10 Viscosity of Water as a Function of Temperature (Accepted Data) ............... 12 4.1.11 Resistivity and Conductivity of 0.1 Molar Potassium Chloride ..................... 12
4.1.12 Activity Coefficient of 0.1 Molar Potassium Chloride ................................... 12 4.1.13 Diffusion Coefficient of Potassium Chloride ................................................ 12 4.1.14 Porosity range ........................................................................... 12 4.1.15 Effect of Temperature on Diffusion ................................. 13
4.2 CRITERIA ............................................................................ 13
4.3 CODES AND STANDARDS ..................................................... 13
5. ASSUMPTIONS .............................................................................. 14
6. MODEL ........................................................................................... 15 6.1 RESISTIVITY OF PARTIALLY SATURATED MATERIAL ............................. 15 6.2 DIFFUSIVITY AS A FUNCTION OF CONDUCTIVITY ................................... 16 6.3 TEMPERATURE EFFECTS ON CONDUCTIVITY AND DIFFUSION ............ 17 6.4 EFFECTS OF WATER COMPOSITION ON DIFFUSION AND CONDUCTION 19 6.5 MODEL VALIDATION ....................................................................................... 20
6.5.1 Validation Criteria .......................................................................................... 20
6.5.2 Validation Results ......................................................................................... 20
7. C O N C LU SIO N S ..................................................................................................................... 22 7.1 R E SU LT S ................................................................................................................... 23
8. RE FEREN CES ........................................................................................................................ 28 8.1 DOCUMENTS CITED .......................................................................................... 28 8.2 CODES, STANDARDS, REGULATIONS, AND PROCEDURES ...................... 29
9. A TTA C H M EN T S ................................................................................................................... 30
ANL-EBS-MD-000031 REV 00 November, 1999Page 3 of 30

FIGURES
Page
Figure 1. Normalized Diffusivity vs. Water Content ............................................................... 21
Figure 2. Log Plot of Conductivity vs. Water Content ............................................................ 25
Figure 3. Log Plot of Diffusivity vs. Water Content .............................................................. 26
Figure 4. Log Plot Temperature Dependent Diffusivity vs. Water Content at 40% Porosity ..... 27
TABLES
Page
Table 1. Normalized Diffusivity as a Function of Saturation and Water Content .................. 21
Table 2. Diffusion Coefficients and Conductivity ................................................................... 24
ANL-EBS-MD-000031 REV 00 November, 1999Page 4 of 30

1. PURPOSE
The purpose of this document is described in CRWMS M&O 1999b, and is to develop a predictive model for the diffusivity of ions in unsaturated media. The scope of this document is limited to developing a model showing how resistivity and diffusivity can be estimated as a function of water content.
ANL-EBS-MD-000031 REV 00 November, 1999Page 5 of 30

2. QUALITY ASSURANCE
This document was prepared in accordance with AP-3.10Q, Analyses and Models, and the Development Plan (CRWMS M&O 1999b), which was prepared in accordance with AP-2.13Q, Technical Product Development Planning, and is subject to quality assurance controls. A Technical Change Request (T1999-0131) was approved in accordance with AP-3.4Q, Level 3 Change Control.
This technical document has been evaluated (CRWMS M&O 1999c) in accordance with QAP-2-0, Conduct ofActivities, and has been determined to be subject to the requirements of the Quality Assurance Requirements and Description (DOE 1998a). The QAP-2-3, Classification of Permanent Items, evaluation entitled Classification of the Preliminary MGDS Repository Design (CRWMS M&O 1999a, p. IV-1) has identified the ex-container system as QA-2, important to waste isolation. Diffusive inverts are not specifically classified, but the invert is a component of the ex-container system. For this document, it is assumed that the classification of a diffusive barrier is QA-2, important to waste isolation. Also, the invert is part of the engineered barrier system, which the Q-List has identified as QA-1, important to radiological safety; and QA-2, important to waste isolation (DOE 1998b, p. 11-9). The invert is not specifically on the Q-List.
This model is validated in accordance with Section 5.3 of AP-3.10Q, Analyses and Models. Model validation is discussed in Section 6.5. Qualified and accepted input data and references have been identified. No unqualified data were used in this report. All inputs are documented in Attachment I of this report in accordance with AP-3.15, Managing Technical Product Inputs. Results of this model have been submitted to TDMS in accordance with AP-SIII.3Q, Submittal and Incorporation of Data to the Technical Data Management System. Computer software and model usage are discussed in Section 3 of this report.
ANL-EBS-MD-000031 REV 00 November, 1999Page 6 of 30

3. COMPUTER SOFTWARE AND MODEL USAGE
No software subject to the requirements of the Quality Assurance Requirements and Description (DOE 1998a) was used in the preparation of this document. The model developed herein is validated in Section 6.5. The developed model is appropriate for the estimation of conductivity and diffusivity. The results of this report are within the range of validation, as discussed in Section 6.5.2.
ANL-EBS-MD-000031 REV 00 Page 7 of 30 November, 1999
4. INPUTS
4.1 DATA AND PARAMETERS
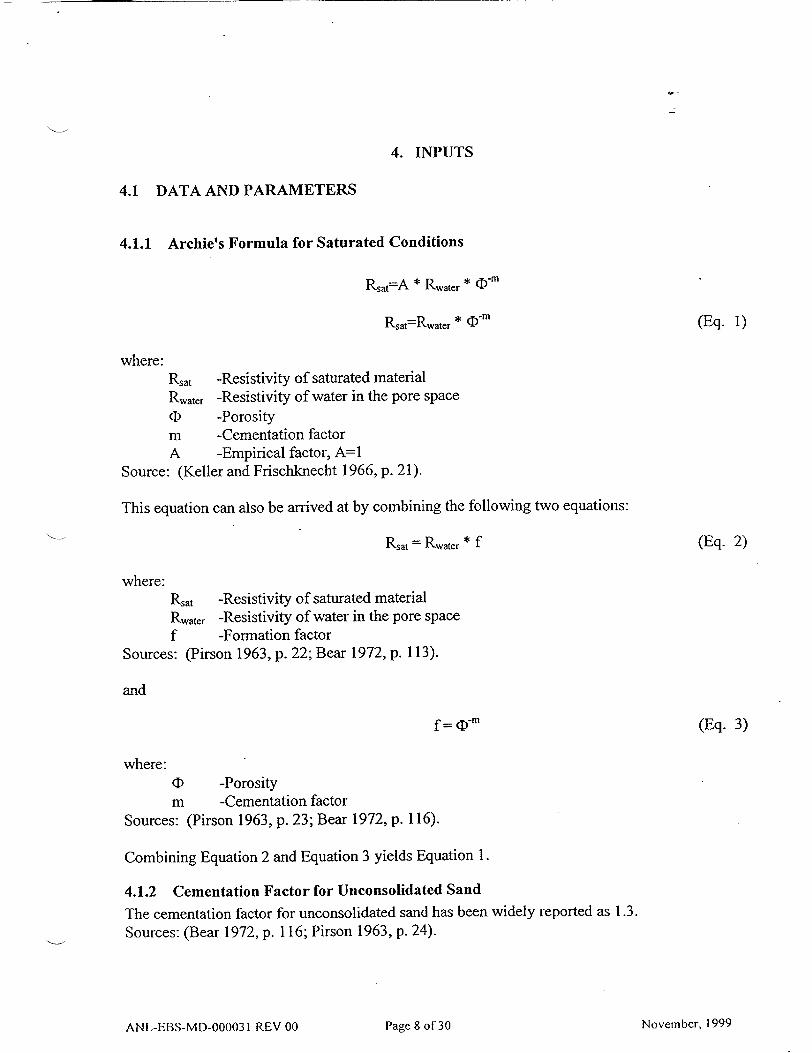
4.1.1 Archie's Formula for Saturated Conditions
Rsat=A * Rwater * (D-m
Rsat=Rwater * (I)"m (Eq- 1)
where: Rsat -Resistivity of saturated material Rwatcr -Resistivity of water in the pore space 0 -Porosity
m -Cementation factor A -Empirical factor, A=1
Source: (Keller and Frischknecht 1966, p. 21).
This equation can also be arrived at by combining the following two equations:
Rsat = Rwater * f (Eq. 2)
where: Rsat -Resistivity of saturated material Rwater -Resistivity of water in the pore space f -Formation factor
Sources: (Pirson 1963, p. 22; Bear 1972, p. 113).
and
f =D-m (Eq. 3)
where: ( -Porosity m -Cementation factor
Sources: (Pirson 1963, p. 23; Bear 1972, p. 116).
Combining Equation 2 and Equation 3 yields Equation 1.
4.1.2 Cementation Factor for Unconsolidated Sand
The cementation factor for unconsolidated sand has been widely reported as 1.3.
Sources: (Bear 1972, p. 116; Pirson 1963, p. 24).
ANL-EBS-MD-000031 REV 00 November, 1999Page 8 of 30
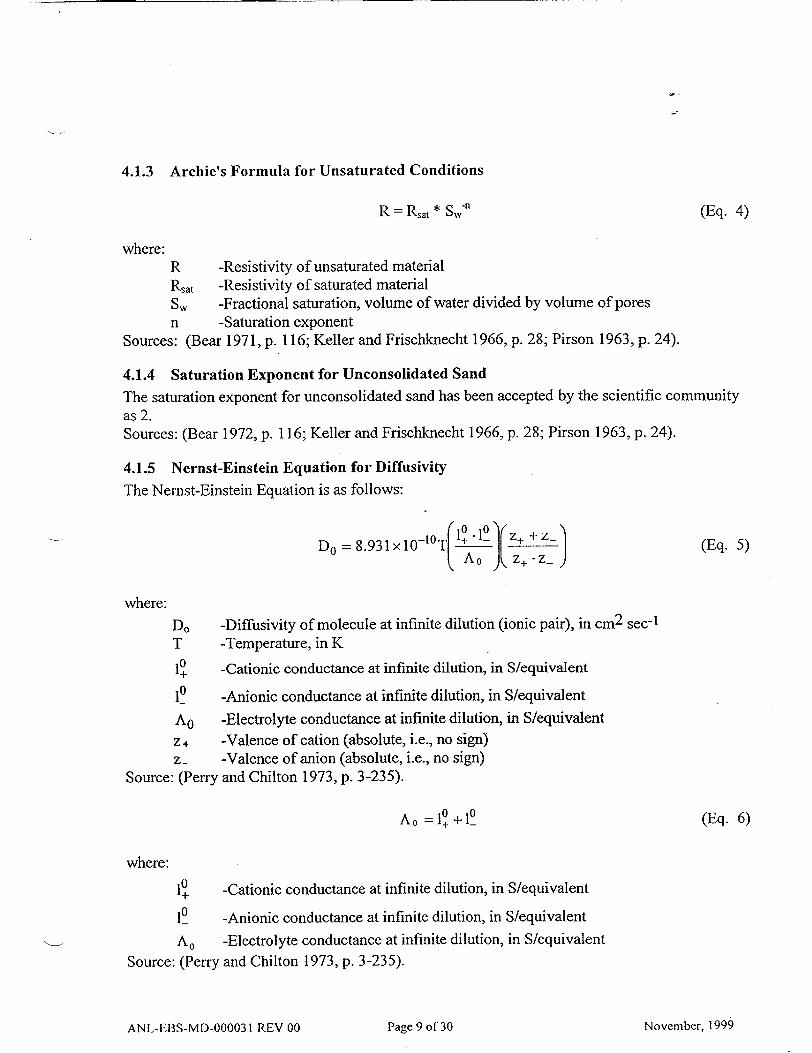
4.1.3 Archie's Formula for Unsaturated Conditions
R = Rsat * Sw"n
where: R -Resistivity of unsaturated material Rsat -Resistivity of saturated material SW -Fractional saturation, volume of water divided by volume of pores n -Saturation exponent
Sources: (Bear 1971, p. 116; Keller and Frischknecht 1966, p. 28; Pirson 1963, p. 24).
(Eq. 4)
4.1.4 Saturation Exponent for Unconsolidated Sand
The saturation exponent for unconsolidated sand has been accepted by the scientific community as 2. Sources: (Bear 1972, p. 116; Keller and Frischknecht 1966, p. 28; Pirson 1963, p. 24).
4.1.5 Nernst-Einstein Equation for Diffusivity
The Nemst-Einstein Equation is as follows:
D =8.3 x10⁻¹⁰T O "1 0 Z+ +zAo z+-z_ (Eq. 5)
where:
Do -Diffusivity of molecule at infinite dilution (ionic pair), in cm2 sec-I T -Temperature, in K 0 1+ -Cationic conductance at infinite dilution, in S/equivalent 10 -Anionic conductance at infinite dilution, in S/equivalent
Az -Electrolyte conductance at infinite dilution, in S/equivalent
z+ -Valence of cation (absolute, i.e., no sign) zr -Valence of anion (absolute, i.e., no sign)
Source: (Perry and Chilton 1973, p. 3-235).
A0 = 1°+ 1 (Eq. 6)
where: 0 1+ -Cationic conductance at infinite dilution, in S/equivalent 10 -Anionic conductance at infinite dilution, in S/equivalent
AO -Electrolyte conductance at infinite dilution, in S/equivalent Source: (Perry and Chilton 1973, p. 3-235).
ANL-EBS-MD-000031 REV 00 November, 199§}Page 9 of 30

It can be shown that the square of the average of two (unique) numbers is always greater than their product (Attachment II).
The following statement will allow a simplification of Equation 5:
-2 >10 .10
where:
10 -Cationic conductance at infinite dilution, in S/equivalent
1+ -Anionic conductance at infinite dilution, in S/equivalent
I -Average ionic conductance at infinite dilution, in S/equivalent Source: Equation 11-2.
It is conservative to substitute the average ionic conductance for the product of the cationic and anionic conductance because the resulting diffusion coefficient, if altered, will be made larger (i.e., a faster rate of diffusion). Incorporating this substitution and Equation 6 into. Equation 5 yields:
Equation 5: D,=8.931x1 0- T Z+lj -+-ZtAo Z+ *z-z A, = I' + 10
Equation 6:
using conclusion from Equation 11-2: Ao= 21
substituting: D. 8.93lx1O0T _J(2)
simplifying: D, =8.931x10¹⁰T(i)
D, =8.931x1OToT (Eq. 7)
where: D. -Diffusivity of molecule at infinite dilution (ionic pair), in cm 2 sec-1 T -Temperature, in K
10 -Cationic conductance at infinite dilution, in S/equivalent
10 -Anionic conductance at infinite dilution, in S/equivalent
I -Average ionic conductance at infinite dilution, in S/equivalent
A0 -Electrolyte conductance at infinite dilution, in S/equivalent
ANL-EBS-MD-000031 REV 00 November, 1999Page 10 of 30
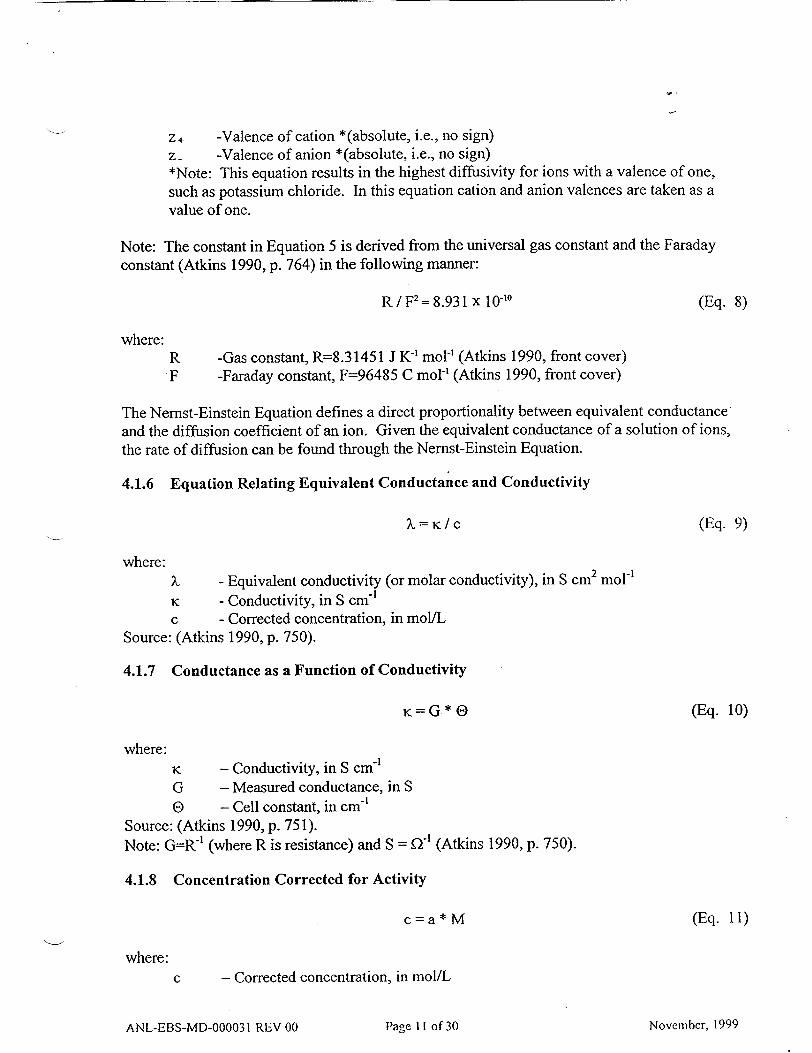
z + -Valence of cation *(absolute, i.e., no sign) z_ -Valence of anion *(absolute, i.e., no sign) *Note: This equation results in the highest diffusivity for ions with a valence of one,
such as potassium chloride. In this equation cation and anion valences are taken as a value of one.
Note: The constant in Equation 5 is derived from the universal gas constant and the Faraday constant (Atkins 1990, p. 764) in the following manner:
R/F 2=8.931 x 10⁻¹⁰ (Eq. 8)
where: R -Gas constant, R=8.31451 J K• mol' (Atkins 1990, front cover) F -Faraday constant, F=96485 C mol' (Atkins 1990, front cover)
The Nernst-Einstein Equation defines a direct proportionality between equivalent conductance
and the diffusion coefficient of an ion. Given the equivalent conductance of a solution of ions, the rate of diffusion can be found through the Nernst-Einstein Equation.
4.1.6 Equation Relating Equivalent Conductance and Conductivity
X,=KIc (Eq. 9)
where:
21 - Equivalent conductivity (or molar conductivity), in S cm 2 molr
K, - Conductivity, in S cm-1
c - Corrected concentration, in mol/L Source: (Atkins 1990, p. 750).
4.1.7 Conductance as a Function of Conductivity
K=G*® (Eq. 10)
where:
K - Conductivity, in S cm 1
G - Measured conductance, in S
E - Cell constant, in cm-1
Source: (Atkins 1990, p. 751).
Note: G=R7' (where R is resistance) and S = Q-1 (Atkins 1990, p. 750).
4.1.8 Concentration Corrected for Activity
c = a * M (Eq. 11)
where: c - Corrected concentration, in mol/L
ANL-EBS-MD-000031 REV 00 November, 1999Pagec I I of 30
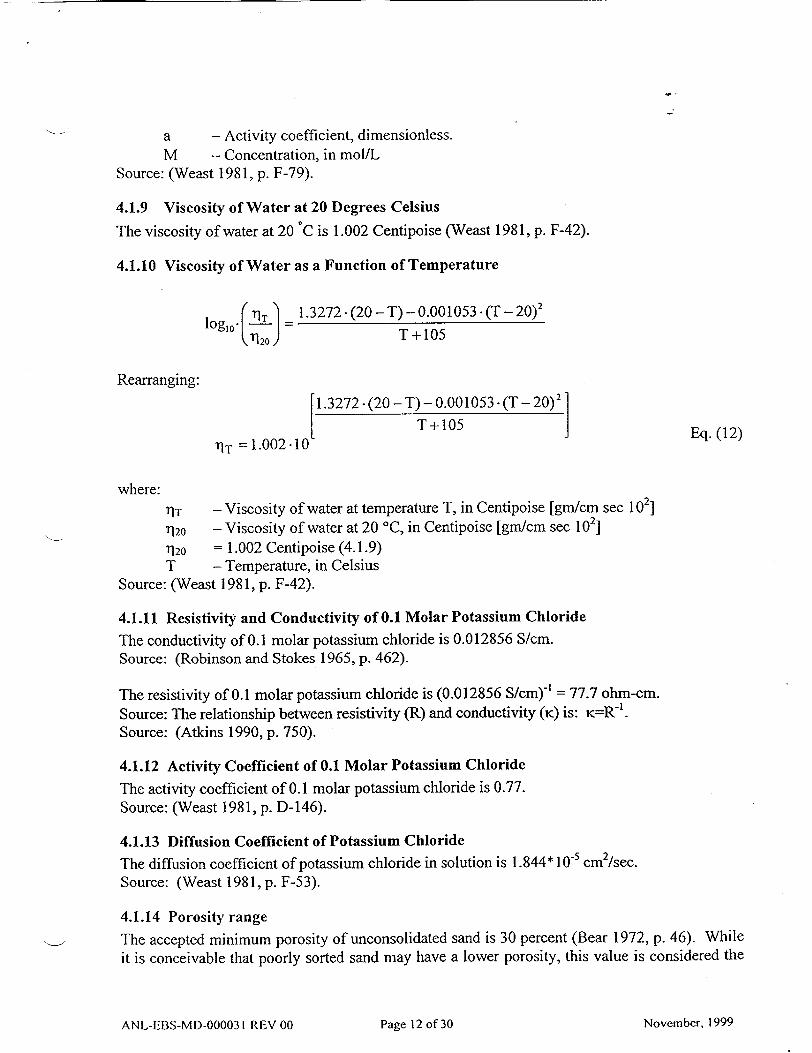
a - Activity coefficient, dimensionless. M - Concentration, in mol/L
Source: (Weast 1981, p. F-79).
4.1.9 Viscosity of Water at 20 Degrees Celsius
The viscosity of water at 20 OC is 1.002 Centipoise (Weast 1981, p. F-42).
4.1.10 Viscosity of Water as a Function of Temperature
log, 0. (m I, 1.3272.(20-T)T- 0.001053 "(T - 20) 2
Rearranging:
1.3272- (20 - T) - 0.001053. (T - 20) 2
'IT =1.002-10 T+105 Eq. (12)
where: 11T - Viscosity of water at temperature T, in Centipoise [gm/cm see 1021]
T12 0 - Viscosity of water at 20 'C, in Centipoise [gm/cm see 102]
T120 = 1.002 Centipoise (4.1.9) T - Temperature, in Celsius
Source: (Weast 1981, p. F-42).
4.1.11 Resistivity and Conductivity of 0.1 Molar Potassium Chloride
The conductivity of 0.1 molar potassium chloride is 0.012856 S/cm. Source: (Robinson and Stokes 1965, p. 462).
The resistivity of 0.1 molar potassium chloride is (0.012856 S/cmf)- = 77.7 ohm-cm. Source: The relationship between resistivity (R) and conductivity (K) is: K=R"1.
Source: (Atkins 1990, p. 750).
4.1.12 Activity Coefficient of 0.1 Molar Potassium Chloride
The activity coefficient of 0.1 molar potassium chloride is 0.77. Source: (Weast 1981, p. D-146).
4.1.13 Diffusion Coefficient of Potassium Chloride
The diffusion coefficient of potassium chloride in solution is 1.844* 10- cm 2/sec. Source: (Weast 1981, p. F-53).
4.1.14 Porosity range
The accepted minimum porosity of unconsolidated sand is 30 percent (Bear 1972, p. 46). While
it is conceivable that poorly sorted sand may have a lower porosity, this value is considered the
ANL-EBS-MD-000031 REV 00 November, 1999Page 12 of 30

lower bound for most samples. The maximum porosity for uniform spherical particles approaches 50 percent (Bear 1972, p. 46). The range of porosity used in this model is between 30 percent and 50 percent.
4.1.15 Effect of Temperature on Diffusion
The diffusivity (D) is proportional to temperature (T, in Kelvin) and inversely proportional to viscosity (rl) (i.e., D oc T / -q). Source: (Cussler 1997, p. 114).
It follows that if diffusivity (Do) is known at some [ambient] temperature (T,), the diffusivity (D) at some [elevated] temperature (T) can be found by:
( ) D=D TO (Eq. 13)
Substituting viscosity (Equation 12) for ri and rjo [using (b * ax) / (b * ay) = axy]:
f~T + 273
-+•-•- ( + 273) (Eq. 14) D 0[1.3272.(20-T)-0.001053.(T_20)
2 1.3272.(20-T0)-0.001053.(T0_20)2 10r T+105 T0 +105 03(p2)
where: D -Adjusted diffusivity, in cm2/sec, at temperature T, in degrees Celsius Do -Diffusivity, in cmlsec, at temperature To, in degrees Celsius
4.2 CRITERIA
No criteria, as defined in AP-3.IOQ, were used in the preparation of this document.
4.3 CODES AND STANDARDS
No codes or standards, as defined in AP-3.1 OQ, were used in the preparation of this document.
ANL-EBS-MD-00003 1 REV 00 November, 1999Page 13 of 30

5. ASSUMPTIONS
No assumptions were used in the preparation of this model, this section is therefore not applicable.
ANL-EBS-MD-000031 REV 00 November, 1999Page 14 of 30

6. MODEL
A model for estimating the diffusivity of electrolytes in saturated and unsaturated porous material is developed in Section 6.2. The model has two parts: first, a model for estimating the conductivity of a material is presented in Section 6.1. The inputs into this model are empirical, and accepted data for clean sand is given as an example. This model predicts the conductivity of a material as a function of saturation.
The second part of the model is developed in Section 6.2 and yields a diffusion coefficient based on conductivity (found through direct measurement or through the method in Section 6.1). An additional portion of the model is developed in Section 6.3, and allows the adjustment of diffusion coefficients as a function of temperature. The effects of water composition are conservatively bounded in Section 6.4.
The model is validated by comparison with a collection of measured diffusion coefficients found using traditional techniques. Model validation criteria are developed in Section 6.5.1. Model validation data is developed in Section 6.5.2 and presented in Table 1 and Figure 1.
6.1 RESISTIVITY OF PARTIALLY SATURATED MATERIAL
Archie's law is presented as an estimate of the conductivity of a material based on saturation, resistance of the saturating solution, and porosity. Combining Equation 1 and Equation 4 yields an equation for conductivity as a function of porosity, saturation, and the conductivity of the saturating fluid.
Equation 1: Rsat=Rwater * -m
Equation 4: R = Rsat * Sw-'
combining equations: R = Rwater -m Sw n
converting to conductivity: C = [Rwater (-m Sw'n]-,
simplifying: C = Cwater '•Dm S, n (Eq. 15)
where: C - Conductivity of partially saturated material Cwater - Conductivity of water in the pore structure ( - Fractional porosity. Parametric range between 0.30 and 0.50
Sw - Saturation, fraction of pore volume containing water m - Empirical cementation factor n - Empirical saturation exponent
The calculated conductivity of sand partially saturated with 0.1 molar potassium chloride is shown for ranges of porosity and saturation in Table 2 and Figure 2.
ANL-EBS-MD-000031 REV 00 November, 1999Page 15 of 30

6. DIFSVT AS A FUCTO OFCNDCIVT
inrint amont of tim to colet Manann bondr codtin over 6xene time0 ~ perod 66 6ifcut 0-e inirc meho of Se termnn difso coficet at lo *water
cotn is to use codctvt mesue nt to - aclt 6o cofi iet. The anSalogyiie
betee the drvn focs acin on an ion In elcria 64dctvt mesrmns th driving
*oc acin on th ios is .lcria poenia grdet In difsin 0 the drvn foc acin oS
Eqato 7: D. 8. x I0_ T 2
Eqain10* * 0
Cobnn Eutos 9, 10 an 11 .=G G/a MIIOc ) (Eq 16
Difsvt is fon by cobnn 6qain 7 n 6(it
* 0 6.901510-6. T5 G 0 10 (Eq 17
k -Coducan e, in S Sm o-. Aduse 0o cocnrtonefcs
* -C nutiiy in S .e 0
E) ~ -Cel co stat 0n .
T -Tmeaue . n S
AN-B-D003 RE 00 P* 16o.0 Noemer.19
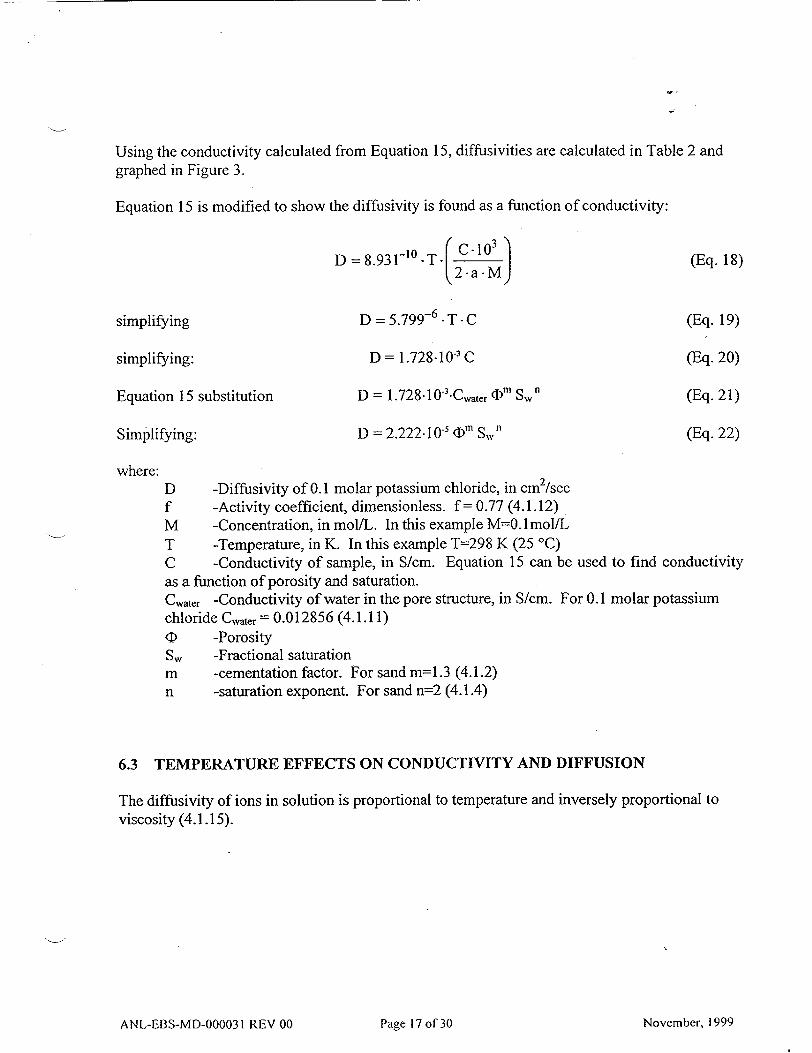
Using the conductivity calculated from Equation 15, diffusivities are calculated in Table 2 and graphed in Figure 3.
Equation 15 is modified to show the diffusivity is found as a function of conductivity:
D =8.931-' 0 T C.a-03 (Eq. 18)
simplifying D = 5.799- 6 T- C (Eq. 19)
simplifying: D = 1.728-10- C (Eq. 20)
Equation 15 substitution D = 1.728.10-3-Cwater Om Swn (Eq. 21)
Simplifying: D = 2.222.10-' Om Swv (Eq. 22)
where: D -Diffusivity of 0.1 molar potassium chloride, in cm2/sec f -Activity coefficient, dimensionless. f= 0.77 (4.1.12) M -Concentration, in mol/L. In this example M=0.1 mol/L T -Temperature, in K. In this example T=298 K (25 'C) C -Conductivity of sample, in S/cm. Equation 15 can be used to find conductivity as a function of porosity and saturation. C,,,ater -Conductivity of water in the pore structure, in S/cm. For 0.1 molar potassium chloride Cwater = 0.012856 (4.1.11) D -Porosity Sw -Fractional saturation m -cementation factor. For sand m=1.3 (4.1.2) n -saturation exponent. For sand n=2 (4.1.4)
6.3 TEMPERATURE EFFECTS ON CONDUCTIVITY AND DIFFUSION
The diffusivity of ions in solution is proportional to temperature and inversely proportional to viscosity (4.1.15).
ANL-EBS-MD-000031 REV 00 November, 1999Page 17 of 30

Equation 14:
T +273)
To +273) - o [.3272.(20-T)-o.oo0o053(T -20) I.3272.(20-T .0) 1053(T, 0 -2o)2
+105 T+105
Equation 17:G-0 -10 D = 8 .931"10 -"1 -To° ( 2 --- M
for Too = 25 C, the viscosity exponent is:
1.3272. (20 - Too) - 0.001053. (Tco - 20)2
Teo +105= -0.051 (Eq. 23)
Substituting Equation 17 and Equation 23 into Equation 14 and converting to Kelvin (To cancels
out of the numerator):
simplifying: D (Eq. 24)
For 0.1 molar potassium chloride with conductance measured at temperature TL, in Kelvin:
Equation 19: 6 Do =5.799 *To -C
Substituting Equation 19 and Equation 23 into Equation 14 and converting to Kelvin:
ANL-EBS-MD-000031 REV 00 Page 18 of 30 November, 1999

D = (5.799-10-6 T-C) (Eq. 25) .[-1"3272.(T-293)-0.001053"(T-293)2 +0.051T1
Substituting Equation 15 for C:
D (5.799.10-6 . T"(Cwater "0m "Swn) (Eq. 26) [-1.3272-(T-293)-0.001053-(T-293) 2 +0.0511
1°L T-6 ]
For sand partially saturated with 0.1 molar potassium chloride:
D - (7.455-10-8 T'((D 1.3 "Sw2 (Eq. 27)
[-1.3272-(T-293)-0.001053-(T-293)2.+0.051)1
where: D -Diffusivity of 0.1 molar potassium chloride at 25 C, in cm2/sec T -Temperature, in K C -Conductivity of sample, in S/cra Cwater -Conductivity of water in the pore structure, in S/cm. For 0.1 molar potassium chloride Cwater = 0.0 12856 (4.1.11)
(D -Fractional porosity Sw -Fractional saturation m -cementation factor. For sand m=1.3 (4.1.2) n -saturation exponent. For sand n=2 (4.1.4)
Using Equation 27, diffusion coefficients are calculated in Table 2 as a function of temperature. These data are also presented in Figure 4.
6.4 EFFECTS OF WATER COMPOSITION ON DIFFUSION AND CONDUCTION
The activity coefficient of an ion in a single salt solution is generally higher than the activity coefficient of an ion in solution with many other ions. This statement is corroborated by Stumm and Morgan (1981, p. 411), where activity coefficients in single salt solutions are compared with
activity coefficients measured in seawater. The model does not account for background electrolyte effects, which is conservative (bounding).
ANL-EBS-MD-00003 1 REV 00 Page 19 of 30 November, 1999
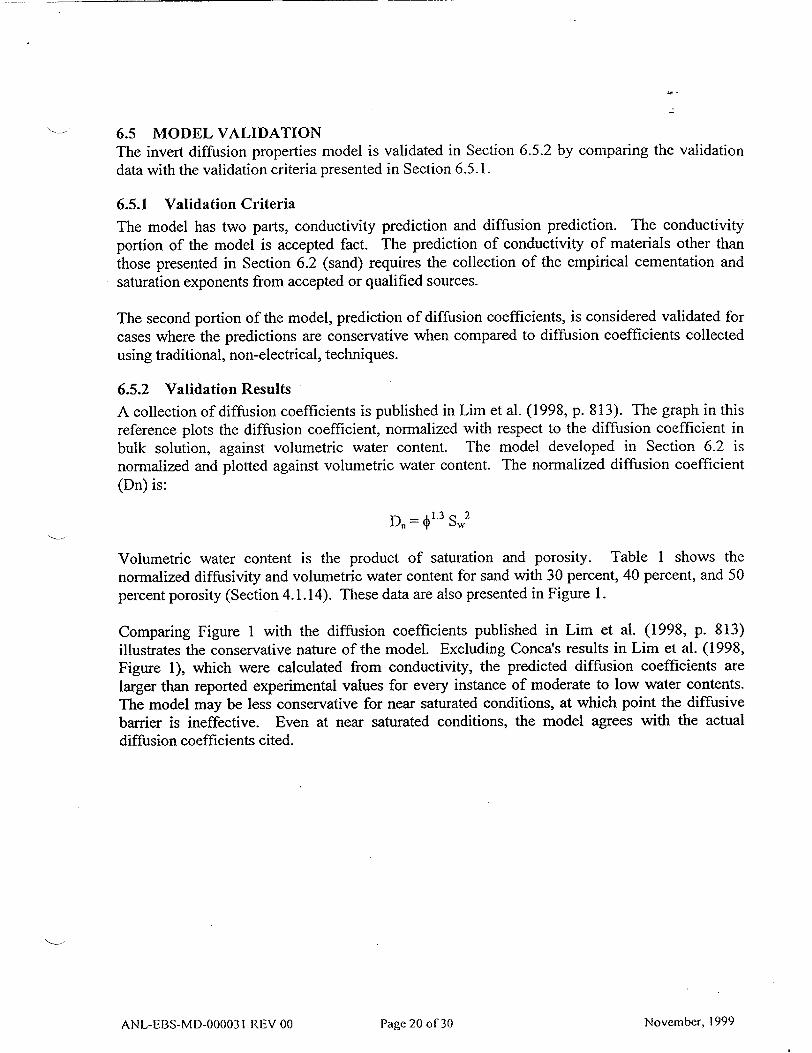
6.5 MODEL VALIDATION The invert diffusion properties model is validated in Section 6.5.2 by comparing the validation data with the validation criteria presented in Section 6.5.1.
6.5.1 Validation Criteria
The model has two parts, conductivity prediction and diffusion prediction. The conductivity
portion of the model is accepted fact. The prediction of conductivity of materials other than those presented in Section 6.2 (sand) requires the collection of the empirical cementation and saturation exponents from accepted or qualified sources.
The second portion of the model, prediction of diffusion coefficients, is considered validated for cases where the predictions are conservative when compared to diffusion coefficients collected using traditional, non-electrical, techniques.
6.5.2 Validation Results
A collection of diffusion coefficients is published in Lim et al. (1998, p. 813). The graph in this reference plots the diffusion coefficient, normalized with respect to the diffusion coefficient in
bulk solution, against volumetric water content. The model developed in Section 6.2 is normalized and plotted against volumetric water content. The normalized diffusion coefficient (Dn) is:
D,, = b1"3 S,,,2
Volumetric water content is the product of saturation and porosity. Table 1 shows the normalized diffusivity and volumetric water content for sand with 30 percent, 40 percent, and 50 percent porosity (Section 4.1.14). These data are also presented in Figure 1.
Comparing Figure 1 with the diffusion coefficients published in Lim et al. (1998, p. 813) illustrates the conservative nature of the model. Excluding Conca's results in Lim et al. (1998, Figure 1), which were calculated from conductivity, the predicted diffusion coefficients are
larger than reported experimental values for every instance of moderate to low water contents. The model may be less conservative for near saturated conditions, at which point the diffusive
barrier is ineffective. Even at near saturated conditions, the model agrees with the actual diffusion coefficients cited.
ANL-EBS-MD-00003 1 REV 00 November, 1999Page 20 of"30
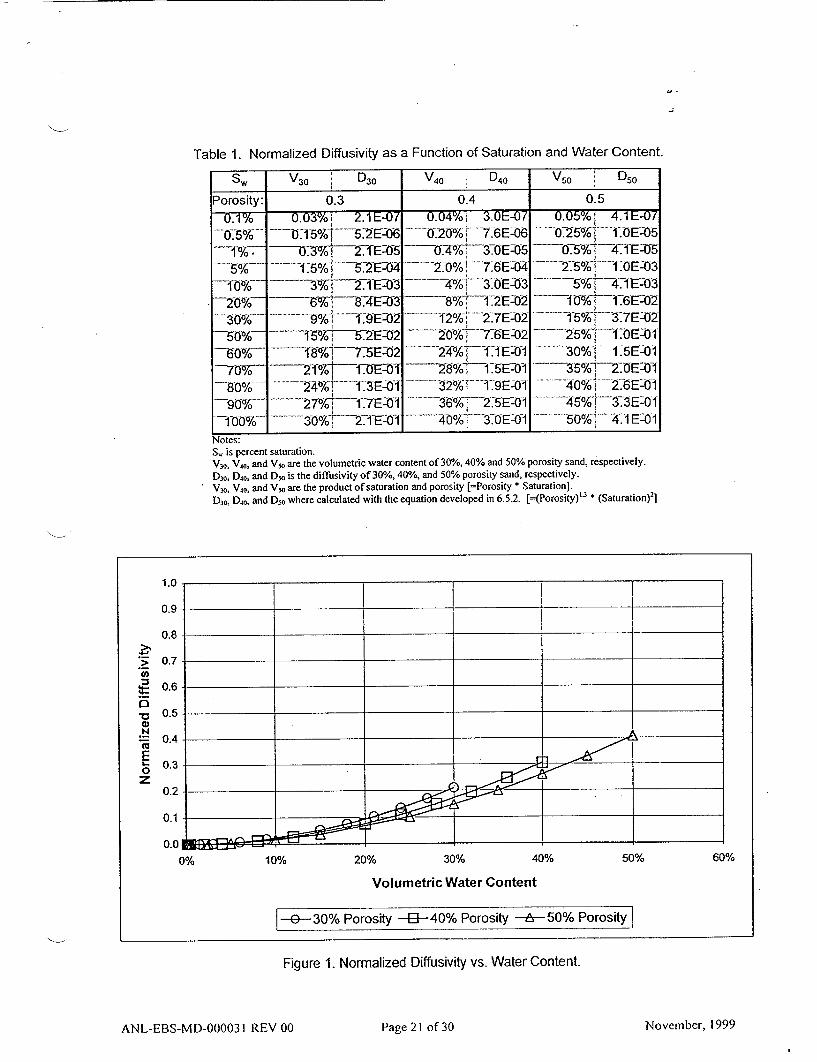
Table 1. Normalized Diffusivity as a Function of Saturation and Water Content.
----------. -- 90 ------ -- 02
-2r ---57-j6I-EZ227% --7 T5E-02
302 § .1E-0i
U.U4'o; J3.Ut--U( ... 20% 7.6E-06 -0-T-•-3-0E-0-5
S20% "7 6 E-04 S... 4% -3TOE-03 -- 8%•:2_E:02
-. -2%-2:7E-02 ... 0-%7,--6E.:02 --24-0T ---jI E- 011
...... 71-115 E 01 3 ...... .32 .o!-'---T19E::0.1
-5- 3 % 9 E - -01 4........ 36% . E--2O5E0
..... 40%•--3:0E=0-1
0.5
~0.05%/ 4.1E--07 0.25%f .. OE.. :05
2.5%-'--1I0E O03 ..... --5%V4,T1Et_3
10•rih1.6E-O2 -- -------- -- 15/% 31---3:7E 02
. 25••o -I0E-1
-- 3;5%1--2,0E031
40 2.. 2-6E:01 ..45�34 E:O-1
S.......50/7o ,---I-1EO:1
Notes: S,. is percent saturation. V3o, V4a, and Vo are the volumetric water content of 30%, 40% and 50% porosity sand, respectively. D30, D4, and DN is the diffusivity of 30%, 40%, and 50% porosity sand, respectively. V3 O, V40, and Vo are the product of saturation and porosity [=Porosity * Saturation]. D30, D40, and D5 where calculated with the equation developed in 6.5.2. [=(Porosity)' 3 * (Saturation)2 ]
Figure 1. Normalized Diffusivity vs. Water Content.
ANL-EBS-MD-000031 REV 00
V 50 D50
--50%~ --600%--700/6
---,g%-
,-1,00%/--
November, 1999Page 21 of 30

7. CONCLUSIONS
The diffusivity of a given material can be predicted from conductivity measurements or basic material properties, including two empirical constants. The models in this document were validated in Section 6.5.2.
Equation 15 C = Cwater * (I' * Swn
where: C -Conductivity of the material Cwater -Conductivity of the saturating material ( -Porosity. Parametric range between 30% and 50% m -Empirical cementation factor n -Empirical saturation exponent
The diffusivity can be found from conductivity through the following:
Equation 17: D =8.931 .101 0 ,T, G -e -103
where: D - Diffusivity, in cm2 sec' G - Measured conductance, in S ® - Cell constant, in cm-1
a - Activity coefficient, dimensionless M - Concentration, in mol/L T - Temperature, in K
ANL-EBS-MD-000031 REV 00 November, 1999Page 22 of 30

A modification of this model includes a temperature adjustment:
(8.931"10-10 -T (G ' 10G12- .
Equation 24: D = [-1.3272"(T-293)-0.001053-(T-293) 2 +0051)
+0.0
where: G - Measured conductance, in S
E - Cell constant, in cm-1
a - Activity coefficient, dimensionless M - Concentration, in mol/L T -Temperature, in K
7.1 RESULTS
Conductivity and diffusivity are presented in Table 2. Figure 2 is a log-log plot of conductivity as a function of water content. Figure 3 is a log-log plot of diffusivity as a function of water content. Figure 4 is a log-log plot of diffusivity as a function of temperature for a material at a porosity of 40%.
ANL-EBS-MD-000031 REV 00
t•
November, 1999Page 23 of 30

(
Table 2. Diffusion Coefficients and Conductivity
Notes: (Sw) Saturation (Sw) is a parametric value ranging between 0.1% and 100% (Vw) Volumetric Water Content (Vw) is the product of porosity and saturation. (C) =(0.0 12 856* (Porosity)^ 1.3 *(Saturation)A2). Source: Equation 15 with C.,,,.=0.0 12856 (4. 1.11). (D) =2.222* l0.s*((Porosity)A1.3*(Saturation)A2)). Source: Equation 22. (Dt) =(7.455 * I 0**(Temp. in K)*(porosity)AI .3*(Sw)A2)/[ I OA((.l .31 72*(20 - Temp in 0C))-0.001I053*((Temp in *C -20)A2))/(Temp in TC + 105) + 0.05 1)]
Source: Equation 27. While saturation (Sw) and volumetric water content (Vw) are displayed as percentages, the fractional values are used in calculations.
z 0
z
M
0
Sw VW wVW G D D D Dt t1 Dt Dt Tm &m ridegrees esius.j 30' 20 ---!' 0
Pooit:30 0%J50f 3~J 40 0% 3% 4-0% 50% 40% 40%__j. 400% 406
0.% .03% u.u4-/%- 0.050/ 2.7F--09 3.9E-09 15.2E-09 4.6E-2i6.8E-12 9.QE-12 5.9E-2.E11 t. 0.3%' 0.0 9%' 0.12 % a. I507-% ".4 E -0*8 --3 E 48 4.7E0 41El .E1 1-15E2iFEf 1 15~02E1
0% 0T%02% 0725MOO~ -G. 7E- YgEZ0ý T.S 3E-07 -12-.E:TOIU T--'7ET0I' 12-aETJ01 .T5E--T3T0T44-E1l5 0.% .2% .2% .3% 3E07 19E072.6'E-07 -2.3E-1 0 M.E- 0 i44Ef 2Ei05Ei018E-01.E-09
01% 0.'2% 0.48% '*.3W'5727-I-''.3EU-7- "I'E07"T2E0 4"6 6TE0T4E"I-0 2.9l"'E 3% 0.3%" 0.2% 0.5% 2E G1 3.95E-U'~ 47 E0 . .2-0 -0E-9 .E-09 530'1Z 13E-09,21E0
4-E'5% IU 8 S ".5%. MM70% -1. 12? 2 1 4:E :E-08
13% G39%- 4*.% ... 1 .E0 3."605 or~E0 4:6U6086.8E-08;E-0-0 ".E08.E-06 1-.-5E-0:.E0
15% % 6 8% 6.E-058.8-051.2-f04 i.E-J0971 .EZ-072OE 1.5 E 0712.7Er07 3'4.9ET-075.E--078
80% ...%.. .... 6 VE-045 1E-04 .2E-04 1"JOE-07 2.5E-07'3'.OE-'07'7 24E'-07'4.87E-07j6ISE 075.321-07
-"-7 _0 --- 0' o -.E'07 7.4E0711T 06 .4E-0',9'E4E0 7E-"03.06E-076194 3E906.8E
70% 2"%~ 28%"{, Mo T7 ... "3IE'-03' T.BE'03 :2.1 E-04 1.9E-07':E0..E 2.9E-07 5:8E-'07 8.E03:lE-07 90%'27 ~3% 4%' 22~033.2-O 4.6E-0 3:'-0jE--0Q7.38'-0764.3E-0697E,-06.4E01 .E0
I.

1.00%
Volumetric Water Content
1 4 30% Porosity -3--40% Porosity -As 50% Porositye
Figure 2. Log Plot of Conductivity vs. Water Content
(
z C
0 0
m
0 0
I. I --
I.0E-02
1.OE-03
1.OE-04
S1.0E-05
- 1.OE-06 C 0
1.OE-07
1.0E-08
i r~nQ:.c
0.01% 0.10% 10.00% 100.00%
h.
i -45p
-x

(
1.OE-04
1.0E-05
1.OE-06
"Z 1.OE-07
- 1.OE-08
j- 1.OE-09
1.OE-10
1.0E-11
1.OE-12
0.01% 0.10% 1.00% 10.00% 100.00%
Volumetric Water Content
--• 30% Porosity -U--40% Porosity -*-50% Porosity
Figure 3. Log Plot of Diffusivity vs. Water Content

z
C,
Cr'
0 0 0
0.10% 1.00% 10.00%
Volumetric Water Content
-4--25 Degrees -3-50 Degrees A 70 Degrees -e- 90 Degrees]
Figure 4. Log Plot Temperature Dependent Diffusivity vs. Water Content at 40% Porosity
(
1.OE-04
1.OE-05
1.OE-06
________________________________________________________________________________ _______________________________________________________________________________ I
U' 1.OE-07 '.,
E
• 1.OE-08
1.OE-09
1.0E-10
1.OE-1 1
1.OE-12
0.01% 100.00%

8. REFERENCES
8.1 DOCUMENTS CITED
Atkins, P.W. 1990. Physical Chemistry, 4th Edition. New York, New York: W. H. Freeman and Company. TIC: 245483.
Bear, J. 1972. Dynamics of Fluids in Porous Media. New York, New York: American Elsevier Publishing Company, Inc. TIC: 217568.
CRWMS M&O (Civilian Radioactive Waste Management System Management and Operating Contractor) 1999a. Classification of the Preliminary MGDS Repository Design. B00000000
01717-0200-00134 Rev 01. Las Vegas, Nevada: CRWMS M&O. ACC: MOL.19981103.0546.
CRWMS M&O 1999b. Development Plan for Invert Diffusion Properties Model. TDP-EBSMD-000016 Rev 00. Las Vegas, Nevada: CRWMS M&O. ACC: MOL.19990813.0391.
CRWMS M&O 1999c. Activity Evaluation for Engineered Barrier System Performance
Modeling (WP# 12012383MX). Las Vegas, Nevada: CRWMS M&O. ACC: MOL.19990719.0317.
Cussler, E.L. 1997. Diffusion: Mass Transfer in Fluid Systems, 2 "d Edition. New York, New York: Cambridge University Press. TIC: 241150.
DOE (U.S. Department of Energy) 1998a. Quality Assurance Requirements and Description.
DOE/RW-0333P Rev 8. Washington, D.C.: DOE Office of Civilian Radioactive Waste Management (OCRWM). ACC: MOL.19980601.0022.
DOE 1998b. Q-List. YMP/90-55Q Rev 5. Las Vegas, Nevada: OCRWM. ACC: MOL.19980513.0132.
Keller, G.V. and Frischknecht5 F. C. 1966. Electrical Methods in Geophysical Prospecting. New York, New York: Pergamon Press. TIC: 230941.
Lim, P.C.; Barbour, S.L.; and Fredlund, D.G. 1998. "The influence of degree of saturation on
the coefficient of aqueous diffusion" Canadian Geotechnical Journal, 35, 811-827. Ottawa,
Ontario: NRC Research Press. TIC: 245626.
Perry, R.H. and Chilton, C.H. 1973. Chemical Engineers'Handbook, 5"' Edition. New York, New York: McGraw-Hill Book Company. TIC: 242591.
Pirson, S.J. 1963. Handbook of Well Log Analysis: For Oil and Gas Formation Evaluation. Englewood Cliffs, New Jersey: Prentice-Hall, Inc. TIC: 245393.
ANL-EBS-MD-00003 1 REV 00 November, 1999Page 28 of 30

Robinson, R.A. and Stokes, R.H. 1965. Electrolyte Solutions: The Measurement and Interpretation of Conductance, Chemical Potential and Diffusion in Solutions of Simple Electrolytes, 2 Edition. London, England: Butterworths Publications Limited. TIC: 242575.
Stumm, W. and Morgan, J. J. 1981. Aquatic Chemistry: An Introduction Emphasizing Chemical Equilibria in Natural Waters, 2 "d Edition. New York, New York: John Wiley & Sons, Inc. TIC: 208448.
Weast, R.C., ed. 1981. CRC Handbook of Chemistry and Physics: A Ready-Reference Book of Chemical and Physical Data, 6 2 "d Edition. Boca Raton, Florida: CRC Press. TIC: 240722
8.2 CODES, STANDARDS, REGULATIONS, AND PROCEDURES
AP-2.13Q, Rev 00. Technical Product Development Planning. Washington, D.C.: DOE OCRWM. ACC: MOL.19990701.0617.
AP-3.4Q, Rev 01. Level 3 Change Control. Washington, D.C.: DOE OCRWM. ACC: MOL. 19990923.0230.
AP-3.1OQ, Rev 01. Analyses and Models. Washington, D.C.: DOE OCRWM. ACC: MOL. 19990702.0314.
AP-3.15Q, Rev 00, ICN 1. Managing Technical Product Inputs. Washington, D.C.: DOE OCRWM. ACC: MOL. 19990831.0079.
AP-SIII.3Q, Rev 00. Submittal and Incorporation of Data to the Technical Data Management System. Washington, D.C.: DOE OCRWM. ACC: MOL.19990702.0319.
QAP-2-0, Rev 05. Conduct ofActivities. Las Vegas, Nevada: CRWMS M&O. ACC: MOL. 19980826.0209.
QAP-2-3, Rev 10. Classification of Permanent Items. Las Vegas, Nevada: CRWMS M&O. ACC: MOL. 19990316.0006.
ANL-EBS-MD-000031 REV 00 Page 29 of 30 November, 1999
9. ATTACHMENTS
Pages Attachment I: Document Input Reference Sheets ............................................................... I-1 -1-9 Attachment II: Mathematical Proof .................................................................................... 1-1 - 1-2
ANL-EBS-MD-000031 REV 00 November, 1999Page 30 of 30
ATTACHMENT I DOCUMENT INPUT REFERENCE SHEETS
ANL-EBS-MD-000031 REV 00 November, 19991-1

(
OFFICE OF CIVILIAN RADIOACTIVE WASTE MANAGEMENT
DOCUMENT INPUT REFERENCE SHEET
I. Document Identifier No./Rev.: Change: Title:
ANL-EBS-MD-000031 REV 00 .- Invert Diffusion Properties Model
Input Document 8. TBV Due To
2. Technical Product Input 3. Section 4. Input 5. Section 6. Input Description 7. TBV/TBD Unqual. From Un
Source Title and Priority Uncontrolled confirmed
Identifier(s) with Version Source
a Atkins, P.W. 1990. Physical Cover N/A entire Gas constant N/A N/A N/A N/A
Chemistry, 4 'h Edition. New York, (Est. fact) New York: W. H. Freeman and Company. TIC: 245483. Cover N/A entire Faraday's constant
(Est. fact)
p. 750 N/A 4.1.6, 6.2 Molar conductivity equation (Equation)
p. 7 50 N/A 4.1.7, 6.2 Conductance equation (Equation)
p.750 N/A 4.1.7, Conductivity is the inverse of resistivity. (Equation) 4.1.11, 6.2 Conductance is the inverse of resistance.
2 Bear, J. 1972. Dynamics of Fluids p. 113 N/A- 4.1.1 Equation: formation factor (F) fronm N/A N/A N/A N/A
in Porous Media. New York, New Corroborative resistance. York: American Elsevier Publishing Company, Inc. TIC: p. 116 N/A- 4.1.1 Equation: F from porosity, cementation.
217568. Corroborative
p. 116 N/A- entire Cementation factor for sand. Corroborative
p. 116 N/A- 4.1.3, 6.1 Archies equation for resistivity of Corroborative unsaturated media.
p. 116 N/A- entire Saturation exponent. Corroborative
p.46 N/A 4.1.14 Range of porosity. (Reference)

(
z
rCi
0, 0. 0• 0
OFFICE OF CIVILIAN RADIOACTIVE WASTE MANAGEMENT
DOCUMENT INPUT REFERENCE SHEET
I. Document Identifier No./Rev.: Change: Title:
ANL-EBS-MD-000031 REV 00 -- Invert Diffusion Properties Model
Input Document 8. TBV Due To
2. Technical Product Input 3. Section 4. Input 5. Section 6. Input Description 7. TBV/TBD Unqual. From Un
Source Title ad Status Used in Priority Uncontrolled confirmed Sourc Titl andSource
Identifier(s) with Version Source
3 CRWMS M&O 1999a. IV-l N/A 2 Classification of systems N/A N/A N/A N/A
Classification of the Preliminary MGDS Repository Design. (Reference) BOOOOOOOO-01717-0200-00134 REV 01. Las Vegas, Nevada: CRWMS M&O. ACC: MOL.19981103.0546.
4 CRWMS M&O 1999b. All N/A 2 Development plan of document N/A N/A N/A N/A
Development Plan for Invert Diffusion Properties Model. TDP- (Reference) EBS-MD-000016 REV 00. Las Vegas, Nevada: CRWMS M&O. ACC: MOL.19990813.0391.
CRWMS M&O 1999c. Activity All N/A 2 Activity Evaluation N/A N/A N/A N/A
Evaluation for Engineered Barrier System Performance Modeling (Reference)
(WP# 12012383MX). Las Vegas, Nevada: CRWMS M&O. ACC: MOL. 19990719.0317.
(
z
C>
0 0'
0 0
rn 0
0
OFFICE OF CIVILIAN RADIOACTIVE WASTE MANAGEMENT
DOCUMENT INPUT REFERENCE SHEET
1. Document Identifier No./Rev.: Change: Title:
ANL-EBS-MD-000031 REV 00 -- Invert Diffusion Properties Model
Input Document 8. TBV Due To
2. Technical Product Input 3. Section 4. Input 5. Section 6. Input Description 7. TBV/TBD Unqual. From Un
Source Title and Status Used in Priority Uncontrolled confirmed
Identifier(s) with Version Source
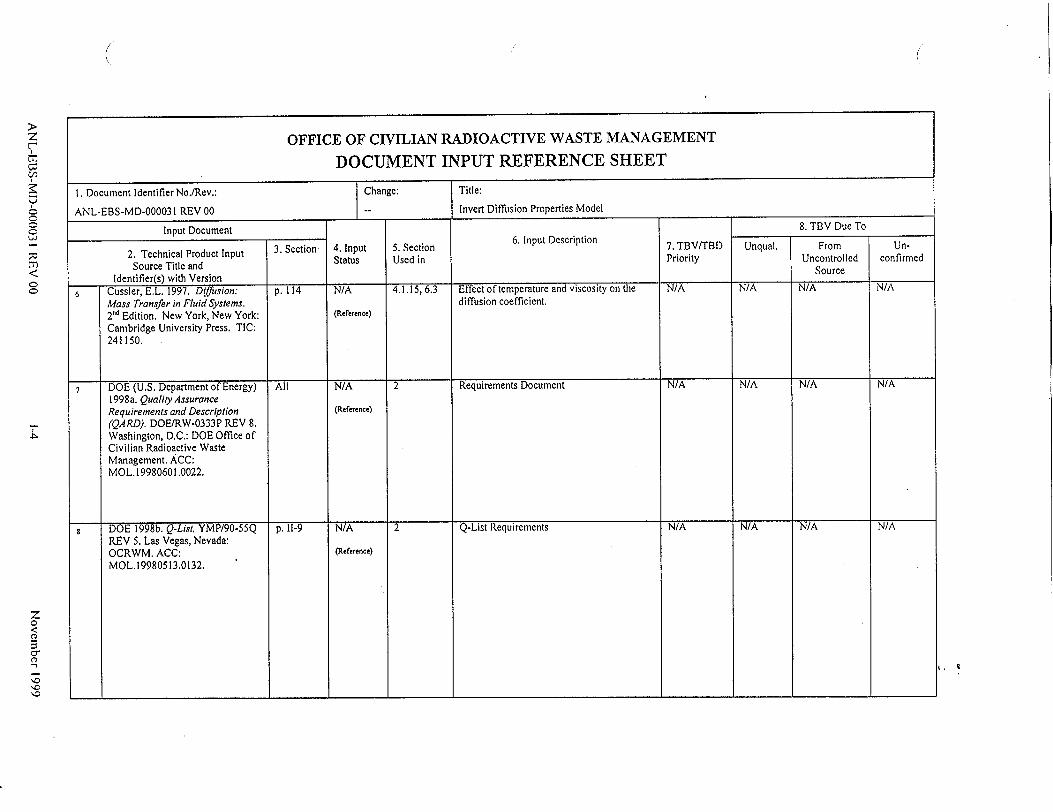
6 Cussler, E.L. 1997. Diffusion: p. 114 N/A 4.1.15, 6.3 Effect of temperature and viscosity on the N/A N/A N/A N/A
Mass Transfer in Fluid Systems. diffusion coefficient. 2"n Edition. New York, New York: (Reference)
Cambridge University Press. TIC: 241150.
DOE (U.S. Department of Energy) All N/A 2 Requirements Document N/A N/A N/A N/A
1998a. Quality Assurance Requirements and Description (Reference)
(QARD). DOE/RW-0333P REV 8. Washington, D.C.: DOE Office of Civilian Radioactive Waste Management. ACC: MOL. 19980601.0022.
DOE 1998b. Q-List. YMP/90-55Q p. 11-9 N/A 2 Q-List Requirements N/A N/A N/A N/A REV 5. Las Vegas, Nevada: OCRWM. ACC: (Reference)
MOL.19980513.0132.
I,
l

(
z
7 73 M
c/
0 0 0o
0
m 0
OFFICE OF CIVILIAN RADIOACTIVE WASTE MANAGEMENT
DOCUMENT INPUT REFERENCE SHEET
1. Document Identifier No./Rev.: Change: Title:
ANL-EBS-MD-000031 REV 00 .- Invert Diffusion Properties Model
Input Document 8. TBV Due To
2. Technical Product Input 3. Section 4. Input 5. Section 6. Input Description 7. TBV/TBD Unqual. From Un
Source Title and Status Used in Priority Uncontrolled confirmed
Identifier(s) with Version Source
Keller, G.V. and Frischknecht, F. p. 21 N/A 4.1.1, 6.1 Archie's law: resistivity of saturated media. N/A N/A N/A N/A
C. 1966. Electrical Methods in (Equation)
Geophysical Prospecting. New York, New York: Pergamon Press. p. 28 N/A 4.1.3, 6.2 Archies law for resistivity of unsaturated
TIC: 230941. (Equation) media.
p. 28 N/A- entire Saturation exponent for unsaturated sand. Corroborative
10 Lim, P.C.; Barbour, S.L.; and Pg. 813, N/A- 6.5 Diffusion coefficients found using traditional N/A N/A N/A N/A Fredlund, D.G. 1998. "The Figure 1. Corroborate techniques.
with model influence of degree of saturation on results for
tile coefficient of aqueous validation
diffusion. "Canadian purposes.
Geotechnical Journal, 35, 811-827. Ottawa, Ontario: NRC Research Press, TIC: 245626.
Perry, R.H. and Chilton, C.H. 3-235 N/A 4.1.5 Diffusivity found using conductance N/A N/A N/A N/A 1973. Chemical Engineers' (Established Handbook, 5h Edition. New York, 3-235 facts from 4.1.5 Electrolyte conductance is tile sum of ionic N/A N/A N/A N/A
engineering New York: McGraw-Hill Book handbook) conductances Company. TIC: 242591.

(
z 7
C
M
05 0, 0
0• 0
OFFICE OF CIVILIAN RADIOACTIVE WASTE MANAGEMENT
DOCUMENT INPUT REFERENCE SHEET
I, Document Identifier No./Rev.: Change: Title:
ANL-EBS-MD-000031 REV 00 -- Invert Diffusion Properties Model
Input Document 8. TBV Due To
2. Technical Product Input 3. Section 4. Input 5. Section 6. Input Description 7. TBV/TBD Unqual. From Un
Source Title and Status Used in Priority Uncontrolled confirmed
Identifier(s) with Version Source
12 Pirson, S.J. 1963. Handbook of p. 22 N/A 4.1.1 Equation: formation factor (F) from N/A NMA N/A N/A
Well Log Analysis: For Oil and (Established resistance. facts from
Gas Formation Evaluation. engineering
Englewood Cliffs, New Jersey: p.23 handbok) 4.1.1 Equation: F from porosity, cementation. Prentice-Hall, Inc. TIC: 245393.
p. 24 entire Cementation factor for sand.
p. 24 4.1,3, 6.1 Archies equation for resistivity of unsaturated media.
p. 24 entire Saturation exponent.
13 Robinson, R.A. and Stokes, R.H. p.462 N/A 4.1.11,6.1 Conductivity of10.I molar potassium N/A N/A N/A N/A
1965. Electrolyte Solutions: The (Reference) chloride. Measurement and Interpretation of Conductance, Chemical Potential and Diffusion in Solutions of Simple Electrolytes. London, England: Butterworths Publications Limited. TIC: 242575.
(

(
z
cr
50 0
0 0•
<
0
OFFICE OF CIVILIAN RADIOACTIVE WASTE MANAGEMENT
DOCUMENT INPUT REFERENCE SHEET
1. Document Identifier No./Rev.: Change: Title:
ANL-EBS-MD-000031 REV 00 -- Invert Diffusion Properties Model
Input Document 8. TBV Due To
2. Technical Product Input 3. Section 4. Input 5. Section 6. Input Description 7. TBVITBD Unqual. From Un
Source Title and Status Used in Priority Uncontrolled confirmed Sourc Titl andSource
Identifier(s) with Version
14 Stumm, W. and Morgan, J. J. 1981. p. 411 N/A 6.4 The activity coefficient of an ion in a single N/A N/A N/A N/A
Aquatic Chemistry: An (Reference) salt solution is higher than the activity
Introduction Emphasizing coefficient of an ion in solution with many
Chemical Equilibria in Natural other ions. Waters. 2 d Edition. New York, New York: John Wiley & Sons, Inc. TIC: 208448.
I Weast, R.C., ed. 1981. CRC p.-F-79 N/A 4.1.8, 6.2 Activity effect of concentration. N/A N/A N/A N/A
Handbook of Chemistry and (Established Physcs: Redy-Rfernce ookfacts from
Physics. A Ready-Reference Book p. F-42 scientific 4.1.9, 6.3 Viscosity of water at 20 degrees Celsius.
of Chemical and Physical Data, handbook)
62," Edition. Boca Raton, Florida: p. F-42 4.1.10, 6.3 Viscosity of water as a function of CRC Press. TIC: 240722 temperature.
p. D-146 4.1.12, 6.2 Activity coefficient of 0.1 molar potassium chloride.
p. F-53 4.1.13, Diffusion coefficient of 0.1 molar potassium 6.5.2 chloride.
z C
0 2
(
OFFICE OF CIVILIAN RADIOACTIVE WASTE MANAGEMENT
DOCUMENT INPUT REFERENCE SHEET
z 7
C,
•0 O0 1.i
0 0•
1. Document Identifier No./Rev.: Change: Title:
ANL-EBS-MD-000031 REV 00 Invert Diffusion Properties Model
Input Document 8. TBV Due To
2. Technical Product Input 3. Section 4. Input 5. Section 6. Input Description 7. TBV/TBD Unqual. From Un
Status Used in Priority Uncontrolled confirmed Source Title and Source
Identifier(s) with Version
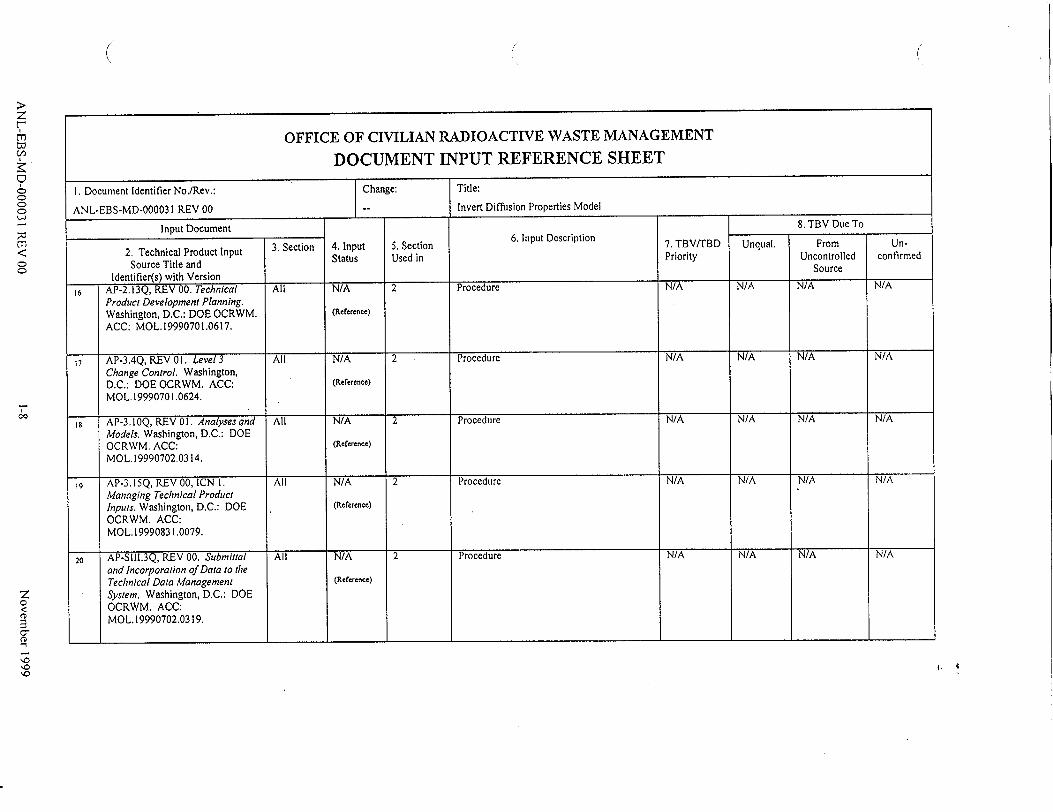
6 AP-2.13Q, REV 00. Technical All N/A 2 Procedure N/A N/A N/A N/A
Product Development Planning. Washington, D.C.: DOE OCRWM. (Reference) ACC: MOL.19990701.0617.
AP-3.4Q, REV 01. Level 3 All N/A 2 Procedure N/A N/A N/A N/A
Change Control. Washington, D.C.: DOE OCRWM. ACC: (Reference) MOL. 19990701.0624.
IS AP-3.1OQ, REV 01. Analyses and All N/A 2 Procedure N/A N/A N/A N/A Models. Washington, D.C.: DOE OCRWM. ACC: (Reference)
MOL.19990702.0314.
19 AP-3.15Q, REV 00, ICN 1. All N/A 2 Procedure N/A N/A N/A N/A
Managing Technical Product Inputs. Washington, D.C.: DOE (Reference) OCRWM. ACC: MOL. 19990831.0079.
20 AP-SIII.3Q, REV 00. Submittal All N/A 2 Procedure N/A N/A N/A N/A
and Incorporation of Data to the Technical Data Management (Reference)
System. Washington, D.C.: DOE OCRWM. ACC: MOL. 19990702.0319.
I.

( (
OFFICE OF CIVILIAN RADIOACTIVE WASTE MANAGEMENT
DOCUMENT INPUT REFERENCE SHEET
1. Document Identifier No./Rev.: Change: Title:
ANL-EBS-MD-000031 REV 00 • -- Invert Diffusion Properties Model
Input Document 8. TBV Due To
2. Technical Product Input 3. Section 4. Input 5. Section 6. Input Description 7. TBVITBD Unqual. From Un
Source Title and Status Used in Priority Uncontrolled confirmed
Identifier(s) with Version Source
21 QAP-2-0, REV 05. Conduct of All N/A 2 Procedure N/A N/A N/A N/A Activities. Las Vegas, Nevada: CRWMS M&O. ACC: (Rererence)
MOL. 19980826.0209.
22 QAP-2-3, REV 10. Classification All N/A 2 Procedure N/A N/A N/A N/A of Permanent Items. Las Vegas, Nevada: CRWMS M&O. ACC: (Reference)
MOL. 19990316.0006.
I.
ATTACHMENT II MATHEMATICAL PROOF
ANL-EBS-MD-000031 REV 00 November, 19991I-1

The square of the average of two numbers is always greater than their product. Consider two
non-negative numbers A and B: [(A+B) ?AI
(A+B)2 ?
[A2 2ABi-B1Ž(4AO
[A2 ý?j(2]>
[A2 +0 -(2AO] 9 (Eq. 1I-1)
From basic calculus, the minimum of the expression is found. Taking the first derivative and
setting equal to zero will show where the maximum or minimum of the equation occurs. The
derivative of Equation II-1 with respect to A is:
DA [A2 + B2 - (2AB)] = 0
2A-2B = 0
A=B
To determine whether this point is a maximum or a minimum take the second derivative of
Equation II-M is: DA(2A - 2B) = 2
The positive sign of the second derivative at the point A=B indicates that the minimum of the
expression occurs at the point A=B. Substituting B for A in Equation II-1 yields:
[B2 + B2 -(2B- B)]?0
2B 2 -2B 2 >0 9
0>0
This statement is true, which proves the following inequality (i.e. the square of the average of
two unique numbers is always greater than their product):
2
ANL-EBS-MD-000031 REV 00 November, 1 9991I-2