disclaimer - snu open repository and archive:...
TRANSCRIPT

저 시-비 리- 경 지 2.0 한민
는 아래 조건 르는 경 에 한하여 게
l 저 물 복제, 포, 전송, 전시, 공연 송할 수 습니다.
다 과 같 조건 라야 합니다:
l 하는, 저 물 나 포 경 , 저 물에 적 된 허락조건 명확하게 나타내어야 합니다.
l 저 터 허가를 면 러한 조건들 적 되지 않습니다.
저 에 른 리는 내 에 하여 향 지 않습니다.
것 허락규약(Legal Code) 해하 쉽게 약한 것 니다.
Disclaimer
저 시. 하는 원저 를 시하여야 합니다.
비 리. 하는 저 물 리 목적 할 수 없습니다.
경 지. 하는 저 물 개 , 형 또는 가공할 수 없습니다.
공학박사학위논문
A Study on Design Parameters and
Aerodynamic Stability during Construction
Stages for a Cable-stayed Suspension Bridge
사장-현수교의 설계변수 및
가설 중 내풍 안정성 연구
2016년 8월
서울대학교 대학원
건설환경공학부
이 호


i
ABSTRACT
A cable-stayed suspension bridge, which can be applicable to road and railway
bridge, is investigated both parameter study on structural characteristic and study
on construction sequence to secure aerodynamic stability. The cable-stayed
suspension bridge with the main span length of 1408m is considered as an example
bridge and this bridge accommodates eight road lane and two railway track.
Parametric study is carried out. Two design parameters: suspension-to-span
ratio and length of transition part are considered and studied for their effects on the
structural behavior under live loads which consist of trains and road vehicles. As a
result, a suspension-to-span ratio of 0.22to 0.56 is effective to increase the overall
rigidity of structure as compared to responses of cable-stayed bridge and
suspension bridge. As the length of suspended portion in main span increases, the
vertical displacement of the deck gradually increases and the negative vertical
bending moment of deck at the junction between cable-stayed parts and suspended
part in main span sharply increases. Also, the cable tension in the longest hanger
rapidly increases due to different stiffness in two structure systems namely the
cable-stayed part and the suspension part. This can lead to fatigue problems which
can be solved by installing the transition part. To investigate the effect of the
transition parts, the ratio of transition part to cable-stayed part is changed from 0 to
0.45, by adding additional hangers in the cable-stayed part. As a result, the increase
ii
of the transition part is effective to reduce the cable tension in the longest hanger.
The transition part to cable-stayed part ratio ranging from 0.1 to 0.32 is favorable
for this case study bridge.
In the long-span cable-supported bridges, construction stage has lower
stiffness relative to completed stage and is vulnerable to vibration by wind.
Therefore, aerodynamic stability in construction is a major design issue. Based on
the deck erection, two different construction schemes are considered to investigate
aerodynamic stability of construction scheme by buffeting analysis for the cable-
stayed suspension bridge. The first construction scheme is the construction Plan 0
(series sequence) and the second scheme is the construction Plan 1(simultaneously
construction sequence). As a result, applying construction Plan 0 scheme,
aerodynamic stability of the suspended deck in construction phase is assured.
However, one of the hangers is required to increase the cross-sectional area or
adjusts its length after installation in order to secure aerodynamic stability. In case
of applying construction Plan 1, the excessive rigid body torsional deformation in
the suspended deck is found in the initial construction stage due to the rigid body
motion of the suspended deck by the vertical mode of main cable. In order to
control the rigid body torsional displacement of deck, X-Type bracing, Rigid beam
and Strut system are considered as structural stabilization measures. The most
effective structural stabilization measure is the strut system by installing on the
main cables. When construction Plan 1 scheme with Strut system, aerodynamic
stability is possible and construction period can be reduced by 48 days compared to

iii
construction Plan 0 as series construction scheme. However, it is required to have
proper construction management of two type of bridge structure according to
simultaneous construction in both deck of cable-stayed parts and suspended part.
The lifting gantry can be applicable for an aerodynamic stabilization measure to
control the rigid body torsional deformation during erection of suspended decks.
Keywords: Cable-stayed suspension bridge, Suspension-to-span ratio,
Transition part, aerodynamic stability, Construction phase, Deck
erection sequence, Parameter study
Student Number: 2012-30248
iv
TABLE OF CONTENTS
ABSTRACT .................................................................................. I
1. INTRODUCTION ..................................................................... 1
2. ANALYSIS THEORY ............................................................... 9
2.1 Cable elements...................................................................................... 9
2.2 TCUD analysis method ...................................................................... 19
2.3 Configuration analysis procedure for a cable-stayed suspension
bridge ......................................................................................... 28
2.4 Buffeting analysis ............................................................................... 32
3. INVESTIGATED BRIDGE .................................................... 39
3.1 Bridge description .............................................................................. 39
3.2 Initial equilibrium state for the example bridge ................................. 42
3.3 Initial equilibrium state for the parametric study analysis models ..... 44
4. DESIGN PARAMETER STUDY ON STRUCTURAL
PERFORMANCE OF CABLE-STAYED SUSPENSION
BRIDGE UNDER LIVE LOAD AND WIND LOAD ............... 52
4.1 Suspension-to-span ratio effects under live load ................................ 57
v
4.2 Effect of transition part under live load .............................................. 66
4.3 Dynamic characteristics...................................................................... 73
4.4 Effect of suspension-to-span ratio on the aerostatic stability ............. 75
4.5 Summary and discussion .................................................................... 78
5. AERODYNAMIC STABILITY OF A CABLE-STAYED
SUSPENSION BRIDGE IN CONSTRUCTION ....................... 80
5.1 Description of construction scheme ................................................... 86
5.3 Aerodynamic stability of construction Plan 0 (P0) ............................. 94
5.4 Aerodynamic stability of construction Plan 1(P1)............................ 103
5.5 Aerodynamic feasibility study on an alternative construction plan.. 130
5.6 Summary .......................................................................................... 138
6. CONCLUSIONS ................................................................... 140
REFERENCES .......................................................................... 144

vi
LIST OF FIGURES
Fig. 1. 1 Dichinger’s structural system .............................................................................. 1
Fig. 1. 2 Wujiang bridge (China, 1997). Reprinted from highestbridges.com, by Eric
Sakowski, 2015 .................................................................................................... 2
Fig. 1. 3 The bridge behavior under train load in a suspension bridge and a cable-
stayed suspension bridge (Source : Michel Virlogeux) ....................................... 4
Fig. 2. 1 Nodal force and displacement vectors of an elastic catenary cable element ..... 10
Fig. 2. 2 Nodal force and displacement vectors of a truss-cable element ........................ 15
Fig. 2. 3 Geometric constraints in the TCUD method for cable-stayed suspension
bridges ............................................................................................................... 21
Fig. 2. 4 Flowchart of TCUD method .............................................................................. 23
Fig. 2. 5 Analysis model of a cable-stayed suspension bridge ......................................... 24
Fig. 2. 6 Additional geometric constraints for a cable-stayed suspension bridge ............ 26
Fig. 2. 7 Analysis scheme of determinig the tension of stay cable in main span by
TCUD ................................................................................................................ 30
Fig. 2. 8 Combined two bridge structure for the configuration analysis .......................... 31
Fig. 2. 9 Bridge axis and wind component on the deck ................................................... 32
Fig. 3. 1 Layout of investigated bridge with a main span of 1408 m (unit: m) ................ 40
Fig. 3. 2 A dead loads distribution rate for hangers in the transition part ........................ 42
Fig. 3. 3 Distribution of equivalent tensions of stay cables in example bridge ................ 43
Fig. 3. 4 Distribution of equivalent tensions of hangers in example bridge ..................... 43
Fig. 3. 5 Finite element models for parameter study ........................................................ 46

vii
Fig. 3. 6 Distribution of axial forces in deck under dead load ......................................... 48
Fig. 3. 7 Distribution of vertical bending moment of deck under dead load .................... 48
Fig. 3. 8 Distribution of cable forces in stay cables under dead load ............................... 50
Fig. 3. 9 Distribution of cable forces in hangers under dead load .................................... 51
Fig. 4. 1 The scheme of suspension-to-span ratio (Ls/L) ................................................. 52
Fig. 4. 2 Road model in KBDC 2015 ............................................................................... 53
Fig. 4. 3 Train load model LM71 in EC1-EN1991-2 ....................................................... 54
Fig. 4. 4 Live load cases .................................................................................................. 54
Fig. 4. 5 Vertical displacement of deck under LC1 for Ls/L=0.22 ................................... 57
Fig. 4. 6 The vertical displacement of deck under LC1 ................................................... 59
Fig. 4. 7 The vertical displacement of deck under LC 2 .................................................. 59
Fig. 4. 8 The maximum longitudinal slope of deck under LC 2 ...................................... 60
Fig. 4. 9 The vertical bending moment of deck under LC 2 ............................................ 61
Fig. 4. 10 Tension of stay cables under combined maximum response of LC1 and LC2 64
Fig. 4. 11 Tension of hangers under combined maximum response of LC1 and LC2 ..... 65
Fig. 4. 12 The scheme of transion part-to-cable-stayed part ratio (Lt/Lc) ....................... 66
Fig. 4. 13 FE analysis model for the verified effect of transition ratio ............................ 67
Fig. 4. 14 Analysis case of the load distrinution ratio at the transion parts ...................... 68
Fig. 4. 15 Effect of transition part for the amplitude of hanger tension ........................... 69
Fig. 4. 16 Secondary stress of main cable at cable bands with transiton ratio ................. 70
Fig. 4. 17 Secondary stress of main cable at cable bands with different load
distribution ratio ................................................................................................ 72
Fig. 4. 18 Comparison of natural frequencies of seven sample bridge models ................ 74
Fig. 4. 19 The lateral displacement of the deck at the center of mid-span ....................... 76

viii
Fig. 4. 20 The vertical displacement of the deck at the center of mid-span ..................... 76
Fig. 4. 21 The torsional displacement of the deck at the center of mid-span ................... 77
Fig. 5. 1 System with two vertical cable planes positioned the central area .................... 80
Fig. 5. 2 Construction scheme of cable-stayed suspension bridges ................................. 81
Fig. 5. 3 FE models of erection sequence in construction Plan 0 ..................................... 87
Fig. 5. 4 FE models of erection sequence in construction Plan 1 ..................................... 89
Fig. 5. 5 Deck erection by derrick crane .......................................................................... 90
Fig. 5. 6 Deck erection by lifting gantry .......................................................................... 90
Fig. 5. 7 FE analysis model of P0_ES2 ............................................................................ 94
Fig. 5. 8 The 1st torsional mode shapes for P0_ES2(f = 0.486Hz) .................................. 95
Fig. 5. 9 The maximum torsional displacement at the tip of the deck for P0_ES2 .......... 95
Fig. 5. 10 FE analysis model of P0_ES6 .......................................................................... 96
Fig. 5. 11 The 1st torsional mode shapes for P0_ES6(f = 0.319Hz) ................................ 96
Fig. 5. 12 The maximum torsional displacement at the tip of the deck for P0_ES6 ........ 97
Fig. 5. 13 The dominant frequency of deck for construction Plan 0 ................................ 98
Fig. 5. 14 The maximum torsional displacement at the tip of cantilever deck in
construction Plan 0 ............................................................................................ 99
Fig. 5. 15 The maximum lateral displacement at the tip of cantilever deck in
construction Plan 0 .......................................................................................... 100
Fig. 5. 16 The maximum vertical displacement at the tip of cantilever deck in
construction Plan 0 .......................................................................................... 100
Fig. 5. 17 Distribution of stay cables tension under D+W in construction Plan 0 ......... 101
Fig. 5. 18 The tension variation of hanger H12 under D+W in construction P0 ............ 102
Fig. 5. 19 FE analysis model of bare structure for P1_ES2:0 Bare structure ................. 103

ix
Fig. 5. 20 The torsional displacement of deck for P1_ES2:0 Bare structure ................. 104
Fig. 5. 21 Mode contribution of torsional displacement of deck for P1_ES2:0 Bare
structure ........................................................................................................... 104
Fig. 5. 22 Increasing torsional stiffness by X-Type bracing for P1_ES2 ....................... 105
Fig. 5. 23 Improving torsional stiffness by Rigid beam for P1_ES2 ............................. 106
Fig. 5. 24 Improving torsional stiffness by Strut system for P1_ES2 ............................ 107
Fig. 5. 25 FE analysis model of bare structure for P1_ES6:0 Bare structure ................. 109
Fig. 5. 26 Mode contribution of torsional displacement of deck for P1_ES6:0 Bare
structure ........................................................................................................... 110
Fig. 5. 27 Distribution of stay cable tensions for P1_ES6 ............................................. 110
Fig. 5. 28 Distribution of hanger tensions for P1_ES6 .................................................. 111
Fig. 5. 29 Improving torsional stiffness by X-Type bracing for P1_ES6 ....................... 111
Fig. 5. 30 The tension of hangers under D+W for P1_ES6:1 X-Type bracing ............... 113
Fig. 5. 31 The tension of X-Type hangers under D+W for P1_ES6:1 X-Type bracing . 113
Fig. 5. 32 Increasing torsional stiffness by Rigid beam for P1_ES2 .............................. 114
Fig. 5. 33 The tension of hangers under D+W for P1_ES6:2 Rigid beam ..................... 115
Fig. 5. 34 Enhancement of torsional stiffness by Strut system for P1_ES6 ................... 116
Fig. 5. 35 The tension of hangers under D+W for P1_ES6:3 Strut systems .................. 117
Fig. 5. 36 The dominant frequency of cable-stayed deck for construction Plan 1 ......... 118
Fig. 5. 37 The dominant frequency of suspended deck for construction Plan 1 ............ 119
Fig. 5. 38 The maximum torsional displacement of deck in construction Plan 1 .......... 120
Fig. 5. 39 The maximum lateral displacement of deck in construction Plan 1 .............. 120
Fig. 5. 40 The maximum vertical displacement of deck in construction Plan 1 ............ 121
Fig. 5. 41 Distribution of stay cables tension under D+W in construction Plan 1 ......... 122
x
Fig. 5. 42 Distribution of hangers tension under D+W in construction Plan 1 .............. 122
Fig. 5. 43 Layout of Strut system on the main cable ...................................................... 123
Fig. 5. 44 Torsional displacement of suspeded deck with number of Strut .................... 124
Fig. 5. 45 Torsional displacement of suspeded deck with various moment of inertia Iz 124
Fig. 5. 46 The position of the lifting gantry for the erection phase of deck in
construction plan1 ........................................................................................... 126
Fig. 5. 47 The maximum torsional displacement of deck with lifting gantry in
construction Plan 1 .......................................................................................... 127
Fig. 5. 48 Distribution of hangers tension under D+W with lifting gantry in
construction Plan 1 .......................................................................................... 127
Fig. 5. 49 The torsional displacement of deck under different structural measures for
P1_ES2 ............................................................................................................ 128
Fig. 5. 50 FE models of erection sequence in alternative construction plan .................. 131
Fig. 5. 51 The position of the lifting gantry for the erection phase of deck in
alternative construction plan ............................................................................ 133
Fig. 5. 52 The dominant frequency of suspended deck for alternative construction plan134
Fig. 5. 53 The maximum torsional displacement of deck in alternative construction
plan .................................................................................................................. 135
Fig. 5. 54 The maximum lateral displacement of deck in alternative construction plan 135
Fig. 5. 55 The maximum vertical displacement of deck in alternative construction plan136
Fig. 5. 56 Distribution of stay cables tension under D+W in alternative construction
plan .................................................................................................................. 137
Fig. 5. 57 Distribution of hangers tension under D+W in alternative construction plan 137

xi
LIST OF TABLES
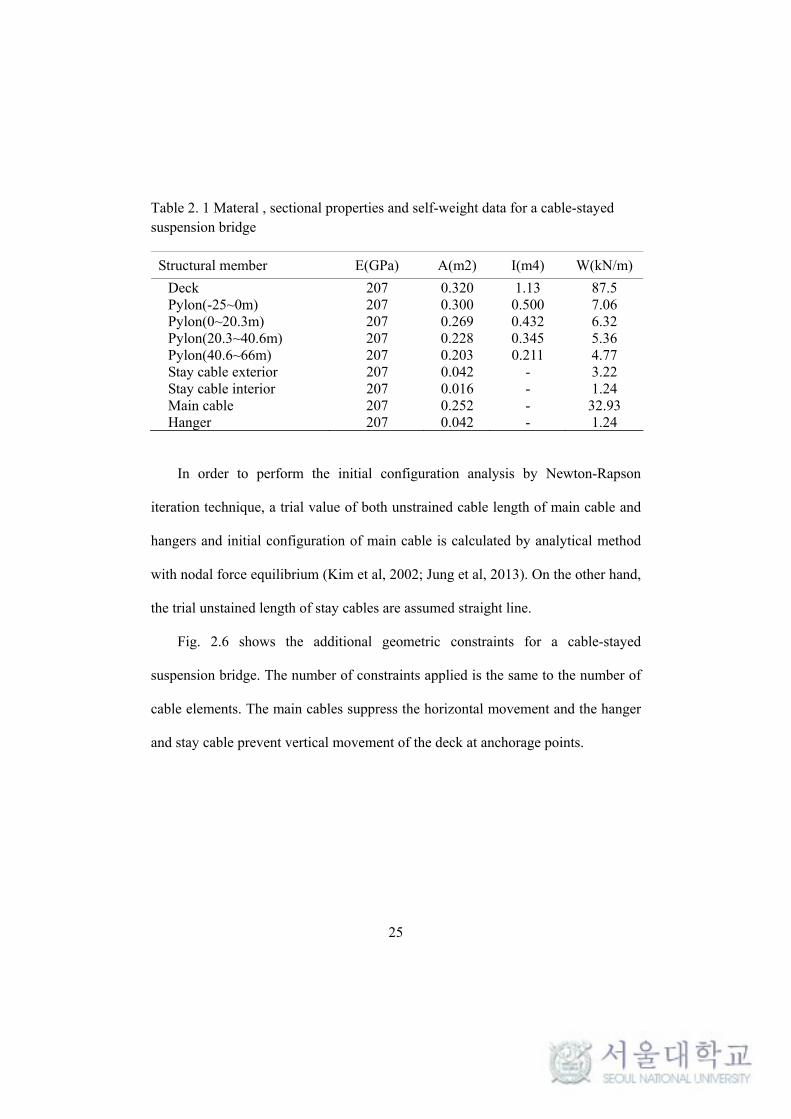
Table 2. 1 Materal , sectional properties and self-weight data for a cable-stayed
suspension bridge .............................................................................................. 25
Table 2. 2 The maximum displacements and internal forces in frame elements by
TCUD method ................................................................................................... 26
Table 2. 3 Unstrained cable lengths of the main cable, hangers and stay cables by
TCUD method ................................................................................................... 27
Table 3. 1 The cross-sectional properties of cable-stayed suspension bridge .................. 41
Table 3. 2 Analysis cases for parametric study ................................................................ 44
Table 3. 3 Comparison of Horizontal tension in main cables under dead load ................ 49
Table 4. 1 Aerostatic coefficients ..................................................................................... 56
Table 4. 2 The vertical displacement of deck under combined maximum response of
LC1 and LC2 ..................................................................................................... 58
Table 4. 3 The maximum longitudinal slope of the deck under LC2 ............................... 60
Table 4. 4 Responses of pylon under combined maximum value of LC1 and LC2 ......... 62
Table 4. 5 Horizontal tension of main cable under combined maximum value of LC1
and LC2 ............................................................................................................. 63
Table 4. 6 The fatigue damage for the longest hanger at the transition parts ................... 70
Table 4. 7 The fatigue damage for the longest hanger at the transition parts ................... 71
Table 5. 1 Static coefficient for bridge members ............................................................. 85
Table 5. 2 The estimated construction durations for Plan 0 ............................................. 91
Table 5. 3 The estimated construction durations for Plan 1 ............................................. 92

xii
Table 5. 4 The estimated construction durations for construction plans .......................... 93
Table 5. 5 Influence of X-Type bracing on the maximum displacement at the tip of
suspended decks for P1_ES2 ........................................................................... 106
Table 5. 6 Influence of Rigid beam on the maximum displacement at the tip of
suspended decks for P1_ES2 ........................................................................... 107
Table 5. 7 Influence of Strut system on the maximum displacement at the tip of
suspended decks for P1_ES2 ........................................................................... 108
Table 5. 8 Influence of X-Type bracing on the maximum displacement at the tip of
suspended decks for P1_ES6 ........................................................................... 112
Table 5. 9 Influence of Rigid beam on the maximum displacement at the tip of
suspended decks for P1_ES6 ........................................................................... 114
Table 5. 10 Influence of Strut system on the maximum displacement at the tip of
suspended decks for P1_ES6 ........................................................................... 116
Table 5. 11 Equivalent stiffness for lifting gantry .......................................................... 125
Table 5. 12 The estimated construction durations for alternative construction plan ...... 132
1
Chapter 1
Introduction
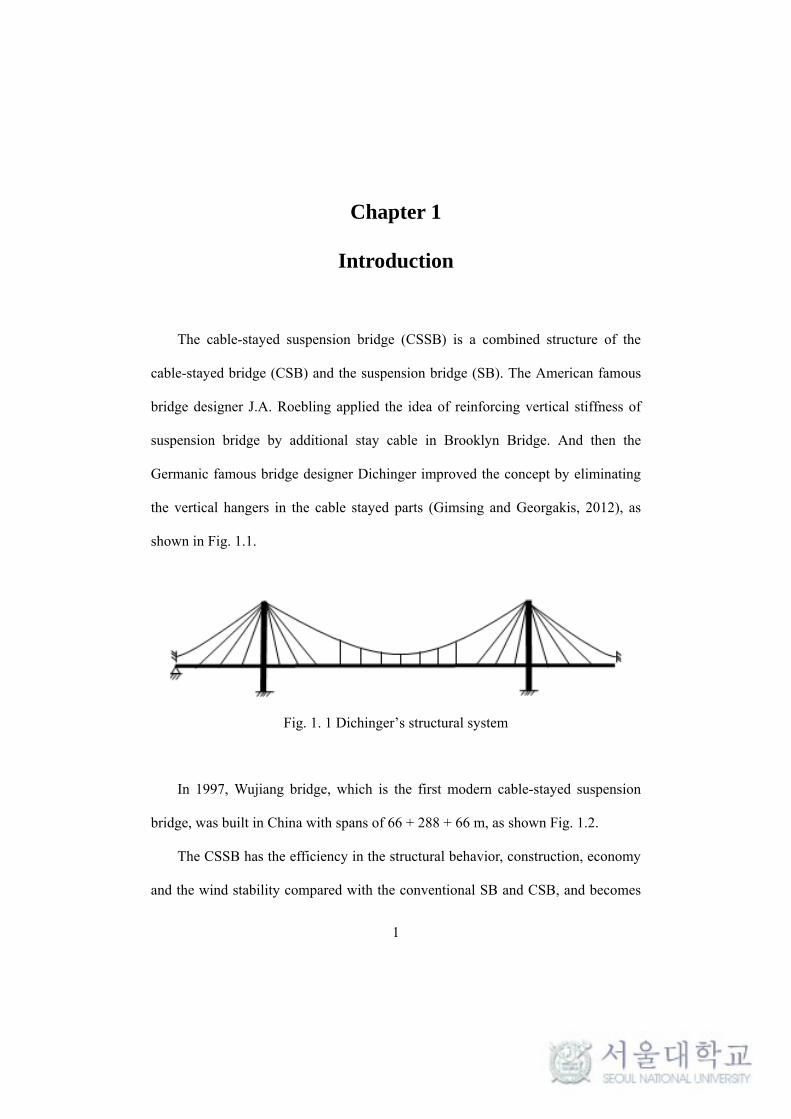
The cable-stayed suspension bridge (CSSB) is a combined structure of the
cable-stayed bridge (CSB) and the suspension bridge (SB). The American famous
bridge designer J.A. Roebling applied the idea of reinforcing vertical stiffness of
suspension bridge by additional stay cable in Brooklyn Bridge. And then the
Germanic famous bridge designer Dichinger improved the concept by eliminating
the vertical hangers in the cable stayed parts (Gimsing and Georgakis, 2012), as
shown in Fig. 1.1.
Fig. 1. 1 Dichinger’s structural system
In 1997, Wujiang bridge, which is the first modern cable-stayed suspension
bridge, was built in China with spans of 66 + 288 + 66 m, as shown Fig. 1.2.
The CSSB has the efficiency in the structural behavior, construction, economy
and the wind stability compared with the conventional SB and CSB, and becomes

2
an attractive alternative in the design of long span bridges (Zhang, 2006; Gimsing
and Georgakis, 2012). Based on advantages mentioned above, long-span road-
railway cable-stayed suspension bridge was designed and is now on construction.
Fig. 1. 2 Wujiang bridge (China, 1997). Reprinted from highestbridges.com, by Eric Sakowski, 2015
From the comparison with cable-stayed bridges and suspension bridges, the
cable-stayed suspension bridges have some different structural characteristics due
to the interaction between the cable-stayed portions and suspended portion in mid-
span. For the design of CSSB, the mechanics performance including the static and
dynamic characteristics, construction, and wind stability need to be fully
investigated for understanding and a realistically predict the structural behavior.
However, few publications about structural behavior and wind stability are

3
available in the literature.
From recent publications, the initial equilibrium state of CSSB which is the
starting point of static and dynamic load analysis. Kim (2011) studied initial
equilibrium state by Target configuration under dead load (Kim and Lee, 2001)
method considering two different analysis approach such as combining and
separating the two structural parts. Sun et al. (2013) proposed a four-step approach
for determining the reasonable initial equilibrium state using commercial finite
element (FE) programs, focusing on the optimization of the cable tension and
shapes of all cables. Lonetti and Pascuzzo (2014) proposed a design methodology
to predict optimum cable tension and dimensioning of the cable system based on
the combination of a finite element approach and an iterative optimization
procedure.
For the structural behavior, Zhang (2007) studied the mechanics performance
of CSSB including the static and aerodynamic stability, and compared to the
suspension bridge and cable-stayed bridge with the same main span of 1400 m. Sun
et al. (2013) proposed a systematic nonlinear analysis strategy for CSSB, and
studied parameters related to the structural behavior with an example of a 1400 m
span considering road load and static wind load.
However, most research on structural performance analysis of CSSB is
focused on road vehicle. The suspension bridge system has huge vertical deflection
by the train load and does not satisfy the serviceability criteria (Bruno et al, 2009).
The CSSB is an alternative structural system which can meet severe deflection

4
restriction of railway bridges by supplementing stay cables, as shown in Fig. 1.3.
Fig. 1. 3 The bridge behavior under train load in a suspension bridge and a cable-stayed suspension bridge (Source : Michel Virlogeux)
Therefore, study on the structural parameters of CSSB including train load is
required in consideration of the applicability of the railway bridge. Especially, the
effect of structural parameter with the suspension-to-span ratio, which affects the
overall vertical stiffness, needs to be reviewed in the perspective of improving the
excessive vertical deflection occurred due to the train load.
With an increasing span length of cable-stayed suspension bridges become a
flexible structure and very susceptible to wind action. From recent publications,
Zhang (2006) studied effects of some design parameters on the flutter stability of a

5
CSSB with main span of 1400 m. The study found that some design parameters are
helpful for improving the flutter stability. Nakamura (2006) examined the effects of
some countermeasure on the flutter stability of a CSSB. The study found that rigid
beam is effective for improving the flutter stability in the completed state. Zhang et
al. (2008) examined parameters related to nonlinear aerostatic and aerodynamic,
and determined the optimal values of these design parameters such as the cable sag
to span ratio, the suspension to span ratio, the side span length, and the layout of
stay cable planes, and the subsidiary piers in side spans. For the aerodynamic
stability for cable-stayed suspension bridges during construction, Lee et al. (2015)
studied for enhancement of wind stability of a cable-stayed suspension bridge in
construction with several structural stabilization measures and recommended strut
system in order to control the torsional deformation of suspended deck.
Most of the references were reviewed in terms of aerodynamic stability of the
completed state. However, the construction stage of bridge is vulnerable to
vibration by wind due to less structural rigidity than completed state. As a result,
the review on wind stability during the construction state needs to be studied.
Cable-stayed suspension bridges can be constructed by series construction
sequence which erects the deck of cable-stayed parts and afterwards suspension
part. When the erection of main cable is completed, above construction scheme can
be erected without aerodynamic stability improvement measures since deck of
suspended part is attached to the deck of cable-stayed part. However, reducing the
construction time can be necessary due to demand of owner and environmental

6
restrictions. From a structural point of view, cable-stayed suspension bridges can
be reduced the construction period by erecting in the main span deck
simultaneously from suspended part and cable-stayed parts after completed
erection of main cables. However, it is required both to verify the aerodynamic
stability on the construction phase of suspended deck and to find the potential
improvement measures in the aerodynamic stability for the erection of the deck in
suspended part. Therefore, it is necessary to investigate applicable aerodynamic
stability enhancement measures.
In this thesis, analysis of CSSB was done in the two perspectives of views.
Firstly, parametric study is carried out. Two design parameters such as suspension-
to-span ratio and length of transition part are considered and studied for their
effects on the structural behavior under live loads which consist of trains and road
vehicles. Secondly, applicable construction sequences for cable-stayed suspension
bridges were defined based on the established construction method, and studied on
the aerodynamic stability of its construction sequences focus on the erection of
suspended deck. Especially, owner’s requests and environmental restriction and the
case when rapid construction is required due to the short construction period were
also included.
With the above objectives, this thesis is organized in 6 chapters. The main text
of each chapter is intentionally kept as short as possible in favor of easy reading.
In this Chapter has been described for background, objective and a literature
review for the structural characteristic of cable-stayed suspension bridge and its
7
aerodynamic stability in construction.
In Chapter 2, the theories and analytical method that are used in present
studies are presented. It briefly introduced that considered cable element and
TCUD method for initial shape analysis of cable-stayed suspension bridges. On the
basis of these methods, a configuration analysis procedure is proposed based on
practical approach. Also, the theory of buffeting analysis for the evaluation of
aerodynamic stability in construction is presented.
In Chapter 3, an example bridge considered in this study is described and
found their initial equilibrium state under dead load by proposed practical approach.
Also, validity of practical method above mentioned is identified through the
comparison between initial equilibrium state of the example bridge obtained by
practical method and design values. Initial shape analysis is also performed on
seven bridge analysis models for design parameter study of cable-stayed
suspension bridges.
In Chapter 4, in order to identify the effect of suspension-to-span ratio as one
of design parameters, nonlinear static analysis is performed to seven bridge
analysis models considering wind and live load consisting train load and road
vehicle load and its effect is identified. In order to identify the effect of transition
part which is reducing the tension amplitude of the longest hanger, moving load
analysis under fatigue train load is performed to five bridge analysis models with
Midas civil program.
In Chapter 5, aerodynamic stability of suspended deck in construction is
8
investigated with erection scheme of series construction (Construction Plan 0) and
simultaneously construction (Construction Plan 1) as considering fast-track
construction. Three structural stabilization measures are considered to control the
torsional deformation of suspended deck in the initial erection stage of construction
plan 1. The most effective measure is applied on construction plan 1 and has
identified their applicability. The lifting gantry, which is the construction
equipment for the suspended deck, can be applicable for an aerodynamic
stabilization measure to control the rigid body torsional deformation during
erection of suspended decks.
Finally in Chapter 6, the main conclusions and major contributions of the
thesis are first summarized, then, a set of future researches are proposed.

9
Chapter 2
Analysis theory
2.1 Cable elements
The formulation of cable element considering the unstrained length as the
unknown is described in the following section.
(1) Elastic catenary cable element
The elastic catenary cable element, which is derived from the exact solution of
the elastic catenary cable theory in two-dimensional (Irvine, 1981), is proposed by
O’Brien and Francis (1964) and later developed by Jayaraman and Knudson (1981),
Ahn (1991), and Andreu et al. (2006). The cable element suspended between point
i(0,0,0) and j(Lx,Ly,Lz), and the Lagrangian coordinates of undeformed and
deformed configurations are s and p, as shown in Fig. 2.1.
The geometric constraint is given by
2 2 2
1dx dy dz
dp dp dp
(2.1)
The force equilibrium equation for the cable can be expressed as

10
1 2 30, 0, 0dx dy dz
T F T F T F wsdp dp dp
(2.2)
where T = cable tension.
The cable tension can be expressed with the Lagrangian coordinate s, and the
force components eq. (2.2).
2 2 21 2 3( )T F F F ws (2.3)
Z
Y
X
U4,F4
U5,F5
U6,F6
U1,F1
U2,F2
U3,F3
i(0,0,0)
j(Lx,Ly,Lz)
p(x,y,z)
wL0
Fig. 2. 1 Nodal force and displacement vectors of an elastic catenary cable element
The cable tension T is related to the strain ε by Hook’s law as
0 0 ( 1)dp
T EA EAds
(2.4)
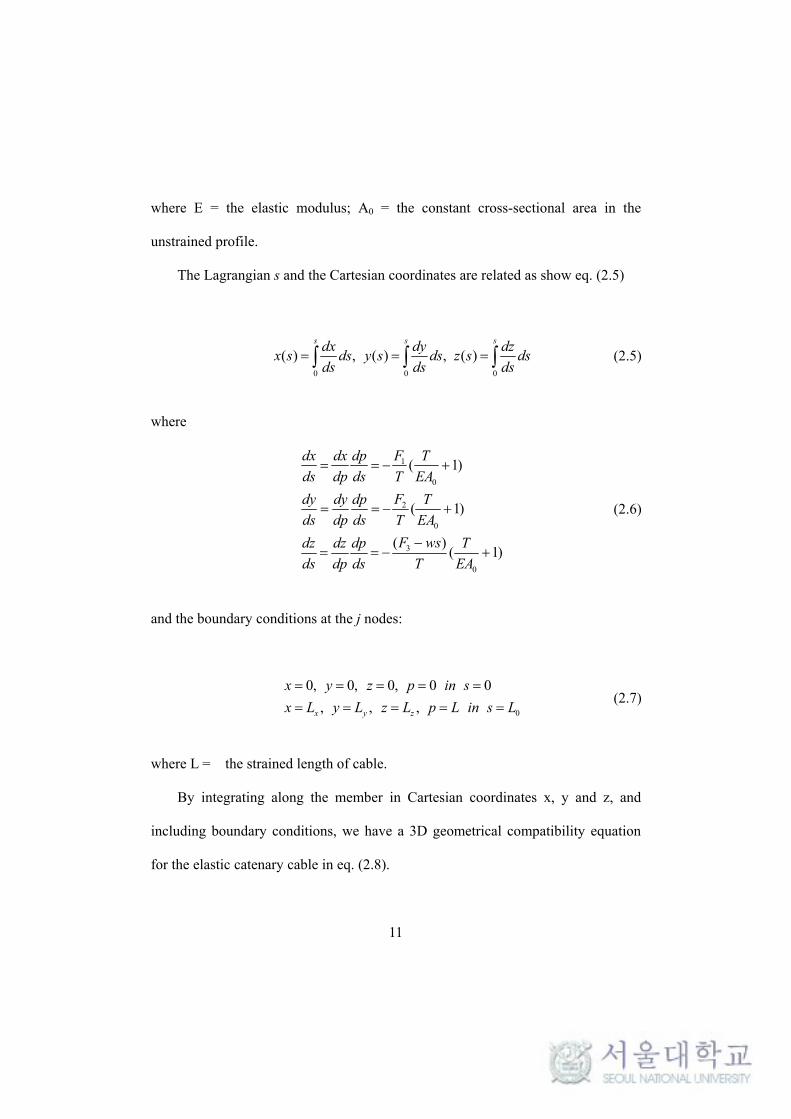
11
where E = the elastic modulus; A0 = the constant cross-sectional area in the
unstrained profile.
The Lagrangian s and the Cartesian coordinates are related as show eq. (2.5)
0 0 0
( ) , ( ) , ( )s s sdx dy dz
x s ds y s ds z s dsds ds ds
(2.5)
where
1
0
2
0
3
0
( 1)
( 1)
( )( 1)
Fdx dx dp T
ds dp ds T EA
Fdy dy dp T
ds dp ds T EA
F wsdz dz dp T
ds dp ds T EA
(2.6)
and the boundary conditions at the j nodes:
0
0, 0, 0, 0 0
, , , x y z
x y z p in s
x L y L z L p L in s L
(2.7)
where L = the strained length of cable.
By integrating along the member in Cartesian coordinates x, y and z, and
including boundary conditions, we have a 3D geometrical compatibility equation
for the elastic catenary cable in eq. (2.8).

12
1 0 10 3 3
0
2 0 20 3 3
0
23 0 0
0 0
ln( ) ln( )
ln( ) ln( )
1( )
2
x j i
y j i
z j i
F L FL T wL F T F
EA w
F L FL T wL F T F
EA w
F L wLL T T
EA EA w
(2.8)
where 2 2 2 2 2 21 2 3 1 2 0 3, ( )i jT F F F T F F wL F
Eq. (2.8) can be expressed as following form;
1 2 3 0 1 2 3 0 1 2 3 0( , , , ), ( , , , ), ( , , , )x x y y z zL L F F F L L L F F F L L L F F F L (2.9)
By partial differential of eq. (2.9) with respect to nodal forces and L0 leads to
the following expression;
1 2 3 01 2 3 0
1 2 3 01 2 3 0
1 2 3 01 2 3 0
x x x xx
y y y yy
z z z zz
L L L LdL dF dF dF dL
F F F L
L L L LdL dF dF dF dL
F F F L
L L L LdL dF dF dF dL
F F F L
(2.10)
where 4 1 5 2 6 3, ,x y zdL dU dU dL dU dU dL dU dU
or expressed in matrix form
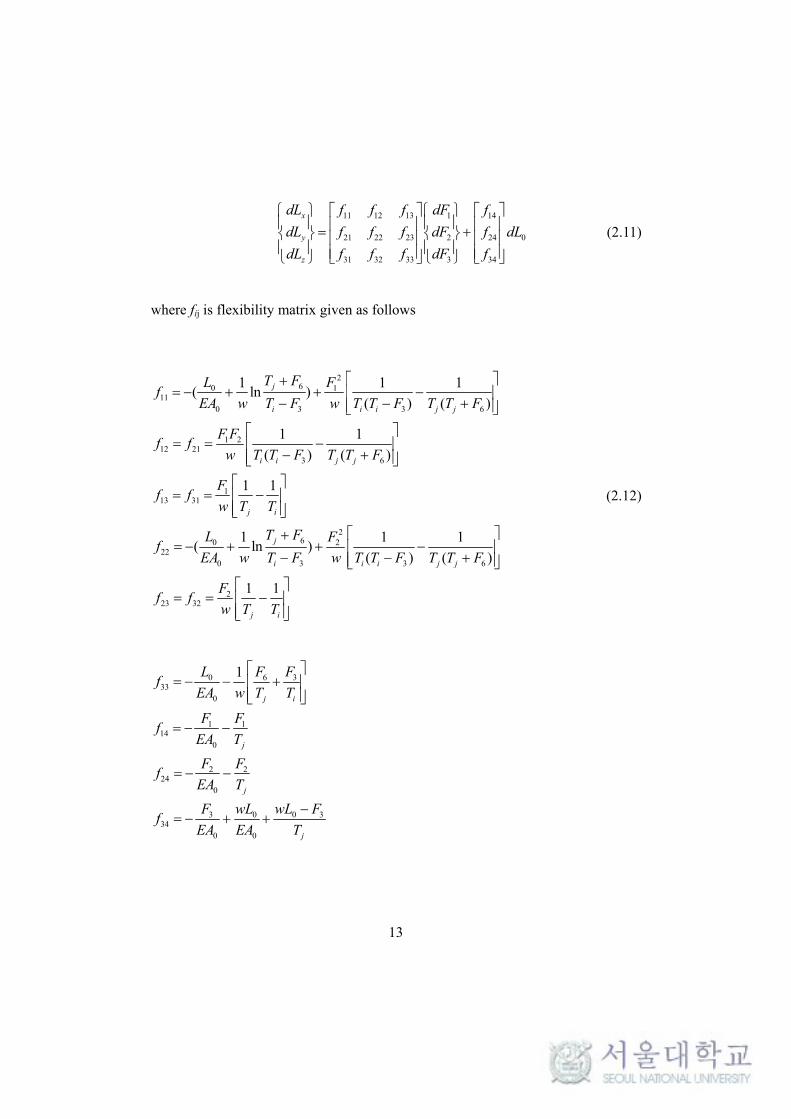
13
11 12 13 1 14
21 22 23 2 24 0
31 32 33 3 34
x
y
z
dL f f f dF f
dL f f f dF f dL
dL f f f dF f
(2.11)
where fij is flexibility matrix given as follows
260 1
110 3 3 6
1 212 21
3 6
113 31
260 2
220 3 3 6
223 32
1 1 1( ln )
( ) ( )
1 1
( ) ( )
1 1
1 1 1( ln )
( ) ( )
j
i i i j j
i i j j
j i
j
i i i j j
T FL Ff
EA w T F w T T F T T F
F Ff f
w T T F T T F
Ff f
w T T
T FL Ff
EA w T F w T T F T T F
Ff f
1 1
j iw T T
(2.12)
0 6 333
0
1 114
0
2 224
0
3 0 0 334
0 0
1
j i
j
j
j
L F Ff
EA w T T
F Ff
EA T
F Ff
EA T
F wL wL Ff
EA EA T

14
The cable stiffness matrix kij can be obtained by inverting the flexibility matrix
fij as follows (Kyung, 2002);
1 11 12 13 14
2 21 22 23 24 0
3 31 32 33 34
x
y
z
dF k k k dL f
dF k k k dL f dL
dF k k k dL f
(2.13)
and nodal force at node j are obtained from equilibrium equation as
4 1 5 2 6 0 3, , F F F F F wL F (2.14)
From eq. (2.13) and (2.14) yields the following incremental equation of the elastic
catenary cable element (Kyung, 2002; Kim and Kim, 2012).
0c c c cuF k U k L (2.15)
where ΔFc = the incremental nodal force vector; kc = the stiffness matrix of elastic
catenary cable element; ΔUc = the incremental displacement vector; kcu = the
stiffness matrix related to the unstrained lengths of the cable element.

15
(2) Truss-cable element
The force-displacement relationship of the truss-cable elements is as follow;
00
0
( )EA
T L LL
(2.16)
where E and A0 = the elastic modulus, cross-sectional area, respectively; L and L0
and T = the strained and unstrained length, and tension of the truss element,
respectively.
The cable tension in eq. (2.16) can be decomposed into its coordinate x, y and
z as
Z
Y
X
U4,F4
U5,F5
U6,F6
U1,F1
U2,F2U3,F3
Lz
Ly
Lx
Fig. 2. 2 Nodal force and displacement vectors of a truss-cable element

16
01 0
0
02 0
0
03 0
0
( )
( )
( )
x x
y y
z z
L L EAF T L L
L L L
L L EAF T L L
L L L
EAL LF T L L
L L L
(2.17)
where 2 2 2x y zL L L L .
Eq. (2.17) can be expressed as following form;
1 1 0 2 2 0 3 3 0( , , , ), ( , , , ), ( , , , )x y z x y z x y zF F L L L L F F L L L L F F L L L L (2.18)
An incremental equation can be derived from eq. (2.18) as
1 1 1 11 0
0
2 2 2 22 0
0
3 3 3 33 0
0
x y zx y z
x y zx y z
x y zx y z
F F F FdF dL dL dL dL
L L L L
F F F FdF dL dL dL dL
L L L L
F F F FdF dL dL dL dL
L L L L
(2.19)
where 4 1 5 2 6 3, ,x y zdL dU dU dL dU dU dL dU dU
or expressed in matrix form (Kyung, 2002)
1 11 12 13 14
2 21 22 23 24 0
3 31 32 33 34
x
y
z
dF k k k dL f
dF k k k dL f dL
dF k k k dL f
(2.20)

17
Where
20 0 0
11 30
012 21 3
013 31 3
20 0 0
22 30
( )
( )
x
x y
x z
y
EA L EA L Lk
L L L
EA L Lk k
LEA L L
k kL
EA L EA L Lk
L L L
023 32 3
20 0 0
33 30
014 2
0
024 2
0
034 2
0
( )
y z
z
x
y
z
EA L Lk k
L
EA L EA L Lk
L L L
EA Lk
L
EA Lk
L
EA Lk
L
(2.21)
and nodal forces at node j are obtained from equilibrium equation as
4 1 5 2 6 3, , F F F F F F (2.22)
The incremental equation of equilibrium can be obtained for a truss-cable element
considered unstrained lengths as unknowns (Kyung, 2002; Kim and Kim, 2012)
0( )c ce cg c clF k k U k L (2.23)

18
where ΔFc = the incremental nodal force vector; kce = the elastic stiffness matrix;
kcg = the geometric stiffness matrix of truss-cable element; ΔUc = the incremental
displacement vector; kcl = the stiffness matrix related to the unstrained lengths of
the cable element.

19
2.2 TCUD analysis method
Target configuration under dead loads (TCUD) method (Kim and Lee 2001;
Kim and Kim 2012; Jung et al., 2013) is introduced. The TCUD is effective
method to determine the unstrained length or tension of cable elements by Newton-
Raphson iterative technique including the unstrained length of the cable element
such as elastic catenary and truss-cable element in unknown parameters, and
providing additional constraints condition which suppresses the undesirable
displacement of the cable structure as boundary conditions. The incremental
equilibrium equations of bridge structures are considered using eq. (2.15) and
(2.23) adding unstrained lengths of the cable element as unknown, and using
incremental tangential stiffness matrix in case of nonlinear or second-order framed
structure (McGuire, w., et al., 2000; Gavin, H. P., 2014) as in eq. (2.24)
( )f fe fg fF k k U (2.24)
where ΔFf = the incremental nodal force vector; kfe = the elastic stiffness matrix of
frame element; kfg = the geometric stiffness matrix of frame element; ΔUf = the
incremental displacement vector
The direct assemblage of the tangential stiffness matrix leads to the following
incremental form of equilibrium equation for the structural system (Kim and Kim
2012; Jung et al., 2013) as

20
0t lF K U K L (2.25)
where ΔF(n×1) = the incremental unbalanced load vector composed of external
load and internal member force; Kt (n×n) and Kl ( n×m) = the tangential stiffness
matrix and the unstrained length-related stiffness matrix due to m cable element,
respectively; ΔU(n×1) = the incremental nodal displacement vector; ΔL0(m×1) =
the incremental unstrained length vector; n is the number of total degree of
freedom and m the number of cable element.
As the total number of unknowns (n+m) in eq. (2.25), in order to solve this
equation, is a required additional constraint condition. Fig. 2.3 shows examples of
the additional constraints applied for cable-stayed suspension bridges. For this
purpose, eq. (2.25) can be written (Kim and Kim 2012; Jung et al., 2013) as
0tu u ts s lF K U K U K L (2.26)
where Ktu (n×(n-m)) and Kts (n×m) = partitioned stiffness matrices according
to ΔUu and ΔUs, respectively. ΔUu ((n-m)×1) = the unknown displacement vector
to be determined by TCUD analysis; ΔUs(m×1) = the constrained displacement
vector defined by the designer to control the unwanted deformation of the bridge.
21
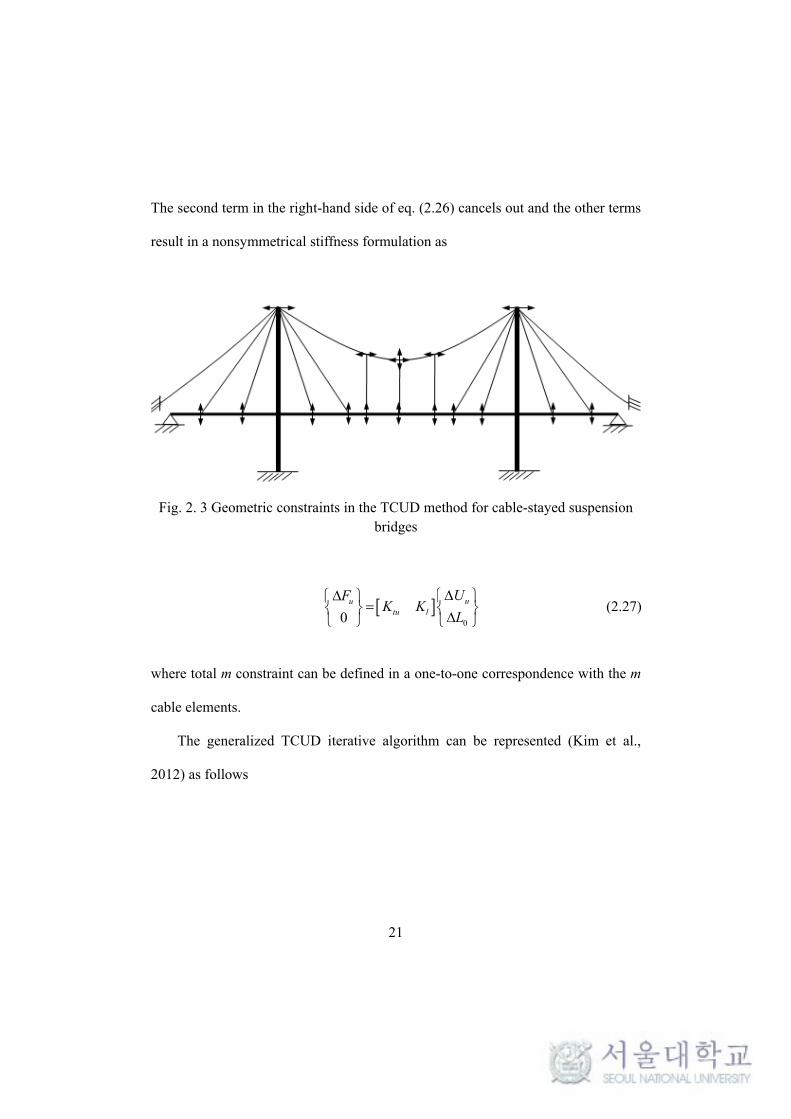
The second term in the right-hand side of eq. (2.26) cancels out and the other terms
result in a nonsymmetrical stiffness formulation as
Fig. 2. 3 Geometric constraints in the TCUD method for cable-stayed suspension bridges
00uu
tu l
UFK K
L
(2.27)
where total m constraint can be defined in a one-to-one correspondence with the m
cable elements.
The generalized TCUD iterative algorithm can be represented (Kim et al.,
2012) as follows

22
( ) ( 1)( 1) ( 1)
( )0
( 1) ( 1) ( 1)
0
for i=1,2,...
i ii i u u
tu l i
i i iu f c
U FK K
L
F W F F
(2.28)
( ) ( 1) ( )
( ) ( 1) ( )0 0 0
(0) (0) (0) : 0, 0, 0
i i iu u ui i i
u f c
U U U
L L L
initial condition U F F
(2.29)
where W = the dead load vector; ( ) ( ),i if cF F = the equivalent internal force vectors
for the frame and cable element, respectively.
This paper adopts the TCUD method following the flowchart as shown in Fig. 2.4.

23
Start iteration, Iter=0
Iter = Iter+1
Calculate the frame and cableelements stiffness matrix
Iter=1
Convergence
Assemble the global stiffness matrix
Unbalanced load
Slove eq. (2.28)
Yes
No
Calculate the unbalanced load( ) ( 1) ( 1)i i i
f cF W F F
( )
( 1) ( )
i
i i
F
F F
(1) ( )F W dead load
( 1)
( 1)0 0 0
i i i
i i i
U U U
L L L
Yes
No
Output
Fig. 2. 4 Flowchart of TCUD method

24
A cable-stayed suspension bridge as an example bridge has been studied in
order to verify the cable element and the iteration procedure of TCUD method
described in above section.
A cable-stayed suspension bridge as an example is taken from the study of
Kim (2011) and Choi (2012), as shown in Fig. 2.5.
M1
41.91@4=167.64m
51m
41.91@14=586.71m
66m
41.91@4=167.64m
25m
M2
M5M8
M9 M10
H1 H2 H8 H9
S1 S2 S3 S4 S6S5H5
Fig. 2. 5 Analysis model of a cable-stayed suspension bridge
The example bridge has a span of 922.02 m with pylon height of 91m and the
sag of 51 m. The bridge deck and pylons are modeled using 22 and 8 frame
element, respectively. The bridge deck has 2 % camber for side spans and main
span. The stay cables are modeled using 12 elastic catenary cable elements as a fan
type cable system. The main cable and hangers are modeled using 10 and 9 elastic
catenary cable elements and truss-cable elements, respectively. Those cable
elements are considered one cable element. M, H, and S in Fig 2.5 are indicated
number of main cable, hangers, and stay cables, respectively. Table 2.1 summarizes
the material and sectional properties and the self-weight data.
25
Table 2. 1 Materal , sectional properties and self-weight data for a cable-stayed suspension bridge
Structural member E(GPa) A(m2) I(m4) W(kN/m)
Deck 207 0.320 1.13 87.5 Pylon(-25~0m) 207 0.300 0.500 7.06 Pylon(0~20.3m) 207 0.269 0.432 6.32 Pylon(20.3~40.6m) 207 0.228 0.345 5.36 Pylon(40.6~66m) 207 0.203 0.211 4.77 Stay cable exterior 207 0.042 - 3.22 Stay cable interior 207 0.016 - 1.24 Main cable 207 0.252 - 32.93 Hanger 207 0.042 - 1.24
In order to perform the initial configuration analysis by Newton-Rapson
iteration technique, a trial value of both unstrained cable length of main cable and
hangers and initial configuration of main cable is calculated by analytical method
with nodal force equilibrium (Kim et al, 2002; Jung et al, 2013). On the other hand,
the trial unstained length of stay cables are assumed straight line.
Fig. 2.6 shows the additional geometric constraints for a cable-stayed
suspension bridge. The number of constraints applied is the same to the number of
cable elements. The main cables suppress the horizontal movement and the hanger
and stay cable prevent vertical movement of the deck at anchorage points.

26
Fig. 2. 6 Additional geometric constraints for a cable-stayed suspension bridge
Table 2.2 shows summary of maximum displacements and internal forces in
the frame elements. It can be noticed that the results analyzed by present study tool
show good agreement with previous study.
Table 2. 2 The maximum displacements and internal forces in frame elements by TCUD method
Structural responses Present study
Kim’s study
Choi’s study
Vertical displacement at the top of pylon(cm) -15.47 - -15.46
Max. positive bending moment of the deck(kN·m) 16222(16245)
15000 15451
Max. negative bending moment of the deck(kN·m) -11875(-11895)
-11000 -11890
Note : The round bracket values denote the analyzed result with continuous beam analysis for the bridge deck only.
Table 2.3 shows the unstrained cable lengths of the main cable, hangers and
stay cables by present study tool. This result indicated that the unstrained length of
main cable, hangers, and stay cables are in good agreement with those previous
studies.

27
Table 2. 3 Unstrained cable lengths of the main cable, hangers and stay cables by TCUD method
Cable No. Present study(m) Kim’s study(m) Choi’s study(m)
M1 179.83 179.83 179.83 M2 171.99 171.98 171.99 M5 41.86 41.86 41.86 H1 65.81 65.77 65.81 H2 16.49 16.40 16.39 H5 3.00 2.98 3.00 S1 142.98 141.74 142.98 S2 107.46 106.37 107.59 S3 78.67 77.93 78.74 S4 75.27 77.96 75.10 S5 102.85 106.40 102.75 S6 138.20 141.81 137.93
Note : M - main cable, H - hanger, and S - stay cable

28
2.3 Configuration analysis procedure for a cable-stayed
suspension bridge
The determination of initial equilibrium state of cable-stayed suspension
bridges under dead load is very important in the process of structural analysis. The
analysis process to determine the unstrained lengths or initial cable tension which
satisfies a given design conditions under dead load is referred to as initial
configuration analysis.
The road and railway long-span cable-stayed suspension bridge is taken as an
example in this paper. In order to perform the configuration analysis of the example
bridge, the elastic catenary cable and truss-cable element are derived considering
the unstrained length as the unknown and Target configuration under dead loads
(TCUD) method (Kim and Lee 2001; Kim and Kim 2012; Jung et al., 2013) is
introduced in above section. With those element and method, the reasonable
completed dead load state for the example bridge is performed according to the
principle that the vertical displacement of the deck and longitudinal displacement
of pylon close to zero under dead load. For the trial initial configuration of main
cable is calculated by analytical method with nodal force equilibrium (Kim et al,
2002; Jung et al, 2013). The example adopted some measures in order to improve
excessive vertical deflection occurs by the train load, as shown in Fig. 3.1. Those
measures include installing several subsidiary piers and concrete deck at side span,

29
and taking short side span with partially earth-anchored stay cable. In this case,
determination of reasonable completed dead load state is a lack of convenient
method due to complex boundary conditions at side span. Therefore, practical
method in terms of the deflection of deck and pylon close to zero has been applied
to determine the initial equilibrium state for example bridge.
To do this, some assumptions are required as: 1) In the case of CSSBs, dead
loads of the deck in cable-stayed parts and suspended part are supported by stay
cables and hangers, respectively. 2) In the transition part, stay cables and hangers at
the same point on the deck have a certain percentage of dead loads. 3) The
horizontal tension of main cable is constant along the main cable. 4) The sag point
at the middle of center span is given as design parameter. 5) The hangers in
suspended part remain vertical in the initial shape finding analysis.
The configuration analysis procedure of CSSB under dead load can be
divided into five steps as follow:
Step 1. Calculation of the vertical reaction forces of both stay cables and
hangers at cable anchorage points using the method of continuous
beam on rigid supports.
Step 2. Initial trial configuration of main cable is calculated by nodal force
equilibrium method (Kim et al, 2002; Jung et al, 2013) under vertical
reaction forces at the anchorage points of hangers, and obtained the
unstained length of hangers and configuration of main cables.

30
Step 3. Determining the tension of stay cables in main span by TCUD based on
the applied fixed boundary condition at the anchorage points of stay
cable at the pylon, and also considering the initial tension of stay
cables in side span as the horizontal and vertical force, as shown in Fig.
2.7.
Step 4. Calculation of the tension of stay cables in side span based on horizontal
forces equilibrium at the pylon, as shown in Fig. 2.7.
Fig. 2. 7 Analysis scheme of determinig the tension of stay cable in main span by TCUD
Step 5. Combined two bridge structure, and iterative calculation by Newton-
Rapson is performed to meet the vertical displacement converge by
adjusting the tension of stay cable in side span with nonlinear approach,
as shown in Fig. 2.8.

31
Fig. 2. 8 Combined two bridge structure for the configuration analysis
The convergence tolerance for the configuration analysis can be expressed as
410v
L
(2.30)
where δv = the maximum vertical displacement of all nodes; L = the main span
length.

32
2.4 Buffeting analysis
The modal frequency domain approach is used to calculate the buffeting responses
(Simiu and Scanlan, 1996). Wind direction and bridge axis is defined in Fig. 2.9.
U+u(t)
w(t)
α
L,h
D,pM
B
Fig. 2. 9 Bridge axis and wind component on the deck
Three displacement components of bridges can be expressed such as following
forms:
1
: h(x,t) = ( ) ( )N
i ii
Vertical h x B t
1
: p(x,t) = ( ) ( )N
i ii
Lateral p x B t (2.31)
1
: (x,t) = ( ) ( )N
i ii
Torsion x t
where x is the coordinate along the bridge deck span; and t = time; hi(x),pi(x), and

33
αi(x) = modal values corresponding to vertical, lateral and torsional displacement
components, respectively; ξi = generalized coordinate of the ith mode; N = number
of modes; and B = deck width.
The governing equation of motion of ξi is
22 =q ( )i i i i i i i iI w t (2.32)
where Ii and qi = generalized mass and force of the bridge deck per unit length,
respectively; ζi and i = damping ratio-to-critical and the circular natural
frequency of the ith mode, respectively.
The generalized force qi(t) is defined by
q ( ) ( ) ( ) ( ) dxi se b i se b i se b i
deck
t L L h B D D p B M M (2.33)
where L, D, and M indicate the lift, drag and pitching moment per unit span length.
Self-excited force under sinusoidal motion of frequency can be expressed as
2 2 21 2 3 4
1 =
2se
h B hL U B KH KH K H K H
U U B
2 2 21 2 3 4
1 =
2se
p B pD U B KP KP K P K P
U U B
(2.34)
2 2 2 21 2 3 4
1 =
2se
h B hM U B KA KA K A K A
U U B

34
where ρ = air density; U = mean wind velocity; K = B /U = reduced frequency;
= circular natural frequency (rad/s); over dots indicate the time derivative; Hi*,
Pi*, and Ai
*, i = 1,…,4 are the flutter derivatives of the bridge deck section.
The buffeting forces due to a turbulent wind can be written as
21 ( , ) ( , ), 2
2L
b Lu L Lw D
dCu x t w x tL x t U B C C
U d U
21 ( , ) ( , ), 2
2D
b Du D Dw
dCu x t w x tD x t U B C
U d U
(2.35)
2 21 ( , ) ( , ), 2
2M
b Mu M Mw
dCu x t w x tM x t U B C
U d U
where u(x,t) and w(x,t) = longitudinal and vertical wind velocity fluctuation
component, respectively; CL,CD, and CM = the lift, drag, pitching moment
coefficients, respectively; dCL/dα and dCM/dα = the slopes of the load coefficient
curves at angle α in Fig. 2.2, relatively; kl = aerodynamic admittance function.
The single mode uncoupled equilibrium equation in (2.2) for the ith mode can
be rewritten with a new frequency i0, a new damping ratio γi, and a buffeting
force qib ( Simiu and Scanlan, 1996) as
20 0
q ( )2 ib
i i i i i ii
t
I (2.36)
and

35
4
2 2 * * * *0 3 4 3 4( )
2 i i i i i i i ii i h h h hi
B lH G H G A G A G
I (2.37)
4* * * * *
0 1 2 1 1 22 2 ( )2 i i i i i i i i i ii i i i h h h p p h
i
B lH G H G P G A G A G
I (2.38)
The modal integrals Grisi are obtained by
( ) ( ) , , , or i i
xr s i i i i i i i
deck
dG r x s x r s h p
l (2.39)
For the buffeting force qib(t) defined as
2 21( ) ( ) ( ) ( ) ( ) ( ) ( )
2ib b i b i b i
deck
q t U B l L t h x B D t p x B M t x dx (2.40)
Defining the Fourier transform of ξi (t) to be
0
( ) lim ( )T
j ti i
Tt e dt
(2.41)
and taking the Fourier transform of (2.36) yields the new system of equations such
that
2 22 20 0
B ( , ) ( , )2 ( ) ( )
2i i i ii deck
U l u x w x dxj x x
I U U l
(2.42)
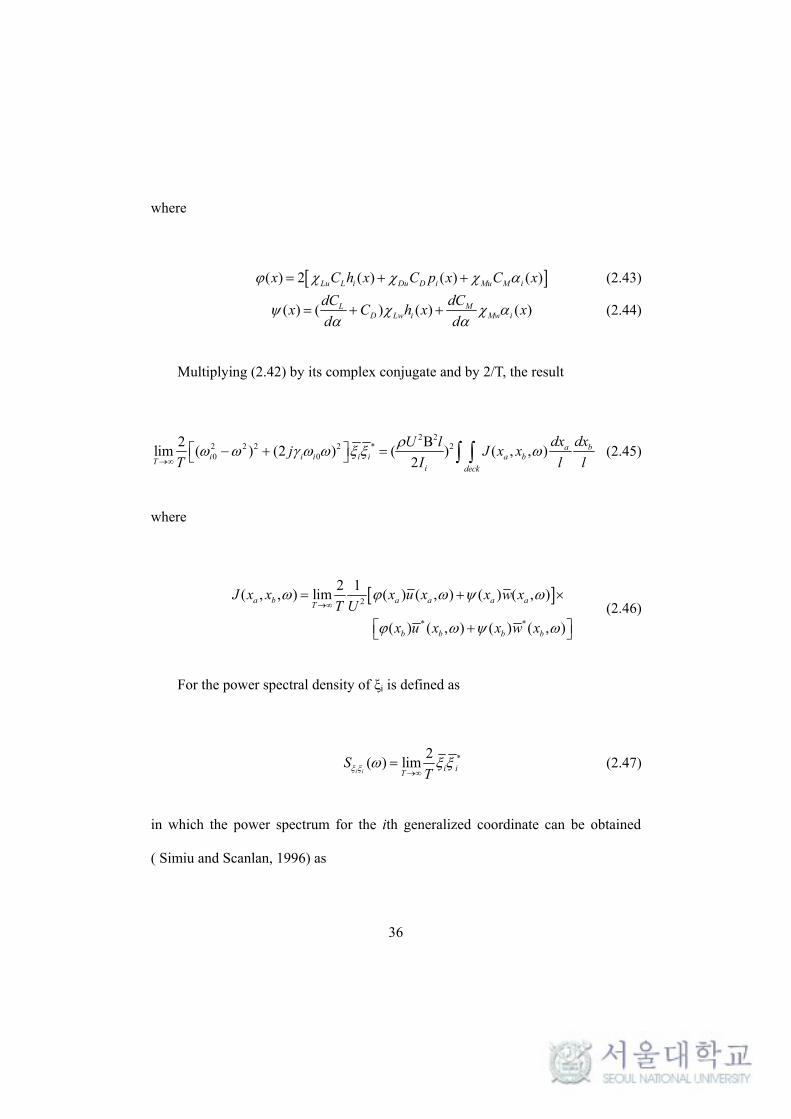
36
where
( ) 2 ( ) ( ) ( )Lu L i Du D i Mu M ix C h x C p x C x (2.43)
( ) ( ) ( ) ( )L MD Lw i Mw i
dC dCx C h x x
d d
(2.44)
Multiplying (2.42) by its complex conjugate and by 2/T, the result
2 22 2 2 2 * 20 0
2 Blim ( ) (2 ) ( ) ( , , )
2a b
i i i i i a bT
i deck
dx dxU lj J x x
T I l l
(2.45)
where
2
* *
2 1( , , ) lim ( ) ( , ) ( ) ( , )
( ) ( , ) ( ) ( , )
a b a a a aT
b b b b
J x x x u x x w xT U
x u x x w x
(2.46)
For the power spectral density of ξi is defined as
*2( ) lim
i i i iT
ST
(2.47)
in which the power spectrum for the ith generalized coordinate can be obtained
( Simiu and Scanlan, 1996) as

37
2 22
2 2 2
2
0 0
B( )
2 1( ) ( ) ( )
1 ( ) 2i i
iu w
ii i
U l
IS R S R S
U
(2.48)
where
/( ) ( ) a bC x x l xa xba b
deck
d dR x x e
l l (2.49)
/( ) ( ) a bC x x l xa xba b
deck
d dR x x e
l l (2.50)
where C = exponential decay function of the wind velocity fluctuation between two
separate point a and b along the bridge deck; Su(ω) and Sw(ω) = power spectral
density functions of the wind velocity fluctuations u and w, respectively.
The mean square of the generalized response can be obtained accordingly:
2
0
( )i i i
S d
(2.51)
and the global responses with respect to vertical, lateral and torsional
directions can be combined from single-modal responses due to the squared root of
the sum of the squares (SRSS) principle as follows:
2 2 2 2 2 2 2 2
1 1 1
( ) ( ), ( ) ( ), ( ) ( )i i i
N N N
h i p i ii i i
x sqrt h B x sqrt p B x sqrt
(2.52)

38
The maximum response for the ith mode can be calculated as a peak factor
times ith RMS response. The peak factor kp is defined (Strømmen, 2010) as
0.577
2 ln[ (0) ]2 ln[ (0) ]
p x
x
k f Tf T
(2.53)
where
2
0
0
( )1
(0)2
( )
x
x
x
S d
f
S d
(2.54)
and T is set to be 10 min in a full scale.

39
Chapter 3
Investigated bridge
3.1 Bridge description
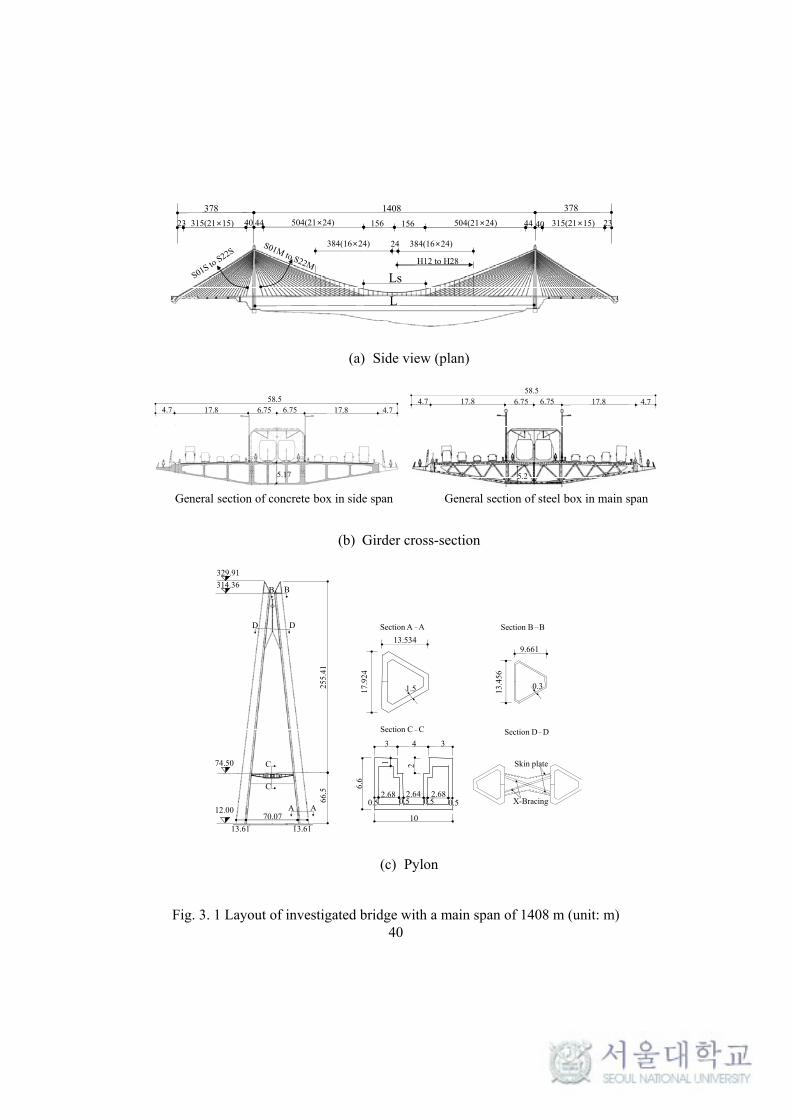
The cable-stayed suspension bride (CSSB) is a road and railway bridge as an
example bridge. The CSSB has a main span of 1408 m and two side spans of 378
m as shown in Fig. 3.1(a). The main span consists of the cable-stayed portion of
1096m and the suspension portion of 312m. In the side span, four intermediate
piers are installed in order to increase in-plane flexural rigidity of bridge. The cable
system consists of the main cables, hangers and stay cables. The distance of two
main cables is 13.5m, the cable sag to span ratio is 1/6.5, and the hanger is spaced
at 24m. The stay cables are anchored to the deck at 15m intervals in side spans and
24m in the main span. The deck shown in Fig. 3.1(b) is a streamlined box girder
with 58.5 m wide and 5.2 m high. The main span and side span decks consist of
steel and pre-stressed concrete, respectively. The pylon is A-shape concrete leg
with a transverse beam, and its height is 322 m as shown in Fig. 3.1(c). Total 9
cross sections for concrete decks of side span and 11 cross sections for steel decks
of main span are defined. The sectional and material properties are listed in Table
3.1.
40
1408378 378
315(21×15)
24
504(21×24)444023 156 156 504(21×24) 44 40 315(21×15) 23
384(16×24) 384(16×24)
H12 to H28
Ls
L
(a) Side view (plan)
58.56.75 6.75 17.817.8 4.74.7
5.17
58.56.75 6.75 17.817.8 4.74.7
5.2
General section of concrete box in side span General section of steel box in main span
(b) Girder cross-section
AA70.07
13.61 13.61
74.50
12.00
329.91
66.5
255.
41
314.36
C
C
BB
DD
17.9
24
13.534
1.5
X-Bracing
Skin plate
3 4 3
6.6
10
1 2
0.52.68
0.52.64
0.52.68
0.5
13.4
56
9.661
0.3
Section A A Section B B
Section C C Section D D
(c) Pylon
Fig. 3. 1 Layout of investigated bridge with a main span of 1408 m (unit: m)

41
Table 3. 1 The cross-sectional properties of cable-stayed suspension bridge
Structural members
E (MPa)
A (m2)
Ix (m4)
Iy (m4)
Iz (m4)
m (ton/m)
Im (ton·m2
/m) Remark
Girder side span 2.2×10⁴ 51.21~65.07
471.89~612.35
8399.3~10248
155.67~201.2
154.65~294.3
25878 ~45347
Girder main span 2.1×10⁵ 3.04~7.48
25.92~33.27
756.4~1632.2
11.76~27.07
43.45~98.82
11013 ~25975
Pylon-bottom 2.2×10⁴ 72.77 2405.8 1431.9 1871.2 181.91 - A-A
Pylon-top 2.2×10⁴ 35.87 737.46 385.9 551.94 89.68 - B-B
Pylon-transverse 2.2×10⁴ 35.87 737.46 385.9 551.94 62.60 - C-C
Pylon-top bracing 2.1×10⁵ 35.87 737.46 385.9 551.94 0.53 - D-D
Main cable side span
2.0×10⁵ 35.87 - - - 2.785 -
Main cable main span
2.0×10⁵ 35.87 - - - 2.580 -
Hangers 2.05×10⁵ 0.004~0.014
- - - 0.036~0.119
- H12 to H28
Stay cable side span
1.95×10⁵ 0.012~0.023
- - - 0.110~0.206
- S01S to 22S
Stay cable main span
1.95×10⁵ 0.010~0.021
- - - 0.089~0.194
- S01M to 22M
Notes: E – elastic modulus; A - sectional area; Ix - torsional moment inertia; Iy - lateral moment inertia; Iz - vertical moment inertia; m – mass per unit length; Im – mass moment of inertia per unit length.
42
3.2 Initial equilibrium state for the example bridge
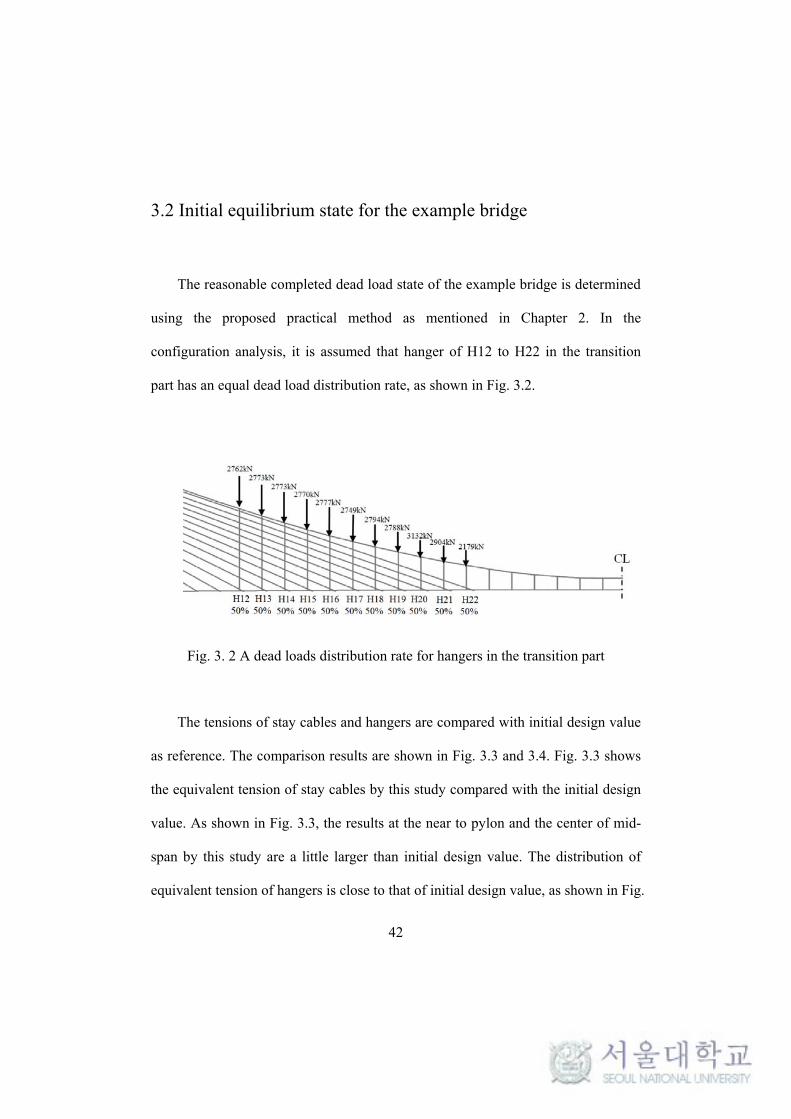
The reasonable completed dead load state of the example bridge is determined
using the proposed practical method as mentioned in Chapter 2. In the
configuration analysis, it is assumed that hanger of H12 to H22 in the transition
part has an equal dead load distribution rate, as shown in Fig. 3.2.
Fig. 3. 2 A dead loads distribution rate for hangers in the transition part
The tensions of stay cables and hangers are compared with initial design value
as reference. The comparison results are shown in Fig. 3.3 and 3.4. Fig. 3.3 shows
the equivalent tension of stay cables by this study compared with the initial design
value. As shown in Fig. 3.3, the results at the near to pylon and the center of mid-
span by this study are a little larger than initial design value. The distribution of
equivalent tension of hangers is close to that of initial design value, as shown in Fig.

43
3.4. The results show that the practical method works well for the completed dead
load state of the example bridge.
Fig. 3. 3 Distribution of equivalent tensions of stay cables in example bridge
Fig. 3. 4 Distribution of equivalent tensions of hangers in example bridge

44
3.3 Initial equilibrium state for the parametric study analysis
models
In order to investigate the structural behaviors considering different
suspension-to-span ratio for cable-stayed suspension bridges, seven bridge models
with the same design conditions of the example bridge are designed based on
added or removed stay cables and hanger in both structural parts, the cable-stayed
parts and suspended part, as shown in Fig. 3.5. Table 3.2 listed seven bridge
analysis models which are designed to modify the example CSSB model in section
3.1.
Table 3. 2 Analysis cases for parametric study
Analysis case Suspension portion length(m) Suspension-to-span ratio
Ls/L=0.00 0(Cable-stayed br.) 0.00 Ls/L=0.22 312(As-built) 0.22 Ls/L=0.45 647 0.45 Ls/L=0.56 792 0.56 Ls/L=0.66 936 0.66 Ls/L=0.77 1080 0.77 Ls/L=1.00 1408(Suspension br.) 1.00
Notes: Ls - Length of suspension portion, L- Length of main span
Ls/L=0.00 as a partially earth-anchored cable-stayed bridge, the pylon height
should be changed in order to enhance the efficiency of stay cables due to the
increase inclining angles of stay cables. However, the pylon height has fixed for the
45
purposes of comparison with cable-stayed suspension bridges. Furthermore, a pure
suspension model of Ls/L=1.00, the concrete deck of side spans are required with a
view of back stay for cable-stayed bridges but not effective in structural viewpoint.
However, the same design conditions of side spans have applied like other bridge
models for the comparison purposes. Also, the distance of two main cables is
49.6m and vertical hangers are attached along the edge of the bridge deck in
analysis case of Ls/L=1.00.
Detailed illustrations for the arrangement of the stay cables and hangers in
seven bridge models are shown as follows:
Analysis model of Ls/L=0.00 has 112 pairs of stay cables, where 11 pairs of them
are partially earth-anchored in each side span. Ls/L=1.00 has 56 pairs of hangers in
the center of main span. In model Ls/L=0.2 has 88 pairs of stay cables where 5
pairs of them are partially earth-anchored in each side span, and 12 pairs of hangers
in the center of main span. 15 pairs of stay cables in both side span and main span
and 26 pairs of hangers in main span are installed in Ls/L=0.45. In the case of
Ls/L=0.56 to Ls/L=0.77, the pairs of stay cables installed descend as 12 to 6 by 3
in both side span and main span while the pairs of hangers on main span ascend
from 32 to 44 by 6. This is illustrated in Fig. 3.5.

46
Ground Ground
(a) Ls/L=0.00, Ls=0m
Ground Ground
(b) Ls/L=0.22, Ls=312m
(c) Ls/L=0.45, Ls=647m
(d) Ls/L=0.56, Ls=792m
(e) Ls/L=0.66, Ls=936m
(f) Ls/L=0.77, Ls=1080m
(g) Ls/L=1.00, Ls=1408m
Fig. 3. 5 Finite element models for parameter study
47
Seven bridge analysis models are developed as a simplified three-dimensional
(3-D) FE models. The deck and pylon members are modeled by a 3-D frame
element (Kim et al. 2004) and stay cables, main cables and hangers are modeled by
elastic catenary cable element (Irvine, 1981) , as shown in Fig 3.2.
Initial equilibrium state under completed dead load is found by practical
methods mentioned in Chapter 2, and the results are compared as follows.
Fig. 3.6 shows the distribution of axial forces in the deck. At the near to pylon
of deck are large compressive forces in all the models. In the deck of the earth-
anchored analysis cases of Ls/L=0.00 and Ls/L=0.22 are in compression and
tension at the same times. The model Ls/L=0.00 has a large number of earth-
anchored stay cables, and the peak of the tension in the deck is significantly larger.
As the suspension-to-span ratio increases, both compressive forces and tension in
the deck decreases, which improves the structural stability and saves materials.
Fig 3.7 illustrates vertical bending moment of the deck. All of the bridge
analysis models represent a similar trend with a small difference in value. The
maximum and minimum vertical bending moment of the deck is found at the near
to pylon and subsidiary piers of side spans.

48
Fig. 3. 6 Distribution of axial forces in deck under dead load
Fig. 3. 7 Distribution of vertical bending moment of deck under dead load
49
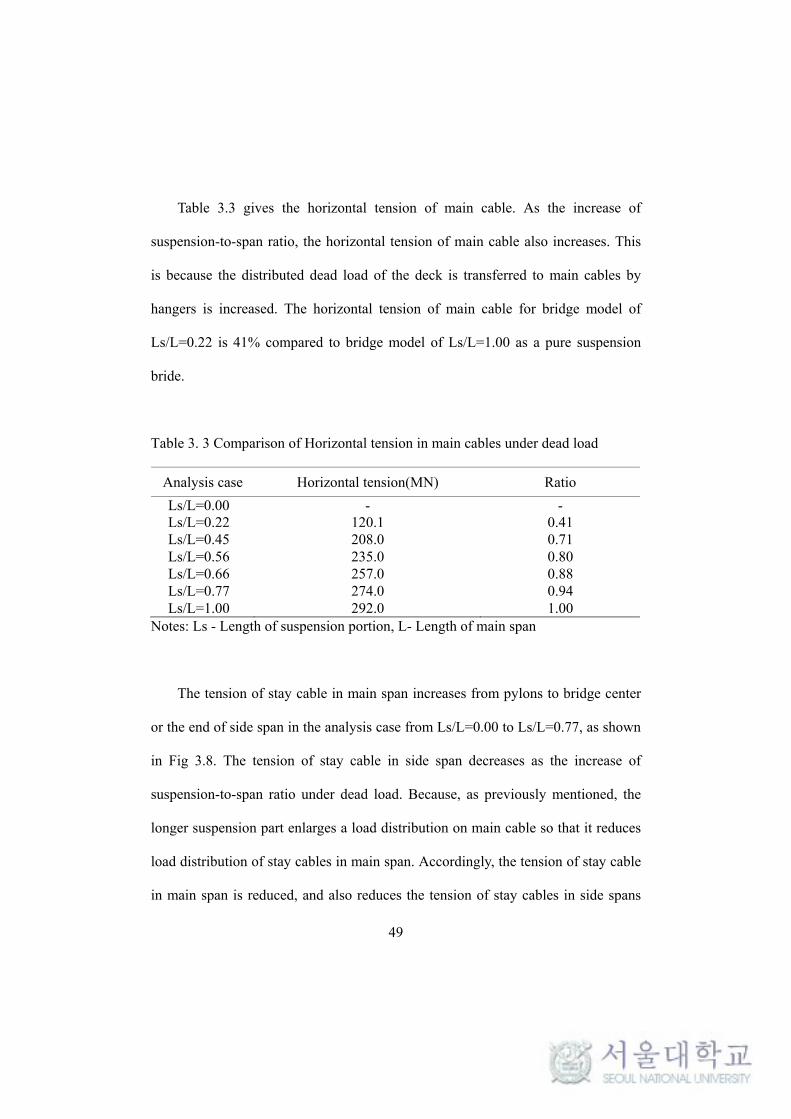
Table 3.3 gives the horizontal tension of main cable. As the increase of
suspension-to-span ratio, the horizontal tension of main cable also increases. This
is because the distributed dead load of the deck is transferred to main cables by
hangers is increased. The horizontal tension of main cable for bridge model of
Ls/L=0.22 is 41% compared to bridge model of Ls/L=1.00 as a pure suspension
bride.
Table 3. 3 Comparison of Horizontal tension in main cables under dead load
Analysis case Horizontal tension(MN) Ratio
Ls/L=0.00 - - Ls/L=0.22 120.1 0.41 Ls/L=0.45 208.0 0.71 Ls/L=0.56 235.0 0.80 Ls/L=0.66 257.0 0.88 Ls/L=0.77 274.0 0.94 Ls/L=1.00 292.0 1.00
Notes: Ls - Length of suspension portion, L- Length of main span
The tension of stay cable in main span increases from pylons to bridge center
or the end of side span in the analysis case from Ls/L=0.00 to Ls/L=0.77, as shown
in Fig 3.8. The tension of stay cable in side span decreases as the increase of
suspension-to-span ratio under dead load. Because, as previously mentioned, the
longer suspension part enlarges a load distribution on main cable so that it reduces
load distribution of stay cables in main span. Accordingly, the tension of stay cable
in main span is reduced, and also reduces the tension of stay cables in side spans
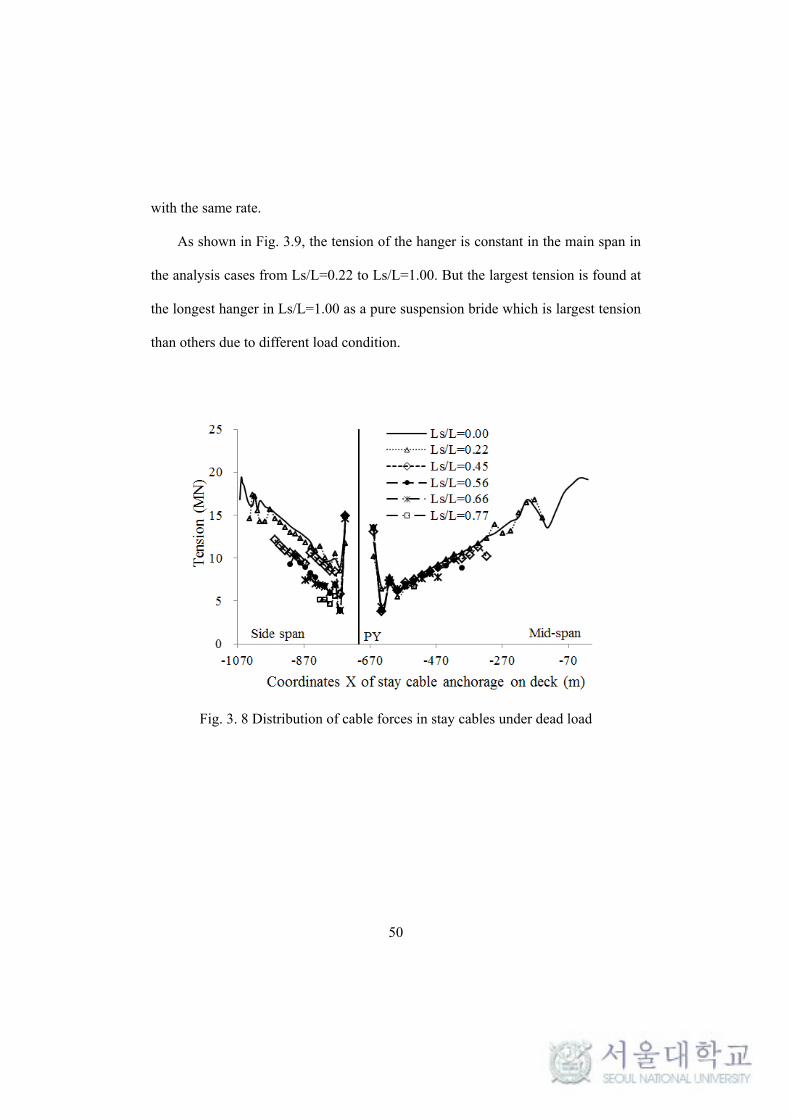
50
with the same rate.
As shown in Fig. 3.9, the tension of the hanger is constant in the main span in
the analysis cases from Ls/L=0.22 to Ls/L=1.00. But the largest tension is found at
the longest hanger in Ls/L=1.00 as a pure suspension bride which is largest tension
than others due to different load condition.
Fig. 3. 8 Distribution of cable forces in stay cables under dead load

51
Fig. 3. 9 Distribution of cable forces in hangers under dead load

52
Chapter 4
Design parameter study on structural performance of
cable-stayed suspension bridge under live load and
wind load
Considering train load in long-span cable-supported bridges, the bridge has to
satisfy the rigorous vertical deflection criteria under service load. The cable-stayed
suspension bridge (CSSB) can improve the vertical stiffness by additional stay
cable, and becomes an alternative structure. In order to comprehensively
understand and a realistically predict the structural behavior of CSSB, parametric
study is carried out with seven bridge analysis models considering different
suspension-to-span ratio. The scheme of suspension-to-span ratio (Ls/L) shows in
Fig. 4.1. Investigated bridge analysis models are developed as a simplified three-
dimensional (3-D) FE models, as shown in Fig 3.5.
Length of main span(L)
Length of suspended part(Ls)
Ground anchor
Ground anchor
Fig. 4. 1 The scheme of suspension-to-span ratio (Ls/L)

53
For the parametric study, two design parameters, the suspension-to-span ratio
and length of transition part are considered and studied for their effects on the
structural behavior under live loads consisting of trains and road vehicles and wind
load.
The design live road is consist of a uniform lane load w and truck load based
on the Korean Highway Bridge Design Code (Limit State Design) – Cable
Supported Bridges (KBDC, 2015) as shown in Fig 4.2.
Where L is length of span
Truck load Lane load(Model1)
Fig. 4. 2 Road model in KBDC 2015
For the design train load consists of a uniformly distributed load 80kN/m and
4 point loads of 250 kN based on LM 71 of Eurocodes1 (CEN, 2003), as shown Fig.
4. 3.

54
Fig. 4. 3 Train load model LM71 in EC1-EN1991-2
In the analysis, two live load cases LC1 and LC2 are considered as shown in
Fig 4.4. In the load case LC1, the road vehicle loads in the mid-span and the train
loads in 400m length at the center of mid-span are loaded in order to consider the
maximum deflection at the center of main span. In the second case, the only one
side quarter of mid-span is loaded to consider the maximum longitudinal slope of
the deck.
Fig. 4. 4 Live load cases
For all live load cases, 2 train track and 10 traffic lane are loaded together. For

55
road vehicle, a uniform lane load of w=67.620 kN/m and truck load as a
concentrated load of 930.75 kN considering multi-lane reduction factor are
considered based on the Korea Bridge Design Code (Limit State Design) for cable-
supported bridge (KBDC, 2015). For train load, a uniformly distributed loads 212.8
kN/m and 4 point loads as a concentrated load of 2660 kN with α=1.33.
For the aerostatic stability analysis, the aerostatic drag (D), lift (L), and
pitching moment (M) components of wind load are considered to be acted on the
bridge deck under wind attack angles of 0°, as shown in Fig. 2.7. The following
three components of wind load are as follow
2
2
2 2
( ) 0.5 ( )
( ) 0.5 ( )
( ) 0.5 ( )
D
L
M
D V BC
L V BC
M V B C
(4.1)
where α = wind attack angle; ρ = the air density; V = wind velocity; B = width of
deck; CD, CL, and CM = aerostatic coefficients of drag, lift, and pitching moment,
respectively.
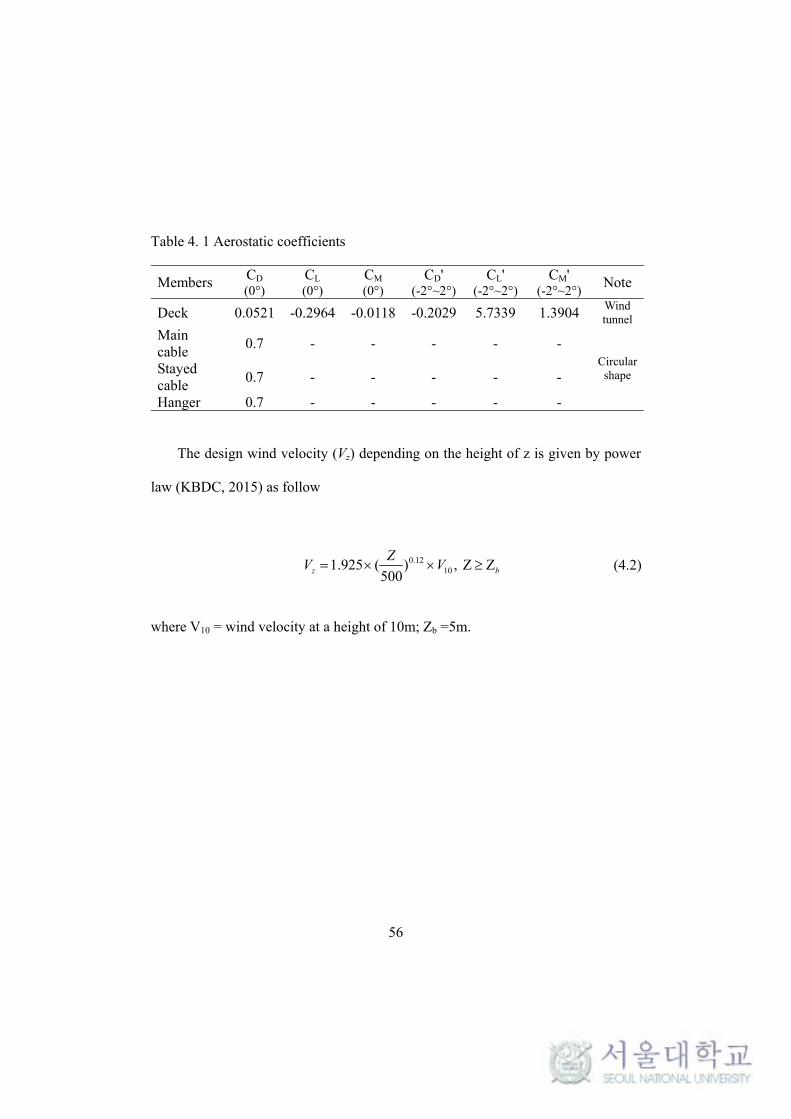
The aerostatic coefficients are obtained from wind tunnel test (Greisch, 2013),
as listed in Table 4.1. Wind load action on the cables and pylons only considered
the drag component, and the corresponding drag coefficient is 0.7 for cables and
ranging from 0.824 to 1.038 for pylons.
56
Table 4. 1 Aerostatic coefficients
Members CD
(0°) CL
(0°) CM
(0°) CD'
(-2°~2°)CL'
(-2°~2°)CM'
(-2°~2°) Note
Deck 0.0521 -0.2964 -0.0118 -0.2029 5.7339 1.3904 Wind tunnel
Main cable
0.7 - - - - - Circular shape Stayed
cable 0.7 - - - - -
Hanger 0.7 - - - - -
The design wind velocity (Vz) depending on the height of z is given by power
law (KBDC, 2015) as follow
0.12101.925 ( ) , Z Z
500z b
ZV V (4.2)
where V10 = wind velocity at a height of 10m; Zb =5m.

57
4.1 Suspension-to-span ratio effects under live load
Based on the initial equilibrium state of seven bridge analysis models from
Chapter 3, nonlinear static analysis was conducted for those models and
displacement and internal forces were obtained. After that the responses is
compared with seven bridge analysis models and discussed.
(1) Responses of deck
The vertical displacement of analysis case LS/L=0.22 due to load case LC1, as
shown in Fig. 4.5. The maximum vertical displacement of 3.26m at mid-span of
deck under train load is larger than road vehicle load, and the difference of
maximum vertical displacement is about 58%. These figures clearly indicate that
the loading effect of train is dominant in the vertical deflection.
Fig. 4. 5 Vertical displacement of deck under LC1 for Ls/L=0.22

58
The vertical displacement of analysis models are compared with two live load
cases. Load cases LC1 and LC2 as show in Fig 4.5 and 4.6, respectively. With the
increase of suspension-to-span ratio, the vertical displacement at the center of mid-
span of deck and at the quarter of mid-span gradually increases under two live load
cases, as shown in Fig 4.6 and Fig 4.7. The minimum value of the vertical
displacement of deck is found at the Ls/L=0.22(with suspended part length being
312m) under load case of LC1 and LC2.
Table 4.2 shows the vertical displacement of deck under combined maximum
responses of LC1 and LC2. With the increase of suspension-to-span ratio, the
maximum vertical displacement at the center of mid-span of deck gradually
increases. The most effective in restricting the live load deformation occurs at the
suspension-to-span ratio of 0.22, and the ratio of mid-span to maximum vertical
displacement (L/δmax) is 316.
Table 4. 2 The vertical displacement of deck under combined maximum response of LC1 and LC2
Analysis case L/2(m) δmax(m) L/δmax
Ls/L=0.00 7.287 7.728 193
Ls/L=0.22 4.450 4.450 316
Ls/L=0.45 6.100 6.100 231
Ls/L=0.56 6.480 6.480 217
Ls/L=0.66 7.730 7.730 191
Ls/L=0.77 7.920 8.190 172
Ls/L=1.00 8.810 9.160 154 Notes: Ls - Length of suspension portion, L- Length of main span
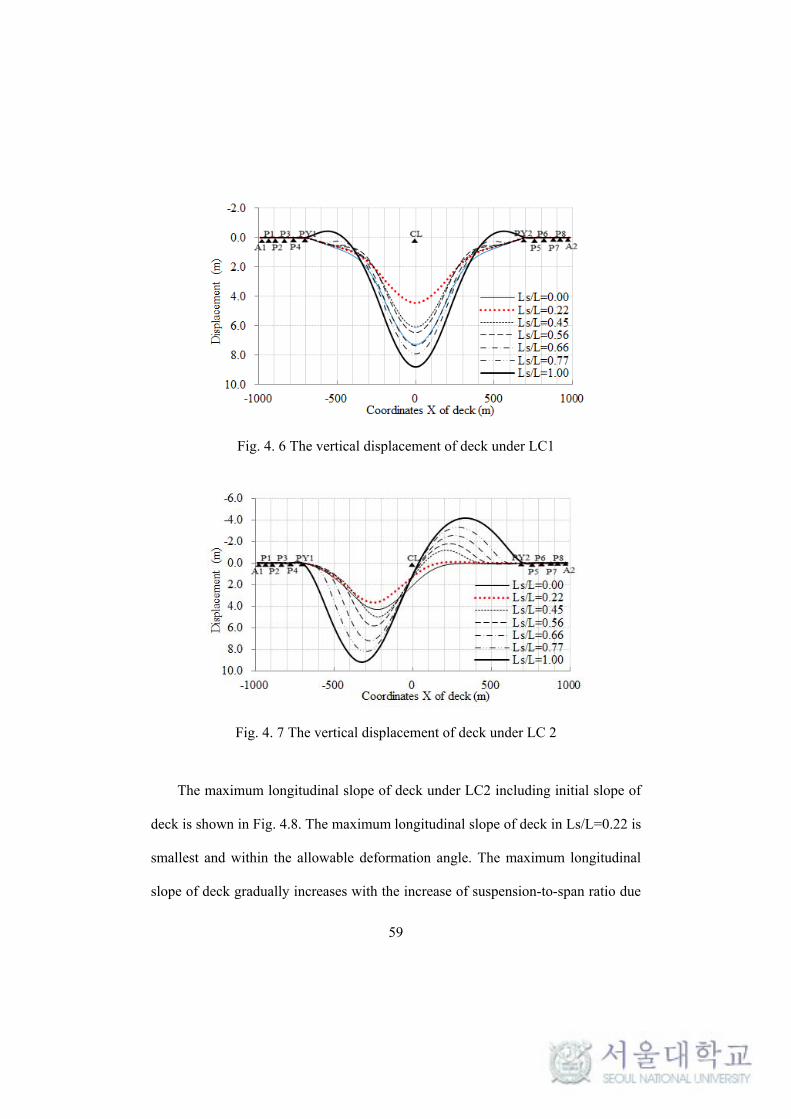
59
Fig. 4. 6 The vertical displacement of deck under LC1
Fig. 4. 7 The vertical displacement of deck under LC 2
The maximum longitudinal slope of deck under LC2 including initial slope of
deck is shown in Fig. 4.8. The maximum longitudinal slope of deck in Ls/L=0.22 is
smallest and within the allowable deformation angle. The maximum longitudinal
slope of deck gradually increases with the increase of suspension-to-span ratio due
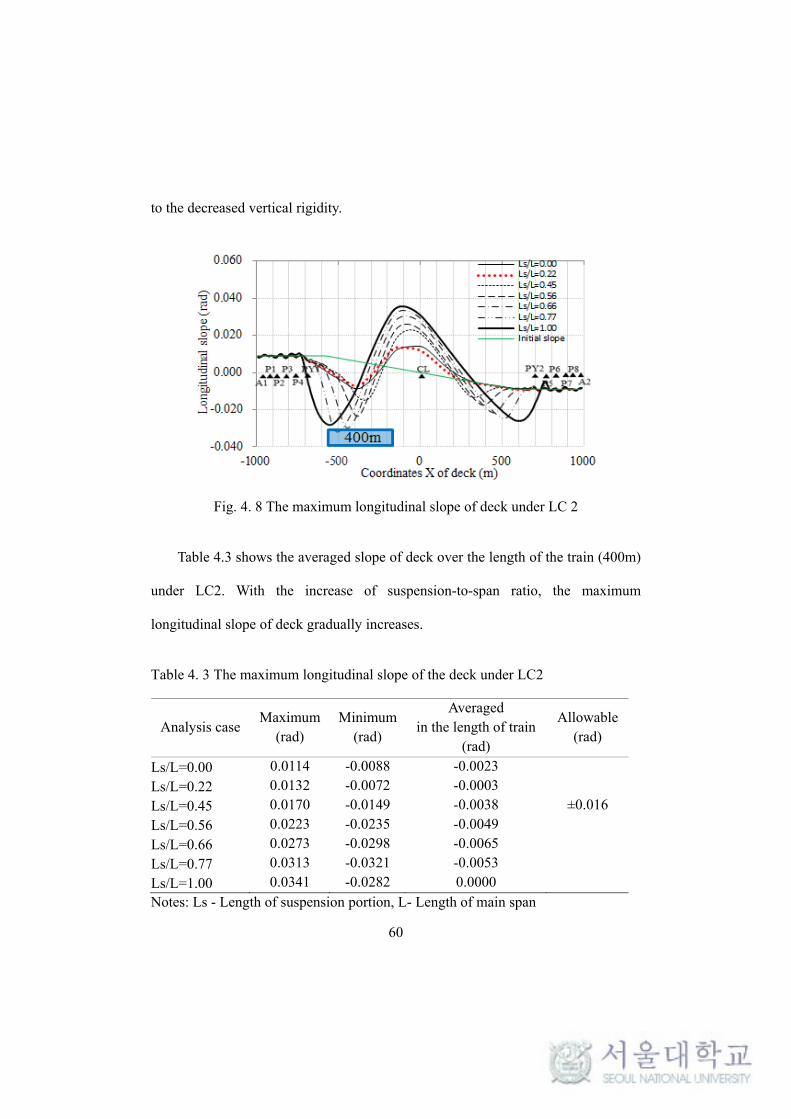
60
to the decreased vertical rigidity.
Fig. 4. 8 The maximum longitudinal slope of deck under LC 2
Table 4.3 shows the averaged slope of deck over the length of the train (400m)
under LC2. With the increase of suspension-to-span ratio, the maximum
longitudinal slope of deck gradually increases.
Table 4. 3 The maximum longitudinal slope of the deck under LC2
Analysis caseMaximum
(rad) Minimum
(rad)
Averaged in the length of train
(rad)
Allowable (rad)
Ls/L=0.00 0.0114 -0.0088 -0.0023
Ls/L=0.22 0.0132 -0.0072 -0.0003
Ls/L=0.45 0.0170 -0.0149 -0.0038 ±0.016
Ls/L=0.56 0.0223 -0.0235 -0.0049
Ls/L=0.66 0.0273 -0.0298 -0.0065
Ls/L=0.77 0.0313 -0.0321 -0.0053
Ls/L=1.00 0.0341 -0.0282 0.0000 Notes: Ls - Length of suspension portion, L- Length of main span

61
Fig. 4.9 shows the vertical bending moment of deck under LC2. In the deck,
the maximum negative vertical bending moment, 1450 MN·m, is found at the
Ls/L=1.00 as a pure suspension bridge. Along with the increase of suspension-to-
span ratio, the maximum negative vertical bending moment of deck at the junction
sharply increases due to the stiffness difference of suspended part and cable-stayed
parts. It indicates that transition part have to be set up to improve the stiffness
transition of the deck between the cable-stayed part and suspended part.
Fig. 4. 9 The vertical bending moment of deck under LC 2
In terms of two aspects of maximum vertical deformation and longitudinal
slope of deck, the effective suspension-to-span ratio is about 0.22 to 0.56, this is to
improve vertical rigidity for serviceability under train load.
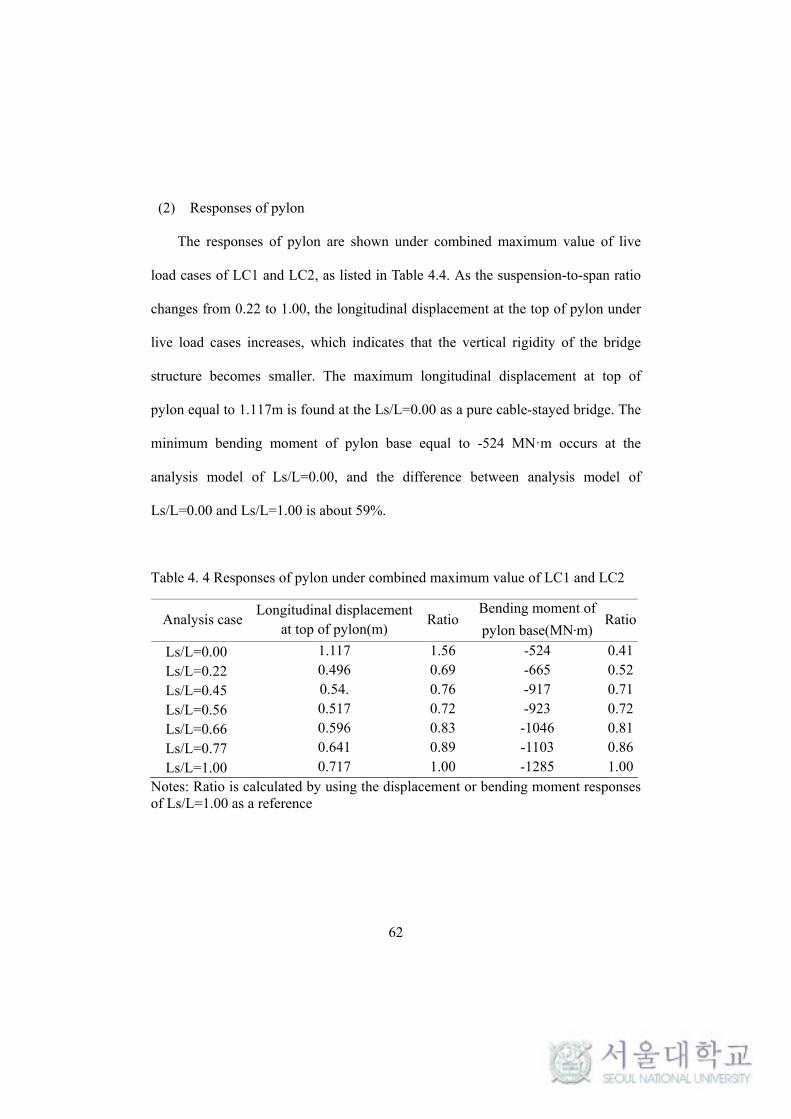
62
(2) Responses of pylon
The responses of pylon are shown under combined maximum value of live
load cases of LC1 and LC2, as listed in Table 4.4. As the suspension-to-span ratio
changes from 0.22 to 1.00, the longitudinal displacement at the top of pylon under
live load cases increases, which indicates that the vertical rigidity of the bridge
structure becomes smaller. The maximum longitudinal displacement at top of
pylon equal to 1.117m is found at the Ls/L=0.00 as a pure cable-stayed bridge. The
minimum bending moment of pylon base equal to -524 MN·m occurs at the
analysis model of Ls/L=0.00, and the difference between analysis model of
Ls/L=0.00 and Ls/L=1.00 is about 59%.
Table 4. 4 Responses of pylon under combined maximum value of LC1 and LC2
Analysis caseLongitudinal displacement
at top of pylon(m) Ratio
Bending moment of
pylon base(MN·m) Ratio
Ls/L=0.00 1.117 1.56 -524 0.41
Ls/L=0.22 0.496 0.69 -665 0.52
Ls/L=0.45 0.54. 0.76 -917 0.71
Ls/L=0.56 0.517 0.72 -923 0.72
Ls/L=0.66 0.596 0.83 -1046 0.81
Ls/L=0.77 0.641 0.89 -1103 0.86
Ls/L=1.00 0.717 1.00 -1285 1.00 Notes: Ratio is calculated by using the displacement or bending moment responses of Ls/L=1.00 as a reference

63
(3) Responses of main cables
Table 4.5 gives the cable tension of main cable under combined maximum
value of LC1 and LC2. The maximum horizontal tension of main cable at the
center of mid-span gradually increases due to the increased vertical load
transmission to the main cable by hangers with the increase of suspension-to-span
ratio. The minimum horizontal tension of main cable at mid-span is found at
Ls/L=0.22 and 33% lower than that of Ls/L=1.00 as a pure suspension bridge. The
live load-to-dead load ratio of horizontal tension of main cable for all of analysis
cases are mostly in the range of 0.29 to 0.47.
Table 4. 5 Horizontal tension of main cable under combined maximum value of LC1 and LC2
Analysis case Main cable tension at mid-span(MN) Ratio (Live load/Dead) Dead load Maximum live load
Ls/L=0.00 - - -
Ls/L=0.22 120.1 57.0 0.47 Ls/L=0.45 208.0 80.6 0.39 Ls/L=0.56 235.0 79.4 0.34 Ls/L=0.66 257.0 86.2 0.34 Ls/L=0.77 274.0 86.8 0.32 Ls/L=1.00 292.0 85.0 0.29 Notes: the ratio is expressed as each result of live load divided by dead load
(4) Responses of stay cables
The distribution of the maximum tension of stay cables shows under combined
maximum values of LC1 and LC2, as found in Fig. 4.10. Along with the increase

64
of suspension-to-span ratio, the maximum tension of stay cables at the mid-span is
gradually increasing. As the suspension-to-span ratio changes from 0.45 to 0.77,
the maximum tension of stay cable under live loads are found at the longest stay
cable near to junction.
Fig. 4. 10 Tension of stay cables under combined maximum response of LC1 and LC2
(5) Responses of hangers
The distribution of the maximum tension of hanger is found at the longest
hanger near to junction, as shown in Fig. 4.11. It means that the fatigue problem
might occur due to the stiffness difference of suspended part and cable-stayed parts
in mid-span of cable-stayed suspension bridge. Therefore, the stress amplitude of
the longest hanger at the junction should be verified under fatigue load, and some
structural measures should be determined for overcoming the problem of stiffness
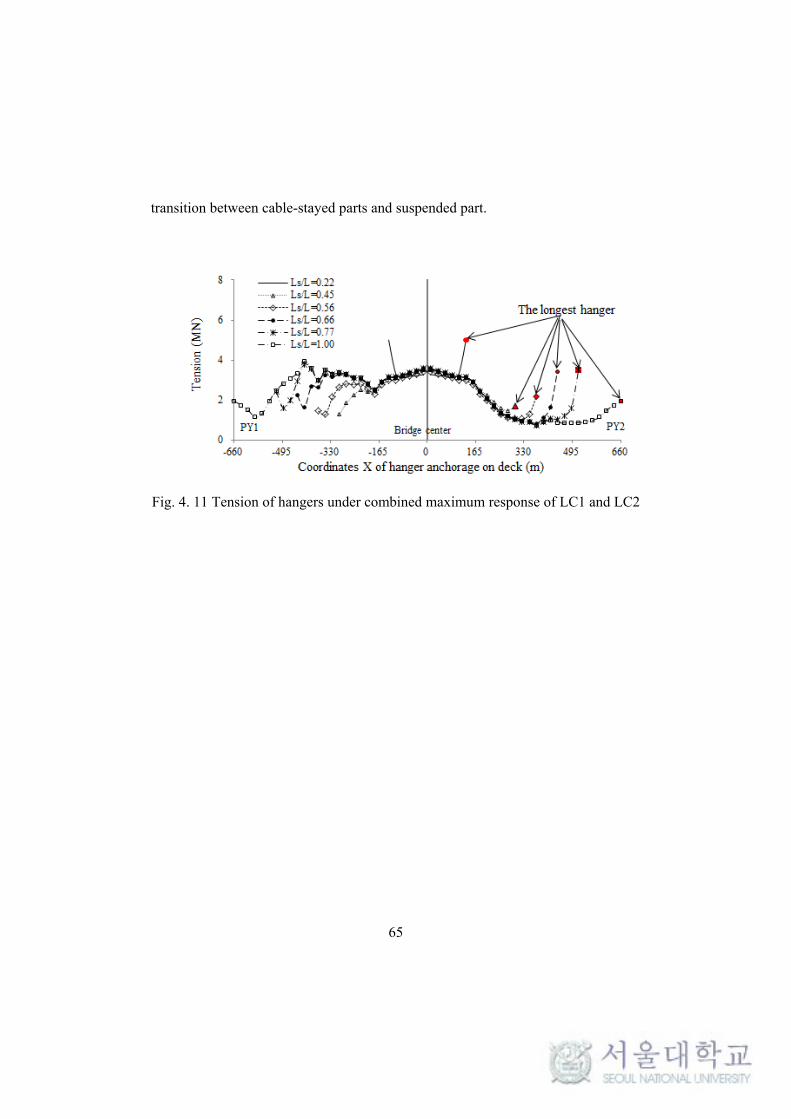
65
transition between cable-stayed parts and suspended part.
Fig. 4. 11 Tension of hangers under combined maximum response of LC1 and LC2

66
4.2 Effect of transition part under live load
A sudden change of stiffness at junction between stay-cable parts and
suspended part cause sharply increase of negative bending moment on deck and the
tension amplitude of the longest hanger near to the junction, which can lead to
fatigue problem. As a structural improvement suggestion to mitigate the severe
stiffness change on the junction part, additional hangers on the cable-stayed part is
considered. These hangers are called crossing hangers. The scheme of transition
part-to-cable-stayed part ratio (Lt/Lc) shows in Fig. 4.12. In order to investigate the
effect of the transition part, the ratio of transition part to cable-stayed part is
changed from 0 to 0.45, by adding crossing hangers in the cable-stayed part based
on the structural system of Ls/L=0.22, as shown in Fig. 4.13. One of the design
parameters for transition parts is the dead load distribution ratio for each pair of
stay cables and hangers at the same point on the deck. In order to investigate the
effect of the load distribution ratio in the transition parts, four different load
distribution ratios are considered in parameter study, as shown in Fig. 4.14.
Fig. 4. 12 The scheme of transion part-to-cable-stayed part ratio (Lt/Lc)

67
(a) Lt/Lc =0(No transition part)
(b) Lt/Lc =0.02; 1 crossing hangers
(c) Lt/Lc =0.14; 4 crossing hangers
(d) Lt/Lc =0.32; 8 crossing hangers
(e) Lt/Lc =0.45; 11 crossing hangers
Fig. 4. 13 FE analysis model for the verified effect of transition ratio

68
Fig. 4. 14 Analysis case of the load distrinution ratio at the transion parts
A train load, which has a strong effect on a tension of stay cables and hangers,
is considered in the fatigue analysis. Moving load analysis is carried out based on a
linearized finite displacement analysis by a commercial program of Midas Civil.
The transition parts ratio and dead load distribution at the transition parts are
studied with respects of the amplitude of longest hanger tension and secondary
stress of main cable, and recommend value for these parameters on condition of
this parametric study results.
(1) Effect of transition part ratio
Fig 4.15 gives the amplitude of hanger tensions according to the variation of
transition part under equal dead load distribution ratio for cable-stayed parts and
suspended part. As the transition part increases, the amplitude of the longest hanger
tension reduces.
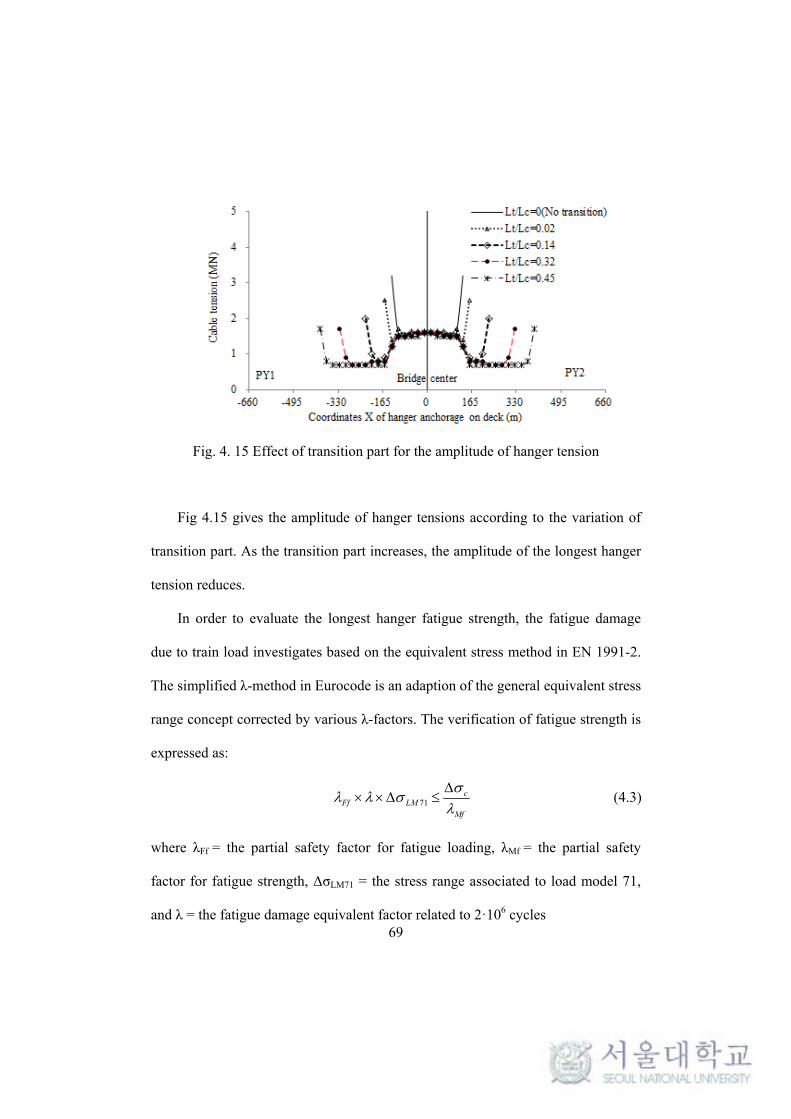
69
Fig. 4. 15 Effect of transition part for the amplitude of hanger tension
Fig 4.15 gives the amplitude of hanger tensions according to the variation of
transition part. As the transition part increases, the amplitude of the longest hanger
tension reduces.
In order to evaluate the longest hanger fatigue strength, the fatigue damage
due to train load investigates based on the equivalent stress method in EN 1991-2.
The simplified λ-method in Eurocode is an adaption of the general equivalent stress
range concept corrected by various λ-factors. The verification of fatigue strength is
expressed as:
71c
Ff LMMf
(4.3)
where λFf = the partial safety factor for fatigue loading, λMf = the partial safety
factor for fatigue strength, ΔσLM71 = the stress range associated to load model 71,
and λ = the fatigue damage equivalent factor related to 2·106 cycles

70
With increased transition ratio, the fatigue damage of the longest hanger
decreases and ensured the fatigue strength, as listed in Table 4.6.
Table 4. 6 The fatigue damage for the longest hanger at the transition parts
Analysis case
Stress range of the longest hanger
Δσ71(Mpa)
Equivalent stress range
ΔσE,2(Mpa)
Fatigue damage D<1.0
Lt/ Lc =0.00 238 145 1.2
Lt/ Lc =0.02 186 113 0.3
Lt/ Lc =0.14 149 91 0.1
Lt/ Lc =0.32 127 77 0.03
Lt/ Lc =0.45 127 77 0.03
Fig 4.16 gives the secondary stress (Lee and Kim, 2015) of main cable at the
cable bands of first and center position under equal dead load distribution ratio at
the transition parts. The maximum secondary stress of main cable at the position of
center band is largest and within the allowable stress. As the transition part
increases, the secondary stress of main cable at the position of center band reduces.
Fig. 4. 16 Secondary stress of main cable at cable bands with transiton ratio

71
(2) Effect of dead load distribution ratio in the transition parts
The maximum tension amplitude of the longest hangers for analysis cases
considered the different dead load distribution ratio, as listed in Table 4.7.
S60H40_Constrant, which is applying a constant dead load distribution ratio to
40% for hangers in transition parts, is smallest (1.31Mpa) and within the allowable
fatigue strength.
Table 4. 7 The fatigue damage for the longest hanger at the transition parts
Analysis case Amplitude of tension(MN)
Ratio Fatigue damage D<1.0
S60H40_Constant 1.31 0.85 0.01
S60H40_Varing(50to30%) 1.48 0.96 0.01
S50H50_Constant 1.35 0.88 0.01
S50H50_Varing(60to40%) 1.54 1.00 0.02
Fig 4.17 gives the secondary stress of main cable at the cable bands of first and
center position under different dead load distribution ratio at the transition parts.
The maximum secondary stress of main cable at the position of center band is
largest and within the allowable stress. Based on the secondary stress of main cable,
analysis models of S50h50_Constant is promising to reduce the secondary stress of
main cable.

72
Fig. 4. 17 Secondary stress of main cable at cable bands with different load distribution ratio
In conclusion, a set-up of transition part can reduce the amplitude of hanger
tension and secondary stress of main cable. The result shows that 32% of transition
part-to-cable-stayed part ratio (Lt/Lc) is more effective to mitigate tension
amplitude of the longest hanger. However, the tension amplitude of longest hanger
turns to increase when transition part exceeds 32%. This characteristic should be
considered to design of transition part in cable-stayed suspension bridges. In order
to reduce the secondary stress of main cable, equal dead load distribution of each
pair of stay cables and hangers at the same point on the deck is effective.
73
4.3 Dynamic characteristics
The seven bridges analysis models with various suspension-to-span ratio have
conducted a free vibration analysis to obtain modal parameters and structural
geometric nonlinearity is also considered.
Fig. 4.18 shows comparison of main natural frequencies for those bridge
analysis models. In Fig. 4.18, the notation of V, L, and T indicates the mode of
Vertical, Lateral, and Torsional, respectively. Also, the notation of S and AS
indicates the symmetric and asymmetric, respectively. The 1st modal frequencies of
vertical, lateral, and torsional for cable-stayed suspension bridges, which indicate
the bridge analysis model of Ls/L=0.22 to Ls/L=0.77, are all between the bridge
model of Ls/L=0.00 and Ls/L=1.00, but its natural frequencies much greater than
bridge model of Ls/L=1.00m due to the cable-stayed part in bridge model of
Ls/L=0.22 to Ls/L=0.77 helps to improve the vertical and torsional rigidity.
However, the 1st symmetric torsional frequency of deck gradually decreases with
increase of suspended portion in main span due to the vertical cable plane
positioned inside of the bridge deck, as shown in Fig. 3.1.(b).
Under same main span, structural rigidity of Ls/L=0.22 is greater than other
bridge models. It means that the suspension-to-span ratio of 0.22 is effective for the
increase of overall rigidity of structure.

74
Fig. 4. 18 Comparison of natural frequencies of seven sample bridge models

75
4.4 Effect of suspension-to-span ratio on the aerostatic stability
In order to fully understand the wind stability of cable-stayed suspension
bridges, the effects of suspension-to-span ratio on the aerostatic stability are
investigated, and its favorable values are discussed.
The seven bridges analysis models with various suspension-to-span ratio have
conducted nonlinear static analysis under the wind attack angle of 0°, and the deck
maximum vertical, lateral and torsional displacements at the center of main span
with increasing wind speed are compared.
Fig. 4.19~4.21 shows lateral displacements, vertical displacement, and
rotational angle of the deck at the center of mid-span of the seven bridges analysis
models, respectively. The displacement curves under different suspension-to-span
ratio are approximately equivalent, which indicates that suspension-to-span ratio
has little effect on the aerostatic stability in this example bridge case. However, the
lateral displacement of the deck increases with the decrease of suspension-to-span
ratio under the same wind velocity, as shown in Fig. 4.19. Both the vertical
displacement and torsional angle of bridge deck increase with suspension-to-span
ratio increase under the same wind velocity, as shown in Fig. 4.20~4.21. When the
wind velocity is over 120 m/s, the torsional displacement of bridge analysis case of
Ls/L=0.77becomes prominent.

76
Fig. 4. 19 The lateral displacement of the deck at the center of mid-span
Fig. 4. 20 The vertical displacement of the deck at the center of mid-span
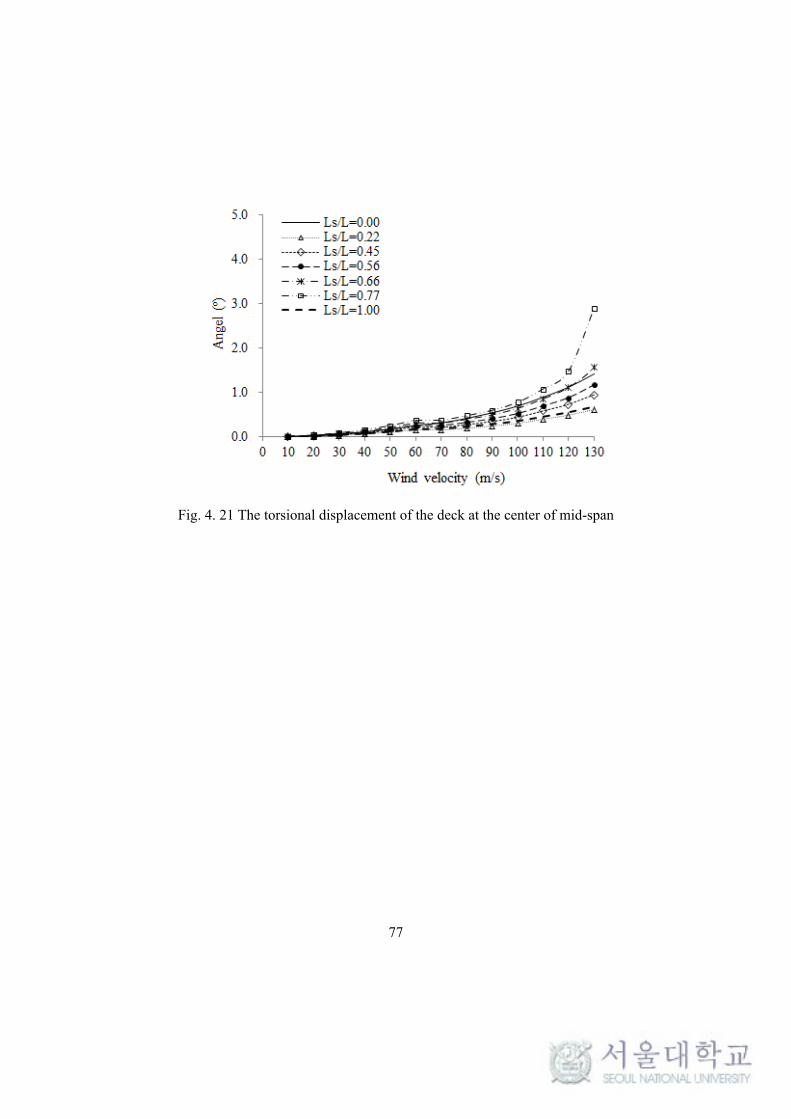
77
Fig. 4. 21 The torsional displacement of the deck at the center of mid-span

78
4.5 Summary and discussion
Parametric study is carried out. Two design parameters such as suspension-to-
span ratio and length of transition part are considered and studied for their effects
on the structural behavior under live loads consisting of trains and road vehicles.
The overall results are as follows.
1. The effective suspension to span ratio is 22~56% from the point of view of
improvement of vertical displacement by train load.
2. Increasing the suspension-to-span ratio provides extremely high negative
bending moment of deck at the junction between cable-stayed parts and
suspended part. The tension of longest hanger also rapidly increases due to
the stiffness difference between two structural systems. In order to
mitigate the rapid stiffness change, transition part is required to install
crossing hanger at the cable-stayed parts.
3. Increase of the transition part can mitigate the rapid change of tension of
the longest hanger near to the junction. This mitigation effect is valid up to
the transition part of 32%. However, as the transition part exceeds 32%,
tension amplitude of the longest hanger rather tends to increase.
4. An equally distributed dead load in transition parts is efficient to reduce
the secondary stress of main cable.

79
5. The vertical and torsional stiffness of cable-stayed suspension bridges is
relatively larger than suspension bridge (Ls/L=1.00) based on the dynamic
characteristics analysis. It results from the effect of cable-stayed part. For
the structural rigidity in this example bridge case, suspension-to-span ratio
of 0.22% is greater than that of conventional bridges, such as cable-stayed
bridges and suspension bridges.
6. The suspension-to-span ratio has little effect on the aerostatic stability in
this example bridge case
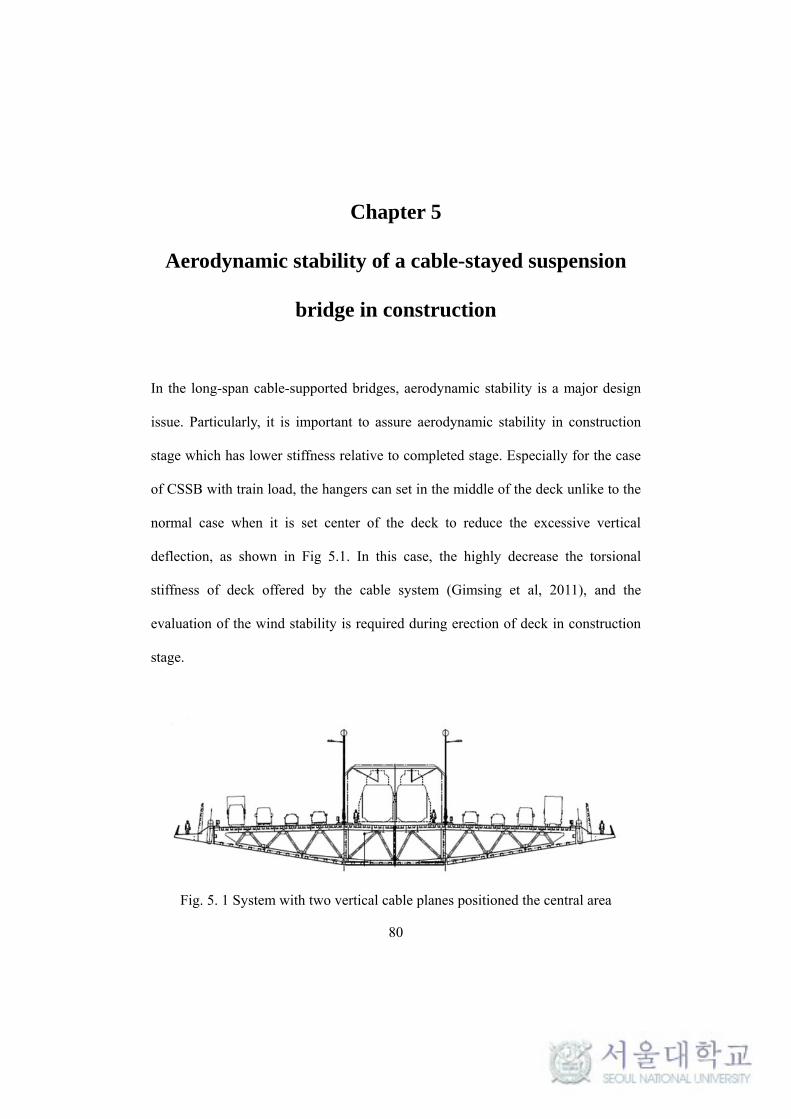
80
Chapter 5
Aerodynamic stability of a cable-stayed suspension
bridge in construction
In the long-span cable-supported bridges, aerodynamic stability is a major design
issue. Particularly, it is important to assure aerodynamic stability in construction
stage which has lower stiffness relative to completed stage. Especially for the case
of CSSB with train load, the hangers can set in the middle of the deck unlike to the
normal case when it is set center of the deck to reduce the excessive vertical
deflection, as shown in Fig 5.1. In this case, the highly decrease the torsional
stiffness of deck offered by the cable system (Gimsing et al, 2011), and the
evaluation of the wind stability is required during erection of deck in construction
stage.
Fig. 5. 1 System with two vertical cable planes positioned the central area
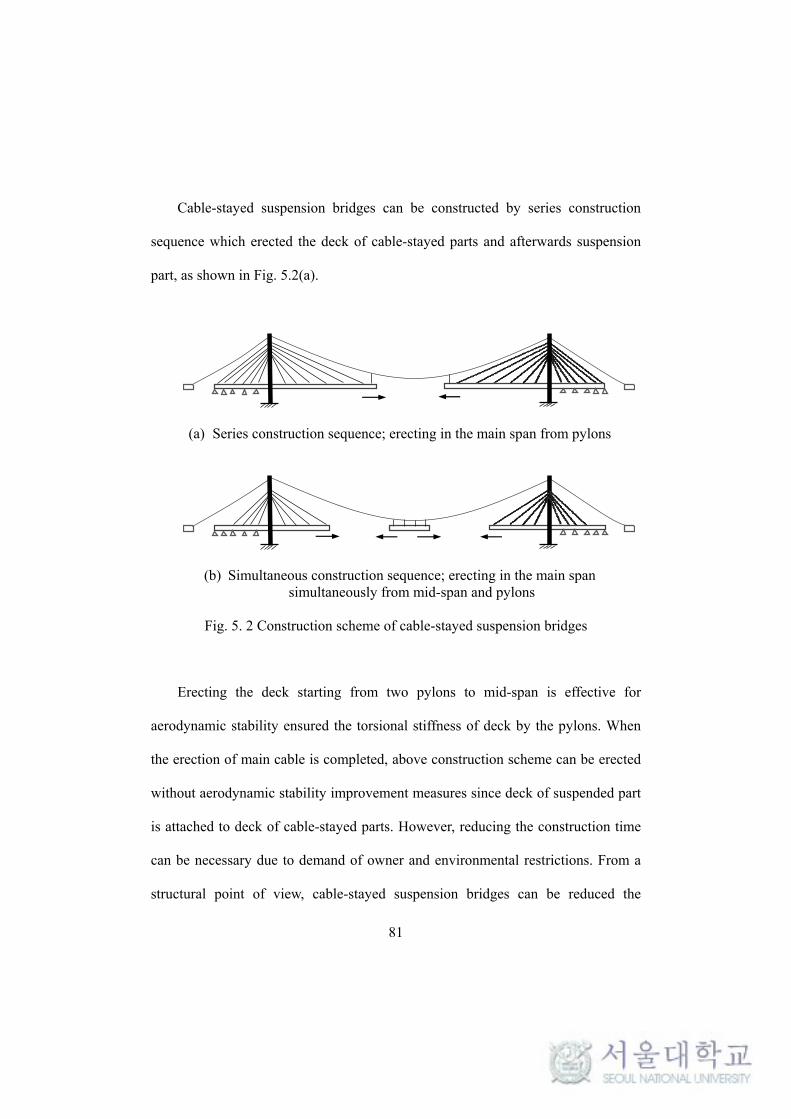
81
Cable-stayed suspension bridges can be constructed by series construction
sequence which erected the deck of cable-stayed parts and afterwards suspension
part, as shown in Fig. 5.2(a).
(a) Series construction sequence; erecting in the main span from pylons
(b) Simultaneous construction sequence; erecting in the main span simultaneously from mid-span and pylons
Fig. 5. 2 Construction scheme of cable-stayed suspension bridges
Erecting the deck starting from two pylons to mid-span is effective for
aerodynamic stability ensured the torsional stiffness of deck by the pylons. When
the erection of main cable is completed, above construction scheme can be erected
without aerodynamic stability improvement measures since deck of suspended part
is attached to deck of cable-stayed parts. However, reducing the construction time
can be necessary due to demand of owner and environmental restrictions. From a
structural point of view, cable-stayed suspension bridges can be reduced the

82
construction period by erecting in the main span deck simultaneously from
suspended part and cable-stayed parts after completed erection of main cables, as
shown in Fig. 5.2(b).
However, it is required both to verify the aerodynamic stability on the
construction phase of suspended deck and to find the potential improvement
measures in the aerodynamic stability for the erection of the deck in suspended part.
Therefore, it is necessary to investigate applicable aerodynamic stability
enhancement measures.
In this paper, X-Type bracing, Rigid beam and Strut system are considered as
structural stabilization measures from the literature survey (Honda et al., 1998;
Nakamura, 2006; Kubo, 2007; Xiang and Ge, 2007).
This study investigates the aerodynamic stability during construction of a
cable-stayed suspension bridge. The considered example bridge can be found in
Chapter 3. Erecting the bridge decks of this example bridge structure can be used
two construction plans such as series construction sequence and simultaneous
construction sequence, as shown in Fig. 5.2. With two construction plans,
aerodynamic stability on the erection of main span decks is investigated in
condition of completed erection of pylons and side span decks.
Since the bridge structure is subjected to a large displacement during
construction, the structural geometry and internal forces of members should be
reasonably simulated for the investigation of aerodynamic stability for specific
construction steps. The SNUSUS (Kim, 1993), an in-house program developed in

83
Structural Design Laboratory at Seoul National University (SNU) for a
construction step analysis of suspension bridge, is utilized for this purpose. The
main cables, hangers, and stay cables are modeled with an elastic catenary cable
element (Irvine, 1981), which is rigorously formulated based on an unstrained
length. The girders and pylons are modeled with a 3-D frame element (Kim, 1993;
Kim et al. 2004). The structural system can be changed by a series of construction
commands and the static analysis is performed considering the geometric nonlinear
properties of the strain-hardening structure.
The initial equilibrium state for the completed structure is established by
practical method as mentioned in chapter 3. Overall geometry and internal forces
introduced were confirmed to be in a reasonable range.
The construction stage is simulated by a backward analysis from the initial
equilibrium state by eliminating structural components in a reverse order of
erection sequences. When an equilibrium status is realized for a construction stage,
a free vibration analysis is followed to obtain modal parameters for further
buffeting analysis of the structural stage. The aerodynamic stability of the
structures in construction is evaluated by BUFFET2 (Kim, 2004; 2013), a buffeting
analysis program developed by Structural Design Laboratory at SNU, with the
modal and structural information delivered from SNUSUS. The design wind
velocity for construction stage is determined to be 40.66 m/s at the deck level of
75m for sea wind. The von Karman spectra are used to describe the wind velocity
fluctuations (von Karman, 1948).

84
=
u u
2 2 5 / 6u u
f S ( f ) 4 f
( 1 70.8 f )
(5.1a)
=
2n n u
2 2 11 / 6n u
f S ( f ) 4 f ( 1 755.2 f ), n=v ,w
( 1 283.2 f )
(5.1b)
where /
xfu nf f L V , f = natural frequency; xf
nL = the integral length scale of
the relevant turbulence component of u, v, and w in the xf wind direction.
The turbulence intensities and integral length scales are assumed to be 10%
and 5% and 183 m and 15 m for the u and w components, respectively. The
coherence of wind velocity fluctuations between two separated points are modeled
with function as (Simiu and Scanlan, 1996)
, )( )
B AA B
cff
V z
x xCoh(x , x ) = exp(- (5.2)
in which, the constant c is taken as 8.
The scientific and Technical Centre for Building (CSTB) at Nantes wind
tunnel performed wind tunnel tests with a 1:100 scaled model of investigated
bridge (Greisch, 2013). The aerostatic coefficients are listed in Table 5.1.
The self-excited drag force is evaluated based on the quasi-steady theory. The
self-excited lift and pitching moment are calculated based on the flutter derivatives
derived from Theodorsen function in terms of the reduced wind velocity U/nB,

85
where n is the natural frequency of the bridge deck. The quasi steady theory applies
to the drag component ( *1 2 /DP C K ). The aerodynamic admittance of the
bridge deck section is taken as unity in all cases in a conservative aspect. The
modal damping ratio is assumed to be 0.32% in all considered mode. Only the
aerodynamic forces acting on the bridge deck are included for the buffeting
analysis.
Table 5. 1 Static coefficient for bridge members
Members CD
(0°) CL
(0°) CM
(0°) CD'
(-2°~2°)CL'
(-2°~2°)CM'
(-2°~2°) Note
Deck 0.0323 -0.2369 -0.0024 -0.1432 5.4496 1.3789 Wind tunnel
Main cable
0.7 - - - - - Circular shape Stayed
cable 0.7 - - - - -
Hanger 0.7 - - - - -

86
5.1 Description of construction scheme
Two construction plans such as series construction sequence (Construction
Plan 0) and simultaneous construction sequence (Construction Plan 1) can be used
erecting the bridge decks of this example bridge structure, as shown in Fig 5.3 and
5.4. Based on completed erection of pylons and the side span decks, seven erection
stages were selected for each construction plan. Expected construction period of
each construction plan is calculated by ideal construction sequence and is
compared. The notation of ES, D, P0, and P1 in Fig 5.3~5.4 are indicated erection
stage, deck segment number and each construction plan, respectively.
For Construction Plan 0, the deck of main span erection proceeds from cable-
stayed parts to suspension part. The erection phase was divided into 7 stages, and
described as follows:
Erection stage (ES) 1: The pair of deck segments D0 to D12 and 24 stay cables in
each cable plan are installed.
ES2: The pair of decks D20 and the stay cables S20 are installed.
ES3: The main cable completed. The pair of decks d21 and the hangers H21 is
installed.
ES4: The pair of decks D23 and the hangers H23 is installed.
ES5: The pair of decks D25 and the hangers H25 is installed.
ES6: The pair of decks D28 and the hangers H28 is installed.
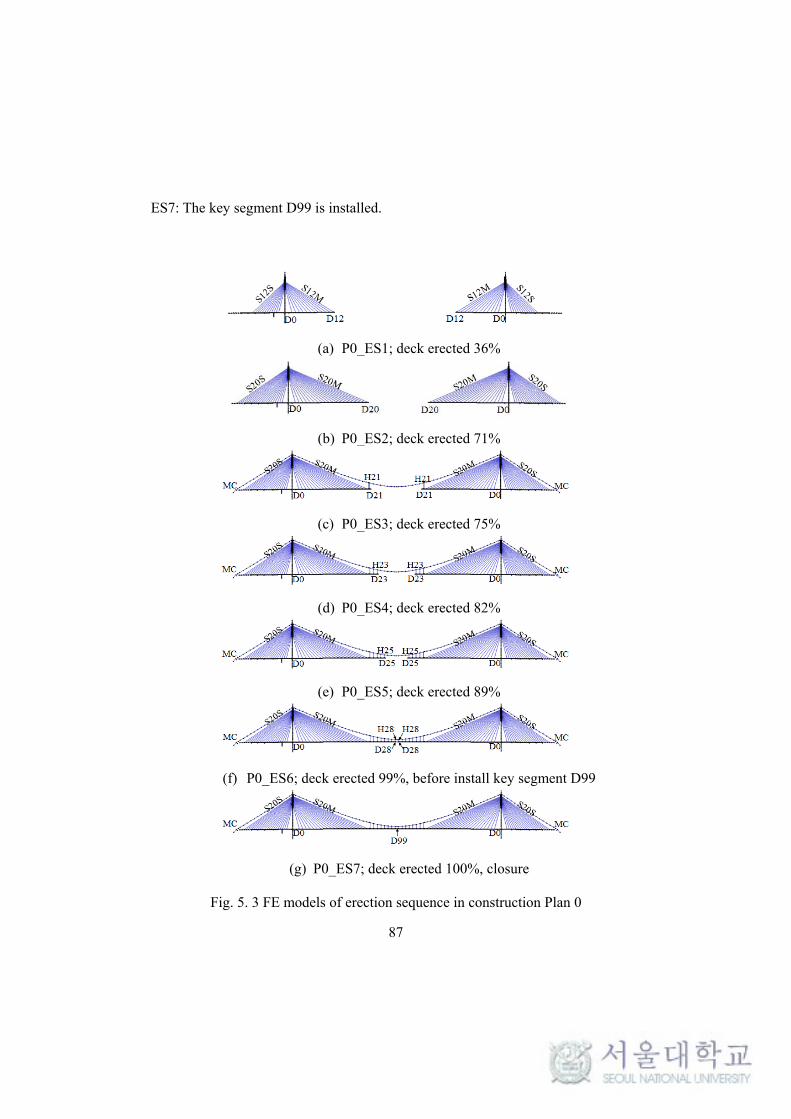
87
ES7: The key segment D99 is installed.
(a) P0_ES1; deck erected 36%
(b) P0_ES2; deck erected 71%
(c) P0_ES3; deck erected 75%
(d) P0_ES4; deck erected 82%
(e) P0_ES5; deck erected 89%
(f) P0_ES6; deck erected 99%, before install key segment D99
(g) P0_ES7; deck erected 100%, closure
Fig. 5. 3 FE models of erection sequence in construction Plan 0
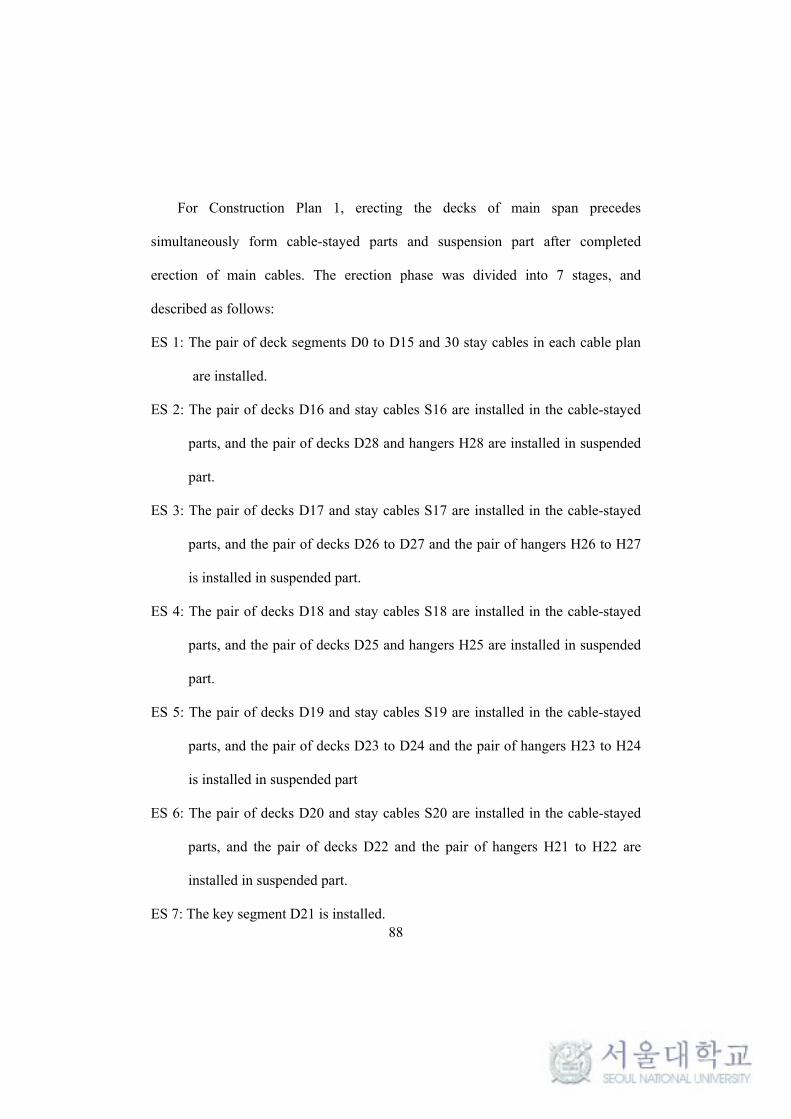
88
For Construction Plan 1, erecting the decks of main span precedes
simultaneously form cable-stayed parts and suspension part after completed
erection of main cables. The erection phase was divided into 7 stages, and
described as follows:
ES 1: The pair of deck segments D0 to D15 and 30 stay cables in each cable plan
are installed.
ES 2: The pair of decks D16 and stay cables S16 are installed in the cable-stayed
parts, and the pair of decks D28 and hangers H28 are installed in suspended
part.
ES 3: The pair of decks D17 and stay cables S17 are installed in the cable-stayed
parts, and the pair of decks D26 to D27 and the pair of hangers H26 to H27
is installed in suspended part.
ES 4: The pair of decks D18 and stay cables S18 are installed in the cable-stayed
parts, and the pair of decks D25 and hangers H25 are installed in suspended
part.
ES 5: The pair of decks D19 and stay cables S19 are installed in the cable-stayed
parts, and the pair of decks D23 to D24 and the pair of hangers H23 to H24
is installed in suspended part
ES 6: The pair of decks D20 and stay cables S20 are installed in the cable-stayed
parts, and the pair of decks D22 and the pair of hangers H21 to H22 are
installed in suspended part.
ES 7: The key segment D21 is installed.

89
(a) P1_ES1; deck erected 54%
(b) P1_ES2; deck erected 61%
(c) P1_ES3; deck erected 72%
(d) P1_ES4; deck erected 79%
(e) P1_ES5; deck erected 89%
(f) P1_ES6; deck erected 96%, before install key segment D21
(g) P1_ES7; deck erected 100%, closure
Fig. 5. 4 FE models of erection sequence in construction Plan 1

90
Based on the each construction plan, construction period for the erection of
main span decks is calculated, as listed in Table 5.2 and 5.3. When calculated
construction duration, the cable-stayed parts is assumed to use free cantilever
method by derrick crane and 1cycle of 10days for erection of the deck (i.e., lift and
erect of deck segment is 1day, install stay cable is 3days, welded deck segment is
6days). Otherwise, the suspension part is considered to use strand jack method for
the lifting of deck segment and 1cycle of 7days for erection of the deck (i.e., lift
and erect of deck segment, install hanger is 1day, welded deck segment is 6days).
Fig. 5.5 and 5.6 show deck erection method to estimate the construction period.
Fig. 5. 5 Deck erection by derrick crane
Fig. 5. 6 Deck erection by lifting gantry
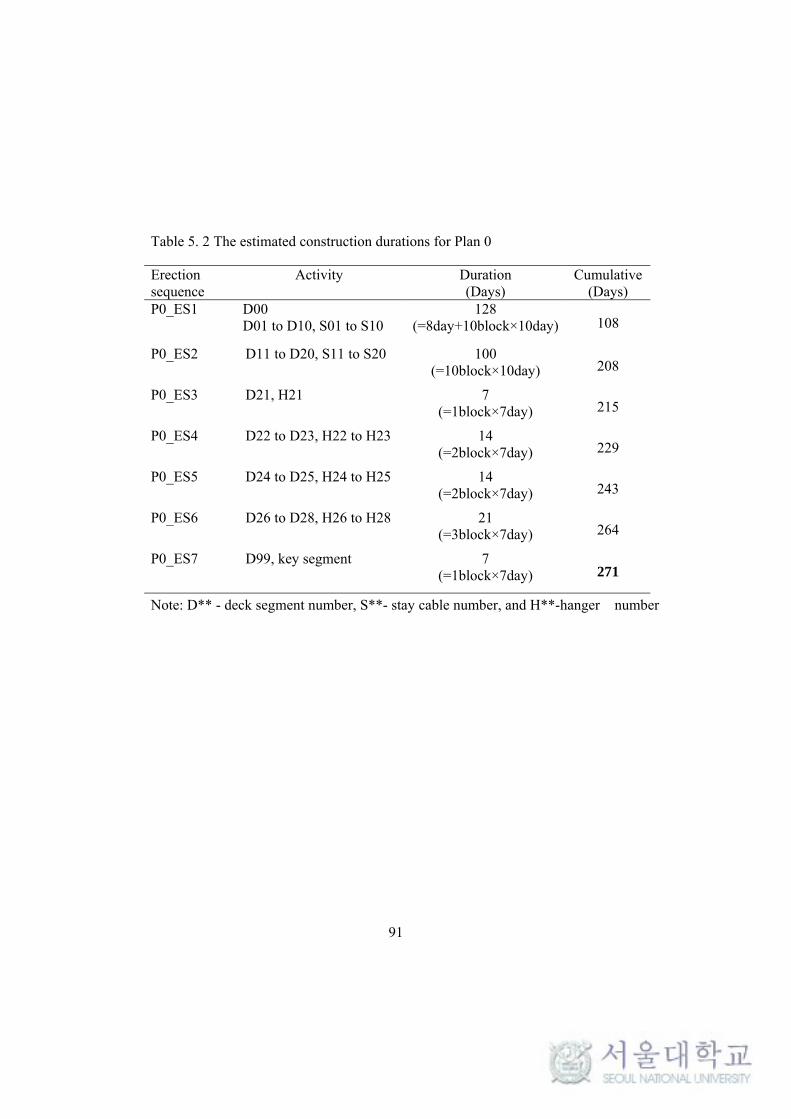
91
Table 5. 2 The estimated construction durations for Plan 0
Erection sequence
Activity
Duration (Days)
Cumulative (Days)
P0_ES1 D00 D01 to D10, S01 to S10
128 (=8day+10block×10day) 108
P0_ES2 D11 to D20, S11 to S20 100 (=10block×10day) 208
P0_ES3 D21, H21 7 (=1block×7day) 215
P0_ES4 D22 to D23, H22 to H23 14 (=2block×7day) 229
P0_ES5 D24 to D25, H24 to H25 14 (=2block×7day) 243
P0_ES6 D26 to D28, H26 to H28 21 (=3block×7day) 264
P0_ES7 D99, key segment 7 (=1block×7day) 271
Note: D** - deck segment number, S**- stay cable number, and H**-hanger number

92
Table 5. 3 The estimated construction durations for Plan 1
Erection sequence
Activity
Duration (Days)
Cumulative (Days)
P1_ES1 D00 D01 to D15, S01 to S15
158 (=8day+15block×10day) 158
P1_ES2 D16, S16 D28, D99, and H28
10 (=1block×10day) 168
P1_ES3 D17, S17 D26 to D27, H26 to H27
14 (=2block×7day, 1block×10day)
182
P1_ES4 D18, S18 D25, H25
10 (=1block×10day,
1block×7day) 192
P1_ES5 D19, S19 D23 to D24, H23 to H24
14 (=2block×7day, 1block×10day)
206
P1_ES6 D20, S20 D22, H21 to H22
10 (=1block×10day,
1block×7day) 216
P1_ES7 D21, key segment 7 (=1block×7day) 223
Note: D** - deck segment number, S**- stay cable number, and H**-hanger number
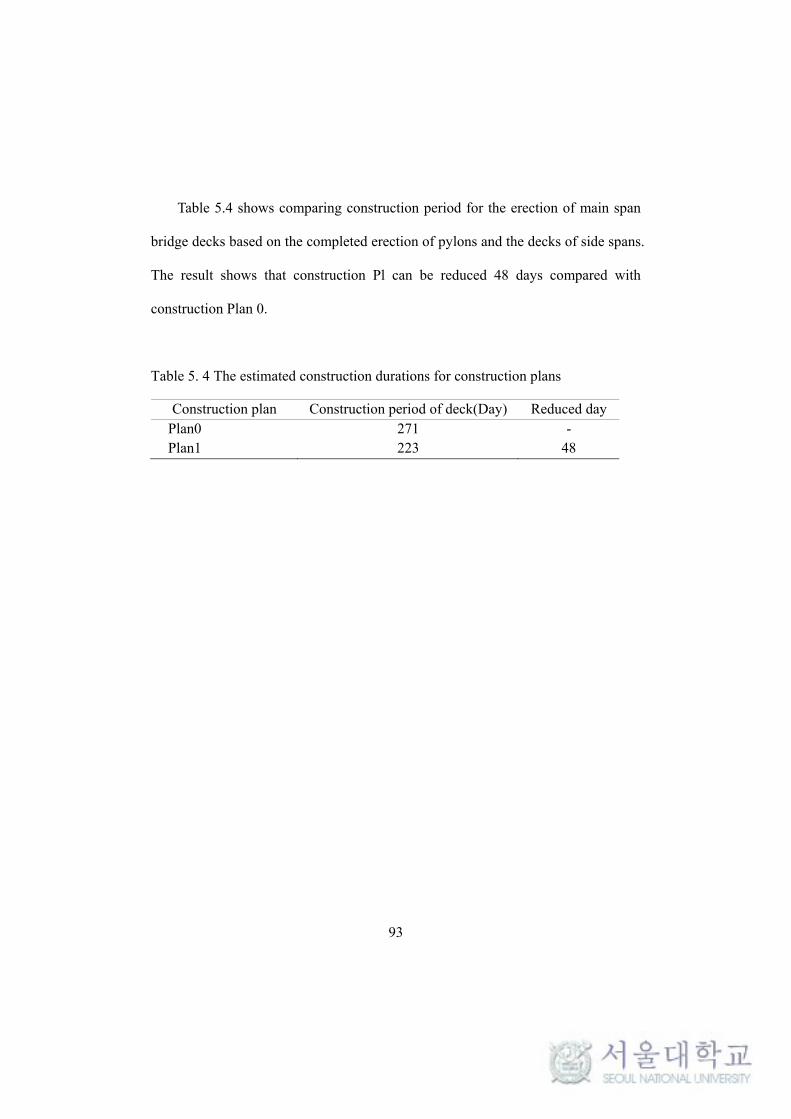
93
Table 5.4 shows comparing construction period for the erection of main span
bridge decks based on the completed erection of pylons and the decks of side spans.
The result shows that construction Pl can be reduced 48 days compared with
construction Plan 0.
Table 5. 4 The estimated construction durations for construction plans
Construction plan Construction period of deck(Day) Reduced day Plan0 271 - Plan1 223 48

94
5.3 Aerodynamic stability of construction Plan 0 (P0)
Based on the construction Plan0, aerodynamic stability in construction stages
is investigated by buffeting analysis focus on the torsional displacement of
suspended decks.
(1) Aerodynamic stability of construction stage of P0_ES2
The construction stage of P0_ES2, which is the longest cable-stayed parts, is
erected pair of deck d00 to d20 and pair of stay cables S01 to S20. Fig. 5.7 shows
FE analysis mode of P0_ES2.
Fig. 5. 7 FE analysis model of P0_ES2
Fig. 5.8 shows some dominant vibration modes. The 1st torsional frequency for
P0_ES2 is 0.486 Hz.

95
Fig. 5. 8 The 1st torsional mode shapes for P0_ES2(f = 0.486Hz)
Fig. 5.9 gives the buffeting analysis results for construction stage of P0_ES2.
The result shows that the maximum rigid body rotational displacement of deck
under buffeting is dominant than mean wind load. Under the combined effect of
mean wind and buffeting load, the maximum rigid body rotational displacement of
deck rises as the wind velocity is increased. The maximum rigid body rotational
displacement of deck is 0.8° at design wind speed of 41m/s and divergence not
occurred.
Fig. 5. 9 The maximum torsional displacement at the tip of the deck for P0_ES2

96
(2) Aerodynamic stability of construction stage of P0_ES6
Erection stage of P0_ES6, which is before closing of the bridge at the main
span center, is erected pair of deck d00 to d28, pair of stay cables S01 to S20, and
pair of hangers H21 to H28, as shown in Fig. 5.10.
Fig. 5. 10 FE analysis model of P0_ES6
Fig. 5.11 shows some dominant vibration modes. The 1st torsional frequency
for P0_ES6 is 0.319 Hz.
Fig. 5. 11 The 1st torsional mode shapes for P0_ES6(f = 0.319Hz)
Fig. 5.12 shows the buffeting analysis results for construction stage of P0_ES6.
The result shows that the maximum torsional displacement of deck under buffeting
is dominant than mean wind load. Under the combined effect of mean wind and

97
buffeting load, the maximum torsional displacement of deck rises as the wind
velocity is increased. The maximum torsional displacement of deck is 1.7° at
design wind speed of 41m/s and divergence not occurred.
Fig. 5. 12 The maximum torsional displacement at the tip of the deck for P0_ES6
Under critical construction stage of P0_ES2 and P0_ES6, the divergence of
torsional displacement of deck during erection stages is not found in design wind
speed of 41m/s. therefore, aerodynamic stability of construction Plan 0 is
investigated with seven erection stages, as shown in Fig. 5.3.
(3) Aerodynamic stability of construction Plan 0
Fig 5.13 shows the dominate frequency of torsion, lateral, and vertical of the

98
deck in each erection phase for construction Plan 0. As far as deck erection
increases, the dominant frequency of torsion, lateral, and vertical tends to be
reduced. This indicates that overall rigidity of bridge structure becomes smaller.
Especially, torsional frequency declines dramatically in the deck erection of
suspended part.
Fig. 5.14~5.16 shows the maximum torsional displacement, lateral
displacement, and vertical displacement at the tip of cantilever deck under wind
load, respectively.
Fig. 5. 13 The dominant frequency of deck for construction Plan 0
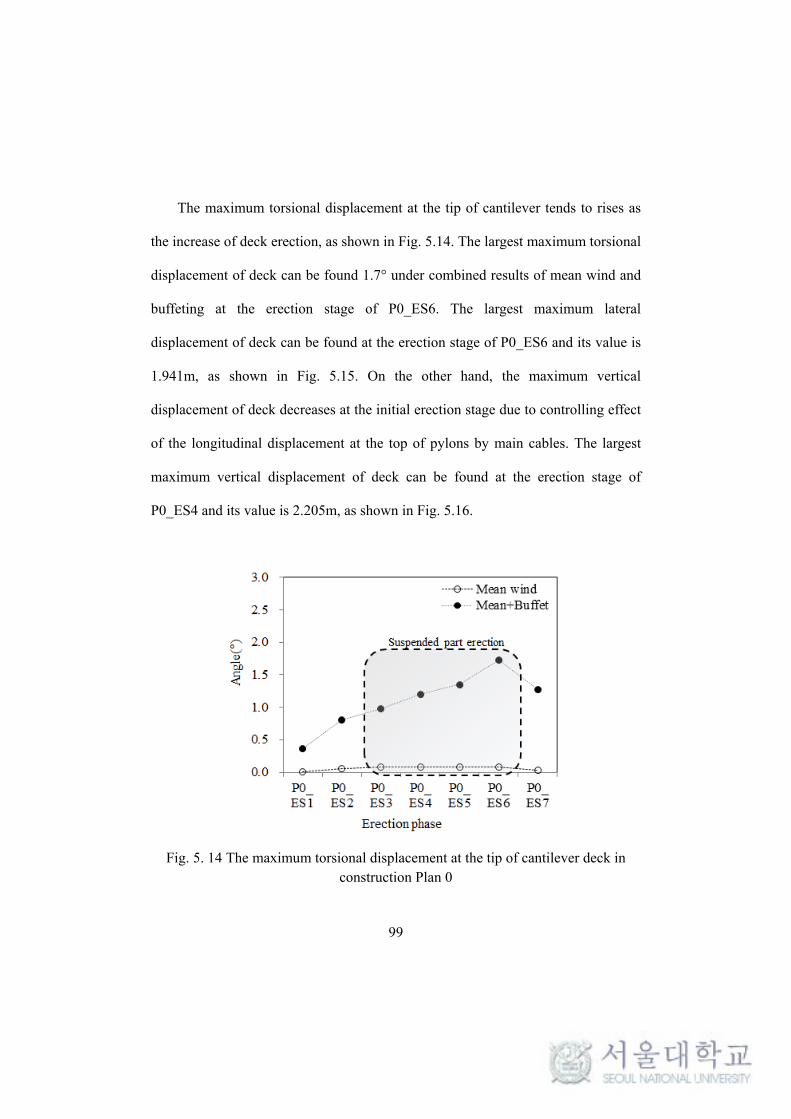
99
The maximum torsional displacement at the tip of cantilever tends to rises as
the increase of deck erection, as shown in Fig. 5.14. The largest maximum torsional
displacement of deck can be found 1.7° under combined results of mean wind and
buffeting at the erection stage of P0_ES6. The largest maximum lateral
displacement of deck can be found at the erection stage of P0_ES6 and its value is
1.941m, as shown in Fig. 5.15. On the other hand, the maximum vertical
displacement of deck decreases at the initial erection stage due to controlling effect
of the longitudinal displacement at the top of pylons by main cables. The largest
maximum vertical displacement of deck can be found at the erection stage of
P0_ES4 and its value is 2.205m, as shown in Fig. 5.16.
Fig. 5. 14 The maximum torsional displacement at the tip of cantilever deck in construction Plan 0

100
Fig. 5. 15 The maximum lateral displacement at the tip of cantilever deck in construction Plan 0
Fig. 5. 16 The maximum vertical displacement at the tip of cantilever deck in construction Plan 0
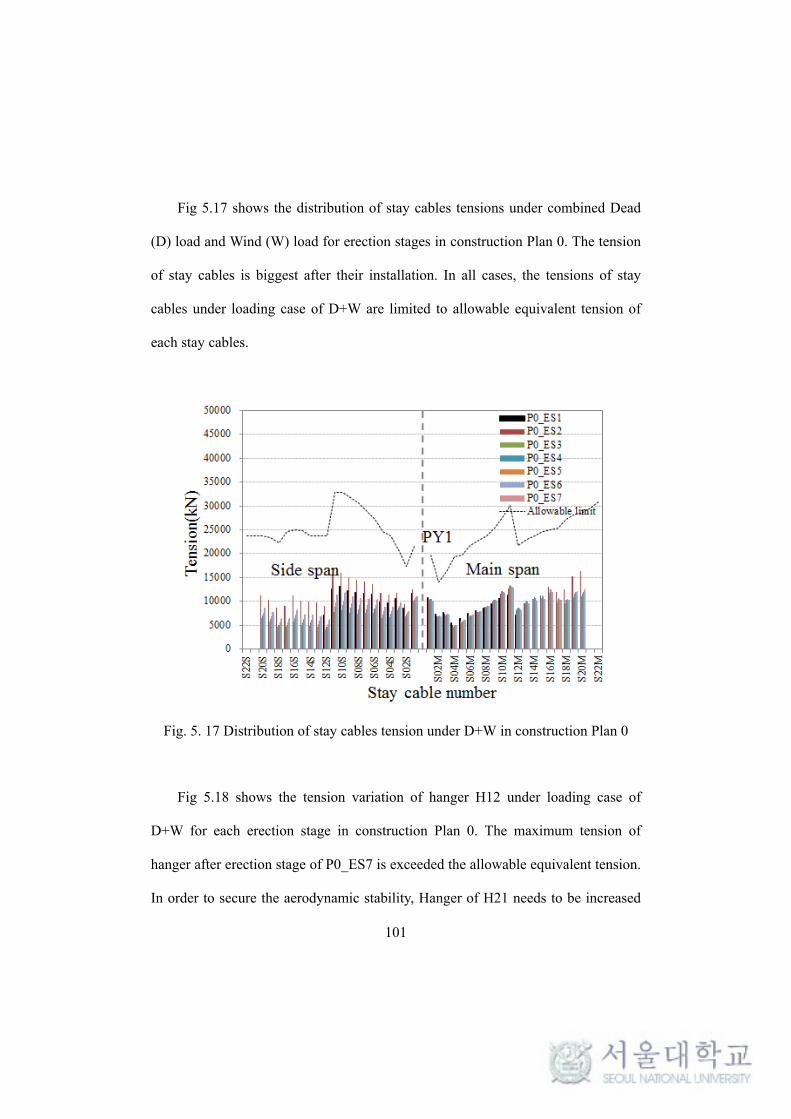
101
Fig 5.17 shows the distribution of stay cables tensions under combined Dead
(D) load and Wind (W) load for erection stages in construction Plan 0. The tension
of stay cables is biggest after their installation. In all cases, the tensions of stay
cables under loading case of D+W are limited to allowable equivalent tension of
each stay cables.
Fig. 5. 17 Distribution of stay cables tension under D+W in construction Plan 0
Fig 5.18 shows the tension variation of hanger H12 under loading case of
D+W for each erection stage in construction Plan 0. The maximum tension of
hanger after erection stage of P0_ES7 is exceeded the allowable equivalent tension.
In order to secure the aerodynamic stability, Hanger of H21 needs to be increased

102
of cross-sectional area or adjust its length of cable after their installation in erection
stage of P0_ES3 and P0_ES7. The maximum hanger tension increase up to 14571
kN for H21.
Fig. 5. 18 The tension variation of hanger H12 under D+W in construction P0
(4) Summary of aerodynamic stability for construction Plan 0
The feasibility of suggested construction plan of deck in terms of aerodynamic
stability is examined. The torsional deformation under construction stage of
suspension part is less than 2 degree, which is stable. Aerodynamic stability
problems are not expected for the construction Plan 0 except the longest hanger of
H21. Hanger of H21 needs to be increased of cross-sectional area or adjust its
length of cable after erection phase of P0_ES3 and P0_ES7 to secure the
aerodynamic stability in construction Plan 0.
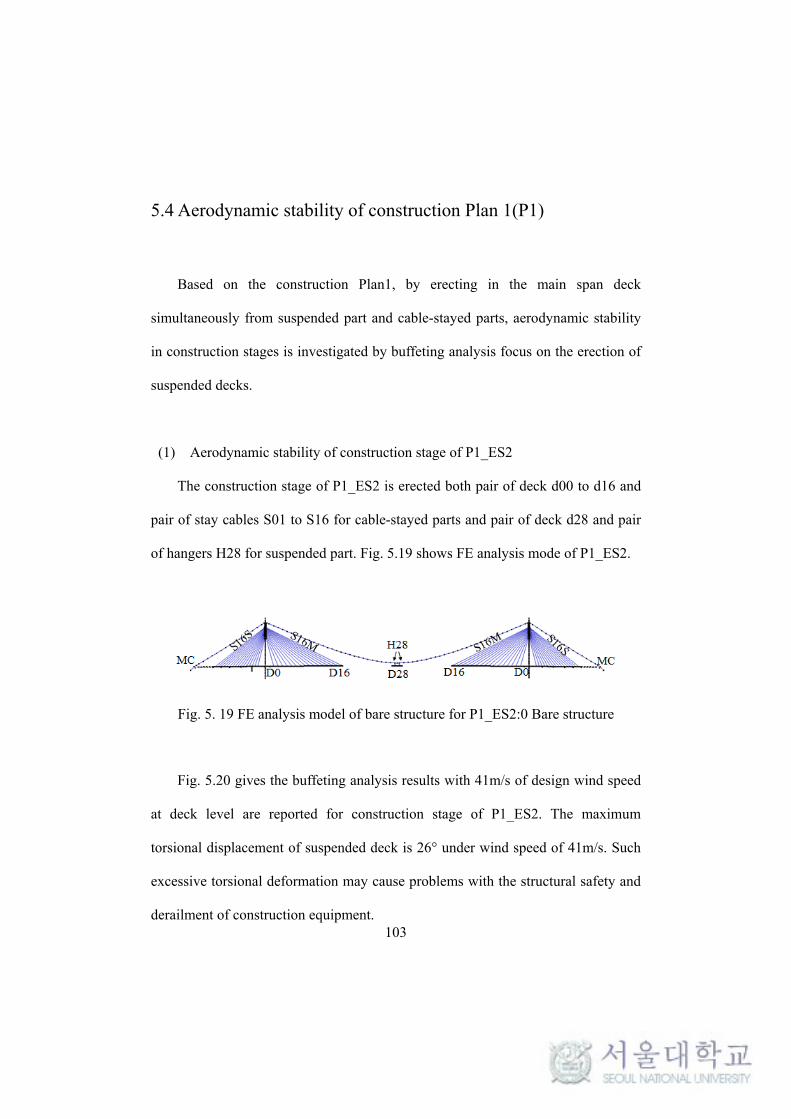
103
5.4 Aerodynamic stability of construction Plan 1(P1)
Based on the construction Plan1, by erecting in the main span deck
simultaneously from suspended part and cable-stayed parts, aerodynamic stability
in construction stages is investigated by buffeting analysis focus on the erection of
suspended decks.
(1) Aerodynamic stability of construction stage of P1_ES2
The construction stage of P1_ES2 is erected both pair of deck d00 to d16 and
pair of stay cables S01 to S16 for cable-stayed parts and pair of deck d28 and pair
of hangers H28 for suspended part. Fig. 5.19 shows FE analysis mode of P1_ES2.
Fig. 5. 19 FE analysis model of bare structure for P1_ES2:0 Bare structure
Fig. 5.20 gives the buffeting analysis results with 41m/s of design wind speed
at deck level are reported for construction stage of P1_ES2. The maximum
torsional displacement of suspended deck is 26° under wind speed of 41m/s. Such
excessive torsional deformation may cause problems with the structural safety and
derailment of construction equipment.
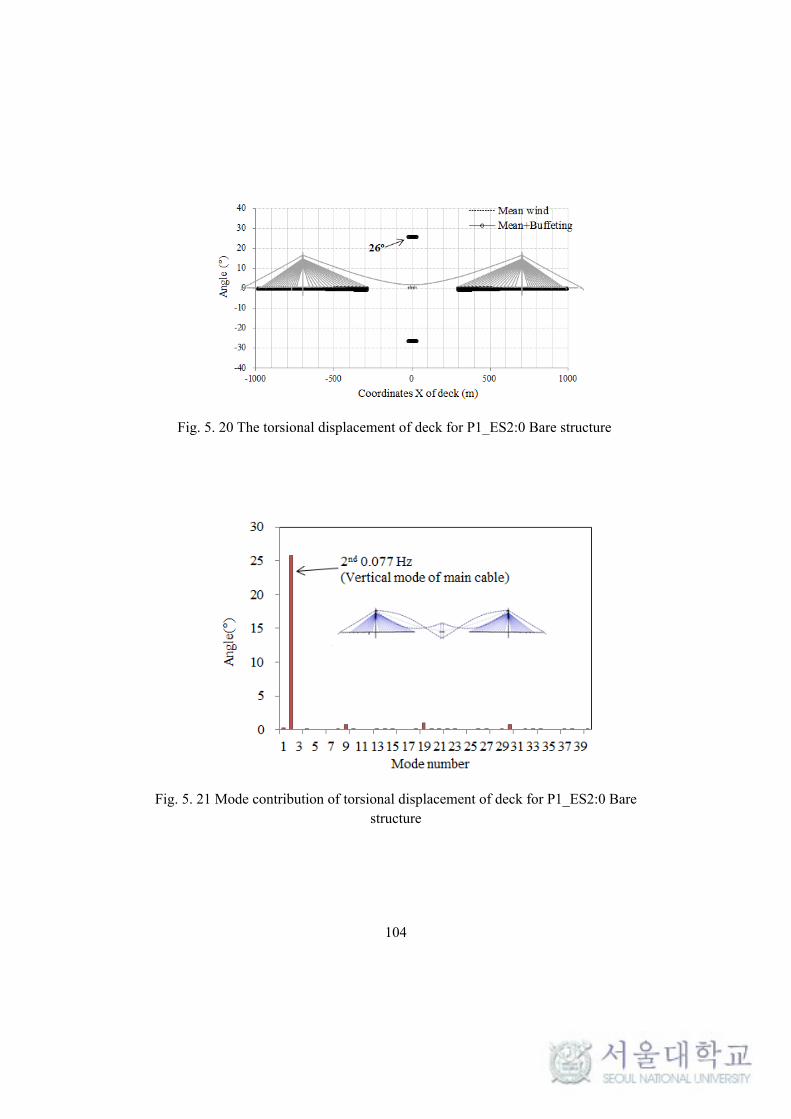
104
Fig. 5. 20 The torsional displacement of deck for P1_ES2:0 Bare structure
Fig. 5. 21 Mode contribution of torsional displacement of deck for P1_ES2:0 Bare structure

105
In order to analyze the main reason for the excessive torsional deformation of
the suspended deck, the responses contributions of modes are investigated. Fig.
5.21 shows that the most contribution mode for the torsional deformation of
suspended deck is the 1st vertical mode of main cable. Therefore, it is required
structural measures to reduce the torsional deformation of suspended deck by
controlling the 1st vertical mode of the main cable.
To overcome the above problem, several structural measures are proposed in
this paper such as X-Type bracing, Rigid beam and Strut system from the literature
survey (Honda et al., 1998; Nakamura, 2006; Kubo, 2007; Xiang and Ge, 2007).
(2) Increasing torsional stiffness by X-Type bracing for erection phase of
P1_ES2
In order to increase the torsional stiffness of the bridge deck, some hangers
connect each cable with the opposite side of the deck. These hangers are called X-
Type bracing(X-B) as shown in Fig. 5.22.
Fig. 5. 22 Increasing torsional stiffness by X-Type bracing for P1_ES2
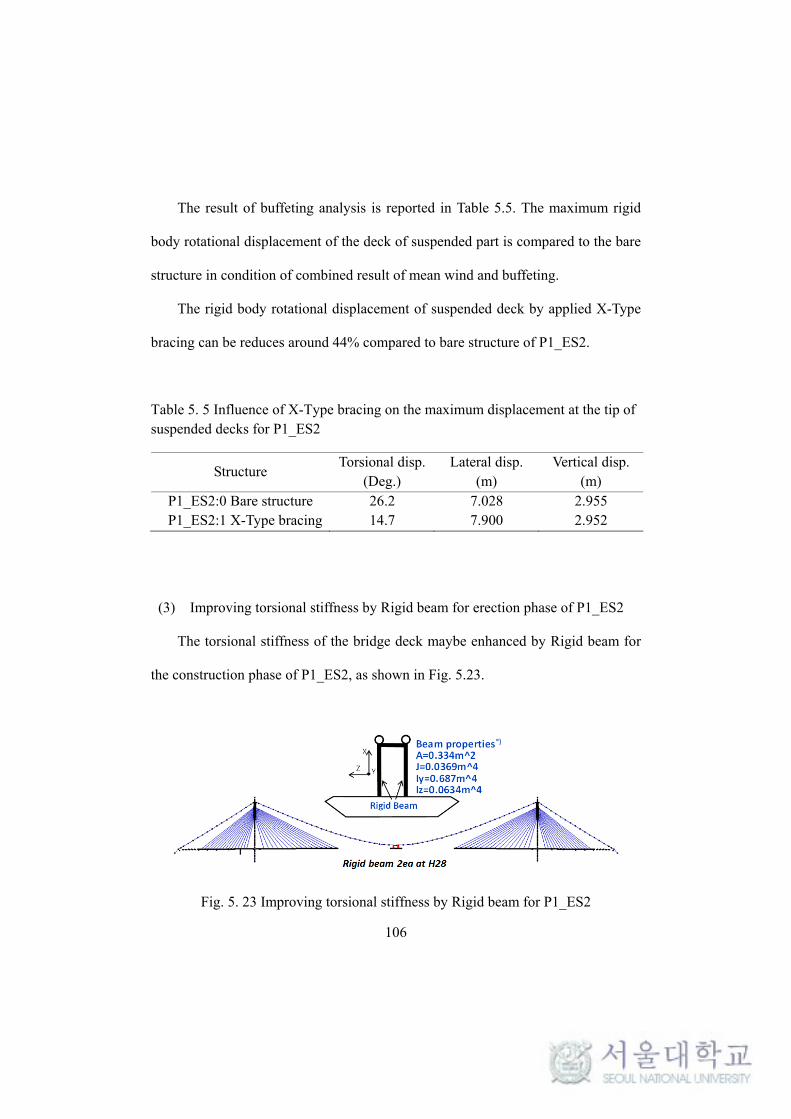
106
The result of buffeting analysis is reported in Table 5.5. The maximum rigid
body rotational displacement of the deck of suspended part is compared to the bare
structure in condition of combined result of mean wind and buffeting.
The rigid body rotational displacement of suspended deck by applied X-Type
bracing can be reduces around 44% compared to bare structure of P1_ES2.
Table 5. 5 Influence of X-Type bracing on the maximum displacement at the tip of suspended decks for P1_ES2
Structure Torsional disp.
(Deg.) Lateral disp.
(m) Vertical disp.
(m) P1_ES2:0 Bare structure 26.2 7.028 2.955 P1_ES2:1 X-Type bracing 14.7 7.900 2.952
(3) Improving torsional stiffness by Rigid beam for erection phase of P1_ES2
The torsional stiffness of the bridge deck maybe enhanced by Rigid beam for
the construction phase of P1_ES2, as shown in Fig. 5.23.
Fig. 5. 23 Improving torsional stiffness by Rigid beam for P1_ES2
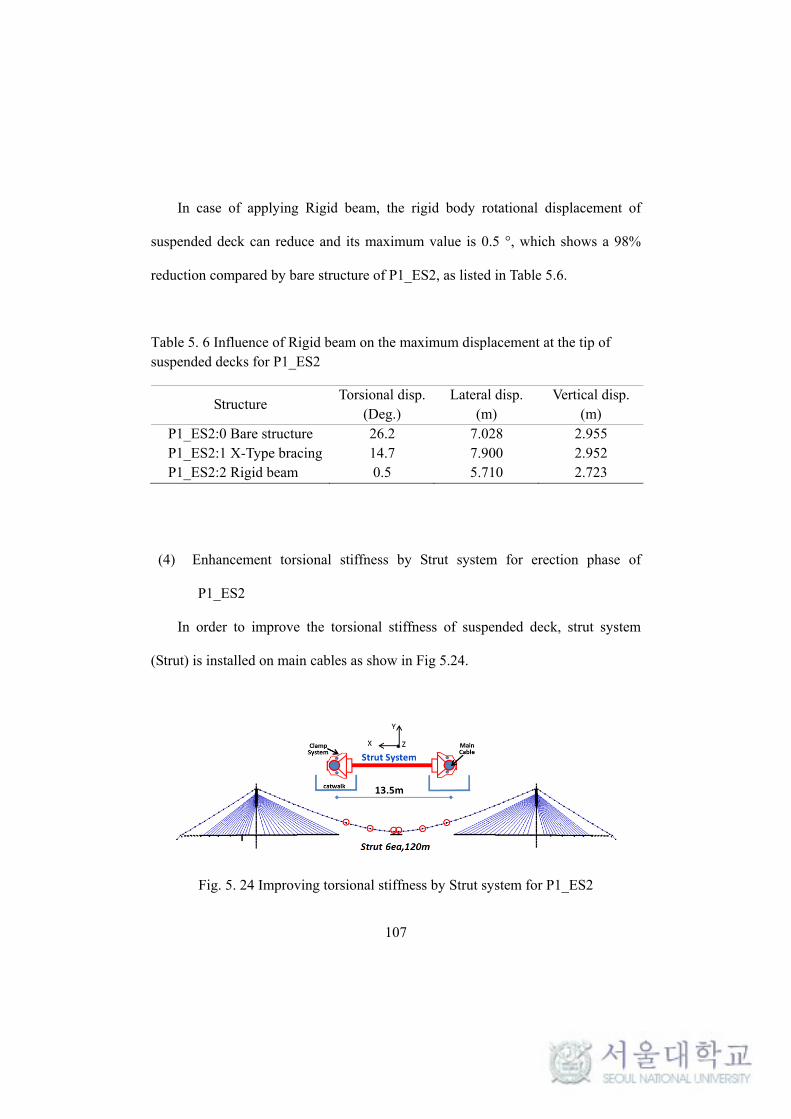
107
In case of applying Rigid beam, the rigid body rotational displacement of
suspended deck can reduce and its maximum value is 0.5 °, which shows a 98%
reduction compared by bare structure of P1_ES2, as listed in Table 5.6.
Table 5. 6 Influence of Rigid beam on the maximum displacement at the tip of suspended decks for P1_ES2
Structure Torsional disp.
(Deg.) Lateral disp.
(m) Vertical disp.
(m) P1_ES2:0 Bare structure 26.2 7.028 2.955 P1_ES2:1 X-Type bracing 14.7 7.900 2.952 P1_ES2:2 Rigid beam 0.5 5.710 2.723
(4) Enhancement torsional stiffness by Strut system for erection phase of
P1_ES2
In order to improve the torsional stiffness of suspended deck, strut system
(Strut) is installed on main cables as show in Fig 5.24.
Fig. 5. 24 Improving torsional stiffness by Strut system for P1_ES2
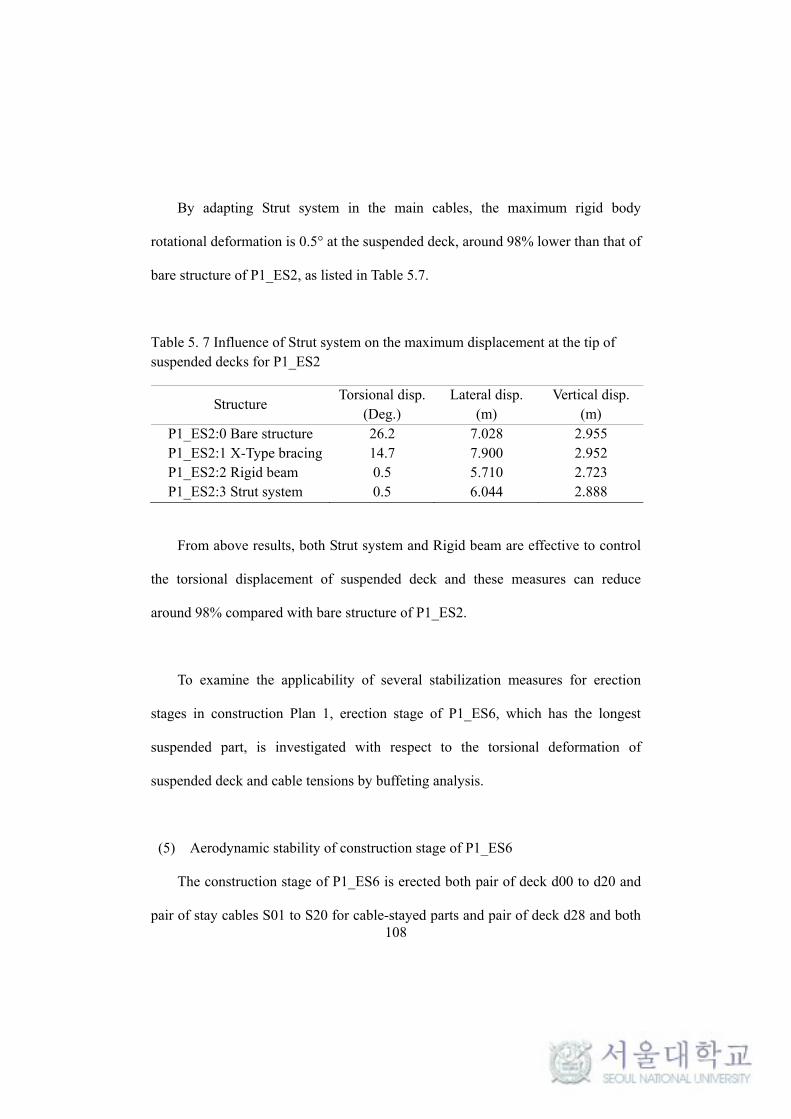
108
By adapting Strut system in the main cables, the maximum rigid body
rotational deformation is 0.5° at the suspended deck, around 98% lower than that of
bare structure of P1_ES2, as listed in Table 5.7.
Table 5. 7 Influence of Strut system on the maximum displacement at the tip of suspended decks for P1_ES2
Structure Torsional disp.
(Deg.) Lateral disp.
(m) Vertical disp.
(m) P1_ES2:0 Bare structure 26.2 7.028 2.955 P1_ES2:1 X-Type bracing 14.7 7.900 2.952 P1_ES2:2 Rigid beam 0.5 5.710 2.723 P1_ES2:3 Strut system 0.5 6.044 2.888
From above results, both Strut system and Rigid beam are effective to control
the torsional displacement of suspended deck and these measures can reduce
around 98% compared with bare structure of P1_ES2.
To examine the applicability of several stabilization measures for erection
stages in construction Plan 1, erection stage of P1_ES6, which has the longest
suspended part, is investigated with respect to the torsional deformation of
suspended deck and cable tensions by buffeting analysis.
(5) Aerodynamic stability of construction stage of P1_ES6
The construction stage of P1_ES6 is erected both pair of deck d00 to d20 and
pair of stay cables S01 to S20 for cable-stayed parts and pair of deck d28 and both

109
pair of deck d22 to d28 and pair of hangers H21 to H28 for suspended part. Fig.
5.25 shows FE analysis mode of P1_ES6.
Fig. 5. 25 FE analysis model of bare structure for P1_ES6:0 Bare structure
Fig. 5.26 gives mode contribution of torsional displacement of deck for
P1_ES6:0Bare structure. The most contribution mode for the torsional deformation
of suspended deck is 1st vertical mode of main cable. The maximum torsional
deformation of suspended deck is 9.9 ° at the design wind velocity of 41m/s.
As shown in Fig. 5.27, distribution of stay cable tensions for erection stage of
P1_ES6 is smaller than the allowable equivalent tension of each stay cable.
Otherwise tension of the longest hanger H21 is 11277 kN, which is exceeded
61% than the allowable equivalent tension of 7007 kN, as shown in Fig. 5.28.
Meanwhile, structural stabilization measures are needed for erection phase of
suspended deck under wind effects. Likewise, it is necessary to verify the hanger
stability under examination of the applicability of stabilization measures for
erection stages.

110
Fig. 5. 26 Mode contribution of torsional displacement of deck for P1_ES6:0 Bare structure
Fig. 5. 27 Distribution of stay cable tensions for P1_ES6
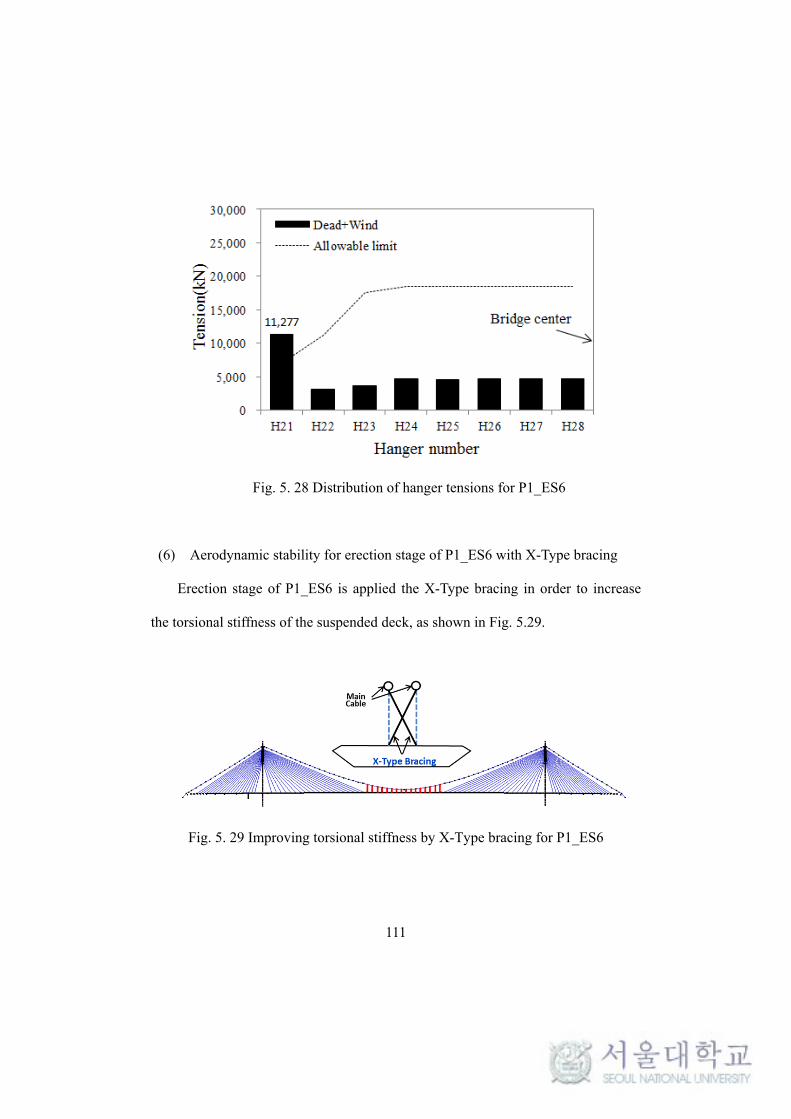
111
Fig. 5. 28 Distribution of hanger tensions for P1_ES6
(6) Aerodynamic stability for erection stage of P1_ES6 with X-Type bracing
Erection stage of P1_ES6 is applied the X-Type bracing in order to increase
the torsional stiffness of the suspended deck, as shown in Fig. 5.29.
Fig. 5. 29 Improving torsional stiffness by X-Type bracing for P1_ES6

112
The result of buffeting analysis is reported in Table 5.8. The maximum
torsional displacement of deck at the suspended part is compared to the bare
structure on condition of combined mean wind and buffeting responses.
Controlling of the torsional displacement of suspended deck by X-Type bracing is
effective and reduced around 34% compared than bare structure.
Table 5. 8 Influence of X-Type bracing on the maximum displacement at the tip of suspended decks for P1_ES6
Structure Torsional disp.
(Deg.) Lateral disp.
(m) Vertical disp.
(m) P1_ES6:0 Bare structure 9.9 6.019 2.753 P1_ES6:1 X-Type bracing 6.6 6.426 2.750
The tension in the hangers is smaller than the allowable equivalent tension of
each hanger under combined effect of D and W except the longest hanger of H21,
as shown in Fig. 5.30.
For the X-Type hangers, tension of the X-Type hanger in H21X to H26X
exceeds the allowable equivalent tension. So those X-Type hangers are required to
adjust its length of cable for each erection phase, as shown in Fig 5.31.
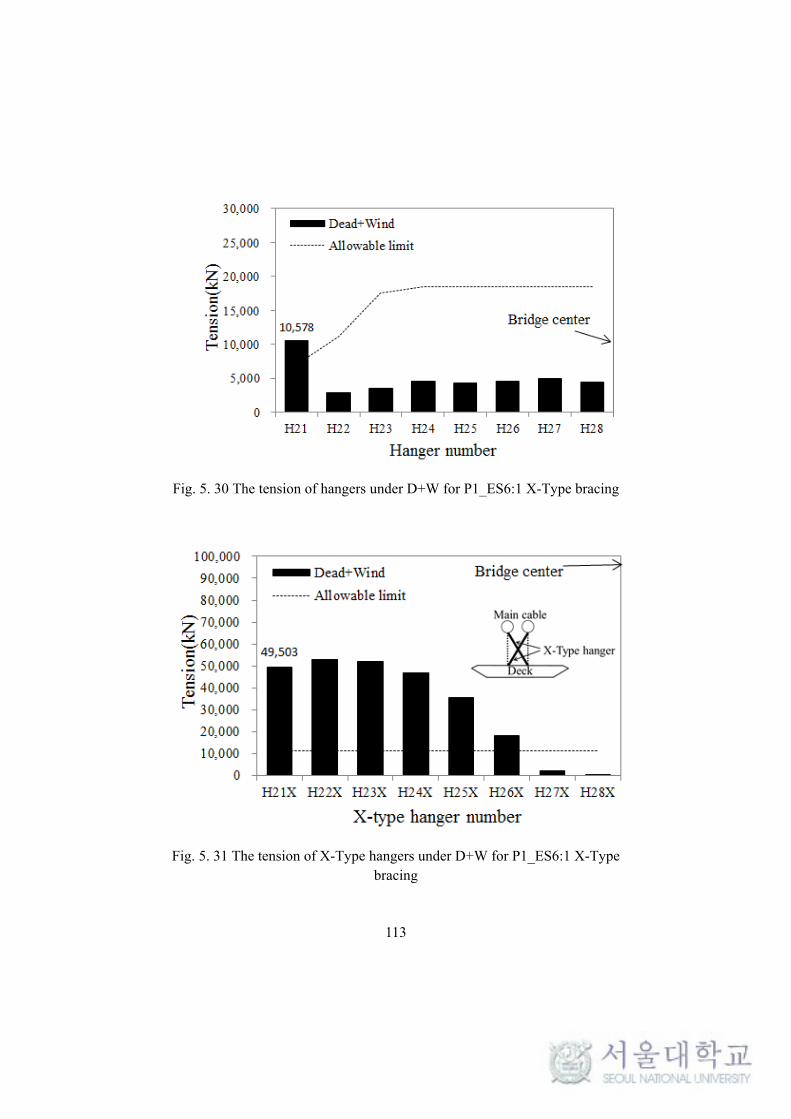
113
Fig. 5. 30 The tension of hangers under D+W for P1_ES6:1 X-Type bracing
Fig. 5. 31 The tension of X-Type hangers under D+W for P1_ES6:1 X-Type bracing
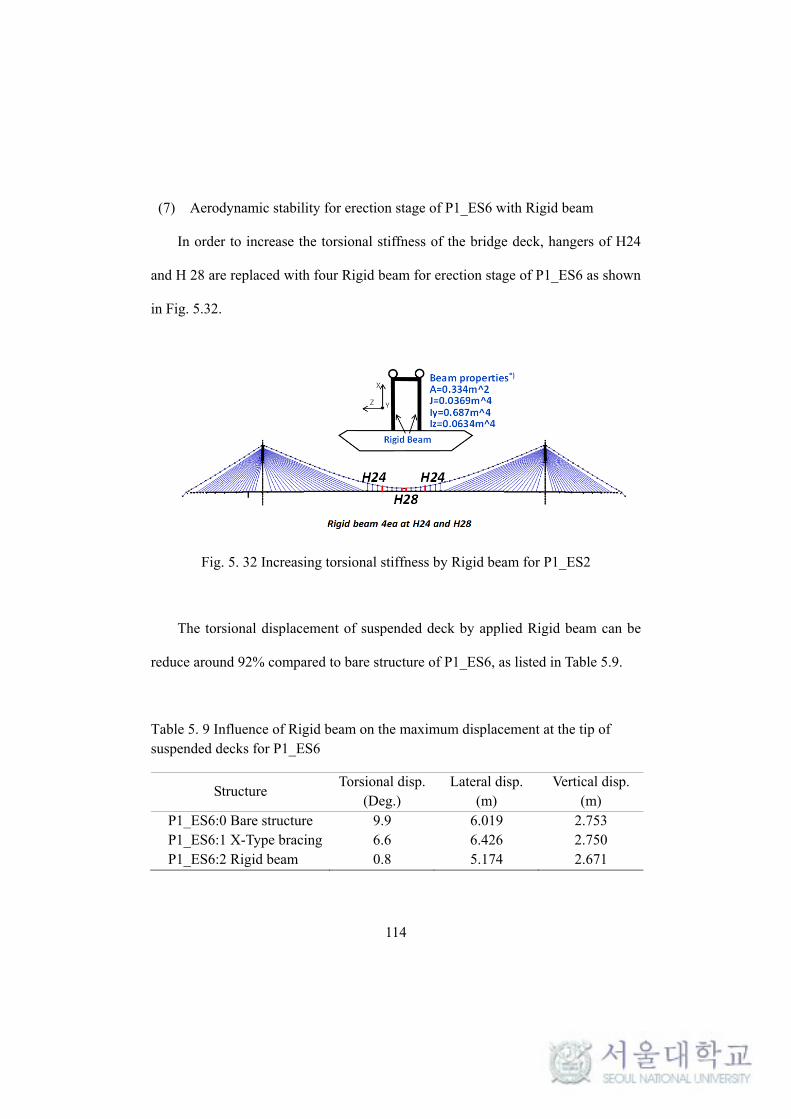
114
(7) Aerodynamic stability for erection stage of P1_ES6 with Rigid beam
In order to increase the torsional stiffness of the bridge deck, hangers of H24
and H 28 are replaced with four Rigid beam for erection stage of P1_ES6 as shown
in Fig. 5.32.
Fig. 5. 32 Increasing torsional stiffness by Rigid beam for P1_ES2
The torsional displacement of suspended deck by applied Rigid beam can be
reduce around 92% compared to bare structure of P1_ES6, as listed in Table 5.9.
Table 5. 9 Influence of Rigid beam on the maximum displacement at the tip of suspended decks for P1_ES6
Structure Torsional disp.
(Deg.) Lateral disp.
(m) Vertical disp.
(m) P1_ES6:0 Bare structure 9.9 6.019 2.753 P1_ES6:1 X-Type bracing 6.6 6.426 2.750 P1_ES6:2 Rigid beam 0.8 5.174 2.671
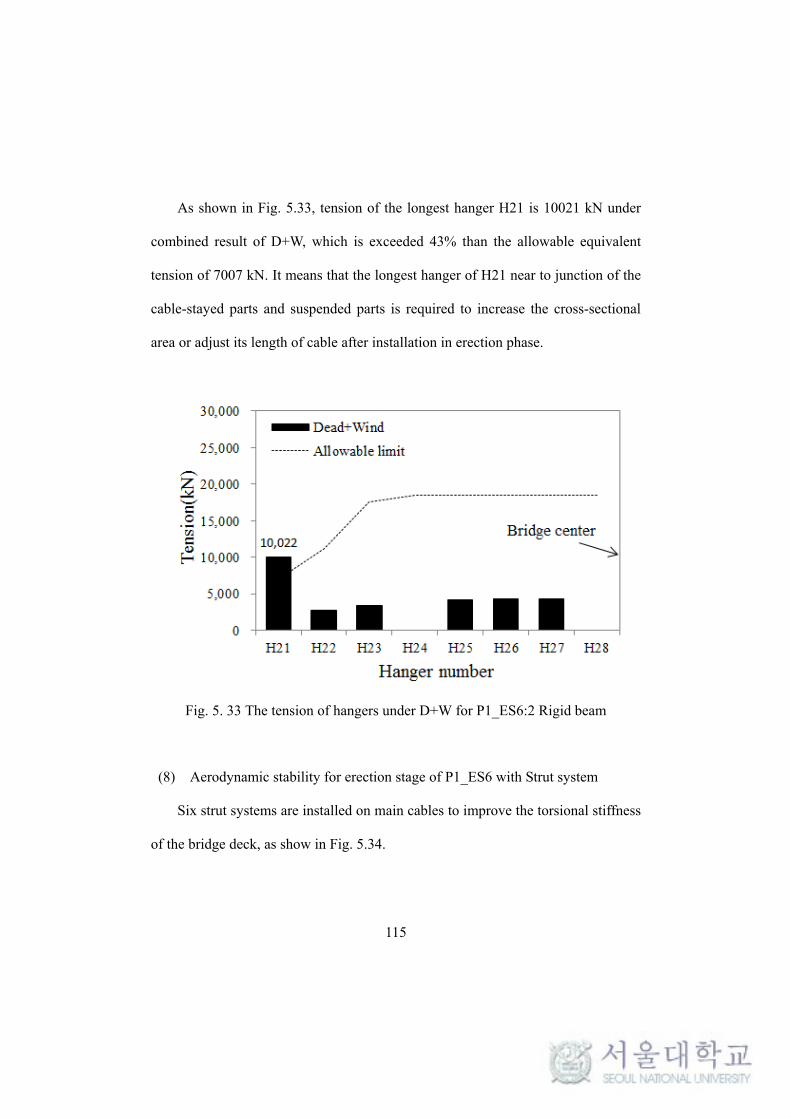
115
As shown in Fig. 5.33, tension of the longest hanger H21 is 10021 kN under
combined result of D+W, which is exceeded 43% than the allowable equivalent
tension of 7007 kN. It means that the longest hanger of H21 near to junction of the
cable-stayed parts and suspended parts is required to increase the cross-sectional
area or adjust its length of cable after installation in erection phase.
Fig. 5. 33 The tension of hangers under D+W for P1_ES6:2 Rigid beam
(8) Aerodynamic stability for erection stage of P1_ES6 with Strut system
Six strut systems are installed on main cables to improve the torsional stiffness
of the bridge deck, as show in Fig. 5.34.
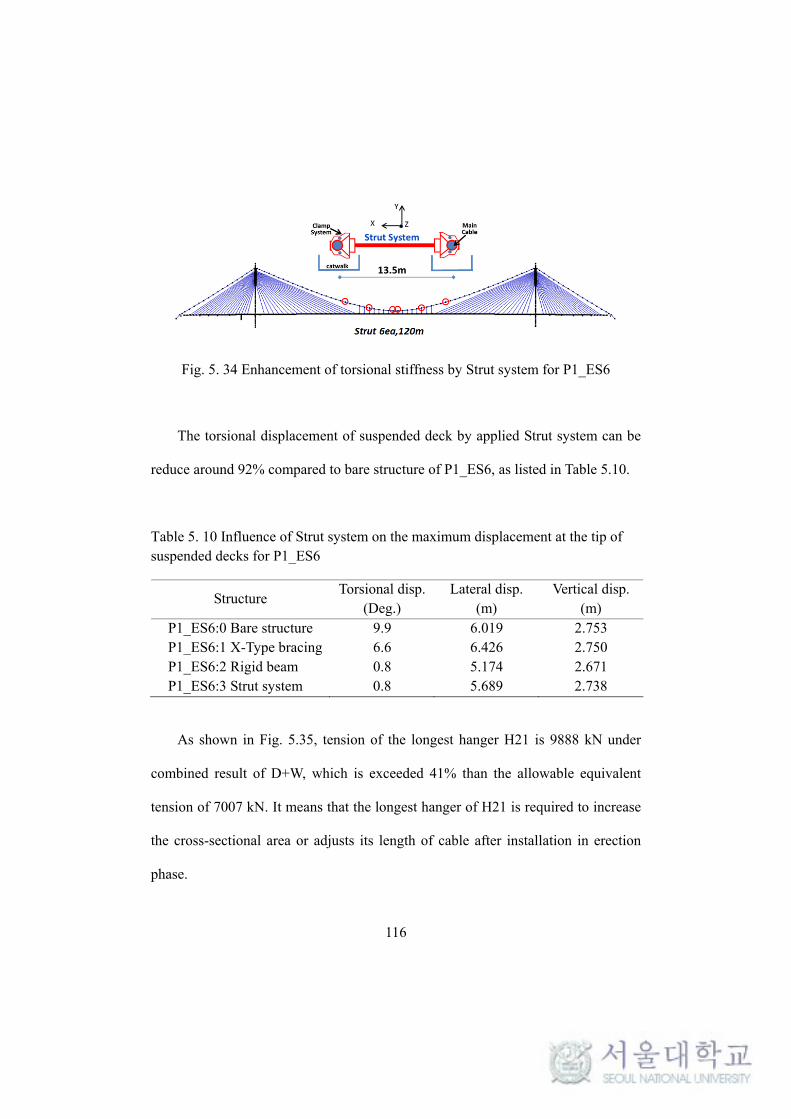
116
Fig. 5. 34 Enhancement of torsional stiffness by Strut system for P1_ES6
The torsional displacement of suspended deck by applied Strut system can be
reduce around 92% compared to bare structure of P1_ES6, as listed in Table 5.10.
Table 5. 10 Influence of Strut system on the maximum displacement at the tip of suspended decks for P1_ES6
Structure Torsional disp.
(Deg.) Lateral disp.
(m) Vertical disp.
(m) P1_ES6:0 Bare structure 9.9 6.019 2.753 P1_ES6:1 X-Type bracing 6.6 6.426 2.750 P1_ES6:2 Rigid beam 0.8 5.174 2.671 P1_ES6:3 Strut system 0.8 5.689 2.738
As shown in Fig. 5.35, tension of the longest hanger H21 is 9888 kN under
combined result of D+W, which is exceeded 41% than the allowable equivalent
tension of 7007 kN. It means that the longest hanger of H21 is required to increase
the cross-sectional area or adjusts its length of cable after installation in erection
phase.

117
Fig. 5. 35 The tension of hangers under D+W for P1_ES6:3 Strut systems
From effect of the structural stabilization measures in erection stage of
P1_ES6, both Strut system and Rigid beam are effective to control the torsional
displacement of suspended deck and those measures can reduce around 92%
compared with bare structure of P1_ES6. But Rigid beam limited usage can be
adapted for short hanger part. However, strut system has less limitation compared
to Rigid beam. Therefore, aerodynamic stability for construction Plan 1 is
investigated with six Strut system installed on the main cables in order to stabilize
the torsional deformation of suspended deck.
(9) Aerodynamic stability of construction Plan 1
Fig. 5.36 and 5.37 show the dominant frequency of torsion, lateral, and
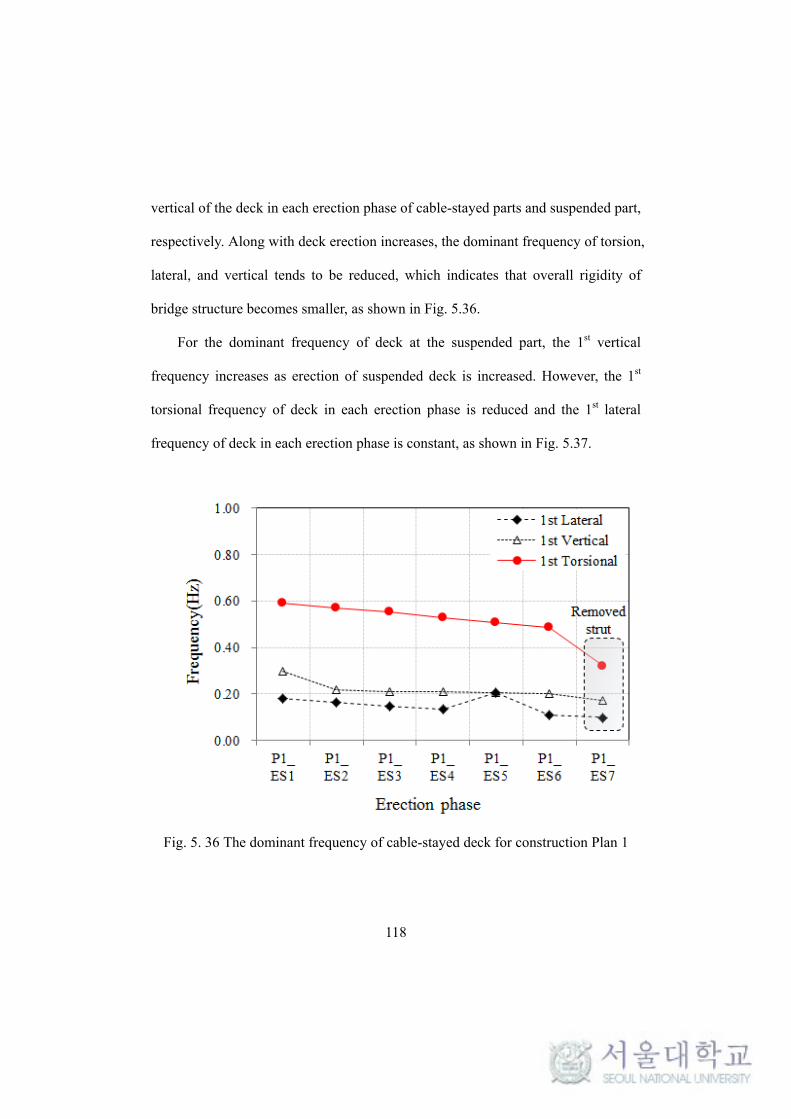
118
vertical of the deck in each erection phase of cable-stayed parts and suspended part,
respectively. Along with deck erection increases, the dominant frequency of torsion,
lateral, and vertical tends to be reduced, which indicates that overall rigidity of
bridge structure becomes smaller, as shown in Fig. 5.36.
For the dominant frequency of deck at the suspended part, the 1st vertical
frequency increases as erection of suspended deck is increased. However, the 1st
torsional frequency of deck in each erection phase is reduced and the 1st lateral
frequency of deck in each erection phase is constant, as shown in Fig. 5.37.
Fig. 5. 36 The dominant frequency of cable-stayed deck for construction Plan 1

119
Fig. 5. 37 The dominant frequency of suspended deck for construction Plan 1
Fig 5.38~5.40 show the maximum torsional displacement, lateral displacement,
and vertical displacement at the tip of cantilever deck under wind load, respectively.
The maximum torsional displacement at the tip of cantilever tends to rises as the
increase of deck erection, as shown in Fig. 5.38. The largest maximum torsional
displacement of deck at the suspended part can be found 0.8° under combined
results of mean wind and buffeting at the erection stage of P1_ES6. The maximum
lateral displacement of deck about 6m is constant in the erection phases for
construction Plan 1, as shown in Fig. 5.39. On the other hand, the maximum
vertical displacement of deck can be found at the initial erection stage of P1_ES2
and its value is 2.89m, as shown in Fig 5.40.

120
Fig. 5. 38 The maximum torsional displacement of deck in construction Plan 1
Fig. 5. 39 The maximum lateral displacement of deck in construction Plan 1

121
Fig. 5. 40 The maximum vertical displacement of deck in construction Plan 1
Fig 5.41 shows distribution of stay cable tensions under combined dead load
and wind load for erection stages in construction Plan 1. In all cases, the tensions
of stay cables under loading case of dead load and wind load are limited to
allowable equivalent tension of each stay cables.
Fig 5.42 shows distribution of hanger tensions under loading case of D+W for
each erection stage in construction Plan 1. The longest hanger of H21 exceeded the
allowable equivalent tension after their installation in erection stage of P1_ES6. In
order to secure the aerodynamic stability, hanger of H21 needs to increase the
cross-sectional area or adjust its length of cable after their installation in erection
stage of P1_ES6. The maximum hanger tension increase is up to 14558 kN for H21.

122
Fig. 5. 41 Distribution of stay cables tension under D+W in construction Plan 1
Fig. 5. 42 Distribution of hangers tension under D+W in construction Plan 1

123
(10) Parameter study of strut system for construction Plan 1
To adapt Strut system, parametric study is carried out with various layouts on
the main cable considering the number of its uses and with stiffness sensitivity.
To describe the effect of the number of Strut system, four different layout of
Strut system on the main cable are considered in erection stage of P1_ES2 for this
study, as shown in Fig. 5.43.
Fig. 5. 43 Layout of Strut system on the main cable
As shown in Fig. 5. 44, an increase of the number of Strut system is efficient
to reduce the torsional displacement of suspended deck. The case of applying three
Strut system with interval of 228m on the main cable produces the biggest torsional
displacement of the suspended deck under combined results of mean wind and
buffeting. After applying four Strut systems, the torsional deformation of
suspended deck is converged. For the structural safety in erection phases, four to

124
six of Strut systems are recommended for this example bridge.
Fig. 5. 44 Torsional displacement of suspeded deck with number of Strut
Fig. 5. 45 Torsional displacement of suspeded deck with various moment of inertia Iz
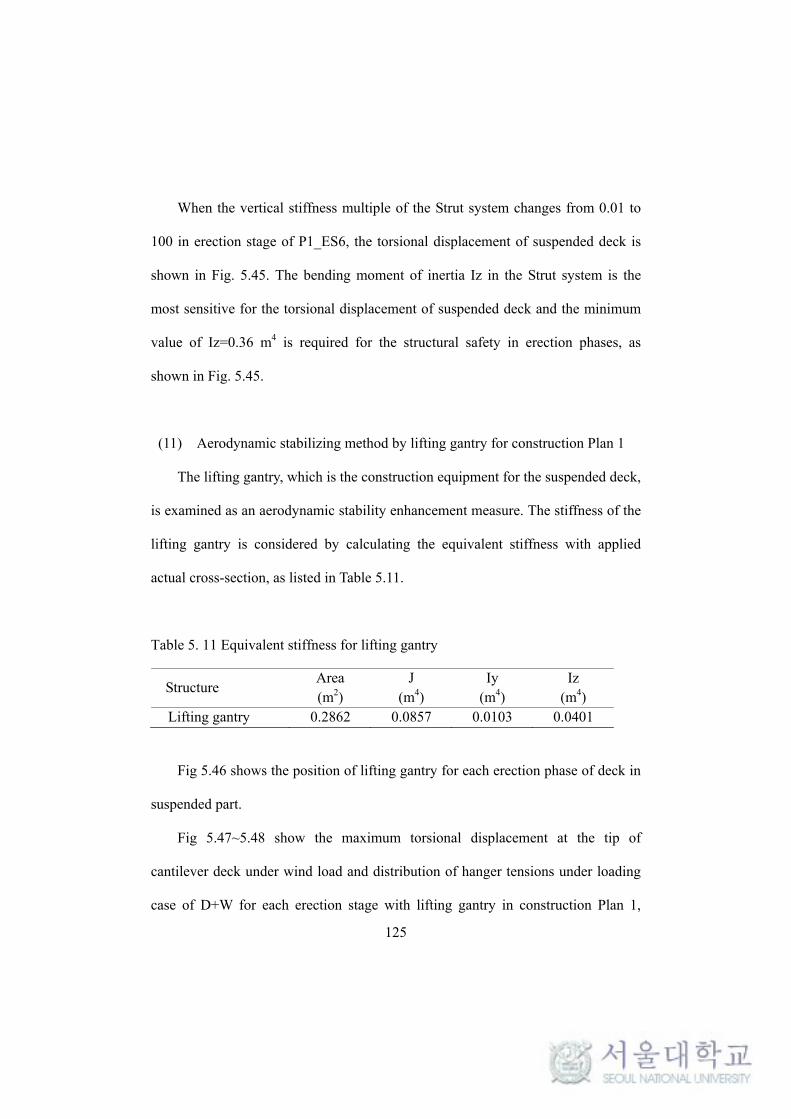
125
When the vertical stiffness multiple of the Strut system changes from 0.01 to
100 in erection stage of P1_ES6, the torsional displacement of suspended deck is
shown in Fig. 5.45. The bending moment of inertia Iz in the Strut system is the
most sensitive for the torsional displacement of suspended deck and the minimum
value of Iz=0.36 m4 is required for the structural safety in erection phases, as
shown in Fig. 5.45.
(11) Aerodynamic stabilizing method by lifting gantry for construction Plan 1
The lifting gantry, which is the construction equipment for the suspended deck,
is examined as an aerodynamic stability enhancement measure. The stiffness of the
lifting gantry is considered by calculating the equivalent stiffness with applied
actual cross-section, as listed in Table 5.11.
Table 5. 11 Equivalent stiffness for lifting gantry
Structure Area (m2)
J (m4)
Iy (m4)
Iz (m4)
Lifting gantry 0.2862 0.0857 0.0103 0.0401
Fig 5.46 shows the position of lifting gantry for each erection phase of deck in
suspended part.
Fig 5.47~5.48 show the maximum torsional displacement at the tip of
cantilever deck under wind load and distribution of hanger tensions under loading
case of D+W for each erection stage with lifting gantry in construction Plan 1,
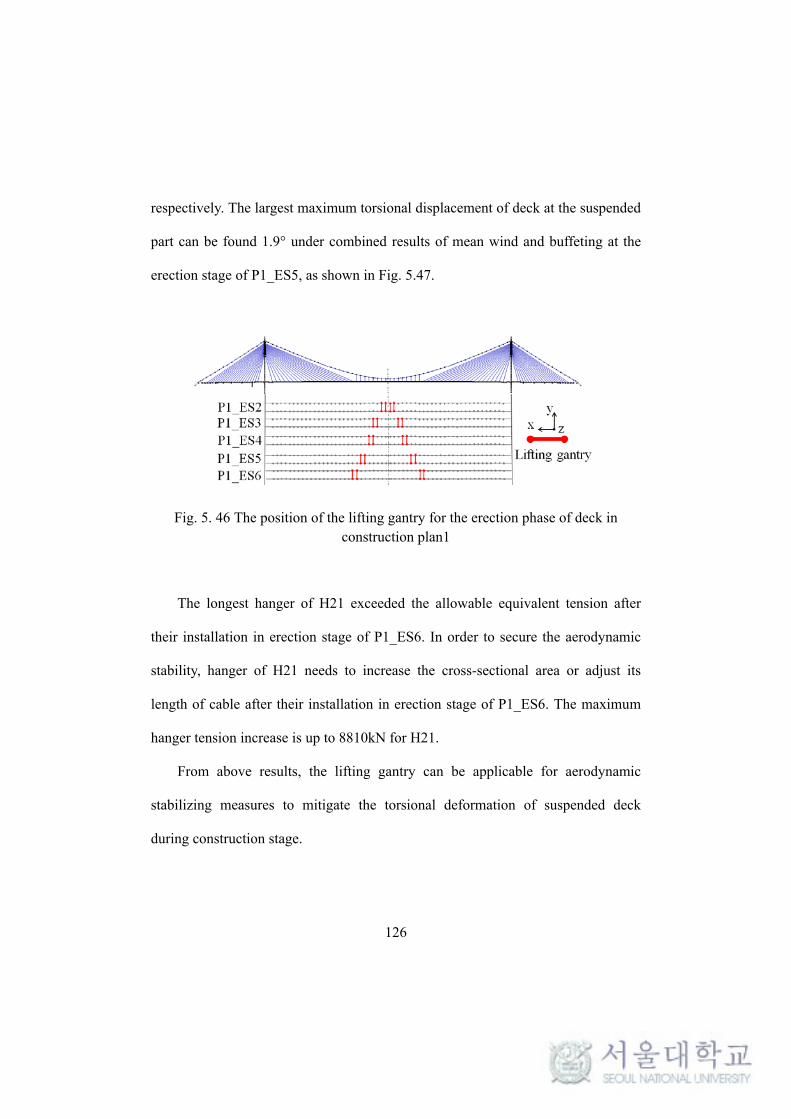
126
respectively. The largest maximum torsional displacement of deck at the suspended
part can be found 1.9° under combined results of mean wind and buffeting at the
erection stage of P1_ES5, as shown in Fig. 5.47.
Fig. 5. 46 The position of the lifting gantry for the erection phase of deck in construction plan1
The longest hanger of H21 exceeded the allowable equivalent tension after
their installation in erection stage of P1_ES6. In order to secure the aerodynamic
stability, hanger of H21 needs to increase the cross-sectional area or adjust its
length of cable after their installation in erection stage of P1_ES6. The maximum
hanger tension increase is up to 8810kN for H21.
From above results, the lifting gantry can be applicable for aerodynamic
stabilizing measures to mitigate the torsional deformation of suspended deck
during construction stage.

127
Fig. 5. 47 The maximum torsional displacement of deck with lifting gantry in construction Plan 1
Fig. 5. 48 Distribution of hangers tension under D+W with lifting gantry in construction Plan 1

128
(12) Summary of aerodynamic stability for construction Plan 1
Aerodynamic stability problems are expected for the suspended deck in
construction Plan 1. In order to improve the torsional rigidity of suspended deck,
three different structural measures such as X-Type bracing, Rigid beam, and Strut
system are considered in aerodynamic stability analysis.
These proposed measures are effective to improve the torsional stiffness of
deck as shown in Fig 5.49. But X-Type bracing need to adjust its length of cable
for each erection phase. The Rigid beam limited usage can be adapted for short
hanger part only.
Fig. 5. 49 The torsional displacement of deck under different structural measures for P1_ES2

129
However, strut system has less limitation compared to other structural
stabilization measures, but economic problem should be reviewed depending on
the number of its uses.
In order to reduce the torsional deformation of suspended deck in construction,
Strut system is the most effective structural measure. In case of applying Strut
system on the main cable in Construction Plan 1, the torsional angle of suspended
deck is controlled with less than 1° during the erection of suspended decks. The
distribution of stay cables tensions in the each erection stage are lower than the
allowable tension of each stay cable. However, the longest hanger of H21 near to
junction of the cable-stayed parts and suspended part require an increase of cross-
sectional area or adjust its length of cable since the installation phase in order to
secure aerodynamic stability.
The lifting gantry can be applicable for an aerodynamic stabilization measure
to control the rigid body torsional deformation during erection of suspended decks.

130
5.5 Aerodynamic feasibility study on an alternative construction
plan
A feasibility study for another potential sequence of erection, which can
reduce overall construction period, is performed with aerodynamic stabilizing
measures combined of strut system and lifting gantry. When the suspended deck
segments as well as the configuration of main cables come to the final position, the
welding between suspended decks can be carried out. By delaying welding process,
the deck segments can be erected in a fast-track mode. As shown in Fig. 5.50,
seven erection stages were selected for construction plan based on completed
erection of pylons and the side spans decks, and described as follows:
Erection stage (ES) 1: The pair of deck segments D0 to D12 with 24 stay cables in
each cable plan is installed. The main cable completed and D14 to D15 with
H14 to H15 are installed.
ES2: The pair of decks D16 to D17 and the stay cables S16 to S17 are installed.
ES3: The pair of decks D18 to D19 and the stay cables S18 to S19 are installed.
ES4: The pair of decks D20 to D21 and the stay cables S20 to S21 are installed.
ES5: The pair of decks D22 to D23 and the stay cables S22 to S23 are installed.
ES6: The pair of decks D24 to D25 and the stay cables S24 to S25 are installed.
ES7: The pair of decks D26 to D28 and the stay cables S26 to S28 are installed
The notation of A1 in Fig. 5.50 is indicated alternative construction plan.

131
(a) A1_ES1; deck erected 52%
(b) A1_ES2; deck erected 58%
(c) A1_ES3; deck erected 65%
(d) A1_ES4; deck erected 72%
(e) A1_ES5; deck erected 79%
(f) A1_ES6; deck erected 86%
(g) A1_ES7; deck erected 96%
Fig. 5. 50 FE models of erection sequence in alternative construction plan
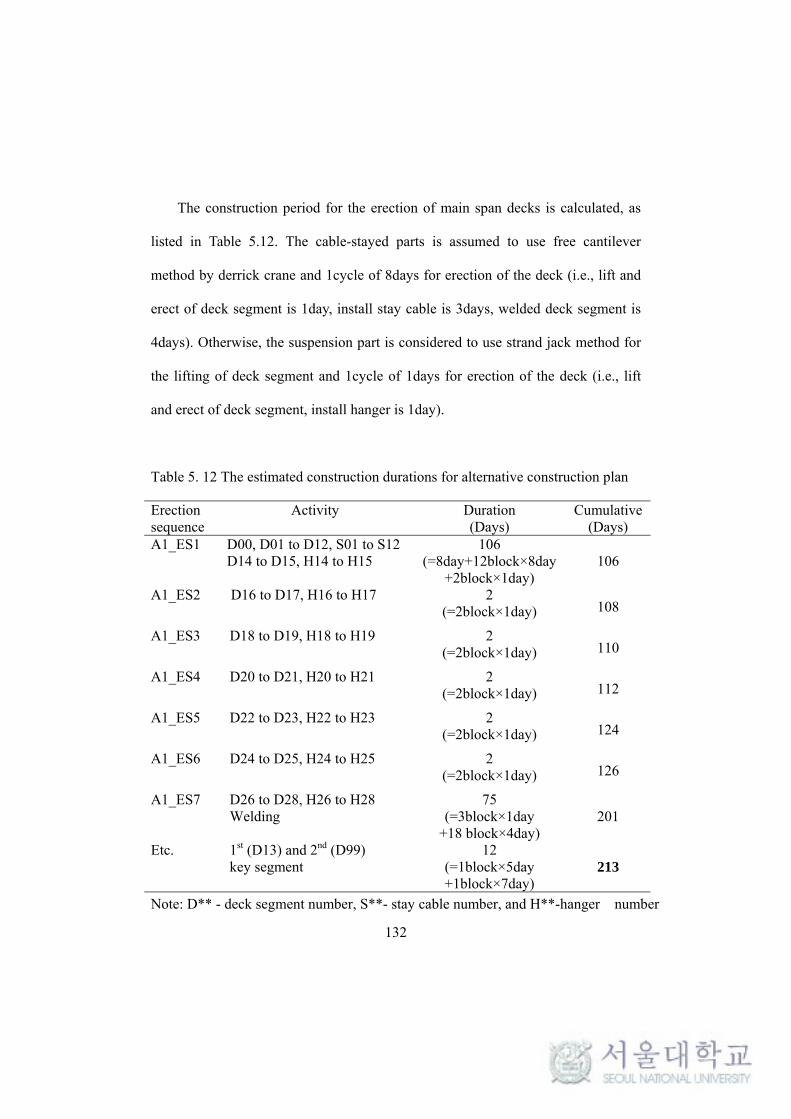
132
The construction period for the erection of main span decks is calculated, as
listed in Table 5.12. The cable-stayed parts is assumed to use free cantilever
method by derrick crane and 1cycle of 8days for erection of the deck (i.e., lift and
erect of deck segment is 1day, install stay cable is 3days, welded deck segment is
4days). Otherwise, the suspension part is considered to use strand jack method for
the lifting of deck segment and 1cycle of 1days for erection of the deck (i.e., lift
and erect of deck segment, install hanger is 1day).
Table 5. 12 The estimated construction durations for alternative construction plan
Erection sequence
Activity
Duration (Days)
Cumulative (Days)
A1_ES1 D00, D01 to D12, S01 to S12 D14 to D15, H14 to H15
106 (=8day+12block×8day
+2block×1day) 106
A1_ES2 D16 to D17, H16 to H17 2 (=2block×1day) 108
A1_ES3 D18 to D19, H18 to H19 2 (=2block×1day) 110
A1_ES4 D20 to D21, H20 to H21 2 (=2block×1day) 112
A1_ES5 D22 to D23, H22 to H23 2 (=2block×1day) 124
A1_ES6 D24 to D25, H24 to H25 2 (=2block×1day) 126
A1_ES7 D26 to D28, H26 to H28 Welding
75 (=3block×1day
+18 block×4day) 201
Etc. 1st (D13) and 2nd (D99) key segment
12 (=1block×5day +1block×7day)
213
Note: D** - deck segment number, S**- stay cable number, and H**-hanger number

133
Alternative construction plan can be reduced by 58 days compared with
construction Plan 0 based on the completed erection of pylons and the decks of side
spans. However, it is required to verify the aerodynamic stability on the
construction phase of suspended deck.
In this section, the feasibility of an alternative construction plan examines in
terms of aerodynamic stability with aerodynamic stabilizing measures combined of
strut system and lifting gantry. Fig 5.51 shows the position of Strut system and
lifting gantry for each erection phase of deck in suspended part.
Fig. 5. 51 The position of the lifting gantry for the erection phase of deck in alternative construction plan
For the dominant frequency of deck at the suspended part, the 1st torsional
frequency of deck in each erection phase is reduced. However, the 1st vertical
frequency increases as erection of suspended deck is increased and the 1st lateral

134
frequency of deck in each erection phase is constant, as shown in Fig. 5.52.
Fig. 5. 52 The dominant frequency of suspended deck for alternative construction plan
Fig 5.53~5.55 show the maximum torsional displacement, lateral displacement,
and vertical displacement at the tip of cantilever deck under wind load, respectively.
The maximum torsional displacement at the tip of cantilever tends to descend as
the increase of deck erection, as shown in Fig. 5.53. The largest maximum torsional
displacement of deck at the suspended part can be found to be equal to 3.6° under
combined results of mean wind and buffeting at the erection stage of A1_ES2. The
maximum lateral displacement of deck is decreased from 6.7m to 5.5m in the
erection phases for alternative construction plan, as shown in Fig. 5.54. On the
other hand, the maximum vertical displacement of deck can be found at the initial
erection stage of A1_ES2 and its value is 3.6m, as shown in Fig. 5.55.

135
Fig. 5. 53 The maximum torsional displacement of deck in alternative construction plan
Fig. 5. 54 The maximum lateral displacement of deck in alternative construction plan
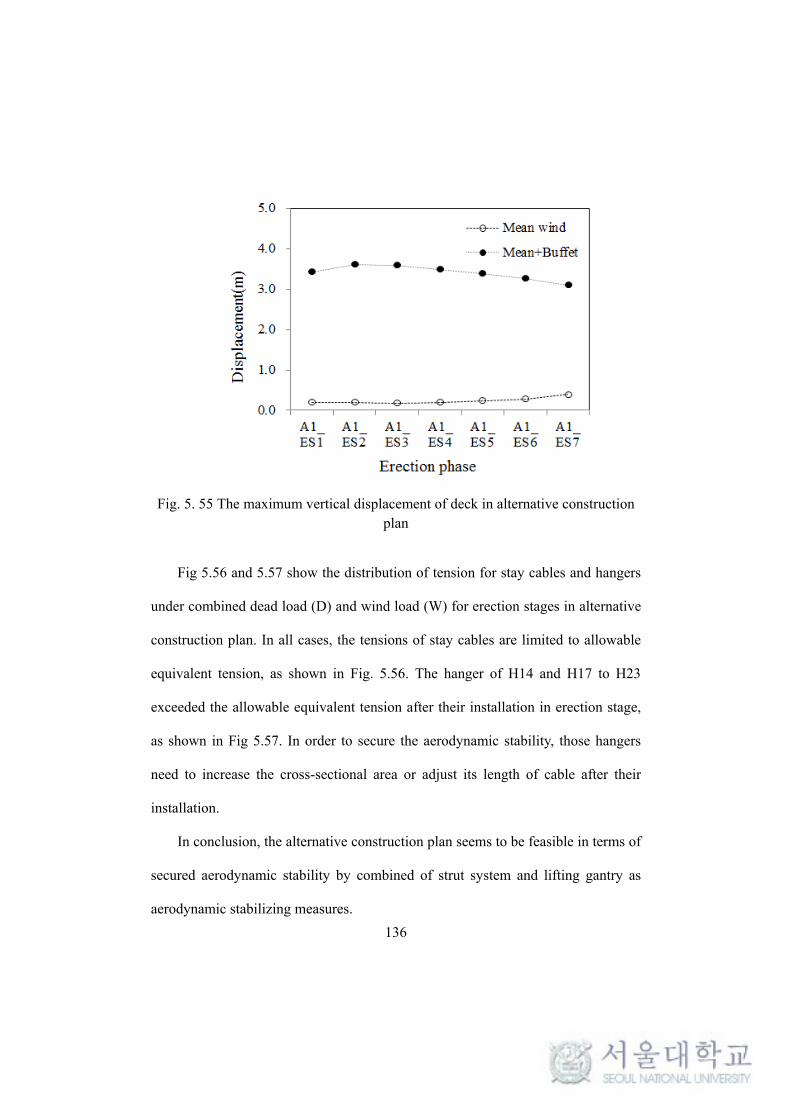
136
Fig. 5. 55 The maximum vertical displacement of deck in alternative construction plan
Fig 5.56 and 5.57 show the distribution of tension for stay cables and hangers
under combined dead load (D) and wind load (W) for erection stages in alternative
construction plan. In all cases, the tensions of stay cables are limited to allowable
equivalent tension, as shown in Fig. 5.56. The hanger of H14 and H17 to H23
exceeded the allowable equivalent tension after their installation in erection stage,
as shown in Fig 5.57. In order to secure the aerodynamic stability, those hangers
need to increase the cross-sectional area or adjust its length of cable after their
installation.
In conclusion, the alternative construction plan seems to be feasible in terms of
secured aerodynamic stability by combined of strut system and lifting gantry as
aerodynamic stabilizing measures.

137
Fig. 5. 56 Distribution of stay cables tension under D+W in alternative construction plan
Fig. 5. 57 Distribution of hangers tension under D+W in alternative construction plan

138
5.6 Summary
This study examines the aerodynamic stability of a cable-stayed suspension
bridge in erection sequences of suspended deck. The overall results are as follows.
1. In the case of applying Construction Plan 0 as series construction scheme,
aerodynamic stability of the suspended deck in construction phase is
assured, however, the longest hanger of H21 near to junction required an
increase of cross-sectional area or adjust its length after installation in
order to secure aerodynamic stability.
2. In the case of applying Construction Plan 1, the excessive rigid body
torsional deformation of 26° in the suspended deck is found in the initial
construction stage due to the rigid body motion of the suspended deck by
the vertical mode of main cable. In order to control the rigid body
torsional deformation of the suspended deck, the most effective structural
stabilization measure is the strut system by installing on the main cables.
3. In the case of applying Strut system on the main cable in Construction
Plan 1, the rigid body torsional angle of suspended deck is controlled less
than 1° during the erection of suspended decks. The distribution of stay
cables tensions in the each erection stage are lower than the allowable
tension of cable. However, the longest hanger of H21 near to junction of

139
the cable-stayed parts and suspended parts required an increase of cross-
sectional area or adjust its length since the installation phase in order to
secure aerodynamic stability.
4. When Construction Plan 1 as simultaneous construction scheme using
Strut system, construction assuring aerodynamic stability is possible and
construction period can be reduced by 48 days compared to Construction
Plan 0 as series construction scheme. However, it is required to have
proper construction management of two type of bridge structure according
to simultaneous construction in both deck of cable-stayed parts and
suspended part.
5. The lifting gantry can be applicable for an aerodynamic stabilization
measure to control the rigid body torsional deformation during erection of
suspended decks.
6. When alternative construction scheme in which suspended decks are
erected from tower side to center of mid-span with combined of strut
system and lifting gantry, construction assuring aerodynamic stability is
possible and construction period can be reduced by 58 days compared to
Construction Plan 0 as series construction scheme.

140
Chapter 6
Conclusions
In order to comprehensively understand and a realistically predict the
structural behavior of a cable-stayed suspension bridge, both parametric study and
aerodynamic stability in construction stage are investigated. The following
conclusions can be made based on the obtained results:
Firstly, parametric study is carried out. Two design parameters, the suspension-
to-span ratio and length of transition part are considered and studied for their
effects on the structural behavior under live loads consisting of trains and road
vehicles. A suspension-to-span ratio of 0.22 to 0.56 is effective to increase the
overall rigidity of structure compared responses of cable-stayed bridge and
suspension bridge. As the suspended portion in main span increases, the vertical
displacement of the deck gradually increases and the negative vertical bending
moment of deck at the junction between cable-stayed parts and suspended part in
main span sharply increases. Also, the cable tension in the longest hanger rapidly
increases due to difference stiffness in two structure system such as cable-stayed
and suspension part. This can lead to fatigue problems which can be solved by
installing the transition part. The transition part to cable-stayed part ratio ranging
from 0.1 to 0.45 is favorable for this case study bridge. An equally distributed dead
load in transition parts is efficient to reduce the secondary stress of main cable.
141
Secondly, applicable construction sequences considered fast-track erection for
the cable-stayed suspension bridge were defined based on the established
construction method, and studied on the aerodynamic stability of its construction
sequences which focuses on the erection of suspended deck. Based on the deck
erection, two different construction schemes are considered to investigate
aerodynamic stability of construction scheme by buffeting analysis for the cable-
stayed suspension bridge. The first construction scheme is the construction Plan 0
(series sequence) and the second scheme is the construction Plan 1 (simultaneously
construction sequence). As a result, applying construction Plan 0 scheme,
aerodynamic stability of the suspended deck is assured. However, one of hangers is
required to increase of cross-sectional area or adjusts its length of cable after
installation in order to secure aerodynamic stability. In the case of applying
construction Plan 1, the excessive torsional deformation in the suspended deck is
found in the initial construction stage due to the rigid body motion of the
suspended deck by the vertical mode of main cable. In order to control the torsional
displacement of deck, X-Type bracing, Rigid beam and Strut system are considered
as structural stabilization measures. The most effective structural stabilization
measure is the strut system by installing on the main cables. When Construction
Plan 1 as simultaneous construction scheme installing six strut systems,
construction assuring aerodynamic stability is possible and construction period can
be reduced by 48 days compared than Construction Plan 0 as series construction
scheme. However, it is required to have proper construction management of two

142
type of bridge structure according to simultaneous construction in both deck of
cable-stayed parts and suspended part. The lifting gantry can be applicable for an
aerodynamic stabilization measure to control the rigid body torsional deformation
during erection of suspended decks. When alternative construction scheme in
which suspended decks are erected from tower side to center of mid-span with
combined of strut system and lifting gantry, construction assuring aerodynamic
stability is possible and construction period can be reduced by 58 days compared to
Construction Plan 0 as series construction scheme.
In conclusion, cable-stayed suspension bridges provide better structural
performance under train load compared conventional system of cable-stayed
bridges and suspension bridge. Consequently, cable-stayed suspension bridges are
expected to be more widely used for long-span cable supported bridge including
railway bridges. Also, proposed aerodynamic stabilizing measures of strut system
and lifting gantry can be applicable to mitigate the rigid body torsional deformation
of suspended decks during construction stages for cable-stayed suspension bridges
and long span suspension bridge.
In reviewing the study, the following points are suggested for further research.
The reasonable finished dead load state is a lack of convenient method in case of
complex boundary conditions at side spans as can be found in the example bridge
of this paper. Therefore, analysis method for determination of reasonable
completed dead load state is required based on the optimization concepts in order
to economic design of structure. Also, effect of some design parameters should be

143
investigated such as the rise-span ratio and the number of subsidiary piers in side
spans on structural static and dynamic behaviors under loading of live and wind.
The proposed aerodynamic stabilizing measures of strut system and lifting
gantry can be successfully applied to control the rigid body torsional deformation
of suspended decks during construction stages for a cable-stayed suspension bridge.
However, the extension to application of aerodynamic stabilizing measures for the
long span and multi span suspension bridges should be studied. Also, flutter
analysis should perform with proposed aerodynamic stabilizing measures
considering aerodynamic derivatives by wind tunnel test to ensure the validity of
the stability limits.
144
REFERENCES
Ahn, S.S., 1991. Static and dynamic nonlinear analysis of spatial cable networks
using elastic catenary cable element, M. S. thesis, Seoul National University, Seoul,
Korea.
Andreu, A., Gil, L., Roca, P., 2006. A new deformable catenary element for the
analysis of cable net structures, Comput. Struct. 84, 1882-1890.
Bathe K., 1996. Finite element procedures. Prentice-Hall, Englewood Cliffs, N.J.
Brancaleoni, F., 1992. The construction phase and its aerodynamic issues,
Aerodynamics of large bridges, A. Larsen, ed., Balkema, Rotterdam, The
Netherlands, 147-158.
Bruno, D., Greco, F., Lonetti, P., 2009. A Parametric Study on the Dynamic
Behavior of Combined Cable-Stayed and Suspension Bridges under Moving Loads.
International Journal for Computational Methods in Engineering Science and
Mechanics 10(4), 243-258.
Choi, J.H., 2013. Initial shape analysis for cable-stayed and suspension bridges by

145
nonlinear FEM considering unstrained length, M. S. thesis, SungKyunKwan
University, Seoul, Korea.(in Korean)
Chopra, A. 2007. Dynamics of structures. Pearson Prentice Hall.
Cobo del Arco, D., Aparicio, A.C., 2000. Improving the wind stability of
suspension bridges during construction. J. of Struct Engrg, ASCE 127(8), 869-875.
European Committee for Standardization, EN 1991-2, 2003. Traffic loads on
bridges, Brussels, CEN
Gavin, H. P., 2012. Geometric stiffness effects in 2d and 3d frames, Lecture notes,
Duke University, Fall.
Ge, Y.J., Tanaka, H., 2000. Aerodynamic stability of long-span suspension bridges
under erection. J. of Struct Engrg, ASCE 126(12), 1404-1412.
Greisch, 2013. 3rd Bosphorus bridge - Actions – wind, Design report, Greisch,
Belgium.
Greisch, 2014. 3rd Bosphorus bridge – Model description – General beam model,
Design report, Greisch, Belgium.

146
Gimsing, N.J., Georgakis, C.T., 2012. Cable supported bridges: concept and design,
3rd Edition, Wiley, New York.
Honda, A., Miyata, H., Shibata, H., 1998. Aerodynamic stability of narrow decked
suspension bridge (Aki-nada Ohashi Bridge), J. of wind Engineering and Industrial
Aerodynamics 77&78, 409-420.
Irvine, H. M., 1981. Cable structures. MIT Press, Cambridge.
Jayaraman, H., Knudson, W., 1981. A curved element for the analysis of cable
structures, Comput Struct. 14(3-4), 325-333.
Jung, M.R., Min, D.J., Kim, M.Y., 2013 Nonlinear analysis methods based on the
unstrained element length for determining initial shaping of suspension bridges
under dead loads, Computers and Structures, 128, 272-285.
KBDC, 2015. Korean Highway Bridge Design Code (Limit State Design) – Cable
supported Bridges.
Kim, K.H., 2011. Initial equilibrium configuration analysis for bridges supported
with stayed and suspended cables. M. S. thesis, Seoul national university, Seoul,
Korea. (in Korean)

147
Kim, H.K. 1993. Three dimensional analyses of suspension bridges considering
construction stages. Ph. D. thesis, Seoul National University, Seoul, Korea.
Kim, H.K., Kim, K.T., Lee, H., Kim, S.J., 2013. Performance of unpretensioned
wind stabilizing cables in the construction of a cable-stayed bridge. J. Bridge Eng.
10(1061), 722-734
Kim, K.S., Lee, H.S., 2001. Analysis of target configurations under dead loads for
cable-supported bridges. Comput Struct 79, 2681-2692.
Kim, H.K., Kim, M.Y., 2012. Efficient combination of a TCUD method and an
initial force method for determining initial shapes of cable-supported bridges. Int J
of Steel Struct, 12, 157-74.
Kim, H.K., Lee, M.J., Chang, S.P., 2002 Nonlinear shape-finding analysis of a self-
anchored suspension bridge, Engineering Structures, 24(12). 1547-1559.
Kim, H.K., Shinozuka, M., Chang, S.P., 2004. Geometrically nonlinear buffeting
responses of a cable-stayed bridge. J. Eng. Mech. 130(7), 848-857.
Kubo, K., 2007. Basic research on the feasibility and aerodynamic stability of
hybrid suspension bridge for super long suspension bridges, Ph.D. thesis, Kyushu

148
Institute of Technology, Kyushu, Japan.
Kyung, Y.S., 2002. An improved method for initial shape analysis of cable
supported bridges, M. S. thesis, SungKyunKwan University, Seoul, Korea. (in
Korean)
Larsen, A., 1995. Prediction of aeroelastic stability of suspension bridges during
erection. PROC., 9th Int. Conf. on Wind Engrg., New Delhi, India.
Lee, M.J., Kim, H.K., 2015 Angular change and secondary stress in main cables of
suspension bridges, International Journal of Steel Structure 16(2), 573-585
Lee, H., Kim, H.K., Kim, M.S., Cho, E.K., 2015 Enhancement of wind stability of
a cable-stayed suspension bridge in construction, Proceedings of Annual Academic
Conferences, Jeju, KSSC.(in Korean)
Lonetti, P., Pascuzzo, A., 2014. Optimum design analysis of hybrid cable-stayed
suspension bridges. Advances in Engineering Software 73, 53-66.
MathWorks. 2013. MATLAB R2013b. MathWorks, Simulink.
McGuire, W., Gallagher, R.H., Ziemian, R.D., 2000. Matrix structural analysis 2nd
149
edition, John Wiley & Sons, New York.
Michel Virlogeux, 2013. Presentation du pont, The conceptual design of the Third
Bosphorus Bridge
Nakamura, K., 2006. Ultimate instability problem of long-span cable-stayed
bridges and applicability to ultra-long span, Ph. D. thesis. Tokyo Metropolitan
University, Tokyo, Japan. (in Japanese)
O’Brien, W.T., Francis, A.J., 1964. Cable movements under tow-dimensional loads,
J. Struct. Div. ASCE 90, 89-124.
Simiu, E., Scanlan, R.H., 1996. Wind effects on structures, Wiley, New York.
Strømmen, E. N., 2010 Theory of bridge aerodynamics, Springer, Berlin.
Sun, B., Cai, C., Xiao, R., 2013. Analysis strategy and parametric study of cable-
stayed-suspension bridges. Advances in Structural Engineering 16,1081-1102.
Von Karman, T., 1948. Progress in the statistical theory of turbulence, J. of
Maritime Research 7.

150
Wang, P.H., Yang, C.G., 1996. Parametric studies on cable-stayed bridges. Comput
Struct. 60(2), 243-260.
Xiang, H., Ge, Y.J., 2007. Aerodynamic challenges in span length of suspension
bridges, Frontiers of Architecture and Civil Engineering in China 1(2), 153-162
Yang, Y.B., Kuo, S.R., 1994. Theroy and analysis of nonlinear framed structures.
Prentice Hall, Singapore.
Zhang, X., Stern, D., 2008. Wind-resistant design of cable-stayed-suspension
hybrid bridges. Transportation and Development Innovative Best Practices, 444-
449.
Zhang, X.J., Sun, B.N., 2005. Aerodynamic stability of cable-stayed-suspension
hybrid bridges. Journal of Zhejiang University SCIENCE 6A, 869-874.
Zhang, X.J., 2006. Study of design parameters on flutter stability of cable-stayed-
suspension Hybrid bridges. Wind Struct. 9(4), 331-344.
Zhang, X.J., 2007. Investigation on mechanics performance of cable-stayed-
suspension hybrid bridges. Wind and Structures 10, 533-542.
http://www.3kopru.com/eng/photogallery

151
http://highestbridges.com/wiki/index.php?title=Wujiang_Bridge_Lanhai

152
국 문 초 록
도로-철도 병용교에 적용이 가능한 사장-현수교의 구조특성 분석을
위한 변수연구와 내풍안정성을 확보한 가설 순서에 대한 연구를 수행하
였다. 8차선 도로와 2차선 열차하중을 수용하는 주경간 1408m 사장-
현수교를 예제 교량으로 선정하였다.
디자인 변수연구는 전체 강성에 영향이 큰 suspension-to-span
ratio를 고려하여 7개의 해석모델을 작성하였다. 열차하중과 차량하중을
포함하는 활하중 모델을 고려하여 정적 비선형 해석을 수행하였다. 연직
강성 측면에서 응답을 분석하였다. 검토결과 사장교와 현수교의 응답 대
비 연직 강성 확보 측면에서 가장 효과적인 suspension-to-span ratio
비율은 0.22~0.56 이다. 현수구간이 증가할 수록 연직 변위가 증가하고,
사장교부와 현수교부의 경계 위치에서 거더의 급격한 부모멘트 증가 현
상이 발생한다. 특히, 사장교부와 현수교부의 경계 위치의 선단 행어에
큰 장력이 발생하며, 이는 피로 문제를 발생시킬 수 있다. 이러한 문제
는 사장교와 현수교의 결합에서 발생하는 강성 차이로 인해 발생하며,
transition구간을 설정하여 해결이 가능하다. 효과적인 transition part-
to-cable-stayed part 비율은 0.1~0.32 이다.
케이블 교량의 가설단계 구조계는 완성계에 비해 상대적으로 강성이

153
작고, 바람에 의한 진동에 취약하다. 따라서 가설 중 내풍안정성 확보는
중요한 디자인 이슈이다. 가설 중인 장경간 사장-현수교를 대상으로 거
더의 가설 관점에서 적용 가능한 가설 순서인 순차가설 방법과 주케이블
시공이 완료된 상태에서 사장교구간과 현수구간을 동시에 시공하여 가설
공기를 줄일 수 있는 동시시공 방법을 고려해 내풍 안정성을 평가하였다.
내풍 안정성은 버페팅 해석으로 평가하였다. 검토 결과 순차가설 방법으
로 deck를 시공할 경우 특별한 안정화 방안 없이 시공이 가능하다. 하
지만 가설기간 동안 일부 행어의 길이조정 작업이 요구된다. 반면, 동시
시공 방법은 현수구간 가설 초기 현수구간 deck에 과도한 비틀림 변형
이 발생한다. 이를 개선하기 이한 구조 안정화 방안으로 X-type
bracing, Rigid beam 과 Strut system을 검토하였다. 검토 결과 가장
효과적인 안정화 방안은 Strut system 이다. 동시시공 방법으로 deck
를 시공할 경우 주케이블에 Strut system을 설치하여 내풍 안정성을 확
보한 시공이 가능하다. 이는 순차 시공 대비 시공공기를 단축 시키는
효과를 얻을 수 있다. 하지만 동시 시공에 따른 두 가지 시스템의 가설
관리가 필요 하다는 점을 고려해야 한다. 가설 중 내풍 안정화 방안인
Strut system은 가설 구조물인 리프팅 겐트리로 대체 가능하다. 사장-
현수교의 현수구간 deck 가설 중 발생하는 불안정성은 Strut system과
리프팅 겐트리를 적절히 조합하여 적용하면 효과적인 제진이 가능하며
154
내풍 안정성을 확보한 급속 시공이 가능하여 가설 공기를 줄일 수 있다.
제안된 구조적 내풍 안정화 방안은 장경간 현수교 및 사장-현수교의 현
수구간 가설 중 발생하는 deck의 불안정성을 제어하는 하나의 방안으로
활용이 가능 할 것으로 기대 된다.
주요어: Cable-stayed suspension bridge, Suspension-to-span ratio,
Transition part, aerodynamic stability, Construction phase,
Deck erection sequence, Parameter study
Student Number: 2012-30248