disclaimer - seoul national...
TRANSCRIPT

저 시-비 리- 경 지 2.0 한민
는 아래 조건 르는 경 에 한하여 게
l 저 물 복제, 포, 전송, 전시, 공연 송할 수 습니다.
다 과 같 조건 라야 합니다:
l 하는, 저 물 나 포 경 , 저 물에 적 된 허락조건 명확하게 나타내어야 합니다.
l 저 터 허가를 면 러한 조건들 적 되지 않습니다.
저 에 른 리는 내 에 하여 향 지 않습니다.
것 허락규약(Legal Code) 해하 쉽게 약한 것 니다.
Disclaimer
저 시. 하는 원저 를 시하여야 합니다.
비 리. 하는 저 물 리 목적 할 수 없습니다.
경 지. 하는 저 물 개 , 형 또는 가공할 수 없습니다.

공학석사 학위논문
RC Column Retrofit with Ultra High Performance Concrete
초고성능 콘크리트를 이용한 기둥 보강 연구
2017 년 2 월
서울대학교 대학원
건축학과
구 인 영

RC Column Retrofit with Ultra High Performance Concrete
지도 교수 홍 성 걸
이 논문을 공학석사 학위논문으로 제출함
2017 년 2 월
서울대학교 대학원
건축학과
구 인 영
구인영의 공학석사 학위논문을 인준함
2017 년 2 월
위 원 장 (인)
부위원장 (인)
위 원 (인)

Abstract
RC Column Retrofit with Ultra High Performance Concrete
Koo, In Yeong Department of Architecture and Architectural Engineering
College of Engineering Seoul National University
Ultra high performance concrete is a material that can exert a compressive
strength of 180 MPa or more and a tensile strength over 10 MPa. Recently,
researches and applications of UHPC as a structural retrofit material for
existing structural members are actively proceeding. This study deals with a
column retrofit with UHPC jacket that can efficiently utilize strong
compressive capacity of UHPC. The UHPC column retrofit method can allow
jacket designed in less thickness than ordinary concrete jacketing. Also, it is
expected to have superior strengthening performance compared to other
column retrofitting methods. Furthermore excellent performances are
expected in durability, fire resistance, and abrasion resistance.
The purpose of this study is to evaluate the strengtheningt performance of
UHPC jackets. Considering the constructability for jacketing, any inserting
additional flexural reinforcement or shear connectors were not considered and
only pure jacketing performances were estimated. The main focus of this
research was on the evaluation of strengthening performance for lateral load i

resistance capacity among various performances required for seismic
strengthening of the column. For this purpose, experimental research and a
theoretical analysis on the failure mode were carried out.
In the experiment, UHPC jacket was found out to have excellent the
strengthening performance in lateral load resistance. In the case of specimens
with no additional stirrup reinforcement, the columns were destroyed by the
massive diagonal cracks on the jacket and as the cracks increased, the
performance of jacket has decreased very abruptly. It was confirned that
UHPC jacketing may cause additional unexpected failure due to additional
shear force applied to adjacent beams or slabs. Therefore, proper measures
should be taken for this kind of unexpected failure.
In theoretical failure mode analysis, three failure modes were considered .
For each failure mode, corresponding failure curve was plotted against the
axial load and lateral load. When the lateral load acts on the flexural member,
the interface shear force is larger than that of the general RC composite
section due to the characteristic of the section in which the UHPC having
strong rigidity surrounds the inner column. When the interface shear strength
is not sufficiently large, the composite column is prone to fail by diagonal
tension cracks in jacket. Therefore, it is recommended to control the
occurrence and opening of cracks in the jacket by inserting additional
reinforcing bars or meshes in the jacket for better performance and further
researches on this method and performance will be required.
Keywords : UHPC, retrofit, column, seismic
Student Number : 2015-21094
ii

Contents
Abstract .................................................................................. i
Contents ................................................................................ iii
List of Tables ......................................................................... v
List of Figures ...................................................................... vi
Chapter 1. Introduction ....................................................... 1
1.1 Backgrounds ........................................................................................... 1
1.2 Scope and Objectives ............................................................................. 3
Chapter 2. Literature Review ............................................. 4
2.1 Ultra High Performance Concrete .......................................................... 4
2.2 Retrofitting RC column with concrete jacket ......................................... 5
2.3 Interface shear strength model ............................................................... 7
2.4 Direct shear strength model of UHPFRC ............................................... 9
Chapter 3. Experimental Research ................................... 10
3.1 Experiment program ............................................................................. 10
3.1.1 Introduction ................................................................................... 10
3.1.2 Geometry & material detail of retrofitting target ........................... 11
3.1.3 Nominal strength of retrofitting target column ............................. 13
3.1.4 Test variable .................................................................................. 16
3.1.5 Manufacturing process .................................................................. 18
3.1.6 Material property test results ......................................................... 20
iii

3.1.7 Test set-up and procedure .............................................................. 22
3.2 Test results ............................................................................................ 25
3.2.1 Reference RC column ................................................................... 25
3.2.2 RC column retrofitted by 30mm jacket (R-30) ............................. 27
3.2.3 RC column retrofitted by 50mm jacket (R-50) ............................. 29
3.2.4 Strengthening effect of UHPC jacket ............................................ 34
3.2.5 Nominal shear strength expectataion ............................................ 37
3.2.6 Collapse mechanism ...................................................................... 39
3.2.7 Strain of transverse re-bars ............................................................ 40
3.2.8 RC column retrofitted by 50mm jacket and stirrups (R-50S) ....... 42
Chapter 4. Theoretical Analysis ........................................ 49
4.1 Introduction .......................................................................................... 49
4.1.1 General procedure ......................................................................... 49
4.1.2 Analysis method ............................................................................ 50
4.1.3 Basic assumptions ......................................................................... 50
4.2 Failure mode analysis ........................................................................... 52
4.2.1 Failure mode classification ............................................................ 52
4.2.2 Flecxural compressive failure at column ends .............................. 54
4.2.3 Direct shear failure between web-flange of UHPC jacket ............ 58
4.2.4 Diagonal tension failure in UHPC web ......................................... 65
4.2.5 Analysis result ............................................................................... 78
Chapter 5. Conclusion ........................................................ 83
References ........................................................................... 85
초 록 ................................................................................ 88
iv

List of Tables
Table 3-1 Properties of retrofitting target ....................................................... 12
Table 3-2 Test variables and detail ................................................................. 17
Table 3-3 Mixture portion of concrete ........................................................... 20
Table 3-4 Material properties of reinforcement ............................................. 20
Table 3-5 UHPC mixing portion .................................................................... 21
Table 3-6 Experiment result summary ........................................................... 36
Table 3-7 Nominal shear strength of UHPC jacketed column ....................... 38
Table 4-1 Failure mode classification ............................................................ 54
v

List of Figures
Fig. 1-1 Prototype of UHPC retrofit for an existing RC frame ........................ 3
Fig. 3-1 Geometry of RC column .................................................................... 11
Fig. 3-2 Strain compatibility solution ............................................................ 13
Fig. 3-3 P-M interaction diagram for the target RC column .......................... 14
Fig. 3-4 P-V interaction diagram for the target RC column ........................... 16
Fig. 3-5 Surface before/after sandblast .......................................................... 18
Fig. 3-6 UHPC slump test .............................................................................. 18
Fig. 3-7 Manufacturing process of test specimens ......................................... 19
Fig. 3-8 Material properties of RC columns and additional reinforcements .. 21
Fig. 3-9 UHPC material test results: .............................................................. 22
Fig. 3-10 Lateral loading protocol .................................................................. 22
Fig. 3-11 Test set-up ....................................................................................... 23
Fig. 3-12 Measurement set-up ........................................................................ 24
Fig. 3-13 Crack pattern (R-0) ......................................................................... 26
Fig. 3-14 Crack pattern (R-30) ....................................................................... 28
Fig. 3-15 Crack pattern (R-50) ....................................................................... 30
Fig. 3-17 Load-displacement curve (R-0) ...................................................... 31
Fig. 3-18 Load-displacement curve (R-30) .................................................... 31
Fig. 3-19 Load-displacement curve (R-50) .................................................... 32
Fig. 3-20 Crack opening process .................................................................... 32
Fig. 3-21 extended image of diagonal crack .................................................. 33
Fig. 3-22 Load-drift curve envelop ................................................................ 34
Fig. 3-23 Stiffness against displacement envelops ......................................... 35
Fig. 3-24 Strain of tie bars in core column ..................................................... 40
Fig. 3-25 Crack pattern (R-50S) ..................................................................... 43
Fig. 3-26 Load-displacement curve (R-50) .................................................... 44
Fig. 3-27 Base crack after experiment ........................................................... 44
Fig. 3-28 Rocking state of R-50S ................................................................... 44
vi

Fig. 3-29 Strain of tie bars in UHPC jacket ................................................... 46
Fig. 3-30 Strain of tie bars along the height ................................................... 48
Fig. 4-1 Jacket connection to stub .................................................................. 51
Fig. 4-2 Crack types of experiment result (R-30) .......................................... 52
Fig. 4-3 Assumed stress-strain curve of concrete ........................................... 55
Fig. 4-4 Strain compatibility solution for composite section ......................... 56
Fig. 4-5 P-M interaction diagram for jacketed section ................................... 57
Fig. 4-6 P-V interaction diagram (failure mode 1) ......................................... 57
Fig. 4-7 crack patterns of mode 2 and normal stress distribution at end ........ 58
Fig. 4-8 vertical stress distribution in flange .................................................. 58
Fig. 4-9 shear flow in column section: ........................................................... 59
Fig. 4-10 Cohesion coefficient for sandblasted surface (Santos et el, 2014) . 61
Fig. 4-11 P-V interaction diagram (30mm, mode 2) ...................................... 63
Fig. 4-12 P-V interaction diagram (50mm, mode 2) ...................................... 63
Fig. 4-13 Analysis method for failure mode 2................................................ 64
Fig. 4-14 Crack patterns of mode 3 ................................................................ 65
Fig. 4-15 Strain distribution at height z .......................................................... 66
Fig. 4-16 Normal stress distribution by Cw in web at (A) .............................. 68
Fig. 4-17 Normal stress distribution by Cw in web at (B) .............................. 69
Fig. 4-18 shear flow of flange in column section: .......................................... 71
Fig. 4-19 Normal stress distribution by Cf in web ......................................... 72
Fig. 4-20 Mohr’s circle ................................................................................... 73
Fig. 4-21 Principal stress distribution at the cracking load ............................ 74
Fig. 4-22 Analysis method for failure mode 3................................................ 76
Fig. 4-23 P-V interaction diagram (30mm, mode 3) ...................................... 77
Fig. 4-24 P-V interaction diagram (50mm, mode 3) ...................................... 77
Fig. 4-25 Final P-V interaction diagram (R-50) ............................................. 78
Fig. 4-26 P-V diagram (b=300mm, ρ=2.1) .................................................... 81
Fig. 4-27 P-V diagram (b=300mm, ρ=3.0) .................................................... 81
Fig. 4-28 P-V diagram (b=600mm, ρ=2.1) .................................................... 82
Fig. 4-29 P-V diagram (b=600mm, ρ=3.0) .................................................... 82 vii


Chapter 1. Introduction
1.1 Backgrounds
Korea is located inside an earthquake plate and thus its earthquake shows
a moderate seismic tendency. However, thesedays the occurrence frequency of
the earthquake in Korea has been gradually increasing. Especially, in 2016,
there occurred the largest earthquake in Gyung-Ju, since the observance of
earthquake started in 1978. Its magnitude was estimated up to 5.8. As
population and national infrastructures are concentrated in urban areas, in case
of an earthquake, huge damage is expected and it is urgent to prepare for an
earthquake. Meanwhile, the domestic seismic design criteria was first
introduced in 1988, and most of the structures built before that do not satisfy
the seismic design criteria. Structural members of these buildings are
considered to have weak seismic performance due to the wide spacing of the
stirrup reinforcements and use of 90 ̊hooks.
There are three widely used techniques for retrofitting RC columns:
Reinforced concrete jacketing, FRP wrapping, steel jacketing. Concrete
jacketing method is most frequently used in field. It can increase overall
structural capacities such as axial load capacity, shear strength, flexural
strength and deformation capacity. However, it requires jacket thickness
higher than 70-100mm, leading to decrease architectural area while increasing
total mass of structure. On the other hand, FRP wrapping and steel jacketing
have advantages over concrete jacketing method such as much less thickness, 1

lower weight and better constructability. However, strengthening
performances are only limited to shear strength and deformation capacity.
Axial load capacity can be increased by confinement effect, but is limited in
extent. Besides, durability matters like fire or corrosion resistance should
come into consideration when applying these methods.
Recently, a new retrofit technique using UHPFRC jacket to complement
the weak points of existing method has been researched and applied to real
structures. UHPFRC is an ultra-high performance fiber reinforced concrete of
which compressive strength can reach over 180MPa and tensile strength over
10MPa by included fiber. This high strength can make it possible to exhibit
higher strengthening effect than using normal concrete jacket. Also, due to
high fluidity of UHPFRC, jacket thickness can reduce less than 30~50mm,
thus, minimize the main disadvantage of normal concrete jacketing method.
There are other advantages of UHPFRC retrofit such as high durability, good
adjustability with various situations and that it can be combined optionally
with other materials like wire mesh or textile mesh for better performances.
2

1.2 Scope and Objectives
The main goal of this research is to estimate strengthnening effect of
UHPC jacket for a sqaure RC column. Especially, the lateral load bearing
capacity of UHPC jacketed RC column is on the focus. The jacketing method
is limited to discontinuous jacket for a high constructability. It means that the
jacket is not physically connected to adjacent beam or stub, which would be
very difficult to install within a thin thickness of the jacket.
The structural experiment was performed to compare the maximum lateral
load before and after jacketing. The experiment was planned to focus on
evaluating lateral load bearing capacity. Theoretical analysis was also
conducted based on experimental results. Failure modes for a retrofitted
column were defined and corresponding failure loads were estimated.
Fig. 1-1 Prototype of UHPC retrofit for an existing RC frame
Column Jacketing
Beam overlay
3

Chapter 2. Literature Review
2.1 Ultra High Performance Concrete
There are several characteristics of UHPC which shows that it could be an
appropriate material to be applied as a reparing substance.
• Very high mechanical strength: The very dense microstructure due to its
very low water/binder ratio of only about 0.20 allow it to haver high
compressive strength up to seven times more than normal concrete. Also, due
to steel fibers inserted, it can have tensile strength up to 10MPa and exhibit
ductile behavior.
• Extremely low permeability: The high density of the UHPC matrix
brings extremely low permeability which mostly prevents the deleterious
environmental influences such as water and chlorides. UHPC also shows high
resistance of abrasion so that as a rehabilitation material, it can protect inner
structures effectively from physical damages.
• High fluidity: The high liquidity of UHPC allows it to adjust various
situations and circumstances. It can flow through relatively thin spaces so that
when applied to existing structures as a jacketing method, it can minimize the
required jacket thickness more than other materials. Also, when it is applied to
deteriorated concrete structures, it can permeate damaged parts or cracks so
that it can rehabilitate damages more efficiently.
4

2.2 Retrofitting RC column with concrete jacket
Beschi conducted two full-scale tests demonstrating the efficiency of the
HPFRC jacketing technique. With the application of a high performance fiber
reinforced concrete jacket, he showed that it was possible to increase the
bearing capacity of the column and of the beam column joint, reaching also an
adequate level of ductility. He concluded that the proposed technique resulted
suitable for strengthening existing RC structures characterized by low
concrete strength and low reinforcement ratios. In addition, the possibility of
applying a thin concrete jacket did not substantially change the stiffness of
structure, which might be relevant when the stiffness distribution of the
original building should not be significantly modified. Finally, it was
important to remark that the use of a self-compacting HPFRC jacket results in
very smooth cast surfaces, allowing avoiding the use of finishing plaster
layers, with an obvious advantage in terms of reduction geometry variations in
the structure.
Meda conducted an experiment about strengthening of corroded RC
columns with fiber reinforced concrete jacket. Reinforcement corrosion can
induce severe damage in reinforced concrete (RC) columns leading to a
relevant loss of bearing capacity. This condition can be even more critical in
case of seismic events. The possibility of repairing and strengthening
corrosion damaged columns with high performance fiber RC (HPFRC)
jacketing was investigated. The main aim of the retrofit was, not only to
restore the original bearing capacity, but also to increase the column durability.
In order to investigate the effectiveness of the proposed technique, full-scale
5

tests on RC columns under cyclic loads was performed. Two columns were
artificially corroded and one of them was repaired with a HPFRC jacket. This
study concluded that The use of a high performance concrete layer can protect
the core RC column and enhance its durability.
Zakaria studied aiming at investigating the effectiveness of strengthening
the entire height of downscaled square RC columns by applying Forta Ferro
Polypropylene Fibrous Ultra High Performance Self Compacting Concrete
(Fibrous UHPSCC) as a jacketing material. He concluded that the self-
compaction behavior of the Fibrous UHPSCC is very effective in
casting the RC column jackets easily without manual compaction. The
benefits of using self-compacting concrete is the fact that the jacketing
thickness can be relatively thin and steel congestion which often causes
segregation and honeycombing problems can be lessened. It is
recommended to strengthen the four sides of square RC columns using
the Fibrous UHPSCC as a jacketing material, as it is a high
compressive strength material and reinforced by fibers which enhanced
the ductility and reduced the jacketing thickness.
6

2.3 Interface shear strength model
In Eurocode 2, the interface shear strength between two concrete layers
cast at different times is proposed as a summation of three main elements
given as:
( ), sin cos 0.5if allow ctd n yd cdc f f ft µs ρ µ a a n= ⋅ + + + ≤ (1)
In this equation, ctdc f⋅ refers to the concrete cohesion strength resulting
from concrete chemical adhesion in the interface layer, where 𝑐𝑐 is the
cohesion coefficient and ctdf is the concrete tensile strength of the concrete
topping layer. nµs is a frictional stress factor resulting from the friction
coefficient at the interface, 𝜇𝜇 and ns which is the normal stress.
( )sin cosydfρ µ a a+ is a clamping stress component resulting from the
steel reinforcements crossing the interface, in which 𝜌𝜌 is the reinforcement
ratio, ydf is the design yield stress of the reinforcement and 𝛼𝛼 is the angle
between the steel reinforcement and the plane and 𝜐𝜐 is strength reduction
function. Design expression in Eurocode 2 is based on qualitative observation
of the surface textures that range from very smooth to very rough. The
recommendation of roughness height for rough surface should be at least 3
mm and for indented or very rough surface at least 5 mm. The value of the
friction coefficient has a variation from 0.50 – 0.90, while the cohesion
coefficient ranged from 0.025 – 0.50. These valures are corresponding to the
surface profile from very smooth to very rough.
CEB-FIB Model Code 2010 quantifies the surface roughness using the
average roughness, aR which is determined as the mean value of texture
7
height along a certain length, ml . The surface texture is measured and
categorized from very smooth to very rough. Very smooth is where the
surface is cast against steel formwork, thus 𝑅𝑅𝑎𝑎 is not measurable. Meanwhile,
smooth surface is untreated and cast against wooden formwork where aR is
taken as less than 1.5 mm, and rough surface is roughened by sand blasting
where aR is more than 1.5 mm. For very rough surface, the surface is
roughened using high pressure water jet where the indented has an aR of
more than 3 mm. The friction coefficient ranged from 0.50 – 1.40, and the
concrete adhesion is categorized into rough and very rough surface with the
mean shear resistance ranged from 1.5 – 3.5 N/mm2. The interface shear
strength equation is given as:
( )c n yft t µ s κ ρ= + + ⋅ ⋅ (2)
where, 𝜅𝜅 is the interaction “effectiveness” factor and ct is the adhesion or
interlocking mechanism. The term ( )n yfµ s κ ρ+ ⋅ ⋅ is contributed from
friction and dowel action. The assessment on the strong adhesive bonding is
when the adhesive bonding and interlocking are the main contributing
mechanisms to the interface shear strength, while the weak adhesive bonding
is when friction and dowel action are the main contributing mechanisms to the
interface shear strength.
8

2.4 Direct shear strength model of UHPFRC
The direct shear strengh of UHPFRC can be presented in a similar
composition which is a combination of three components: cohesion, friction
and dowel action. However, in UHPFRC, the contribution of steel fibers
should be taken into account in frictional factor. Lee at al suggested the
frictional shear strength of UHPFRC given as equation (3) based on the
experimental analysis and plasticity theory. However, ctd ccf A Kµ was added
to the basic frictional shear strength equation of normal concrete. It was
assumed that the tensile strength by steel fiber is applied as an average normal
confinement force to cracking plane. The upper limit of shear friction strength
was defined as an upper limit of shear strength suggested by K-UHPC
structure design guidelines issued by Korea Concrete Institute, assuming that
it is a strength by compressive strut rupture of UHPC. For a monolitic
structure, cohesion coefficient c of UHPC is defined to be 2.0 MPa and
friction coefficient μ to be 1.4.
( ) ( ),
2 3,
sin cos
0.84cwd c cc n u ctd cc yd w
u cd cc
V A f K A f A
f A
t µ s µ a a= + + + +
≤ (3)
9

Chapter 3. Experimental Research
3.1 Experiment program
3.1.1 Introduction
As indicated in chapter 2.2, previous experiments about column
strengthening with UHPC or HRC are only dealing with single curvature
columns. .In single curvature column, required shear capaticy is usually lower
than flexural capacity, because a/d ratio of single-curvature column is twice as
large as that of double-curvature column. Hence, previous researches were
focusing on flexural strengtheing effect of UHPC jacket. However, in real
building, usually, columns have double curvature when applied lateral load.
And for unseismic designed columns are normally more vulernable to shear
than flexure.
This experiment focuses on shear strengthening performance of UHPC
jacket. For this purpose, column specimens were planed in double curvature
and designed to be governed by shear capacity, not by flexural capacity when
applied lateral load. There are several factors to be estimated in seismic
retrofit experiments such as lateral load resistance capacity, ductility, stiffness,
energy dissipation, etc. Among these factors, this research and the
experiments mainly concentrated to estimate strenghenging lateral load
resistance performace of UHPC jacket. Jacket thickess and additional stirrup
reinforcement insert were planned as variables.
10

3.1.2 Geometry & material detail of retrofitting target
Fig. 3-1 Geometry of RC column
Four identical RC column specimens were manufactured in half scale. The
dimensions adopted for the column cross section and height were
300×300mm and 1260mm, respectively. The corresponding span to depth
ratio is 4.15. The longitudinal reinforcement consisted of eight 22mm
diameter bars and corresponding reinforcement ratio is 3.44%. These
relatively small span to depth ratio and large reinforcement ratio were
intended to make a shear failure mode both in before and after retrofitting, in
order to make it clear to define shear strength of specimens. The transverse
reinforcement comprised of 10mm diameter stirrups with 150mm spacing.
11

The column has 500×500mm foundations at both upper and lower stubs to
have double curvature experiment. Detail geometres and material properites
of the RC column are described in Fig. 3-1 and Table 3-1.
Table 3-1 Properties of retrofitting target
Column geometry
section 300mm × 300mm
Height, h 1260mm
Longitudinal reinforcement 8 × HD22
Transverse reinforcement HD10@150mm
Nominal strength
Concrete, cf ′ 24 MPa
Reinforcement, yf 400 MPa (SS400)
12

3.1.3 Nominal strength of retrofitting target column
a) Moment capacity
The nominal moment capacity of the target column can be estimated using
strain compatibility solution. This process starts with assuming linear strain
distribution among the whole section and setting the value of the strain of
extreme compressive fiber, 0.003cuε = . With a stress-strain relationship of
materials, the stress distribution and corresponding net normal force and
moment can be calculated. The process is briefly described in Fig. 3-2. The
iteration of this process while varying the neutral axis location, gives the P-M
interation diagram. Fig. 3-3 shows the resultant P-M interation diagram for
this RC section. Herein, any strength reduction factor was not considered.
(a) Strain distribution
(b) Force distribution
Fig. 3-2 Strain compatibility solution
cuε
c
cCsiF
13

Considering that the column is designed to have double curvature in
bending, the maximum bending moment, M shoud satisfy equation (4)
2M VL= (4)
where,
V = lateral load applied to column
L = length of the column
From the equation (22), the P-M interaction diagram of Fig. 3-3 can be
transformed to P-V interaction diagram, as shown in solid line of Fig. 3-4.
Fig. 3-3 P-M interaction diagram for the target RC column
b) Shear capacity
14

The shear strength, nV of the target column can be calculated from the
following equations (5) -(7) in ACI 318-11.
n c sV V V= + (5)
'0.17 114c c w
g
PV f b dA
= +
(6)
v yts
A f dV
s= (7)
where,
ytf = nominal strength of stirrup reinforcement (MPa)
s = stirrup spacing (mm)
The resultant shear strengh with respect to axial load, P is plotted with
dotted line in Fig. 3-4. This graph shows that the column would be governed
by shear failure at lower axial load and by flexural failure at higher axial load.
The axial load in this experiment was 0.3 g cA f ′ so that the target column
would fail in flexural failure.
15

Fig. 3-4 P-V interaction diagram for the target RC column
3.1.4 Test variable
Four RC columns were retrofitted in different ways. The jacket thickness
was chosen as a main variable. R-0 remained unretrofitted as a reference
specimen. R-30 and R-50 were retrofitted by 30mm and 50mm UHPC jacket,
respectively. 30mm was chosen as it is 10% of the column width. 50mm was
chosen, because this thickess was thought as the minimum thickness that
could afford additional reinforcement in jackets. The details of the three
specimens are summarized in Table 3-2.
flexural failure
shear failure
16

Table 3-2 Test variables and detail R-0 R-30 R-50 R-50S
Retrofit Method Reference 30mm jacket
(10% thinkness) 50mm jacket
(16.7% thickness) 50mm jacket + additianl striups
Section
Elevation
17

3.1.5 Manufacturing process
The manufacturing processes of the test specimens are shown in Fig. 3-7.
First of all, three identical RC columns were manufactured (Fig. 3-7 (a)-(c)).
After concrete curing had finished, the surface of the column was sandblasted
by 100MPa air pressure so that the surface roughness could reach about 3-
4mm (Fig. 3-7 (e)). This surface roughening technique was already
demonstrated effective by Martinola et al (2010). Fig. 3-5 shows the image of
the column surface before and after sandblasting.
Then, the jacketing forms were installed for R-30 and R-50. For the
convenience in UHPC pouring, the formwork were made lied down(Fig. 3-7
(f)). UHPC was mixed on the place and poured onto core column (Fig. 3-7
(g)). Fig. 3-7 shows that the slump test result of the UHPC was about 600mm,
which shows high fluidity of the UHPC. After pouring, UHPC was cured in
hot steams about 90℃ for 72 hours(Fig. 3-7 (h)).
Fig. 3-5 Surface before/after sandblast Fig. 3-6 UHPC slump test
18

(a) Arrange reinforment bars (b) Column formwork
(c) Concrete placing (d) Disassemble formwork
(e) sandblasting (f) jacketing formwork
(g) placing UHPC (h) steam curing
Fig. 3-7 Manufacturing process of test specimens 19

3.1.6 Material property test results
The mixture portion of concrete with nominal compressive strength of
24MPa is shown inTable 3-3. Concrete standard specimens of 10cm×20cm
size were casted according to KS F 2403 and 3 specimens were tested
following with KS F 2405. The test results are shown in Fig. 3-8 (a). Actual
compressive strength of concrete came out to be 29.1MPa.
In the case of reinforcement used in this research, direct tension test
results and material properties are listed inTable 3-4. D22 acting as main
longitudinal reinforcement in RC columns showed 490MPa yield strength.
D10 used as a stirrup reinforcement showed about 465MPa yield strength.
Table 3-3 Mixture portion of concrete Nominal Strength (MPa)
W/C (%)
S/a (%)
Unit weight(kgf/m3)
Cement Water Sand Grave Admixture
24 48 47.5 344 165 860 968 1.72
Table 3-4 Material properties of reinforcement Diameter Steel grade syf (MPa) suf (MPa) sE (GPa)
D22 SD400 490 628 187
D10 SD400 465 628 187
20

(a) (b)
Fig. 3-8 Material properties of RC columns and additional reinforcements a) Compressive stress-strain curve of concrete, b) Tensile stress-strain curve of
SD400 D22
The mixture portion of UHPC is specified in Table 3-5. The steel fiber
used was only 13mm, which is a bit short, in order to prevent unexpected
defect in UHPC pouring. The characteristic tensile strength of the fiber is
2500MPa according to manufacturer.
Compression test for UHPC was carried out in the same way for normal
concrete. Its compressive strength came out to be 144MPa and maximum
strain was about 0.004. The tensile strength was estimated to be 6.4MPa and
tensile cracking strength was 4.9MPa.
Table 3-5 UHPC mixing portion Nominal Strength W/B
Mass proportion
Cement Silica fume Sand Filling
powder Super-
plasticizer Steel fiber (MPa) (%)
180 20 1 0.25 1.1 0.3 0.018 1.5%
0
5
10
15
20
25
30
35
0 1 2 3
Com
pres
sive
stre
ss (M
Pa)
Strain (×10-3mm/mm)
0
100
200
300
400
500
600
700
0 50 100 150
Ten
sile
stre
ss (M
Pa)
Strain (×10-3mm/mm)
21

(a) (b)
Fig. 3-9 UHPC material test results:
a) Compressive stress-strain curve, b) Tensile stress-displacement curve.
3.1.7 Test set-up and procedure
The four tests were conducted in the same set-up as presented in Fig. 3-11.
Initial constant axial load of 0.3 c gP f A′= was applied to column by two
100ton oil jacks and then, displacement controlled horizontal cyclic load V
was applied by a 200ton actuator. The amplitude of imposed displacement of
the first cycle was 3mm and increased by 3mm for every additional cycle up
to 15mm, and thereafter increased by 6mm.
Fig. 3-10 Lateral loading protocol
020406080
100120140160
0 1 2 3 4
Com
pres
sive
stre
ss (M
Pa)
Strain (×10-3mm/mm)
012345678
0 1 2 3 4
Ten
sile
stre
ss (M
Pa)
Displacement (mm)
-3.00
-2.00
-1.00
0.00
1.00
2.00
3.00
0 2 4 6 8 10 12 14 16
Dri
ft R
atio
(%)
Cycle number
22

Fig. 3-11 Test set-up
23

Fig. 3-12 Measurement set-up
Steel gauges were attached to the main longitudinal bars at both ends of
the columns to measure the flexural curvature and yield point of the members.
Steel gauges for stirrup bars were attached at the points where shear failure is
expected. The shear deformation of the center part of the column was
measured by attaching the concrete gauge in X shape. LVDT was installed in
order to measure the flexural curvature of the end portion of the member
where maximum flexural deformation is expected.
24

3.2 Test results
3.2.1 Reference RC column
The crack patterns of the unretrofitted reference specimen R-0 during and
after test are as shown in Fig. 3-13. The initial cracks occurred around the end
of the column as flexural cracks at 0.46% drift ratio. These cracks spread as
flexural - shear cracks until 0.92%. However, when the displacement reached
1.16%, vertical cracks occurred rather than flexural - shear cracks, which were
dominant until the previous stage. Afterwards, the strength had dropped
abruptly. The vertical cracks almost coincide with the position and direction
of the longitudinal reinforcements. Therefore, it can be seen that the failure
mode was a bond failure due to the separation between the rebars and
concrete. This is not the originally intended shear failure mode. It is inferred
that due to the excessive amount of longitudinal rebars in small cross section
had led to this unexpected bond failure. Also, tight loading cycles might have
influenced on the result.
During the test, any rebars didn’t reach the yield point. The maximum
lateral load came out to be 210.4 kN and the maximum displacement was
1.16%. The resultant load-displacement curve is shown in Fig. 3-16
25

Fig. 3-13 Crack pattern (R-0)
26

3.2.2 RC column retrofitted by 30mm jacket (R-30)
The crack patterns of the R3 specimen reinforced with UHPC of 30mm is
described in Fig. 3-14. Owing to the crack control capability of the steel fiber,
any cracks in the column surface did not occur until the drift ratio reaches
0.90%, except for the separation between UHPC jacket and end stubs. When
the displacement increased to 1.16%, there occured a large diagonal crack
starting at column center. The strength was not immediately reduced right
after the occurance of the cracks. However, as following load was applied, the
diagonal cracks were spread over while other small cracks occurred
simultaneously. As the massive crack reaches around the pull-out length of the
steel fiber, the UHPC jacket does not function and the strength decreased
drastically.
It was found that some of the longitudinal reinforcements had yielded
around the maximum strength, but the diagonal cracks occurred almost at the
same time so that it did not lead to the flexural yielding of the entire members.
The maximum strength came out to be 359.8kN and the maximum
displacement was 1.65%.
27

Fig. 3-14 Crack pattern (R-30)
28

3.2.3 RC column retrofitted by 50mm jacket (R-50)
For R-50 specimens retrofitted with 50mm UHPC jacket, cracks patterns
and the failure mode appeared similar to those of R-30. At the drift ratio of
1.78%, some vertical cracks occurred in the compression zone. Thereafter,
when the drift increased up to 2.20%, large diagonal cracks occurred at the
upper part of the column. In contrast to R-30, diagonal cracks occured in both
positive and negative directions. As the cracks of the diagonal cracks
gradually spread, the steel fibers were observed to be pulled out or cut off
from the UHPC matrices. It resulted in a sudden drop in lateral load capacity.
It seems that when massive diagonal cracks opened, the UHPC jacket and the
core column did not act as a unified section any more.
It was found that the longitudinal reinforcements yielded at 1.09% of drift
ratio before the initial cracks occurred, and it was confirmed that the entire
member showed yielding behavior from the load - displacement curve as
shown in Fig. 3-18. The maximum lateral strength came out to be 478.9kN
and the maximum displacement was 2.72%.
29

Fig. 3-15 Crack pattern (R-50)
30

Fig. 3-16 Load-displacement curve (R-0)
Fig. 3-17 Load-displacement curve (R-30)
-600
-400
-200
0
200
400
600
-3 -2 -1 0 1 2 3
Lat
eral
load
, V (k
N)
Drift ratio, Δ/L (%)
-600
-400
-200
0
200
400
600
-3 -2 -1 0 1 2 3
Lat
eral
load
, V (k
N)
Drift ratio, Δ/L (%)
Diagonal cracking
Rebar yielding
31

Fig. 3-18 Load-displacement curve (R-50)
Fig. 3-19 Crack opening process
-600
-400
-200
0
200
400
600
-3 -2 -1 0 1 2 3
Lat
eral
load
, V (k
N)
Drift ratio, Δ/h (%)
Diagonal cracking
Rebar yielding
32

Fig. 3-20 extended image of diagonal crack
33

3.2.4 Strengthening effect of UHPC jacket
Compared with the R-0 specimen, the maximum load capacities of R-30
and R-50 increased about 71% and 128%, respectively. The maximum strain
increased about 42% and 134%, respectively. Considering that the column
area increased 44% and 78%, the increase in strength was almost proportional
to the increase in area. However, the maximum displacement of R-50 was
superior to that of R-30. This is because in R-50, the rebars has reached the
yield points and R-30 has been fractured before yielding.
Fig. 3-21 Load-drift curve envelop
-600
-400
-200
0
200
400
600
-3 -2 -1 0 1 2 3
Lat
eral
load
, V (k
N)
Drift ratio, Δ/h (%)
R-0 R-30 R-50
Diagonal cracking
Rebar yielding
34

For each cycle, the point corresponding to 75% of the maximum value /
additional force maximum strength is connected, and the stiffness is
calculated from the drift by the slope, and the result is shown in Fig. 3-22.
The initial stiffness of unreinforced specimen R0 was 35.6kN, R3 was
68.0 kN / mm, and R5 was 76.2 kN / mm. It was confirmed that the stiffness
increased by 91% and 114%, respectively. The decrease of the stiffness due to
the displacement was linearly decreased in the R0 case, but in the case of the
reinforced specimen, the decrease width was relatively large at the initial
stage and then decreased linearly thereafter. This is due to the fact that unlike
R0, the reinforced specimens show prominent lifting at the joints. After the
initial rapid decline, stiffness reduction was observed to be similar to R0. At
this time, the stiffness of R3 and R5 increased by 69% and 100%, respectively.
Fig. 3-22 Stiffness against displacement envelops
0
10
20
30
40
50
60
70
80
90
0 0.5 1 1.5 2 2.5
Stiff
ness
(kN
/mm
)
Drift ratio (%)
R-0 R-30 R-50
35
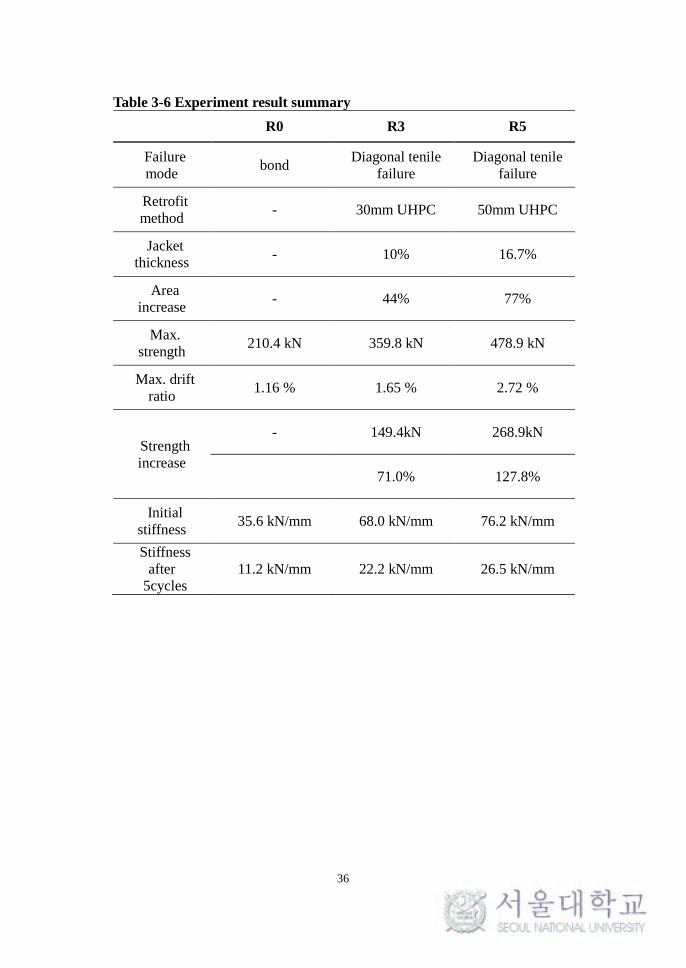
Table 3-6 Experiment result summary
R0 R3 R5
Failure mode bond Diagonal tenile
failure Diagonal tenile
failure
Retrofit method - 30mm UHPC 50mm UHPC
Jacket thickness - 10% 16.7%
Area increase - 44% 77%
Max. strength 210.4 kN 359.8 kN 478.9 kN
Max. drift ratio 1.16 % 1.65 % 2.72 %
Strength increase
- 149.4kN 268.9kN
71.0% 127.8%
Initial stiffness 35.6 kN/mm 68.0 kN/mm 76.2 kN/mm
Stiffness after
5cycles 11.2 kN/mm 22.2 kN/mm 26.5 kN/mm
36

3.2.5 Nominal shear strength expectataion
FIB Bulletin 24 and Eurocode 8 suggested that the nominal shear strength
for concrete jacketed RC column can be evaluated assuming the composite
section as unified. Strength expressions are not suggested specifically. The
nomional shear strength of UHPC jacketed column can be estimated with
similar approach. Assuming unified section between RC and UHPC jacket,
the shear strength is the summation of all the contributions. There are three
factors for the shear strength contribution: RC core, jacket matrix, steel fibers.
In the case of additional stirrups inserted, their contributions should also be
summed up. Therefore, the nominal shear strength, dV can be calculated by
d core jm jf jsV V V V V= + + + (8)
where, coreV , jmV , jfV , jsV are RC core, matrix, fiber and stirrup
contributions, respectively. coreV and jsdV can be calculated by ACI code
provision. UHPC maxtix and fiber contributions can be calculated by
adjusting expressions in K-UHPC design guideline. It suggests that
0.18jm cd j jV f b d= and ( )tanjf sd u jV f b zb= , where cdf is design
compressive strength of UHPC, sdf is design average tensile strength in the
direction perpendicular to diagonal tension crack of UHPC, jb is width of
jacket, jd is effective depth, ub is angle occurring between axial direction
and diagonal tension crack plane and is limited to 30̊, z is distance from the
position of the resultant of the compressive stresses to the centroid of tensile
steel (mm), generally /1.15d . Herein, strength reduction factors were not
considered.
37

By the process explained above, nominal shear strength of test specimens
can be calculated. In Fig. 3-16 to Fig. 3-18, the dotted lines represent the
theoretical nominal shear strength. The calculated nominal strengths, Vd were
found to be a little bit higher than maximum experimental results. However,
the differences are small and considering the strength reduction factor, they
are within allowable levels.
Detail calculation results are summarized in Table 3-7 including all
contributions with experimental results. The ratio of Vd to Vexp were found to
be around 1.1, which means 10% errors. Thus, it coud be considered that the
shaer strength expression of equation (8) shows quite good expectations.
However, as the number of specimens that could be compared is restricted to
only two, the validity of equation (8) as a shear strength expression needs
additional verifications.
Table 3-7 Nominal shear strength of UHPC jacketed column
Vcore Vjm Vjf Vd Vexp Vd/Vexp
R-0 212 - - 212.0 210.4 1.01
R-30 212 36.3 142.2 390.5 359.8 1.08
R-50 212 64.8 254.0 530.8 478.9 1.11
(Unit : kN)
38
3.2.6 Collapse mechanism
There are two types of diagonal cracks in RC structural members. One is
shear compression crack and the other is diagonal tension crack. Considering
that the diagonal cracks in rotrofitted specimen (R-30, R-50) start around the
center of the column, not the point of load, and the shape of the cracks was far
from compressive rupture, this crack is identified as a diagonal tension crack.
If assuming UHPC as homogeneous material, the diagonal tension crack
would occur when the principal tensile stress in UHPC jacket reaches over the
tensile cracking strength of UHPC. Therefore, it is necessary to find out
principal stress distribution in the jacket in order to analyze the failure modes
of test results.
39

3.2.7 Strain of transverse re-bars
Fig. 3-23 (a), (b) and (c) show strains of stirrup bars that are located fourth
from the bottom stub for R-0, R-30 and R-50, respectively. In R-0 specimen,
the strain hase kept in linear elastic state and suddenly went up at last cycle.
This indicates that the column failed in very brittle manner. For R-30 and R-
50 specimens, they showed similar behaviors. Before diagonal crack occurred,
the strains have kept in linear elastic state, which means that there were not
notable cracks in core concrete and diagonal crack has just occurred in UHPC
jacket. Even after diagonal cracks occurred in jacket, the graphs show
continuous linear state. However, after a few cycles, the strains rose up
abruptly. It seems that as the diagonal cracks expanded the confinement effect
from the jacket lost and sudden cracks must have occurred in core column.
(a) R-0
Fig. 3-23 Strain of tie bars in core column
40
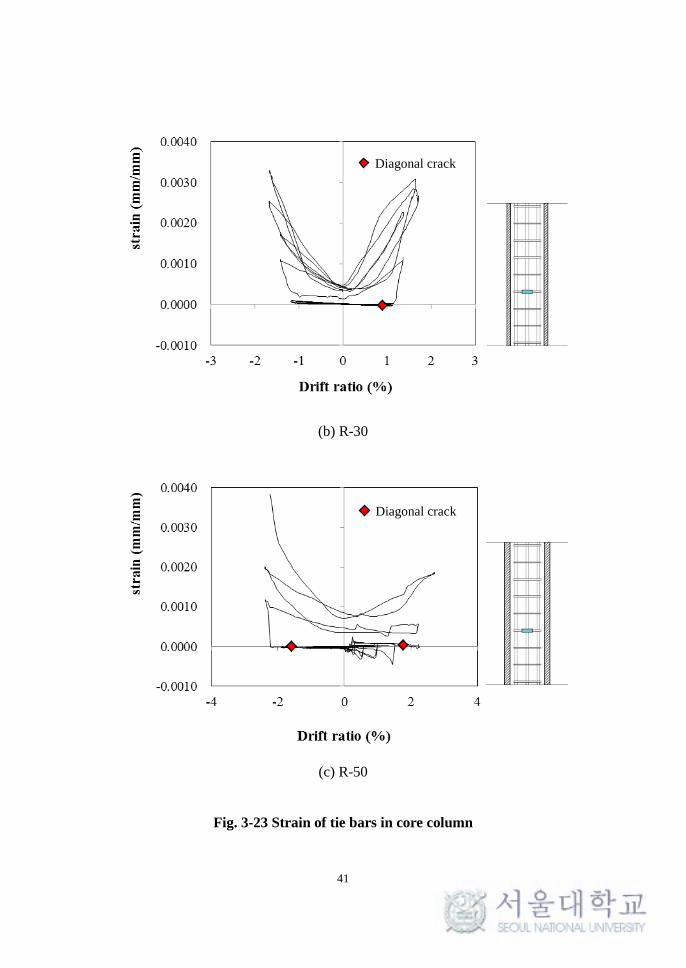
(b) R-30
(c) R-50
Fig. 3-23 Strain of tie bars in core column
Diagonal crack
Diagonal crack
41

3.2.8 RC column retrofitted by 50mm jacket and stirrups (R-50S)
The load-displacement curves and the cracks of R-50S reinforced with
shear reinforcement (D10 @ 150) in addition to UHPC of 50mm are shown in
Fig. 3-25. At a glance, it shows a clear difference from previous specimens.
While R3 and R5 specimens failed by massive diagonal crack, in R5S
specimen, although the diagonal crack occurred, it did not grow up to massive
scale. The shear cracks generated at the early stage seems to be sustained by
shear reinforcement so that cracks could not extend. As the jacket kept
surrounding the core column and making it as a unified section, columns
could be prohibited from shear failure and very ductile behavior was observed.
However, as resultant strength and stiffness of the column was much
stronger than that of the base stub, and the cracks occured in the base
continued to spread and open. The increase of lateral displacement gave rise
to the shear deformation and bending deformation of the column. However,
the flexural deformation itself concentrates on the joint and the column acted
like rigid body while pushing the base. As a result, the cracks of the base
absorbed a considerable amount of deformation energy and the column itself
only repeated rigid body motion. The experiment was terminated after the
deformation to 10% drift ratio.
The maximum lateral load was 480kN, which is slightly larger than that of
R5 specimen. This satisfied the fact that both columns reached yield points
and the flexural moments of both columns were same.
42

Fig. 3-24 Crack pattern (R-50S)
43

Fig. 3-25 Load-displacement curve (R-50)
Fig. 3-26 Base crack after experiment Fig. 3-27 Rocking state of R-50S
-600
-400
-200
0
200
400
600
-12 -10 -8 -6 -4 -2 0 2 4 6 8 10 12
Lat
eral
load
, V (k
N)
Drift ratio, Δ/L (%)
44

It was confirmed that the column height increased from 1260mm to
1270mm by 10mm after the experiment. In the case of the general column
lateral force test, the displacement after the flexural yielding should increase,
and the tensile fracture of the reinforcing bar due to the compression of the
concrete at the compression zone or the tensile failure at the tension zone
should occur. However, the compressive strength of the UHPC is only
marginal, It was judged that the maximum strain was not reached even at 10%
drift due to occurrence of many slip in the repeated force.
Fig. 3-28 shows the strain of tie bars inserted in UHPC jacket. The graphs
show obvious tendency that the strain was increasing linearly with drift ratio
after a certain point. At 10% drift ratio, the maximum strain of RS-5 bar came
out to be about 0.002mm/mm, which is a little bit lower than yield strain of
reinforcement. This means that if the test had kept proceeding, the RS-5 tie
bar would have yielded within a few cycles. While the strain graph of RS-5
which is located at around mid-height shows very symmetric shape, the strain
of RS-1 that is put in near the stub shows unsymmetric tendency.
45
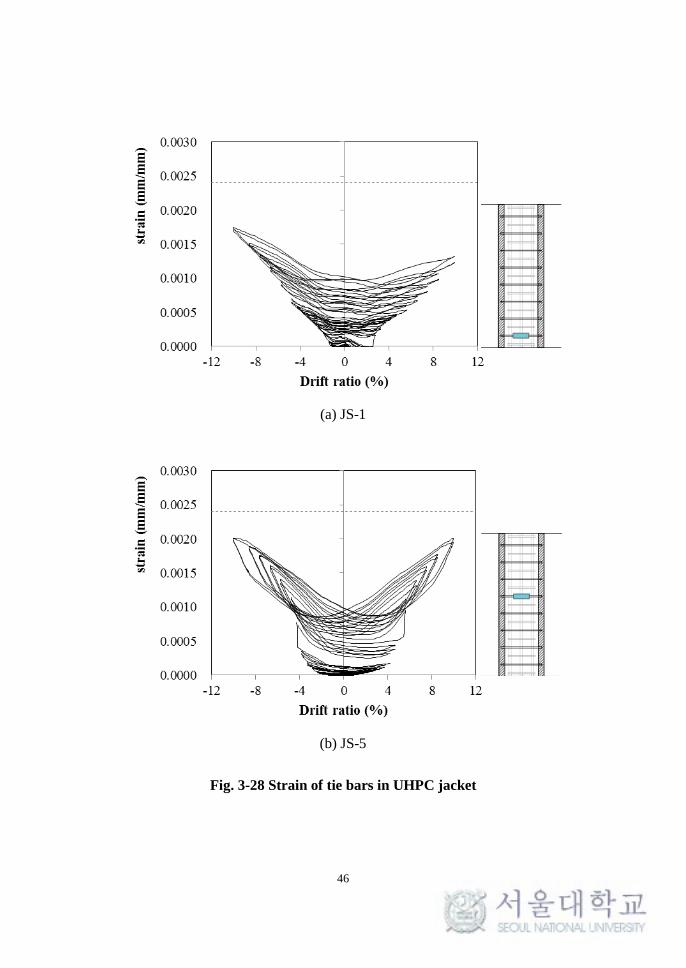
(a) JS-1
(b) JS-5
Fig. 3-28 Strain of tie bars in UHPC jacket
46

Fig. 3-29 shows the value of strain gages of tie bars along the height at the
maximum drift ratio from 0.5% to 9.0% corresponding to each cycle. There
are some points that can be inferred from these graphes.
First, it was found that the initial strains of JS-1 and JS-8, which are
located near the end stubs, had negative values. This means that the tie bars
around the column ends got negative strain at early stage. Normally, when the
RC flexural members get lateral load, their stirrup ties get tensile stress and
thus, should get positive strains. This is the effect of compressive strut that
might have been formed around end stubs and this arch action governs the
initial behavior over the beam action.
Second, there are obvious tendency that as drift ratio increases, strains of
JS-1, JS-8 increase much faster than JS-4 and JS-5, which are located at inner
part. And when drift ratio got very high, strains of inner tie bars became larger
than boundary stirrups. This indicates that when lateral load is applied to this
column, shear deformations are first concentratated near the end stubs and
then gradually expand to inner parts as the drift ratio get futher higher. It is
required to design shear stirrups of UHPC jacket depending on design seismic
load. If the column is expected to get mid-range seismic deformation,
strengthening end parts are more important. And if the column is expected to
get severe seismic deformation, strengthening mid-parts would be more
important.
47

(a) positive direction (drift ratio : 0.5%~9.0%)
(b) negative direction (drift ratio : 0.5%~9.0%)
Fig. 3-29 Strain of tie bars along the height
0
200
400
600
800
1000
1200
-0.0002 0.0002 0.0006 0.001 0.0014 0.0018 0.0022
Dis
tanc
e fr
om b
ottu
m (m
m)
strain (mm/mm)
0
200
400
600
800
1000
1200
-0.0002 0.0002 0.0006 0.001 0.0014 0.0018 0.0022
Dis
tanc
e fr
om b
ottu
m (m
m)
strain (mm/mm)
48

Chapter 4. Theoretical Analysis
4.1 Introduction
4.1.1 General procedure
General analysis procedure is based on failure mode analysis just as the
procedure to estimate design strength of RC column in. In chapter 3.1.3,
failure curves for flexural compressive failure of which failure criteria is
0.003cε = and shear failure based on code provision were plotted in the
interaction diagram regarding to axial load, P and lateral load, V. Then, the
lower curve depending on axial force will govern the failure mode.
The same approach was applied for the retrofitted composite column
section to estimate a failure mode and corresponding maximum lateral load
resistance capacity. The possible failure modes were defined based on
experimental crack patterns. Next, for each failure mode, corresponding
faillure curves were plotted in P-V interaction diagram. Finally, lower bound
curve of all failure curves will decide theoretical failure modes and
corresponding maximum load, which means load resistance capacity.
Due to the characteristic of this composite section, it was found that the
interface shear strength has a very important role to determine the mechanical
behavior of the retrofitted column. So, although experimental variables does
not include interface shear capacity, in theoretical analysis, interface shear
strength was treated as important factors in some intepretations. 49

4.1.2 Analysis method
Instead of using a special computer analysis program, the analysis used a
simple strain compatibility solution to calculate the stress distribution of the
column. The axial force and moment applied to column section at a certain
height can be calculated, and based on these axial force and moment,
corresponding strain distribution can be calculated by strain compatibility
method. Then, normal and shear stress distribution can be calculated from the
strain distributions. Finally, failure curve can be drawn by connecting the
points in which the stresses reach failure criteria of each failure mode.
4.1.3 Basic assumptions
The assumptions used for the analysis are as follows.
1) The strain distribution at each column section is linear.
2) Tensile forces are only transferred by reinforcement of core column.
These assumptions are required because there is no physical connection
beteen the UHPC jacket and concrete stub as illustrated in Fig. 4-1.
Accordingly, UHPC doest not get direct tensile forces. Therefore, the vertical
tensile stress of UHPC is assumed to be zero.
3) P-Δ effect was not considered
This study focuses only on the lateral load resistance capacity. Assuming
lateral displacement is not large, P-Δ effect can be ignored.
50

4) Confinement effect of the jacket can be ignored.
Normally, jacketing method causes confinement effect to core column.
However, in this case UHPC jacket contributes for strengthening the column
mainly by supporting the external loads directly. Strengthening effect by
confinement would be relatively very small compared to direct supports of the
jacket. Moreover, confinement effect of the jacket in rectangular section is
very difficult to estimate. Thus, most researches on confinement effect depend
on experiments focusing on confinement effect, which is not the case.
Therefore, Confinement effect was not considered in this study.
Fig. 4-1 Jacket connection to stub
51

4.2 Failure mode analysis
4.2.1 Failure mode classification
Fig. 4-2 Crack types of experiment result (R-30)
Three failure modes were considered in this study. Mode ① is a flexural
compressive failure at column ends. This mode will happen when the strain of
extreme compressive fiber( cmε ) reaches UHPC’s ultimate compressive
strain( uuε ).
Mode ② is a direct shear failure between web and flange of the jacket.
As the composite section has higher stiffness outside and lower stiffness
inside, the normal forces applied to outer jacket would be very large. It leads
to high shear stress between the flange and web of the jacket and could give
rise to this kind of failure mode when the direct shear stress( jtt ) between web
52

and flange reaches over the shear strength( ,u allowt ) of UHPC.
Three failure modes were considered in this study. Mode ① is a flexural
compressive failure at column ends. This mode will happen when the strain of
extreme compressive fiber( cmε ) reaches UHPC’s ultimate compressive
strain( uuε ).
Mode ② is a direct shear failure between web and flange of the jacket.
As the composite section has higher stiffness outside and lower stiffness
inside, the normal forces applied to outer jacket would be very large. It leads
to high shear stress between the flange and web of the jacket and could give
rise to this kind of failure mode when the direct shear stress( jtt ) between web
and flange reaches over the shear strength( ,u allowt ) of UHPC.
Mode ③ is a diagonal tension failure in the web plane, which is the
failure modes of the actual tests. This mode will happen when the principal
tensile stress( 1s ) in the jacket reaches over the tensile strength( ,u tf ) of the
UHPC. This mode is also influenced by the composition of the section,
becuase the principal tensile stress is highly affected by the shear stress of the
web.
There are other possible failure modes such as UHPC’s tensile failure due
to hoop stresses by confinement effect or shear failure of internal core.
Further studies are required to deal with these failure modes.
53

Table 4-1 Failure mode classification
Failu
re
mod
e Mode ① Mode ② Mode ③
Compressive failure of UHPC
Direct shear failure between web-flange
Diagonal tension failure in web plane
Cra
ck
patt
erns
Failu
re
crite
ria
cm uuε ε= ,jt u allowt t= 1 ,u tfs =
4.2.2 Flecxural compressive failure at column ends
P-V interaction curve for mode 1 can be drawn by transforming P-M
interaction diagram. P-M interation curve can be found out from strain
compatibility solution. The process is almost same as with chapter 3.1.3. The
difference is that first, the strain of the maximum compressive fiber is
0.004uuε = , instead of 0.003cuε = . Second, as the maximum strain of the
54

concrete is not always 0.003cuε = , the equivalent stress block method
cannot be applied. Thus, the stress-strain curve of concrete was assumed as a
double-linear curve described in Fig. 4-3. The maximum compressive strength
and the initial stiffness were based on material experimental result.
Fig. 4-3 Assumed stress-strain curve of concrete
The process is simply illustrated in Fig. 4-4. While varying the neutral
axis c, the sectional force and moment can be plotted and the resultant P-M
curve is shown in Fig. 4-5. If there is no P-Δ effect as assumed, the maximum
moment in column should satisfy equation (9) for double curvature column.
Thus, the lateral load, V has linear relation with moment, M. Therefore, P-V
interaction diagram can be directly drawn from the P-M curve.
2
VLM = (9)
55

Fig. 4-4 Strain compatibility solution for composite section
Fig. 4-6 shows the failure curves of flexural failure mode for the jacketed
columns including for the unjacketed section. The lateral load capacity
increased about two times at zero axial load and the axial load capacities are
calculated to increase about 2.5 to 4 times depending on the jacket thickness.
56

Fig. 4-5 P-M interaction diagram for jacketed section
Fig. 4-6 P-V interaction diagram (failure mode 1)
0
2000
4000
6000
8000
10000
12000
14000
0 200 400 600 800 1000 1200
Axi
al lo
ad, P
(kN
)
Moment, M (kN-m)
30mm jacket
50mm jacket
0
2000
4000
6000
8000
10000
12000
14000
0 200 400 600 800 1000 1200
Axi
al lo
ad, P
(kN
)
Lateral load, V (kN)
Unjacketed
30mm jacket
50mm jacket
57

4.2.3 Direct shear failure between web-flange of UHPC jacket
Fig. 4-7 crack patterns of mode 2 and normal stress distribution at end
Fig. 4-8 vertical stress distribution in flange
Second failure mode is a direct shear failure between web and flange of
UHPC jacket. Fig. 4-7 shows the crack patterns of this failure mode and
normal stress distribution at column end when lateral load or moment appliy 58

to the column. This failure mode could occur when the direct shear stress in
web-flange joint is higher than shear strength of UHPC.
Interface shear strength should be considered to analyze this failure mode.
If interface shear strength is sufficiently large (case (a)), the shear flow caused
by Cf could be directly transferred aligned with the direction of shear force
(Fig. 4-9. (a)). In this case the shear stress among the interface could be
regarded same (equation (27)). However, if interface shear strength is not
sufficient (case (b)), the shear stress in flange should be transferred to web to
fill the insufficient amount (Fig. 4-9. (b)). This additional shear stress will
increase the shear stress in web and hasten this shear failure mode.
Fig. 4-9 shear flow in column section:
a) if τif,allow is large enough, b) if τif,allow is not sufficient
The shear stress at joint can be calculated from the vertical force
equilibrium in Fig. 4-8.
In the case of ( ), 2
fif allow
Cb t L
t ≥+
,if u jtt t t= = (10)
59

( )2fC b t Lt= + (11)
( ), 2f
u jt
Cb t L
t t= =+
(12)
In the case of ( ), 2
fif allow
Cb t L
t <+
,if if allowt t= (13)
( ) ( )( ), 2f if allow jtC b t Lt t= + ⋅ (14)
,, 2
f if allowu jt
C L btt
t−
= (15)
where,
,if allowt = allowable interface shear stress (MPa)
ift = interface shear stress (MPa)
,u jtt = direct shear stress at the joint (MPa)
fC = Normal force applied to jacket flange (kN)
The failure critera would be , ,u jt u allowt t= , where,
,u allowt = allowable shear stress of UHPC (MPa)
For the analysis above, the interface shear strength, ,if allowt and direct shear
60

strength of UHPC, ,u allowt are required to be estimated. As explained in
chapter 2.3, the interface shear strength has three contributions: cohesion,
friction, clamping. In the experiment, the clamping bars were not used, so the
clamping factor does not have to be considered. Also, there is no force normal
to interface. Thus, the friction factor doesn’t need to be considered as well.
Therefore, only cohesion factor needs to be considered.
The cohesion factor consists of cohesion coefficient and design value of
concrete tensile strength. The value of cohesion coefficient, c for sandblasted
surface could be estimated from (Santos et el, 2014).
From Fig. 4-10, cohesion coefficient is 0.93 and,
, =2.23MPaif allow ctdc ft = ⋅ (16)
As the values used for equation (16) have relatively large deviations, the
interface shear strength was assumed conservatively as , 2MPaif allowt =
Fig. 4-10 Cohesion coefficient for sandblasted surface (Santos et el, 2014)
Average: 0.93
0.4
0.6
0.8
1
1.2
1.4
coef
ficie
nt o
f coh
esio
n, c
61

The direct shear friction strength of UHPC is explained in chapter 2.4. For
the same reason with interface shear strength, the clamping factor and friction
factor by normal stress need not be considered. The cohesion factor and
friction by steel fiber contribution should be considered.
, , 9.2MPau allow c u ctdf Kt t µ= + = (17)
For conservative analysis, assume
, 9MPau allowt = (18)
Using the algorithm ofFig. 4-13, it is possible to get failure curve of mode
2. The resultant P-V interaction diagram for R-30 and R-50 sections are
plotted in Fig. 4-11 and Fig. 4-12. For the interface shear strength of assumed
2MPa, it is shown that the failure curve for mode 2 in R-30 is almost same
with mode 1 curve. In the case of R-50 section, failure curve for mode 2 is
much lower than mode 1, which means that the column is apt to fail in mode 2
rather than mode 1.
62

Fig. 4-11 P-V interaction diagram (30mm, mode 2)
Fig. 4-12 P-V interaction diagram (50mm, mode 2)
0
2000
4000
6000
8000
10000
12000
14000
0 200 400 600 800 1000 1200
Axi
al lo
ad, P
(kN
)
Lateral load, V (kN)
2 MPa
0
2000
4000
6000
8000
10000
12000
14000
0 200 400 600 800 1000 1200
Axi
al lo
ad, P
(kN
)
Lateral load, V (kN)
2 MPa
4 MPa
63

Fig. 4-13 Analysis method for failure mode 2
64

4.2.4 Diagonal tension failure in UHPC web
The third failure mode is a diagonal tension failure, which was the
experimental result. Fig. 4-14 shows the crack patterns of this failure mode.
This failure mode could occur when the maximum principal tensile stress in
UHPC web is higher than tensile strength of UHPC, which may not be high
enough.
Fig. 4-14 Crack patterns of mode 3
65

It is necessary to analyze principal stresses among the UHPC web to find
out the maximum value. For that purpose, the normal and shear stress at any
location in the UHPC web should be estimated. As shown in Fig. 4-15, the
axial force and moment at loacation z, can be found from the axial force and
moment diagram, respectively. Then, it is possible to get strain distribution at
height z, which is assumed to be linear. This strain distribution at z can be
defined with two funtions, ( )m zε and ( )c z where ( )m zε is maximum
compressive strain at extreme compressive fiber and ( )c z is the length
between extreme compressive fiber and neutral axis. These are functions of z.
As the strain distribution at height z, defined by ( )m zε and ( )c z , is
given, the normal stress can be easily found out by multiflying elastic
modulus of UHPC to strain distributions. As assumed in 4.1.3, the tensile
stress is not considered. Thus, the negative value in the vertical stress should
be just zero.
Fig. 4-15 Strain distribution at height z
66

The next step is to estimate the shear stress distribution. It can be
estimated from the normal stress distributions applied to UHPC. The shear
stress was divided to stress by normal force applied to web, Cw and shear
stress by normal force applied to Cf.
Fig. 4-16 shows the normal stress distribution at (A) highlighting the web
portions. The location (A) indicates where all the section get normal
compressive strain. The shear stress by normal force should start with zero at
left side and end with zero at right side. For simplicity, the shear stress
distribution was assumed symmetric and accordingly, the net normal stress
distribution was also assumed to be symmetric. Then, from the vertical force
equilibrium in the free body diagram of Fig. 4-16, equation (19) and (20) can
be built.
( ) ( ) ( )( )
( ) ( ) ( )
( ) ( ) ( )
0
0
,
212
12
x
jw m m
x
m m
m m
z x t dz z dz z dx t
xz dz z dx th t
xz dz z x th t
t s s
s s
s s
⋅ ⋅ = + − ⋅
= + − − ⋅ +
= + − − ⋅ +
∫
∫ (19)
( ) ( ) ( )( )
( )
( )
, 12
12
12
m mjw
m
mU
z dz z xz x xdz h t
d xxdz h t
d xE xdz h t
s st
s
ε
+ − = − +
= − +
= − +
(20)
67

where,
jwt = Shear stress by Cw (MPa)
ms = Normal stress at extreme compressive fiber (MPa)
Equation (20) shows that the shear stress by Cw could be determined by, a
derivative of maximum strain by height, z with other material and geometry
factors.
Fig. 4-16 Normal stress distribution by Cw in web at (A)
68

Fig. 4-16 shows the normal stress distribution at (B) which indicates the
location where only part of the section gets normal compressive strain. The
shear stress by normal force should start with zero at left side and end with
zero at the point where normal stress becomes zero. Assuming shear stress
distribution as symmetric, then, from the vertical force equilibrium in the free
body diagram of Fig. 4-17, equation (21) and (22) can be built.
Fig. 4-17 Normal stress distribution by Cw in web at (B)
69

( ) ( ) ( )( )
( ) ( ) ( )
( ) ( ) ( )
0
0
,
21
1
x
jw m m
x
m m
m m
z x t dz z dz z dx t
xz dz z dx tc z
xz dz z x tc z
t s s
s s
s s
⋅ ⋅ = + − ⋅
= + − − ⋅
= + − − ⋅
∫
∫ (21)
( ) ( ) ( )( )
( )
( ) ( )( )
, 1
1
1 0
m mjw
m
mU
z dz z xz x xdz c z
d xxdz c z
d xE x x c zdz c z
s st
s
ε
+ − = −
= −
= − ≤ ≤
(22)
The next step is to estimate shear stress in the web by normal force in
flange, Cf. In the same as in 4.2.3, the interface shear strength need to be
considered. As illustrated in Fig. 4-18, if interface shear strength is large
enough (Fig. 4-18 (a)), there will be no shear flow toward the web. The shear
stress by Cf at interface would be same as shear stress by Cw where x t= .
Therefore,
If ( ), ,if allow jw z tt t≥ ,
( ) ( ),if jwz z tt t= (23)
( ) 0jf zt = (24)
70

However, if the interface shear strength is not sufficient, the shear flow
toward the web would occur (Fig. 4-18 (b)).
If ( ), ,if allow jw z tt t< ,
( ) ,if if allowzt t= (25)
( ) ( )( ) ( ),, 2jf jw if allow
tz z t t x h tb
t t t
= − ≤ ≤ +
(26)
where,
jft = Shear stress in the web by Cf (MPa)
Equation (26) was built with a assumption that shear stress by Cf is
uniform along the web.
Fig. 4-18 shear flow of flange in column section:
a) if τif,allow is large enough, b) if τif,allow is not sufficient
71

Fig. 4-19 Normal stress distribution by Cf in web
The total shear stress can be found by just adding jwt and jft , as shown in
Fig. 4-19. Then, as the shear stress and normal stress at any location in the
web of jacket, the principal stress can be found out from the equation (27),
which can be built from the Mohr’s circle that is described in Fig. 4-20.
72

Fig. 4-20 Mohr’s circle
2
21 2 2
j jj
s ss t
= + −
(27)
1 2tan
j
jtbs
− =
(28)
73

Fig. 4-21 Principal stress distribution at the cracking load
a) for R-30, b) for R-50
The principal tensile stress distributions of the experiment specimens (R-
30, R-50) were estimated with this method at their cracking loads. The results
are plotted in Fig. 4-21 with actual cracking patterns overlapped. The
maximum principal tensile stresses appeared to occur at a little away from the
middle of the column, while the principal stresses at centers were quite low.
74

This is because, a derivative of maximum strain by height, md dzε which is
the main factor of the shear stress (Equations (20), (22)), is lowest at the
center.
The shapes and directions of the areas of high principal tensile stresses
appeared to match with the actual crack patterns, which means that although
there are many assumtions are used for this method, it can evaluate the
principal tensile stress quite well in some degrees.
The maximum values of principal tensile stresses came out to be about
5.0MPa and 8.8MPa for R-30 and R-50, respectively. The cracks would occur
when the area that has a principal tensile stress over the tensile strength of the
UHPC become large to some extent. This extent is difficult to extimate. For
simplicity and conservative analysis, just assume that the column could fail in
diagonal crack when the maximum principal tensile stress at a point reaches
the tensile strength of UHPC.
Applying above process, the P-V interaction diagram was plotted with an
algorithm described in Fig. 4-22. The resultant diagrams are shown in Fig.
4-23 and Fig. 4-24. For comparision, the interface shear strengths for 5MPa
10MPa are plotted altogether as well as for 2MPa.
The result shows that the failure curve for mode 3 is much lower than
mode 1 when axial load is not that much high. This means that this composite
column is prone to fail in diagonal tension cracking failure rather then flexural
compressive failure. When the interfacet shear is large enough (about 10MPa),
then, the failure cure for mode 3 is almost get out of the failure curve of mode
1. Therefore, if it is necessary to secure high lateral load capacity in normal
75

axial load condition, while utilizing the high compressive strength of UHPC,
the interface shear strength need to be designed high enough. This can be
accomplished by adding some clamping bars at the interface as well as surface
roughening treatment.
Fig. 4-22 Analysis method for failure mode 3
76

Fig. 4-23 P-V interaction diagram (30mm, mode 3)
Fig. 4-24 P-V interaction diagram (50mm, mode 3)
0
2000
4000
6000
8000
10000
12000
14000
0 200 400 600 800 1000 1200
Axi
al lo
ad, P
(kN
)
Lateral load, V (kN)
2 MPa
5 MPa
10 MPa
0
2000
4000
6000
8000
10000
12000
14000
0 200 400 600 800 1000 1200
Axi
al lo
ad, P
(kN
)
Lateral load, V (kN)
2 MPa
5 MPa
10 MPa
77

4.2.5 Analysis result
Fig. 4-25 shows the final P-V interaction diagram including mode 1,2 and
3 for R-50. The interface shear strength was assumed to be 2MPa. It appeared
that for normal axial force region, about less than 6000kN, the column would
fail in mode 3. The column is prone to fail in mode 2 for higher axial force
region and fail in mode 3 for the highest region.
Fig. 4-25 Final P-V interaction diagram (R-50)
0
2000
4000
6000
8000
10000
12000
14000
0 200 400 600 800 1000 1200
Axi
al lo
ad, P
(kN
)
Lateral load, V (kN)
Mode 1
Mode 2
Mode 3Failure mode 1
Failure mode 2
Failure mode 3
78

For comparison, P-V interaction diagrams for other sections and a/d ratios
are plotted as well through Fig. 4-26 to Fig. 4-29. All the jacket thicknesses
were unified to 10% of column section width. The failure mode 2 was
excluded because for 10% thickness jacket, failure curve for mode 2 was
found out to exist outside of failure curve of mode 1.
The result shows quite clear tendency that the a/d ratio do highly influence
on the curve shape of mode 3. The failure curves of which a/d ratios are 2.1,
Fig. 4-26 and Fig. 4-28, have similar shapes and seem to require interface
shear strength of 10MPa to get to be outside of failure curve of mode 1. In
contrast, Fig. 4-26 and Fig. 4-28 shows the failure curve whose a/d ratios are
3. It is estimated that they only require interface shear strength of about 5MPa
to get out of mode 1 failure curve.
It may be required to add some clamping bars as well as surface
roughening treatment to satiyfy the interface strength. The amount of the
clamping bars to secure the interface shear strength more than 5MPa can be
estimated by the formula ( )sin cosydfρ µ a a+ . The cohesion contribu-
tion would be 2MPa as estimated in 4.2.3. Than clamping contribution should
be more than 3MPa. Assuming ydf = 400MPa and 1.34µ = , than the shear
reinforcement ratio, ρ is calculated about 0.006. This value is quite large in
that for it requires at least two sets of #3 bars per every 100mm for 300mm-
width column. Therefore, it would be very uneconomic to secure high
interface shear strength using clamping bars.
Instead of bringing up interface shear strength, to increase a tensile
strength of jacket would be more economic and also easier to construct. In
79

order to raise up the tensile strength of UHPC itself is limitative as the amount
of steel fiber is limited. Therefore, adding some additional stirrups or meshes
inside the jacket would be advisable to secure high tensile strength of jacket
and to control post-cracking behavior.
80

Fig. 4-26 P-V diagram (b=300mm, ρ=2.1)
Fig. 4-27 P-V diagram (b=300mm, ρ=3.0)
0
1000
2000
3000
4000
5000
6000
7000
8000
9000
10000
0 200 400 600 800
Axi
al lo
ad, P
(kN
)
Lateral load, V (kN)
2 MPa
5 MPa
10 MPa
0
1000
2000
3000
4000
5000
6000
7000
8000
9000
10000
0 100 200 300 400 500 600
Axi
al lo
ad, P
(kN
)
Lateral load, V (kN)
2 MPa
5 MPa
81

Fig. 4-28 P-V diagram (b=600mm, ρ=2.1)
Fig. 4-29 P-V diagram (b=600mm, ρ=3.0)
0
5000
10000
15000
20000
25000
30000
35000
40000
0 500 1000 1500 2000 2500 3000
Axi
al lo
ad, P
(kN
)
Lateral load, V (kN)
2 MPa
5 MPa
10 MPa
0
5000
10000
15000
20000
25000
30000
35000
40000
0 500 1000 1500 2000 2500
Axi
al lo
ad, P
(kN
)
Lateral load, V (kN)
2 MPa
5 MPa
82

Chapter 5. Conclusion
In this study, the lateral load resistance capacity of RC column retrofitted
with ultra high performance concrete (UHPC) jacket was estimated through
an experiment and theoretical analysis. In order to secure high constructability
the jacketing method considered in this study was just a simple jacketing
without any measures such as additional longitudinal reinforcements or shear
stud between jacket and core. For interface treatment, surface roughnening
process using sandblasting was applied.
In chapter 3, the experimental result was analyzed. The experiment was
implemented with variables of jacket thickness and stirrup insert. The lateral
load capacities of the retrofitted columns have increased about 70~130%
depending on jacket thickness. The columns reached their maximum strength
when they got the diagonal tension crack in the web of the jacket. The
columns went to failure soon after crack occured. Although steel fibers
contribute to sustain the crackings from further opening, it is considered
insufficient.
In the specimen with additional stirrups inserted inside the jacket, the
result shows much higher performance especially in ductility. The stirrups in
jacket prevent massive diagonal cracking that other specimens has occurred.
This made the retrofitted column sustain the lateral load far beyond the
yielding point. However, it is judged that the excessively high ductile
behavior was influenced by relatively weak base strength in that the cracks
occurred in base stub was found to be too large and these cracks must have
absorbed significant amount of energy and reduced stress which otherwise 83
should have applied to column or jacket.
In chapter 4, possible failure mode for the UHPC jacketed RC column was
analyzed with some assumptions. Based on experimental results, failure mode
of UHPC jacketed column was classified into three modes: flexural
compressive failure, direct shear failure between flange and web of the jacket,
diagonal shear failure of web of the jacket. Failure curves for the possible
failure modes were plotted in interaction diagram between axial and lateral
load. For each mode, failure criteria was set and the failure condition was
found by numerical method. The result shows that in normal axial load
condition, the retrofitted columns are prone to fail in diagonal tension failure,
which accord with experimental result. This is due to the composition of
composite section, which has high stiffness outside and low stiffness inside.
In order to avoid premature diagonal tension failure, two additional
measures can be taken. First, interface shear strength can be secured by
adding clamping reinforcements as well as surface roughening. However, this
method requires too much works, as the required interface shear strength is
very high. Second, additional stirrups or meshes can be added inside jacket to
prevent the jacket from failure by diagonal tension cracks.
This research is expected to be used as a reference for suggesting design
method and strength expressions of UHPC jacketing for RC column. Further
experimental research would be necessary that has variables of applied axial
load or surface treatment in order to verify the failure mode analysis result of
this study.
84

References
ACI committee 318. 2011. American Concrete Institute, Farmington Hills, MI Building Code Requirements for Structural Concrete and Commentary.
An, X., and Maekawa, K. 1998. Shear Resistance and Ductility of RC
Columns after Yield of Main Reinforcement. Paper presented at the PROCEEDINGS-JAPAN SOCIETY OF CIVIL ENGINEERS.
ASCE/SEI 41-13. 2014. Seismic Evaluation and Retrofit of Existing
Buildings, American Society of Civil Engineers. Beschi, C., Meda, A., and Riva, P. 2009. "High Performance Fiber
Reinforced Concrete Jacketing in a Seismic Retrofitting Application". Paper presented at the ATC & SEI conference on Improving the Seismic Performance of Existing Buildings and Other Structures.
Beschi, C., Meda, A., and Riva, P. 2011. "Column and Joint Retrofitting
with High Performance Fiber Reinforced Concrete Jacketing". Journal of Earthquake Engineering, 15(7), 989-1014.
Chynoweth, G., Stankie, R. R., Allen, W. L., Anderson, R. R., Babcock,
W. N., Barlow, P., . . . Constantino, F. J. 1996. "Concrete repair guide". ACI committee, concrete repair manual, 546, 287-327.
Committee, A., Institute, A. C., and Standardization, I. O. f. 2008.
Building code requirements for structural concrete (ACI 318-08) and commentary.
Lampropoulos, A., and Dritsos, S. E. 2011. "Modeling of RC columns
strengthened with RC jackets". Earthquake Engineering & Structural Dynamics, 40(15), 1689-1705.
85

Lee, J.-H., and Hong, S.-G. 2015. " Shear Friction Strength based on Limit Analysis for Ultra-High Performance Fiber Reinforced Concrete". Journal of the Korea Concrete Institute, 27(3), 296-306.
Lee, J., Nishiyama, M., Kono, S., and Sakashita, M. 2015. "Diagonal
Tension Failure of Reinforced and Prestressed Concrete Member". ACI Structural Journal, 112(3), 311.
MacGregor, J. G., Wight, J. K., Teng, S., and Irawan, P. 1997.
Reinforced concrete: mechanics and design (Vol. 3): Prentice Hall Upper Saddle River, NJ.
Meda, A., Mostosi, S., Rinaldi, Z., and Riva, P. 2016. "Corroded RC
columns repair and strengthening with high performance fiber reinforced concrete jacket". Materials and Structures, 49(5), 1967-1978.
Meda, A., Plizzari, G., Rinaldi, Z., and Martinola, G. 2009.
"Strengthening of R/C Existing Columns with High Performance Fiber Reinforced Concrete Jacket".
Minafò, G. 2015. "A Practical Approach for The Strength Evaluation
Of Ro Columns Reinforced with RC Jackets". Engineering Structures, 85, 162-169.
Mohamad, M. E., and Ibrahim, I. S. 2015. "Interface Shear Strength of
Concrete-to-Concrete Bond with and without Projecting Steel Reinforcement". Jurnal Teknologi, 75(1).
Pan, Z., and Li, B. 2012. "Truss-Arch Model for Shear Strength of
Shear-Critical Reinforced Concrete Columns". Journal of Structural Engineering, 139(4), 548-560.
Santos, P. M., and Júlio, E. 2014. "Interface Shear Transfer on
Composite Concrete Members". ACI Structural Journal, 111(1), 113-121.
Takiguchi, K. 2001. "Shear Strengthening of Reinforced Concrete
Columns Using Ferrocement Jacket". Structural Journal, 98(5), 696-704.
86

Tayeh, B. A., Bakar, B. A., and Johari, M. M. 2013. "Characterization
of The Interfacial Bond between Old Concrete Substrate and Ultra High Performance Fiber Concrete Repair Composite". Materials and Structures, 46(5), 743-753.
Thermou, G., Pantazopoulou, S., and Elnashai, A. 2007. "Flexural
Behavior of Brittle RC Members Rehabilitated with Concrete Jacketing". Journal of Structural Engineering, 133(10), 1373-1384.
Vandoros, K. G., and Dritsos, S. E. 2006. "Interface Treatment in
Shotcrete Jacketing of Reinforced Concrete Columns to Improve Seismic Performance". Structural Engineering and Mechanics, 23(1), 43-61.
Vandoros, K. G., and Dritsos, S. E. 2008. "Concrete Jacket
Construction Detail Effectiveness When Strengthening RC Columns". Construction and Building Materials, 22(3), 264-276.
87

초 록
초고성능 콘크리트를 이용한 기둥 보강 연구
구 인 영
서울대학교 건축학과 대학원
UHPC는 초고성능 콘크리트는 압축강도 180MPa 이상,
인장강도 10MPa 이상 발휘할 수 있는 재료로서 구조 보강재
로의 연구 및 적용이 활발히 진행되고 있다. 본 연구에서는
UHPC의 가장 큰 장점인 강한 압축력을 효율적으로 이용할
수 있는 기둥보강에 관한 연구를 수행하였다. UHPC를 활용한
기둥 보강은 일반 콘크리트 자켓팅보다 적은 두께로 설계가
가능하고, 타공법에 비해 보강 성능이 뛰어날 것으로 예상되며,
내구성이나 내화성, 내마모성 등에서도 탁월한 성능을 기대할
수 있다.
본 연구는 UHPC 자켓을 이용한 보강방법 중 시공성을
고려하여, 추가적인 휨철근이나 전단 연결재 등을 사용하지 않
고 기존 기둥을 순수 UHPC 자켓만을 사용하여 보강했을 때
의 보강 성능을 확인하는데 목적을 두었다. 기둥의 내진 보강
시 요구되는 여러 성능 중 횡강도 보강 성능 평가에 주 초점
을 두었으며, 이를 위하여 관련 실험과 보강 기둥의 파괴 모드
및 강도에 관한 이론적인 분석을 실시하였다.
88

자켓 두께에 따른 보강 실험에서는 두께에 따라 횡강도
가 우수한 보강 성능을 확인하였다. 띠철근을 추가 배근하지
않은 실험체의 경우에는 자켓의 사인장 균열로 파괴되었으며,
사인장 균열 발생이후에 자켓의 성능이 급격히 감소하는 것을
결과를 보였다. 또한, UHPC 자켓팅이 인접 보나 슬라브에 추
가적인 전단력을 가하여, 예상치 못한 파괴가 발생할 수 있으
므로, 이에 대한 고려가 필수적이며, 기둥보강시에는 보나 슬
라브의 오버레이 공법과 병행하여 사용하는 것이 바람직할 것
이다.
파괴 모드 분석에서는 세가지 파괴를 산정하고 그에 따
른 파괴곡선을 축력과 횡력에 관한 상관도에 나타내었다. 그
결과, 부재에 횡력이 작용할 경우 강성이 강한 UHPC가 내부
기둥을 감싸고 있는 단면의 특성상 일반적인 RC 합성 단면에
비하여 계면 전단력이 크게 작용하며, 계면 전단 강도가 충분
히 크지 않은 경우 기둥이 사인장균열에 의해 파괴될 확률이
높다는 것을 확인하였다. 따라서 UHPC 자켓 적용시 보다 우
수한 성능 발휘를 위해서는 자켓 내부에 추가 철근이나 메쉬
를 삽입하여 사인장 균열의 발생 및 벌어짐을 제어하는 것이
필요하며 이에 대한 공법 및 성능에 관한 추가 연구가 요구하
다.
핵심용어 : 초고성능콘크리트(UHPC), 기둥, 보강
학번 : 2015-21094
89