disclaimer - cybg€¦ · particularly btl gradual growth in ... regional market share based on...
TRANSCRIPT


Disclaimer

Today’s agenda
3

4
Leadership team here today
•
•
•
•
•
•
•
•
•
•
•

David Duffy Chief Executive Officer

Investment highlights
6
1
2
Strong fundamentals underpin the CYBG value proposition
3
4
5
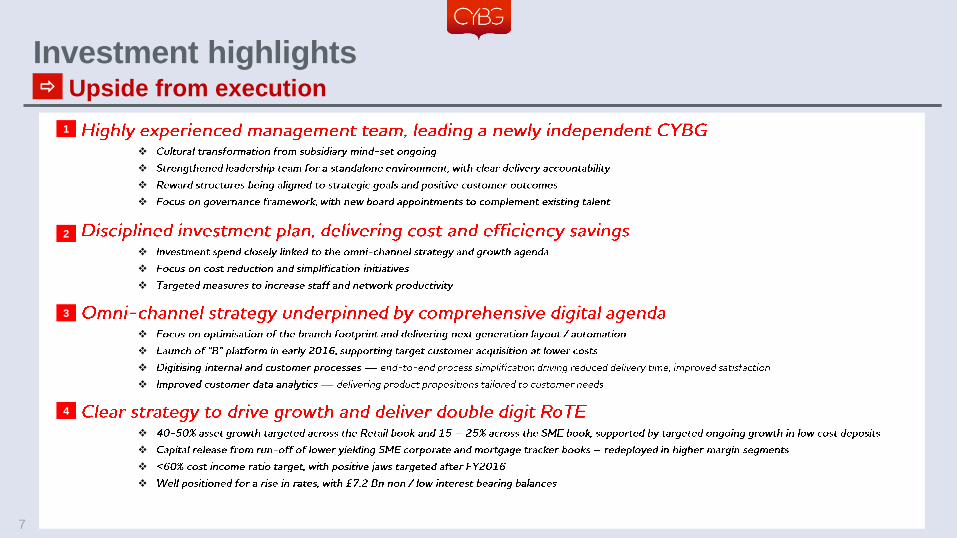
1
2
3
4
Investment highlights Upside from execution
7

David Duffy Chief Executive Officer

Positive GDP growth – 2.2% in 2015,
2016 estimate 2.4% 1
Reduced unemployment — 5.4% in 2015
below long term average
Real earnings growth (core regions
almost equal or ahead of London since
2006), driving an increase in consumer
confidence
Inflation expected to remain below 2%
target from BoE
More measured base rate increase
expected (1)
9
Supportive market backdrop Continued positive outlook
for UK macro
Retail banking continues
to show recovery and growth
Momentum rebuilding
in SME and commercial
Sustained momentum in the housing
market – transaction volumes still
below pre-crisis levels
Credit environment remains strong
Strong growth in mortgage lending,
particularly BTL
Gradual growth in personal lending and
credit card originations reflecting
improved sentiment
Continued growth in deposits, with
shift from term to PCAs in low rate
environment
PCAs continue to represent the anchor
relationship banking product
Gross monthly lending flows in 2015
+8% vs. 2014
Investment expected to grow relatively
strongly in 2015/16 — forecasts for
subsequent years revised up
Y-o-y growth in lending to SMEs
turning positive in April 2015 — first
time since 2009
North East and Yorkshire & the Humber
saw a stronger uptick SME lending in
Q2 vs Q1 2015 compared to other
regions
Attractive margins in niche segments
where larger banks are not competing
1. Source: Oxford Economics

10
• 20.7m population in CYBG’s
core regional markets
• Sustained increase in
average earnings across
core regions supporting
confidence and spending
• House price growth in CYBG
core geographies more
muted, driving further upside
potential
• Stable SME lending volumes
in CYBG core regions —
Yorkshire & Humber growing
20.7 MM population in CYBG’s
core markets
MM people
5.4
2.7
7.2 5.4
8.6 8.9
Scotland NorthEast
NorthWest
Yorkshire& Humber
London SouthEast
Greater scope for further house price
increases in core regions vs. London
Core regions reflect marginal
improvement in the value of new
lending to SMEs £ 000s
400
800
1200
Scotland North East/North West
Yorkshire & Humber
£ MM
CYBG’s core regions present attractive dynamics
Core regions earnings growth
rates have equalled or surpassed
that in London since 2006
£ 000s
27.2 27.0 24.8 25.2 25.0
1.9 2.4 2.4
1.7 1.8
UK Scotland North East North West Yorkshire &Humber
2014 average annual earnings (left-hand axis)
2006–2014 CAGR (right-hand axis)
%
Source: Office for National Statistics Source: Office for National Statistics
Source: Office for National Statistics Source: British Banking Association
288 246 193 155 182 183
514
4.1 3.1 3 0.7 1.6 1.5
6.8
UK UK (excl.London)
Scotland NorthEast
NorthWest
Yorkshire&
Humber
London
Dec 2015 average house prices (left-hand axis)
Dec 2006– Dec 2015 CAGR (right-hand axis)

11
Regulatory environment continues to evolve
• Focus on competition amongst banks in the UK market — creation of the CMA(1) in 2014
• Introduction of PCA switching service in 2013, supporting switch away from top 5 banks
• Early adoption of Basel III / CRDIV requirement
• Continued focus on best practice conduct and customer fairness
• Ring-fencing and resolution frameworks driving increased stability
• Enhanced stress testing hurdles, further strengthening bank balance sheets
• Macro prudential measures in focus – RWA floors, higher capital requirements, path to IRB
• Potential FPC(2) recommendations and directions – housing market and unsecured lending
1. The Competition and Market Authority (“CMA”), 2. Financial Policy Committee (“FPC”)

David Duffy Chief Executive Officer

Our business at a glance
13
2.8 MM retail and business
customers £ 29 Bn customer loans £ 26 Bn customer deposits
Significant scale (2015)
Strong market shares in core regions
Full service product range
Broad channel distribution capability
9.1
c.14.0
8.1
4.1 3.1 1.4
3.5 1.6
PersonalCurrent Accounts ('PCA')
BusinessCurrent Accounts ('BCA')
Business Lending Mortgages
Share in core regions (6) National share
SME
Branch Network &
Business PB
Centres
Telephony / Voice Internet
Banking
Mortgage
Intermediaries
Retail
Mobile
Banking
%
ATMs Post Office
partnership
PCAs
Mortgages Personal Loans
Savings Accounts & Term
Deposits
Credit Cards &
Overdrafts
Payment &
Transaction Services Term Lending
Working Capital
Solutions(1)
BCAs & Deposits
Overdrafts Savings
Established regional franchise
Source: BBA, CACI, CMA, BoE, CML
→ Population of c.18 MM within a 10 minute drive of a
Clydesdale / Yorkshire retail branch (7)
1. Defined as asset finance, invoice finance, trade finance, treasury solutions, payment services and international services; 2. CACI (2015); 3. Regional market share based on Scotland only as calculated by CMA review (Banking services
to small and medium sized enterprises, July 2014), national market share based on BOE 2015 calculation; 4. BBA 2Q15 SME lending stock; 5. Share of stock CML (2015). Regional market share based on availability of regional loan data
(c.70% of UK market); 6. Defined as Scotland, Yorkshire and the Humber and North-East and North-West England; 7. Based on Experian Branch Catchments (September 2015)
(5) (4) (3) (2)
275 Retail branches
154 Yorkshire
40 Business and
private banking
centres
Clydesdale 121
2015

127
127
127
0
176
227
189
216
214
194
211
237
214
17
8
32
146
212
£3.3 Bn
3% 2% 3% n/a n/a 4%
UK gross loans (£ Bn) and mortgage market share (%) (1)
UK gross loans mix and SME lending market share (%)(4,5)
n/a
✓✓✓
275
✓✓
75
✓✓✓
314
✓✓✓
222(13)
✓✓
0(14)
✓✓
9
The only UK mid-market bank which has material scale, full service capabilities and a substantially standalone IT platform
Customer deposit mix and PCA market share (%) (6)
Differentiated position to UK challengers
✓✓✓
c.615(12)

Our strategy
15
We are a strong regional bank with established Retail and SME franchises supported
by trusted local community brands
• Leverage our capabilities in existing core regional markets
• Continue our successful national growth strategy focusing on selected products
and sectors where we have a strong history and established capabilities
• Deliver a consistently superior experience to our customers underpinned by our
local community brands and a customer driven omni-channel strategy
• Deliver enhanced shareholder returns
Our business today
Our strategic aims
1
2
3
4
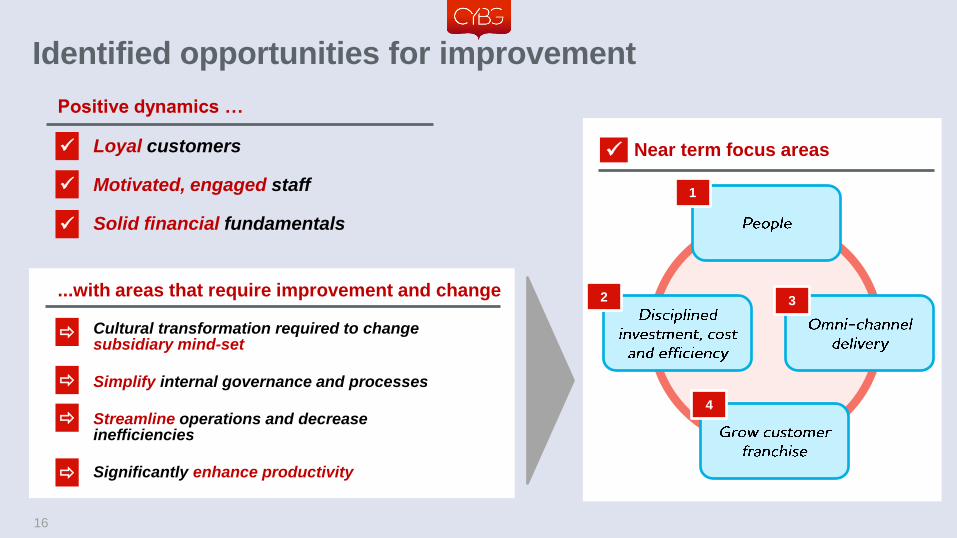
Identified opportunities for improvement
Positive dynamics …
...with areas that require improvement and change
• Loyal customers
• Motivated, engaged staff
• Solid financial fundamentals
• Cultural transformation required to change subsidiary mind-set
• Simplify internal governance and processes
• Streamline operations and decrease inefficiencies
• Significantly enhance productivity
Near term focus areas
16
3
1
2
4

17
People – cultural transformation
Near term actions Progress
• Senior Board appointments
• Leadership team restructured
• Number of key senior positions filled
• Senior management bench strength
assessment exercise ongoing
• Reduction in policies and committees
• New employee engagement approach
1
• Strengthen leadership team for
standalone environment
• Identify and fill key capability
gaps
• Full employee clarity on
strategic direction
• Reward programme aligned to
strategic goals and customer
Cross bank approach

18
Disciplined investment, cost and efficiency
Near term actions Progress
• Review of investment spend linked
to customer strategy agenda and
resilience of franchise
• Revised governance and control
framework for costs
• Targeting specific areas for cost
reduction
• End-to-end process simplification
• Increased productivity and
continued optimisation of branch
network
• Investment in data architecture
Path to improved operational efficiency
FY2015 Targeted
• Targeting centralised costs and
inefficiencies
• Investment in growth strategy
2
• c.£300 MM investment spend for
growth and resilience across
FY2015/2016
• Structural integration of retail and
SME franchises
• 24 branch closures in FY 2015 aligned
to network reconfiguration
• 70% of business centres co-located
with retail branches
• Cost reduction and simplification
initiatives
• End-to-end mortgage process to be
replicated in business lending
• Targeted headcount reductions across
the business

19
Opportunity from delivery of Omni-channel strategy 3
Near term actions
Distribution
• Next generation branch format / automation - Live
• Optimisation of footprint aligned to customer needs
• Digital connectivity to non-branch channels
Processes
• Online current account opening – Live
• Mortgage end-to-end process simplification
Customer data analytics
• “Digital Next Best Action” – Live
Mobile / Internet
• Enhanced mobile banking proposition
• Public Launch of “B” platform
Consistent, superior customer experience delivered through
seamless omni-channel platform
Tablet banking
ATM’s
Branches
Telephone banking
Internet banking
Mobile banking
“B” platform
Intermediary

20
Grow customer franchise
[Best Buy]
Momentum in delivery Near term actions
uSwitch Annual customer survey responses(3), %
78 77 72
66
Best onlineservice
Best customerservice (branch)
Overallsatisfaction
Best customerservice (overall)
(1) Peers: YB - Barclays, Co-Op, Halifax, HSBC, Lloyds, Nationwide, NatWest, Santander, TSB / CB - Bank of Scotland, RBS, Santander, TSB; 2. Gross new facilities accepted and available to customers; 3. Based on 10,000 current account customers survey during 9th to 16th
March 2015. Ranking and response pertaining to Clydesdale Bank only not CYBG; 4. Awards as at 2015 for Yorkshire Bank; 5. Survey consists of First Direct, Nationwide Building Society, Clydesdale Bank, TSB, Santander, Yorkshire Bank, Co-op, Halifax, Bank of Scotland,
NatWest, Lloyds, Barclays, HSBC and RBS
Oct 2014 Aug 2015
Net Promoter Scores(1)
Source: Uswitch customer survey (2015)
4
http://business-reporter.co.uk/2015/09/09/first-direct-and-clydesdale-bank-top-customer-satisfaction-poll/
Customers
• Investment in target segments, geographies
and propositions
• Improve customer experience through “B”
“Best regional lender” (4)
Award winning “first time
buyers” (2 years running)
SME gross new facilities, 2015(2)
2014 2015
Mortgage balances, £ Bn
2014 2015
Customer deposits, £ Bn
Overdrafts
22%
Term
47% Asset
finance
21%
Invoice
finance
9%
Treasury & trade finance
1%
Gross new facilities: £1.9Bn(2)
Distribution and products
• Growth in SME business leveraging
existing areas of expertise
• Step change in branch productivity
• Greater focus on proprietary mortgage
volumes
• Continued focus on balanced deposit
growth
• Prudent approach to intermediary
mortgage volumes

21
Clear strategy to deliver growth and shareholder returns
• Normalisation of the credit cycle
• Evolving OOI environment
• New surcharge tax
• Regulatory costs
Other
5
Near term
investment
&
standalone
build costs
• Increased costs
in 2016, from
transition to
fully standalone
operations and
investment to
support growth
1
• Run-off of lower yielding corporate and tracker portfolios
• Focus on higher yielding SME segments
• Continued growth in higher return mortgage segments
• Continued acquisition of low cost customer deposit funding maintaining LDR up to 115%
Change in asset
and liability mix
2
• Measured sustainable asset growth in line with our strategy
• Strong cost control with positive operating jaws
• Opportunity to simplify processes and reduce operating costs
• Digitisation of the distribution and operating model
Operating leverage
and simplification
opportunities
3
• Well positioned to benefit from rising rates
• £7.2 Bn non / low interest bearing balances and £3.4 Bn of capital benefiting from structural hedge (as at FY2015)
Rising rate
environment
4
TO BE UPDATED AS
PROPOSED GUIDANCE
IS SETTLED
RoTE FY2015 Near term investment Change inasset / liability mix
Operating leverage /cost efficiencies
Yield curve benefit Other Medium term targetdouble digit RoTE
1 2
3
4 5
(1)
1. Management basis
Gavin Opperman Director Customer Banking
Helen Page Propositions and Marketing
Director

175 years of retail presence in core regional markets
20.5
10.5 6.9
0.8 0.4
Mortgages Savings & term deposits PCAs Personal loans Credit cards
Number of customers holding products, 000s (2015)
Intermediary Digital Contact Centre Network
• 11 years track record
• 74% of gross
new mortgage lending (4)
(£3.7 Bn)
• Invitation-only panel
• 973k RIB & mobile
registrations(7)
• 41% of PLs new
lending (4)
• Mobile app
• Internet banking
• Presence on 21
aggregator sites
• 2 main contact centres(8)
• 10% of gross
new mortgage
lending (4) (5)
• 46 mortgage specialists
(intention to fill vacancies)
• 19% of PLs new
lending (4)
• 81% of PCA openings(4)
• 125 face to
face mortgage
specialists (intention to
fill vacancies)
• 14% of gross
new mortgage
lending (4) (5)
1,378 130 233 1,819 335
Gross customer balances (2015, £ Bn)(9)
Well-established proposition for 2.6 MM customers(2)
Data shown below represents 2015
Accessed through an omni-channel distribution proposition
1. Cushman & Wakefield Retail Centre Rankings; 2. As at September 2015; 3. Based on Experian Branch Catchments (September 2015); 4. As at September 2015; 5. Includes private banking sales. Note that mortgage sales attributed to
web, of 2% of total, have not been allocated to branch or voice; 6. Ability to transact through post office branches, providing access where CYBG not present in the vicinity; 7. Mobile and retail internet banking personal customer
penetration (2015); 8. Supported by outsourcing agreement. Two further CYBG call centres in England to handle customer requirements; 9. Excludes overdraft
Presence in 7 of top 10 Retail sites in GB (1)
c.18 MM customers within a 10 minute drive of a Clydesdale / Yorkshire retail branch (3)
2015 275
121
154
Retail branches
Clydesdale
Yorkshire
11.8k Post office
outlets (6)
Strong regional network
(24 closures vs. 2014)

Established and trusted brands with focus on service quality
Revitalised and refreshed brands focused on delivering fair customer outcomes
Underpinned by strong
values and behaviours
Designed to stretch across Retail
and SME and beyond core
regions
o Get the basics right - first time, every time
o Listen, understand, respond o Be accountable to customers and
each other o Treat customer time as more
important than your own o Know your neighbourhood
Built on what customers told us
a great bank should be
Increased marketing spend
supporting brand and
proposition
We asked
c.600,000
customers to
help us become
a better bank
14 19
22 33
2012 2013 2014 2015
Marketing P&L investment, £MM per period
Brands refreshed, with a clear sense of purpose
1.CYBG employee engagement (retail results, 84% employee response rate), 2015; 2. Based on 10,000 current account customers survey during 9th to 16th March 2015. Ranking and response pertaining to Clydesdale Bank only not
CYBG; 3. Survey consists of First Direct, Nationwide Building Society, Clydesdale Bank, TSB, Santander, Yorkshire Bank, Co-op, Halifax, Bank of Scotland, NatWest, Lloyds, Barclays, HSBC and RBS
Service quality recognised by the market
78 77 72
66
Best onlineservice
Best customerservice (branch)
Overallsatisfaction
Best customerservice (overall)
uSwitch Annual customer survey responses(2), %
Source: Uswitch customer survey (2015)
Balanced scorecard approach for all staff
All staff undertake fair outcomes training – 96% of staff surveyed
indicated they understand how to contribute to meeting the needs of
customers (up from the previous year)(1)
19% reduction in monthly complaints, excl. PPI (FY14 vs. FY15)
Clear focus on fair customer outcomes

5.5 5.9 6.5 6.9
3.4 3.9 4.4 6.0 6.6 5.2 4.4
4.5
15.5 15.1 15.4 17.5
2012 2013 2014 2015
PCAs Personal variable rate savings Personal fixed rate term
2.7 3.0
3.3 3.6
2.7 3.1
3.6
4.7
2012 2013 2014 2015
PCAs Savings CAGR (2012 – 2015)
100
Cost of funds, Bps
115 153 169 Over 30% of Customers
25-30% of Customers
20-25% of Customers
10-20% of customers
<10% of Customers
42%
78% PCA customers
with us > 10 years
Primary PCA
relationship(2)
Growing lower cost personal deposit balances
Gross deposits balances (£ Bn)
Growing average balances
Average deposit balance per customer (£000s)
25
21%
8%
CAGR
(2012 –2015)
(12%)
New footnote
Cost of funds amended
Title change We will continue to grow our deposit franchise, leveraging our loyal
customer base in core regions
1. Core regions defined as Scotland, Yorkshire and the Humber and North-East and North-West England; CACI (June 2015), based on stock of balances; 2. Primary (i.e. main bank) customer must be party to at least one MT account of a
selected product type which meets the following criteria: i) credit turnover averaging at least £1000 in the last 3 consecutive months, ii) three or more standing orders or direct debits (or a combination of the three) in place, iii) three or more
customer initiated transactions (ATM, point of sale, branch counter services); 3. Market share for savings and term
1.8 MM PCA customers
3.1%
9.1% PCA share in core
regions
PCA national
share 1.3%
3.8% Savings share in core
regions(3)
Savings national
share(3)
Strong regional presence (1)

26
1.6
1.9
Traditional thrift Growing reward
15
36
Traditional thrift Growing reward
1.6
12.1
Traditional thrift Growing reward
Cross-sell, (avg. product holding) Average lending balance(1), (000s) Internet usage (%)
Source Experian (September 2015)
Aff
lue
nce
Lifestage
45 60 64
33 31 24
16 8 10
Market Average YB CB
None (C/A only) 1 2 3 4 5+
Opportunity vs. market
Youth Elderly
Low
High Market
CYB Share
Target Segment
Market: 31% CYB: 23%
CYB: 77% Market: 69%
Source GfK Financial Research Survey (FRS), 12 months ending September 2015, 58,198 main current account customers
interviewed
Significant revenue opportunity from targeting higher value, younger
customer demographics
CYBG customer segmentation; 2015
Under-weight in higher value, younger demographic
Source Experian
Traditional thrift Ageing individuals with low
incomes with reliance on the state
Growing reward High income families with growing children who are making excellent financial
progress
1. Unsecured personal lending balance
% of products held at main current account provider, 12 months ending Sept
2015
Clear opportunity to improve penetration
Target demographic presents significant revenue opportunity
27
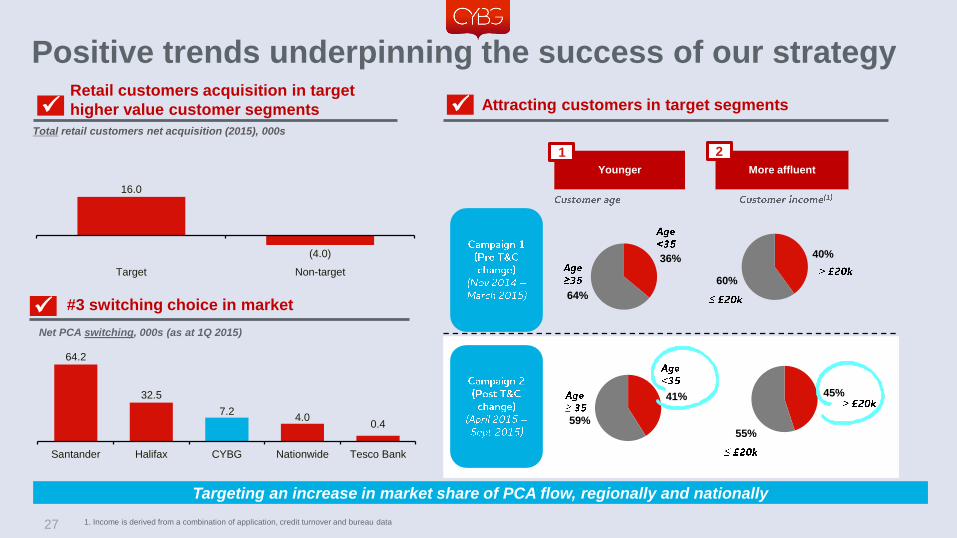
Positive trends underpinning the success of our strategy Acquisition box
Customer No.
Targeting an increase in market share of PCA flow, regionally and nationally
Retail customers acquisition in target
higher value customer segments
#3 switching choice in market
64.2
32.5
7.2 4.0
0.4
Santander Halifax CYBG Nationwide Tesco Bank
Net PCA switching, 000s (as at 1Q 2015)
Younger
1
36%
64%
Attracting customers in target segments
41%
59%
More affluent
2
40%
60%
45%
55%
16.0
(4.0)
Target Non-target
Total retail customers net acquisition (2015), 000s
1. Income is derived from a combination of application, credit turnover and bureau data

We will continue targeting growth in mortgages
15.4 16.1 18.4 20.5
2012 2013 2014 2015
1.6 3.9
Increased diversification outside of core
regions
1
Support customer needs
through controlled growth in BTL
3
Other regions
Core regions
Owner occupied
Buy to let
Intermediary
Proprietary
Achieved primarily through
intermediaries
2
2012
51%
49%
20%
80%
35%
65%
2015
41%
59%
31%
69%
53%
47%
28
Award winning “first time buyers” proposition with Moneyfacts 2 years running and “best regional lender” with Your Mortgage(3)
Gross stock balances, £ Bn
Above market growth
1. Share of stock CML (2015). Regional market share based on availability of regional loan data (73% of UK market).Stock market share as at 1H2015; 2. CAGR based 2012 to 2015. Market CAGR based on CML 2012 to 2015; 3. Awards
as at 2014 for Yorkshire Bank
Gross stock
balances (£ Bn)
National Regional
10% CYBG CAGR(2) 1% Market CAGR(2)
•
•
•
•
Scotland 6%
England North 8%
England Midlands
5%
Greater London
46%
Rest of South 30%
Other 5%
2.1 2.2
3.6 3.7
2012 2013 2014 2015 Average Annual income (2015) (£ 000s)
86% outside
core regions
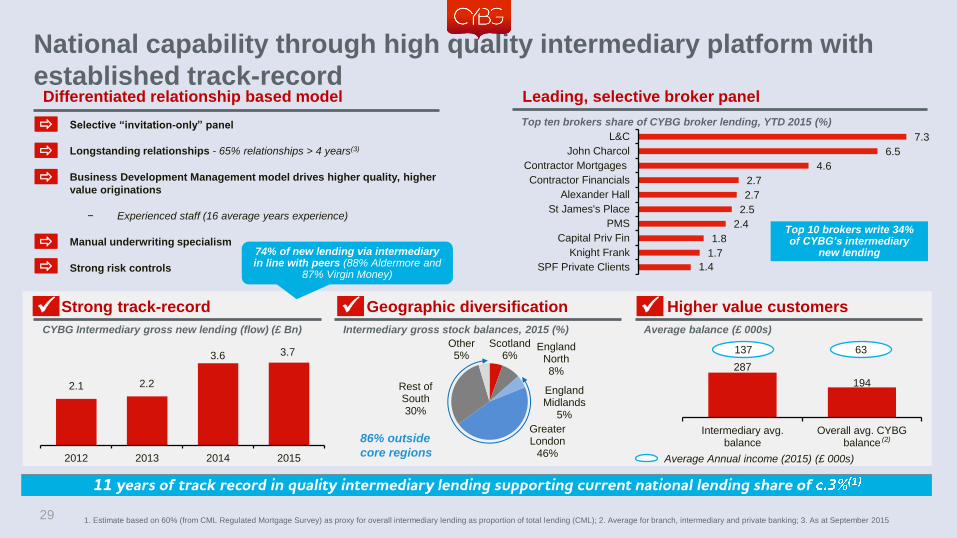
Selective “invitation-only” panel
Longstanding relationships - 65% relationships > 4 years(3)
Business Development Management model drives higher quality, higher
value originations
− Experienced staff (16 average years experience)
Manual underwriting specialism
Strong risk controls
National capability through high quality intermediary platform with
established track-record
29
Differentiated relationship based model
Strong track-record
CYBG Intermediary gross new lending (flow) (£ Bn)
Geographic diversification
Intermediary gross stock balances, 2015 (%)
Higher value customers
1. Estimate based on 60% (from CML Regulated Mortgage Survey) as proxy for overall intermediary lending as proportion of total lending (CML); 2. Average for branch, intermediary and private banking; 3. As at September 2015
1.4
1.7
1.8
2.4
2.5
2.7
2.7
4.6
6.5
7.3
SPF Private Clients
Knight Frank
Capital Priv Fin
PMS
St James's Place
Alexander Hall
Contractor Financials
Contractor Mortgages
John Charcol
L&C
Top 10 brokers write 34% of CYBG’s intermediary
new lending
Leading, selective broker panel
Top ten brokers share of CYBG broker lending, YTD 2015 (%)
287
194
Intermediary avg.balance
Overall avg. CYBGbalance
137 63
(2)
Average balance (£ 000s)
74% of new lending via intermediary in line with peers (88% Aldermore and
87% Virgin Money)
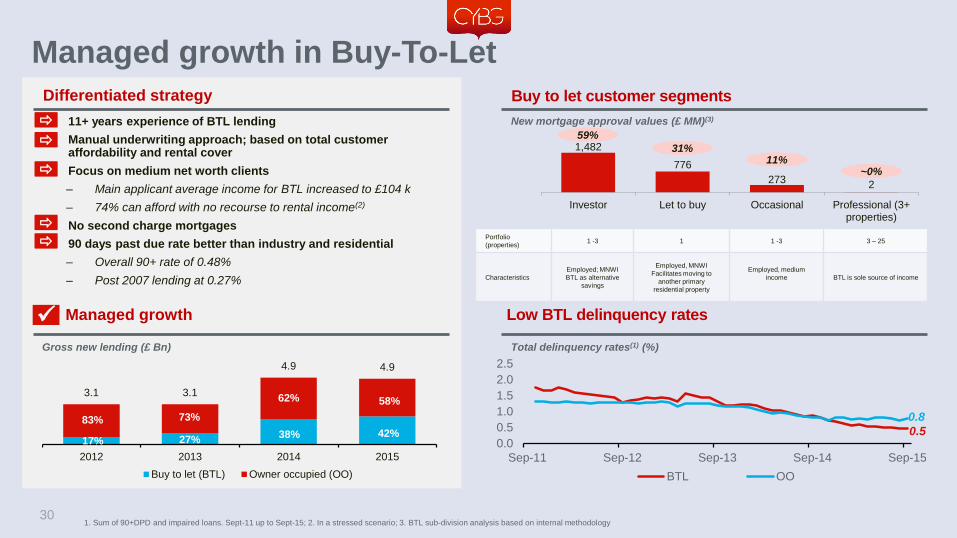
Managed growth in Buy-To-Let
11+ years experience of BTL lending
Manual underwriting approach; based on total customer affordability and rental cover
Focus on medium net worth clients
– Main applicant average income for BTL increased to £104 k
– 74% can afford with no recourse to rental income(2)
No second charge mortgages
90 days past due rate better than industry and residential
– Overall 90+ rate of 0.48%
– Post 2007 lending at 0.27%
1,482
776
273 2
Investor Let to buy Occasional Professional (3+properties)
59%
31% 11%
~0%
3.1 3.1
4.9 4.9
2012 2013 2014 2015
Buy to let (BTL) Owner occupied (OO)
Portfolio
(properties) 1 -3 1 1 -3 3 – 25
Characteristics
Employed; MNWI
BTL as alternative
savings
Employed, MNWI
Facilitates moving to
another primary
residential property
Employed, medium
income
BTL is sole source of income
30
0.0
0.5
1.0
1.5
2.0
2.5
Sep-11 Sep-12 Sep-13 Sep-14 Sep-15
BTL OO
0.5
0.8 83% 73%
58%
38%
Strap deleted
Differentiated strategy
New mortgage approval values (£ MM)(3)
Buy to let customer segments
Total delinquency rates(1) (%)
Low BTL delinquency rates
Gross new lending (£ Bn)
Managed growth
1. Sum of 90+DPD and impaired loans. Sept-11 up to Sept-15; 2. In a stressed scenario; 3. BTL sub-division analysis based on internal methodology
17% 27%
62%
42%

Focus on digital enablement to reinvigorate unsecured propositions
1. Includes private banking credit cards sold via face-to-face / branches; 2. Includes digital and telephony
Future
Credit card proposition reinvigorated
Continued focus on digital e.g. aggregators
Deepen existing relationships e.g. Secure Site
sales and “Digital Next Best Action”
Improving end-to-end customer experience
Aligned pricing across channels with capability
to differentiate by campaign
Develop new customer-centric propositions
14.2 11.3
16.3
34.2
2012 2013 2014 2015
Retail new card issuance, 000s(1)
• Digital enablement –
increased sales via
aggregators
• Competitive credit
card proposition
introduced – 0% offer
on purchases
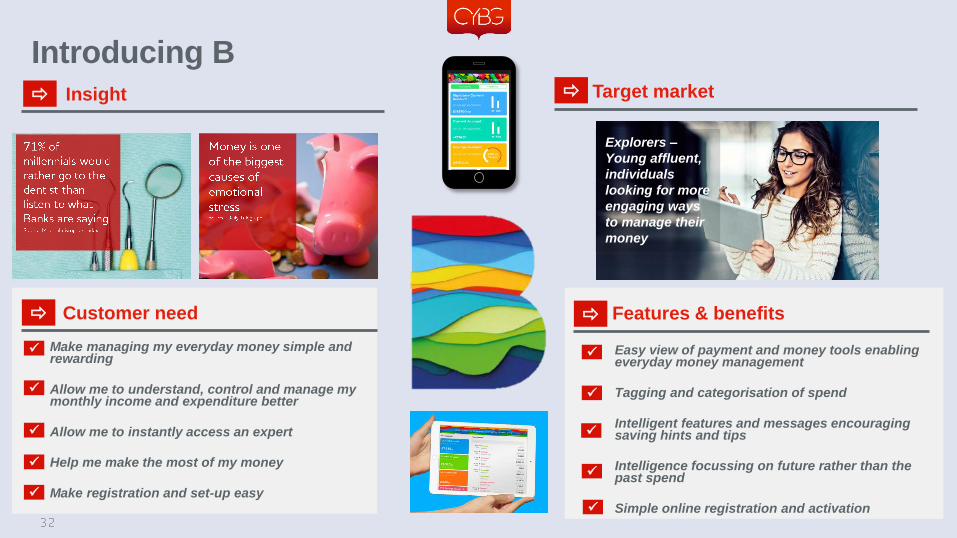
Introducing B
• Make managing my everyday money simple and rewarding
• Allow me to understand, control and manage my monthly income and expenditure better
• Allow me to instantly access an expert
• Help me make the most of my money
• Make registration and set-up easy
Easy view of payment and money tools enabling everyday money management
Tagging and categorisation of spend
Intelligent features and messages encouraging saving hints and tips
Intelligence focussing on future rather than the past spend
Simple online registration and activation
Insight
Customer need
Target market
Explorers –
Young affluent,
individuals
looking for more
engaging ways
to manage their
money
Features & benefits

Gavin Opperman
Director Customer Banking

5.1
1.2 0.8
Term lending Overdraft Working CapitalSolutions
Asset 55%
Invoice 41%
Full-service product proposition aligned to 179 k customers’ needs
Gross total business banking balances (2015), £ Bn
(1)
6.0
1.8 1.0
BCAs Savings Term deposit
Established SME bank with regional track-record and scale
34
3.5
15.4
6.7 5.7 4.3
National Scotland Yorkshire &the Humber
North East North West
#3(4)
% SME stock market share (BBA)(10) Market position(4)
Business Direct
Platform
• 51 k customers
• 79 RMs
• Telephony support
for small business
Relationship
Managers (RMs)
• 325 Business &
Commercial
Banking RMs(5)
• 97 Private Banking
RMs
Product and Sector
Specialists
• 183 Working Capital
Solutions(6)
• 177 Specialist and
Acquisition
Finance(7)
• 70 Sector
Specialists(8)
Digital
Platform
• Business Online
internet platform
• 14 k Business
Online and 47 k
internet banking
registered users
Treasury & trade
4%
Integrated omni-channel service and origination model (3)
Leading regional presence
Network with national reach(9)
1.Defined as asset finance, invoice finance, treasury & trade finance; 2. Regional hubs deliver an integrated Commercial, Specialist and Acquisition Finance (‘SAF’), Small Business and Private proposition. Glasgow and London West End are co-
located; 3. As at September 2015; 4. CMA review (Banking services to small and medium sized enterprises, July 2014); 5. 325 RMs include: Business Direct (79), Commercial (140 – including 50 Agribusiness RMs), Small Business (37), SAF (45)
and National Business Solutions (“NBS”) (24); 6. Includes Asset Finance (46), Invoice Finance (69), Other (68 - incl Payments and Treasury Solutions) staff; 7. 69 RMs (included in 325) plus Associate Directors, Growth Finance, Origination Directors ,
NBS Advisers and Management. Includes 31 CSC staff transferred into SAF since March 2015; 8. 50 Agriculture RMs (included in 325) plus 12 Sector specialists and 8 CRE specialists; 9. Map excludes Orkney and Shetland; 10. BBA 2Q2015 SME
lending stock
Birmingham
Edinburgh Glasgow
Leeds
Manchester
Carlisle
Dundee
Thainstone
Preston
Gloucester Oxford
Northampton
Lincoln
York
Gatwick
St Albans
Bury St Edmunds
London West End
Lancaster
Additional distribution
support through the
Post Office
Regional B&PB hubs
B&PB centres
Retail co-located Aberdeen
Newcastle
40 centres including 6 Hubs
(70% of centres are co-located with Retail)

Solid foundations for delivering a refreshed proposition
Portfolio de-risked
Transfer of £5.7 Bn CRE
to NAB(2)
Business refocused on
SME customers
Tightened risk appetite
Further run-off of
£1.1 Bn low yielding
business loans by 2019
Restructured 72 to 40
Business & Private Banking
Centres(3)
Established 6 regional
customer service centres
28 co-located business
centres with Retail(4)
23 k customers moved to
Business Direct(3)
Standardised
relationship management
portfolios
Centralised
administrative support
Reduced headcount by
44% - direct cost base
reduced by c.30%
Prioritised resource to
targeted growth areas
Exited IFA business
10.8 6.0
5.7
1.1
16.5
7.1
2012 2015
2012 CRE 2015 Identified run-off
72
40
2012 2015
Number of Business & Private
Banking Centres
70% 15%
% of co-located sites
27
51
2012 2015
Number of BD customers
(000s)
29% 13%
% customers serviced through
Business Direct
2,103
1,173
Beforerestructuring
Afterrestructuring
Number of FTE
Distribution restructured Service model redesigned Operations right-sized
Franchise significantly de-risked and positioned for growth
Business banking loan book
(£ Bn)
35 1. Low-yielding run-off was only identified in 2014; 2. In 2012; 3. Sept 2012 to Sept 2015; 4. Latest (Sept 2015); 5. One centre marked for closure in 2016
Footnote;
legend
(1)

Micro 97 k 55%
Business Direct 51 k 29%
Small Business 7 k 4%
Commercial / SAF 22 k 13%
Diversified customer base across full SME spectrum
Business customers split (2015),% Segment Definition
Micro Turnover: <£120 k
No lending
Business Direct Turnover: <£750 k
Lending: <£0.1 MM
Small Business Turnover: >£750 k – £2 MM
Lending: £0.1 MM-£0.25 MM
Commercial / Specialist &
Acquisition Finance (‘SAF’)
Turnover: >£2 MM
Lending: >£0.25 MM
Full-service model targeting needs of diversified customers
36
Total (2015): 179 k customers
Micro £0.6 Bn
7%
Business Direct £1.0 Bn
11%
Small Business £1.8 Bn
20%
Commercial / SAF
£5.5 Bn 62%
Total SME Deposits (September 2015): £8.8 Bn
Business Direct £0.1 Bn
2% Small Business
£0.3 Bn 4% Commercial /
SAF £6.7 Bn
94%
Total SME Loans (September 2015): £7.1 Bn
(1)
1. Includes SAF (1,430), NBS and other customers
Gross stock (2015),% Gross stock (2015), %
Deposit base supported by small and micro
customer base
Lending focused on higher value, lower risk
commercial relationships
%
updated

Explain how or on
what basis?
• Cash flow lending
• Acquisition finance
• Growth finance
• Emerging technology unit(4)
• Asset finance
• Invoice finance
• Treasury solutions
• Payment solutions
• International trade
SECTOR SPECIALISTS
70 staff(1)
WORKING CAPITAL SOLUTIONS
183 staff(2)
SPECIALIST & ACQUISITION FINANCE
177 staff(3)
• Agriculture
• Hospitality and Hotels
• Health
• Manufacturing – automotive tooling
• Transport – near shore marine
• Finance – insurance brokers
• CRE and housing associations
Significant product and sector expertise available to deliver the best solutions for our clients
Customers
Note: Data as at 2015
1. 50 Agriculture RMs (included in 325) plus 12 sector specialists plus 8 CRE specialists. See page 35, footnote 5 for full RMs split; 2. Includes asset finance (46), invoice finance (69), other (68 - including payments and treasury
solutions) staff not included within 325 RMs; 3. 69 RMs (included in 325) plus associate directors, growth finance, origination directors, National Business Services (NBS) advisers and management; 4. Newly established team which
targets high growth early stage technology companies backed by Business Angel syndicates/VCs & PE houses
Relationship-driven service model integrated with extensive product
and sector specialism
37
Relationship Managers
325 SME RMs Digital Network
Relationship managers are at the heart of our omni-channel distribution model

Local presence and quality face to face service drives deep
understanding of customer needs
38 Note: Data as at September 2015; Map excludes Orkney and Shetland; 1. 177 Commercial (including Agriculture RMs) and Small Business RMs and 79 Business Direct RMs (total 256) included in 325 RMs; 2. Commercial lending excluding
SAF
Quality face to face service delivered by RMs with over 15 years average experience
Alastair Christmas
Scotland Director • 31 years experience, chartered banker
• 70 RMs in team (22% of RMs)(1)
− 18 years average service
• 34% of gross new lending(2)
• 10 k customers / 11 years average longevity
Brian Colquhoun
South & Midlands Director • 35 years experience, chartered banker
• 44 RMs in team (14% of RMs)(1)
− 8 years average service
• 24% of gross new lending(2)
• 5 k customers / 8 years average longevity
Simon Wright
East and West England Director • 23 years experience
• 63 RMs in team (20% of RMs)(1)
− 18 years average service
• 42% of gross new lending(2)
• 9 k customers / 10 years average longevity
Andrew Falconer
Business Direct Director • 18 years experience, chartered banker, MBA
• 79 RMs in team (25% of RMs)(1)
− 8 years average service
• 51 k customers / 13 years average longevity
Birmingham
Edinburgh Glasgow
Leeds
Manchester
Carlisle
Dundee
Thainstone
Preston
Gloucester Oxford
Northampton
Lincoln
York
Gatwick
St Albans
Bury St
Edmunds
London
West End
Lancaster
Aberdeen
Newcastle

Lending strategy diversifying into higher return products
39
Loan book weighted to traditional term lending
Gross loan balances, 2015
1. Gross customer margin for front book, not portfolio stock
Term
£5.1 Bn, 72%
Overdrafts
£1.2 Bn, 16%
Treasury & trade
finance
£30 MM, <1% Asset finance
£0.4 Bn, 6%
Invoice finance
£0.3 Bn, 5%
• Strong relationships with customers — c. 67% of originations from existing customers
• Working capital solutions supporting increasing customer demand
Invoice finance – c. 600 customers / £319 MM balances (2015)
Asset finance – c. 8,140 agreements / £425 MM gross balances (2015), reflecting 10% growth in origination balances
• Specialist and acquisition finance is a key part of growth strategy
SAF remains 31% of total balances
Acquisition finance represent only 7% of total balances
Focused growth in higher return product areas
Gross new facilities accepted and available to customers, 2015
3.58%
3.58%
3.63%
3.05% Gross customer
margin(1) (2015)
(%)
Overdrafts
£430 MM, 22%
Term
£923 MM, 47%
Asset finance
£404 MM, 21%
Invoice finance
£169 MM, 9%
Treasury & trade finance
£10 MM, 1%
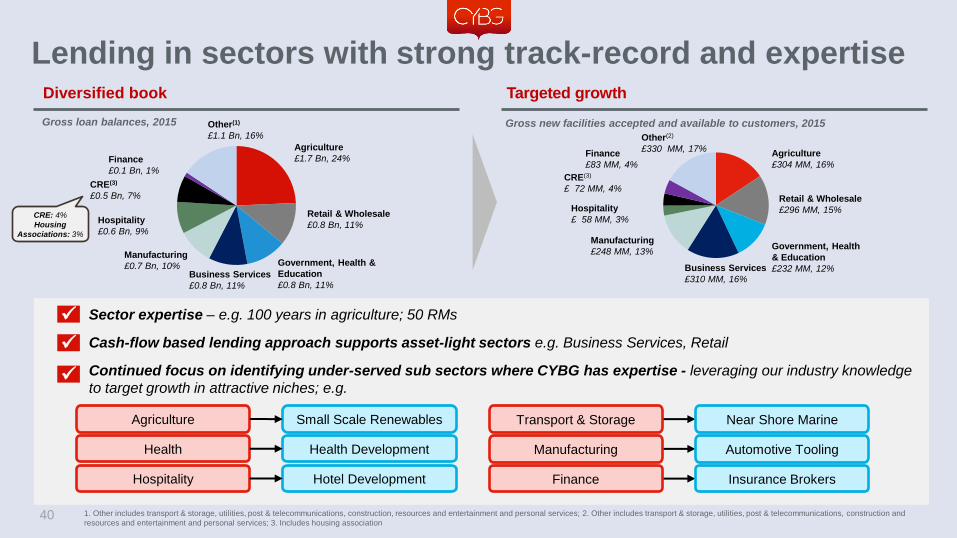
Lending in sectors with strong track-record and expertise
40
Diversified book
Gross loan balances, 2015
1. Other includes transport & storage, utilities, post & telecommunications, construction, resources and entertainment and personal services; 2. Other includes transport & storage, utilities, post & telecommunications, construction and
resources and entertainment and personal services; 3. Includes housing association
• Sector expertise – e.g. 100 years in agriculture; 50 RMs
• Cash-flow based lending approach supports asset-light sectors e.g. Business Services, Retail
• Continued focus on identifying under-served sub sectors where CYBG has expertise - leveraging our industry knowledge
to target growth in attractive niches; e.g.
CRE: 4%
Housing
Associations: 3%
Retail & Wholesale
£0.8 Bn, 11%
Business Services
£0.8 Bn, 11%
Agriculture
£1.7 Bn, 24%
Government, Health &
Education
£0.8 Bn, 11%
Manufacturing
£0.7 Bn, 10%
CRE(3)
£0.5 Bn, 7%
Finance
£0.1 Bn, 1%
Other(1)
£1.1 Bn, 16%
Hospitality
£0.6 Bn, 9%
Agriculture Small Scale Renewables
Health Health Development
Hospitality Hotel Development
Transport & Storage
Manufacturing
Finance
Near Shore Marine
Automotive Tooling
Insurance Brokers
Labels
colours
Targeted growth
Gross new facilities accepted and available to customers, 2015
Business Services
£310 MM, 16%
Agriculture
£304 MM, 16%
Retail & Wholesale
£296 MM, 15%
Manufacturing
£248 MM, 13% Government, Health
& Education
£232 MM, 12%
Finance
£83 MM, 4%
Transport & Storage
£82 MM, 4%
Utilities, Post, Telephony
£77 MM, 4%
Other(2)
£330 MM, 17%
CRE(3)
£ 72 MM, 4%
Hospitality
£ 58 MM, 3%

Focused sector and product expertise enables targeted growth
41
Significant breadth of knowledge and expertise across CYBG
Complemented by experienced underwriting capabilities with > 10 years of average expertise
Se
cto
r a
nd
sp
ec
iali
st
fin
an
ce
Wo
rkin
g
ca
pit
al
so
luti
on
s
• Manufacturing
• Kevin Rimmer
• 20+ years experience
• Previously at Lloyds TSB and ABN AMRO
• Agriculture
• David Hannon
• 32 years of experience
• Previously at HSBC
• CRE: Housing Associations
• Elaine Reed
• 30+ years experience
• Previously at Social Housing Regulator and Co-op
• Hospitality/ Hotels
• Shona Pushpaharan
• 10 years of experience
• Previously Head of Hotels at AIB
• Health
• Derek Breingan
• 13+ years of experience
• Previously at RBS
• Chartered banker
• Invoice Finance
• Martin Rothera
• 15 years of experience
• Asset Finance
• Iain Corbett
• 30 years experience
• Previously with Fortis Lease
• Treasury Solutions
• David McGill
• 30 years experience
• Previously at RBS
• Intern’l Services
• John Brown
• 30 years of experience
• Previously at Lloyds and RBS
• Payment Solutions
• Andrea Belle
• 25+ years experience
• Extensive experience of Business & Retail Banking
• Regional Director
• Graeme Sands
• CA with Industry experience
• Previously at PWC
• Regional Director
• Phil Tarimo
• 20 years Corporate Banking experience
• Chartered Accountant
• Finance – Insurance Brokers
• Paul Hambrook
• 17 years experience
• Previously at RBS
• Transport – Marine
• Matt Smith
• 20+ years of experience
• MBA, Member of Chartered Institute of Logistics & Transport
• CRE
• John Carter
• 30 years experience
• Property Lending Specialist
Profiles updated

42
Long-standing regional presence delivering stable deposits
Source: 1.21.7.7 Business model based on long-standing local relationships: 54% of customers have been with us for > 10 years
Positive deposit growth despite low yielding corporate book run off
5.2 5.3 5.5 6.0
1.9 1.9 1.7 1.8
3.3
1.7 1.3 1.0
10.4
8.8 8.5 8.8
2012 2013 2014 2015
BCAs Business variable rate savings Business fixed rate term
Cost of funds
(2015)
0.2%
0.6%
1.1%
0.4%
Established, long-standing
regional presence(1)
c.14%
#3
BCA market share
in Scotland
BCA rank in
Scotland for last
10 years
1.4% National BCA
market share
0.9% 0.5% 0.8%
Cost of funds (%)
1. Regional market share based on Scotland only as calculated by CMA review (Banking services to small and medium sized enterprises, July 2014); national market share based on BoE 2015
calculation; 2. Cost of funds of all BCAs, where as cost of funds of interest bearing BCAs of 0.2% and cost of funds of non-interest bearing BCAs of 0.0%; 3. Deposit only SME accounts
Gross deposit balances (£ Bn)
(2)
42 43 40 40
Average deposit per account (£k)(3)
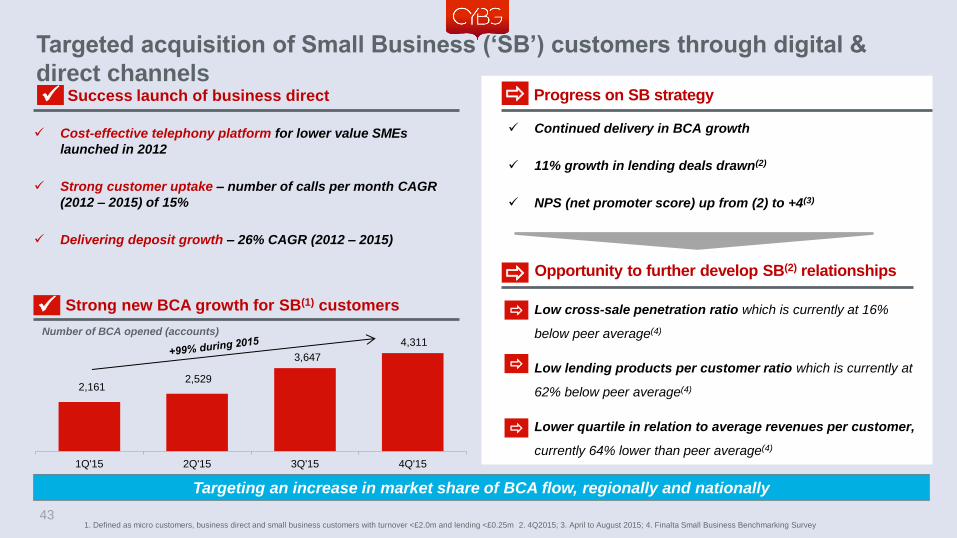
2,161 2,529
3,647
4,311
1Q'15 2Q'15 3Q'15 4Q'15
43
Targeted acquisition of Small Business (‘SB’) customers through digital &
direct channels
• Low cross-sale penetration ratio which is currently at 16%
below peer average(4)
• Low lending products per customer ratio which is currently at
62% below peer average(4)
• Lower quartile in relation to average revenues per customer,
currently 64% lower than peer average(4)
1. Defined as micro customers, business direct and small business customers with turnover <£2.0m and lending <£0.25m 2. 4Q2015; 3. April to August 2015; 4. Finalta Small Business Benchmarking Survey
Targeting an increase in market share of BCA flow, regionally and nationally
Success launch of business direct Progress on SB strategy
Number of BCA opened (accounts)
Strong new BCA growth for SB(1) customers
Opportunity to further develop SB(2) relationships
Continued delivery in BCA growth
11% growth in lending deals drawn(2)
NPS (net promoter score) up from (2) to +4(3)
Cost-effective telephony platform for lower value SMEs
launched in 2012
Strong customer uptake – number of calls per month CAGR
(2012 – 2015) of 15%
Delivering deposit growth – 26% CAGR (2012 – 2015)

318.6
121.9
Private banking Retail (ex. Intermediary)
Fee-based relationship driven proposition aimed at higher net
worth customers, primarily business owners
Distribution synergies with SME banking and operational
synergies with Retail
Serviced through 97 RMs with average 19 years experience
Premium banking service model
44
Type Income/ Criteria %
Business Owner 25% stake in business or specific
job titles (1) 52%
Professionals £75k- £200 K p.a 26%
Successful
Retirees assets > £100k 22%
Average deposit balances / customer
(2015), £000s
18% 35% 47%
1 Product 2 Products
3+ Products
1. The reference "specific job titles" includes roles such as Chairman, Managing Director, Chief Executive, Group Chief Executive Officer, Owner, Proprietor, Interim Chief Executive, Partner; 2. Includes
Direct. Retail excludes intermediary customers and micro
Deposit balances (2015)
84.4
5.7
Private banking Retail (ex. Intermediary)
Total loans £3.4 Bn
12% of group Total deposits £2.9 Bn
11% of group
Product holding per customer
(2015), %
Private banking current accounts
Profitable complementary Private Banking proposition High quality complementary customer base Complementary proposition for business owners
Average mortgage balances / “new to bank”
customer (2015), £000s(2)
Gross loan balances (2015)
Over 10% of group customer loans and deposits Higher value customers Higher cross-sell
All current accounts
51% 32%
17%
Variable mortgages
61%
Fixed mortgages
34%
PLs 3%
Overdraft 1% PCAs
30%
Savings 42%
Term 28%

Debbie Crosbie Chief Operating Officer

Proven operating platform, with scalable infrastructure aligned to the
full-service proposition
46
• 65 MM mobile app logins • 689 k internet banking registrations • 41% of personal loans opened online
Internet banking and digital channels
Everyday banking capability
• 18 MM teller transactions p.a.
• 21.9 MM account maintenance requests handled
• 3.4 MM calls answered by direct banking
Full clearing bank
• 151 MM inward UK BACS payment transactions processed
• 24.5 MM outgoing UK faster payment transactions processed
Loan origination capability
• 39 k mortgage completions in 2015 +19% CAGR (12 – 15)
• 44 k credit decisions made for business customers
Customer service delivery
• 99.6% current account switches processed within Service Level Agreement (“SLA”)
• 19% reduction in monthly complaints – excl. PPI
Proven system capabilities (2014 – 2015) IT system operating leverage opportunity
Customer facing services
• Capability to expand peak transaction capacity 2x at low cost
Multiple brands on the same IT platform • Reduced cost and complexity of regulatory /
mandatory change
Proven operating model flexibility, in response
to demand changes
• Demonstrated performance against SLAs and quality
targets through peaks and troughs
• Low cost service centres that can be flexed on demand
• Selective partners provide best-in-class service
proposition, and demand flexibility
• Proven track record of mature and effective supplier
management

• All key decision-making is locally-
managed by CYBG
• Limited enterprise dependencies
• TSA agreed in principle with NAB
• Last TSA to be exited by late-2018
• Exit plans to limit business disruption
• Strong joint governance to ensure
service levels are maintained
• Net incremental impact of standalone
costs is estimated to be £15 MM–£25
MM per annum
• Output from NAB’s credit risk engine for monthly calculation of RWAs on both standardised and FIRB basis
• Credit risk management systems: such as operational risk model and credit economic capital calculations
• Liquidity, IRRBB, market risk management and reporting systems
• Payments & processing IT systems and applications
• Middle and back office operational support
• Premises (dealing room, infrastructure and desk space)
• System support across HR reporting, payroll and performance review
• System support for financial consolidation and reporting
Risk (12 – 36
months)
Treasury (12 – 36
months)
HR &
Finance (12 months)
Clear plan to be standalone, with limited TSA service provision by NAB for a 12-36 month period
1. Captured in cost guidance provided on page [x]
Core platform standalone, with clear plan for full separation
47
Limited enterprise dependencies covered by TSAs Core banking platform standalone

1. Historically split 30% Opex 70% Capex
Sustained investment supports growth strategy
48
Total investment spend
Cash spend (1), split by category (£ MM )
153
66
219
c.300
FY13/14 FY15/16
c.50%
c.50%
70%
30%
• Sustained historical investment spend of
c.£100 MM p.a. in infrastructure and platform
• SME ‘Connected to You’ proposition
• Additional on-line products sales, including instant
access savings account
• Digitisation of on-line credit decisions
• Digitisation of on-line business capabilities
• Further B development
‘Digital Next Best Action’
Wi-Fi enabled branches
Current account on-line opening
2015 investments: differentiated proposition to grow
and digitise the bank
In development for 2016 / 2017
‘B’, a digital proposition, tablet and mobile offering to
help customers better understand and control their
money
Well progressed for early 2016

Platform is evolving to provide an omni-channel experience
49
Finance Fraud Risk HR Treasury Regulatory
Enterprise Services
Single
Customer View
Big
Data
Digital Next
Best Action Assets Payments Liabilities
Data
Warehouse
Analytics
& MI
Transaction
Data Store Communications Collections & Recoveries Credit Scoring
Core Banking Services Data Services
Open
Banking API
Micro
Services Process Digitisation Automated Services Identify and Authentication
Personalisation User
Experience Digital Employees End-to-end Automation
Trusted
Data
Digital IT Platform
Customer Experience
Omni-Channel Proposition
Branch ATM Tablet Mobile Internet Telephone Intermediary “B” platform

Disciplined investment, supporting current growth strategy
Future opportunity from delivery of digital Omni-channel strategy
Future opportunity for simplification, cost and efficiency initiatives
Our strategic aims
1
2
3
Our business today
Robust, scalable platform with operating leverage
50
Proven operating platform aligned to a full service customer proposition
Limited reliance on NAB and clear plan to be fully standalone
Flexible and resilient model with significant operating leverage

Risk Management
51
Derek Treanor Acting Chief Risk Officers
Debbie Crosbie Chief Operating Officer

52
2011 2012 2013 2015 2014
Strategic
review of UK
business
1
Risk & control framework
review
2
Transfer of
CRE portfolio
3
Conduct risk review
4
Customer trust & confidence team
established
5
Asset quality
review
6
• Risk framework enhanced and tightened following a Strategic
Review of the business in 2011
• Risk & control framework review established clear ownership
and accountabilities for risk across the 3 Lines of Defence
• Business lending has been de-risked through the transfer of a
£5.7 Bn Commercial Real Estate portfolio and run-off of higher
risk and unprofitable lending
• Legacy conduct risks identified, with a conduct risk
mitigation package in place
• Customer trust & confidence team established to ensure clear
accountability and a dedicated focus on fair outcomes for
customers
• Asset quality review concluded in 2015 with positive affirmation
of the credit framework
1
2
3
4
5
6
Enhanced Risk & Control Framework Significant changes to strengthen risk functions CYBG business has been de-risked
431 FTEs across five distinct areas of risk – strong mix of internal promotions and lateral hires from experienced executive management teams
= Senior management with experience through the cycle and three of five Risk Leadership Team members recruited externally =

15.4 15.4 16.1 18.4
20.5
1.3 1.3 1.3
1.3
1.2
16.5
10.9 9.0
8.0 7.1
33.2
27.6 26.4
27.7 28.8
2012(incl CRE)
2012(excl CRE)
2013 2014 2015
Mortgages Retail unsecured Business
53
% mortgages of total
Loan portfolio performing strongly
769
205 158 80 59
2012(incl CRE)
2012(excl CRE)
2013 2014 2015
Total impairment losses on average credit exposures including fair value loan credit risk adjustments
1,294
452 426 375 263
377
233 222 182 143
1,671
685 648 556 406
2012(incl CRE)
2012(excl CRE)
2013 2014 2015
Gross impaired assets Total 90+DPD
Impairment charge (£ MM)
Impairment charge to gross average loan balances (bps)
% of gross loans
231bps 74bps 60bps 30bps 21bps
2.5% 2.5% 2.0% 5.0% 1.4%
Portfolio asset quality (£ MM) £ Bn
Core portfolio breakdown by product Asset quality
56% 67% 61% 71% 46%
Reweighting to mortgages Material and sustained improvement in asset quality

0.0
0.5
1.0
1.5
2.0
2.5
Sep-09 Sep-10 Sep-11 Sep-12 Sep-13 Sep-14 Sep-15
I/O C/I OO BTL
0.7 0.6
0.8
0.5
1. Sum of 90+DPD and impaired loans
Continued affordability stress testing at
mortgage interest rate of 7.45%
No interest only sold in retail network:
restricted to private banking and broker
channels since 2013
No self-certified Mortgages
Geographic exposure diversified
through broker channel
All mortgages >£500 k are manually
underwritten
Robust manual underwriting processes
in BTL and broker channel
45 manual underwriting staff with
average 22 years of banking experience
Improved LTV profile of back book
reflecting House Price Indexation trends
Reduced risk profile across mortgage book
Risk dynamically managed as
risks and opportunities evolve
Delinquency (90+DPD)(1), %
Robust quality drives declining
defaulted delinquency
54
Improved risk profile driven by macro
environment and prudent approach
71 76 64 66
133 131 109 98
204 207 173 164
2012 2013 2014 2015Gross Impaired Assets Total 90+DPD
1.3% 1.3% 0.9% 0.8%
% of Mortgage Book
£ MM
% of defaulted loans reduced Impairment charge remains low
Coverage remains strong
10
14
6 10
8
18
2012 2013 2014 2015
Impairment charge
7bps 9bps 3bps 9bps
13.2 15.0 15.6 23.8
38.0 40.8 42.2
59.1
2012 2013 2014 2015
Provisions % Impaired & 90+DPD
Provisions % Impaired
£ MM
Impairment charge remains low
%
Coverage remains strong Impairment charge to gross average loan
balances (bps)

55
Scotland 17%
England North 24%
England Midlands 7%
Greater London 28%
Rest of South 20%
Other 4%
OO - C/I 45%
OO - I/O 13%
BTL - I/O 39%
BTL - C/I 3%
(1)
Note: All data as at 2015
1. Other includes Wales, Northern Ireland, Channel Islands and those new accounts where the region might be unknown until collateral matching has occurred; 2. Excludes loans where data is not currently available due to front book
data matching still to be completed and historic data capture requirements
Retail secured lending remains diversified and prudent
<= 50% 10%
50-80% 68%
80-90% 18%
90-100% 4% <= 2
20%
2 to 3 30%
3 to 4 30%
4 to 4.5 11%
> 4.5 9%
Gross new mortgage lending - repayment and borrower profile split, % Mortgage lending stock - geographic split, %
Lending is geographically diversified Majority of new lending continues to
be owner-occupied
Gross new mortgage lending - loan-to-income breakdown, % (2) Gross new mortgage lending – LTV breakdown (at origination), % (2)
LTV remains conservative LTI profile within risk limits
Colours
footnote

2.1 2.2
3.6 3.7 0.3 0.2
0.3 0.4
0.8 0.7
0.9 0.9 3.1 3.1
4.9 4.9
2012 2013 2014 2015
Broker Private banking Branch & Direct
Asset quality metrics evidence strong performance reflecting typically High
Net Worth Customers
Selective broker panel, by invitation only (c.331 from 3,500+)
Regular reviews of Broker introducers, using MI to monitor performance,
includes FCA status, Equifax assessments and fraud referral levels
Arrears rates and subsequent losses from individual Brokers are monitored,
action taken if required.
Broker site visits regularly conducted
66% 70% 74% 74%
% broker of total new business volume
1. Other includes Wales, Northern Ireland, Channel Islands and those new accounts where the region might be unknown until collateral matching has occurred; 2. Sum of 90+DPD and impaired loans; 3. Excludes loans where data is not
currently available due to front book data matching still to be completed and historic data capture requirements
0.0
0.5
1.0
1.5
Sep-11 Sep-12 Sep-13 Sep-14 Sep-15
Broker (total book)
Broker (originated over last three years)
0.2 0.1
<= 50% 32%
50-80% 63%
80-90% 4%
90-100% 1%
95%
“<80% LTV”
Scotland 6%
England North 8%
England Midlands
5%
Greater London
46%
Rest of South 30%
Other 5% <= 2
19%
2-3 27%
3-4 29%
4 - 4.5 12%
>4.5 13%
87%
“<4.5 LTI”
(1)
2012 amended;
geographic % updated
footnote Disciplined approach to broker origination
Gross new mortgage lending volumes, £ Bn
3/4 of new lending through broker channel Disciplined approach to broker origination
Low LTV, diversified book...
Broker Delinquency (2), %
...with low delinquency
Indexed LTV Band (Value) 2015
(% of intermediary stock)(3)
Geographic split 2015
(% of intermediary stock)
LTI split 2015
(% of intermediary stock)(3)
56

2.6 2.9 4.2
5.7 0.5 0.6
0.7
0.7
3.1 3.5
4.9
6.4
2012 2013 2014 2015
I/O C&I
• BTL applications are credit assessed using a full income and stressed expenditure (I&E) assessment as the primary affordability test
Stressed rental cover can also be used
CYBG’s approach favours customers seeking investment growth returns rather than rental yields
• BTL borrowers limited to a max of three properties with CYBG
• Appetite, across the cycle, for a maximum of 35% of portfolio in BTL
• Conservative BTL LTV
I/O BTL Mortgages limited to max 75% LTV
C&I BTL Mortgages limited to max 80% LTV
0.0
1.2
2.3
3.5
Sep-11 Sep-12 Sep-13 Sep-14 Sep-15
BTL OO
0.5 0.8
<= 2 31%
2-3 27%
3-4 21%
4 – 4.5 7%
>4.5 14% <= 50%
24%
50-80% 73%
80-90% 2%
90-100% 1%
97%
“<80% LTV” 86%
“<4.5 LTI”
<= 75% 2%
75-100% 4%
100-125% 8%
125-150% 19%
> 150% 67%
Conservative approach to BTL – book performing well
BTL total stock, £ Bn
Managed growth in BTL(4) Conservative approach to BTL origination
BTL profile
Delinquency rates (1), %
Low BTL delinquency rates
Indexed LTV (Total BTL)(2), % LTI (Total BTL) (2), % Rent cover (Total BTL) (2,3), %
1. Sum of 90+DPD and impaired loans; 2. Excludes loans where data is not currently available due to front book data matching still to be completed and historic data capture requirements 3. Rental cover is based on initial payment and
any repayment; 4. The average back book loan size is c.£170k 57

58
730 756 824 763
436 396 364 376
144 122 94 79
1,310 1,274 1,282 1,218
2012 2013 2014 2015
PLs Credit Cards Overdraft
14 14
10 9
2012 2013 2014 2015
Total 90+DPD
29 28 22
15
2012 2013 2014 2015
Impairment charge
4.7% 4.8% 4.6% 4.2%
% of Total Book
1.1% 1.0% 0.8% 0.7%
% of Unsecured Lending Portfolio
214bps 218bps 170bps 118bps
286 285 310 256
2012 2013 2014 2015
Unsecured loans are a small proportion of book and performing well
£ MM £ MM
Unsecured <5% of total book Asset quality strong
Provision as a % of 90+DPD £ MM
Impairment charge declined Coverage remains robust
Impairment charge to gross average loan balances(bps)
Controlled risk appetite — UPLs >25k go through manual underwriting process

• Majority of decisions are made by the independent credit underwriter (‘DCA’) following
front line Relationship Manager (RM) support for the request
Total of 41 business underwriting staff, with an average of 22 years of banking
experience
For certain assets, underwriting is undertaken by limited number of Credit Managers with
particular sector experience, e.g. Agriculture, Specialist & Acquisition Finance
• Lending assessment focused on cash generation as primary repayment source
Process supported by in-house financial forecast tool generating industry standard Cash
Flow Available for Debt Service (CFADS)
Cashflow based underwriting expertise delivered by a team of 41 dedicated staff
Application /
Renewal
Front line
assessment
Credit
underwriter
(“DCA”)
Secondary exit
analysis
Primary exit
analysis
Business
lending
platform
Business model / debt
servicing analysis
including liquidity /
cash flow and
probability of default
Assessment of security
provided and likely
recovery in the event of
default
Joint
sign off
required
Significant experience underwriting business lending Business Credit Assessment Process Underwriting approach
59
“Categorised assets” identified in early stages by SBS team
Assets referred to SBS by RM, Credit officer or review team (1st / 2nd Line) based on:
Categorised asset checklist; daily / weekly excess lists; eCRS movements; deteriorating trends; covenant breaches
Focus on introducing loans to SBS as early as possible to ensure appropriate course of action
− No reliance on 90+DPD trigger
All Forborne Business lending is referred to and managed by SBS
Watch loans 74%
90+DPD 4%
Default No Loss <90+DPD
3%
Impaired assets 19% Loans being
monitored
% total categorised portfolio, % (2015)
£1.0bn total, 14% of Business Lending

60
Positive asset quality trajectory in business book
12.6 9.2 7.4 6.5 6.1
3.9
1.7 1.6 1.5 1.0
16.5
10.9 9.0 8.0 7.1
2012(incl CRE)
2012(excl CRE)
2013 2014 2015
Performing Categorised
24% 16% 18% 19% 14%
% Categorised
2012
(incl.
CRE)
2012
(excl.
CRE)
2013 2014 2015
Watch 2.3 1.2 1.1 1.0 0.7
Defaulted
(incl. 90+DPD) 0.4 0.1 0.2 0.2 0.1
Impaired 1.2 0.4 0.3 0.3 0.2
Total 3.9 1.7 1.6 1.5 1.0
166
116
52 27
2012 2013 2014 2015
Impairment charge to gross average loan balances (bps)
141bps 116bps 62bps 37bps
70.2 81.1 85.1 83.9
104.6
52.6 59.8 58.8 60.4
76.6
21.7 18.2 18.5 17.9 20.3
2012(Incl. CRE)
2012(Excl. CRE)
2013 2014 2015
Impaired Total categorised (less watch) Total categorised
£ Bn £ Bn
Quantum of categorised loans reduced All elements of categorised loans declining
Total provisions as a % of the respective category £ MM
Impairment charges have reduced(1) Coverage remains robust
1. Impairment charge includes gains and losses on financial instruments at FV comprises: fair value gains and losses on derivatives held for economic hedging activities, ongoing hedge ineffectiveness and movement of fair value loans that are no longer sold; Business impaired loans of £381 in 2012 (excluding CRE), £350 in 2013, £311 in 2014 and £197 in 2015

61
Legacy conduct exposure well addressed
• Total cover of £2.1 BN1 across provisions and conduct indemnity
o Substantial unutilised provisions of £986 MM (as at 30 September 2015) in place to cover legacy conduct costs
o Severe stress scenario is addressed by an additional conduct indemnity of £1.115 BN1, which covers customer redress and
administrative costs relating to pre-separation conduct issues
• Visibility on PPI outlook improving with upheld complaints on a falling trend
o Walk-in complaints running at approximately 3,3002 per month, average redress paid circa £4,000 per upheld complaint
o FCA consultation on time barring potentially draws a line under the issue
o Substantial provisions raised for PBR3 and Back Book Remediation
o Significant progress made on other conduct issues
o IRHP4 scheme is fully provided and closed
o FRTBL4 adequately provided and settlement progressing
o No other material issues identified
• Substantial investment undertaken to reduce conduct risk in the front book
o Robust customer fairness model embedded to mitigate future conduct risks
1. The indemnity provided by NAB is drawn pro rata with CYBG £120 MM risk share (CYBG risk share amount is included in CYBG’s capital base)
2. Based on FY15 run rate
3. Past Business Review
4. IRHP refers to “Interest Rate Hedging Product”; FRTBL refers to “Fixed-rate Tailored Business Loan”

62
Complaint handling infrastructure reaching scale under experienced
management, to support robust execution
• Resolution of PPI represents a significant management task, exacerbated by increasing proportion of non-
reportable claims1
• New policies and processes in place, operating since August 2014 and drawing on industry best practice
• “Costs to do” remaining provisions of £203 MM represent our best estimate of future cost for handling complaints
in respect of “Walk-in”, Remediation and PBR
• CYBG currently has two sites with circa 1,450 FTEs2 dealing with PPI complaints including outsourced providers
supporting delivery. Third site is being established to further support Remediation and PBR
• Robust governance provides oversight to PPI operations. Weekly operational updates also provided to CYBG
Board and Regulators
• Operational responsibility retained by CYBG post separation from NAB, “costs to do” covered by conduct
indemnity
1. Non-reportable claims includes claims where there is no evidence of a PPI sale
2. FTEs engaged in complaint handling including outsourced providers. Funded by provision. 312 FTEs relate to CYBG employees

63
New roles, refreshed systems and processes in place to minimise future
conduct exposure
A clear set of customer and operating outcomes
which underpin the strategy and are assessed
quarterly
Implemented in March 2014 for the identification and
management of potential conduct issues
Embeds a standardised ‘best practice’ across our
product management intended to ensure improved
and consistently delivered customer outcomes
circa 120 roles created during 2013/14 including a new Executive Director (Board level) accountable for all conduct -related matters
Conduct risk
organisational
radar
Identifies current and
future conduct
concerns/triggers
Investigation of conduct
concerns/triggers
Fairness
outcome
assessment
Testing & monitoring
customer remediation
with confidence
Remediation
assurance
framework
Improving customer
centricity and cultural
maturity
Lessons
learned
framework
All products (both-on and off-sale) are
formally reviewed periodically
Frequency of reviews is risk-based
driven by 5 key risk factors of target
market, complexity, performance,
reputation and commercial risk
5 new product managers and 11 new
senior product analyst roles created
Conduct Framework 1 Customer fairness model 2 Enhanced product governance
process 3

Ian Smith Chief Financial Officer
65
Significant actions to strengthen balance sheet
Solid fundamentals
Well capitalised to support growth
Legacy conduct well addressed
Diversified funding
High quality asset portfolio
Business Momentum
Retail
SME
Deposits
Financial Performance: 2015 & Q1 2016 trading update
Outlook
Straightforward Retail and SME bank with clear path to improved profitability
and returns

1,294
263
377
143
1,671
406
2012(incl CRE)
2015
Gross impaired assets Total 90+DPD
66
Management actions strengthened balance sheet
Asset portfolio de-risked Loan book reshaped
15.4
20.5
1.3
1.2
16.5 7.1
33.2
28.8
2012(incl CRE)
2015
Mortgages Retail unsecured Business
4%
50%
46%
5%
25%
71%
CAGR
(2012 –2015)
(25%)
10%
(2%)
231bps
5.0%
% of gross loans
Impairment charge to gross average loan balances (bps)
Gross stock loans, £ Bn Portfolio asset quality (£ MM) £ Bn
21bps
1.4%
Funding position improved
10.7 13.0
5.2
7.8
9.9
5.5
0.6 0.1 3.2 3.8
7.7
1.0
0.6
0.4
38.0
31.5
2012(inc. CRE)
2015
CAGR
(2012 –2015)
(49%)
+6%
20%
8%
70%
6%
154 Blended cost of
funds (bps)
3%
12%
84%
108
+14%

• Total capital and leverage ratio comfortably in excess of regulatory requirements
– 13.2% CET1 ratio and 7.1% leverage ratio
– Includes pension and indemnity buffer
• Standardised approach to risk weighting IRB upside potential
• Additional capital protection from £1.1 Bn conduct indemnity from NAB
– Supplemented by existing unutilised provision of c.£1.0 Bn
• Existing Tier 2 and AT1 to be replaced at separation(2)
– NAB to remarket securities post completion of the transaction
67
13.2%
2.5%
3.2%
18.9%
2015 Capital Ratio
CET1
Ratio
AT1
Tier 2
7.1 Leverage ratio (%)
(£0.6 Bn)
(£0.5 Bn)
(£2.4 Bn)
2015 Total RWAs (£ Bn) 18.2
2015 Credit RWAs (£ Bn) 16.3
Credit RWAs / Loans (%) 57%
Total RWAs / Assets (%) 47%
Group capital structure(1)
% RWA
1. Capital structure of CYB Investments Limited at 30 September 2015. Capital structure in CYBG will mirror after 3 corner demerger and AT1 / Tier 2 repurchase and reissue; 2. Tier 2 £475 MM 10NC5 5% coupon & AT1 £450 MM PNC7 8% coupon
Robustly capitalised to support growth ambition
Fundamentals Momentum Financial Performance Outlook

£1.7 Bn conduct mitigation package
68
Conduct protection: sized to provide cover in severe stress
• CYBG capital requirement includes £120 MM
risk share, which is deployed alongside the
NAB indemnity
o Draw downs are pro rata1 between NAB and
CYBG
• Mitigation package amount is the result of
stress tests to CYBG’s provision models and
conduct exposures, and reflects:
o A series of extreme stresses to underlying
provision assumptions
o Multi-factor stresses
o Potential lifetime cover
£2.1 Bn provisions and indemnity
Key messages
CYBG has in aggregate £2.1 Bn of unutilised provisions and indemnity (excluding £120 MM CYBG risk share) to absorb future costs
arising from conduct issues, including redress and cost to do
1. Based on £1.115 BN of indemnity, CYBG’s risk share is a fixed 9.7% of each relevant conduct cost. If there is no further spec ific support provided by NAB prior to implementation of the Demerger, the risk share will stay at 9.7%
2. This excludes CYBG £120 MM risk share. The indemnity provided by NAB is drawn pro rata with CYBG risk share
Fundamentals Momentum Financial Performance Outlook

24.0 26.3
3.5 3.8 2.7
1.0 0.9 0.4
31.1 31.5
2014 2015
Deposits Secured funding
Due to NAB Other wholesale funding
1.1 1.1 1.1 0.5
6.1
1.4 1.1 0.1
0.5
0.4 0.4 0.4
7.7
3.0 2.6
1.0
2012 2013 2014 2015
Subordinated liabilities Wholesale funding RMBS
69
NSFR (%) (1)
Strong growth in deposits driving
improved cost of funds, NSFR and lower LDR
Further reducing funding from NAB
£ Bn
£ Bn
LDR (%)
Diversified funding portfolio weighted towards lower cost customer deposits
• All NAB senior funding repaid.
• RMBS refinanced at expected call in 2017
• Subordinated Debt remarketed post demerger
1. Net Stable Funding Ratio; 2. £100m loan repaid in October 2015, three months earlier than maturity date
115 109
108 120
77%
121 108 Blended cost of
funds (bps)
•
•
83% •
•
•
Continued improvement in funding position and mix, including strategic
actions focused on attracting lower cost, stable deposits
− Supported by strategic initiatives in products and channels
− NSFR and LDR benefiting from growth in the retail deposit book
Material reduction in levels of NAB funding
Minimal overall reliance on short-term wholesale funding
Benefits from strategic actions evident
Fundamentals Momentum Financial Performance Outlook
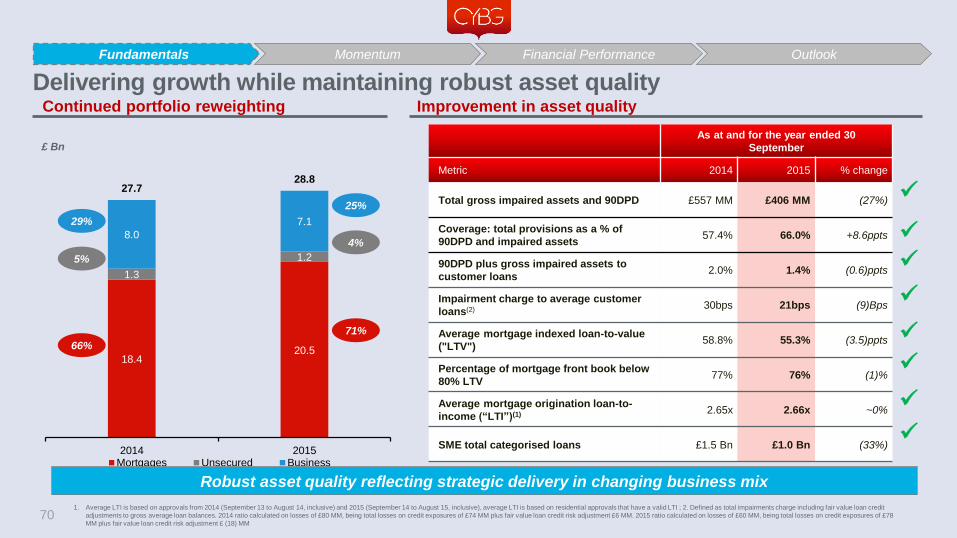
70
Delivering growth while maintaining robust asset quality Improvement in asset quality
Portfolio asset quality (£ MM)
Continued portfolio reweighting
£ Bn
18.4 20.5
1.3
1.2
8.0
7.1
27.7 28.8
2014 2015Mortgages Unsecured Business
29%
5%
66%
25%
4%
71%
Impairment charge (£ MM)
Impairment charge to gross average loan balances (bps)
0.0
0.5
1.0
1.5
Sep-14 Sep-15
I/O C/I OO BTL
0.7 0.6
0.8
0.5
176 187
57.3 65.8
2014 201590DPD 90DPD & Impaired Assets
Total provisions as a % of the respective category
Robust asset quality reflecting strategic delivery in changing business mix
Impairment charge (1) as % of average balances
Bps
3 9
29 21
62
37
170
118
2014 2015Mortgages Overall total
Business lending Unsecured
Average mortgage indexed LTV, %
58.8 55.3
2014 2015
1.5
1.0
2014 2015
Categorised
SME book categorised loans, £Bn
19% 14%
% Categorised
375 263
182
143
557
406
2014 2015Gross impaired assets Total 90 DPD
% of Gross Loans
As at and for the year ended 30
September
Metric 2014 2015 % change
Total gross impaired assets and 90DPD £557 MM £406 MM (27%)
Coverage: total provisions as a % of
90DPD and impaired assets 57.4% 66.0% +8.6ppts
90DPD plus gross impaired assets to
customer loans 2.0% 1.4% (0.6)ppts
Impairment charge to average customer
loans(2) 30bps 21bps (9)Bps
Average mortgage indexed loan-to-value
("LTV") 58.8% 55.3% (3.5)ppts
Percentage of mortgage front book below
80% LTV 77% 76% (1)%
Average mortgage origination loan-to-
income (“LTI”)(1) 2.65x 2.66x ~0%
SME total categorised loans £1.5 Bn £1.0 Bn (33%)
1. Average LTI is based on approvals from 2014 (September 13 to August 14, inclusive) and 2015 (September 14 to August 15, inclusive), average LTI is based on residential approvals that have a valid LTI ; 2. Defined as total impairments charge including fair value loan credit
adjustments to gross average loan balances. 2014 ratio calculated on losses of £80 MM, being total losses on credit exposures of £74 MM plus fair value loan credit risk adjustment £6 MM. 2015 ratio calculated on losses of £60 MM, being total losses on credit exposures of £78
MM plus fair value loan credit risk adjustment £ (18) MM
Fundamentals Momentum Financial Performance Outlook

371 363
385
361
353
321
340 331
2014 2015
Variable Fixed Front book pricing Overall
• Market pricing remains competitive – targeted approach to
pricing / volume mix decisions
• Diversified channel strategy is supportive of pricing decisions
– ability to tactically increase volumes
• Back book margin evolution driven by customer product
switching
• Total book yield benefits from continued tracker run-off(2)
71
• Successful delivery of strategic growth initiatives through broker and
proprietary channels
• Continued change in mix driven by customer behaviour in a low rate
environment
• Increase in proportion of fixed rate (‘FR’) stock to 62%
• 91% FR flow expected to increase proportion of FR over time
• Reduction in legacy tracker book, running off in line with contractual
maturity (£200–300 MM p.a.)
Spot gross balances, £ Bn Average yield excluding fee income, Bps (1)
Delivering sustainable growth Yield evolution in line with competitive market
1. Deferred fee income not allocated between sub-products, hence shown in overall line only; 2. Tracker yield constant at 142bps in 2014 and 2015; 3. SVR balance at 30 September 2015 of £3,081 MM with an average yield of 4.96% ; 4. Total mortgage
book split £6.4 Bn BTL at an average yield of 3.60% and £14.1 Bn OO at an average yield of 3.21%
Momentum in mortgage business
27 31
73 69
2014 2015
2.9 2.6
9.5 12.7
6.1
5.2
18.4
20.5
2014 2015
Tracker Fixed Variable
Proportional split of balances, %
Buy to let (BTL) Owner occupied (OO)
Fundamentals Momentum Financial Performance Outlook

72
0.82 0.76
0.36 0.38
0.09 0.08
1.28 1.22
2014 2015
Unsecured personal loans ("UPLs") Credit cards Overdrafts
10.4 9.2
15.2
14.0
12.4 12.2
12.0 10.8
2014 2015
UPLs Credit cards Overdrafts Overall
Spot gross balances, £ Bn Average yield, %
Balances broadly stable in competitive environment Yields reflect market competition and channel pricing
alignment
• UPLs yield decline driven by higher margin back book run off
• UPLs pricing now aligned across all channels
• Front book pricing driven by aggregator channels
• Slight contraction in 2015 as a result of strategic pricing decisions in
a highly competitive market
• Growth in credit card balances in 2015 reflects launch of new "Gold"
proposition
• Continued improvement in risk profile: 52 bps decline in the
impairment charge to 118 bps(1)
• Continue to develop new customer-centric propositions supported
by improved end to end customer experience and differentiated
channel pricing campaigns
Stable unsecured balances with focus on pricing discipline
1. Delta 2015 vs. 2014, calculated as impairment charge to gross average loan balances. Corresponds to a reduction of impairment charge from £22 MM in 2014 to £15 MM in 2015
Fundamentals Momentum Financial Performance Outlook

73
Successful execution of strategic initiatives
Marginal yield compression in line with market
Spot gross balances, £ Bn
Average yield excluding fee income, bps (1)
1. Deferred fee income not allocated between sub-products, hence shown in overall line only
Positioned for growth in SME book
399 379
300 300
422
404
389 378
2014 2015
Overdrafts Term lending Working capital solutions Overall
6.2 6.0
1.8 1.1
8.0 7.1
2014 2015Core lending Identified run-off
Focused growth in higher return product areas and sectors
Gross facilities accepted and available to customers, 2015
Overdrafts
£430 MM, 22%
Term
£923 MM, 47%
Asset finance
£404 MM, 21%
Invoice finance
£169 MM, 9%
Treasury & trade finance
£10 MM, 1%
Benefits of new strategic approach evident
• Higher yield front book in selected working capital solutions
products than term lending
• Selective new lending to sectors previously “closed” such as
hospitality and CRE
• Target medium term loan growth in new sectors and new to bank
customers
• Yield decline attributable to more conservative risk appetite,
competitive market pressures and existing business rolling onto
lower rates
Gross new facilities: £1.9Bn
•
•
•
Fundamentals Momentum Financial Performance Outlook

12.0 13.0
6.2 7.8
5.7 5.4 0.1
0.1 24.0 26.3
2014 2015
Current accounts Savings Term deposits Other wholesale
10 10
59 75
277
235
90 78
2014 2015
Current accounts Savings Term deposits Overall
50% 49%
115
• Overall reduction mainly reflecting term deposits dynamics
− Maturing of balances recruited in higher interest rate periods and the
effect of rolling to lower front-book interest rates
• Current account funding costs remain low
• Savings cost increase driven by preferential rates offered on ISAs
LDR
(%)
74
109
• Continued reduction in term deposit costs as a result of run-off of more
expensive back book deposits and new inflows at lower rates
– Expensive term deposits continue to be replaced by lower cost funding
– PCA growth driven by low rate environment and strategic initiatives
– Savings growth driven by competitive rates offered on linked savings and
preferential cash ISAs offering(2)
Growth in CAs and Savings balances Driving a reduction in customer funding costs
Stock of customer deposits, £ Bn Average rate, Bps (1)
1. Current accounts and total lines includes Non-interest bearing accounts; 2. ISA balance of £2,431m as at 30 September 2015 at an average rate of 166 bps
Improved deposit mix, reflecting strategic actions
Current accounts as a % of total stock
Fundamentals Momentum Financial Performance Outlook

75
• Income continues to rebase in line with expectations:
− Net interest income reflects growth in mortgages offset by lower business
lending.
− OOI lower due to changes to current account charging structures, lower
business lending, and non-recurrence of prior period sale and leaseback gains
• Expenses reflect increased investment:
− Increase compared to 2014 due to increased spend in marketing, digital platform
and developing new propositions
• Low credit losses:
− Continued strong credit performance and prudent approach
− GIA and 90DPD continue to decline while coverage ratios increased(6)
− Through the cycle expected loss estimated at c.30 bps(7)
Income statement (management basis) (1)(2) Key trends in 2015 2015 performance reflects ongoing business reshaping
Year Ended 30 September
£ MM 2014 2015 % change
Net interest income 785 787 0.3%
Other operating income (“OOI”) 205 175 (14.6%)
Gains and losses on financial instruments at
FV (8) 2 n.m.
Total income 982 964 (1.8%)
Operating and administrative expenses (686) (727) 6.0%
Operating profit before impairment losses 296 237 (19.9%)
Impairment losses (credit exposures) (74) (78) 5.4%
- Of which specific provisions (95) (73) (23.2%)
- Of which collective provisions 21 (5) n.a.
Underlying profit before tax (5) 222 159 (28.4%)
NIM 2.30% 2.20% (10)bps
Cost-to-income ratio (‘CIR‘) 70% 75% 5ppts
Impairment/Average Customer Loans(8) 30bps 21bps (9)Bps
RoTE (Underlying basis) (3) 7.7% 5.1% (2.6)ppts
1. Presented on a management basis which represents the historical results of CYBG excluding adjustments that CYBG's Directors believe are non-recurring, or otherwise not indicative of the underlying performance of the business. These include conduct redress expenses, restructuring costs, impacts of the disposed UK CRE portfolio,
impairment losses on goodwill and other one off items. Conduct charges exclude charges relating to Interest Rate Hedging Products (IRHP) in 2014. Underlying profit after tax is a non-statutory profit measure; refer to Page 96 for reconciliation to reported statutory profit; 2. Management basis also excludes the impacts of the "Insurance
Intermediary Business" (the non-trading holding company National Wealth Management Europe Holdings Ltd, and its trading subsidiary National Australia Insurance Services Ltd (NAIS), the operations of which were acquired by CYBG on 30 September 2015). Total income and net profit after tax for the Insurance Intermediary Business
for the year ended 30 September 2015 was £22 MM (2014: £23 MM, 2013: £31 MM, 2012: £41 MM) and £13 MM (2014: £12 MM, 2013: £17 MM, 2012: £22 MM) respectively; refer to Page 97 for further reconciliation to Insurance Intermediary business; 3. Management basis RoTE is defined as underlying profit less non-controlling, AT1
and preference share distributions as a percentage of average tangible equity (total equity less intangible assets excluding minorities, AT1 and preference shares for a given period). AT1 distributions commenced June 2015 with £18 MM paid in 2015 (£300 MM 6M LIBOR+763bps, £150 MM 6M LIBOR+ 690bps); 4. 2015 impairment
charge includes £8 MM representing additional collective provision overlay on secured book for losses incurred but not recognised following conclusion of the Asset Quality Review in 2015; 5. Pre AT1 and preference shares distributions and minority interests 6. Total provisions as a percentage of Impaired & 90DPD 2014 = 57.4%, 2015
= 66.0%; 7. CYBG Group has, using a financial model whose key inputs are cycle neutral probability of default ("PD"), loss given default ("LGD") and exposure at default ("EAD"), estimated the through the cycle ("TTC") expected loss on its non defaulted customer loan portfolio as at 30 September 2015 over a one year time horizon at
approximately 30 basis points. The PD/LGD/EAD model inputs are based on internal models that have not been subject to any external validation process. No assurance can be given that future losses on, or future impairment charges with respect to, CYBG Group's total customer loan portfolio, which changes over time and which
includes non-defaulted and defaulted customers loans, will not exceed the TTC expected loss set forth herein; 8. Defined as total impairments charge including fair value loan credit adjustments to gross average loan balances. 2014 ratio calculated on losses of £80 MM, being total losses on credit exposures of £74 MM plus fair value
loan credit risk adjustment £6 MM. 2015 ratio calculated on losses of £60 MM, being total losses on credit exposures of £78 MM plus fair value loan credit risk adjustment £ (18) MM
Fundamentals Momentum Financial Performance Outlook

220 218
230
220
2012 2013 2014 2015
76
Stable NIM
1. Includes liquid assets of 1.0 bps; 2. Includes wholesale funding of (1.0) bps
Breakdown of NIM evolution
• Asset pricing & mix:
− Continued shift of mix away from SME and unsecured into mortgages
− Competitive pressures on front book mortgage margins, partly offset by tracker run-off
− Unsecured environment remains competitive impacting yields and lending appetite
− Overall SME yield benefiting from run-off of low yielding corporate book
− Mix in SME front book shifting to higher yielding assets
• Deposit pricing & mix:
− Continued run-off of expensive term deposits
− Strong growth in low cost current account and savings deposits
• Swap unwind impact:
− Continued to reduce in 2015
230
(13) 9 (7) 220
2014 NIM Asset pricing & mix Liability pricing &mix
Swap income 2015 NIM
• Near term margin outlook: broadly stable subject to market interest rates and competitive environment
Stable net interest margin supported by change in mix and management actions
Fundamentals Momentum Financial Performance Outlook

Year Ended 30 September
£ MM FY12 FY13 FY14 FY15
Insurance income(2) 23 12 7 5
Business lending 49 31 27 23
Foreign exchange brokerage 21 21 19 20
Mortgages 2 3 4 3
Credit cards 16 15 14 12
Current account fees 138 135 122 108
Product income 249 217 193 171
Other (1) 15 8 12 4
Total underlying other operating
income 264 225 205 175
Note: Business lending and mortgages product fee income shown net of fees deferred under the EIR accounting
methodology
Activities no longer undertaken
• c.75% of the insurance income decline between FY12–15 driven by a reduction in
income from CYBG’s IFA business, which was closed in 2013
Reduction in Business lending book
• Business lending OOI declined primarily due to reduction of book size and
reshaped activities
Changes to Retail product T&Cs
• Current account fees lower as a result of revised charging structures and customer
behaviour
77
1
2
3
FY15 represents a normalised level of OOI (excluding impact of future investments from acquired Insurance Intermediary Business)2
Decline in contribution from OOI… …largely driven by management actions
1. Includes gain on disposal of fixed assets and other; 2. The impact to CYBG Group's results arising from the consolidation of the Insurance Intermediary business would have been additional income of £17 million in the year ending 30 September 2015
(2014: £17 million, 2013: £24 million, 2012: £31 million), additional operating expenses of £1 million (2014: £2 million, 2013: £2 million, 2012: £1 million), and a tax charge of £3 million (2014: £3 million, 2013: £5 million, £2012: £8 million).
OOI driven by pro-active response to regulatory backdrop and reshaping of book
1
2
3
Fundamentals Momentum Financial Performance Outlook

78
Cost base reflects increased investment
1. [Commentary on separation cost]
Staff costs lower due to ongoing restructuring and optimisation to enable right sizing and separation
D&A increased in the period as a result of additional investment to support the growth strategy
and digitisation agenda
Other opex increased reflecting increase in spend to support the business strategy, to support
brand, marketing and refreshed proposition and for higher intercompany charges with NAB
2016 cost guidance re-iterated – 2016 cost targeted at run rate equivalent of 2H 2015 annualised
to reflect additional standalone costs and investment, partially offset by restructuring benefits
Key trends in 2015
Management focused on the execution of a broad based simplification and productivity agenda in parallel with
rigorously targeted investment spend
Year ended 30
September
£MM 2014 2015
Staff costs 287 282
Depreciation and
amortisation (‘D&A’) 78 83
Other opex 321 362
Total costs 686 727
Cost-to-income ratio
(“CIR”) 70% 75%
FTE 7,278 7,244
£
686
(5)
5
41 727 762
2014 Staff costs D&A Other opex 2015 Illustrative2H15 annualised
£
£
Fundamentals Momentum Financial Performance Outlook

Q1 trading update
• Trading in line with Board's expectations
• Momentum in loan book maintained - 6.6% annualised growth1 in mortgages. Good growth in owner
occupied
• Core SME lending balances stable
• Asset quality remains strong with continuing low impairment charges in the quarter
• 28,930 personal and business current accounts opened2
• Funding position remains strong
• Net interest margin (NIM) stable and in line with guidance at 2.20% annualised
• Management continues to focus on tight operating cost control, alongside delivery of the planned
programme of investment in the franchise
Fundamentals Momentum Financial Performance Outlook

80
Clear set of targets underpins our objectives
Target (within 5 years) Current (FY2015)
Asset growth
• Mortgage book CAGR 10% (1)
• Total retail book CAGR 9% (1)
• Core business book stable
• 40 – 50% growth in mortgage book
• 40 – 50% growth in retail lending book
• 15 – 25% growth in SME lending book
Funding and capital
• £13 Bn current accounts
• LDR 109%
• CET1 13.2%
• LDR up to 115%
• CET1 range 12 – 13 %
Margins • 2.20% NIM
• Broadly stable in the near term with potential for modest
widening, commensurate with expected movements in rates
and competitive environment
Costs • 75% Cost-to-income ratio (“CIR”) • Positive jaws (after FY2016)
• CIR below 60%
RoTE • Targeting double digit RoTE within the five year period post admission, following a period of planned increased investment in 2015
and 2016
Dividend
(subject to regulatory approvals)
• Target modest inaugural dividend in respect of 2017
• In time, intended pay-out up to c.50% of earnings (after paying AT1 distributions)
Subject to assumptions as to interest rates, the broader macro-economic and competitive environment and having regards to the context of the current regulatory
environment
1. 2012 vs. 2015
Fundamentals Momentum Financial Performance Outlook

David Duffy Chief Executive Officer

Investment highlights summary
82
1
2
Strong fundamentals underpin the CYBG value proposition
3
4
5
Upside from execution
1
2
3
4


Organisational Structure
CEO
David Duffy
Customer
Banking
Director
Human
Resources
Director
CRO CFO Product
Director
Propositions
& Marketing
Director
Gavin
Opperman
Kate
Guthrie
Derek
Treanor
(Acting)
Ian Smith Helen Page
COO
Debbie
Crosbie
Communications
Director
Lynn McManus
Fergus
Murphy

Source: 1.22.1.1
£21.7Bn +10% vs. FY14
• 0.2 MM customers
• £194 k avg. mortgage(6)
• 3.63% variable rate average yield(5)
• 1.6% national market share
• 59% outside core region(3)
• 3.61% fixed rate average yield(5)
• 1.4 MM customers
• 3.8% regional market share
• 83% in core region
Credit card • £0.4 Bn (2%)
• 0.3 MM customers
• £1.3 k average balance(4)
• 0.8% national market share
• 83% in core region
• 14.1% average yield
Personal loans • £0.8 Bn (4%)
• 0.1 MM customers
• £6.8 k average balance(4)
• 5.6% regional market share
• 81% in core region
• 9.2% average yield
Retail: Comprehensive regional and national product proposition
Personal lending
Retail and private banking customers (2015)(1)
1. Overdraft not shown above; 2. Primary (i.e. main bank) customer must be party to at least one current account of a selected product type which meets the following criteria: i) credit turnover averaging at least £1000 in the last 3
consecutive months, ii) three or more Standing Orders or Direct Debits (or a combination of the three) in place, iii) three or more customer initiated Transactions (ATM, Point of Sale, Branch Counter services); 3. Based on mortgage
balances geographic split; 4. Defined as average balance per customer; 5. In addition to 1.42% tracker rate average yield; 6. Average of mortgage size based on intermediary, private banking and branch/ direct 86
Personal deposits
Retail and private banking customers (2015)
PCAs • £6.9 Bn (39%)
• 1.8 MM customers
• £3.6 k average balance(4)
• 42% primary(2)
• 9.1% regional market share
• 86% in core region
• 0.1% cost of funds
Term (fixed rate) • £4.5 Bn (26%)
• £24.4 k average balance(4)
• 2.4% cost of funds
Savings (variable rate) • £6.0 Bn (34%)
• £4.7 k average balance(4)
• 0.8% cost of funds
Residential mortgages • £14.1 Bn (69%)
Buy-to-let mortgages • £6.4 Bn (31%)
£17.5Bn +14% vs. FY14

Retail: Distribution capability delivering a full product set
1.Online form & post; 2. Includes aggregators; 3. Includes term deposits, cash ISA and instant access accounts; 4. Supported by outsourcing agreement. Two further CYBG call centres in England to handle customer requirements; 5.
Includes private banking credit cards sold via face-to-face / branches
Branch Network
275 branches 28 co-located with
Business & Private 2,042 FTE
Telephony
2 main centres (UK)(4)
530 operator FTE In-house &
Outsourced
Digital (2)
Online banking Mobile app Text Alerts Social Media
Intermediary London-based
provides national
reach
Total accounts opened / total gross new lending (2015)
Enhanced
origination
platform
launch in
2H2015
CUSTOMER CHANNEL
PRODUCT PROPOSITION
Mortgages Loans PCAs Savings(3) Credit
Cards(5)
97k 81k 34k
n.a. n.a. n.a.
82% 81% 37%
7% 15% 10%
11% (1) 4% (1) 53%
% of total accounts opened (2015)
Omni-channel service model linked to branch and digital, enabling a comprehensive offering aligned to our customers’ needs
Source: Direct Telephony FTE relates to FTE engaged directly in speaking to customers across CYBG and outsource provider
Updated branch
FTE
Telephone centres
footnote
£4.9 Bn £0.3 Bn
n.a. 74%
39% 14%
19% 10%
41% 3% (1)
% of total gross new
lending (2015)

SME: Full product set to meet customer needs across segments
88 1. Treasury solutions defined as currency, interest rate and commodity risk management products. Prior to 1 March 2015, B&PB allocation of treasury income was 30%; however, from 1 March 2015 100% is now allocated to B&PB;
2. International Trade defined as banking services to import / export companies; 3. Payments defined as merchant services and business online; 4. Includes personal deposits and fee income
Segment
PRODUCT PROPOSITION % Customer segment internal revenue by product (2015)
Business
Direct
Small
Business
Commercial
Specialist & Acquisition Finance
(‘SAF’)
Treasury(1) &
trade(2)
Deposits / cash
management(4) Payments(3)
1%
% of total revenue
per product
Overdraft & term
lending
50%
Invoice finance
—
2%
7%
6% 6% 4% 30%
% of total
revenue per
segment
10%
6%
53%
31%
100%
Full service platform and capability, catering for a broad range of SME banking requirements
Typo
Numbers
updated
Asset finance
4%

Branch and Direct Model Face to face Relationship Management
SME: Relationship management expertise aligned to customer
needs
1. Customer/ RM ratio analysed by level of customer exposure; 2. Includes SAF and NBS; 3. Indicative ratio based on lending customers; 4. Based on commercial customers only; SAF customers / RM ratio of c. 20
# Customers
Micro Business Direct Small business Commercial(2)
c.97k
• Local support through retail
branches
• Service capability within
Business Direct
c.51k
• Telephone based RM
proposition
• Retail branch support
c.7k
• Face to face relationship management in local B&PB centres
• Access to product and sector specialists depending on
customer needs and complexity
c.22k
Service Model
Customer / RM
ratio(3) n.a
500 (>£50k) (1)
650 (<£50k) 125 70(4)
n.a 79 37 RMs 209
Differentiated small business service proposition, through
dedicated relationship managers with average 11 years of
experience and access to a comprehensive product suite
Efficient service model
through the retail branch
network
Supported by an extensive
specialist product & sector
capability
89

90
New origination
growth
• Targeting significant increase of origination
volumes in the medium term by growing in line
with market and leveraging sector capabilities
• Including launch of centralised and specialised
CRE capability
Enhanced customer
knowledge
• Free up RM time to deepen relationships and
sector knowledge
Penetration of
under-served
markets
• Identification of niche, under-served opportunities
• Provision of development funding, leveraging the
deep sector knowledge (e.g. hotels, healthcare)
• Consistent with our risk appetite
Refreshed
conservative CRE
offering
• Experienced CRE specialists with deep sector
knowledge
• Centralised specialist approach
• Targeted lending to good quality higher margin
CRE developments and investments
Development of
SAF offering
• Growth aligned to defined asset quality and sustainable
returns
• Cash flow lending to medium sized businesses
• Focused acquisition finance origination
SME: Target medium term loan growth in new sectors and new to bank
customers
“New to Bank” gross SME lending(2) of £638m (YoY
+32%)
Lending origination consistent with risk appetite
Appointment of additional key sector specialists including:
hotels and housing associations
Positive and improving NPS (net promoter score): +12(1)
Invested in enhanced RM training, successfully
implemented
Launch of Emerging Technology Unit
Delivering on specialist propositions with origination of
£200 MM YoY (2,3)
Recruitment of a Head of CRE and CRE Team
Controlled re-entry to the CRE market in September 2015
1.NPS for B&PB moved from (21) to +12 in 2015; 2. Facilities accepted and available to customer; 3. £185m since formal launch on 1 February 2015

91
Segment of Portfolio
% Total Business
Portfolio
(Sep2015)
Average eCRS
(Sep2015)
% of Impaired
(Sep 2015)
% of Watch
(Sep 2015) Business
Impairment Charge
(£MM)
(Sep2015) % of respective
sector portfolio
% Total Impaired
Portfolio
% of respective
sector portfolio
% Total Watch
Portfolio
Agriculture 24% 11.66 1% 7% 13% 29% 4
Retail & Wholesale Trade 12% 14.33 2% 8% 9% 10% 4
Government, Health &
Education 11% 14.16 3% 10% 14% 14% 1
Business Services 11% 13.48 2% 8% 6% 6% 5
Manufacturing 10% 14.29 1% 2% 13% 12% 0
Hospitality 9% 16.40 12% 38% 21% 17% 16
Commercial Real Estate 7% 12.52 5% 13% 9% 6% 3
Transport & Storage 4% 14.64 2% 3% 6% 2% 0
Resources 1% 14.71 1% 1% 1% 0% -1
Other (1) 11% 12.72 2% 10% 4% 4% 5
Total 100% 13.45 3% 100% 11% 100% 37
Risk: Sector exposures are being managed
1. Other includes entertainment and personal services, utilities, post and telecommunications, construction and finance sectors; 2. Charge relates to a trading business which retained a property element within a broader exposure;
3. A rating system used to assess a customer's probability of default within the following 12 month period using a scale of 1 to 23 (and two default rates); 4. Loans being monitored
(3)
• Following transfer of the CRE portfolio in 2012 and deleveraging of business lending, agriculture, whilst broadly static in value terms, is the single largest sector
• Total impaired and watch portfolios have reduced overall, resulting in certain sectors having an increased proportionate share
• Whilst decreasing, the Hospitality sector remains the largest component of the impaired portfolio. The impairment charge reflects difficulties experienced by a number
of customers in this sector post the Global Financial Crisis

92
Arable 27%
Beef or Sheep 26%
Dairy 21%
Other 13%
Agriculture Services
13%
• CYBG has a long history of lending to the agriculture sector
• Agriculture portfolio is well secured and diversified (sub-sector and
individual customer)
• While recent challenges in key Agricultural sub-sectors have increased
categorisations, the level of defaults and losses remains low
• Selective growth within the portfolio, which is subject to a value cap, with
concentration expected to reduce as other SME lending grows
(1)
2
1 1
4
2012 2013 2014 2015
Risk: Agriculture sector exposure
Agriculture sub-sector split, % (2015)
Agriculture represents the largest current exposure
Well balanced, diversified portfolio
Agriculture impairment charges(2), £ MM (2015)
Minimal losses experienced
1. Others include: Poultry (6%), Pig Farming (2%), Forestry & Fishing (3%) Horticulture & Fruit Growing (1%) and other Agriculture (2%); 2. Specific impairment charges, excludes collective
Bubbles
Broadly constant level of performing
% of agricultural stock loans
94 89 88 85
5 9 10 13 1 1 2 2
2012(excl. CRE)
2013 2014 2015
Performing Watch Defaulted

Risk: Lending growth remains diversified
93
New lending is focussed on SME trading businesses
Agriculture remains a material component of new lending;
primarily supporting existing customers
Selective new lending to sectors previously “closed” such
as hospitality and CRE
Gross new facilities accepted and available to customers, (2015)
Lending growth diversified New lending per sector
Note: New lending is defined as both New to Bank lending and increased lending to existing customers
1. Other includes transport & storage, utilities, post & telecommunications, construction and resources and entertainment and personal services; 2. Includes housing association
Business Services
£310 MM, 16%
Agriculture
£304 MM, 16%
Retail and
Wholesale
£296 MM, 15% Manufacturing
£248 MM, 13%
Health
£232 MM, 12%
Finance
£83 MM, 4%
Transport & Storage
£82 MM, 4%
Utilities, Post, Telephony
£77 MM, 4%
Other(2)
£303 MM, 16%
230 234 241 175
79 42 71 36 19 22
150
80 71 55
73
153
41 11 41 53 37
22
310 304 296
248 232
83 82 77 72 59
172
BusinessServices
Agriculture Retail andWholesale
Manufacturing Health Finance Transport andStorage
Utilities, Post &Teleco
CRE Hospitality Other
Business Services
£310 MM, 16%
Agriculture
£304 MM, 16%
Retail & Wholesale
£296 MM, 15%
Manufacturing
£248 MM, 13% Government, Health
& Education
£232 MM, 12%
Finance
£83 MM, 4%
Other(1)
£330 MM, 17%
CRE(2)
£ 72 MM, 4%
Hospitality
£ 58 MM, 3%
Strong contribution to new business origination from existing customer base

Financials: Focus on reshaping the balance sheet
1. Includes £200 MM non-controlling interest in 2012 and 2013, which was repaid in 2014; represents capital contribution in the form of hybrid capital notes from NAB subsidiary and £450 MM AT1 issued by CYBG to NAB; 2. Full look through; 3. The
customer loans exclude accrued interest and are gross of unearned income, deferred fee income and provisions. The balances also include financial assets at fair value and acceptances ; 4. Retail and private banking loans; 5. 2012 to 2014 note cover
balances exclude the cover held with G4S and the Post Office, which forms part of cash balances. Balances for cover held with G4S and Post Office are: 2012 £42m; 2013 £45m; 2014 £34 MM; 6. Includes assets held for sale (i.e. disposed UK CRE portfolio)
of £5,225 MM; 7. Includes £5,084 MM of NAB funding relates to the disposed UK CRE portfolio; 8. Total customer loans in AP (£28,783 MM) = £27,687 MM (gross loans and advances per note 15 in CYBI Ltd Annual Financial Report (“AFR”)) plus £1,097 MM
(loans and advances within other financial assets at fair value per note 13 in CYBI Ltd AFR) plus £4 MM (due from customers on acceptances) minus £5 MM (accrued interest receivable on other financial assets at fair value) 94
Key trends
Summary
Strong continued growth in mortgage book
Reduction in customer funding gap driven by deposit growth
Reduced utilisation of NAB funding
Strong capital position
Strong balance sheet fundamentals with continued
improvement in capital, liquidity, funding and leverage metrics
Strategic actions delivering shift in asset mix in line with plan
Continued strength in liability franchise
Balance sheet
Year Ended 30 September
£MM
2012 2013 2014 2015 2014 vs. 2015
Consumer lending (4) 16,679 17,422 19,726 21,722 10.1%
Business lending 10,896 9,002 7,970 7,061 (11.4%)
Total Customer Loans (3) 27,575 26,424 27,696 28,783 3.9%
Liquid Assets and other 8,968 7,695 7,154 7,893 10.3%
of which note cover(5) 1,779 2,073 2,054 2,033 (1.0%)
Other Assets 7,839 2,629 2,542 2,029 (20.2%)
Total Assets 44,382 36,748 37,392 38,705 3.5%
Customer Deposits 26,528 24,266 23,989 26,349 9.8%
Wholesale Funding(8) 3,187 3,085 3,453 3,766 9.1%
NAB Funding 7,716 3,036 2,677 998 (62.7%)
Notes in Circulation 1,567 1,709 1,831 1,791 (2.2%)
Other Liabilities 2,765 2,203 2,904 2,358 (18.8%)
Total Liabilities 41,763 34,299 34,854 35,262 1.2%
Equity and Reserves (1) 2,619 2,449 2,538 3,443 35.7%
Liabilities and Equity 44,382 36,748 37,392 38,705 3.5%
Ratios
LDR (%) 104% 109% 115% 109% (6ppts)
Customer Funding gap 1,047 2,158 3,707 2,434 (34.3%)
CET1 FLT (2) 7.7% 9.6% 9.4% 13.2% 3.8ppts
Leverage Ratio 4.6% 5.1% 5.2% 7.1% 1.9ppts

Financials: Bridge to reported earnings
95
• Pension scheme reform – one-off contribution by NAB in FY12 upon its exit
as a participating employer. In FY15, plan arrangements were amended,
resulting in a credit within personnel expenses
• Payment protection insurance (PPI) redress expense – recognition of,
and revisions to, redress cost estimates
• Other conduct charges – relate to a number of industry and CYBG specific
issues
• Impairment of intangible assets – relate to software
• Impairment losses on goodwill – FY12 charge of £141 MM relating to
NAGE investment in CYBG, reflecting the restructuring of the business in
2012
• Disposed legacy CRE portfolio result – The legacy CRE portfolio was
reclassified as held for sale at FY12 and was transferred to NAB at book
value
• Restructuring – Charges in FY12 and FY15 comprised provisions for
redundancies, lease break and associated property vacancy and other costs
• Gain on capital restructuring – relating to replacement/ redemption of non-
CRD IV compliant instruments held by NAB
• IRHP redress – There are no equivalent amounts in prior years as the
provisions raised were offset by receivables from NAB.
1. Relating to a reduction in the value of National Australia Bank Europe Limited investment in Clydesdale Bank plc, reflecting the results (including impairments) on the legacy CRE book and other restructuring costs
Earnings reconciliation Key trends
£MM FY12 FY13 FY14 FY15
Pension scheme reform 130 – – –
PPI redress expense (120) (130) (420) (390)
PPI complaint handling fine – – – (21)
IRHP redress expense – – – (75)
Other conduct (23) (50) (13) –
Impairment of other intangible assets (36) – (23) (10)
Impairment losses on goodwill (141) – – –
Disposed legacy CRE portfolio result (502) – – –
Restructuring (149) – – (17)
Gain on capital & debt restructuring – – – 61
Pension increase exchange gain – – – 18
Separation costs – – – (10)
(Loss)/profit on ordinary activities before
tax(803) (49) (234) (285)
Tax credit/(charge) 156 5 44 60
(Loss)/profit for the period (647) (44) (190) (225)
Year Ended 30 September

(12) (9) (8) (6)
30 22 15 16
30 22 15 16
(8) (5) (3) (3)
22 17 12 13
Financials: Insurance Intermediary business(1)
96
Income Statement Overview
• On 30 September 2015, this business was acquired by
CYBG from NAB as part of the transaction, subject to
regulatory approval
• NAB-owned insurance intermediary for a number of third
party providers of insurance and investment products,
specialising in corporate lines, home insurance, motor insurance
and personal lines, included within the CYBG transaction
perimeter
• Income generated mainly through commissions earned on
the distribution of general insurance products to CYBG
customers
• Includes the right to collect trail commission from various
investment products written before 2009 and earns
commission on other insurance products.
• As at 30 September 2015, the business had total assets of
£8 million and total liabilities of £4 million

97
Financials: Reweighting of loan book reducing RWA intensity
• Reduction in credit RWAs as mix shifts from higher
capital intensity business lending to secured
mortgages
• Pillar I non-credit RWAs reduced due to business
simplification
• Continued focus as part of portfolio optimisation
strategy
...on the back of management actions
1. Credit risk on derivatives from CRD IV implementation; 2. 2015 vs. 2012 balances; 3. Including CRE portfolio
2012(3) 2013 2014 2015 Growth
Retail mortgages 6,139 6,319 6,917 7,526 23%
Business lending 15,805 9,694 7,961 7,044 (55%)
Other retail lending 1,104 1,071 1,030 951 (14%)
Other lending 1,137 878 855 773 (32%)
Total credit risk 24,185 17,962 16,763 16,294 (33%)
Credit valuation adjustment - - 137 206 —
Operational risk 1,905 1,684 1,564 1,589 (17%)
Counterparty risk 370 170 181 138 (63%)
Market risk 1 1 - - —
Total RWAs 26,461 19,817 18,645 18,227 (31%)
Total Loans 33,227 26,424 27,696 28,783 (13%)
Credit RWAs / total loans 73% 68% 61% 57% (16ppts)
Total RWA / Assets 60% 54% 50% 47% (13ppts)
Shrinking risk-weighted assets...
£ MM
(1)
(2)

98
Credit Rating Summary (February 2016) — Clydesdale Bank PLC
Credit Rating Summary (February 2016) — CYBG PLC
Rating agency considerations
Agency Long-Term Outlook Short-term
S&P BBB- Stable A-3
Fitch BBB+ Stable F2
Agency Long-Term Outlook Short-term
S&P BBB+ Stable A-2
Fitch BBB+ Stable F2
Moody’s Baa2 Stable P-2
• CYBG is rated Investment Grade on a stand-alone basis by S&P and Fitch
• CB PLC remains investment grade after demerger on Stable outlook with all 3 rating agencies

Wholesale funding split
Bonds and notes Breakdown of amounts due to related entities
3,017 2,421 2,039 2,094
697 1,097 1,096 1,096
3,714 3,518 3,135 3,190
38 (85) (64) (27)
3,752 3,433 3,071 3,163
14 20 14 24
3,766 3,453 3,085 3,187
478 1,131 1,125 1,125
125 1,097 1,434 6,077
382 410 442 475
13 39 35 39
998 2,677 3,036 7,716

Capital structure: overview of sub-debt
CYBG PLC
CYB Investments Ltd (Previously NAGE)
Clydesdale Bank PLC
NAB

101
• DB scheme with 3,083 active members (Sept’15)
• Subject to Cash Funding valuation every 3 years
• Last formal cash funding valuation at 30 Sept’13
– Identified actuarial funding deficit of £450 MM
– Next valuation effective 30 Sept’16
• Schedule of contributions agreed
– Cumulative contributions of £215 MM in FY13/14
– £50 MM per annum due Oct 2017 through Oct 2021
– Final payment of £55 MM due Oct 2022
– Remove deficit on a Cash funding basis by 2022
• Sensitivities:
• Benefit reforms:
– Close to new entrants (2004)
– Basis moved to “career average salary” (2006)
– Introduced employee contributions (2012)
– Launched Pension Increase Exchange (“PIE”, 2014)
• Changed asset allocation:
– Increase in ‘matching’ assets / fixed income (equates 37% (2012)
24% (2015))
– Interest rate and inflation Hedging – current hedge ratio of 50%
• Further strategies considered on ongoing basis
(301) (197)
49 52
(699)
(450) (244)
(396)
2012 2013 2014 2015Accounting basis Cash funding basis
DB scheme closed to new entrants
Significant actions to reduce risk & capital charge
Surplus / (deficit), £ MM
Deficit being actively managed
[To discuss status of pension trustee discussion]
DB pension scheme: Overview
Pension scheme de-risked: P&L and capital volatility reduced
M et ricImpact on def ined benef it
ob ligat ion £ mImpact on pension cost £ m
D iscount R at e
+0.25% (178) (8)
-0.25% 192 10
Inf lat ion
+0.25% 162 8
-0.25% (152) (6)
Lif e Expent ancy
+1 year 113 6
-1 year (113) (4)


Summary – As of 30 September 2015
Financial snapshot
(£ MMs) Total provisions
raised
Total provisions
utilised
Unutilised
provisions
remaining
PPI
Redress: Walk ins / PBR 578 277 301
Remediation 270 0 270
Costs to do1: 348 145 203
Total PPI 1,196 422 774
IRHPs/FRTBLs 506 314 192
Other2 48 28 20
Total (excl. indemnity) 1,750 764 986
Conduct Indemnity – Unutilised 1,115
Total (incl. indemnity)3 2,101
103
• £465 MM additional conduct costs recognised in
FY15 – £390 MM PPI and £75 MM IRHP / FRTBL.
PPI increase largely relates to inclusion of PBR
and refresh of costs to do
• £986 MM unutilised provisions represent 56% of
total provisions raised
o This includes £270 MM unutilised PPI
Remediation provisions relating to
previously closed complaints that are being
reassessed
• £1,115 MM of additional unutilised conduct
indemnity protecting against severe stress
scenario
o Covers PPI, IRHP, FRTBL and other conduct
matters subject to minimum thresholds
• Total cover for legacy conduct of £2,101 MM3
1. Total expected administrative costs for remediating customer complaints
2. Excluding provisions previously raised and resolved
3. This excludes CYBG £120 MM risk share. The indemnity provided by NAB is drawn pro rata with CYBG risk share

• 226 K “Walk-in” complaints received to 30 September 2015,
around 180 K of the complaints are being reassessed for
potential remediation
• Provision covers estimated cost of PBR and additional walk in
complaints assuming declining rate over time
• Provision covers circa 175 K further claims7, including PBR
customer mailing
• As an illustration, other things being equal, the indemnity
would allow a redress exercise, in addition to completed
redress and existing provisions, of the same scale to that
which has already been undertaken and provisioned for
• Impact of Plevin and time barring consultation by the FCA is
unclear at this stage
104
Valid PPI “Walk-in” complaints declining since 2012 PPI complaints trend
Redress provisions for walk-ins/ PBR
(as of 30 Sept 2015) £ MMs
Provisions raised to date 578
Provisions utilised to date5 (277)
Unutilised provisions remaining6 301
1. Claims Management Companies
2. Chart excludes pre-2010 complaints
3. The status of valid “Walk-in” complaint is based on the initial assessment when the complaint is received, this could change up to when the complaint is closed
4. Data for CYBG is financial years ended 30 September. Industry data is for years ended 31 December. For FY 15 industry data a pro rata figure is provided based on 2H 2014
5. Total costs of remediation for pre-August 2014 complaints will ultimately include costs arising from the Remediation exercise
6. Excluding “costs to do”
7. Includes coverage for ‘No PPI’ Walk-in complaints
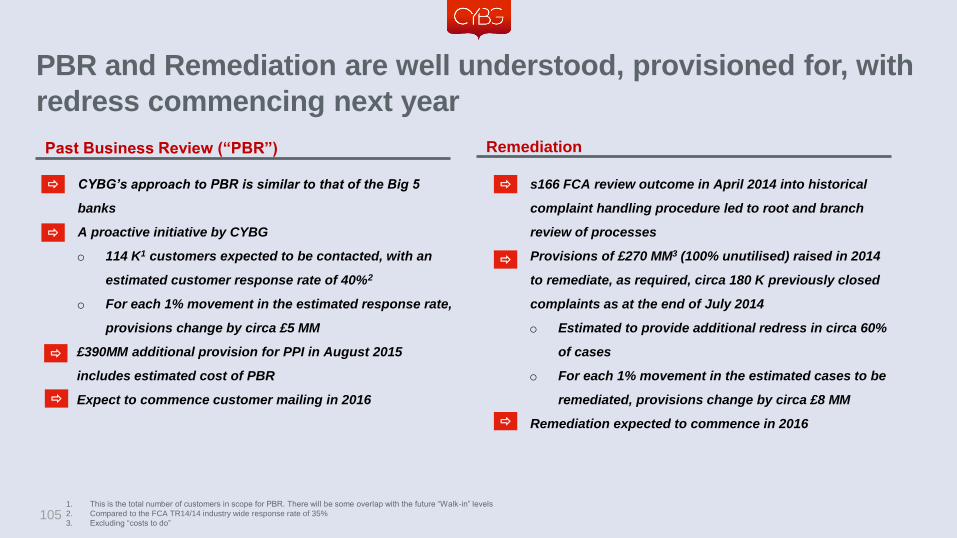
105
PBR and Remediation are well understood, provisioned for, with
redress commencing next year
Past Business Review (“PBR”) Remediation
• CYBG’s approach to PBR is similar to that of the Big 5
banks
• A proactive initiative by CYBG
o 114 K1 customers expected to be contacted, with an
estimated customer response rate of 40%2
o For each 1% movement in the estimated response rate,
provisions change by circa £5 MM
£390MM additional provision for PPI in August 2015
includes estimated cost of PBR
Expect to commence customer mailing in 2016
• s166 FCA review outcome in April 2014 into historical
complaint handling procedure led to root and branch
review of processes
• Provisions of £270 MM3 (100% unutilised) raised in 2014
to remediate, as required, circa 180 K previously closed
complaints as at the end of July 2014
o Estimated to provide additional redress in circa 60%
of cases
o For each 1% movement in the estimated cases to be
remediated, provisions change by circa £8 MM
• Remediation expected to commence in 2016
1. This is the total number of customers in scope for PBR. There will be some overlap with the future “Walk-in” levels
2. Compared to the FCA TR14/14 industry wide response rate of 35%
3. Excluding “costs to do”

106
IRHP / FRTBL exposure assessed and settlement is well
progressed
• Scheme is fully provided and now closed – outstanding offers of
redress are expected to settle by Q1 2016
• Remediation relating to IRHPs was driven by both a regulator
review process and Bank proactivity
• Redress activity has been underway since 2012 when CYBG
agreed with the FSA, alongside 8 other banks, to undertake a
review of IRHPs dating back to 2001
• Risk of reopening the issue is low
Interest Rate Hedging Products (IRHPs) Fixed-rate Tailored Business Loans (FRTBLs)
• CYBG has been undertaking a complaints-led review of
FRTBLs since 2012 – encompasses new ‘Walk-in’ and previously
closed complaints
• The number of new complaints received has been trending
down quarter on quarter since Q1 2015
• Complaints expected to tail off. On that profile, we estimate
the current unutilised provisions to cover circa 18 months of
redress
• Responded to March 2015 Treasury Select Committee report
Total provisions incl. “costs to do”
(as of 30 Sept 2015) £ MMs
Total provisions raised to date 268
Total provisions utilised to date (213)
Unutilised provisions remaining 55
Total provisions incl. “costs to do”
(as of 30 Sept 2015) £ MMs
Total provisions raised to date 238
Total provisions utilised to date (101)
Unutilised provisions remaining 137

Other conduct issues
Other conduct issues are currently immaterial with downside
covered by conduct indemnity
• Back Book:
o All products have been reviewed to assess risks and where required more detailed
review has been undertaken
o No significant new issues identified to date requiring proactive redress
• Packaged Accounts: Not a material issue at this stage
• Consumer Credit Act: Not a material issue at this stage
107 1. With respect to the indemnity, conduct matters other than PPI, IRHP and FRTBL are subject to minimum thresholds of £2.5 MM for industry-wide schemes and £5 MM and 50 customers for CYBG-specific issues
Key messages
• Conduct risks relating to both
Packaged Accounts and Consumer
Credit Act are not material at this stage
and are currently below the minimum
threshold for cover under the conduct
indemnity1

108
Conduct indemnity mechanics
• CYBG PLC will acquire the CYB
Investments group1 and will be the entity
that is listed to achieve the demerger of
the CYBG group from NAB
• NAB will indemnify CYBG PLC for certain
conduct costs (including customer
redress and costs to do) relating to
conduct issues arising prior to
separation. Indemnity is intended to be
sufficient to deal with all pre-separation
conduct issues
• All redress to customers will be managed
by and paid direct by CYBG PLC.
Responsibility for redress programme
retained by CYBG
CYBG PLC NAB Indemnity
Payments
Customers Redress
Payments
Conduct Review Committee
Overview of NAB indemnity mechanics
• CYBG will claim under the indemnity as new provisions are required – indemnity claim from NAB is
P&L-neutral for CYBG
• CYBG risk share is £120 MM and will be drawn pro rata with the indemnity2 – P&L expense but
already included in CYBG capital
• NAB risk share is 100% collateralised at Bank of England
• A joint CYBG and NAB Conduct Review Committee has been established – an indemnity
governance and oversight committee that meets on quarterly basis
Annual review of limit adequacy by PRA – the indemnity limit cannot be increased
1. Formerly called National Australia Group Europe Ltd
2. Based on £1.115 BN of indemnity, CYBG’s risk share is a fixed 9.7% of each relevant conduct cost. If there is no further spec ific support provided by NAB prior to implementation of the Demerger, the risk share will stay at 9.7%
(see page 114 ‘Key indemnity terms and conditions’ for more information)

109
Key terms in relation to indemnity termination
• Conduct indemnity is perpetual unless otherwise agreed by the PRA
• At or after the fifth anniversary, NAB and CYBG PLC can agree to seek PRA consent to terminate the conduct indemnity,
with CYBG PLC consent not to be unreasonably withheld where the proposal is to convert the outstanding undrawn
indemnity into ordinary shares in CYBG PLC, provided:
o No more than £200 MM of shares (market value) to be issued; and
o The share issue is capped such that not more than 9.9% of CYBG PLC’s share capital (pre-conversion) is issued
• If the amount of NAB’s remaining liability under the conduct indemnity cover has fallen below £100 MM, at any time, NAB
has the right to seek PRA consent to terminate by the conversion of the outstanding undrawn indemnity into ordinary
shares in CYBG PLC provided:
o The share issue is capped such that not more than 9.9% of CYBG PLC’s share capital (pre-conversion) is issued
• 3 year run off period for an existing provision at time of equity termination; any remaining unutilised cash will be
returned to NAB

110
Key indemnity terms and conditions
Key terms Description
Structure and Amount Up to £1.7 BN support - risk share of £120 MM for CYBG, £1.115 BN indemnity from NAB plus capital support of £465 MM provided by
NAB in September 2015. Pre-separation capital support is not subject to the risk sharing arrangements
CYBG responsible for a portion of conduct liabilities that equate to the portion that £120 MM bears to the sum of £1.115 BN plus £120
MM. Liability therefore to be shared 90.3% / 9.7% between NAB and CYBG, assuming no further support provided by NAB for conduct
matters pre-separation
Term Perpetual until fully utilised or PRA agrees no longer required or termination arrangements implemented
Scope Covers all conduct costs arising from pre-separation activities subject to certain limitations: inclusion of conduct matters other than PPI,
IRHP and FRTBL subject to minimum thresholds of (i) £2.5 MM for industry-wide schemes, and (ii) £5 MM and 50 customers for CYBG-
specific issues
Claims and Payments Claims can be made under the indemnity when new provisions for relevant pre-separation conduct matters are raised or existing
provisions for pre-separation conduct matters are increased
CYBG may utilise amount paid by NAB pursuant to the indemnity on a quarterly basis if and when it pays a conduct cost. Amounts in
respect of excess provisions to be applied against other relevant conduct matters or returned to NAB
Annual Review Annual review of indemnity limit adequacy by PRA. The indemnity limit cannot be increased
Customer Redress Conduct claims are managed by CYBG
Cash Security NAB risk share is 100% cash collateralised at Bank of England
Governance Joint CYBG and NAB conduct review committee established plus information rights for NAB and agreed dispute resolution process to
provide governance in respect of the conduct indemnity

Key takeaways
111
• Total cover of £2.1 BN1 across provisions and conduct indemnity
• Visibility on PPI outlook improving with upheld complaints on a falling trend
• Significant progress made on other conduct issues
• Substantial investment undertaken to reduce conduct risk in the front book
1. The indemnity provided by NAB is drawn pro rata with CYBG £120 MM risk share (CYBG risk share amount is included in CYBG’s capital base)

Historical evolution of conduct provisions Provisions raised
(£ MM) Pre FY12 FY12 FY13 FY14 FY15 Total
PPI 136 120 130 420 390 1,196
IRHPs/FRTBLs1 – 31 36 364 75 506
Other industry and bank specific issues – 18 18 2 12 - 48
Total 136 169 184 796 465 1,750
1. The income statement effect of these provisions was nil in FY12, FY13 and FY14 due to the recognition of an offsetting receivable from NAB. In FY15 capital was contributed by NAB
2. Includes £18 MM relating to a provision where there is an offsetting receivable from NAB 112


• Positive GDP growth outlook
• Reduced unemployment and
increase in consumer
confidence, coupled with real
earnings growth
• Inflation expected to remain
below 2% target from BoE
• More measured base rate
increase expected
114
Strong UK GDP growth outlook Continued unemployment decline
(0.3)
(4.3)
1.9 1.6 0.7
1.7
2.2 2.8 2.4
08 09 10 11 12 13 14 15 16
UK GDP growth rate, %
Source: Oxford Economics
UK unemployment rate, %
Source: Oxford Economics (Feb 2016)
5.7
7.6 7.9 8.1 8.0 7.6
6.2
5.4 5.1
08 09 10 11 12 13 14 15 16
Positive UK macroeconomic outlook
More gradual rise in rates expected
UK base rates, %
2.1
0.5 0.5 0.5 0.5 0.5 0.5
0.5
1.0
08 09 10 11 12 13 14 15 16
Source: Oxford economics (Feb2016)
Sharp rise in consumer confidence
UK Consumer Confidence Index, %
08 09 10 11 12 13 14 15 16Source: GFK

858 886 885 932 1,074 1,219 1,208
2009 2010 2011 2012 2013 2014 2015
Transaction Volumes
115
• Sustained momentum in the
housing market – transaction
volumes still below previous
levels
• Credit environment remains
strong
• Strong growth in mortgage
lending, particularly BTL
• Growth in personal lending
and credit card originations
reflecting improved sentiment
• Continued growth in deposits,
with shift from term to PCAs
in low rate environment
• PCAs continue to represent
the anchor relationship
banking product
Clear improvement in unsecured
lending
Continued house price increases
and strong transaction volumes
£ Bn
Source: CML, Halifax
UK retail banking continues to show recovery and growth
(0.10)
(0.05)
0.00
0.05
0.10
07 08 09 10 11 12 13 14 15
Personal Loans & Overdrafts Credit Card Lending
Annual Growth Rates, %
Source: BBA
Positive growth in personal
deposits
(10%)
0%
10%
11 12 13 14 15
CDs Interest sight Sight deposit ISA
Annual Growth Rates, %
Source: BoE
525 540 525 522 547 594 660
132 125 125 129 157 176 182
9 9 13 16 21
27 38 141 134 138 145
178 203 220
2009 2010 2011 2012 2013 2014 2015
Residential Buy-to-let
New originations remain strong,
particularly in BTL
New mortgage lending by type, £ Bn
Source: CML, Bank of England
CAGR
12-15
12%
34%
1.December 2015

116
SMEs further strengthening balance sheets
Total deposits from SMEs, £ Bn
Source: BBA
Gross monthly lending flows in 2015 +8% vs. 2014
Investment expected to grow relatively strongly in 2015/16 —
forecasts for subsequent years revised up
Y-o-y growth in lending to SMEs turning positive in April 2015 — first
time since 2009
North East and Yorkshire & the Humber saw a stronger uptick SME
lending in Q2 vs Q1 2015 compared to other regions
Attractive margins in niche segments where larger banks are not
competing
Momentum building with flows increasing
Net lending inflection point reached
SME stock (LHS) and gross flows (RHS)
Source: Bank of England
Quarterly changes in net loans to SMEs, £ Bn
Source: Bank of England
Stock of SME loans Gross monthly flow
1. Economic and fiscal outlook, March 2015; 2. Bank support for SMEs – 1st Quarter 2015
Momentum rebuilding in SME and commercial market
59 59 60 62 64 65 68 71 75 76 84 87 87 90
59 60 62 62 61 62 63 62 61 62 64 65 65 67
Q4 Q12012
Q2 Q3 Q4 Q12013
Q2 Q3 Q4 Q12014
Q2 Q3 Q12015
Q2
Value of Current Account Balances Value of Deposit Account Balances
(2.5)
(1.5)
(0.5)
0.5
Q12012
Q2 Q3 Q4 Q12013
Q2 Q3 Q4 Q12014
Q2 Q3 Q4 Q12015
Q2 Q3 Q4

% 2015 2016 2017 2018 2019 2020
Macroenvironment
Real GDP Growth
2.30% 2.20% 2.30% 2.30% 2.30% 2.30%
Consumer Price Index
0.50% 1.40% 2.00% 2.10% 2.20% 2.20%
Unemployment Rate
5.60% 5.30% 5.20% 5.10% 4.90% 4.90%
Interest Rate
BoE Base Rate (Average)
0.50% 0.73% 1.10% 1.38% 1.50% 1.58%
3 Month Libor (Average)
- 0.97% 1.44% 1.73% 1.77% 1.84%
Forward 2 Year Swap Rate
- 1.34% 1.64% 1.75% 1.81% 1.90%
Forward 5 Year Swap Rate
- 1.57% 1.74% 1.83% 1.89% 1.97%
UK Macroenvironment and Interest rate assumptions
117
New page
Note: All figures relate to financial years. Assumptions underpinning business plan. Compiled from various sources
New