disciplining fisheries subsidies: incorporating sustainability at the wto & beyond fisheries...
Post on 21-Dec-2015
219 views
TRANSCRIPT

DISCIPLINING FISHERIES SUBSIDIES:INCORPORATING SUSTAINABILITY AT THE
WTO & BEYOND
Fisheries Development Strategies: Past, Present, and Way Forward
Lidvard Grønnevet Environment Department
World Bank
Thursday March 1, 2007

•OVERVIEW
•DEVELOPMENT OVER TIME
•PRESENT WORLD BANK ACTIVITIES
•SUCESSFUL FISHERIES MANAGEMENT
•WAY FORWARD

TRENDS IN FISH PRODUCTION (FP) AND HUMAN POPULATION (HP).
Production: million metric tones. Population: billions.
1961 1976 2001 % 1961 to 2001
FP HP FP HP FP HP FP HP 40,5 3,1 72,6 4,1 142,1 6,1 250 97 World 100 100 100 100 100 100 23,6 1,0 40,7 1,1 33,2 1,3 40 30 Developed 58 32 56 27 23 21
17,0 2,1 31,4 3,0 108,9 4,8 540 128 Developing 42 68 44 73 77 79 8,0 1,7 15,9 2,4 76,2 3,9 857 129 LIFDC 20 55 22 59 54 64
Source: Hersoug 2004

Chart 1: Production from Capture Fisheries and Aquaculture, by Economic Class of Country
(Source: FAO FSTAT)
0
20,000,000
40,000,000
60,000,000
80,000,000
100,000,000
120,000,000
140,000,000
160,000,000
Met
ric T
ons
Other
Developing countries or areas
Developed countries or areas
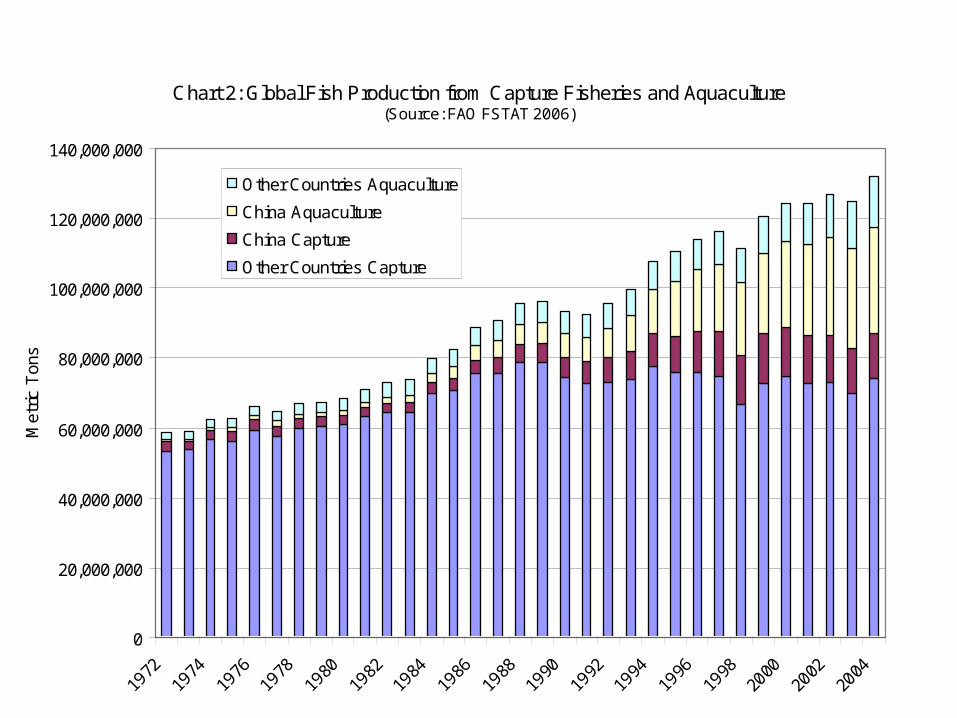
Chart 2: Global Fish Production from Capture Fisheries and Aquaculture(Source: FAO FSTAT 2006)
0
20,000,000
40,000,000
60,000,000
80,000,000
100,000,000
120,000,000
140,000,000
Met
ric T
ons
Other Countries Aquaculture
China Aquaculture
China Capture
Other Countries Capture

Chart 3: Aquaculture Production by Environment and Economic Class of Country(Source: FAO FSTAT 2006)
0
5,000,000
10,000,000
15,000,000
20,000,000
25,000,000
30,000,000
35,000,000
40,000,000
45,000,000
50,000,000
Met
ric T
ons
Developing Country Marine
Developing Country Fresh
Developing Country Brackish
Developed Country Marine
Developed Country Fresh
Developed Country Brackish

Chart 4: Aquaculture Production, Excluding China(Source: FAO FSTAT 2006)
0
2,000,000
4,000,000
6,000,000
8,000,000
10,000,000
12,000,000
14,000,000
16,000,000
Met
ric T
ons
Developing Country Marine
Developing Country Fresh
Developing Country Brackish
Developed Country Marine
Developed Country Fresh
Developed Country Brackish
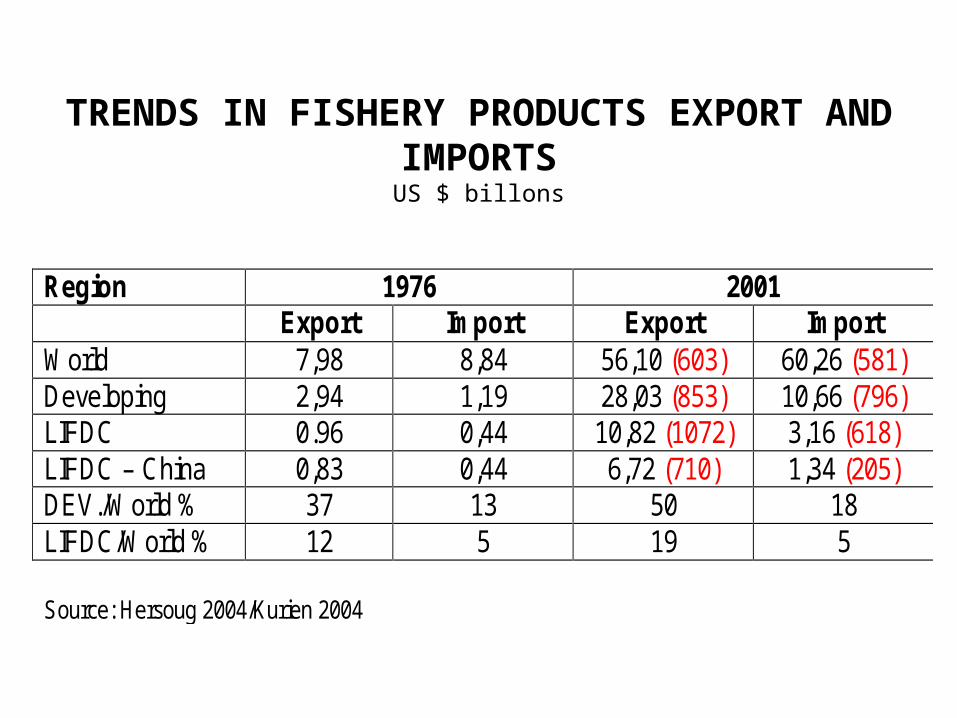
TRENDS IN FISHERY PRODUCTS EXPORT AND IMPORTS
US $ billons
Region 1976 2001 Export Import Export Import World 7,98 8,84 56,10 (603) 60,26 (581) Developing 2,94 1,19 28,03 (853) 10,66 (796) LIFDC 0.96 0,44 10,82 (1072) 3,16 (618) LIFDC – China 0,83 0,44 6,72 (710) 1,34 (205) DEV./World % 37 13 50 18 LIFDC/World % 12 5 19 5 Source: Hersoug 2004/Kurien 2004

Exporters and importers of large pelagic fish (62% of exports)
EEZ fishedImporting country

Exporters and importers of invertebrates (62% of exports)
EEZ fished
Importing country squid
squidcrab, squid
octopus
lobster
shrimp
shrimp, squid

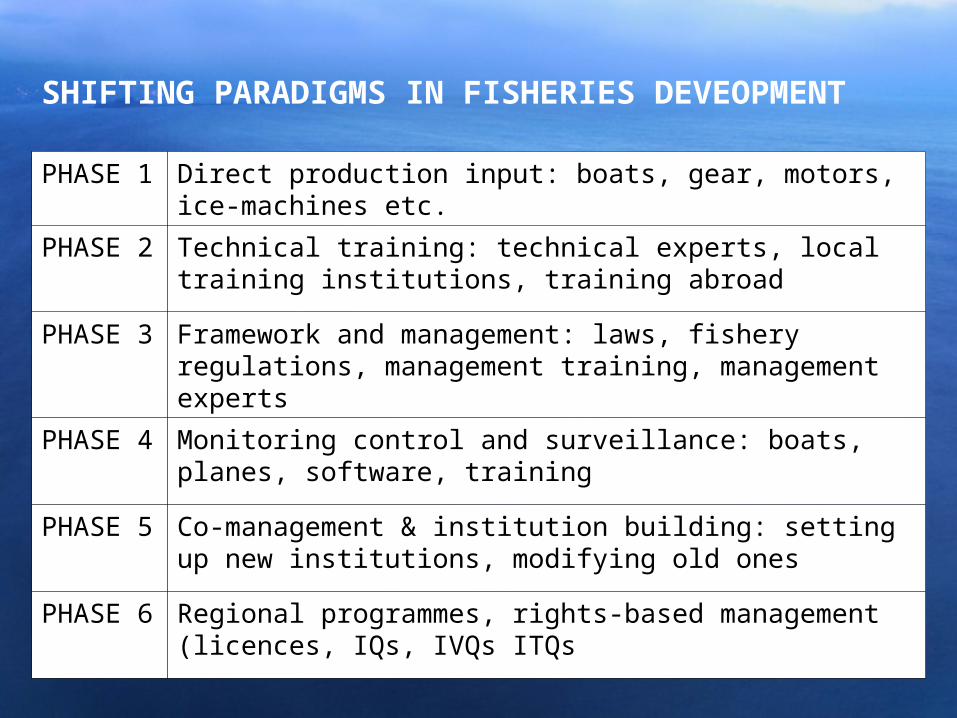
SHIFTING PARADIGMS IN FISHERIES DEVEOPMENT
PHASE 1 Direct production input: boats, gear, motors, ice-machines etc.
PHASE 2 Technical training: technical experts, local training institutions, training abroad
PHASE 3 Framework and management: laws, fishery regulations, management training, management experts
PHASE 4 Monitoring control and surveillance: boats, planes, software, training
PHASE 5 Co-management & institution building: setting up new institutions, modifying old ones
PHASE 6 Regional programmes, rights-based management (licences, IQs, IVQs ITQs

Anchoveta variation
El NiñoEl NiñoEl Niño

Evolution of the focus of fisheries sector assistance
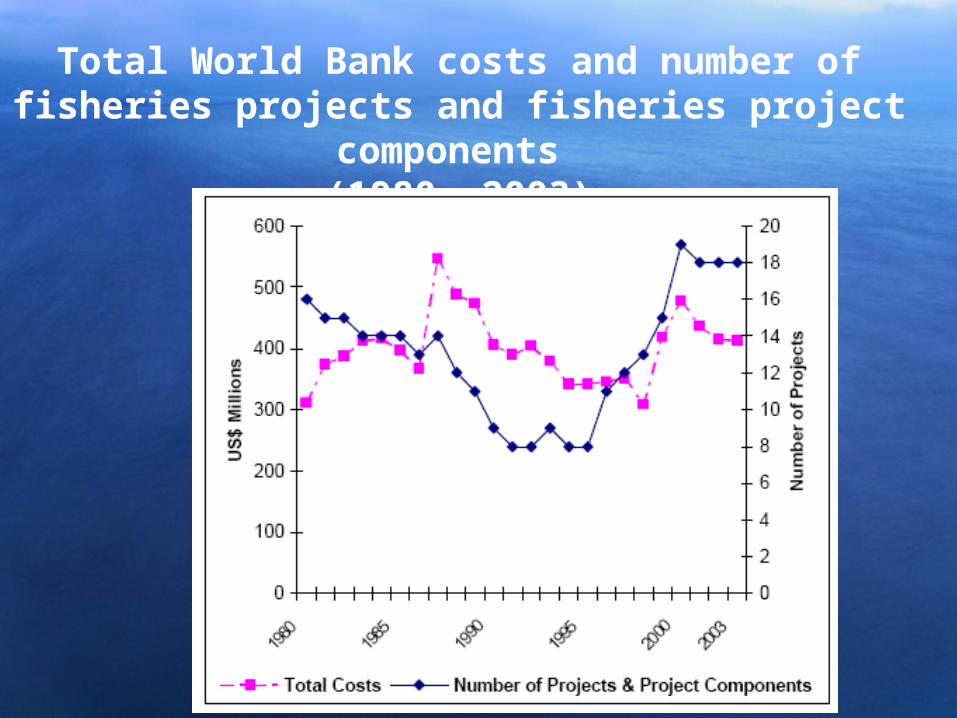
Total World Bank costs and number of fisheries projects and fisheries project components
(1980- 2003)

PROFISHGlobal Program on
Sustainable Fisheries
OBJECTIVE: ‘strengthen governance of the world’s marine fisheries’
Two tracks:1. Country-level sector reform
•roadmaps to achieve effective sector governance and reform•aligning donor interventions•capacity building
2. Regional and global initiatives •building regional and global awareness and consensus•using improved fisheries management tools

the rent drain• telling the story of overfishing in economic terms• make country-level estimates of rent loss to support
reforms • build economic arguments to justify the political and social
costs of change – a focus on finance ministers• “Where is - Fish in - the Wealth of Nations?” – track the
depleting capital account
and to follow the estimates …
• develop an arsenal of tools to capture lost rent, including• a roadmap for the political economy of reform• address the social costs of adjustment (e.g. fleet reduction) • build equity into change management (pro-poor) Preliminary global estimate:
US$ 50 billion/ year

SDN Vice Presidency for
Sustainable Development Integration of ESSD and INF to
SDN
• The new Vice Presidency for Sustainable Development will work across all spaces – from the biggest cities to the smallest towns, at the global, national, and local levels –
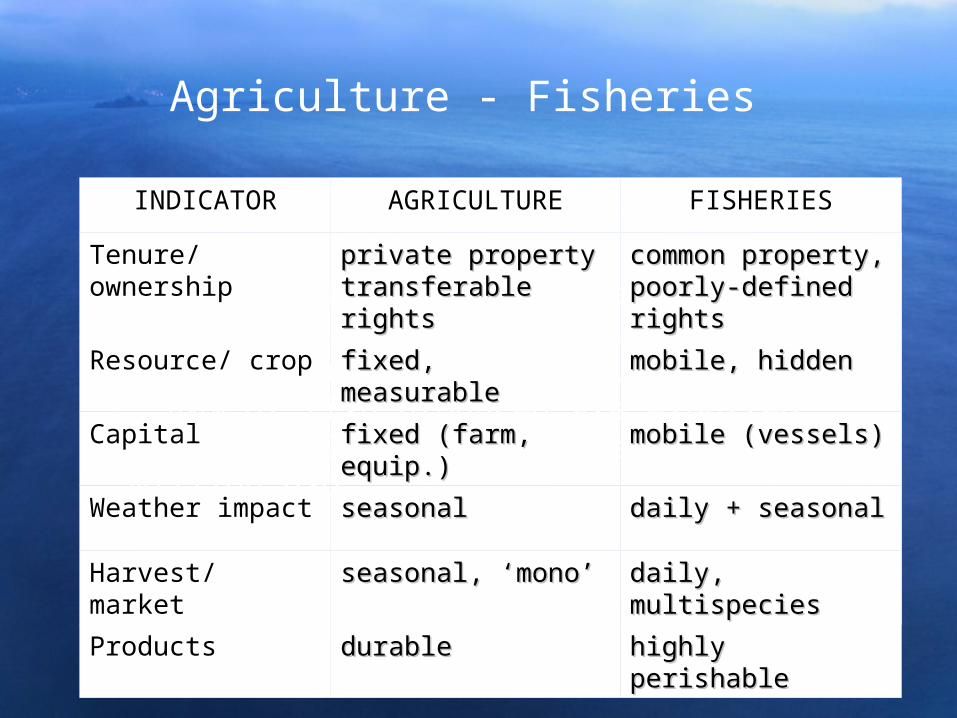
Agriculture - Fisheries
• ~ 20% wheat & 5% of rice are exported;• Exports in 2000 : 26 million tonnes of product worth
55 million USD;• ~ 40% of fish produced are exported; • Imports : 27 million tonnes worth 61 million USD.
INDICATOR AGRICULTURE FISHERIES
Tenure/ ownership private propertyprivate propertytransferable rightstransferable rights
common property, common property, poorly-defined rightspoorly-defined rights
Resource/ crop fixed, measurablefixed, measurable mobile, hiddenmobile, hidden
Capital fixed (farm, equip.)fixed (farm, equip.) mobile (vessels)mobile (vessels)
Weather impact seasonalseasonal daily + seasonaldaily + seasonal
Harvest/ market seasonal, ‘mono’seasonal, ‘mono’ daily, multispeciesdaily, multispecies
Products durabledurable highly perishablehighly perishable

Successful Fisheries Management
Dimensions for success in fisheries management:• Economic - meeting wealth and efficiency objectives• Societal - equity objectives; distribution and access• Biological - meeting conservations objectives • Political – stability in relation to political changes
Require institutional capacity to define balance and to implement responsible over timeRequire institutional and policy environment that creates incentives to conserve fish and optimize wealth generationPolitical commitment and will are essential
(From Bostock 2005)

Changes in catch and season length in the central Gulf of Alaska halibut fishery from 1970 to 1994, before the
introduction of IFQs


How subsidies induce overfishing
MEY
MSY Bionomic equilibrium (BE)
Total cost of fishing effort (TC)
Total Revenue (TR)
Fishing effort (E)
TR & TC ( $)
E1 E2 E3
Max. rent
TC1
TC2BE2
BE1
TR
TR& TC ($)
E3 E4 Fishing effort (E)
Cost-reducing subsidies
Gordon Schaefer bioeconomic model

LESSONS FROM NAMIBIA:• Right based fisheries management system. Gives
incentive to harvest effectively. Generates considerable resource rent.
• Effective enforcement of rules. Cooperation and support from fishers.
• Payment (fees) for the right to fish. Establishes the principle that broader society has the right to benefit from the productivity of the natural resources. Also: that management of the fishery is part of the cost of fishing. (Ensures that portion of the rent does not become capitalized into the trading of rights.)
• Overcapacity can create economic vulnerability that can seriously undermine the robustness of the
management system. (P. Manning 2005)
SIERRA LEONEObjectives
The aims of the paper are to:
(i) present an assessment of the fisheries sector in Sierra Leone, highlighting the potential opportunities for contributing to national development, and the major issues which need to be addressed in order for this to be successful and sustainable;
(ii) outline a broad strategy for fisheries development in Sierra Leone; the main features of this strategy would be expected to form the basis of a dedicated programme of support by donors to underpin and enable its successful implementation in the future.
Focus: wealth-based approaches that aim to optimize economic returns from fisheries for the long-term benefit of society in Sierra Leone.
Goal:
to ensure that the fisheries sector makes a significant contribution to sustainable development and pro-poor economic growth in line with the national PRSP.

FSS will focus on four sets of outputs: Opportunities for sustainable fisheries development -
identified, assessed and supported; An enabling environment for sustainable fisheries
development will be created and enhanced over time;Capacity will be created to capitalize on opportunities, in
both the public and private sectors, to create and sustain both the enabling environment and fisheries management systems;
Fisheries management system options will be analyzed, leading to the establishment and operationalisation of appropriate fisheries systems in Sierra Leone over time.

