disasters in africa: old and new hazards and growing ... · in 1994 there were epidemics in cote...
TRANSCRIPT
Disasters in Africa: old and new hazards and growing vulnerability Alessandro Loretti a & Yonas Tegegn b
Disasters occur when hazard and vulnerability meet. In Mrica, natural hazards interact with widespread manmade hazards, and with various factors of vulnerability. Most of the 53 countries of the continent that in 1996 had a total population of 764.6 million people ( 1) are highly susceptible to disasters.
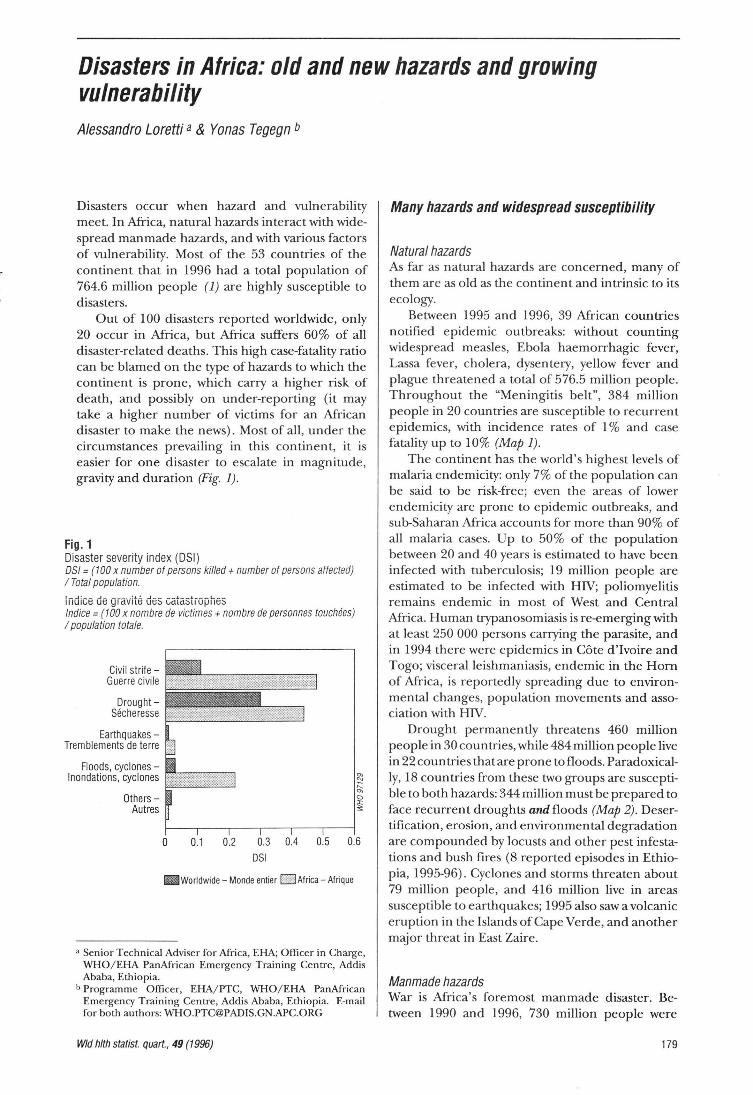
Out of 100 disasters reported worldwide, only 20 occur in Mrica, but Mrica suffers 60% of all disaster-related deaths . This high case-fatality ratio can be blamed on the type of hazards to which the continent is prone, which carry a higher risk of death, and possibly on under-reporting (it may take a higher number of victims for an Mrican disaster to make the news). Most of all, under the circumstances prevailing in this continent, it is easier for one disaster to escalate in magnitude, gravity and duration (Fig. 1).
Fig. 1 Disaster severity index (DSI) OS/= (1 00 x number of persons killed+ number of persons affected) I Total population.
indice de gravlt~ des catast;ophes lndice = (100 x nombre de victimes + nombre de personnes touchees) I population totale.
Civil strifeGuerre civile
DroughtSecheresse
EarthquakesTremblements de terre
Floods, cyclones -lnondations, cyclones
OthersAut res
0 0.1 0.2 0.3 0.4 0.5 0.6
OSI
Iilii Woridwide- Monde entier ELl Africa- Afrique
a Senior Technical Adviser for Africa, EHA; Officer in Charge, WHO/ El-lA PanAfrican Emergency Training Centre, Addis Ababa, Ethiopia.
b Programme Officer, EHA/ PTC, WHO/El-lA PanAfrican Emergency Training Centre, Addis Ababa, Ethiopia. E-mail for both authors: [email protected]
Wid h/th statist. quart., 49 (1996)
Many hazards and widespread susceptibility
Natural hazards As far as natural hazards are concerned, many of them are as old as the continent and intrinsic to its ecology.
Between 1995 and 1996, 39 Mrican countries notified epidemic outbreaks: without counting widespread measles, Ebola haemorrhagic fever, Lassa fever, cholera, dysentery, yellow fever and plague threatened a total of 576.5 million people. Throughout the "Meningitis belt", 384 million people in 20 countries are susceptible to recurrent epidemics, with incidence rates of 1% and case fatality up to 10% (Map 1).
The continent has the world's highest levels of malaria endemicity: only 7% of the population can be said to be risk-free; even the areas of lower endemicity are prone to epidemic outbreaks, and sub-Saharan Mrica accounts for more than 90% of all malaria cases. Up to 50% of the population between 20 and 40 years is estimated to have been infected with tuberculosis; 19 million people are estimated to be infected with HIV; poliomyelitis remains endemic in most of West and Central Mrica. Human trypanosomiasis is re-emerging with at least 250 000 persons carrying the parasite, and in 1994 there were epidemics in Cote d'Ivoire and Togo; visceral leishmaniasis, endemic in the Horn of Mrica, is reportedly spreading due to environmental changes, population movements and association with HIV.
Drought permanently threatens 460 million people in 30 countries, while 484 million people live in 22 countries that are prone to floods. Paradoxically, 18 countries from these two groups are susceptible to both hazards: 344 million must be prepared to face recurrent droughts and floods (Map 2). Desertification, erosion, and environmental degradation are compounded by locusts and other pest infestations and bush fires (8 reported episodes in Ethiopia, 1995-96) . Cyclones and storms threaten about 79 million people, and 416 million live in areas susceptible to earthquakes; 1995 also saw a volcanic eruption in the Islands of Cape Verde, and another major threat in East Zaire.
Manmade hazards War is Mrica's foremost manmade disaster. Between 1990 and 1996, 730 million people were
179
affected by armed conflicts, and many continue to be: because their country is at war, because they suffer the consequences of violence in neighbouring countries (e.g. refugee inflows), because they are undergoing difficult transitions to peace (Map 3). In UN jargon, wars are called "complex emergencies", and indeed complex they are: in 1996, the Hom of Mrica is the theatre of 37 different foci of conflict, with 7 warring factions in Somalia alone.
Besides conflict and political transition, economic growth and industrial development also carry specific manmade hazards. Road and other transportation incidents show increasing trends. 1996 saw a major air crash in Zaire, with 263 victims, and a ferry tragedy on Lake Victoria, with about 500 dead. In Tanzania and Zaire railways disasters are frequently reported; in 1994, Zimbabwe suffered 3 500 road incidents, and 900 related deaths; Ethiopia saw 652 deaths on its roads in the second semester of 1995. Mining and other industrial disasters are reported, too: in 1995 a major chemical spill occurred in Kigali, Rwanda.
Vulnerability factors
Population growth and human settlements Increasing numbers of vulnerable people are exposed to hazards. Annual rates of population growth in sub-Saharan countries average 2.8%. Patterns of human settlement are changing, and often for the worse: in one extreme case, since 1994, 750 000 Rwandan refugees have been sheltered around two active volcanoes, near Goma in Zaire. Movements of refugees, internally displaced people, economic migrants, urban squatters, etc. occur against a background of environmental degradation, political and cultural instability and unplanned human concentrations, and cities that grow by more than 7% per year. Most of the population of the continent is concentrated in 10 highdensity areas: the north of Morocco and Algeria, the Lower Nile Valley in Egypt, the Highlands of Ethiopia, Kenya and Zimbabwe, the Great Lakes Region, the Rand and the eastern coast in South Mrica, the coastal strip from Cote d'Ivoire to Cameroon, and the north of Nigeria (Map 4). Some communities, sometimes entire countries appear to have reached the limit of the carrying capacities of their environment, without being able to develop viable alternatives (2).
Poverty, food insecurity, poor infrastructures and services, weak economies Poverty remains the main element of vulnerability: in some countries, the people living in absolute poverty constitute as much as 83% of the population. Across the continent, agriculture is the main
180
productive sector, but arable land is scarce, e.g. only 7% of the total area of Zambia and Zimbabwe -and many households eke out a living on farms of 1h hectare or less, as in Malawi and Ethiopia. Precarious food security remains a paramount regional concern: very few countries count on the full supply of daily caloric requirements: in Ethiopia, daily supplies represent only 73% of the minimum needs.
Poor infrastructures and services add to vulnerability, and are themselves unduly vulnerable to hazards; they suffer from years of insufficient investment and increasing user pressure. Throughout the region, only 41% of the population has easy access to safe water, and this rate is universally worse in the rural areas; even in two countries as different as Swaziland and Congo, rural access to safe water is equally bad: 7%. Only 60% of the sub-Saharan population has easy physical access to health services; again, in the rural areas this rate falls to 15-17%. In financial terms, 267 million people have only US$ 10 per year per capita, or less, to spend on their health: only US$ 4 in Ethiopia, Liberia, Sierra Leone and Tanzania, for instance. As for cultural access, programmes for health education and information must face the fact that, in 1990, the region's adult literacy rate was calculated at 4 7% overall, and only at 36% for women.
Structures and capacities for disaster reduction and emergency management are also poor. The UN Economic Commission for Mrica reports that 50% of Mrican countries have plans for disaster mitigation, but that few have laws to back them up; 2 countries out of 3 have public awareness activities, but only 1 out of 5 has training programmes to sustain them.c Budget allocations are insufficient, and inter-country collaboration and support systems (such as information and communications) are weak.
In macro-economic terms, Mrica is expected to grow in the next 10 years, but population will grow too, offsetting economic development: the gains will be spread too thinly, and GDP in sub-Saharan countries will increase by only 0.9% per person per year. In 1994, sub-Saharan Africa's total debt stood at US$ 211 billion, equalling 255% of export incomes: average per capita spending on debt servicing was US$ 43, compared with US$ 35 spent per capita on health and education. Thirty-three Mrican countries are among the world's least economically developed (Map 5).
In UNDP's most recent analysis (3), only Mauritius had reached a high value on the Human Development Index (HDI); for the rest of the continent, just 15 countries had reached medium levels of
c UNECA, Regional report to the World Conference on Natural Disaster Reduction , Yokoh ama, May 1994 (available from the UN Administrative Subcommittee on Coordination/Subcommittee on Nutrition, United Nations, Geneva).
Rapp. trimest. statist. sanit. mond., 49 (1996)

Map 1 - Carte 1 African countries affected by epidemics, 1995-1996
Pays africains touches par les epidemies, 1995-1996
c ®
D No disease notified -Aucune maladie declanie
r:'l 1 disease notified -L..J 1 maladie declaree
0
• 2 diseases notified-2 maladies declarees
0 D
~ 3 diseases notifiedl!!!lilil 3 maladies declarees
• 4 diseases notified-4 maladies declarees
Diseases notified: Cholera (C), Plague (P), Yellow fever (Y), Meningitis (M), Ebola fever (E) and Lassa fever (L)
Maladies declarees: cholera (C), peste (P) , !iilvre jaune (J), fievre a virus Ebola (E) et fievre de Lassa (L)
Population at risk in affected countries: Cholera 456 million, plague 140 million, ye llow fever 265 million, meningitis 316 million, Ebola 66 mi llion, and Lassa fever 5 mill ion. Population a risque dans les pays touches: cholera 456 millions, peste 140 millions, fievre jaune 265 millions, meningite 316 millions. Ebola 66 millios, et fievre de Lassa 5 millions.
Map 3 -Carte 3
Map 2 -Carte 2 African countries prone to drought and floods
Pays africains vulnerables a Ia secheresse et aux inondations
@
G'""l Drought only-L..J Secheresse seulement
iR Floods only -(jjjjj[J lnondations seulement
• Drought and floodsSecheresse et inondations
0
0 D
Total population in affected countries: Drought 460 million, floods 484 million, and 344 million of these are affected by both drought and floods.
Population totale des pays touches: secheresse 460 millions, inondations 484 millions, et 344 millions touches a Ia lois par Ia secheresse et les inondations.
Complex emergencies in Africa (Areas of conflict and post-conflict transition) , 1990-1996
Situations d'urgence complexes en Afrique (zones de conflit et de transition a pres conflit), 1990-1996
Mali Mauritania- Mauritanie
Niger Senegal- Senegal
Western Sahara (Morocco)- Sahara occidental (Maroc)
~ Areas of conflict-1ft'- Zones de conflit
Refugee movement-Mouvement de retugies
Cameroon- Cameroun Ghana
Liberia- Liberia Nigeria- Nigeria L--'-'"'----
Sierra Leone Togo
Internally displaced populationPopulation deplacee au sein du pays Angola
Mozambique South Africa- Afrique du Sud
Total population in affected countries: 730 million Population totale dans les pays touches: 730 millions
Wid hlth statist. quart., 49 (1996)
Algeria- Algerie Egypt - Egypte Lybian Arab Jamahiriya- Jamahiriya arabe libyenne
.,./
Hamish Islands- lies Hamish
Eritrea- Erythree Ethiopia - Ethiopie Kenya Somalia- Somalie Sudan - Soudan Uganda- Ouganda
181

Map 4- Carte 4 Concentration of population in Africa
Concentration de Ia population en Afrique
@
0
a o
GJ 500 000 population/habitants
Map 6- Carte 6 Countries facing food emergency, January- February 1996
Pays menaces par Ia famine, janvier- fevrier 1996
@
Total population in affected countries: 272 million. Population totale des pays concerm!s: 272 millions.
Source: FAD
182
0
a o
Map 5- Carte 5 Human development index (HOI) in 1993
lndicateur du developpement humain en 1993
Human development index values- Valeurs de l' lndicateur du developpement humain
D High- Eleve (1!:0.800)
Ill ~e~gg~ 0 ~~§)n lllliili1ll Low- Faible I!H (0.200- 0.499)
l.i:l Least developed countries~ Pays les mains develop pes
0
a D
HOI is a compound indicator make up of three elements: life span, measured in terms of life expectancy at birth , level of education, and standard of living, measured by real Gross Domestic Product (GOP). The maximum value is 1 -L'IDH est un indicateur composite comportant trois elements: Ia duree de vie, mesuree d'apres !'esperance de vie a Ia naissance, le niveau d'education, et le niveau de vie, mesure d'apres le Produit interieur brut (P IB) reel par habitant; Ia valeur maxi male etant 1.
Source: UNDP, Human development report 1996. - PNUD, Rapport mondia/ sur le developpement humain 1996.
HDI, only 7 of them in the sub-Saharan portion. All the others occupy the lowest ranks in the scale, and 34 of them actually rate worse in the 1996 HDI report than they did in 1995 (overall, 16 Mrica countries improved their HDI).
The impact Through complex causal chains, disasters affect people directly, killing and injuring them, and indirectly: by precluding production, by destroying assets and stocks, by denying access to services, by disrupting the environment and the social fabric, and by wasting development opportunities.
According to reports in the WHO Weekly epidemiological record, in the first six months of 1996, meningitis had already killed 5 000 ( 4); in 1995, cholera killed 3 000 (5); between 1995 and 1996 there were 265 deaths from Ebola haemorrhagic fever (6), and 60 from Lassa fever (7). Throughout Mrica, measles-associated deaths number 500 000 each year. In 1993, malaria caused an estimated 270-480 million cases of illness and 1.4-2.6 million deaths, 1 million of them in children under-5 (8); the direct and indirect costs of the endemic and of its periodic epidemic outbreaks are estimated at
Rapp. trimest. statist. sanit. mond., 49 (1996)

US$ 1.7 billion per year, i.e. 1% of the Region's gross domestic product. Moreover, it was estimated that in 1995 there were 1.47 million new cases of tuberculosis in Mrica and some 581 000 deaths (9).
Recent years have seen no famine on a scale comparable with those of the 1970s and 1980s, but in June 1996, FAO spoke of "exceptional food emergencies" looming in 14 countries in Africa (10) with 22 million people facing direct food shortages from a series of causes that go from drought and recent crop failures, to displacement, shortage of agricultural inputs and civil strife (Map 6). During the 1992-93 Southern Mrican drought, hospital admissions for malnutrition doubled throughout the subregion. The food shortages did not turn into famine, thanks in part to effective relief programmes, but mainly to the people's own coping strategies. However, these, in turn, involved liquidation of assets, migration, and separation of families. Health services were affected too, and access to primary health care decreased: rural units were left with no water, and impoverished community workers had to migrate from their villages; some countries had to cut the imports of essential drugs. Thus, health resources decreased as vulnerability grew: not surprisingly cholera and dysentery spread throughout the subregion immediately.
As for conflicts, the peak of the Rwanda crisis, in April 1994, appears to have cost 1 million lives. Current estimates for Burundi (since 1993) and Liberia (since 1991) are 150 000 deaths in each country. In Southern Mrica the war caused 1. 9 million excess deaths from 1980 to 1990. In Sudan, the crisis of 1963-1973 resulted in 400 000 deaths, and, since 1983, at least 500 000 more were killed. Today, Mrica counts 17.5 million internally displaced persons, and 6 million refugees; in June 1996, more than 2 million of them were reported at immediate risk of malnutrition and associated mortality.d Conflicts cost the region about US$ 13 billion per year and leave behind long-term vulnerabilities and new hazards. Some countries have lost 70% of their health network to the war, and years of opportunities for preventing and controlling diseases and developing services. With 30-40 million landmines, Mrica is today the most severely mine-infested continent in the world.
d Refugee Nutrition Information System report on the nutrition situation of refugee and displaced populations, No. 16, June 1996 (available from the UN Administrative Subcommittee on Coordination/ Subcommittee on Nutrition, United Nations, Geneva).
Wid hlth statist. quart., 49 (1996)
Summary
Disasters occur when hazards and vu lnerability meet. Out of 100 disasters reported worldwide, only 20 occur in Africa, but Africa suffers 60% of all disaster-related deaths. Th is is probably due to the type of hazards that affect this continent, to under-report ing, and to the fact that under the circumstances prevailing in Africa, it is easy for any disaster to escalate and mu ltiply its impact. Afr ica's natural hazards are mainly epidemics, endemic diseases, drought, floods, agricultural pests and bush fires, but some areas are also susceptible to earthquakes, cyc lones and volcanic eruptions. The natural hazards interact with manmade ones, such as armed conf licts, air, road and ra ilway incidents, other industrial hazards such as mining accidents, chemical spills, etc. , and with widespread vu lnerability. The context is one of rap id populat ion growth , forced movements of population, environmental degradation, precarious urbanization, food insecurity , poverty, frag ile economies, infrastructures and institut ions, and cu ltural and political instability. The 53 countries of the continent are highly susceptible and vu lnerab le and the ir 761 390 000 people are exposed to both natural and manmade hazards. Through complex causal chains, disasters affect people directly and indirectly. In the first 6 months of 1996, meningitis had already killed 5 000 people. Throughout Africa, there are 500 000 measles-associated deaths each year; the direct and indirect costs of malaria are estimated at US$1 .7 billion per year. In June 1996 food emergencies were looming in 14 African countries with 22 million people facing direct food shortages. Since 1980, conf licts have caused at least 3. 7 mil lion excess deaths and cost the Region about US$ 13 bill ion per year. Wars have destroyed 70% of the health network of some countries, and have left behind 30-40 mill ion landmines, making Africa the most mine-infested continent in the world.
Resume
Catastrophes en Afrique : risques anciens et nouveaux et vulmirabilite croissante
Les catastrophes surviennent lorsque les risques et Ia vulnerabilite se rejoignent. Sur 100 catastrophes signalees dans le monde, seulement 20 surviennent en Afrique; mais !'Afrique compte 60% de tous les deces lies aux catastrophes. Cela est probablement dO aux types de dangers qui affectent ce continent, a !'absence de signalement et au fait que, compte tenu des conditions qu i regnent en Afrique, toute catastrophe s'aggrave et multip lie son impact facilement. Les risques naturels de !'Afr ique sont essentiellement les epidemies, les maladies endemiques, Ia secheresse, les inondations, les ravageurs des cu ltures et les feux de forets, mais certaines reg ions connaissent egalement des tremblements de terre, des cyclones et des eruptions volcaniques. Les risques naturels se conjuguent aux catastrophes provoquees par l'homme telles que les conflits armes, les accidents aeriens, routiers et ferroviaires, les aut res risques industriels te ls que les accidents miniers, les deversements ch imiques, etc ., avec une vulnerabilite generalisee. Le contexte est celui d'une croissance
183
demographique rapide, de deplacements de population , de degradation environnementale, d 'u rban isation precaire , d'insecurite alimentaire, de pauvrete, d'economies, d'infrastructures et institutions frag iles et d 'instabil ite culturelle et politique. Les 53 pays du continent sont extremement vulnerables et leurs 761 390 000 habitants exposes a Ia fois aux risques naturels et provoques par l'homme. Par l'intermed iaire de chaines de causalite complexes les catastrophes touchent les gens directement et indirectement. Durant le premier semestre de 1996, Ia meningite avait deja tue 5 000 personnes. Dans toute !'Afr ique, il y a 500 000 deces associes a Ia rougeole par an ; les coOts directs et indirects du palud isme sont estimes a US$ 1, 7 milliard par an . En juin 1996, des situations d'urgence alimentaire menayaient dans 14 pays africains ou 22 millions de personnes etaient directement confrontees a Ia penurie de nourriture . Depuis 1980, les conflits ont provoque au moins 3,7 mill ions de deces en exces et ils coOtent a Ia Region environ US$ 13 milliards par an. Les guerres ont detruit 70% du reseau sanitaire dans certains pays et ont laisse derriere elles 30 a 40 millions de mines terrestres, ce qui fait de !'Afrique le continent le plus infeste de mines du monde
184
References - References 1. United Nations, World papulation prospects: the 1992 revision,
New York, United Nations Population Division, Department of Social and Economic Information and Policy Analysis, 1993.
2. King,M.H. &Elliot, C.M.,Legitimatedoublethink, Lancet,34l: 669.U71 (1993).
3. United Nations Development Programme, Human development report 1996, New York, Oxford University Press, 1996.
4. Weekly epidemiological record/Releve epidemiologique hebdornt~r daire, 71(12) (1996), pp. 89-90.
5. Weekly epidemiological record/Releve epidbniologique hebdomadaire, 71(21) (1996), pp. 157-162.
6. Weekly epidemiological record/ Releve epidbniologique hebd»madaire, 70(34) (1995), pp. 241-242, and 71(17) (1996), pp. 125-126.
7. Weekly epidemiological record/ Releve epidbniologique hebdoma· daire, 71(75) (1996), p. 194.
8. Weekly epidemiological record/Releve epidbniologique hebdomadaire, 71(3) (1996), pp.17-22.
9. Dolin, P.J. et al. Global tuverculosis incidence and mortality during 1990.2000, Bulletin of the World Health Organization, 72(2) : 213-220 (1994). Dolin, P.J. et al. Incidence mondiale de Ia tuberculose et mortali te de 1990 a 2000, Bulletin de /'Organisation mondialede La Sante, 72(2): 220 [Resume] (1994).
Rapp. trimest. statist. sanit. mond., 49 (1996)