disaster (over-)insurance: the long-term financial and
TRANSCRIPT

This paper presents preliminary findings and is being distributed to economists
and other interested readers solely to stimulate discussion and elicit comments.
The views expressed in this paper are those of the authors and do not necessarily
reflect the position of the Federal Reserve Bank of New York or the Federal
Reserve System. Any errors or omissions are the responsibility of the authors.
Federal Reserve Bank of New York
Staff Reports
Disaster (Over-)Insurance:
The Long-Term Financial and Socioeconomic
Consequences of Hurricane Katrina
Zachary Bleemer
Wilbert van der Klaauw
Staff Report No. 807
February 2017

Disaster (Over-)Insurance: The Long-Term Financial and Socioeconomic
Consequences of Hurricane Katrina
Zachary Bleemer and Wilbert van der Klaauw
Federal Reserve Bank of New York Staff Reports, no. 807
February 2017
JEL classification: D14, H84, Q54, R11, R23
Abstract
Federal disaster insurance—in the form of national flood insurance, the Federal Emergency
Management Agency (FEMA), and other programs—is designed to nationally distribute large
geography-specific shocks such as earthquakes and hurricanes. This study examines how
residents were affected on net by the local long-run impacts of Hurricane Katrina and the
subsequent policy response. Using a unique fifteen-year panel of 5 percent of adult Americans’
credit reports, we find, ten years after the hurricane, higher rates of insolvency and lower
homeownership among inundated residents of New Orleans relative to their nonflooded
neighbors. Residents of mostly white and mostly black neighborhoods obtain similar short- and
long-term outcomes, though residents of white neighborhoods are more likely to have migrated
out of the city. Inundated New Orleans residents appear more likely to have migrated to
neighboring states but substantially less likely than nonflooded residents to have migrated north.
However, we find that residents of the large Gulf Opportunity Zone (GO Zone) surrounding New
Orleans, who were also eligible for various federal programs, obtained net financial benefits in
the years after Katrina; a decade later, those residents have higher rates of consumption and
homeownership and lower rates of bankruptcy and foreclosure than residents outside the GO
Zone. These net gains are found to be progressive—favoring young and low-income residents—
and are broadly similar across black and white neighborhoods.
Key words: disaster insurance, household finances, homeownership, migration
_________________
van der Klaauw: Federal Reserve Bank of New York (e-mail: [email protected]). Bleemer: University of California, Berkeley (e-mail: [email protected]). The views expressed in this paper are those of the authors and do not necessarily reflect the position of the Federal Reserve Bank of New York or the Federal Reserve System.

1 Introduction
More than two hundred natural disasters with losses exceeding one billion 2016 dollars have oc-curred in the United States since 1980. Six of the ten costliest disasters were hurricanes, causingover $345 billion in total damages and more than 2,000 deaths (Smith and Katz, 2013). The mostdeadly and damaging of these storms was Hurricane Katrina, which struck the Gulf coast in Au-gust 2005. Hurricanes’ economic cost is immediately experienced by the impacted communitiesthrough damaged infrastructure and disrupted economic activity, but large federal and private in-surance programs exist to spread those costs across the country in the long-run. In this study, weexamine the short- and long-term net aggregate effect of Hurricane Katrina and those insuranceprograms on the consumption, mobility, homeownership, and household composition of individu-als whose residences were impacted by the storm.
Because many residents of hurricane-impacted regions relocate in the years after the storm,it is challenging to conduct representative follow-up surveys of impacted residents. As a result,most studies of post-Katrina outcomes have focused on short run effects one or two years afterthe storm (e.g. Fussell et al 2010, Zissimopoulos and Karoly 2010, Sastry and Gregory 2014).In this study, we analyze data from the Federal Reserve Bank of New York’s Consumer CreditPanel (CCP), a quarterly representative panel of most US residents, to follow residents of Katrina-impacted regions from the time of the storm until 2016, ten years later. Based on consumer creditreports, the CCP contains detailed information on individuals’ consumption behavior, home- andauto-ownership, credit score (a summary measure of creditworthiness strongly related to income),and household composition as well as their age and location. Individuals randomly drawn into theCCP remain indefinitely, enabling representative analysis of hurricane-impacted residents a decadeafter Hurricane Katrina.
We break our analysis into three parts. First, we examine outcomes within the city of NewOrleans, comparing residents that experienced sustained flooding to those that largely remainedabove water. With 1.3 million residents, New Orleans had one of the United States’ forty mostpopulated metropolitan areas. Individuals hit hardest by Hurricane Katrina faced both a greatershock to their economic and social well-being as well as greater opportunity to receive private,local, and federal insurance protection for their substantial losses; we estimate the net effect ofthese opposing dynamics relative to individuals whose homes did not flood, but who neverthelessreceived a substantial shock from the storm (e.g. from disrupted local economic activity).
The second part of our analysis examines post-Katrina migration from New Orleans. In addi-tion to mapping the long-term destinations of former New Orleans residents, we compare inundatedand non-inundated residents to estimate migration patterns specific to inundated residents.
Finally, we compare the outcomes of residents of the Gulf Opportunity (GO) Zone, a hurricane-impacted region designated by the federal government in order to target substantial tax incentivesto promote economic recovery, to those living in the five states surrounding the GO Zone.1 The GO
1The Hurricane Katrina GO Zone was designated by the federal Gulf Opportunity Zone Act of 2005. The Act also
1

Zone covered six million residents, or 2.03 percent of the US population. Spanning the entirety ofLouisiana, Mississippi, and Alabama as well as parts of Florida and Texas, our Five States analysisestimates the effect of the hurricane on residents of the broader region impacted by HurricaneKatrina. These residents faced a wide range of flooding and wind damage (with a substantial shareof residents actually experiencing little or no damage), but were safeguarded by private insuranceand substantial emergency aid from the federal government.
From a policy perspective, our framework allows us to test four outcomes of interest of the fed-eral policies that provided de facto disaster insurance to regions that experience natural disasters.First, we test the policies’ ability to target areas most damaged by the hurricane and provide resi-dents with adequate assistance relative to less-affected residents living in the same region; we callthis the policies’ intensive effectiveness. Second, we test the policies’ extensive effectiveness, ortheir ability to stabilize and normalize outcomes for residents of the broadly-affected region, eventhose minimally impacted by the storm. Third, we test the breadth of the policies’ effectiveness byestimating heterogeneous outcomes in both regions across three demographic divisions which mayhave been importantly and differentially affected by the storm: age, race, and income. While wedo not directly observe race or income, we proxy income by pre-Katrina credit scores (which arehighly correlated with income; see Albanesi and Nosal 2015) and infer black and white residentsfrom the racial distribution of their residential neighborhoods. Finally, our migration analysis as-sesses the effectiveness of federal policies in limiting long-term population losses and in reversingshort-run population outflows from the area hit hardest by Hurricane Katrina.
The region affected by Hurricane Katrina was non-randomly selected, determined by the geo-graphical path of the storm and by topological and engineering features of New Orleans. We usedifference-in-differences event study analysis to control for individual- and time-specific variationin the outcomes of interest. Following Hirano et al (2003), we apply propensity score weightingestimated from three years of residents’ pre-Katrina socioeconomic characteristics to account forregional differences in those characteristics, and show that nearly all of our weighted outcomes ofinterest are balanced across treatment group for five years before the hurricane.
Our analysis of the impact of Hurricane Katrina on household finance is related to that ofGallagher and Hartley (2014), who also use the FRBNY Consumer Credit Panel for their analy-sis, while our analysis of the storm’s impact on mobility and household composition is related toDeryugina, Kawano and Levitt (2014), who use tax return data from the Internal Revenue Service.Our study, which in part confirms those earlier papers’ findings, augments them in four importantways. First, both of these previous studies focus exclusively on outcomes for the city of NewOrleans (where the hurricane was particularly damaging) as a case study of the impact of naturaldisasters in the United States; the former examines the intensive effectiveness of relief policies,while the latter extensively compares New Orleans outcomes to those of 20 demographically-
designated GO Zones for Hurricanes Rita and Wilma, but all references to the ‘GO Zone’ below refer to the KatrinaGO Zone. Individuals living outside the GO Zone may still have been eligible for some subsidies under an additionallaw, the Katrina Emergency Tax Relief Act of 2005, which may attenuate our findings.
2

similar American cities. Our study also examines the broader effect of Hurricane Katrina–andassociated governmental subsidy and insurance programs–on the large Gulf Opportunity Zone thatwas affected by the storm. Second, the previous studies only examined short- and medium-termeffects of the storm (3 and 5 years, respectively), whereas we find that there are both sustainedand strengthening effects of the storm 10 years after its impact. Third, our analysis of residentialoutflow from New Orleans in the years following the storm is unique to this paper. Finally, we con-sider a more comprehensive set of financial outcomes than either study, including bankruptcy andforeclosure filings, insolvency, auto loans and balances, home ownership, consumer debt balances,and credit score.2
In New Orleans, we find relatively modest but persistent effects on residents’ use of auto andconsumer debt, bankruptcy behavior, and credit scores; inundated residents’ credit scores imme-diately and persistently dropped about six points, or 0.05 standard deviations, and consumer debtdeclined by around $150 per quarter (remaining statistically significant at the 10 percent level aslate as 2013). On the other hand, we find large persistent increases in migration and declines inhomeownership rates; a decade after the storm, inundated residents were between two and threepercentage points less likely to hold a mortgage and seven percentage points less likely to remainin New Orleans. Indeed, inundated residents remained more likely to have recently changed res-idences (in the past three years) as late as 2011, after which their behavior reverted to that thenon-flooded control group. Household size immediately declined (by about 0.15 adults per house-hold), with a marked transition from large extended-family households to single-adult residences(as previously documented by Rendall, 2011), but the gap had largely disappeared a decade afterthe storm. Among the inundated, older, higher-income, and white residents were more likely thantheir respective counterparts to evacuate New Orleans immediately after Hurricane Katrina, but wefind little additional evidence of heterogeneous impacts across demographic group. In particular,we find no evidence that residents of mostly-black flooded neighborhoods faced more negativeconsumption, insolvency, homeownership, or partnership outcomes than residents of mostly-whiteflooded neighborhoods, despite our study’s sufficient power to identify such differences.3
Overall, our findings suggest a broad success of insurance and government programs in min-imizing long-term changes in most income and consumption behavior among those who experi-enced the greatest impact from Hurricane Katrina, as well as those programs’ success in distribut-
2Like Deryugina, Kawano, and Levitt, our empirical specification controls for sample selection using propensityscores estimated on a large set of pre-Katrina socioeconomic characteristics, and includes individual and time fixed ef-fects. Gallagher and Hartley control for pre-Katrina socioeconomic characteristics in post-Katrina periods and attemptto directly control for adverse sample selection.
3A number of academic (Hamilton, 2015), private foundation (Hamel, Firth, and Brodie 2015), and newspaper(e.g. Rivlin 2015 in the NYT Magazine and Philip 2015 in the Washington Post) reports have found that blackNew Orleans residents are far less likely to report post-Katrina economic recovery than white New Orleans residents.These reports all rely on current residents belief and perceptions as reported in surveys and interviews instead of actualoutcomes, and fail to directly account for large differences in both post-Katrina immigration and emigration by race.Nevertheless, our study examines only one aspect of those studies’ broader intentions: while we find no evidence ofdifferential impacts resulting from inundation within the white and black populations of New Orleans, we are unableto test whether all black residents of New Orleans fared worse than all white residents, independent of pre-hurricanecharacteristics and hurricane inundation.
3

ing funding across demographic groups, but suggest a failure to redress the long-term decline inhomeownership that remains ten years after the storm.
In the expansive Five States region, we find that Hurricane Katrina had immediate, substantial,and statistically-significant negative effects on consumption and homeownership, with the latterdropping about four percentage points (almost 15 percent) for those residing in the GO Zone whenthe storm hit. However, these declines were short-lived; by 2015, GO Zone residents were onepercentage point more likely to own a home than non-residents (significant at 10 percent). Theimpact also marked the beginning of a medium-term increase in residents’ credit scores (a strongproxy for income), along with an increase in auto debt and decreased prevalence of insolvency,foreclosure, and bankruptcy. Moreover, by 2013 those who resided in the GO Zone at the timeof the storm tended to have higher average consumer debt–by as much as $160 (5 percent)–thanthose who lived outside the GO Zone before the storm. Given their lower insolvency rate, thesetrends suggest that the aftermath of the hurricane provided long-term net consumption benefits forGO Zone residents. This provides some support for the theory that GO Zone residents tended to befinancially overcompensated, on average, for the damage caused by Hurricane Katrina, providingthem with net subsidies relative to residents of neighboring counties.4 Moreover, we find thatthese net subsidies were progressive–somewhat larger for young and low-income residents–andappear broadly similar for residents of black and white GO Zone neighborhoods. Restricting ouranalysis to counties within about 20 miles of the Go Zone border (with similar results for 10 and30 mile bands), we find evidence that these net subsidies cannot be wholly explained by the Zone’speripheral residents, suggesting that the region with the largest benefits was in the region closerto (but not including) New Orleans, where flooding and high winds would have been limited (butnon-negligible).
Finally, our analysis shows that seven percent of New Orleans residents evacuated the city afterHurricane Katrina and have yet to return the city ten years later, with 13 different US states hostingover 500 adult evacuees in 2016. A controlled post-treatment comparison suggests that inundatedNew Orleans residents were significantly and substantially more likely to move to neighboring andnearby states than their non-inundated neighbors in the year after the storm, and ten years laterwere more than 60 percent more likely to have migrated to Georgia and other parts of Louisiana,but they were more than 40 percent less likely to have moved north to states like North Carolinaand New York; indeed they were 33 percent less likely to have moved to any Mid-Atlantic or NewEngland state.
In Section 2 we provide some background on Hurricane Katrina and the various governmentalprograms implemented to insure residents against its associated damage. We introduce our dataset,the Consumer Credit Panel, in Section 3 and discuss our empirical approach in Section 4. Sections5 to 7 present our baseline results for each part of our analysis–the impact on inundated residentswithin the city of New Orleans, the impact on residents of the GO Zone within the Five Statesregion, and the storm’s impact on migration from New Orleans–along with results by age, race,
4Our findings are restricted to financial overcompensation, not overcompensation in an overall welfare sense.
4

and income level. Section 8 concludes.
2 Background
Hurricane Katrina formed as a tropical storm in the Caribbean Sea on August 23rd, 2005. By Au-gust 28th, Mississippi, Alabama, Louisiana, and Florida had been declared in states of emergencyby President George W. Bush and their respective governors, while Mayor Ray Nagin of New Or-leans had ordered the first mandatory evacuation in that city’s history. The hurricane made landfallnear New Orleans on August 29th as a Category 3 hurricane (sustained winds between 111 and129 miles per hour) with a storm radius of over 100 miles. New Orleans experienced 14 inches ofrain and a series of levee failures that flooded most of the city at depths of up to 16 feet (Kates etal, 2006). In the broader affected region, large portions of Louisiana and Mississippi experiencedwind speeds above fifty miles per hour; Katrina rendered 300,000 houses uninhabitable and left atleast 2.5 million residents without electricity (Townsend, 2006).
According to the National Weather Service (NWS), Hurricane Katrina was the third most in-tense (as measured by barometric pressure), third most deadly, and second most costly hurricane tostrike the United States since 1851, when reliable record-keeping commenced (Blake and Gibney,2011). It ranks first in all three of those categories among hurricanes since 1970, and is estimatedby NWS to have caused almost $108 billion in damages ($129 billion in 2015 dollars). In short,Hurricane Katrina was highly disruptive to residents of the Gulf Coast, particularly those who livedin New Orleans, and there is ample reason to expect it to constitute a substantial shock to everyfacet of those residents’ lives.
Insurance for damage caused by Hurricane Katrina came in the form of direct aid, disburse-ments, tax breaks, tax credits, and subsidies from the public and private sectors. According to a2010 report by the Insurance Information Institute, an industry group, private insurance payoutstotaled $41.1 billion towards more than 1.7 million claims across six states. Residents of Louisianaaccounted for the majority of private insurance recipients, receiving more than $25 billion; claimswere evenly split between individuals (49 percent, for homes and cars) and firms (51 percent,not including an additional $2 billion for offshore energy and marine losses). According to theFoundation Center, as much as $6.5 billion was also made available through private individual andcorporate philanthropy, though this includes aid for other 2005 Gulf Coast hurricanes (Lawrenceet al, 2007).
The response of the federal government to Hurricane Katrina was manifold. In addition tothe typical federal response to natural disasters, including insurance payouts through the NationalFlood Insurance Program (which totaled more than $16 billion), the federal government imple-mented three large-scale programs designed to mitigate the long-term socioeconomic impact ofthe storm. About $20 billion was dispersed through the Department of Housing and Urban De-velopment’s Community Development Block Grant program, which targeted infrastructure recon-struction focusing on affordable rental housing, federally assisted housing, and public housing
5

(Boyd, 2011). An additional $20 billion was dispersed through the Department of Homeland Se-curity’s Federal Emergency Management Agency, which provided short-term relief like replace-ment housing and furniture as well as long-term repair of public infrastructure (FEMA, 2013).These programs also funded most state responses to the storm, like the initiatives of Louisiana’sEconomic Development Department; for this reason, we hold the federal governments’ policiescomprehensively responsible for the public insurance portion of the shock caused by HurricaneKatrina.
Finally, the Internal Revenue Service offered substantial tax breaks and subsidies to individ-uals living and working within a federally-designated three-state Gulf Opportunity (GO) Zone,including additional income deductions, augmented earned income credits and child tax credits,expanded federal mortgage subsidies, business property tax breaks and clean-up deductions, andan employee retention and housing credit (IRS, 2006). These tax exemptions totaled about $3.5 bil-lion. The Gulf Opportunity Zone Act of 2005 also authorized Mississippi, Alabama, and Louisianato issue special GO Zone tax-exempt bonds totaling $15 billion for use in permanent reconstructionof GO Zone residences and businesses and $8 billion for the advanced refunding of outstandingbonds. Finally, states received additional GO Zone low-income housing tax credits totaling $330million (Brostek, 2008). The Government Accountability Office noted that:
With some process variations, the three eligible states with GO Zones generally allo-
cated bond authority on a first-come, first-served basis without consistently targeting
the allocations to assist recovery in the most damaged areas. Officials in Louisiana
and Mississippi acknowledged that the first-come, first-served approach led to allocat-
ing bond authority to less-damaged areas at the start of the program (Brostek, 2008).
The total cost of federal and private insurance programs, then, exceeded $100 billion, and was ofsimilar magnitude to the estimated financial cost of the physical damage caused by the storm. Inthis paper, we examine the net or combined effect of Hurricane Katrina and the public and privateresponses that attempted to stabilize the socioeconomic livelihood of impacted residents.
3 Data
3.1 The Consumer Credit Panel
The Federal Reserve Bank of New York’s Consumer Credit Panel (CCP) is an individual-levellongitudinal dataset on consumer liabilities, repayment and location. It is built from anonymizedquarterly consumer credit report data collected and summarized by Equifax Inc. Data are collectedquarterly since the first quarter of 1999, and the panel is ongoing. Sample members have Social Se-curity numbers ending in one of five arbitrarily selected pairs of digits (for example, 10, 30, 50, 70,or 90), which are assigned randomly within the set of Social Security number holders. Therefore,the sample of approximately 12 million individuals comprises 5 percent of U.S. individuals with
6

credit reports (and Social Security numbers). The CCP sample design automatically refreshes thepanel by including all new reports with Social Security numbers ending in the above-mentioneddigit pairs. Therefore the panel remains representative for any given quarter, and includes bothrepresentative attrition, as the deceased and emigrants leave the sample, as well as representativeentry of new consumers, as young borrowers and immigrants enter the sample.5
Each quarter, the CCP includes the birth year and present location of each individual downto the Census Block, in addition to an anonymous street address identifier (allowing us to iden-tify residency change within Census Block).6 It includes loan counts, balances, and repaymentstatuses of consumer debt by type–including auto, mortgage (and other home-secured), and con-sumer credit (credit card, retail, and consumer finance) debt–as well as bankruptcy and foreclosureindicators. We use this information to define homeownership as holding non-zero home-secureddebt (including mortgage, HELOC, and home installment loans), and define bankruptcy and fore-closure by an individual’s experiencing a bankruptcy or foreclosure event in the past three years.7
While CCP data are not top-coded, we winsorize the top one percent of debt balances to avoid ourestimates’ being driven by outliers. The CCP also includes each individual’s Equifax risk score,which (like the FICO score) models 24 month default risk as a function of credit report measures,and which is a strong proxy for income.8 Finally, our data also includes these same characteristicsfor all sampled individuals’ covered household members.9 The CCP defines household membersas individuals with the same full mailing address (as recorded by financial institutions); followingBleemer et al (2014), we define parental coresidence (a possible outcome of interest, signalingeconomic distress) as an individual who shares a residence with at least one adult between 15 and45 years older than her. With household members included, the CCP includes credit report data onover 40 million individuals.
While the sample is representative only of those individuals with Equifax credit reports, thecoverage of credit reports is fairly complete for American adults. Aggregates extrapolated fromthe data closely match those based on the American Community Survey, Flow of Funds Accountsof the United States and the Survey of Consumer Finances.10 In sum, the CCP permits uniqueinsight into questions of geography-specific mobility, debt and consumer behavior, and householdcomposition as a result of the size, representativeness, frequency, and recentness of the dataset. Itssampling scheme allows extrapolation to regional aggregates and spares us most concerns regard-ing attrition and representativeness over the course of a long panel.
5See Lee and van der Klaauw (2010) for details on the sample design.6Nonempty Census Blocks in the US averaged 49 inhabitants in the 2010 Census.7Bankruptcy events include discharges arising from either Chapter 7 or Chapter 13 bankruptcy. Both bankruptcies
and foreclosures include those reported at the account level and in public record.8See Appendix II of Albanesi and Nosal (2014), which matches a small subset of CCP data to 2009 income data
collected by Equifax Workforce Solutions to show the strength of the Equifax risk score as a proxy for income. Theconsumer credit score provided by Equifax is based on a different methodology than the FICO score, but it predictsthe same probability of severe delinquency over the next 24 months (see Lee and van der Klaauw (2010)).
9An individual is covered if she is at least 18 years old and has an Equifax credit report, for which even a loanapplication or listing on an authorized-user account is sufficient.
10See Lee and van der Klaauw (2010) and Brown et al. (2013) for details.
7

We construct two subsamples of CCP data for our analysis. First, we construct a 1999-2016panel of all individuals whose mailing addresses were located in Orleans Parish on the 30th ofJune 2005 (the end of the second quarter), our last data record before Hurricane Katrina. Thedata’s panel structure allows us to follow a random 5 percent of adults who lived in New Orleanswhen Hurricane Katrina hit, both during the years prior and continuing for 10 years after thestorm, tracking the evolution of their consumption behavior, mobility, and household composition.Second, we construct a similar panel of all individuals whose mailing address was located in theFive State Region of our broad analysis–which we define as the full states of Louisiana, Alabama,and Mississippi as well as the Texas and Florida counties with centroids bounded between the 82ndand 99th west meridians–on the 30th of June 2005.11 To enable analysis of the storm’s immediateand longer-term effects, both panels were collected biannually (first and third quarters) in the yearsimmediately before and after Hurricane Katrina, and collected annually (first quarter) thereafter.The total sample size in the second quarter of 2005 is about 19,000 in the city of New Orleans and1.52 million in the Five States region. In the first quarter of 2016, about 80 percent of the samplecontinued to be covered by the CCP, with the remainder either deceased, moved outside the US, orwithout sufficient recent credit history to generate an Equifax credit report (a relatively rare event).Figure 1 shows the set of variables constructed for our analysis of these two panels.
3.2 Additional Data Sources
We use two sources of data to delineate the regions affected by Hurricane Katrina. To identify theNew Orleans residents who were hardest-hit by Katrina, we use geospatial flood inundation dataestimated by the United States Geological Survey’s Center for Earth Resources Observation andScience (see Gesch 2007) and aggregated to the 2000 Census Block level in Orleans Parish bySastry (2007). Following Sastry, we define a Census Block as inundated if it experienced at leastfour feet of flooding on 31 August 2005. Though these inundation data are largely estimated fromdetailed topological data and water level readings from Lake Pontchartrain, the agency notes thatthey compare well with aerial and satellite photographs from the days after the storm. Figure 1ashows a map of the 49 percent Census Blocks in Orleans Parish (51 percent of households) thatwere inundated by Hurricane Katrina.
For the Five States region, we define the broad region affected by the storm by the HurricaneKatrina GO Zone defined by the Gulf Opportunity Zone Act of 2005, as discussed above. Figure1b shows a map of the 89 counties and parishes in the Five State region that fall within the GOZone (shown in blue), out of 401 total counties in the region.12 Due to our singular focus on NewOrleans above, we exclude New Orleans residents from the Five States analysis.
11The 82nd and 99th meridians were chosen to symmetrically include the Hurricane Katrina GO Zone plus addi-tional four degrees longitude for the control group (see Figure 1b). All qualitative results presented below are robustto the inclusion of all of Texas and Florida, and analysis restricted to the GO Zone’s 40-mile border provides similarresults.
12Louisiana ‘parishes’ correspond with the ‘counties’ of all other states. We will refer to all such geographicalunits as ‘counties’ for the remainder of the paper.
8

While the CCP provides sufficient information to produce subsamples by age and income (asproxied by credit score), we use 2000 Census data to geographically subsample black and whiteresidents by Census Blocks. Census Blocks are the smallest regional designation assigned by theUS Census, and had a mean (median) population of 19 (38) across the Five States region in 2000;even the 7,200 Census Blocks in New Orleans contained an average of 49 residents.13 The white(black) subsample comprises all residents of 2000 Census Blocks that were at least 75 percent non-Hispanic white (black).14 About 69 percent of sampled New Orleans residents live in such neigh-borhoods (50 percent black, 19 percent white), as do 61 percent of residents of the Five Statesregion. Remaining residents–most of whom live in racially-diverse neighborhoods–are omittedfrom our race subsamples.15 Because residents non-randomly select their neighborhoods’ char-acteristics, we refer to these subsamples as “White Neighborhoods” and “Black Neighborhoods”,which may not broadly represent white and black residents. Table 2 summarizes the observedcharacteristics of our sample by subpopulation.
4 Empirical Strategy
The goal of our analysis is to estimate the short- to run-long average “treatment effect” of HurricaneKatrina–and the associated policy response–on a large set of economic and demographic statisticsmeasured at regular intervals after the storm. The framework of our analysis will be difference-in-differences regressions, in which we compare outcomes pre- and post-Katrina of those living in theimpacted areas to the same outcomes for those living in similar but not- or less-impacted areas. Inapplying the differences-in-differences approach we use propensity score weighting (Hirano et al,2003; Abadie, 2005) to account for the non-random selection of individuals that were impacted byHurricane Katrina due to the storm’s geographic containment, thereby assuming that geographicresidence selection conditional on (financial) observables is independent of long-run outcomes.We follow Hirano et al by estimating propensity scores using a logit model relating the likelihoodof an individual being impacted by the storm to a large set of observed individual characteristicsand outcomes, including consumption, mobility, and household composition levels and changesmeasured in the first quarters of 2002-2005 (collected before Hurricane Katrina’s impact).16 Acomplete list of observed characteristics is available in Appendix 2.
LetXit be the vector of economic and demographic variables described in Table 1 for individuali and quarter t, and let Yit be a vector of outcomes (one of the economic and demographic variables)for individual i in time t. Let Ki be an indicator for whether i was living in a location impactedby Hurricane Katrina, either an inundated New Orleans Census Block or a county in the federal
13These figures omit unpopulated Census Blocks.14The results presented below are largely insensitive to 10 percentage point changes in these cut-off values.15Fewer than five percent of New Orleans and Five States residents lived in either 75-percent-Hispanic Census
Blocks or Blocks that had no residents during the 2000 Census.16Note that by including annual measures of local conditions, our weighting also accounts flexibly for differences
in pre-treatment trends.
9
Katrina GO Zone. We estimate the following model for all observed quarters (the first quarter ofevery year from 1999–2016 and the second and third quarters of 2005 and 2006), omitting theinteraction term between Ki and the indicator dummy for the second quarter of 2005 (the finalquarter of data before Hurricane Katrina’s impact):
Yit = δi + γt +∑
τ∈[2000,2016]∩Z
Ki1{t=τ}β + εit
where the {β} coefficients–the linear effect of living in an impacted locality in quarter t relative tothe second quarter of 2005–are the coefficients of interest.17 The model includes both individualfixed effects δi and time fixed effects γt (which will capture aggregate business cycle fluctuations).The regression weights impacted individuals by the inverse propensity of inundation, 1
Pr(K̂i=1)and
non-inundated individuals by the inverse propensity of non-inundation, 1
Pr(K̂i=0), using propensities
estimated by logistic regression. Standard errors for the Five States (New Orleans) model areclustered at the county (Census Block) level.
We conduct two tests to measure the effectiveness of our propensity weight estimation proce-dure. First, we test the overlap assumption: that all individuals are estimated as having a positiveprobability of being impacted or not impacted by Hurricane Katrina. We find that no individualsin the New Orleans sample and two individuals in the Five States sample have an impact (or non-impact) probability of less than 0.0001, and omit those individuals from our analysis. Second, wetest the common support assumption: that no individual has a propensity score outside the range ofpropensity scores in the alternative-treatment group. Four individuals in the New Orleans sampleand seven in the Five States sample fail the common support assumption, and are omitted. Givenour sample’s massive size, these results support the applicability of propensity score weightingin our estimation approach.18 Additional evidence of the weights’ effectiveness in balancing thepanel is shown in the results below; as expected, nearly all outcomes of interest are balanced inboth samples for the five years prior to Hurricane Katrina.
5 New Orleans Impacts
We first present estimated effects of living in an inundated New Orleans Census Block on the var-ious socioeconomic outcomes of interest described in Table 1. Effects are estimated relative tootherwise-similar New Orleans residents who lived in non-flooded regions of the city, who maythemselves have sustained substantial water and wind damage in addition to negative externalitiesfrom the nearby flooding (for example, through a decline in the local economy). These estimatedeffects, then, measure only the additional impact of severe inundation in the days following Hur-
17We include the second and third quarters of 2005 and 2006 in our analysis to provide finer-detail estimates of theshort-term impact of Hurricane Katrina.
18Individuals who fail either the overlap assumption or the common support assumption are omitted from ouranalysis below.
10

ricane Katrina, net the additional federal and private insurance and aid provided to mitigate thatimpact. These ‘intensive-margin’ results can be understood to describe insurance programs’ ef-fectiveness in targeting more substantial assistance to residents who were hardest-hit by HurricaneKatrina.
In order to convey the magnitudes of these coefficients, we present them unscaled, whichdescribes the average treatment effect in the units of interest (percentage point, dollars, or riskscore). In some cases, we also present coefficients scaled by the contemporaneous level in the non-inundated ‘control’ Blocks, which describes the ATE as a unitless percent difference.19 In severalfigures below we show the estimated coefficients from Equation (2) plotted for various outcomesof interest from 2000 to 2016. The results for 2000-2005, which estimate the difference betweeninundated and non-inundated neighborhoods before the storm conditional on the set of controlvariables described above, are presented as a validation exercise; we expect that the controlledpre-Katrina impact of Hurricane Katrina will be 0 in those years, as is nearly always the case.
We first consider estimates of Hurricane Katrina’s impact on risk scores (proxy for income)and on new debt originations associated with car purchases or other consumer debt activity (asmeasures of consumption), some of which are shown in Figure 2. Inundated residents experienceda short-term negative shock to their Equifax risk score after the storm of about 6.7 points (0.05standard deviations), and recovered very little over the following ten years, with their averagescore remaining 5.6 points lower ten years after the storm. This short-term decline correspondedwith a two percentage point increase in the fraction of inundated residents with subprime riskscores (scores below 640, the bottom third of risk scores nationwide), though the increase fellinto statistical insignificance after 2008. This finding, consistent with that of Deryugina, Kawanoand Levitt (2014) using IRS income data (Figure 5), suggests that insurance programs failed tomeaningfully close the income gap between inundated and non-inundated New Orleans residentscaused by Hurricane Katrina in the short- or long-term.20
Our analysis of consumption yields results in line with this income finding. We find evidenceof a steady decline in consumer credit balances (with time-variation in consumer debt representinga strong proxy for changes in general consumption, excluding very large purchases) in the threeyears after the hurricane, without any substantial recovery in the following 5-10 years (though thegap is statistically insignificant ten years later). Inundated residents are far more likely to pur-chase a car immediately after the hurricane–possibly replacing cars damaged by the storm, likelywith newer models–with an increase in average auto debt by over $400 per adult, but also becomesteadily more likely to face insolvency on their auto loans–by more than one percentage point in2016. Other measures of extreme financial hardship, however, suggest some degree of post-Katrina
19We choose to scale by the contemporaneous level in non-inundated regions (the ‘control’ group), rather than themore typical choice of the level in inundated regions just before Hurricane Katrina, in order to account for city- (andnation-) wide trends in our outcomes of interest in the late 2000s (driven most significantly by the Great Recession).
20Using a slightly different definition of inundation, Deryugina, Kawano, and Levitt (2014) find a income gap ofabout $5000 between inundated and non-inundated residents in 2010, which corresponded to 0.14 standard deviationsin New Orleans.
11

recovery: inundated residents’ increased likelihood of falling into consumer credit insolvency re-turns to statistical and economic insignificance five years after the storm, and inundated individualsare no more likely to declare bankruptcy than their non-inundated neighbors.
Ten years after the storm, then, the consumption behavior of inundated residents had imper-fectly recovered since the storm relative to their non-inundated neighbors, with small but persistentgaps in credit-score-proxied income and insolvency.
We turn next to Hurricane Katrina’s impact on residential mobility. Figure 3 shows the im-pact of the hurricane on inundated New Orleans residents’ decision to change their residentialaddress, county, or state, either at any time since the storm or specifically in the past three years (ameasure of residential ‘churn’). Inundation considerably increased residents’ likelihood of reloca-tion; within one year, an additional 13.1 percentage points of residents had moved out of OrleansParish. The effect of the storm peaked in 2006 and diminished thereafter, though by 2016, in-undated residents were still 6.7 percentage points more likely to reside outside of Orleans Parishthan non-inundated residents. Figure 3 also shows that the hurricane led to substantial three-yearresidence-churn at the county level through at least 2011, implying that inundated residents weresubstantially more likely to relocate even 3-6 years after the storm (in some cases returning to NewOrleans after years away). Since 2013, however, inundated and non-inundated residents have hadsimilar levels of mobility, suggesting one successful dimension of post-hurricane recovery. Figure3 shows similar trends for impacts on street-address-level and state-level mobility, with inundatedOrleans Parish residents remaining about 2 percentage points more likely to have relocated out ofthe state ten years after the hurricane.
Homeownership, and especially homeownership among the pre-Katrina homeowners, facedsubstantial deterioration due to Hurricane Katrina. At the time of the storm, about one in fourresidents of New Orleans residents were homeowners. The homeownership rate dropped suddenlyafter the storm in both inundated and non-inundated Blocks, but fell further and recovered lessquickly for inundated residents. As shown in Figure 4, one year after the storm, the homeownershiprate had fallen by an additional 5.7 percentage points (29 percent) among inundated residentscompared to non-inundated residents (who themselves experienced a 2.3 percentage point decline).The gap has slowly narrowed in the intervening decade, but remains around 2 percentage points tenyears after the storm. Restricting the sample to pre-Katrina homeowners, the hurricane’s impacton homeownership was even more striking, decreasing homeownership by 25.6 percentage pointsin the short run and 9 percentage points ten years later.
Despite widespread home loss following Hurricane Katrina, the storm had no measurable short-or long-term impact on the proportion of homeowners facing home-secured debt insolvency orforeclosure, though foreclosure was somewhat less common in inundated neighborhoods duringthe Great Recession.21 Nevertheless, our analysis of homeownership shows that inundated NewOrleans residents faced a substantial and persistent negative short-term homeownership shock after
21The decline in foreclosure (conditional on homeownership) during the housing crash may reflect New Orleanssubprime homeowners having already lost their homes, by means other than foreclosure, in 2005.
12

Hurricane Katrina.In addition to the effect on homeownership, we also find substantial effects of Hurricane Kat-
rina on the household composition of inundated residents. Figure 5 shows that the average house-hold size of inundated New Orleans residents, which was 2.84 adults prior to Hurricane Katrina,declined by about 0.16 adults (6 percent) immediately following the storm and slowly recovered toa null effect ten years later. While the welfare effects of this change are unclear–shrinking house-hold sizes could reflect either the dissolution or the emancipation of nuclear families, or a slowerrate of forming or joining multi-person households or extended family households–this is a sub-stantial short-term change in living arrangements caused by Hurricane Katrina. Interestingly, Fig-ure 5 also shows that the decline in household size does not reflect a decline in partner-households(defined as any household with exactly two covered adult members). Instead, we find strong ev-idence of a rise in the proportion of single-adult households at the expense of larger households;the proportion of inundated residents living alone increased by 20 percent (5.4 percentage points)immediately after the storm relative to non-inundated residents, though the two slowly convergeduntil 2016.
We have shown in this section that inundated residents of New Orleans faced a short-term in-crease in mobility and decrease in household size relative to their non-inundated neighbors afterHurricane Katrina, but had fully recovered from those changes in the decade after the storm. Morepressingly, however, inundated residents also faced a persistent negative shock to homeownershipand credit scores along with substantial permanent changes in their residential location. In thissection, we exploit the massive size of our dataset by cutting our sample into six subpopulations ofinterest: youth and elderly residents, under age 40 and over age 60 in 2005; low- and high-incomeindividuals, proxied by having an Equifax risk score below 610 or above 735 (the first and secondterciles in New Orleans); and the residents of predominantly-white or predominantly-black neigh-borhoods (designated at the Census Block level). We estimate the impact of Hurricane Katrinaon each subpopulation by modeling each subpopulation independently; the estimates presentedbelow should be interpreted as the impact of the storm on members of a subpopulation relative tonon-inundated members of that same sub-population.
Tables 3-5 show treatment heterogeneity for a selection of outcomes of interest one, five, andten years after Hurricane Katrina. Table 3 shows that Hurricane Katrina increased elderly NewOrleans residents’ likelihood of leaving New Orleans more than it did youth residents’; ten yearsafter the storm, inundated elderly residents were 13 percentage points less likely to reside in NewOrleans than non-inundated elderly residents, while the inundation gap for youth residents was astatistically-insignificant 1.4 percentage points. Youth residents also faced a more negative con-sumption shock in the medium-term following the storm, while elderly residents actually faced asubstantial positive consumption shock; however, the gap between the two had shrunk somewhatby 2016. In general, Table 3 provides evidence that elderly New Orleans residents were moresuccessful in recovering from Hurricane Katrina than youths, possibly in part by leaving the city.
Treatment heterogeneity by credit score follows an expected pattern; Table 4 shows that higher-
13
income residents were more likely to leave New Orleans following the storm, but were also morelikely to lose homeownership and experience a credit score decline (since they had far more tolose). The homeownership gap fails to dissipate, but higher-income residents’ credit scores hadrecovered to the same decline experienced by lower-income residents by 2016. Both groups facedsimilar impacts in consumption behavior.
Finally, Table 5 displays heterogeneity in Hurricane Katrina’s treatment effect across white andblack New Orleans neighborhoods. Despite sufficient power to detect relatively-small differencein treatment effect, as we did in our other subsample analysis, we find little evidence of treatmenteffect heterogeneity across these groups, though residents of white New Orleans neighborhoods arefar more likely to have left the city following the storm (15.2 vs. 6.6 percentage points ten yearsafter the storm). Residents of black neighborhoods appear to have faced a smaller negative impacton homeownership than residents of white neighborhoods, while the latter may have experienceda larger decline in consumer debt insolvency, but both differences are statistically insignificant.While these findings are agnostic on whether black residents of New Orleans (in both inundatedand non-inundated Blocks) received differential support compared to white residents, they suggestthat support targeted at inundated communities similarly-affected white and black New Orleansneighborhoods.
Appendix Figures A1-A6 display event study figures for these selected outcomes of interest foreach of the six subpopulations.
6 Five States
In the previous section, we discussed the relative ‘intensive’ effectiveness of federal and privateinsurance programs in mitigating long-term negative outcomes for inundated residents of NewOrleans relative to their non-inundated neighbors, but found that inundated residents experiencedpersistent negative shocks in credit score and homeownership and increased outmigration. In thissection, we turn to a broader analysis of the net Hurricane Katrina shock, comparing residents ofthe three-state GO Zone, who bore the brunt of Hurricane Katrina’s damage but were eligible for awide variety of government insurance programs, to residents of the Five States region surroundingthe GO Zone. These ‘extensive-margin’ results can be understood to describe insurance programs’broad effectiveness in providing assistance to all individuals impacted by Hurricane Katrina, notonly those most-severely impacted. As effectiveness may vary with the severity of the storm’slocal impact, and given the city’s unique circumstances and larger size of the policy response, weexclude New Orleans residents from the Five States analysis.
Some federal GO Zone benefits were available to workers who were employed in the GO Zone,whether or not they resided within it; because we cannot observe work locations, to the (likely-small) degree that GO Zone workers are not residents of the GO Zone, our estimates of the trueeffect of the GO Zone programs will be biased towards finding a zero impact. As above, wecompare GO Zone residents to their counterparts along a wide variety of socioeconomic outcomes
14

of interest.We begin with a comparison of the income and consumption behavior of Five States residents.
Figure 6 shows that GO Zone residents experienced a small but immediate, persistent, and highlystatistically significant rise in risk score by between 1 and 2 points, with the fraction of residentsholding subprime risk scores declining about 1.5 percentage points compared to comparable FiveStates residents. We find higher-magnitude effects on consumer credit balances: short-term av-erage consumer debt balances fell by about $100 for GO Zone residents, but the consumptiondecline begins to attenuate after 2009, and by 2016 the Hurricane’s impact on GO Zone residentshas become large and positive, with an additional $160 per month in consumer debt (about 4 per-cent) compared to other Five States residents. As with inundated New Orleans residents, HurricaneKatrina increased GO Zone residents’ average auto debt (by around $400); in addition to a con-sumption boost, this increase may reflect more frequent replacement of damaged cars with newcars after the storm among GO Zone residents.22
Figure 6 also shows substantial long-term positive effects of living in the GO Zone on deroga-tory credit behavior. Hurricane Katrina (and the associated policy response) made GO Zone resi-dents 0.4 and 0.6 net percentage points less likely to hold insolvent auto or consumer debt duringthe Great Recession, respectively, suggesting that they were more successful in weathering therecession than others in the Five States region (though these impacts attenuate by 2016). Theywere also substantially and persistently less likely to declare bankruptcy; the 0.4 percentage pointdecline constitutes a 25 percentage point decline relative to non-GO Zone residents. These results,along with the long-term increases in income and consumption, suggest substantial net financialbenefits of GO Zone residents from Hurricane Katrina when compared to outcomes of similar res-idents outside the GO Zone, which (given the singular destructiveness of the storm) can likely beattributed to governmental and private over-insurance.
Unlike inundated New Orleans residents, GO Zone residents’ mobility decisions were largelyunchanged by Hurricane Katrina. Figure 7 shows that the storm had no short-term effect on lo-cal or cross-state mobility, though we find some evidence that the storm decreases the likelihoodof GO Zone residents leaving the state years after the storm. This decline in mobility may havebeen related to homeownership benefits provided by GO Zone residency; Figure 8 shows that GOZone residents experienced substantial homeownership benefits in the long run. Immediately afterHurricane Katrina, homeownership in the GO Zone declined by 3.6 percentage points (12 percent,likely driven by coastal areas), but it rapidly recovered over the following few years; by 2016, GOZone residents were 1 percentage point more likely than other Five States residents to be home-owners, a three percent increase (though each year’s estimate is only statistically significant at the10 percent level). This result is driven by new homeowners who didn’t own homes before the hur-ricane; when restricting to pre-Katrina homeowners individuals, homeownership was unchangedin the long run when comparing residents inside and outside the GO Zone. These dynamics may
22Since GO Zone residents may be replacing older lower-debt cars with newer higher-debt cars, their net automo-bile wealth may be unchanged.
15
suggest an (unobserved) drop in GO Zone home prices. Moreover, GO Zone residents experiencedlarge short- and long-term declines in rates of home insolvency (around 1.5 percentage points) andforeclosure (around 0.8 percentage points), each of which constitutes a 25-40 percent decline intheir prevalence. Insurance programs, then, were extremely (and over-) successful in mitigatingthe potential long-term effects of Hurricane Katrina on homeownership (as experienced by inun-dated residents of New Orleans), instead yielding substantial and statistically significant benefitsto individuals impacted by the storm.
Unlike in the case of inundated New Orleans residents, we find no statistically-significant ev-idence of a change in long-term household size among GO Zone residents caused by HurricaneKatrina, though the proportion of partnerships appears to temporarily fall just after the hurricane.We find some evidence that Hurricane Katrina decreases the likelihood of parental coresidenceamong GO Zone residents in the short-term (by around 0.3 percentage points), another indicationof the minimal economic stress faced by those residents.
One possible extrapolation of the findings presented above is that individuals residing on theperiphery of the GO Zone, who likely faced minimal damage from Hurricane Katrina but werenevertheless eligible for governmental support as GO Zone residents, were able to leverage theirgeographic position to obtain substantial financial gains, while those on the GO Zone’s interior ex-perienced minimal net benefits. In order to test this hypothesis, we restrict our sample to residentsof GO Zone counties less than twenty-five miles away from a county outside the GO Zone (cen-troid to centroid), along with the parallel control group (residents of non-GO Zone counties within25 miles of a GO Zone county). We then conduct our analysis on this 40-mile-wide band aroundthe boundary of the Hurricane Katrina GO Zone (containing 17.8 percent of GO Zone residents).While the complete output from that analysis is available in the Appendix, along with the outputfrom alternative specifications (15- and 35-mile bandwidths), Figure 10 summarizes our findings.In particular, while Hurricane Katrina increased credit scores, decreased insolvency, and increasedconsumer credit balances among peripheral GO Zone residents, the magnitudes are similar to thoseestimated for the GO Zone as a whole, suggesting that peripheral residents cannot wholly accountfor the regional financial impact presented above. However, the peripheral GO Zone residents ex-perienced no increase in auto balances–likely because their cars were very unlikely to have beendamaged by the distant storm–and no increase in homeownership, suggesting that these effectsmust have been largely driven by residents closer to the GO Zone’s interior.
Appendix Figures A7-A12 and Appendix Tables A1-A3 show Hurricane Katrina’s effect onGO Zone outcomes by subpopulation. Youths tend to benefit more from GO Zone residence thanelderly residents, with the latter group failing to obtain any long-run increase in consumer debtor homeownership. The same dynamic is true for lower-income GO Zone residents, who obtainstatistically-significant increases in consumer debt and homeownership and decreases in parentalcoresidence (unlike higher-income residents). Outcomes for the residents of white and black neigh-borhoods are broadly similar and differences statistically-insignificant, though residents of whiteGO Zone neighborhoods receive a decline in consumer debt insolvency nor shared by residents of
16

black neighborhoods.
7 Post-Katrina Mobility
In the previous two sections, we have focused our analysis on two central populations that weredirectly impacted by Hurricane Katrina. In this section, we specifically consider the subset ofNew Orleans residents who evacuated the city following the storm, examining their migrationdecisions geographically. According to the US Census, nearly half of pre-Katrina New Orleansresidents no longer resided in (or had not yet returned to) that city two years after the storm (Vigdor2008). Analysis of the CPS shows that, of all Hurricane Katrina evacuees who had not returnedto their county of residence by the end of 2006, the largest proportion of them had moved toTexas, followed by Louisiana and then other states in the American south-east (Groen and Polivka2008). Figure 11 extends that analysis by mapping the location of the 11 percent of all pre-KatrinaNew Orleans metropolitan area residents who had fled New Orleans within a year of HurricaneKatrina and remained outside of New Orleans in 2016, ten years after the storm.23 By that year,around 13,000 New Orleans evacuees who had not returned to the city of New Orleans lived inTexas, with another 12,000 in Louisiana and more than 1,000 evacuees living in each of six othersouthern states, in addition to California.24
In order to estimate the geographic impact of Hurricane Katrina on inundated residents of NewOrleans, we extend our model above to estimate the increased likelihood with which inundatedresidents migrated to each of the 50 states. Since we focus on outmigration of those living in NewOrleans at the time of the storm, we must compress our analysis to a single difference, estimatingthe presence Msit of pre-Katrina residents in each state s and time t using a linear probabilitymodel of pre-Katrina socioeconomic characteristics and an inundation indicator:
Msit = α0st +Kiφst +∑
τ∈[2002,2005]∩Z
Xitα1τt + εit
estimated using weighted least squares with the same propensity score weights as used aboveand clustering errors by Census Block. While the unavailability of an estimate of pre-hurricanedifferences in long-run outmigration by inundation limits these estimates’ causal interpretation,the extensive financial control variables and propensity weights should absorb most relevant pre-hurricane differences. We estimate effects one, five, and ten years following Hurricane Katrina,without restricting the sample to individuals who evacuated New Orleans immediately after thestorm.
Table 6 shows the proportion of pre-Katrina New Orleans residents living in each of the top23About 23 percent of 2005 New Orleans residents no longer lived in New Orleans in 2016, unconditional on
evacuating the city between 2005 and 2006. The percent is calculated as a fraction of all individuals who remain inthe CCP in 2016; see Section 3.
24For analysis of the impact of these evacuees on the local economies to which they relocated, focusing on the cityof Houston, see McIntosh (2008) and De Silva et al (2010).
17
ten states to which they migrated one, five, and ten years after the storm, along with the estimatedincreased likelihood with which inundated residents moved to that state (in brackets). One yearafter the storm, Texas was by far the most likely state for New Orleans evacuees to reside in (aspreviously shown using the CPS; see, e.g., McIntosh (2008)), with 6.5 percent of New Orleans resi-dents having shifted their permanent address to that state. Inundated residents appear more than 50percent more likely to migrate to Texas, Georgia, Mississippi, Alabama, and Louisiana (excludingOrleans Parish) than non-inundated residents within a year after the storm, and remained more than30 percent more likely to have migrated to those states even ten years after the storm (by whichtime 8.6 percent of pre-Katrina New Orleans residents lived in Texas). Interestingly, inundated res-idents appear significantly less likely to have moved to distant states like North Carolina and NewYork ten years after Hurricane Katrina than non-inundated residents, and indeed were 33 percentless likely to have moved to any New England or Mid-Atlantic state (statistically significant at 1percent), perhaps another indicator of the long-term economic stress faced by inundated residents(even conditional on outmigration).
8 Conclusion
This study examines the net intensive impact of Hurricane Katrina on inundated residents of NewOrleans, the hurricane’s net extensive impact on a large federally-insured region surrounding NewOrleans, the breadth of those impacts across demographic groups, and the migration outcomes ofNew Orleans residents in the ten years following the storm. Each of these measured outcomescan be interpreted as the result of a large set of federal, state, and local policies implemented toinsure the ‘geographically-unlucky’ residents of the Gulf Coast following an unusually-damaginghurricane.
We find mixed evidence of these policies in New Orleans, with inundated residents havingachieved similar levels of financial distress and household size ten years after the hurricane, butalso find that inundated residents maintain lower credit scores and homeownership rates–and arefar less likely to remain in New Orleans–than their non-inundated neighbors. Outside of NewOrleans, we find substantial evidence of over-insurance, with program-eligible residents enjoyinghigher consumption and homeownership but far lower rates of bankruptcy and foreclosure ten yearsafter the storm (despite facing more direct hurricane damage than the more-distant comparisongroup). These effects appear to have been magnified by the Great Recession, with Gulf Coastresidents appearing to enjoy effective ‘recession insurance’ in the name of hurricane insurance inthe late 2000s. While older, higher-income, and white residents of New Orleans were more likelyto evacuate the city following the storm, we find little evidence of differential policy treatment byrace within New Orleans, and find that the broader region’s over-insurance most benefited youngerand lower-income residents. Finally, we find that inundated New Orleans residents who havemoved out of the city were more likely to remain in Louisiana and the surrounding states, whilenon-inundated residents were more likely to move to the Northeast, suggesting that mobility may
18

not have provided substantial long-run benefits to inundated residents.Our study shares a number of limitations with earlier studies. Our intensive and extensive
analysis is unable to separately identify common or spillover effects, the presence of which woulddownwardly bias our estimates. Our subpopulation analysis estimates marginal within-group ef-fects of the hurricane, with data limitations prohibiting the identification of cross-group differencesin the hurricane’s impact (despite their being of substantial policy interest, especially regardingrace). Since we do not observe residents’ program-specific eligibility or participation, we cannotidentify the treatment effect of individual post-Katrina policies. Perhaps most pressingly, we areunable to define the welfare impact of the storm or its subsequent policy response, instead onlyobserving a large number of social and financial indicators that provide proxies for Gulf Coastresidents’ post-hurricane welfare. We leave the resolution and transcendence of these limitationsto future research.
19

ReferencesAlbanesi, Stefania and Jaromir Nosal. 2014. “Insolvency
after the 2005 bankruptcy reform.” Federal ReserveBank of New York Staff Reports 725.
Atienza, Josefina, Steven Lawrence, and Reina Mukai.2007. Giving in the aftermath of the Gulf Coasthurricanes. New York: The Foundation Center. URLLink.
Blake, Eric and Ethan Gibney. 2011. “The deadli-est, costliest, and most intense United States trop-ical cyclones from 1851 to 2010 (and other fre-quently requested hurricane facts).” NOAA TechnicalMemorandum NWS NHC-6. URL Link.
Bleemer, Zach, Meta Brown, Donghoon Lee, and Wilbertvan der Klaauw. 2014. “Debt, jobs, or housing: what’skeeping Millennials at home?” Federal Reserve Bankof New York Staff Reports 700.
Boyd, Eugene. 2011. “Community developmentblock grant funds in disaster relief and recovery.”Congressional Research Service Reports for Congress7-5700. URL Link.
Brown, Meta, Andrew Haughwout, Donghoon Lee, andWilbert van der Klaauw. 2013. “Do we know what weowe? A comparison of borrower- and lender-reportedconsumer debt.” .
De Silva, Dakshina G., Robert P. McComb, Young-KyuMoh, Anita R. Schiller, and Andres J. Vargas. 2010.“The effect of migration on wages: evidence froma natural experiment.” American Economic Review100 (2):321–326.
Dehejia, Rajeev H. and Sadek Wahba. 1999. “Causal ef-fects in nonexperimental studies: reevaluating the eval-uation of training programs.” Journal of the AmericanStatistical Association 94 (448):1053–1062.
Deryugina, Tatyana, Laura Kawano, and Steven Levitt.2014. “The economic impact of Hurricane Katrinaon its victims: evidence from individual tax returns.”National Bureau of Economic Research Working Paper20713.
Federal Emergency Management Agency (FEMA). 2013.“Louisiana recovery: eight years after Hurricanes Ka-trina and Rita.” FEMA News Releases DR-1603/07 -994. URL Link.
Fussell, Elizabeth, Narayan Sastry, and Mark VanLand-ingham. 2010. “Race, socioeconomic status, and re-turn migration to New Orleans after Hurricane Kat-rina.” Population and Environment 31 (1):20–42.
Gallagher, Justin and Daniel Hartley. 2014. “Householdfinance after a natural disaster: the case of HurricaneKatrina.” Fedreal Reserve Bank of Cleveland WorkingPapers 14-06.
Gesch, Dean. 2007. “Topography-based analysis of Hur-ricane Katrina inundation of New Orleans.” In Scienceand the storms: the USGS response to the hurricanesof 2005, edited by Gaye S. Farris. Reston, VA: US Ge-ological Survey, US Department of the Interior, 53–56.URL Link.
Government Accountability Office (GAO). 2008. “Gulf
Opportunity Zone.” GAO Report 08-913. URL Link.Groen, Jeffrey A. and Anne E. Polivka. 2008. “Hurricane
Katrina evacuees: who they are, where they are, andhow they are faring.” Monthly Labor Review March2008:32–51.
Henderson, Michael. 2015. Views of recovery: ten yearsafter Katrina and Rita. Baton Rouge: Louisiana StateUniversity Reilly Center for Media & Public Affairs.
Insurance Information Institute. 2010. Hurricane KatrinaFact File. New York: The Insurance Information Insti-tute. URL Link.
Internal Revenue Service (IRS). 2006. “Information fortaxpayers affected by Hurricanes Katrina, Rita, andWilma.” Internal Revenue Service Publications 4492.URL Link.
Kates, R. W., C. E. Colten, S. Laska, and S. P. Leather-man. 2006. “Reconstruction of New Orleans after Hur-ricane Katrina: A research perspective.” Proceedingsof the National Academy of Sciences 103 (40):14653–14660.
Lee, Donghood and Wilbert van der Klaauw. 2010. “Anintroduction to the FRBNY Consumer Credit Panel.”Federal Reserve Bank of New York Staff Reports 479.
McIntosh, Molly F. 2007. “Measuring the labor marketimpacts of Hurricane Katrina migration: evidence fromHouston, TX.” American Economic Review 98 (2):54–57.
Philip, Abby. Aug. 24, 2015. “White people in New Or-leans say they’re better off after Katrina. Black peopledon’t.” .
Rendall, Michael S. 2011. “Breakup of New Or-leans households after Hurricane Katrina.” Journal ofMarriage and Family 73 (3):654–668.
Rivlin, Gary. Aug. 18, 2015. “Why New Orleans’s blackresidents are still underwater after Katrina.” .
Rosenbam, Paul R. and Donald B. Rubin. 1983. “The cen-tral role of propensity score in observational studies forcausal effects.” Biometrika 70 (1):41–55.
Sastry, Narayan and Jesse Gregory. 2014. “The locationof displaced New Orleans residents in the year afterHurricane Katrina.” Demography 51 (3):753–775.
Smith, Adam B. and Richard W. Katz. 2013. “U.S.billion-dollar weather and climate disasters: datasources, trends, accuracy and biases.” Natural Hazards67 (2):387–410.
Townsend, Francis F. 2006. The federal response toHurricane Katrina: lessons learned. Washington, D.C.:The White House.
Vigdor, Jacob. 2007. “The Katrina effect: was there abright side to the evacuation of Greater New Orleans?”The B.E. Journal of Economic Analysis and Policy7 (1):64.
———. 2008. “The economic aftermath of Hurricane Ka-trina.” The Journal of Economic Perspectives 22 (4).
Zissimopoulos, Julie and Lynn A. Karoly. 2010. “Em-ployment and self-employment in the wake of Hurri-cane Katrina.” Demography 47 (2).
20

Table 1: Pre-Katrina Sample Characteristics and Inverse Propensity Weights
New Orleans Five StatesUnweighted Weighted Unweighted Weighted
Overall Treated Untreated Treated Untreated Overall Treated Untreated Treated Untreated
State Change (3 Years) .11 .11 .11 .112 .11 .11 .102 .113* .111 .11County Change (3 Years) .224 .224 .224 .228 .225 .258 .241 .267* .263 .259†Address Change (3 Years) .392 .399 .387† .395 .392 .449 .438 .455* .452 .45
Credit Score 656 633 668* 656 656 663 658 666* 663 663Subprime Credit Score .459 .554 .405* .456 .459 .422 .442 .412* .422 .422
Homeownership .246 .213 .266* .245 .246 .277 .269 .28* .277 .277Home Balance 16201 14086 17484* 16477 16329 17283 15920 17928* 17781 17308Has Derog. Home .0175 .0248 .0139* .0179 .0179 .0125 .0137 .012† .0127 .0126
Has Auto .228 .192 .25* .228 .228 .291 .278 .297* .291 .291Auto Balance 2697 2266 2959* 2682 2693 3685 3580 3734* 3698 3688Has Derog. Auto .0117 .0125 .0113 .0116 .0118 .0153 .0153 .0153 .0154 .0153
Has Consumer Debt .508 .452 .542* .511 .509 .524 .513 .53* .524 .524Consumer Balance 2633 2325 2819* 2666 2638 2912 2810 2960* 2928 2912Has Derog. Consumer Debt .106 .122 .0966* .105 .106 .0992 .103 .0973* .0991 .0992Consumer Derog. Balance 316 324 311 309 315 355 352 356 353 354
Household Size 2.84 2.86 2.83† 2.84 2.84 2.73 2.78 2.71* 2.73 2.73Live Alone .192 .208 .182* .193 .192 .192 .189 .193† .192 .192Live with Partner .301 .279 .315* .302 .301 .343 .328 .35* .343 .343
Bankruptcy Rate .0174 .0173 .0175 .0171 .0173 .0183 .0172 .0188* .0183 .0183Foreclosure Ratea .0187 .029 .0137* .0186 .0187 .0135 .0142 .0132 .0136 .0136
Number of Observations 38640 14584 24056 14583 24053 456267 146557 309710 146553 309705
Weighted and unweighted average values by group and treatment. Inverse propensity weights generated from first-stage logit; see paper. T-tests by treatment (inundation or withinGO Zone); * 1%, † 5%. Source: FRBNY Consumer Credit Panel.a Foreclosure rate is conditional on homeownership.
21

Table 2: Sample Characteristics Pre-Katrina by Demographic Group
New Orleans Five StatesBy Age By Income By Race By Age By Income By Race
18–40 60+ Low High White Black 18–40 60+ Low High White Black
Address Change (3 Years) .608 .386* .518 .376* .437 .407* .552 .322* .445 .315* .35 .395*State Change (3 Years) .175 .0941* .116 .0985* .119 .0947* .194 .0764* .111 .0897* .0982 .102*County Change (3 Years) .361 .263* .251 .245* .255 .226* .329 .221* .215 .212* .199 .224*
Credit Score 618 723* 540 782* 691 600* 610 712* 539 783* 706 600*Subprime Credit Score .588 .197* 1 0 .31 .692* .63 .245* 1 0 .248 .698*
Homeownership .23 .163* .188 .288* .33 .147* .179 .151* .171 .253* .309 .167*Home Bal. 16576 7345* 9759 19020* 21659 5566* 13710 6421* 9034 15979* 21854 7169*Has Derog. Home .0159 .00666* .0564 0* .00879 .0253* .0201 .013* .0745 0* .00765 .0364*
Has Auto .344 .141* .327 .199* .307 .201* .267 .109* .256 .15* .249 .184*Auto Bal. 4050 1502* 3534 2372* 3748 2146* 3042 1145* 2725 1688* 2911 2010*Has Derog. Auto .0242 .00471* .0499 0* .0113 .0247* .0168 .00343* .0333 0* .00543 .0176*
Has Consumer Debt .653 .476* .718 .516* .667 .496* .602 .462* .659 .49* .68 .493*Consumer Bal. 2972 2113* 3522 1926* 3817 2095* 2536 2024* 2916 1820* 3814 2035*Has Derog. Consumer Debt .191 .062* .439 0* .105 .228* .186 .068* .406 0* .0787 .216*Derog. Consumer Bal. 397 186* 1114 .148* 299 449* 369 171* 926 .0010* 222 419*
Household Size 2.83 2.72* 2.95 2.63* 2.64 3.14* 2.86 2.82* 2.96 2.7* 2.73 3.01*Live Alone .199 .205* .205 .191* .174 .204* .211 .188* .208 .188* .163 .195*Live with a Partner .316 .345* .274 .386* .385 .239* .281 .311* .257 .345* .353 .251*
Bankruptcy Rate .0174 .00962* .0353 .00109* .0182 .0175 .0187 .00792* .0346 .0010* .0137 .0199Foreclosure Ratea .0157 .00894* .0583 0* .0101 .0321* .0205 .0151* .0745 0* .00743 .0385*
Observations 692373 700352 626980 913502 1105712 154481 12525 12251 12887 15300 14361 11519
Unweighted average values by group and subgroup. High (low) income is defined as being in the top (bottom) Equifax riskscore tercile, with break point at 735 (610). Race is definedas individuals living in Census blocks in which, as of the 2000 Census, at least 75 percent of residents were white or black. T-tests within subgroups; * 1%, † 5%. Source: FRBNYConsumer Credit Panel.a Foreclosure rate is conditional on homeownership.
22

Figure 1a: GO Zone in the Five States Region, by County
The ‘Five States’ region includes the portions of Texas, Louisiana, Mississippi, Alabama, and Florida within fourdegrees longitude of the Gulf Opportunity (GO) Zone defined by the GO Zone Act of 2005. The region includes 401counties, about 20 percent of which were in the GO Zone. Source: The Gulf Opportunity Zone Act of 2005.
Figure 1b: Inundation Region of Orleans Parish, by Census Tract
For reference, the most-populous area of Orleans Parish is the western portion of the city, directly below LakePontchartain and above the Mississippi River. In 2005, there were about 7,200 Census Blocks in New Orleans, halfof which were inundated. Source: GCR and Associates, Inc.; available from RAND.
23

Figure 2: Income and Consumption Outcomes, New Orleans
(a) Credit Score
−10
−5
0
5
2000 2004 2008 2012 2016Year
(b) Auto Insolvency
−.005
0
.005
.01
.015
.02
2000 2004 2008 2012 2016Year
(c) Consumer Debt Insolvency
−.02
−.01
0
.01
.02
.03
2000 2004 2008 2012 2016Year
(d) Bankruptcy
−.005
0
.005
.01
2000 2004 2008 2012 2016Year
(e) Auto Balance
−200
0
200
400
600
2000 2004 2008 2012 2016Year
(f) Consumer Debt Balance
−600
−400
−200
0
200
2000 2004 2008 2012 2016Year
Event study effects around Hurricane Katrina. Standard errors clustered by Census tract. Credit Score measures anindividual’s Equifax risk score, which is comparable to a FICO credit score. Consumer debt includes credit and bankcards, retail debt, and consumer finance debt. A loan is insolvent if it is more than 90 days past due. Bankruptcyindicates chapter 7 and 11 filings in the past three years. Source: FRBNY Consumer Credit Panel.
Figure 3: Mobility Outcomes, New Orleans
(a) Pre-Katrina Address
−.05
0
.05
.1
.15
2000 2004 2008 2012 2016Year
(b) Pre-Katrina County
−.05
0
.05
.1
.15
2000 2004 2008 2012 2016Year
(c) Pre-Katrina State
−.02
0
.02
.04
.06
2000 2004 2008 2012 2016Year
(d) 3-Year Address Change
−.05
0
.05
.1
.15
2000 2004 2008 2012 2016Year
(e) 3-Year County Change
−.05
0
.05
.1
.15
2000 2004 2008 2012 2016Year
(f) 3-Year State Change
−.02
0
.02
.04
.06
2000 2004 2008 2012 2016Year
Event study effects around Hurricane Katrina. Standard errors clustered by Census tract. Top three figures showthe likelihood of having a different residence location than that of June 30 2005, while the bottom three figures showthe likelihood of having changed residence locations in the previous three years. Source: FRBNY Consumer CreditPanel.
24

Figure 4: Homeownership Outcomes, New Orleans
(a) Homeownership
−.08
−.06
−.04
−.02
0
.02
2000 2004 2008 2012 2016Year
(b) Home Insolvency
−.04
−.02
0
.02
.04
2000 2004 2008 2012 2016Year
(c) Homeownership (Condit. onPre-Katrina Owner)
−.3
−.2
−.1
0
.1
2000 2004 2008 2012 2016Year
(d) Foreclosure (Condit. on Pre-Katrina Owner)
−.03
−.02
−.01
0
.01
2000 2004 2008 2012 2016Year
Event study effects around Hurricane Katrina. Standard errors clustered by Census tract. Homeownership is definedas having an active mortgage. Home insolvency and foreclosure are conditional on homeownership. A loan is insolventif it is more than 90 days past due. Conditional homeownership restricts the sample to June 30 2005 homeowners.Theforeclosure indicator indicates having foreclosed on a mortgage in the past three years. Source: FRBNY ConsumerCredit Panel.
Figure 5: Household Composition Outcomes, New Orleans
(a) Adults in Household
−.2
−.1
0
.1
2000 2004 2008 2012 2016Year
(b) Only Adult
−.02
0
.02
.04
.06
2000 2004 2008 2012 2016Year
(c) Partnership
−.03
−.02
−.01
0
.01
.02
2000 2004 2008 2012 2016Year
(d) Live with Parents
−.04
−.02
0
.02
.04
2000 2004 2008 2012 2016Year
Event study effects around Hurricane Katrina. Standard errors clustered by Census tract. Adults in householdincludes all individuals covered by Equifax (see the paper). Partnership is defined as living with only one additionalcovered individual. Parental co-residence is defined as living with at least one individual between 16 and 45 yearsolder. Source: FRBNY Consumer Credit Panel.
25

Tab
le3:
TreatmentHeterog
eneity
byAge
inNew
Orleans
Outcome
OneYearAfter
FiveYears
After
Ten
Years
After
18-40
60+
p-V
alue
18-40
60+
p-Value
18-40
60+
p-Value
Consumer
Bal.
-114
.304
-33.85
20.52
1-226
.086
267.8
0.04
5-278
.287
143.4
0.18
7(94.1)
(82.7)
(166
.5)
(181
.0)
(206
.2)
(244
.4)
Derog
.Con
sumer
Bal.
48.70
45.22
0.92
22.43
38.40
0.62
622
.77
34.38
0.86
5(25.9)
(24.6)
(56.5)
(47.5)
(49.3)
(47.7)
ChangeCounty,Ever
0.06
90.10
80.01
50.04
80.14
80.00
00.01
40.13
00.00
0(0.01)
(0.01)
(0.01)
(0.01)
(0.01)
(0.02)
Cou
nty
Change(3
Years)
0.04
40.09
80.00
1-0.004
0.00
10.82
7-0.010
-0.017
0.74
9(0.01)
(0.01)
(0.02)
(0.01)
(0.02)
(0.01)
LivewithaPartner
-0.000
-0.020
0.32
5-0.020
-0.008
0.64
60.00
1-0.010
0.70
5(0.01)
(0.01)
(0.02)
(0.02)
(0.02)
(0.02)
Homeownership
-0.024
-0.032
0.49
9-0.010
-0.014
0.83
8-0.022
-0.000
0.31
5(0.01)
(0.01)
(0.01)
(0.01)
(0.01)
(0.02)
CreditScore
-4.091
-8.840
0.02
7-7.536
-5.233
0.53
6-10.46
7-2.287
0.06
3(1.5)
(1.6)
(2.4)
(2.8)
(2.6)
(3.5)
Wit
hin
-subgro
up
even
tst
udy
esti
mate
sof
the
impact
of
Hurr
icane
Katr
ina
on
the
state
doutc
om
eone,
five,
and
ten
yea
rsaft
erth
est
orm
.Subgro
ups
defi
ned
by
indiv
idual’s
yea
rsof
bir
th.
Sta
ndard
erro
rscl
ust
ered
by
county
.P
-valu
esfr
om
pair
wis
et-
test
sass
um
ing
indep
enden
ceacr
oss
subgro
up.
Sourc
e:F
RB
NY
Consu
mer
Cre
dit
Panel
.
26

Table
4:TreatmentHeterog
eneity
byCreditScore
inNew
Orleans
Outcome
OneYearAfter
FiveYears
After
Ten
Years
After
Low
CS
HighCS
p-Value
Low
CS
HighCS
p-Value
Low
CS
HighCS
p-Value
Con
sumer
Bal.
49.18
-16.32
00.59
1-35.52
3-107
.652
0.75
627
.52
-32.19
50.84
1(78.4)
(93.3)
(152
.0)
(175
.9)
(189
.4)
(230
.6)
Derog.Consumer
Bal.
41.59
8.31
0.36
3-20.01
0-13.51
70.92
1-29.74
67.05
0.56
9(35.5)
(8.9)
(60.3)
(24.5)
(58.9)
(26.3)
Chan
geCou
nty,Ever
0.04
60.15
30.00
00.05
50.11
90.00
10.02
70.09
90.00
1(0.01)
(0.01)
(0.01)
(0.01)
(0.01)
(0.01)
County
Chan
ge(3
Years)
0.04
50.13
00.00
00.01
2-0.001
0.49
9-0.009
-0.020
0.56
4(0.01)
(0.01)
(0.01)
(0.01)
(0.01)
(0.01)
LivewithaPartner
-0.005
-0.038
0.06
8-0.003
-0.028
0.31
20.01
8-0.009
0.29
3(0.01)
(0.01)
(0.02)
(0.02)
(0.02)
(0.02)
Homeownership
-0.015
-0.054
0.00
2-0.009
-0.052
0.01
40.00
2-0.034
0.07
4(0.01)
(0.01)
(0.01)
(0.01)
(0.01)
(0.02)
CreditScore
-2.764
-8.465
0.00
3-0.421
-5.924
0.05
3-3.524
-3.535
0.99
7(1.4)
(1.4)
(2.3)
(1.7)
(2.6)
(2.0)
Wit
hin
-subgro
up
even
tst
udy
esti
mate
sof
the
impact
of
Hurr
icane
Katr
ina
on
the
state
doutc
om
eone,
five,
and
ten
yea
rsaft
erth
est
orm
.Subgro
ups
defi
ned
by
Equif
ax
risk
score
terc
iles
in2005
New
Orl
eans
(hig
h-i
nco
me
isth
eto
pte
rcile;
low
-inco
me
isth
eb
ott
om
terc
ile)
.Sta
ndard
erro
rscl
ust
ered
by
Cen
sus
tract
.P
-valu
esfr
om
pair
wis
et-
test
sass
um
ing
indep
enden
ceacr
oss
subgro
up.
Sourc
e:F
RB
NY
Consu
mer
Cre
dit
Panel
.
27

Tab
le5:
TreatmentHeterog
eneity
byRacein
New
Orleans
Outcom
eOneYearAfter
FiveYears
After
Ten
Years
After
White
Black
p-V
alue
White
Black
p-V
alue
White
Black
p-Value
Con
sumer
Bal.
-77.73
7-70.38
80.97
3-104
.695
77.26
0.66
916
3.7
242.0
0.88
5(204
.2)
(63.3)
(395
.8)
(155
.2)
(506
.6)
(190
.4)
Derog.Consumer
Bal.
-18.87
628
.70
0.22
8-52.23
9-47.94
50.96
1-119
.342
22.10
0.05
4(31.5)
(23.7)
(71.5)
(50.0)
(58.1)
(44.8)
ChangeCounty,Ever
0.238
0.04
30.00
00.19
50.08
60.00
00.15
20.06
60.00
4(0.02)
(0.01)
(0.03)
(0.01)
(0.03)
(0.01)
County
Chan
ge(3
Years)
0.177
0.04
30.00
00.05
10.02
00.40
20.00
30.00
20.95
0(0.02)
(0.01)
(0.04)
(0.01)
(0.02)
(0.01)
LivewithaPartner
-0.029
-0.010
0.46
5-0.030
-0.006
0.42
50.02
00.00
70.67
9(0.02)
(0.01)
(0.03)
(0.02)
(0.03)
(0.02)
Hom
eownership
-0.046
-0.030
0.35
1-0.018
-0.012
0.79
7-0.017
0.01
10.29
4(0.01)
(0.01)
(0.02)
(0.01)
(0.02)
(0.01)
CreditScore
-5.082
-3.748
0.56
2-1.425
0.74
10.56
70.94
6-1.018
0.66
4(1.8)
(1.4)
(3.0)
(2.3)
(3.8)
(2.4)
Wit
hin
-subgro
up
even
tst
udy
esti
mate
sof
the
impact
of
Hurr
icane
Katr
ina
on
the
state
doutc
om
eone,
five,
and
ten
yea
rsaft
erth
est
orm
.Subgro
ups
defi
ned
by
indiv
iduals
’nei
ghb
orh
oods:
an
indiv
idual
isass
um
edto
be
of
ace
rtain
race
if75
per
cent
of
indiv
iduals
who
resi
ded
inth
eir
2005
Cen
sus
blo
ckb
elonged
toth
at
race
(as
of
the
2000
Cen
sus)
.Sta
ndard
erro
rscl
ust
ered
by
Cen
sus
tract
.P
-valu
esfr
om
pair
wis
et-
test
sass
um
ing
indep
enden
ceacr
oss
subgro
up.
Sourc
e:F
RB
NY
Consu
mer
Cre
dit
Panel
.
28

Figure 6: Income and Consumption Outcomes, Five States Region
(a) Credit Score
−2
0
2
4
6
2000 2004 2008 2012 2016Year
(b) Auto Insolvency
−.006
−.004
−.002
0
.002
.004
2000 2004 2008 2012 2016Year
(c) Consumer Debt Insolvency
−.015
−.01
−.005
0
.005
.01
2000 2004 2008 2012 2016Year
(d) Bankruptcy
−.006
−.004
−.002
0
.002
2000 2004 2008 2012 2016Year
(e) Auto Balance
−200
0
200
400
600
2000 2004 2008 2012 2016Year
(f) Consumer Debt Balance
−200
−100
0
100
200
300
2000 2004 2008 2012 2016Year
Event study effects around Hurricane Katrina. Standard errors clustered by county or parish. Credit Score measuresan individual’s Equifax risk score, which is comparable to a FICO credit score. Consumer debt includes credit andbank cards, retail debt, and consumer finance debt. A loan is insolvent if it is more than 90 days past due. Bankruptcyindicates chapter 7 and 11 filings in the past three years. Source: FRBNY Consumer Credit Panel.
Figure 7: Mobility Outcomes, Five States Region
(a) Pre-Katrina Address
−.03
−.02
−.01
0
.01
.02
2000 2004 2008 2012 2016Year
(b) Pre-Katrina County
−.06
−.04
−.02
0
.02
.04
2000 2004 2008 2012 2016Year
(c) Pre-Katrina State
−.02
−.01
0
.01
.02
2000 2004 2008 2012 2016Year
(d) 3-Year Address Change
−.02
−.01
0
.01
.02
2000 2004 2008 2012 2016Year
(e) 3-Year County Change
−.03
−.02
−.01
0
.01
2000 2004 2008 2012 2016Year
(f) 3-Year State Change
−.015
−.01
−.005
0
.005
.01
2000 2004 2008 2012 2016Year
Event study effects around Hurricane Katrina. Standard errors clustered by county or parish. Top three figures showthe likelihood of having a different residence location than that of June 30 2005, while the bottom three figures showthe likelihood of having changed residence locations in the previous three years. Source: FRBNY Consumer CreditPanel.
29

Figure 8: Homeownership Outcomes, Five States Region
(a) Homeownership
−.04
−.02
0
.02
2000 2004 2008 2012 2016Year
(b) Home Insolvency
−.03
−.02
−.01
0
2000 2004 2008 2012 2016Year
(c) Homeownership (Condit. onOwned)
−.15
−.1
−.05
0
.05
2000 2004 2008 2012 2016Year
(d) Foreclosure (Condit. onOwned)
−.02
−.015
−.01
−.005
0
2000 2004 2008 2012 2016Year
Event study effects around Hurricane Katrina. Standard errors clustered by Census tract. Homeownership is definedas having an active mortgage. Home insolvency and foreclosure are conditional on homeownership. A loan is insolventif it is more than 90 days past due. Conditional homeownership restricts the sample to June 30 2005 homeowners.Theforeclosure indicator indicates having foreclosed on a mortgage in the past three years. Source: FRBNY ConsumerCredit Panel.
Figure 9: Household Composition Outcomes, Five States Region
(a) Adults in Household
−.06
−.04
−.02
0
.02
.04
2000 2004 2008 2012 2016Year
(b) Only Adult
−.005
0
.005
.01
.015
2000 2004 2008 2012 2016Year
(c) Partnership
−.01
−.005
0
.005
.01
2000 2004 2008 2012 2016Year
(d) Live with Parents
−.01
−.005
0
.005
2000 2004 2008 2012 2016Year
Event study effects around Hurricane Katrina. Standard errors clustered by county or parish. Adults in householdincludes all individuals covered by Equifax (see the paper). Partnership is defined as living with only one additionalcovered individual. Parental co-residence is defined as living with at least one individual between 16 and 45 yearsolder. Source: FRBNY Consumer Credit Panel.
30

Figure 10: Outcomes Along the Outer Border of the GO Zone
(a) Credit Score
−5
0
5
10
2000 2004 2008 2012 2016Year
(b) Auto Insolvency
−.015
−.01
−.005
0
.005
2000 2004 2008 2012 2016Year
(c) Auto Balance
−600
−400
−200
0
200
400
2000 2004 2008 2012 2016Year
(d) Consumer Debt Balance
−400
−200
0
200
400
2000 2004 2008 2012 2016Year
(e) Pre-Katrina Address
−.1
−.05
0
.05
2000 2004 2008 2012 2016Year
(f) Homeownership
−.04
−.02
0
.02
2000 2004 2008 2012 2016Year
Event study effects around Hurricane Katrina. Standard errors clustered by county or parish. Sample defined asnon-Go-Zone (Go Zone) counties or parishes with centroids within 25 miles of the centroid of a county or parish (not)in the Go Zone. See series-specific notes above. Source: FRBNY Consumer Credit Panel.
Figure 11: Residence States of Hurricane Katrina Evacuees from New Orleans, March 2016
State map displaying the estimated number New Orleans evacuees living in each state (outside of New Orleans) tenyears after Hurricane Katrina. Evacuees are those who resided in New Orleans immediately prior to the hurricanebut outside New Orleans one year later. Source: FRBNY Consumer Credit Panel.
31
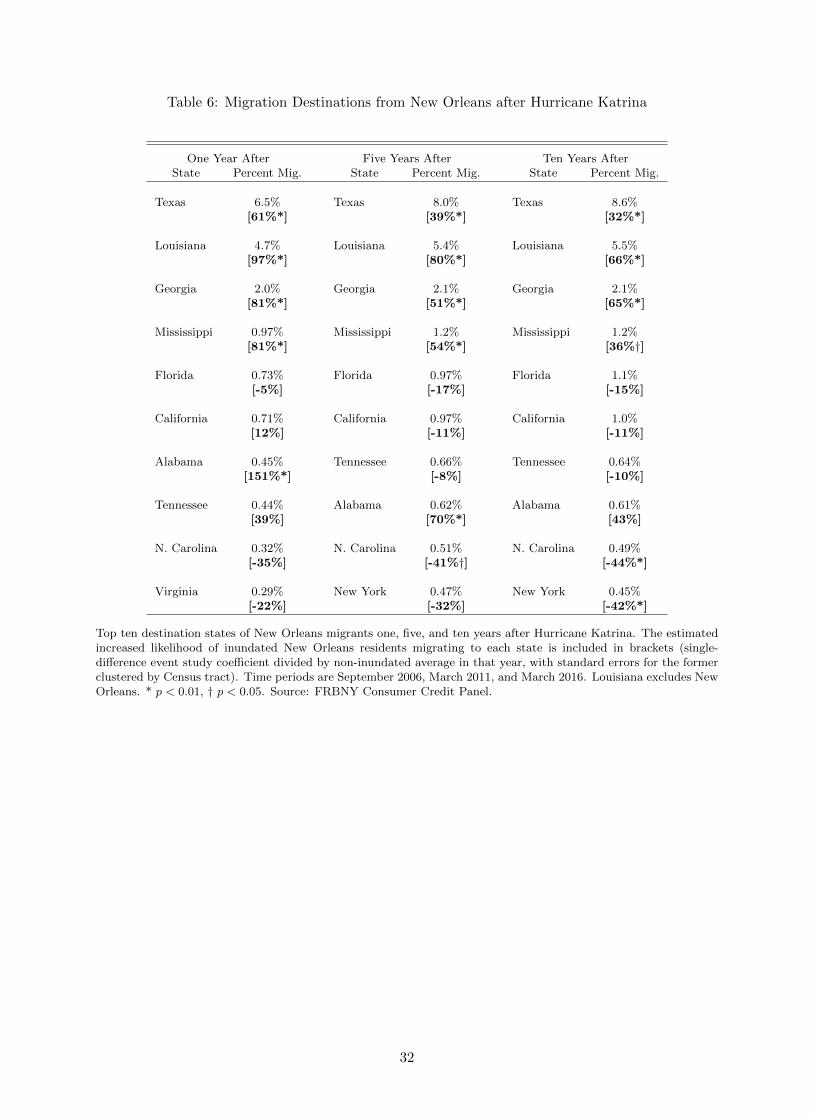
Table 6: Migration Destinations from New Orleans after Hurricane Katrina
One Year After Five Years After Ten Years AfterState Percent Mig. State Percent Mig. State Percent Mig.
Texas 6.5% Texas 8.0% Texas 8.6%[61%*] [39%*] [32%*]
Louisiana 4.7% Louisiana 5.4% Louisiana 5.5%[97%*] [80%*] [66%*]
Georgia 2.0% Georgia 2.1% Georgia 2.1%[81%*] [51%*] [65%*]
Mississippi 0.97% Mississippi 1.2% Mississippi 1.2%[81%*] [54%*] [36%†]
Florida 0.73% Florida 0.97% Florida 1.1%[-5%] [-17%] [-15%]
California 0.71% California 0.97% California 1.0%[12%] [-11%] [-11%]
Alabama 0.45% Tennessee 0.66% Tennessee 0.64%[151%*] [-8%] [-10%]
Tennessee 0.44% Alabama 0.62% Alabama 0.61%[39%] [70%*] [43%]
N. Carolina 0.32% N. Carolina 0.51% N. Carolina 0.49%[-35%] [-41%†] [-44%*]
Virginia 0.29% New York 0.47% New York 0.45%[-22%] [-32%] [-42%*]
Top ten destination states of New Orleans migrants one, five, and ten years after Hurricane Katrina. The estimatedincreased likelihood of inundated New Orleans residents migrating to each state is included in brackets (single-difference event study coefficient divided by non-inundated average in that year, with standard errors for the formerclustered by Census tract). Time periods are September 2006, March 2011, and March 2016. Louisiana excludes NewOrleans. * p < 0.01, † p < 0.05. Source: FRBNY Consumer Credit Panel.
32
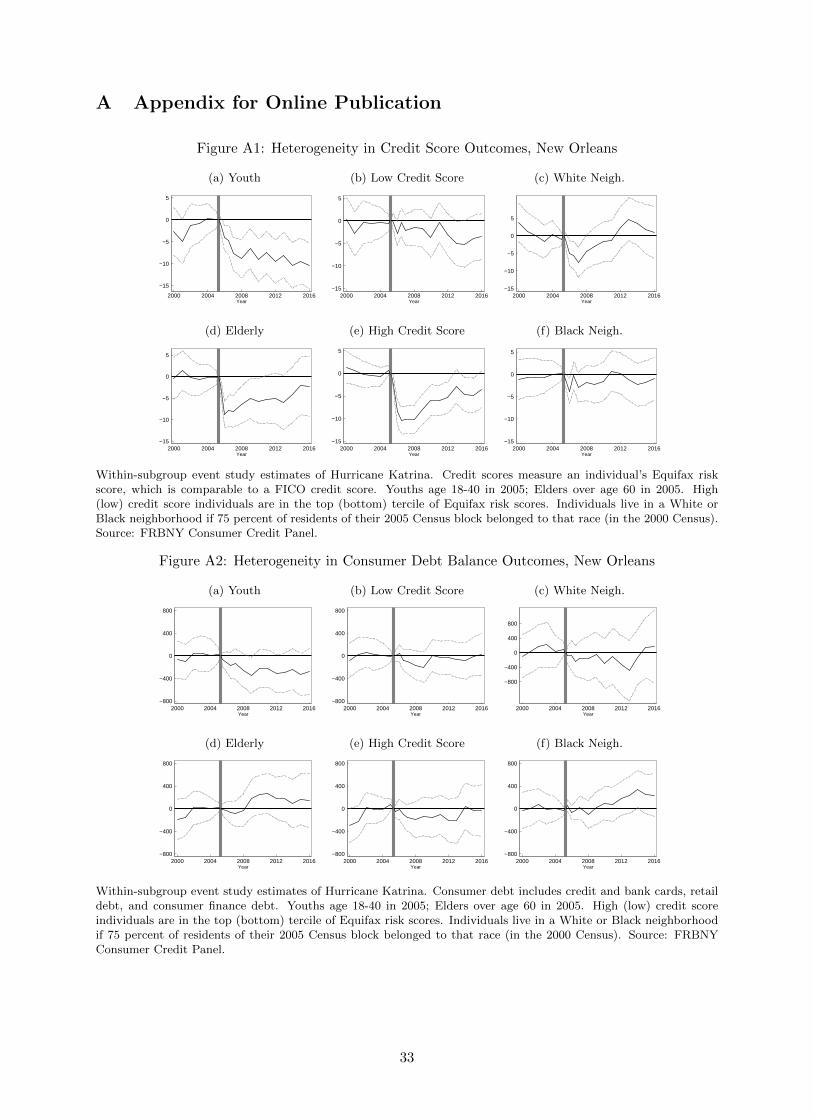
A Appendix for Online Publication
Figure A1: Heterogeneity in Credit Score Outcomes, New Orleans
(a) Youth
−15
−10
−5
0
5
2000 2004 2008 2012 2016Year
(b) Low Credit Score
−15
−10
−5
0
5
2000 2004 2008 2012 2016Year
(c) White Neigh.
−15
−10
−5
0
5
2000 2004 2008 2012 2016Year
(d) Elderly
−15
−10
−5
0
5
2000 2004 2008 2012 2016Year
(e) High Credit Score
−15
−10
−5
0
5
2000 2004 2008 2012 2016Year
(f) Black Neigh.
−15
−10
−5
0
5
2000 2004 2008 2012 2016Year
Within-subgroup event study estimates of Hurricane Katrina. Credit scores measure an individual’s Equifax riskscore, which is comparable to a FICO credit score. Youths age 18-40 in 2005; Elders over age 60 in 2005. High(low) credit score individuals are in the top (bottom) tercile of Equifax risk scores. Individuals live in a White orBlack neighborhood if 75 percent of residents of their 2005 Census block belonged to that race (in the 2000 Census).Source: FRBNY Consumer Credit Panel.
Figure A2: Heterogeneity in Consumer Debt Balance Outcomes, New Orleans
(a) Youth
−800
−400
0
400
800
2000 2004 2008 2012 2016Year
(b) Low Credit Score
−800
−400
0
400
800
2000 2004 2008 2012 2016Year
(c) White Neigh.
−800
−400
0
400
800
2000 2004 2008 2012 2016Year
(d) Elderly
−800
−400
0
400
800
2000 2004 2008 2012 2016Year
(e) High Credit Score
−800
−400
0
400
800
2000 2004 2008 2012 2016Year
(f) Black Neigh.
−800
−400
0
400
800
2000 2004 2008 2012 2016Year
Within-subgroup event study estimates of Hurricane Katrina. Consumer debt includes credit and bank cards, retaildebt, and consumer finance debt. Youths age 18-40 in 2005; Elders over age 60 in 2005. High (low) credit scoreindividuals are in the top (bottom) tercile of Equifax risk scores. Individuals live in a White or Black neighborhoodif 75 percent of residents of their 2005 Census block belonged to that race (in the 2000 Census). Source: FRBNYConsumer Credit Panel.
33
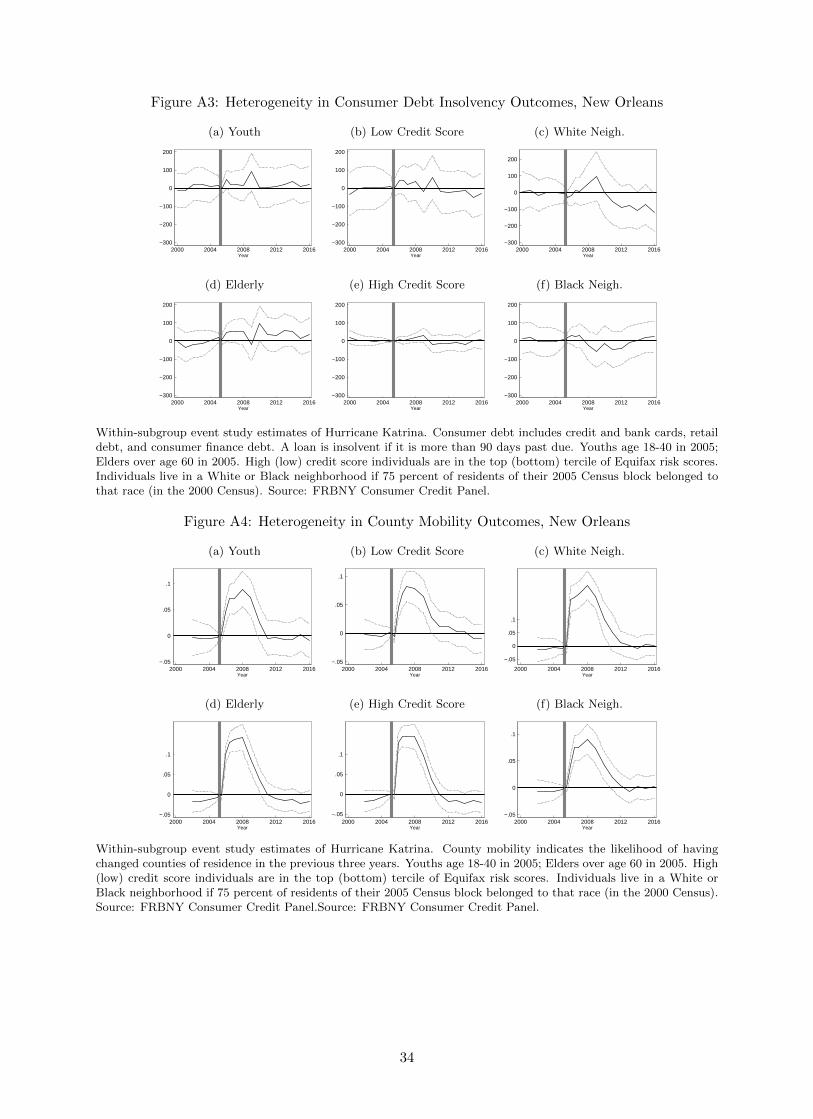
Figure A3: Heterogeneity in Consumer Debt Insolvency Outcomes, New Orleans
(a) Youth
−300
−200
−100
0
100
200
2000 2004 2008 2012 2016Year
(b) Low Credit Score
−300
−200
−100
0
100
200
2000 2004 2008 2012 2016Year
(c) White Neigh.
−300
−200
−100
0
100
200
2000 2004 2008 2012 2016Year
(d) Elderly
−300
−200
−100
0
100
200
2000 2004 2008 2012 2016Year
(e) High Credit Score
−300
−200
−100
0
100
200
2000 2004 2008 2012 2016Year
(f) Black Neigh.
−300
−200
−100
0
100
200
2000 2004 2008 2012 2016Year
Within-subgroup event study estimates of Hurricane Katrina. Consumer debt includes credit and bank cards, retaildebt, and consumer finance debt. A loan is insolvent if it is more than 90 days past due. Youths age 18-40 in 2005;Elders over age 60 in 2005. High (low) credit score individuals are in the top (bottom) tercile of Equifax risk scores.Individuals live in a White or Black neighborhood if 75 percent of residents of their 2005 Census block belonged tothat race (in the 2000 Census). Source: FRBNY Consumer Credit Panel.
Figure A4: Heterogeneity in County Mobility Outcomes, New Orleans
(a) Youth
−.05
0
.05
.1
2000 2004 2008 2012 2016Year
(b) Low Credit Score
−.05
0
.05
.1
2000 2004 2008 2012 2016Year
(c) White Neigh.
−.05
0
.05
.1
2000 2004 2008 2012 2016Year
(d) Elderly
−.05
0
.05
.1
2000 2004 2008 2012 2016Year
(e) High Credit Score
−.05
0
.05
.1
2000 2004 2008 2012 2016Year
(f) Black Neigh.
−.05
0
.05
.1
2000 2004 2008 2012 2016Year
Within-subgroup event study estimates of Hurricane Katrina. County mobility indicates the likelihood of havingchanged counties of residence in the previous three years. Youths age 18-40 in 2005; Elders over age 60 in 2005. High(low) credit score individuals are in the top (bottom) tercile of Equifax risk scores. Individuals live in a White orBlack neighborhood if 75 percent of residents of their 2005 Census block belonged to that race (in the 2000 Census).Source: FRBNY Consumer Credit Panel.Source: FRBNY Consumer Credit Panel.
34

Figure A5: Heterogeneity in Homeownership Outcomes, New Orleans
(a) Youth
−.08
−.06
−.04
−.02
0
.02
2000 2004 2008 2012 2016Year
(b) Low Credit Score
−.08
−.06
−.04
−.02
0
.02
2000 2004 2008 2012 2016Year
(c) White Neigh.
−.08
−.06
−.04
−.02
0
.02
2000 2004 2008 2012 2016Year
(d) Elderly
−.08
−.06
−.04
−.02
0
.02
2000 2004 2008 2012 2016Year
(e) High Credit Score
−.08
−.06
−.04
−.02
0
.02
2000 2004 2008 2012 2016Year
(f) Black Neigh.
−.08
−.06
−.04
−.02
0
.02
2000 2004 2008 2012 2016Year
Within-subgroup event study estimates of Hurricane Katrina. Homeownership is defined as having an active mortgage.Youths age 18-40 in 2005; Elders over age 60 in 2005. High (low) credit score individuals are in the top (bottom)tercile of Equifax risk scores. Individuals live in a White or Black neighborhood if 75 percent of residents of their 2005Census block belonged to that race (in the 2000 Census). Source: FRBNY Consumer Credit Panel.Source: FRBNYConsumer Credit Panel.
Figure A6: Heterogeneity in Parental Coresidence Outcomes, New Orleans
(a) Youth
−.02
0
.02
.04
.06
.08
.1
2000 2004 2008 2012 2016Year
(b) Low Credit Score
−.02
0
.02
.04
.06
.08
.1
2000 2004 2008 2012 2016Year
(c) White Neigh.
−.02
0
.02
.04
.06
.08
.1
2000 2004 2008 2012 2016Year
(d) Elderly
−.02
0
.02
.04
.06
.08
.1
2000 2004 2008 2012 2016Year
(e) High Credit Score
−.02
0
.02
.04
.06
.08
.1
2000 2004 2008 2012 2016Year
(f) Black Neigh.
−.02
0
.02
.04
.06
.08
.1
2000 2004 2008 2012 2016Year
Within-subgroup event study estimates of Hurricane Katrina. Parental co-residence is defined as living with at leastone individual between 16 and 45 years older. Youths age 18-40 in 2005; Elders over age 60 in 2005. High (low)credit score individuals are in the top (bottom) tercile of Equifax risk scores. Individuals live in a White or Blackneighborhood if 75 percent of residents of their 2005 Census block belonged to that race (in the 2000 Census). Source:FRBNY Consumer Credit Panel.
35

Figure A7: Heterogeneity in Credit Score Outcomes, Five States
(a) Youth
−1
1
3
5
2000 2004 2008 2012 2016Year
(b) Low Credit Score
−1
1
3
5
2000 2004 2008 2012 2016Year
(c) White Neigh.
−1
1
3
5
2000 2004 2008 2012 2016Year
(d) Elderly
−1
1
3
5
2000 2004 2008 2012 2016Year
(e) High Credit Score
−1
1
3
5
2000 2004 2008 2012 2016Year
(f) Black Neigh.
−1
1
3
5
2000 2004 2008 2012 2016Year
Within-subgroup event study estimates of Hurricane Katrina. Credit scores measure an individual’s Equifax riskscore, which is comparable to a FICO credit score. Youths age 18-40 in 2005; Elders over age 60 in 2005. High(low) credit score individuals are in the top (bottom) tercile of Equifax risk scores. Individuals live in a White orBlack neighborhood if 75 percent of residents of their 2005 Census block belonged to that race (in the 2000 Census).Source: FRBNY Consumer Credit Panel.
Figure A8: Heterogeneity in Consumer Debt Balance Outcomes, Five States
(a) Youth
−200
−100
0
100
200
300
2000 2004 2008 2012 2016Year
(b) Low Credit Score
−200
−100
0
100
200
300
2000 2004 2008 2012 2016Year
(c) White Neigh.
−200
−100
0
100
200
300
2000 2004 2008 2012 2016Year
(d) Elderly
−200
−100
0
100
200
300
2000 2004 2008 2012 2016Year
(e) High Credit Score
−200
−100
0
100
200
300
2000 2004 2008 2012 2016Year
(f) Black Neigh.
−200
−100
0
100
200
300
2000 2004 2008 2012 2016Year
Within-subgroup event study estimates of Hurricane Katrina. Consumer debt includes credit and bank cards, retaildebt, and consumer finance debt. Youths age 18-40 in 2005; Elders over age 60 in 2005. High (low) credit scoreindividuals are in the top (bottom) tercile of Equifax risk scores. Individuals live in a White or Black neighborhoodif 75 percent of residents of their 2005 Census block belonged to that race (in the 2000 Census). Source: FRBNYConsumer Credit Panel.
36

Figure A9: Heterogeneity in Consumer Debt Insolvency Outcomes, Five States
(a) Youth
−150
−100
−50
0
50
2000 2004 2008 2012 2016Year
(b) Low Credit Score
−150
−100
−50
0
50
2000 2004 2008 2012 2016Year
(c) White Neigh.
−150
−100
−50
0
50
2000 2004 2008 2012 2016Year
(d) Elderly
−150
−100
−50
0
50
2000 2004 2008 2012 2016Year
(e) High Credit Score
−150
−100
−50
0
50
2000 2004 2008 2012 2016Year
(f) Black Neigh.
−150
−100
−50
0
50
2000 2004 2008 2012 2016Year
Within-subgroup event study estimates of Hurricane Katrina. Consumer debt includes credit and bank cards, retaildebt, and consumer finance debt. A loan is insolvent if it is more than 90 days past due. Youths age 18-40 in 2005;Elders over age 60 in 2005. High (low) credit score individuals are in the top (bottom) tercile of Equifax risk scores.Individuals live in a White or Black neighborhood if 75 percent of residents of their 2005 Census block belonged tothat race (in the 2000 Census). Source: FRBNY Consumer Credit Panel.
Figure A10: Heterogeneity in County Mobility Outcomes, Five States
(a) Youth
−.02
0
.02
.04
.06
2000 2004 2008 2012 2016Year
(b) Low Credit Score
−.02
0
.02
.04
.06
2000 2004 2008 2012 2016Year
(c) White Neigh.
−.02
0
.02
.04
.06
2000 2004 2008 2012 2016Year
(d) Elderly
−.02
0
.02
.04
.06
2000 2004 2008 2012 2016Year
(e) High Credit Score
−.02
0
.02
.04
.06
2000 2004 2008 2012 2016Year
(f) Black Neigh.
−.02
0
.02
.04
.06
2000 2004 2008 2012 2016Year
Within-subgroup event study estimates of Hurricane Katrina. County mobility indicates the likelihood of havingchanged counties of residence in the previous three years. Youths age 18-40 in 2005; Elders over age 60 in 2005. High(low) credit score individuals are in the top (bottom) tercile of Equifax risk scores. Individuals live in a White orBlack neighborhood if 75 percent of residents of their 2005 Census block belonged to that race (in the 2000 Census).Source: FRBNY Consumer Credit Panel.
37

Figure A11: Heterogeneity in Homeownership Outcomes, Five States
(a) Youth
−.04
−.02
0
.02
2000 2004 2008 2012 2016Year
(b) Low Credit Score
−.04
−.02
0
.02
2000 2004 2008 2012 2016Year
(c) White Neigh.
−.04
−.02
0
.02
2000 2004 2008 2012 2016Year
(d) Elderly
−.04
−.02
0
.02
2000 2004 2008 2012 2016Year
(e) High Credit Score
−.04
−.02
0
.02
2000 2004 2008 2012 2016Year
(f) Black Neigh.
−.04
−.02
0
.02
2000 2004 2008 2012 2016Year
Within-subgroup event study estimates of Hurricane Katrina. Homeownership is defined as having an active mortgage.Youths age 18-40 in 2005; Elders over age 60 in 2005. High (low) credit score individuals are in the top (bottom)tercile of Equifax risk scores. Individuals live in a White or Black neighborhood if 75 percent of residents of their2005 Census block belonged to that race (in the 2000 Census). Source: FRBNY Consumer Credit Panel.
Figure A12: Heterogeneity in Parental Coresidence Outcomes, Five States
(a) Youth
−.01
−.005
0
.005
.01
.015
.02
2000 2004 2008 2012 2016Year
(b) Low Credit Score
−.01
−.005
0
.005
.01
.015
.02
2000 2004 2008 2012 2016Year
(c) White Neigh.
−.01
−.005
0
.005
.01
.015
.02
2000 2004 2008 2012 2016Year
(d) Elderly
−.01
−.005
0
.005
.01
.015
.02
2000 2004 2008 2012 2016Year
(e) High Credit Score
−.01
−.005
0
.005
.01
.015
.02
2000 2004 2008 2012 2016Year
(f) Black Neigh.
−.01
−.005
0
.005
.01
.015
.02
2000 2004 2008 2012 2016Year
Within-subgroup event study estimates of Hurricane Katrina. Parental co-residence is defined as living with at leastone individual between 16 and 45 years older. Youths age 18-40 in 2005; Elders over age 60 in 2005. High (low)credit score individuals are in the top (bottom) tercile of Equifax risk scores. Individuals live in a White or Blackneighborhood if 75 percent of residents of their 2005 Census block belonged to that race (in the 2000 Census). Source:FRBNY Consumer Credit Panel.
38

Table
A1:
TreatmentHeterog
eneity
byAge
intheFiveStatesregion
Outcome
OneYearAfter
FiveYears
After
Ten
Years
After
18-40
60+
p-V
alue
18-40
60+
p-V
alue
18-40
60+
p-Value
Con
sumer
Bal.
-86.18
5-33.43
80.20
318
.08
-8.633
0.62
117
3.3
28.94
0.08
4(39.5)
(12.6)
(34.9)
(41.2)
(62.5)
(55.3)
Derog.Consumer
Bal.
-17.43
7-12.39
50.54
2-20.12
4-28.96
00.66
90.57
9-15.54
60.39
2(7.9)
(2.6)
(18.4)
(9.5)
(13.1)
(13.5)
Chan
geCou
nty,Ever
-0.001
0.00
40.49
3-0.017
0.00
10.36
5-0.027
-0.005
0.33
8(0.01)
(0.00)
(0.02)
(0.01)
(0.02)
(0.01)
County
Chan
ge(3
Years)
-0.005
-0.002
0.53
8-0.012
-0.012
0.97
6-0.016
-0.013
0.81
0(0.00)
(0.00)
(0.01)
(0.01)
(0.01)
(0.01)
LivewithaPartner
-0.003
-0.007
0.22
50.00
2-0.001
0.54
30.00
00.00
80.27
4(0.00)
(0.00)
(0.00)
(0.00)
(0.00)
(0.01)
Hom
eownership
-0.033
-0.020
0.02
90.01
4-0.003
0.00
50.02
0-0.001
0.01
8(0.01)
(0.00)
(0.01)
(0.00)
(0.01)
(0.00)
CreditScore
2.76
0.34
10.00
01.58
1.20
0.78
91.56
0.42
00.68
6(0.35)
(0.24)
(1.2)
(0.69)
(2.5)
(1.2)
Wit
hin
-subgro
up
even
tst
udy
esti
mate
sof
the
impact
of
Hurr
icane
Katr
ina
on
the
state
doutc
om
eone,
five,
and
ten
yea
rsaft
erth
est
orm
.Subgro
ups
defi
ned
by
indiv
idual’s
yea
rsof
bir
th.
Sta
ndard
erro
rscl
ust
ered
by
county
.P
-valu
esfr
om
pair
wis
et-
test
sass
um
ing
indep
enden
ceacr
oss
subgro
up.
Sourc
e:F
RB
NY
Consu
mer
Cre
dit
Panel
.
39

Table
A2:
TreatmentHeterog
eneity
byCreditScore
intheFiveStatesregion
Outcome
OneYearAfter
FiveYears
After
Ten
Years
After
Low
CS
HighCS
p-Value
Low
CS
HighCS
p-Value
Low
CS
HighCS
p-Value
Con
sumer
Bal.
-38.42
9-57.24
60.67
111
0.4
-41.54
60.20
722
0.9
87.29
0.12
0(31.4)
(31.2)
(109
.9)
(49.2)
(65.8)
(55.3)
Derog.Consumer
Bal.
-40.369
-0.479
0.00
0-14.38
1-32.90
00.61
912
.41
-17.24
20.58
9(10.3)
(0.47)
(36.4)
(8.1)
(54.6)
(5.2)
Chan
geCou
nty,Ever
0.00
00.00
50.51
2-0.012
0.00
60.28
5-0.024
0.00
40.16
7(0.01)
(0.00)
(0.02)
(0.01)
(0.02)
(0.01)
County
Chan
ge(3
Years)
-0.003
-0.001
0.55
4-0.012
-0.008
0.75
2-0.015
-0.010
0.66
2(0.00)
(0.00)
(0.01)
(0.01)
(0.01)
(0.01)
LivewithaPartner
-0.005
-0.007
0.51
8-0.000
-0.001
0.83
1-0.002
0.00
40.31
4(0.00)
(0.00)
(0.00)
(0.00)
(0.00)
(0.00)
Homeownership
-0.031
-0.033
0.63
70.00
80.00
30.32
60.01
20.00
60.40
9(0.00)
(0.00)
(0.00)
(0.00)
(0.01)
(0.01)
CreditScore
3.87
-0.511
0.00
0-0.031
1.38
0.25
90.12
51.33
0.65
0(0.43)
(0.23)
(1.2)
(0.47)
(2.5)
(0.79)
Wit
hin
-subgro
up
even
tst
udy
esti
mate
sof
the
impact
of
Hurr
icane
Katr
ina
on
the
state
doutc
om
eone,
five,
and
ten
yea
rsaft
erth
est
orm
.Subgro
ups
defi
ned
by
cred
itsc
ore
terc
iles
in2005
New
Orl
eans
(hig
h-i
nco
me
isth
eto
pte
rcile;
low
-inco
me
isth
eb
ott
om
terc
ile)
.Sta
ndard
erro
rscl
ust
ered
by
Cen
sus
tract
.P
-valu
esfr
om
pair
wis
et-
test
sass
um
ing
indep
enden
ceacr
oss
subgro
up.
Sourc
e:F
RB
NY
Consu
mer
Cre
dit
Panel
.
40

Table
A3:
TreatmentHeterog
eneity
byRacein
theFiveStatesregion
Outcome
OneYearAfter
FiveYears
After
Ten
Years
After
White
Black
p-V
alue
White
Black
p-V
alue
White
Black
p-Value
Con
sumer
Bal.
-103
.362
-78.73
90.49
0-6.465
106.2
0.17
621
4.5
246.8
0.75
1(29.8)
(19.7)
(40.3)
(72.9)
(52.9)
(87.0)
Derog.Consumer
Bal.
-17.04
1-22.40
10.48
4-69.79
614
.92
0.00
2-17.09
912
.14
0.34
4(3.1)
(7.0)
(14.5)
(22.7)
(12.0)
(28.5)
Chan
geCou
nty,Ever
0.00
70.00
20.38
00.00
50.00
30.85
2-0.001
-0.004
0.85
5(0.00)
(0.00)
(0.01)
(0.01)
(0.01)
(0.02)
County
Chan
ge(3
Years)
0.00
1-0.002
0.52
4-0.009
0.00
50.26
7-0.013
-0.002
0.41
8(0.00)
(0.00)
(0.01)
(0.01)
(0.01)
(0.01)
LivewithaPartner
-0.007
-0.002
0.15
40.00
10.00
20.81
20.00
5-0.004
0.18
4(0.00)
(0.00)
(0.00)
(0.00)
(0.00)
(0.01)
Hom
eownership
-0.042
-0.023
0.00
00.00
90.00
60.62
50.01
70.01
10.44
1(0.00)
(0.00)
(0.00)
(0.00)
(0.01)
(0.01)
CreditScore
1.31
4.18
0.00
03.05
0.88
30.07
52.38
1.50
0.66
9(0.26)
(0.45)
(0.88)
(0.84)
(1.2)
(1.7)
Wit
hin
-subgro
up
even
tst
udy
esti
mate
sof
the
impact
of
Hurr
icane
Katr
ina
on
the
state
doutc
om
eone,
five,
and
ten
yea
rsaft
erth
est
orm
.Subgro
ups
defi
ned
by
indiv
iduals
’nei
ghb
orh
oods:
an
indiv
idual
isass
um
edto
be
of
ace
rtain
race
if75
per
cent
of
indiv
iduals
who
resi
ded
inth
eir
2005
Cen
sus
blo
ckb
elonged
toth
at
race
(as
of
the
2000
Cen
sus)
.Sta
ndard
erro
rscl
ust
ered
by
county
.P
-valu
esfr
om
pair
wis
et-
test
sass
um
ing
indep
enden
ceacr
oss
subgro
up.
Sourc
e:F
RB
NY
Consu
mer
Cre
dit
Panel
.
41

Figure A13: Income and Consumption Outcomes, 25-Mile GO Zone Boundary
(a) Credit Score
−5
0
5
10
2000 2004 2008 2012 2016Year
(b) Auto Insolvency
−.015
−.01
−.005
0
.005
2000 2004 2008 2012 2016Year
(c) Consumer Debt Insolvency
−.02
−.01
0
.01
.02
2000 2004 2008 2012 2016Year
(d) Bankruptcy
−.01
−.005
0
.005
.01
2000 2004 2008 2012 2016Year
(e) Auto Balance
−600
−400
−200
0
200
400
2000 2004 2008 2012 2016Year
(f) Consumer Debt Balance
−400
−200
0
200
400
2000 2004 2008 2012 2016Year
Event study effects around Hurricane Katrina within 25 miles of the GO Zone boundary. Standard errors clusteredby Census tract. Credit Score measures an individual’s Equifax risk score, which is comparable to a FICO creditscore. Consumer debt includes credit and bank cards, retail debt, and consumer finance debt. A loan is insolventif it is more than 90 days past due. Bankruptcy indicates chapter 7 and 11 filings in the past three years. Source:FRBNY Consumer Credit Panel.
Figure A14: Mobility Outcomes, 25-Mile GO Zone Boundary
(a) Pre-Katrina Address
−.1
−.05
0
.05
2000 2004 2008 2012 2016Year
(b) Pre-Katrina County
−.1
−.05
0
.05
.1
2000 2004 2008 2012 2016Year
(c) Pre-Katrina State
−.02
0
.02
.04
.06
2000 2004 2008 2012 2016Year
(d) 3-Year Address Change
−.1
−.05
0
.05
2000 2004 2008 2012 2016Year
(e) 3-Year County Change
−.02
0
.02
.04
2000 2004 2008 2012 2016Year
(f) 3-Year State Change
−.01
0
.01
.02
2000 2004 2008 2012 2016Year
Event study effects around Hurricane Katrina within 25 miles of the GO Zone boundary. Standard errors clusteredby Census tract. Top three figures show the likelihood of having a different residence location than that of June 302005, while the bottom three figures show the likelihood of having changed residence locations in the previous threeyears. Source: FRBNY Consumer Credit Panel.
42

Figure A15: Homeownership Outcomes, 25-Mile GO Zone Boundary
(a) Homeownership
−.04
−.02
0
.02
2000 2004 2008 2012 2016Year
(b) Home Insolvency
−.015
−.01
−.005
0
.005
2000 2004 2008 2012 2016Year
(c) Homeownership (Condit. onPre-Katrina Owner)
−.1
−.05
0
.05
.1
2000 2004 2008 2012 2016Year
(d) Foreclosure (Condit. on Pre-Katrina Owner)
−.015
−.01
−.005
0
.005
2000 2004 2008 2012 2016Year
Event study effects around Hurricane Katrina within 25 miles of the GO Zone boundary. Standard errors clustered byCensus tract. Homeownership is defined as having an active mortgage. A loan is insolvent if it is more than 90 dayspast due. Conditional homeownership restricts the sample to June 30 2005 homeowners.The foreclosure indicatorindicates having foreclosed on a mortgage in the past three years. Source: FRBNY Consumer Credit Panel.
Figure A16: Household Composition Outcomes, 25-Mile GO Zone Boundary
(a) Adults in Household
−.15
−.1
−.05
0
.05
2000 2004 2008 2012 2016Year
(b) Only Adult
−.02
0
.02
.04
2000 2004 2008 2012 2016Year
(c) Partnership
−.02
−.01
0
.01
.02
2000 2004 2008 2012 2016Year
(d) Live with Parents
−.02
−.01
0
.01
2000 2004 2008 2012 2016Year
Event study effects around Hurricane Katrina within 25 miles of the GO Zone boundary. Standard errors clusteredby Census tract. Adults in household includes all individuals covered by Equifax (see the paper). Partnership isdefined as living with only one additional covered individual. Parental co-residence is defined as living with at leastone individual between 16 and 45 years older. Source: FRBNY Consumer Credit Panel.
43