disability, utilization, and costs associated with ... · musculoskeletal conditions united states,...
TRANSCRIPT
Dlsabilii, Utilization, and Costs Associated Wfih Musculoskeletal Conditions United States, 1980 Series C, Analytical Report No. 5
—
,11
1-—
U.S. DEPARTMENT OF HEALTH AND HUMAN SERVICES
Published by
Public Health Service
National Center for Health Statistics
September 1986

Copyright Information
All material appearing in this report is in the public domain
and may be reproduced or copied without permission; citation
as to source, however, is appreciated.
Suggested Ciiation
Murt, H. A., Parsons, P.E., Harlan, W. R., et al.: Disability,
utilization, and costs associated with musculoskeletal
conditions, United States, 1980. National Medical Care Utilization and Expenditure Survey. Series C, Analytical
Report No. 5. DHHS Pub. No. 86-20405. National Center for
Health Statistics, Public Health Service. Washington. U.S.
Government Printing Office, Sept. 1986.
Library of Congress Cataloging-in-Publication Data
Disability, utilization, and costs
associated with musculoskeletal conditions, United
States, 1980.
(Series C, Analytical report; no. 5) (DHHS
publication ; no. (PHS) 66-20405
Written by: Hillary A. Murl and others.
Bibliography: p.
Supt. of Dots. no.: HE22.2614:5
1. Musculoskeletal systern-Diseasea-United States—
Statistics. 2. Medical care, Cost of—United States-
United States-Statistics. 3. Medical care-United
States-Utilization-Statistics. 4. Health surveys—
United States. 1. Murt, Hillary A. Il. National Center
for Health Statistics (U. S.) Ill. Series: National
medical care utilization and expenditure survey.
Series C, Anal~ical report ; no. 5. IV. Series:
DHHS publication ; no. (PHS) 86-20405. [DNLM: 1. Bone
Diseases-economics-United States-statistics.
2. Bone Diseases+ ccurrence+United States. 3. Health
Services-utilization-United States-statistics.
4. Muscular Diseases-economics-United States-
statistics. 5. Muscular Diseases-occurrenc*United
States. WE 16 D611]
RA645.M85D57 1986 338.4’33621’967 86-800142
ISBN O-8406-341-X
National Medical Care Utilization and Expenditure Survey
The National Medical Care Utilization and Expenditure Survey (NMCUES) is a unique source of detailed national estimates on the utilization of and expenditures for various types of medical care. NMCUES is designed to be directly responsive to the continuing need for statistical information
on health care expenditures associated with health services utilization for the entire U.S. population.
NMCUES will produce comparable estimates over time for evaluation of the impact of legislation and programs on health status, costs, utilization, and illness-related behavior in the medical care delivery system. In addition to national estimates for the civilian noninstitutionalized population, it will also provide separate estimates for the Medicaid-eligible
populations in four States. The first cycle of NMCUES, which covers calendar year
1980, was designed and conducted as a collaborative effort between the National Center for Health Statistics, Public Health Service, and the Office of Research and Demonstrations, Health Care Financing Administration. Data were obtained from three survey components. The first was a national household survey and the second was a survey of Medicaid enrollees in four States (California, Michigan, Texas, and New York). Both of these components involved five interviews over a period of 15 months to obtain information on medical
care utilization and expenditures and other health-related information. The third component was an administrative records survey that verified the eligibility status of respondents for the Medicare and Medicaid programs and supplemented the household data with claims data for the Medicare and Medicaid
populations. Data collection was accomplished by Research Triangle
Institute, Research Triangle Park, N. C., and its subcontractors, the National Opinion Research Center of the University of Chicago, Ill., and SysteMetrics, Inc., Berkeley, Calif., under Contract No. 233–79–2032.
Co-Project Officers for the Survey were Robert R. Fuchsberg of the National Center for Health Statistics (NCHS) and Allen Dobson of the Health Care Financing Administration (HCFA). Robert A. Wright of NCHS and Larry Corder of HCFA also had major responsibilities. Daniel G. Horvitz
of Research Triangle Institute was the Project Director primarily responsible for data collection, along with Associate Project Directors Esther Fleishman of the National Opinion Research
Center, Robert H. Thornton of Research Triangle Institute, and James S. Lubalin of SysteMetrics, Inc. Barbara Moser of Research Triangle Institute was the Project Director primarily responsible for data processing.
For sale by the Superintendent of Documents, U.S. Government Printing office Washington, D.C. 20402

Executive Summary . . . . . . . . . . . . . . . . . . . . . . . . . . . . . . . . . . . . . . . . . . . . . . . . . . . . . . . . 1
Introduction . . . . . . . . . . . . . . . . . . . . . . . . . . . . . . . . . . . . . . . . . . . . . . . . . . . . . . . . . . . . . 3
DefinitionofCondition Categories . . . . . . . . . . . . . . . . . . . . . . . . . . . . . . . . . . . . . . . . . . . . . . . . . 4 Sourcesand LimitationsofData . . . . . . . . . . . . . . . . . . . . . . . . . . . . . . . . . . . . . . . . . . . . . . . . . . 6
The National Medical Care Utilization and Expenditure Survey . . . . . . . . . . . . . . . . . . . . . . . . . . . . . . . 6 Public Use Tapes . . . . . . . . . . . . . . . . . . . . . . . . . . . . . . . . . . . . . . . . . . . . . . . . . . . . . . . 6
LimitationsofData . . . . . . . . . . . . . . . . . . . . . . . . . . . . . . . . . . . . . . . . . . . . . . . . . . . . . . . 6
Prevaienceand Demographic Characteristics . . . . . . . . . . . . . . . . . . . . . . . . . . . . . . . . . . . . . . . . . . . 9
Health and LimitationofActivities . . . . . . . . . . . . . . . . . . . . . . . . . . . . . . . . . . . . . . . . . . . . . . . . . 11 Functional Limitation and Perceived Health Status . . . . . . . . . . . . . . . . . . . . . . . . . . . . . . . . . . . . . . 11
Disability Daysand Condition-Related Disability . . . . . . . . . . . . . . . . . . . . . . . . . . . . . . . . . . . . . . . 12
lndirectCostsofMorbidity . . . . . . . . . . . . . . . . . . . . . . . . . . . . . . . . . . . . . . . . . . . . . . . . . . . 15
UtilizationofHealth Sewices . . . . . . . . . . . . . . . . . . . . . . . . . . . . . . . . . . . . . . . . . . . . . . . . . . . . 16 Ambulatory Care . . . . . . . . . . . . . . . . . . . . . . . . . . . . . . . . . . . . . . . . . . . . . . . . . . . . . . . . 16 Hospital Care . . . . . . . . . . . . . . . . . . . . . . . . . . . . . . . . . . . . . . . . . . . . . . . . . . . . . . . . . 19
Health Care Charges . . . . . . . . . . . . . . . . . . . . . . . . . . . . . . . . . . . . . . . . . . . . . . . . . . . . . . . . 20
Discussion . . . . . . . . . . . . . . . . . . . . . . . . . . . . . . . . . . . . . . . . . . . . . . . . . . . . . . . . . . . . . 24
References . . . . . . . . . . . . . . . . . . . . . . . . . . . . . . . . . . . . . . . . . . . . . . . . . . . . . . . . . . . . . 27 ListofDetailedTables . . . . . . . . . . . . . . . . . . . . . . . . . . . . . . . . . . . . . . . . . . . . . . . . . . . . . . . 28
Appendixes 1. Sample Design, DataCollection, and Processing . . . . . . . . . . . . . . . . . . . . . . . . . . . . . . . . . . . . . . . 42 lLDataModificationsto PubIic Use Files . . . . . . . . . . . . . . . . . . . . . . . . . . . . . . . . . . . . . . . . . . . . 48 111. Anal~lcal Strategies . . . . . . . . . . . . . . . . . . . . . . . . . . . . . . . . . . . . . . . . . . . . . . . . . . . . . . 50
lV. Sampling Errors . . . . . . . . . . . . . . . . . . . . . . . . . . . . . . . . . . . . . . . . . . . . . . . . . . . . . . . . 56 V. Definition of Terms.... . .. . . . . . . . . . . . . . . . . . . . . . . . . . . . . . . . . . . . . . . . . . . . . . . . . . . 62
ListofTextFgures
1. Total and condition-related disability days for persons with selected musculoskeletal conditions: United States,
1980 . . . . . . . . . . . . . . . . . . . . . . . . . . . . . . . . . . . . . . . . . . . . . . . . . . . . . . . . . . . . . . 12
2. Mean disability days forall persons and for persons with selected musculoskeletal conditions: United States, 1980 . . . . 14
3. All Iost productivity, and Iostproductivity attributed to selected musculoskeletal conditions, for employed persons and homemakers: UnitedStates,1980 . . . . . . . . . . . . . . . . . . . . . . . . . . . . . . . . . . . . . . . . . . . . . . 15
4. Total and condition-related ambulatory and hospital services for persons with selected musculoskeletal conditions:
United States, 1980 . . . . . . . . . . . . . . . . . . . . . . . . . . . . . . . . . . . . . . . . . . . . . . . . . . . . . . 16
5. Percent distributions of health care charges for all conditions and for selected musculoskeletal conditions, by typeof healthservice: UnitedStates,1980 . . . . . . . . . . . . . . . . . . . . . . . . . . . . . . . . . . . . . . . . . . . . . . 21
6. Charges and percent distribution of charges for treatment of musculoskeletal conditions, by source of payment: United States, 1980 . . . . . . . . . . . . . . . . . . . . . . . . . . . . . . . . . . . . . . . . . . . . . . . . . . . . . . 21
liatofTextTables
A. Number of persons, percent of population, and rate per 1,000 population with selected musculoskeletal conditions, bycondition: United States, 1980 . . . . . . . . . . . . . . . . . . . . . . . . . . . . . . . . . . . . . . . . . 9
B. Mean functional limitation score and percent distribution of all persons and of persons with selected musculoskeletal
conditions by perceived hea[th status, according to condition: United States, 1980 . . . . . . . . . . . . . . . . . . . . . 11
... 111

---
C. Percent distribution of total and condition-related disability days for persons with selected musculoskeletal conditions
by type of disability day, according to condition: United States, 1980 . . . . . . . . . . . . . . . . . . . . . . . . . . . .
D. Mean ambulato~ visits and percent of total visits for persons with selected musculoskeletal conditions, by type of visit
andcondition: United States, 1980 . . . . . . . . . . . . . . . . . . . . . . . . . . . . . . . . . . . . . . . . . . . . . .
E. Mean condition-related ambulatory visits and cumulative percent of condition-related visits for persons with selected
muscuioskeietai conditions, by condition: United States, 1980 . . . . . . . . . . . . . . . . . . . . . . . . . . . . . . . .
F. Mean condition-related visits for persons with selected musculoskeletal conditions who made 1 or more condition-
related ambulatory visits, by provider and condition: United States, 1980 . . . . . . . . . .,. . . . . . . . . . . . . . . .
G. Percent of persons with selected musculoskeletal conditions who made condition-related ambulatory visits to
nonphysicians, and mean condition-related visits, by number of physician visits and condition: United States,
1980 . . . . . . . . . . . . . . . . . . . . . . . . . . . . . . . . . . . . . . . . . . . . . . . . . . . . . . . . . . . . . .
H. Condition-related hospital utilization for persons with selected musculoskeletal conditions, by condition: United States,
1980 . . . . . . . . . . . . . . . . . . . . . . . . . . . . . . . . . . . . . . . . . . . . . . . . . . . . . . . . . . . . . .
J. Total charges and condition-related charges for persons with selected musculoskeletal conditions, by condition:
United States, 1980 . . . . . . . . . . . . . . . . . . . . . . . . . . . . . . . . . . . . . . . . . . . . . . . . . . . . . .
K. Condition-related per capita charges and percent of charges paid out of pocket for persons with selected
muscuioskeletal conditions, by type of health service and condition: United States,1980 . . . . . . . . . . . . . . . . . .
L. Condition-related per capita charges and cumulative percent of condition-related charges for persons with selected
musculoskeletai conditions, by condition: United States, 1980 . . . . . . . . . . . . . . . . . . . . . . . . . . . . . . . .
Symbols
Data not available
. . . Category not applicable
Quantity zero
0.0 Quantity more than zero but less than 0.05
t Sample size is less than 50
* Sample size is less than 25
13
17
17
18
19
19
20
22
22
iv

Disability, Utilization, and Costs Associated with Musculoskeletal Conditions By Hillary A. Mutt, University of Michigan, P. EllenParsons, National Center for Health Statistics, formerlyof the University of Michigan, William R. Harlan,J. William Thomas, James M. Lepkowski, KennethE. Guire, Sylvester Berki, and J. Richard Landis,University of Michigan
Executive Summary
In this report, data from the 1980 National Medical Care Utilization and Expenditure Survey are used to present health characteristics, types and quantities of services used, and the charges for these services for persons with musculoskeletal diseases. Slightly more than 44 million people, or 19.8 percent of the U.S. civilian noninstitutionalized population, were reported in the survey to have at least one musculoskeletal disorder. These data are generally consistent with those from other health surveys, which show that the prevalence of musculoskeletal disorders increases for successive age categories, that such disorders are more common among women than among men, and that they are less prevalent among black persons than among persons of other races.
In terms of both functional limitation and perceived health status, persons with musculoskeletal conditions are, with some notable exceptions, in relatively poor health. Persons having back problems in addition to problems with peripheral joints (such as the knee, hip, or shoulder) were more likely to rate their health as “fair” or “poor” compared with persons having only back problems or compared with persons in the civilian noninstitutionalized population as a whole. Musculoskeletal disorders accounted for a considerable proportion of all disability days reported by the total civiIian noninstitutionalized population: 13 percent of restricted-activity days, 8.8 percent of bed-disability days, and 11.2 percent of all work-ioss days were directly attributable to musculoskeletal conditions. The disabling effects of musculoskeletaI problems pose a significant economic burden; they accounted for a total of $3.9 billion in lost productivity costs during 1980 for employed persons in the work force and for homemakers.
For persons with musculoskeletal problems, the mean number of ambulatory visits per year was nearly twice the rate of 5.2 for the general civilian noninstitutionalized population. Of ambulatory visits made to all health care providers by persons with these conditions, 35.6 percent were related in some way to the treatment of their musculoskeletal problems. Musculoskeletal conditions are somewhat different from many other illnesses because
their treatment is within the professional domain of several types of health care providers. Approximately 13 percent of persons with any type of musculoskeletal disorder received care from chiropractors during the year and this figure rose to nearly 30 percent for back problems only. However, nearly 33 percent of persons with musculoskeletal problems made no visits for treatment of their condition. This relatively high percent can be explained in part by the wide availability of over-the-counter medications for the treatment of pain (pain being the most common symptom reported by persons with these conditions) and in part by the self-limiting nature of acute recurrent episodes of selected musculoskeletal problems. In addition, it may aIso reflect the inability of the health care system to provide successful treatment ofs ymptoms associated with musculoskeletal ailments.
Despite the fact that a relatively large proportion of care administered to patients with musculoskeletal problems was provided in ambulatory settings, approximately 59 percent of the charges generated by the treatment of musculoskeletal conditions were attributed to inpatient hospital care. Total charges generated by the treatment of these conditions amounted to more than $12 bilIion, which represented 8 percent of the Nation’s total health care costs for the civilian noninstitutionalized population in 1980. These charges of $12 billion are high relative to the low costs for each individual with a musculoskeletal problem because of the high prevalence of these disorders. More than 50 percent of persons with musculoskeletal problems generated condition-related per capita charges of less than $50 in 1980. About 23 percent of all charges for the treatment of musculoskeletzdconditions were paid directly by the recipients,
NOTE This report was prepared by the University of Michigan by contractual arrangement with the National Center for Health Statistics (Contract No. 282–83-2 1 I8). The authors are gratefuI for the support received during aII stages of the preparation of this document, both from colleagues at the University of Michigan and from the staff of the National Center for Health Statistics. At the University of Michigan, Sharon Stehouwer contributed greatly to initial analyses of the NMCUES data and to identification and correction of several problems encountered in the data base. Drs. Catherine McLaughlin, Richard L]chtenstein, and Leon Wyszewianski provided valuable
1

conceptual help. Quality secretarial support in the preparation of the many Grace Kovar, Special Assistant for Data Policy and Analysis. The authors tables included in the report came from Jan Feldman, Carolyn Parker, and are indebted to Dr. Robert J. Casady, Chief of the Statistical Methods Staff, Johanna Haaxma-Jurek. At the Institute for Social Research, University of for writing the major section in Appendix 1 in which the NMCUES survey Michigan, Nan Collier developed software for calculating sampling errors, design and estimation methodology are described. When potential errors and Judy Conners performed many of the analyses for generating sampling in the data were identified during the analyses, Robert Wright and Michele errors for national estimates. Chyba quickIy solved the problems. Editors in the Publications Branch pro-
Continual support and guidance were received from the National Center vided valuable assistance during all stages of this report, especially preparation for Health Statistics and in particular from the Project Officer, Dr. Mary of the detailed tables.

In the United States, musculoskeletal conditions exact a heavy toll in terms of disability days, including work-loss days, as well as in the use of medical services. Usually chronic and often disabling, they impose an economic burden on both affected individuals and society at large in lost earnings, lost productivity, and health care costs.
Diseases of the musculoskeletal system, including arthritis and lower back pain, constitute one of the most common categories of chronic health problems experiencedby people in the United States. Physican examination data from the National Health and Nutrition Examination Survey of 1971–75 (NHANES I) indicate that nea.dy 34.7 million people from 25–75 years of age (32.6 percent) are afflicted with symptoms involving the musculoskeletal system, including joint swelling, tenderness, limitation of motion, and pain during motion (Cunningham and Kelsey, 1984). According to Kelsey (1982), musculoskeletal problems rank first among disease groups in terms of their effect on the quality of life as measured by the magnitude of disability, impairment, handicap, and activity limitation.
Musculoskeletal conditions have been shown to rank second in total annual economic costs, which include health care expenditures and the costs of lost productivity. It has been estimated that musculoskeletal disorders cost the Nation about $20 billion (1972 dolh.rs) annually (Cooper and Rice, 1976). Although musculoskeletal diseases ranked only 10th among disease groups in health care costs in 1972, they ranked 1st in costs attributable to lost earnings and services from nonfatal disease (Kelsey, 1982). Musculoskeletal problems are prevalent among all age groups; however, they are most common, and often most severe, among the elderly. Because the number of elderly persons is expected to increase considerably over the next several decades, the impact of musculoskeletal problems in terms of both demand for health care services and economic costs is expected to become greater.
Knowing the frequency of occurrence and the demo-
graphic characteristics of persons with musculoskeletal impairments is an important first step in estimating the health care needs and costs associated with these conditions. National health surveys, such as those conducted periodically by the National Center for Health Statistics (NCHS), provide the data necessary to document the prevalence of musculoskeletal conditions, as well as the extent of disability and the use of medical services attributed to such conditions. Some of these surveys, such as NHANES I and II, are specificallyy designed for investigating the epidemiology of selected diseases, as well as the demographic characteristics of the population groups most affected. In contrast, data from the 1980 National Medical Care Utilization and Expenditure Survey (NMCUES) are best suited for analyzing the annual use of personal health services and related charges for individuals afflicted with musculoskeIetal problems, as well as the magnitude of disability associated with these conditions as many musculoskeletal problems are episodic in nature. These data are more likely to be complete and accurate because they were obtained from a panel survey, which provides for the collection of data at frequent intervals throughout the year, rather than from across-sectional survey.
This report is organized as follows. First the scope of the medical conditions is defined, and the NMCUES data and their limitations relevant to this report are de-scribed briefly. The next focus is on selected demo-graphic and socioeconomic characteristics of persons with reported musculoskeletal conditions, the influence of these conditions on disability and activity levels, and the costs associated with lost productivity. Patterns of health care utilization, including the use of nonphysician providers, are analyzed, and the cost consequences of musculoskeletal conditions are presented in terms of health care resources. The report concludes with Appendixes I–V, which contain information on the sample design; data collection, modification, and processing; analytical strategies; sampling errors; and definition of terms.
3

Definition of Condition Categories
The focus of this report is on chronic and acute recurrent musculoskeletal problems involving the joints and adjacent soft tissue and bone. There are both similarities and differences within this wide array of illnesses ranging from the more severely debilitating rheumatoid arthritis to nonspecific and often transient lower back pain. These conditions are similar in that they are not usually the direct cause of death, they are generally chronic in nature, and they are characterized by similar symptoms such as joint pain and swelling. Differences in this heterogeneous group of illnesses include a variability in prognosis and a varying degree of disability associated with each, ranging from little or no interference with daily activities to total incapacitation.
Only musculoskeletal problems that are chronic in nature are included in this report. Consequently, some conditions that are often classified as musculoskeletal problems are excluded. For example, acute traumatic injuries such as fractures, sprains, and dislocations are excluded because utilization patterns and levels of disability generated by these impairments are likely to differ considerably from the more chronic musculoskeletal problems. The chronic sequelae of traumatic injuries, on the other hand, are included in our definition of musculoskeletal problems. Congenital musculoskeletal defects and diseases of the connective tissue are excluded because of their small sample size.
This report examines both musculoskeletal conditions that are classified using the Ninth Revision of the International Classification of Diseases (ICD) (World Health Organization, 1977), as adapted for use with household surveys by the National Health Interview Survey (National Center for Health Statistics, 1979); and conditions classified as impairments. Impairments are classified by means of a special supplementary code used by NCHS rather than by an ICD code. For example, chronic lower back pain, unrelated to a specific disease, is an orthopedic impairment; whereas osteoarthritis is a musculoskeletal disease that is classified using an ICD code. Structural deformities, such as curvature of the spine, also are classified as impairments.
The focus of this report is on relatively broad categories of musculoskeletal disorders, rather than on specific musculoskeletal diseases such as rheumatoid arthritis or osteoarthritis. The principal reason for electing this approach is that with data reported by household
4
informants, such as in NMCUES, there is likely to be a certain amount of nonspecificity and misspecification of reported diseases.
Persons with any musculoskeletal problem included in this analysis are classified into one of the following three mutually exclusive categories:
(1) Joints only: Includes only those persons who have one or more musculoskeletal disorders of the joints such as the hip, knee, shoulder, or hand. This category is composed of persons having conditions with ICD–9 codes of 711–719, 725–729, and 735–739, and impairment codes of X73–79 and X84-89.
(2) Back only: Includes persons who have only back or spine disorders and no other musculoskeletal problems. This category is composed of persons having a condition with one of the following codes: ICD–9 codes of 720-724 and 737, and impairment codes of X70 and X80.
(3) Joints and back: Includes persons having at least one musculoskeletal disorder of the joints in addition to an impairment of the back or spine. Persons included in this group must have at least one code from each of the other two categories.
Joint impairments are separated from disorders of the back or spine so as not to obscure possible differences in patterns of careseeking and disability. Back problems, for example, are responsible for considerable absenteeism in the working population and are a flequent cause of activity limitation for persons under 45 years of age. Because many impairments of the back are occupationally related, preventive strategies that are appropriate for this set of conditions may not be applicable to other musculoskeletal problems. Furthermore, persons with back problems may be more likely to seek care from chiropractors, and this pattern of utilization would remain undetected if all musculoskeletal conditions were grouped into a single category. Designating a separate category for which individuals must have both a joint and a back disorder permits investigation of whether there are cumulative effects in terms of both medical care use and disability for individuals suffering multiple musculoskeletal impairments of the back, as well as of the peripheral joints. Although an argument can be made that multiple joint disorders may also be cumulative in terms of disability and medical care use, the ICD

coding scheme does not allow such a distinction in all cases. Arthritis, for example, may involve multiple joints, but the number of joints and the site are not always recorded.
5

Sources and Limitations of Data
The National Medical Care Utilization and Expenditure Survey
Data for this study come from the public use files of the National Medical Care Utilization and Expenditure Survey (NMCUES), a national household survey conducted from early 1980 through early 1981. Specific details concerning the sample design and data collection are outlined in Appendix I.
From February 1980 through April 1981, data on 17,123 persons in 6,798 families were collected at approximately 3-month intervals. A total of five interviews, two personal interviews followed by two telephone inter-views and a final personal interview, were conducted. At the conclusion of the first interview, survey participants were provided with a specially designed calendar-diary for recording data about medical events and costs in preparation for subsequent rounds of interviewing. Prior to each interview but the first, respondents were sent a summary sheet showing all medical events and costs reported in previous interviews.
Public Use Tapes
NMCUES public use tapes consist of six files: The person, medical visit, dental visit, hospital stay, pre-scribed medicines and other medical expenses, and condition files. The person file has one record for each of the 17,123 responding eligible persons with data describing the person’s demographic characteristics, health care coverage, employment, income, and usual source of care; numbers of visits, hospital admissions, and other medical events reported for 1980; total charges for each category of care; and limitations and disabilities, including identification of conditions. Data from the other five files, which have more detailed information about events summarized in the person file, can be linked to records in the person file through a unique identification number assigned to each person.
The medical visit file contains one record for every visit reported by people in the person file. A total of 86,594 visits are in the file, which includes visits to providers’ offices, hospital outpatient departments, and emergency rooms. Each record contains the identifying number of the person making the visit, the place of visit, type of physician or nonphysician seen, type of
services provided, conditions causing or associated with the visit, procedures performed during the visit, associated charges, and sources of payment. Similar data on dental visits and hospital admissions are provided in the dental visit and hospital stay files.
The prescribed medicines and other medical expenses file contains one record for each purchase of prescribed medications or other medical expense incurred by survey participants during 1980. Data include the identifying number of the person for whom the purchase was made, date of purchase, prescribed medicine codes, codes for conditions leading to the purchase or other expense, and associated charges and sources of payment.
If a medical condition caused any limitation in a person’s activities (such as staying in bed or staying home from work) or caused the person to seek medical care, then a condition record appears in the condition file. For each condition, the condition file record contains the identifying number of the person, codes from International Classification of Diseases (World Health Organization, 1977), dates of onset of illness, counts of visit types, prescribed medicines and other medical expenses, associated charges, and, if applicable, the reasons for not seeing a physician.
Limitations of Data
Estimates of prevalence—In NMCUES, a particular medical condition was noted only when it caused some type of disability or resulted in an ambulatory visit, hospital admission, purchase of a prescribed medication, or other encounter with the health care system. Hence, conditions that usually require treatment or cause some sort of disability will be better reported. In many cases the survey was administered to a household member other than the person with the musculoskeletal problem. Relying on proxy respondents for information regarding the use of medical services and the extent of disability specifically related to musculoskeletal ailments may con-tribute to an underestimation of these conditions.
Estimates of disability-obtaining detailed information about the number of disability days associated with each medical condition is complicated by the manner — in which the public use files were constructed. For each condition group discussed in this report, the number of associated disability days (restricted-activity days,
6

bed-disability days, and work-loss days) is of interest. Respondents could report more than one underlying condition for a disability day. It is possible to compute the number of disability days listed for each condition in the condition file, but duplication exists for any days reported as caused by two or more conditions. Also, the structure of the public use files does not permit linkage of a specific disability day with alI the associated illnesses. The person file contains an unduplicated count of disability days for each respondent, but no information on conditions causing disability. Therefore, a procedure was devised that would allow estimation of condition-related disability days for persons reporting more than one condition.
Estimation of disability days attributable to a given condition was accomplished by a two-step process. First, for each person, the ratio of the number of disability days in the person file (an unduplicated count) to the total number of disability days in the condition file (a duplicated count) was computed. Second, this ratio was multiplied by the number of disability days listed in the condition file for each medical condition. The result is an estimate of disability days attributable to each condition. The major criticism of this method is that it uniformly reduces the proportion of duplicated days for all conditions. Therefore, variability in actual illness behavior across medical conditions is minimized.
Utilization of health services—For each medical en-counter recorded in the survey, respondents could report up to four medical conditions. The public use files show that approximately 10 percent of medical visits have two or more conditions recorded; multiple conditions are listed for about 12 percent of all hospital stays; and 4 percent of the prescribed medication records have two or more conditions recorded.
On one hand, listing multiple conditions on the event record permits analysis of patterns of care-seeking behavior associated with different illnesses. Such data can reveal, for example, whether certain illnesses are generally treated by themselves or are treated along with other conditions during a medical visitor hospitalization.
On the other hand, the NMCUES survey instrument does not designate “principal diagnosis” or primary reason for each medical encounter. Therefore, when multiple diagnoses are reported, it is difficult to attribute health service use to a specific diagnosis. For this report, a condition-related medical service is defined as one for which the respondent identified a musculoskeletal diagnosis as the only or as one of several reasons for seeking medical care.
Direct costs of health services—NMCUES data contain a number of improbably low values of total charges for ambulatory visits, prescribed medications, and hospital stays. In many cases, the reported data may not correspond to the total charges for the service received, but instead may represent out-of-pocket expenses incurred by patients. To the extent that some respondents reported out-of-pocket expenses as total charges for ser
vices, estimates of total charges are biased downward. As previously noted, people are often treated for
more than one condition when they seek medical care. As a result, it is difficult to isolate those charges that are specific to a given illness. Thus, for these analyses, condition-related charges are defined as charges for heaIth services for which musculoskeletal conditions were listed as either the only reason or as one of several reasons for seeking care. Because these charges may also reflect the treatment of other conditions, they may overestimate the economic impact of musculoskeletal problems, both for the population as a whole and for individuals suffering with these problems.
Indirect costs—The indirect cost of illness and injury is the loss of resources resulting from them. Resource loss is generally calculated as lost productive capacity: the loss of potential economic output because of morbidity and mortality. Indirect costs are usually estimated on the basis of the amount of time by which the individual’s productivity is diminished or lost and the monetary value of that lost productive time.
In calculating the indirect costs of morbidity for 1980, the first necessary calculation is the number of years of productive activity lost by individuals with illness or injury. Because this measure deals with lost productivity, the convention is to count only persons 17 years of age and over who were either working or keeping house at the time of their illness, or who were unable to engage in these activities because of illness or injury. However, persons who were unable to work for health reasons for the entire year are excluded from calculations in this report because no condition was associated with such long-term disability in the NMCUES data files.
The unit for calculation of lost productive time is productive person years. Productive years lost, a non-monetary measure of morbidity costs, is defined as the number of productive days lost because of illness in a year, divided by the number of productive days in a year. For this report, lost productive time is calculated for all employed persons and homemakers. Persons who were employed at any time in 1980 were classified as employed in the NMCUES data files. Homemakers are defined as persons who were not employed or disabled in 1980 and who claimed “keeping house” as their primary activity in 1979. For employed persons, reported work-loss days are divided by 245, the average number of workdays in a year, to determine productive time lost. In this study, calculations of lost output for home-makers were performed for both bed-disability days and restricted-activity days because the former underestimates lost productivity and the latter overestimates lost productivity. The appropriate denominator to annualize days lost for either of these calculations is 365 because homemakers can perform their work every day of the year. By performing both sets of calculations, a range of lost productivity with upper and lower bounds can be constructed for homemakers. Estimates in this report
7

are given for the more restrictive unit of measure, bed-disability days, and for restricted-activity days, which yield somewhat higher estimates of lost productivity. Measures of lost productive time for employed individuals and homemakers have been weighted and aggregated to produce national estimates of productive person years for these two population groups.
Estimates of the indirect costs of morbidity are calculated by multiplying an individual’s reported work-loss time by his or her reported earnings, when available. Reported earnings do not include employee benefits, so earnings are adjusted by a factor of 1.172 to account for the additional value represented by fringe benefits. The adjustment factor is based on the mean percent of earnings represented by employee benefits (17.2 per-cent) in 1980 (Survey of Current Business, 1981). Lost
earnings for employed persons whose earnings were not reported are estimated using U.S. Department of Labor 1980 data for mean annual earnings and are specific to the individual’s age, sex, race, and employment status (full or part time). Again, figures are adjusted to include the value of employee benefits. Lost productivity for homemakers, whose labor is not reimbursed, is estimated using the market-value approach. The value of lost home-maker services is approximated by estimating the cost of replacing those services with services purchased in the market. The values employed are derived from time-use studies and relevant wage rates (Hodgson and Rice, 1984; Walker and Gauger, 1973). Details of the estimation procedures including tables of values used to esti- “ mate these costs are presented in The Costs of Illness, United States, 1980, Appendix V (Parsons et al., 1986).

Prevalence and Demographic Characteristics
Musculoskeletal conditions are frequently cited as among the most common and disabling of the chronic diseases. Data from NMCUES confirm these findings.
Slightly more than 44 million persons, or about 20 percent of the 1980 civilian noninstitutionalized population of the United States, reported having a musculoskeletal problem involving the joints or back, as shown in Table A. Impairment of the knee, hip, shoulder, and other joints was reported for more than 28 million persons (12.8 percent), compared with almost 10.5 mil-lion persons reporting disorders of the back (4.7 percent). Only about 2 percent of the population, or about 5 million persons, reported having musculoskeletal disorders of both the joints and back.
Comparison of interview-based prevalence rates with prevalence rates derived from clinical examinations indicates a likelihood that musculoskeletal problems are underreported in NMCUES. For example, only 25 percent of persons 19 years of age and over reported any musculoskeletal disorder in NMCUES. In contrast, data from the 1971-75 NHANES I (a medical examination survey) indicate that approximately 33 percent of civilian noninstitutionalized persons 25–74 years of age had musculoskeletal abnormalities (Cunningham and Kelsey, 1984). Had persons 75 years of age and over been included in NHANES I, this estimate wor.dd have undoubtedly been higher.
Age- and sex-specific reported prevalence rates of musculoskeletaI disorders based on data from NMCUES
Table A
Number of pereons, percent of population, and rate per 1,000 population with selected musculoskeletal conditions, by
condtiion: United States, 1980
Number of Rate per
persons in Percent of 1,000
Condition thousands population population
All persons . . . . . . 222,824 100.0 . . .
All musculoskeletal
conditions . . . . . ‘44,111 ‘19.8 198.0
Joints only . . . . . . . . . 28,577 12.8 128.3
Backonly . . . . . . . . . . 10,502 4.7 47.1
Joints and back . . . . . . . 5,031 2.3 22.6
‘Figures may not add to totals because of rounding.
are shown in TabIe 1. The overall prevalence of musculoskeletal impairments was more common among females than maIes, but the rates varied by site of the impairment. About 14 percent of females reported musculoskeletal probIems of the joints compared with approximately 11 percent of males. Disorders of the back, on the other hand, were equalIy prevalent among both males and femaIes; approximately 5 percent of both sexes reported this musculoskeletal problem. Joint-and-back musculoskeletal impairments were less common, with such combinations reported by about 2 percent of both males and females.
For both males and females, the prevalence rate for muscuIoskeletaI disorders of the joints increased significantly with age. This finding is consistent with the evidence reported elsewhere. Cunningham and Kelsey (1984) found that 16 percent of persons 25-34 years of age reported musculoskeletaI symptoms, compared with about 40 percent of persons 65–74 years of age. In NMCUES, disorders of the joints were reported by about 6 percent of both males and females under 19 years of age; whereas the prevalence rates for persons 65 years of age and over rose dramatically to 26 percent for men and about 35 percent for women. The prevalence rate for joint-and-back musculoskeletal impairments in-creased similarly with age among women. For men, however, this rate peaked at 45–64 years of age. Interestingly, this pattern is repeated for men with only back problems. Prevalence rates peaked at 81.4 per 1,000 population for men 45-64 years of age. However, among women, the rate peaked in the 19-44 years of age category at 64.5 per 1,000 population, dropping to 57.6 among women 45-64 years of age.
It is not altogether surprising that the overall rate for back disorders among middle-age men exceeds the rate observed for women the same age, as a substantial number of back impairments are occupationally related (U.S. Department of Labor, 1978) and a higher proportion of men of this age are employed. The data from NMCUES indicate that approximately 57 percent of women and 82 percent of men 45-64 years of age were employed (Parsons et al., 1986). The rate for back disorders then declines for both men and women 65 years of age and over. The decline in the rate of back disorders among men of this age can be explained in part by
9

their retirement from the work force. The decline in back problems among older women is more difficult to interpret. One possibility is that a substantially larger percent of older women have joint problems in addition to back problems, thereby reducing the percent of older women with back disorders only (see Table 1).
It is important to note that the age distribution of persons with musculoskeletal disorders differs markedly from the distribution of noninstitutionalized civilian per-sons in the United States. The age composition of the condition groups, with the exception of back problems, is sharply skewed toward the older age categories. For example, approximately 26 percent of persons with joint impairments are 65 years of age and over compared with 11 percent of the overall population (calculated from data in Tables 1 and 2). A similar pattern is observed for the joint-and-back condition group. Moreover, about 54 percent of persons with musculoskeletal problems of any kind are 45 years of age and over compared
with approximate y 30 percent of the overall population. Because of the highly skewed nature of the age distribution of this population, rates of disability and utilization of health services that are not age-adjusted may obscure true differences between persons with these medical conditions and the overall population. Consequently, age-specific rates are discussed throughout the report and presented in the detailed tables.
The prevalence rates of musculoskeletal conditions for black persons as well as for white and other persons are summarized in Table 1. It appears that black persons are significantly less likely than are white and other persons to have musculoskeletal problems of all kinds. These findings are generally consistent with the results reported by Cunningham and Kelsey (1984) and the National Health Interview Survey (Wilder, 1973; Feller, 198 1), which indicate that white persons were more likely than black persons to report higher rates of arthritis, rheumatism, and other musculoskeletal problems.
10

Health and Limitation of Activities
Unlike other medical conditions, such as cardiovascular disease and cancer, musculoskeletal conditions are rarely the cause of death. Instead, musculoskeletal diseases are noted for causing a deterioration in the quality of life. These conditions affect the quality of life through increased disability, limited activity, physical pain, and impairment. The NMCUES data permit the anaIysis of the magnitude of disability and impairment for persons afflicted with musculoskeletal problems. This analysis is done by the use of general indicators of health status and functioning, as well as by specific measures of lost productivity and limitation of activity.
Functional Limitation and Perceived Health Status
Functional limitation scores are presented in Table B; these scores range from O, indicating no Imitation of activity, to 8, indicating severe activity limitation, and to 9, indicating death during the survey period. The functional limitation score was developed from responses to a battery of questions designed to assess ability to perform various common activities such as walking, driving a car, and climbing stairs. In NMCUES, these questions were asked of persons 17 years of age and over.
The distribution of the perceived health status indicator, classified as “excellent,” “good, “ “fair,” and “poor,” is aIso summarized in Table B. These data were
obtained from the question: “Compared to other persons your age, how would you rate your health?’ Perceived health is subjective and reflects not only limitations, pain, and other physical manifestations of disease, but also the person’s emotional response to illness. Functional limitation is somewhat more objective, although an individual’s level of functioning is almost certainIy influenced by attitudinal and emotional factors, as well as any physical disability or disease.
TabIe B shows the mean functional Imitation score for all persons in the United States, as well as for persons in each of the three condition groups. The mean score, or the degree of reported functional limitation, for each of the condition groups is significantly greater than the average score of 1.7 for the total U.S. population. Per-sons suffering both joint and back disorders have the highest mean score, followed by persons with joint impairments only; the mean score for persons with back problems only is significantly lower. It is important to keep in mind that the age structure of the condition groups, excluding back probIems, differs sharply from the age distribution of the overall U.S. population. Thus, the higher mean functional limitation scores of persons with joint or joint-and-back impairments can be attributed in part to the higher percent of older persons afflicted with these conditions.
The functional limitation scores in Table B are generally consistent with respondents’ perceptions of their health. More than twice as many persons reporting musculoskeletal problems rated their health as “fair” or
Table B
Mean functional limitation score and percent distributing of all persons and of persons w-h selected muaculoskeletal cond~ions by perceived health status, according to condtin: United States, 1980
Mean
functional
limitation Perceived health status
Condition score’ Total* Excellent Good Fair Poor
Percent distribution
All persons . . . . . . . . . . . . . . . 1.7 100.0 50.1 36.9 9.3 3.6
All musculoskeletal conditions . . . . 2.6 100.0 31.9 39.9 17.9 10.2
Joints only . . . . . . . . . . . . . . . . . . 2.7 100.0 32.3 38.9 18.1 10.7 Back only . . . . . . . . . . . . . . . . . . . 2.0 100.0 37.1 43.4 13.7 5.8 Joints and back . . . . . . . . . . . . . . . . 3.0 100.0 19.3 38.3 25.6 16.9
‘Functional limitation is computed only for persons 17 years of age and over. 2Figures may not add to totals because of rounding.
11

“poor” (about 28 percent) as did the overall U.S. population (about 13 percent). The condition group with “the highest functional limitation score, joint-and-back disorders, also had the highest proportion of persons (42.5 percent) describing their health as “fair” or “poor.” Approximately 17 percent of these persons rated their health as “poor,” compared with about 4 percent of the total U.S. population. A greater proportion of persons with joint impairments described themselves as being in “fair” or “poor” health (28.8 percent) than did persons with back problems (19. 5 percent). Because respondents were asked to compare their health to that of other persons their age for perceived health status, this health indicator is implicitly age-adjusted and should not be influenced by the age distribution of persons within each condition category.
Functional limitation scores and respondents’ perceptions of health for selected age categories, for males and for females in each condition group, as well as by race, are displayed in Table 2. The data indicate that males and females were similar in their mean functional limitation scores. This pattern is observed, not only in the overall population, but in each of the condition groups as well. In those groups in which there were differences by sex, the differences were small and not significant. The findings for perceived health status are consistent with the pattern seen for functional limitation score; in each condition group, similar proportions of males and females rated their health as either “fair” or “poor.”
Table 2 also shows that the mean functional limitation score increased with age for both males and females in the total U.S. population, and that this was generally true in each of the condition groups as well. For persons with disorders of the joints and with joint-and-back impairments, a significantly higher percent of both males and females in most age categories rated their health as “fair” or “poor” compared with persons of the same age and sex in the total U.S. population. The same held for males with back problems, although the differences were not so great. However, females in each age category with back problems have perceived health status ratings that closely resemble those of the total U.S. population.
Black persons in each condition group generally had slightly higher functional limitation scores than did white and other persons (Table 2), although these differences are not statistically significant. Health perceptions, on the other hand, showed a distinctly different pattern. For all musculoskeletal conditions, a significantly higher percent of the black population rated their health as “fair” or “poor” (39.7 percent) compared with white and other races (26. 9 percent). The racial difference was more pronounced among those rating their health “poor,” where the proportion of black persons was twice that of white and other races.
Disability Days and Condition-Related Disability
Selected measures of productivity and limitation of activity may also be used to assess the health of individuals suffering musculoskeletal problems. The mean bed-disability days measure is based on responses to: “How many days did illness or injury keep [you] in bed all or most of the day?” Mean work-loss days reflect responses to the question: “How many days did illness or injury keep [you] from work all or most of the day?” A restricted-activity day is defined as one during which, because of illness or injury, the respondent stayed home from work, spent all or most of the day in bed, or cut down on usual activities.
Persons with musculoskeletal problems of any kind tended to be less healthy than other persons in the United States (Figure 1). Persons with some form of musculoskeletal disorder represented about 20 percent of the total population; yet they accounted for nearly 43 percent of all restricted-activity days, about 35 percent of the days spent in bed because of illness, and more than 38 percent of all work-loss days for employed persons.
This same pattern held in each condition catego~ (Table C). For example, persons with joint-and-back musculoskeletal disorders accounted for 6 percent of all bed-disability days, yet they represented only 2.3 percent of the U.S. population. Similarly, persons with joint disorders accounted for about 13 percent of the U.S. population, yet approximately 23 percent of all bed-disability days were attributed to this group. Al-
Figure 1
Totaland condition-related disabilitydavs for persons with selected musculoskeletal conditions: United “States, 1980
c1Total
.:.:.: Co~$on
. . .Q
50 r 50 r
19.8
01Restricted- Bed-disability Work-lossPersons with
musculoskeletal activity days days conditions days
12

Table C
Percent distribut”mnof total and condhion-related disabilii days for persons with selected muscuioskeletal conditions by type of
disability day, according to condiiion: United States, 1980
Restricted- Bed-
activity disability Work-loss
Condition days days days
Total
All persons . . . . . . . . . 100.0 100.0 100.0
All musculoskeletal
conditions . . . . . . . . 42.7 35.4 38.7
Joints only . . . . . . . . . . . . 27.4 22.7 22.8
Backonly . . . . . . . . . . . . . 8.3 6.7 11.0
Joints and back . . . . . . . . . . 7.0 6.0 4.9
All musculoskeletal Condition-related
conditions . . . . . . . . 13.0 8.8 11.2
Joints only . . . . . . . . . . . . 8.0 4.9 5.9
Back only . . . . . . . . . . . . . 2.3 1.7 3.4
Joints and back . . . . . . . . . . 2.8 2.2 1.8
though these data show that persons with musculoskeletal problems tend to be less healthy and have higher levels of disability compared with other persons in the civilian noninstitutionalized U.S. population, they do not indicate the direct impact of musculoskeletal conditions on health and functional ability.
The direct influence of musculoslceletal problems on levels of activity and productivity can be estimated by focusing on condition-related disability. “Condition-related” disability days include days for which the respondent listed a musculoskeletal problem either as the only cause or as one of several causes for staying home from work, cutting down on usual activities, or staying in bed. The estimation process used to approximate condition-related disability is described in “Sources and Limitations of Data.”
Of all restricted-activity days reported by the total U.S. population, 13 percent were directly attributable to musculoskeletal problems (Figure 1). Musculoskeletal disorders accounted directly for about 11 percent of all work-loss days, or nearly 63 million days, and approximately 9 percent of all bed-disability days.
The disabling effects of musctdoskeletal problems on individuals reporting one or more of these conditions are presented in Figure 2. Data for restricted-activity days, bed-disability days, and work-loss days show the mean of the total number of such days, as well as the mean number of condition-related days experienced by individuals in each of the condition categories and for aI1musculoskeletal conditions combined.
The mean total restricted-activity days, work-loss days, and bed-disability days for persons suffering from any musculoskeletal disorder were significantly greater than those for the total U.S. population (Figure 2). For example, the mean number of bed-disability days per year for the U.S. population was 5.2 compared with
9.2 days for persons with any kind of musculoskeletal problem. Furthermore, the data indicate that a consider-able portion of this difference is directly attributable to musculoskeletal problems. Musculoskeletal problems accounted for one-quarter to more than one-third of all restricted-activity days, bed-disability days, and work-10SSdays for persons having these conditions.
Impairments of both the joints and back affected productivity and activity levels more than the disorders of either one singly (Figure 2). Persons in this category stayed home in bed, on average, 5 days during the year because of their joint-and-back problems. This represented approximately 36 percent of the mean total bed-disability days for this group. In contrast, mean condition-related bed-disability days approximated 22 percent and 26 percent of mean total bed-disability days for impairments of the joints and of the back, respectively. The same pattern was seen for restricted-activity days and work-loss days as well.
If mean condition-related days (Figure 2) are subtracted from mean total days, the remaining days for persons with joint and with joint-and-back impairments presumably should not be directly related to musculoskeletal problems. However, these remaining days were still significantly greater than the mean total days for the U.S. population. This finding suggests that persons with these musculoskeletal problems have poorer health than the U.S. population as a whole, perhaps because of a variety of illnesses. Persons with back problems appeared to be only moderately worse off than the overall population.
In the previous discussion on prevalence, it was shown that there are distinct age, sex, and racial patterns associated with each of the three categories of musculoskeletal problems. To analyze in greater detail the impact of these conditions on the individuals suffering with these problems, productivity and activity indicators according to selected demographic characteristics are presented in Table 3.
Mean condition-related disability days for each condition group by age for males and for females and by race are shown in Table 3. Females with musculoskeletal problems generally reported more condition-related restricted-activity days and bed-disability days than did males. Among employed persons with musculoskeletal problems, men reported a higher number of condition-related work-loss days than did women, except for back problems, for which women reported, on average, 4.1 days, compared with 1.5 for men.
It is interesting to note that not only did employed women with back problems report, on average, more condition-related work-loss days than did men, but that their condition-related work-loss days represented a higher proportion of total work-loss days (Table 3). Approximately 39 percent of all work-loss days for women in this condition group were condition-related, compared with 21 percent for men.
13

Figure 2
Mean disability days for all persons and for persons with selected musculoskeletal condtions: United States, 1980
� Total
Condition-related l!%%
Restricted-activity days
50 r
All All Joints Back Joints and persons musculoskeletal only only back
conditions
Bed-disability days
20
13.7m>
? .(d
10
5.2
9.2 9.1 7.3
5.0 2
2.3 2.0 1.9 ~~jfjjgq v
o All AH Joints Back Joints and
persons musculoskeletal only only back conditions
Work-loss days
~ 10 9.2 9.3 8.7 9.6
4 4.9 c 3.6 ml
20
All All Joints Back Joints and persons musculoskeletal only only back
conditions
14

Data in TabIe 3 show that age made a difference in the mean number of condition-related disability days reported by both males and females. Condition-related bed-disability days and restricted-activity days generalIy increased with age for persons with any type of musculoskeletal problem. This was not the case, however, for condition-related work-loss days. Men and women 65 years of age and over reported, on average, fewer condition-related work-loss days than did empIoyed persons 19-64 years of age. There are several possible explanations, principally, ( 1) the labor force participation rates of those 65 years of age and over are lower than those for persons 19–64 years of age and only the healthiest people in the older age group are still working; and (2) employed people in the younger age categories represent a broader cross-section of health.
Productivity effects and activity level differences be-tween the black and the white and other races are also shown in Table 3. For all three condition groups, black persons tended to have a greater number of condition-re-Iated restricted-activity days, bed-disability days, and work-loss days than did white and other persons. Musculoskeletal problems also accounted for a larger proportion of condition-related disability days among black persons than among white and other persons. This difference is most striking for condition-related work-loss days. Among black persons, 55.8 percent of all work-loss days were attributable to some type of musculoskeletal problem, compared with 23.5 percent among white and other persons. This difference probably reflects the higher proportion of black persons in occupations involving physical labor.
Indirect Costs of Morbidity
The results above suggest that musculoskeletal problems can seriously hamper the ability of persons to carry out their normal daily activities and to engage in work. These findings are consistent with evidence reported in the literature describing work disability and the costs of productive time lost as a result of musculoskeletal impairments (morbidity costs). Arthritis, for example, is reportedly one of the leading causes of work disability. MuscuIoskeletal conditions are second onIy to cardiovascular problems in terms of the justification for Social Security grants (Yelin, Nevitt, and Epstein, 1980); they are also second only to skin disorders in the number of applications for workers’ compensation (U.S. Department of Labor, 1978).
The NMCUES data indicate that the disabling effects of musculoskeletal problems result in serious economic consequences for society. Figure 3 shows that the morbidity costs for homemakers unable to carry out their daily activities approximated $0.2 billion and the morbidity costs for employed persons with loss of work-days because of their musculoskeletal problems amounted to nearly $3.7 bilIion. Together, they accounted for a total of $3.9 billion in lost productivity costs during 1980
Figure 3
All lost productivity,and lost productivity attributed to selected rnusculoskeletal condti:mns,for ernpbyed persons
and homemakers United States, 1980
Musculoskeletal conditions
Homemakers
alone. This represents 10.5 percent of the $37.6 billion in aggregate morbidity costs associated with productive time lost as a result of illnesses of any kind among employed persons and homemakers according to data from NMCUES (Parsons et al., 1986). (The productive time lost because of muscuIoskeletal conditions for per-sons reporting their occupation as homemaker is measured using bed-disability days. For persons in the work force, lost productivity is measured using work-loss days. The methods employed in the calculation of the indirect costs of morbidity are summarized in “Sources and Limitations of Data.”)
Although the morbidity costs of $3.9 billion are certainly substantial, it is important to keep in mind that this estimate does not include the monetary value of lost productive years for those totally unable to work because of their musculoskeletal impairments. NMCUES respondents were not asked to give a medical reason for not working during 1980. Given the degree of activity limitation and impairment associated with these conditions, there are probably a considerable number of persons who cannot work because of their musculoskeletal problems; their morbidity costs undoubtedly would add a substantial sum to total morbidity costs for musculoskeIetal problems. By way of comparison, those unable to work for heaIth reasons of any kind represented 5.5 percent of the total population “at risk” for lost productivity, yet they accounted for 64.2 percent of all morbidity costs ($67 bilIion) in the United, States during 1980 (Parsons et al., 1986).
15

Utilization of Health Services
Utilization data from NMCUES permit the analysis of the volume of health services used in the treatment of musculoskeletal problems. NMCUES respondents identified up to four medical conditions for which medical services were received for each type of utilization (ambulatory visit, hospital admission, or medication). A condition-related medical service in these analyses is defined as one for which the respondent identified a musculoskeletal diagnosis as either the only reason or as one of several reasons for seeking medical care. Not-condition-related services are defined as those for which none of the musculoskeletal diagnoses was listed.
These data show that persons with musculoskeletal conditions consume a sizable proportion of our Nation’s health care resources. Although they represent about 20 percent of the civilian noninstitutionalized U.S. population, they accounted for about 37 percent of all ambulatory visits, 32 percent of all hospital admissions, and 40 percent of all hospital days during 1980 (Figure 4). Furthermore, a considerable proportion of total resources in the U.S. health care system was devoted to the diagnosis and treatment of musculoskeletal conditions, 13 percent of all ambulatory visits, and nearly 9 percent of all acute hospital days.
Ambulatory Care
Utilization data presented on a per capita basis permit assessment of the health care effects of musculoskeletal conditions from the perspective of the individual. The average number of condition- and not-condition-related ambulatory visits for persons in each of the condition groups is shown in Table D. Ambulatory visits include visits to physicians’ offices, hospital outpatient departments, clinics, and the offices of other health service providers, such as podiatrists and chiropractors.
Table D shows that persons with different types of musculoskeletal problems varied considerably in the number and percent of ambulatory visits that were condition-related. For example, more than 51 percent of visits among persons with joint-and-back impairments were attributed to the treatment of these conditions compared with 28 percent for joints and 44 percent for backs. Persons with joint-and-back disorders also made a significantly greater number of condition-related visits than
Figure 4
Total and condiiion-relsted ambulatory and hospital services for persons with selected musculoskeletal condtion=
United States, 1980
•1 Total
. . . . . . . ::::::: Condition-related
n . . .
36.6 Ambulatory
. . . .
31.6 Hospital
admissions “.”. :.:* 5.7 .“.
39.5 Hospital days
. ..”.
I I 1 I I I I I I
10 20 30 40 50 60 70 80 90 100
Percent of U.S. total for each type of health care service
those in the two other condition groups, an average of 7.1 condition-related visits, which is between two and three times the mean number for the other two groups.
The mean numbers of condition-related visits and total visits by age, sex, and race for persons in each of the condition categories and in the total U.S. population are shown in Table 4. For condition-related visits, sex does not appear to be a significant source of differences in the use of ambulatory services for persons in any of the three condition categories. This is generally true for each age by sex category as well. It is important to note, however, that this pattern did not hold for total visits. For each of the three condition groups, females
16
I

Table D
Mean ambulatory visits and percent of total visits for persons with selected musculoskeletal condt”mns, by type of visit and condition: United States, 1980
Mean
total Condition visits
All musculoskeletal conditions . . . . 9.5
Joints only . . . . . . . . . . . . . . . . . . 9.2
Back only . . . . . . . . . . . . . . . . . . . 8.5
Joints and back . . . . . . . . . . . . . . . . 13.8
reported a significantly higher number of visits for all illnesses than did males. This latter finding is consistent with sex differences in the use of ambulatory services for the total U.S. population (Table 4), which has been well documented (Cleary, Mechanic, and Greenley, 1982; Verbrugge, 1979).
Condition-related visits for persons with musculoskeletal conditions of all kinds also did not vary by race. The overaIl mean number of condition-related visits for black persons was 3.8 and for white and other persons, 3.4. This same pattern held for each individual condition group as well.
AIthough Table D provides the mean number of condition-related visits for persons with muscuIoskeletal problems, it does not provide the actual distribution of these visits—that is, the percent of persons making no visits or the proportion of persons who can be considered “high users.” Table E shows the cumulative percent of persons making condition-related visits for each of the condition groups.
A striking finding is that a substantial percent of persons in each condition group made no condition-related visits at all. Among persons with any musculoskeietaI condition, approximately 33 percent used no ambulatory services. Among the condition categories of the joints and of the back, the percent of persons making no visits was not significantly different. How-ever, the proportion of persons with joint-and-back problems having no visits was significantly lower than the other two groups. It is also interesting to note the proportion of persons in each group who were “high users”
Condition related Not condition related
Mean Percent of Mean Percent of
visits total visits visits total visits
3.4 35.6 6.1 64.4
2.6 28.4 6.6 71.6
3.8 44.5 4.7 55.5 7.1 51.3 6.7 48.7
of ambulatory services. Among persons with joint-and-back problems, about 20 percent reported more than 10 visits for treatment of their musculoskeletal condition, compared with 4 percent and 10 percent for individuals with joint and with back conditions, respectively.
MusculoskeletaI conditions are somewhat different from many other illnesses because their treatment is within the professional domain of several types of health providers. For example, back problems, as well as most joint disorders, are treated by physicians, physical therapists, and chiropractors. Another example of non-physician providers who treat selected musculoskeletal conditions is podiatrists. The frequency with which people seek care from physicians, as weII as from non-physician providers, for the diagnosis and treatment of their musculoskeletal problems is shown in Table 5. Persons with back disorders were less likely to seek care from physicians for the treatment of their problem than were persons in the other two groups. Only 40 percent of persons with back impairments were treated by physicians, compared with 59 percent and 65 percent for persons with joint and with joint-and-back impairments, respectively. The amount of care rendered by nonphysician providers for treating musculoskeletal conditions is considerable, particularly among persons with back problems or joint-and-back impairment. Approximately 30 percent of persons with any kind of back disorder received treatment for their condition from a chiropractor, compared with 4 percent of persons with joint ailments onIy.
The use of physician and nonphysician providers
Table E
Mean condtion-related ambulatory visits and cumulative percent of condtion-related visits for persons with selected musculoskeletal condtiionq by condtiion: United States, 1980
Mean
condition-related
Mean visits for
related 1 or more condition-related visits less than or equal to-
Condition visits visits 0 1 2 3 4 5 6-10
All muscuioskeletal conditions . . . . 3.4 5.1 32.8 58.2 70.5 77.5 82.1 85.0 92.8
Joints only . . . . . . . . . . . . . . . . . . 2.6 4.0 34.7 62.6 75.2 82.5 86.9 89.5 96.0 Back only . . . . . . . . . . . . . . . . . . . 3.8 5.7 33.6 58.0 68.3 74.5 78.6 81.6 90.0 Joints and back . . . . . . . . . . . . . . . . 7.1 8.9 20.3 33.0 48.2 55.3 62.6 66.8 80.5
condition- persons with Cumulative percent of population with
17

for the treatment of musculoskeletal problems by selected demographic characteristics is also shown in Table 5. Several of the findings warrant emphasis.
Within each condition group, there did not appear to be significant differences in the percents of males and females who seek care from each type of provider listed in Table 5. The same pattern held for most age categories for both males and females. Black persons with back problems showed a somewhat different pattern of utilization of physician and nonphysician services compared with white and other persons who had similar ailments. A significantly higher percent of black persons sought care from a physician (53.9 percent) than did white and other persons (39. 1 percent). Conversely, white and other persons were significantly more likely to receive treatment from a chiropractor. This difference was not observed for joint-and-back problems, where the use of chiropractic services by both black and white and other persons was relatively high overall.
The frequent use of ambulatory services for treating musculoskeletal conditions can be attributed to the chronic pain and discomfort associated with these iHnesses and the therapeutic methods that are employed by an array of providers. Therapies that are commonly used to treat the disabling symptoms of musculoskeletal problems include physical therapy, medication, and chiropractic manipulation. Implicit in some of these regimens, such as physical therapy and chiropractic manipulation, is the requirement of multiple visits.
Among persons who sought ambulatory services for treating their musculoskeletal problem, the mean number of such visits was 5.1; however, the number of visits differed significantly by type of provider (Table F). Physicians consistently provided fewer services for treating musculoskeletal conditions, on average, than did the other providers. Among persons with joint disorders, for example, the mean number of condition-related physician visits for persons seeking care was 2.6, compared with 7.7 for chiropractors, 3.3 for podiatrists, and 6.1 for other nonphysician providers. Similarly, the mean numbers of physician visits for persons with back problems and with joint-and-back disorders were 2.8 and 4.0, respectively, compared with 8.2 and 10.1 chiropractic visits for persons in the other two groups.
The extent of overlap in terms of the therapy offered by physicians and other health providers for treating musculoskeletal problems raises the question of whether nonphysician care is used to supplement or to substitute for physician services. Some insight may be provided by examining the relationship of the use of nonphysician providers to the frequency of physician visits. Table G shows the percent of persons receiving services for their musculoskeletal problem from a nonphysician provider, and the mean number of visits to these providers according to the number of physician visits made for the same medical problem. The data appear to raise questions about the role of nonphysician providers in the substitution or supplementation of physician services. (For general information about the use of nonphysician providers as reported by NMCUES participants, see Mugge, 1984, and Mugge, 1986.)
The data in Table G clearly show that a substantial number of persons who did not seek care from a physician did, in fact, receive services from other providers for their musculoskeletal problems. The proportion of per-sons who followed this pattern ranged from about 16 percent for persons with joint problems to approximately 44 percent for persons with back problems.
Moreover, the mean number of visits to nonphysician providers according to the number of physician visits made (Table G) also suggests that people are supplementing physician care with the services of other providers. The most striking example is the category of joint disorders. The mean number of condition-related visits to nonphysician providers was 0.5 for persons making one physician visit, increasing to 1.1 visits for two to four physician visits, and to 3.4 visits for persons making five or more condition-related physician visits. In those instances where visits are made to both physicians and nonphysicians for the same musculoskeletal problem, it is not possible to determine from the data whether these visits were initiated by the patient or resulted from a physician or other professional referral. For example, physicians may provide diagnostic services and perhaps drug therapy to persons with musculoskeletal problems and also refer these patients to physical therapists for physical therapy. In other cases, patients may not only initiate visits with physicians, but with nonphysicians
Table F
Mean condition-related visits for persons with selected musculoskeletal conditions who made 1 or more condition-related ambulatory visits, by provider and condition: United States, 1980
Mean condition-related visits for users
Other Any nonphysician
Condition provider’ Physician Chiropractor Podiatrist providerz
All musculoskeletal conditions . . . 5.1 2.8 8.5 3.4 6.0
Joints only . . . . . . . . . . . . . . . . 4.0 2.6 7.7 3.3 6.1 —Backonly . . . . . . . . . . . . . . . . . . 5.7 2.8 8.2 2.9
Joints and back . . . . . . . . . . . . . . 8.9 4.0 10.1 4.1 8.7
‘Categories do not add to total because of multiple responses.‘Includes optometrists, psychologists, social workers, nurses, physical therapists, and others.
18

Table G
Percent of persons with selected musculoskeletal condtiions who made condtion-related ambulatory visits to nonphysicians, and mean condtion-related visits, by number of physician visits and cond~ion: United States, 1980
0 physician 1 physician 24 physician 5 or more physician
visits visit visits visits
Percent Percent Percent Percent
with Mean with Mean with Mean with Mean
non- non- non- non- non- non- non- non-
physician physician physician physician physician physician physician physician
Condition visit visits
All musculoskeletal conditions . . . 26.9 2.1
Joints only . . . . . . . . . . . . . . . . . . 15.9 1.1
Backonly . . . . . . . . . . . . . . . . . . . 43.5 3.3
Joints and back . . . . . . . . . . . . . . . . 42.1 4.7
as well. Furthermore, because the services provided by some of the nonphysician providers differ from those provided by physicians, it cannot be determined from these data whether nonphysician provider services actually supplement or substitute for a physician visit in terms of therapy.
Hospital Care
Utilization rates of hospital inpatient services are summarized for persons with musculoskeletal problems in Table H. Although the condition-related hospital ad-mission rates of 48.1 and 31.1 admissions per 1,000 population represented about 16 and 18 percent of total admissions for persons with back and with joint problems, respectively, the percent was significantly higher for persons with joint-and-back impairments. Approximately 30 percent of all admissions for persons in this category were for treatment of their musculoskeletal ailments. Condition-related hospital days represented a significantly lower percent of total hospital days for persons with joint disorders (20. 3 percent) compared with those with back problems (26. 8 percent) and joint-and-back problems (26.6).
Differences in hospital utilization by sex, age, and race are displayed in Table 4. Among persons with joint impairments, males had significantly more condition-related admissions and hospital days than did females. For both males and females with joint problems,
visit visits visit visits visit visits
15.2 1.1 25.5 1.4 36.8 4.1
11.0 0.5 21.1 1.1 30.4 3.4 17.7 1.4 33.2 1.6 41.4 3.9
47.0 5.4 36.5 2.7 50.5 6.0
condition-related hospital days increased with age. Among persons in each of the three condition groups, there was no significant difference in condition-related admission rates for males and for females. Among both males and females with joint-and-back disorders, hospital admission rates declined with increasing age. There were too few hospital admissions for persons with back prob-Iems to detect any consistent trends in admission rates for both maIes and females. Although condition-related admissions increased with age among males with joint disorders, this pattern did not hold for females in this group.
The most notable difference in the use of hospital inpatient services occurs between black persons and white and other persons. For persons with musculoskeletal conditions of all kinds, the black population had almost twice the number of condition-related admissions per 1,000 population as for the white and other population, 84 compared with 47. This pattern held for all three condition groups. This magnitude of difference was not seen in the hospital admission rates for all iIlnesses. It shouId be kept in mind, however, that the relatively small numbers of black persons represented in these condition groups, particularly the number who are hospitalized, prevent the confirmation of the statistical significance of these differences. Such difficulties not-withstanding, the direction of these racial differences is consistent with the comparatively poorer health status reported by black persons in NMCUES.
Table H
Condtion-related hospital utilization for persons with selected musculoskeletal condtiions, by condmion:United States, 1980
Condition-related hospital admissions Condition-related hospital days
Rate per Percent of total Rate per Percent of total
Condition 1,000 population admissions 1,000 population hospital days
All musculoskeletal conditions . . . . 50.6 18.1 536.6 22.1
Joints only . . . . . . . . . . . . . . . . . . 48.1 15.7 546.0 20.3 Back only . . . . . . . . . . . . . . . . . . . 31.1 17.9 357.9 26.8 Joints and back . . . . . . . . . . . . . . . . 105.8 30.2 856.9 26.6
19

Health Care Charges
Persons with musculoskeletal problems accounted for a substantial proportion of the Nation’s health care costs (Table J). This group represents about 20 percent of the U.S. civilian noninstitutional ized population, yet it incurred approximately 36 percent of the Nation’s total estimated health care charges. Charges for persons with back problems were slightly greater than would be expected, given this group’s proportion of the population. On the other hand, persons with joint disorders and with joint-and-back problems generated charges two times greater than would be expected given their population proportions.
Charges related to the treatment of musculoskeletal conditions accounted for about 8 percent of the total health care bill. This is lower than the 14 percent of charges incurred in the treatment of hypertension and cardiovascular disease (Thomas et al., to be published), yet it is more than double the 3.5 percent of total charges spent on the treatment of acute respiratory illnesses (Harlan et al., to be published). NMCUES data for 1980 show that musculoskeletal problems ranked third in terms of civilian noninstitutional health care charges, in comparison with their 1972 ranking of 10 (Cooper and Rice, 1976). This difference in ranking is attributable in large part to variability in the sources
Table J
Total charges and condtiion-related charges for persons with selected musculoskeletsl condtiions, by condition:
United States, 1980
Charges Condition in millions Percent’
All musculoskeletal Total
conditions . . . . . . $55,796 36.3
Joints only . . . . . . . . . . . . . 39,060 25.4
Back only . . . . . . . . . . . . . . 9,022 5.9 Joints and back . . . . . . . . . . . 7,714 5.0
All musculoskeletal Condition-related
conditions . . . . . . . . . 12,480 8.1
Joints only . . . . . . . . . . . . . 8,165 5.3 Back only . . . . . . . . . . . . . . 2,046 1.3
Joints and back . . . . . . . . . . . 2,270 1.5
‘Percent of estimated total health care charges for U.S. civilian noninstitutionaiized population in 1980.
of data. The NMCUES charge data are charges reported by survey respondents as incurred during 1980; the estimates of 1972 health care expenditures are derived from provider sources.
The allocation of health care resources for the civilian noninstitutionalized U.S. population, as measured by dollar charges, and the allocation of condition-related charges for persons with musculoskeletal problems are shown in Figure 5. Condition-related charges are defined as charges for health services for which musculoskeletal conditions were listed either as the only reason or as one of several reasons for seeking care. (See “Sources and Limitations of Data” for further information about estimation of total and condition-related charges. ) It appears that the allocation of health care resources for treating all musculoskeletal problems differs significantly from the distribution of resources for treating all illnesses in the total population.
Charges for inpatient care incurred by persons with musculoskeletal problems in connection with their condition represented a significantly smaller percent of their total condition-related health care charges than did inpatient charges incurred for all conditions by the population as a whole. On the other hand, a significantly greater proportion of charges for musculoskeletal problems was generated for ambulatory services rendered by physicians, chiropractors, podiatrists, and other health care providers. Approximately 35 percent of all condition-related charges were attributable to ambulatory visits compared with 28 percent of all-conditions charges for the total U.S. population. Prescription drugs accounted for about 6 percent of total health care charges as well as 6 percent of charges incurred in the treatment of musculoskeletal problems.
Inspection of Table 6 indicates, however, that the three individual musculoskeletal groups were distinctly different from each other, as well as from the overall U.S. population, with respect to the distribution of charges. These differences are obscured when all musculoskeletal problems are combined in a single category.
Persons with back problems have a significantly lower percent of their condition-related health care charges generated by hospital inpatient care, compared with the other two condition groups and the U.S. population, about 42 percent versus 65 percent for joint conditions and approximately 52 percent for joint-and-back
20
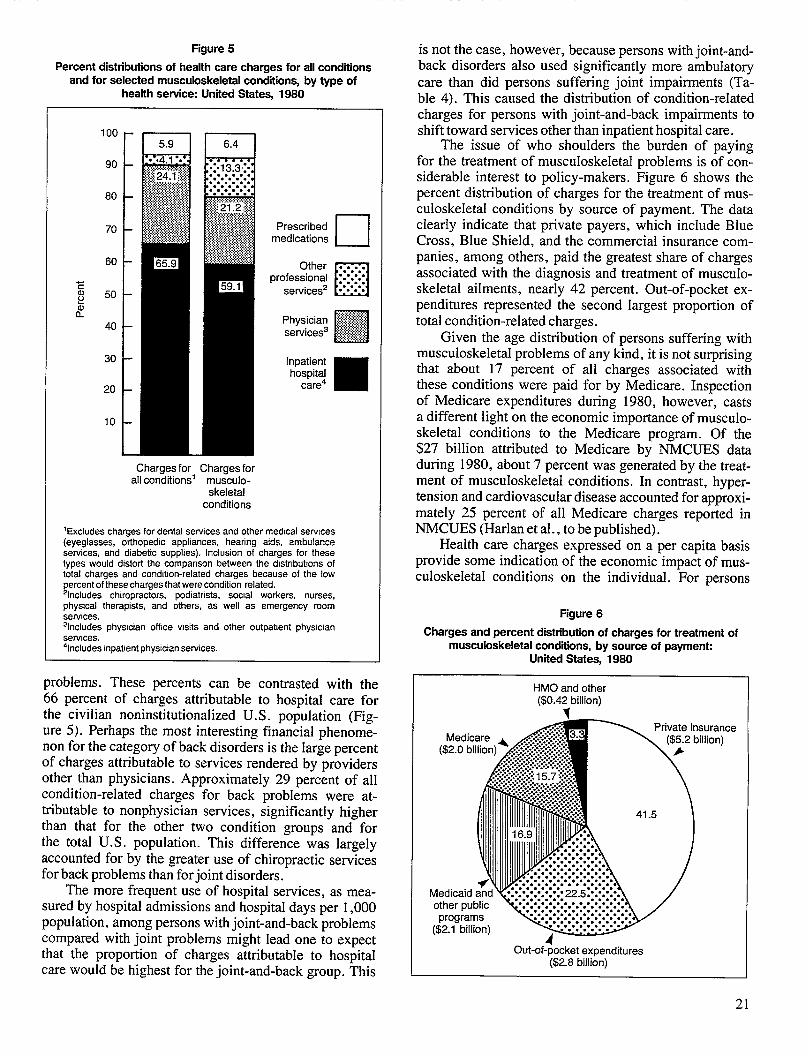
Figure 5
Percent distributions of health care charges for all conditions and for selected musculoskeletal condtiions, by type of
health service: United States, 1980
100 -
90
80
70 Prescribed medications •1
60 - Other . . . . . . . professional .“.”.”.”. . .
50 services2 n�“””””=
40 – Physician # services’ [~j
30
20
10
L Charges for Charges for
all conditions’ musculoskeletal
conditions
‘Excludeschargesfor dentalservicesand othermedicalserwces(eyeglasses, orthopedic appliances, hearing aids, ambulanceservices, and diabetic supplies). Inclusion of charges for thesetypes would distorf the comparison between the distributions oftotal charges and condtlon-related charges because of the lowpercent of these charges that were condition related.%cludes chiropractors, podiatrists, social workers, nurses,physical therapists, and others, as well as emergency roomservices.31ncludes physrcian office visits and other outpabent phys!cianserulces.‘Includes inpat!ent physician services.
problems. These percents can be contrasted with the 66 percent of charges attributable to hospital care for the civilian noninstitutionalized U.S. population (Figure 5). Perhaps the most interesting financial phenomenon for the category of back disorders is the Iarge percent of charges attributable to services rendered by providers other than physicians. Approximately 29 percent of all condition-related charges for back problems were attributable to nonphysician services, significantly higher than that for the other two condition groups and for the total U.S. population. This difference was largely accounted for by the greater use of chiropractic services for back problems than for joint disorders.
The more frequent use of hospital services, as measured by hospital admissions and hospital days per 1,000 population, among persons with joint-and-back problems compared with joint problems might lead one to expect that the proportion of charges attributable to hospital care would be highest for the joint-and-back group. This
is not the case, however, because persons with joint-and-back disorders also used significantly more ambulatory care than did persons suffering joint impairments (Table 4). This caused the distribution of condition-related charges for persons with joint-and-back impairments to shift toward services other than inpatient hospital care.
The issue of who shoulders the burden of paying for the treatment of musculoskeletaI problems is of considerable interest to policy-makers. Figure 6 shows the percent distribution of charges for the treatment of musculoskeIetal conditions by source of payment. The data clearIy indicate that private payers, which include Blue Cross, Blue Shield, and the commercial insurance companies, among others, paid the greatest share of charges associated with the diagnosis and treatment of musculoskeletal ailments, nearly 42 percent. Out-of-pocket expenditures represented the second largest proportion of total condition-related charges.
Given the age distribution of persons suffering with musculoskeletal problems of any kind, it is not surprising that about 17 percent of all charges associated with these conditions were paid for by Medicare. Inspection of Medicare expenditures during 1980, however, casts a different light on the economic importance of musculoskeletal conditions to the Medicare program. Of the $27 billion attributed to Medicare by NMCUES data during 1980, about 7 percent was generated by the treatment of muscuIoskeletaI conditions. In contrast, hyper-tension and cardiovascular disease accounted for approximately 25 percent of aIl Medicare charges reported in NMCUES (Harlan et al., to be published).
Health care charges expressed on a per capita basis provide some indication of the economic impact of musculoskeIetal conditions on the individual. For persons
Figure 6
Charges and percent distribution of charges for treatment of musculoskeletal condtins, by source of paymen~
United States, 1980
HMO and other ($0.4< billion)
Private insurance ($5j2 billion)
1.5
Medicaid akd~ other public programs 1
($2.1 billion) %
Out-of-pocket expenditures ($2.8 billion)
21
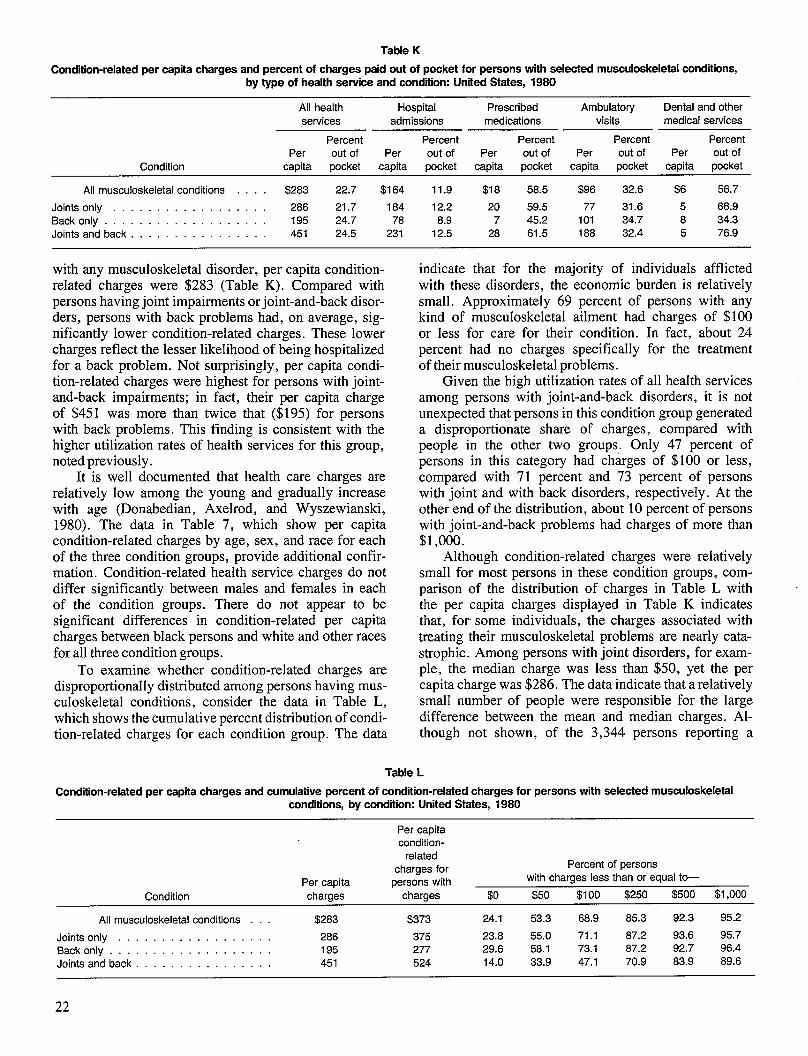
Table K
Condition-related per capita charges and percent of charges paid out of pocket for persons with selected musculoskeletal condtiions, by type of health service and condition: United States, 1980
All health Hospital Prescribed Ambulatory Dental and other services admissions medications visits medical services
Percent Percent Percent Percent Percent Per out of Per out of Per out of Per out of Per out of
Condition capita pocket capita pocket capita pocket capita pocket capita pocket
All musculoskeletal conditions . . . $283 22.7 $164 11.9 $18 58.5 $96 32.6 $6 56.7
Joints only . . . . . . . . . . . . . . . . 286 21.7 184 12.2 20 59.5 77 31.6 5 66.9 Backonly . . . . . . . . . . . . . . . . . . 195 24.7 78 8.9 7 45.2 101 34.7 8 34.3 Joints and back . . . . . . . . . . . . . . 451 24.5 231 12.5 28 61.5 188 32.4 5 76.9
with any musculoskeletal disorder, per capita condition-related charges were $283 (Table K). Compared with persons having joint impairments or joint-and-back disorders, persons with back problems had, on average, significantly lower condition-related charges. These lower charges reflect the lesser likelihood of being hospitalized for a back problem. Not surprisingly, per capita condition-related charges were highest for persons with joint-and-back impairments; in fact, their per capita charge of $451 was more than twice that ($195) for persons with back problems. This finding is consistent with the higher utilization rates of health services for this group, noted previously.
It is well documented that health care charges are relatively low among the young and gradually increase with age (Donabedian, Axelrod, and Wyszewianski, 1980). The data in Table 7, which show per capita condition-related charges by age, sex, and race for each of the three condition groups, provide additional confirmation. Condition-related health service charges do not differ significantly between males and females in each of the condition groups. There do not appear to be significant differences in condition-related per capita charges between black persons and white and other races for all three condition groups.
To examine whether condition-related charges are disproportionally distributed among persons having musculoskeletal conditions, consider the data in Table L, which shows the cumulative percent distribution of condition-related charges for each condition group. The data
indicate that for the majority of individuals afflicted with these disorders, the economic burden is relatively small. Approximately 69 percent of persons with any kind of musculoskeletal ailment had charges of $100 or less for care for their condition. In fact, about 24 percent had no charges specificallyy for the treatment of their musculoskeletal problems.
Given the high utilization rates of all health services among persons with joint-and-back disorders, it is not unexpected that persons in this condition group generated a disproportionate share of charges, compared with people in the other two groups. Only 47 percent of persons in this category had chhges of $100 or less, compared with 71 percent and 73 percent of persons with joint and with back disorders, respectively. At the other end of the distribution, about 10 percent of persons with joint-and-back problems had charges of more than $1,000.
Although condition-related charges were relatively small for most persons in these condition groups, comparison of the distribution of charges in Table L with -the per capita charges displayed in Table K indicates that, for some individuals, the charges associated with treating their musculoskeletal problems are nearly catastrophic. Among persons with joint disorders, for example, the median charge was less than $50, yet the per capita charge was $286. The data indicate that a relatively small number of people were responsible for the large difference between the mean and median charges. Although not shown, of the 3,344 persons reporting a
Table L
Condition-related per capita charges and cumulative percent of condition-related charges for persons with selected musculoskeletal condtiions, by cond~ion: United States, 1980
Per capita condition-
related
Per capita charges for
persons with
Percent of persons
with charges less than or equal to-
Condition charges charges $0 $50 $100 $250 $500 $1,000
All musculoskeletal conditions . . $283 $373 24.1 53.3 68.9 85.3 92.3 95.2
Joints only . . . . . . . . . . . . . . . . 286 375 23.8 55.0 71.1 87.2 93.6 95.7
Back only . . . . . . . . . . . . . . . . . 195 277 29.6 58.1 73.1 87.2 92.7 96.4
Joints and back . . . . . . . . . . . . . . . . 451 524 14.0 33.9 47.1 70.9 83.9 89.6
22

musculoskeletal problem in NMCUES, 30 persons had generated charges in excess of $5,000 for the treatment of their condition. If these 30 persons and their charges were excluded, the per capita condition-related charge would drop to about $178.
From an individual patient’s perspective, affordability of care is determined less by the total amount of charges for medical services than by the proportion of those charges that must be paid out of pocket. About 23 percent of all charges incurred in the treatment of
any musculoskeletal problem was paid out of pocket, with little variance among the three condition groups (Table K). This compares with approximately 28 percent of all charges paid out of pocket by the U.S. population as a whole. These data suggest that the economic burden imposed by musculoskeletal problems, as measured by the proportion of condition-related charges paid out of pocket, is no greater than the burden imposed by other kinds of illnesses.
23

Discussion
Musculoskeletal conditions are quite variable, ranging from self-limited disorders to recurrent long-term illness, and are often accompanied by moderate to severe levels of functional impairment. This heterogeneity persists in this study, despite the fact that two groups of musculoskeletal problems were excluded from the analysis: Traumatic conditions (such as fractures, sprains, and dislocations) and congenital defects.
Several possible approaches to the categorization of musculoskeletal conditions based on specific diagnoses were considered, but none was viable because of the lack of specificity of the medical diagnoses provided by the respondents and the small sample size for individual conditions. The three groupings finally selected represent a compromise between these two constraints. As a result, only one of the three condition categories used in this analysis approaches some degree of homogeneity—back disorders. Back pain is a common, recurrent, and often self-limited manifestation of back disorders. Moreover, diseases of the back most commonly result in mild to moderate disability.
Diseases of the joint, the second category, are much more varied than are back problems. In contradistinction to back disorders, diseases of the peripheral joints, such as rheumatoid arthritis, can be severely debilitating, resulting in systemic manifestations and even death. Of course, some joint impairments cause only mild disability. In this regard, such conditions are similar to mild transient back pain.
The third category, joint-and-back conditions, will have prognostic and functional characteristics at least as varied as peripheral joint conditions considered alone.
The reason for emphasizing the heterogeneity of the condition categories used in this report is to inject a note of caution about overly general statements or hypotheses based on the data. The relative diversity, severity, and prognoses of the various diseases under consideration should be kept in mind as the disability, utilization, and charge patterns are discussed, both here and throughout the report.
The data from NMCUES are generally consistent with those from NHANES I and the National Health Interview Survey, both of which surveys also found that musculoskeletal impairments are more prevalent among the elderly, are generally more common among females than among males, and are more frequent among
white persons than among black persons (Cunningham and Kelsey, 1984; Wilder, 1973; Feller, 1981).
From the perspective of disability incurred, the broad category of musculoskeletal conditions, exclusive of traumatic injuries or congenital diseases, can be characterized from these data as both common and costly in terms of work-loss days and limitation of activity. For example, 13 percent of all restricted-activity days re-ported by civilian noninstitutionalized persons in the United States during 1980 were related to some type of musculoskeletal problem. Furthermore, musculoskeletal conditions were responsible for about 11 percent of all work-loss days reported by this population.
Among black persons, the mean number of disability days (including work-loss days) directly attributable to musculoskeletal conditions was greater than the average number of condition-related disability days reported by persons of white and other races. This is a rather striking finding, given that the overall prevalence of musculoskeletal conditions is higher among white persons and those of other races than among black persons. These differences may suggest a difference in the severity of musculoskeletal conditions, with black persons being more vulnerable to musculoskeletal disease either through genetic predisposition or through acquired differences such as obesity. Another possible explanation for the difference could be a lack of financial and social resources with which to deal with the disabling effects of musculoskeletal conditions.
More than half of all work-loss days reported for black persons (55. 8 percent) were related to these conditions; this rate is twice that for white and other persons. This difference is most likely linked to occupational differences. For example, the physical demands of occupations that involve strenuous work may preclude work attendance if there has been damage to the musculoskeletal system; whereas similar levels of impairment would be compatible with continued work attendance in less physically demanding jobs. The variability in work disability by race emphasizes the potential y different health and economic consequences of musculoskeletal conditions for black persons.
The costs associated with productive time lost be-cause of musculoskeletal problems are considerable. Musculoskeletal disorders accounted for $3.9 billion in lost productivity among employed persons and home-
24

makers. This represents more than 10 percent of the total morbidity costs for empIoyed persons and home-makers. Because many musculoskeletal disorders are occupationally related (Yelin, Nevitt, and Epstein, 1980), altering on-the-job conditions that are causally related to the development of musculoskeletal disorders would be a significant step in the reduction of the productivity losses attributable to these disorders.
Despite the large number of work-loss days and bed-disability days attributable to musculoskeletal disorders, people with these conditions do not necessarily perceive themselves to be suffering from serious ailments. People with back problems, for example, do not differ significantly from the overall population in the extent to which they report their health as poor, nor do they differ significantly in their level of daily functioning. One possible explanation is that people with back disorders are able to manage their daily activities within the scope of their ability to function. Such management of daily activities may not be feasible for persons with peripheral joint disorders, who therefore see them-selves as more limited and in poorer health.
There are noticeable racial differences in the way people with musculoskeletal conditions perceive their health and level of functioning. Within each condition group, black persons not only reported more disability days, on average, than did white and other persons; but they were also more limited in their functional abilities and they perceived themselves to be in poorer health. It is important to keep in mind that the way in which individuals perceive their level of health and their ability to carry out daily activities is influenced not only by the existence of medical conditions, but also by a constellation of social, psychological, and economic factors.
A Iarge proportion of the care administered to patients with musculoskeletaI conditions was provided in ambulatory care settings. This reliance on ambulatory care is attributable to the fact that these conditions, with certain notable exceptions, are not generally amenabIe to surgical interventions. The most common types of intervention are, therefore, drug treatment, physical therapy, and manipulation. Such intervention can easily be achieved in an outpatient setting in most cases.
It is interesting to note that about 33 percent of all persons with a musculoskeletal disorder made no ambulatory visits at aII for their condition during 1980, despite the fact that they reported more Imitation in their activities and rated their health”as poor more frequently than the overall civilian noninstitutionalized population. There are severaI explanations for this finding. First, many of the musculoskeletal problems included in this analysis are characterized by acute recur-rent episodes that are self-limiting in nature. Individuals will generally be acquainted with the appropriate treatment during these episodes, thus eliminating the need to visit a health care provider. Second, persons suffering from these conditions may not seek medical care to alleviate the disability and discomfort that accompany
many musculoskeletal problems because the health care system has been unable to provide successful treatment of their symptoms. These individuals often turn to a host of folk remedies to treat their musculoskeletal ailments (Kronenfeld and Wasner, 1982). Third, pain is the most frequent symptom reported in connection with muscuIoskeIetal disorders; and because this symptom is often successfully treated with over-the-counter medications, the need for other health care services is thus eliminated.
At the other end of the continuum are those persons who make frequent visits to heakh care providers for the treatment of their musculoskeletal problems. For example, approximately 7 percent of persons with musculoskeletal conditions made more than 10 ambulatory visits during the year. The frequent use of ambulatory services for some people can be explained in part by the types of providers treating musculoskeletal conditions and the therapies they are Iikely to use.
Nearly 30 percent of persons with back problems sought care from chiropractors. Moreover, persons with any musculoskeletal problems were likely to make three times as many visits to chiropractors as visits to physicians. Among persons making at least one ambulatory care visit, the average number of chiropractic visits was 8.5, compared with 2.8 for physician visits. This difference is undoubtedly the resuIt of differences in the therapeutic regimens used by each profession. Manipulation therapy, for example, is generally used by chiropractors and is performed during a series of visits. Physicians, on the other hand, are more apt to prescribe medications or to set up a treatment scheduIe to be carried out by a physical therapist. The physician will therefore see the patient less often than a chiropractor would because the physician’s role is Iimited to monitoring change, if any, and any untoward reaction to drug therapy. It is interesting to note that chiropractors are used predominant y by persons of white and other races. Among persons with back disorders, for example, only about 10 percent of black persons used chiropractic services compared with 32 percent of persons of white and other races.
Although the median charge generated in the treatment of muscuIoskeletal conditions in 1980 was less than $50, total charges associated with these conditions amounted to more than $12 billion. This represents 7.8 percent of the total direct health care costs of the 1980 civilian noninstitutionalized U.S. population. These charges of $12 biIIion are high relative to the low costs for each individual in these condition groups because of the high prevalence of these disorders.
The median charge for the treatment of musculoskeletal conditions is relatively low because 24 percent of persons with these ailments had no charges at all during the year. The per capita charge of $283 for all persons with these disorders, however, is relatively high. The substantial difference between mean and median charges suggests that the charges associated with the
25
treatment of musculoskeletal conditions approach catastrophic levels for some individuals.
Nearly 23 percent of charges generated by the treatment of musculoskeletal problems were paid out of pocket. This figure is not dramaticallyy different from the estimate of 28 percent for out-of-pocket expenditures
26
of the total U.S. civilian noninstitutionalized population. Although musculoskeletal conditions tended to have the highest prevalence among the aged, only 16 percent of all charges for these conditions were paid by Medicare. Private insurance sources accounted for a much larger share42 percent of total condition-related charges.

References
Casady, R. J.: The survey design and estimation methodology for the NMCUES. Proceedings of the 19th National Meeting of the
Public Health Conference on Records and Statistics. DHHS Pub. No. (PHS) 81–1214. National Center for Health Statistics, Public Health Service. HyattsviIle, Md., 1983, pp. 181–185.
Cleary, P. D., Mechanic, D., and Greenley, J. R.: Sex differences in medical care utilization: An empirical investigation. J. Health
Sot. Behavior 23: 106-119, 1982.
Cooper, B. S., and Rice, D. P.: The economic cost of illness revisited. Sot. Secur. Bull. 39:21–36, Feb. 1976.
Cox, B. G.: The weighted sequential hot deck imputation procedure. Proceedings of the Section on Survey Research Methods, American
Statistical Association. 1980, pp. 721–726.
Cunningham, L. S., and KeIsey, J. L.: Epidemiology of musculoskeletaI impairments and associated disability. Am. ./. Public Health
74574-579.1984.
Donabedian, A., Axelrod, S. J., and Wyszewianski, L.: Medical
Care Chartbook, seventh edition. Ann Arbor, Mich. Health Administration Press, 1980.
Feller, B. A.: Prevalence of selected impairments, United States, 1977. Vital and Health Statistics. Series 10, No. 134. DHHS Pub. No. (PHS) 81-1562. National Center for Health Statistics, Public Health Service. Washington. U.S. Government Printing Office, Feb. 1981.
Harlan, W. R., Murt, H. A., Thomas, J. W., et al.: Incidence, utilization, and costs associated with acute respiratory conditions, United States, 1980. National Medical Care Utilization and Expenditure Survey. Series C, No. 4. DHHS Pub. No. 86-20404. National Center for Health Statistics. Public Health Service. Washington. U.S. Government Printing Office, Sept. 1986.
Harlan, W. R., Thomas, J. W., Murt, H. A., et al.: Health care utilization and costs of adult cardiovascular disease. National Medical
Care Utilization and Expenditure Survey. Series C, No. 6. National Center for Health Statistics. To be published.
Hodgson, T. A., Chief Economist, Office of Analysis and Epidemiology, National Center for Health Statistics, and Rice, D.P., Professor, Department of Social and Behavioral Sciences and the Aging Health Policy Center, University of California at San Francisco: Personal communication, 1984.
Kelsey, J. L.: Epidemiology of Musculoskeletal Disorders. Monographs in Epidemiology and Biostatistics, Volume 3. Oxford. Oxford University Press, 1982.
Kish, L.: Survey Sampling. New York. J.W. Wiley and Sons, Inc., 1965.
Kronenfeld, J. J., and Wasner, C.: The use of unorthodox therapies and marginal practitioners. Sot. Sci. Med. 16:1119-1125, 1982.
Lepkowski, J. M., Landis, J. R., Parsons, P. E., et al.: Statistical methodologies for analyzing a complex sample survey: The National
Medical Care Utilization and Expenditure Survey. National Medical
Care Utilization and Expenditure Survey. Series A, Methodology. National Center for Health Statistics, Public Health Service. To be published.
Lepkowski, J. M., Stehouwer, S., and Landis, J. R.: Strategies for the analysis of imputed data in a sample survey. Proceedings
of the Section on Survey Research Methods, American Statistical Association, 1984.
Mugge, R. H.: Persons receiving care from selected health care practitioners, United States, 1980. National Medical Care Utilization
and Expenditure Survey. Series B, Descriptive Report No. 6. DHHS Pub. No. 84-20206. National Center for Health Statistics, Public Health Service. Washington. U.S. Government Printing Office, Sept. 1984.
Mugge, R. H.: Visits to selected health care practitioners, United States, 1980. National Medical Care Utilization and Expenditure
Survey. Series B, Descriptive Report No. 8. DHHS Pub. No. 86-20208. National Center for Health Statistics, Public Health Service, Washington. U.S. Government Printing Ofilce, Feb. 1986.
National Center for Health Statistics: Health Interview Survey Medical
Coding Manual and Short Index. Hyattsville, Md. Public Health Service, Jan. 1979.
Parsons, P. E., Lichenstein, R., Berki, S. E., et al.: The costs of illness, United States, 1980. National Medical Care Utilization
and Expenditure Survey. Series C, No. 3. DHHS Pub. No. 86-20403. National Center for Health Statistics, Public Health Service. Washington. U.S. Government Printing Office, Apr. 1986.
Survey of Current Business: Table 1.11, National income by type of income. 60(7):12, July 1981.
U.S. Department of Labo~ An Interim Report to Congress on Occupa
tional Disease. Washington. U.S. Government Printing Office, 1978.
Verbrugge, L. M.: Female illness rates and illness behavio~ Testing hypotheses about sex differences in health. Women Health 4(1):61– 79, 1979.
Walker, K. E., and Gauger, W. H.: The dollar value of household work. Information Bulletin, No. 60. Ithaca, N. Y. College of Human Ecology, 1973.
Wilder, C. S.: Limitation of activity due to chronic condkions, United States, 1969 and 1970. Vital and Health Statistics. Series
10, No. 80. DHEW Pub. No. (HRA) 75–1506. National Center for Health Statistics, Health Resources Administration. Washington. U.S. Government Printing Office, Apr. 1973.
World Health Organization: Manual of the International Statistical
Classl~cation of Diseases, Injuries, and Causes of Death. Based on the Recommendations of the Ninth Revision Conference, 1975. Geneva. World Health Organization, 1977.
Yelin, E., Nevitt, M., and Epstein, W.: Toward an epidemiology of work disability. MiIbank Mere. Fund Q. 58:38(W 15, 1980.
27

List of Detailed Tables
1. Number of persons with selected musculoskeletal conditions and rate per 1,000 population, by sex, age, and race:
United States, 1980 . . . . . . . . . . . . . . . . . . . . . . . . . . . . . . . . . . . . . . . . . . . . . . . . . . . . . . 29
2. Functional limitation score and percent distribution of all persons and for persons with selected musculoskeletal
conditions by perceived health status, according to sex, age, race, and condition: United States, 1980 . . . . . . . . . . 30
3. Mean condition-related disability days and percent of total disability days reported by persons with selected
musculoskeletal conditions, by sex, age, race, and condition: United States, 1980 . . . . . . . . . . . . . . . . . . . . . 32
4. Ambulatory care and hospital utilization for all persons and for persons with selected musculoskeletal conditions, by
sex, age, race, andcondition: United States, 1980 . . . . . . . . . . . . . . . . . . . . . . . . . . . . . . . . . . . . . . 34
5. Percent of persons with selected musculoskeletal conditions who made 1 or more condition-related ambulatory visits,
by provider, sex, age, race, and condition: United States, 1980 . . . . . . . . . . . . . . . . . . . . . . . . . . . . . . . 36
6. Charges related to musculoskeletal conditions and percent distribution by type of health service, according to condition:
United States, 1980 . . . . . . . . . . . . . . . . . . . . . . . . . . . . . . . . . . . . . . . . . . . . . . . . . . . . . . 38
7. Condition-related per capita charges and percent of charges paid out of pocket for persons with selected
musculoskeletal conditions, by type of health service, age, sex, race, and condition: United States, 1980 . . . . . . . . . 39

Table 1
Number of persons with selected musc[lloskeletal conditions and rate per 1,000 population, by sex, age, and race: United States, 1980
All musculoskeletnl conditions Joints only Back only Joints and bark —
Number of Number of Rate per Number of Rate per Number of Rate per Number of Rate per pwsons in pfmons in 1,000 persons in 1,000 persons in 1,000 persons in 1,000
Sex, age, ancl race Lhrmsmds thousands population thousands population thousands population thousands population
Nlnle, all ages,........,.,.. 107,481 19,408 180.6 12,271 114.2 4,959 46.1 2,177 20.3 Uncler19ymrs . . . . . . . . . . . . . . . . . . 35,451 2,416 68.2 1,!338 54.7 *394 tl.1.l i84 $2.4 l!3-44yenrs, . . . . . . . . . . . . . . . . . . . . 41,709 7,381 177.0 4,067 97.5 2,424 58.1 891 21.4 45-64 years . . . . . . . . . . . . . . . . . . . . . 20,828 6,448 309.6 3,796 182.3 1,696 81.4 955 45.9 65yearsanc10ver . . . . . . . . . . . . . . . . 9,491 3,162 333.2 2,470 260.3 t445 t46.9 4248 +26.1
Female, alleges . . . . . . . . . . . . 115,344 24,704 214.2 16,307 141.4 5,543 48.1 2,854 24.7 Clndprl!lyears . . . . . . . . . . . . . . . . . . 34,233 2,810 82.1 1,918 56.0 767 22.4 $126 $3.7 19-44 yenrs . . . . . . . . . . . . . . . . . . . . . 44,383 7’,773 175.1 4,015 90.5 2,862 64.5 896 20.2 45–64 years . . . . . . . . . . . . . . . . . . . . . 22,750 7,727 339,7 5,441 239.2 1,309 57.6 976 42,9 .65yearsmdover . . . . . . . . . . . . . . . . 13,978 6,393 457.4 4,932 352.9 t605 t43.3 856 61.3
Race: Black . . . . . . . . . . . . . . . . . . . . . . . . 26,046 4,216 161,9 2,880 110.6 996 38.2 t341 t13.1 White andothcr . . . . . . . . . . . . . . . 196,779 39,895 202.7 25,698 130.6 9,507 48.3 4,691 23.8
NOTE: Figures maynot.add tototals becrtuse ofroundiag.

Table 2
Functional limitation score and percent distribution of all persons and for persons with selected musculoskeletal conditions by perceived health status,
according to sex, age, race, and condition: United States, 1980
Number of Functional Perceived health status Sex, age, race, persons in limitation and condition thousands score i Total Excellent Good Fair Poor
All persons Percent distribution
Total . . . . . . . . . . . . . . . . . . . 222,824 1.7 100.0 50.1 36.9 9.3 3.6
Male, all ages . . . . . . . . . . . . . 107,481 1.7 100.0 53.2 35.1 8.4 3.4 Under 19 years . . . . . . . . . . . . . . . . 35,451 1.2 100.0 62.1 34.0 3.6 0.4 19-44 years . . . . . . . . . . . . . . . . . . . 41,709 1.2 100.0 58.1 34.6 5.7 1.6 45-64 years . . . . . . . . . . . . . . . . . . . 20,828 1.9 100.0 39.8 38.0 14.1 8.1 65 years And over . . . . . . . . . . . . . . 9,491 3.1 100.0 27.4 35.4 25.3 12.0
Female, alleges . . . . . . . . . . . 115,344 1.8 100.0 47.3 38.6 10.3 2.8 Under 19years . . . . . . . . . . . . . . . . 34,233 1.2 100.0 62.7 33.4 3.6 0.3 19–44 years . . . . . . . . . . . . . . . . . . . 44,383 1.3 100.0 49.6 40.4 7.9 2.1 45-64 years . . . . . . . . . . . . . . . . . . . 22,750 1.9 100.0 33.2 43.4 15.9 7.4 65 years and over . . . . . . . . . . . . . . 13,978 3.3 100.0 24.9 38.0 24.9 12.3
Race: Black . . . . . . . . . . . . . . . . . . . . . . 26,046 1.8 100.0 42.6 40.9 11.2 5.3 %hiteando ther . . . . . . . . . . . . . 196,779 1.7 100.0 51.1 36.4 9.1 3.4
All musculoskeletal conditions
Total . . . . . . . . . . . . . . . . . . . 44,111 2.6 100.0 31.9 39.9 17.9 10.2
Male, all ages . . . . . . . . . . . . . 19,408 2.4 100.0 36.2 38.2 16.6 8.9 Under 19 years . . . . . . . . . . . . . . . . 2,416 1.6 100.0 49.2 41.6 7.9 1.3 19-44 years . . . . . . . . . . . . . . . . . . . 7,381 1.7 100.0 44.8 40.6 9.9 4.7 45-64 years . . . . . . . . . . . . . . . . . . . 6,448 2.7 100.0 28.8 38.6 19.3 13.3 65 years and over . . . . . . . . . . . . . . 3,162 3.6 100.0 21.5 29.5 33.3 15.7
Female, alleges . . . . . . . . . . . 24,704 2.7 100.0 28.5 41.2 19.0 11.2 Under 19 years . . . . . . . . . . . . . . . . 2,810 1.7 100.0 51.3 41.5 6.5 0.7 19-44 years . . . . . . . . . . . . . . . . . . . 7,773 1.8 100.0 35.6 44.4 13.0 7.0 45-64 years . . . . . . . . . . . . . . . . . . . 7,727 2.7 100.0 22.5 41.6 22.9 13.0 65 years and over . . . . . . . . . . . . . . 6,393 4.0 100.0 17.3 37.0 27.0 18.8
Race: Black . . . . . . . . . . . . . . . . . . . . . . 4,216 3.0 100.0 20.9 39.5 21.G 18.7 White and other . . . . . . . . . . . . . 39,895 2.5 100.0 33.1 40.0 17.6 9.3
Joints only
Total . . . . . . . . . . . . . . . . . . . 28,577 2.7 100.0 32.3 38.9 18.1 10.7
Male,alla Gus. . . . . . . . . . . . . 12,271 2.5 100.0 38.2 36.4 16.6 8.7 Under 19 years . . . . . . . . . . . . . . . . 1,938 1.3 100.0 49.9 41.5 6.9 1.7 19-44 years . . . . . . . . . . . . . . . . . . . 4,067 1.6 100.0 48.4 38.1 9.2 4.2 45-64 years . . . . . . . . . . . . . . . . . . . 3,796 2.7 100.0 33.4 S7.O 17.6 12.0 65 years and over . . . . . . . . . . . . . . 2,470 3.8 100.0 19.6 28.9 35.0 16.5
Female, all eges . . . . . . . . . . . 16,307 2.9 100.0 27.8 40.8 19.3 12.1 Under 19 years . . . . . . . . . . . . . . . . 1.918 1.8 100.0 50.4 42.4 6.7 0.5 19-44 years . . . . . . . . . . . . . . . . . . . 4,015 1.7 100.0 38.3 44.0 12.9 4.8 45-64 years . . . . . . . . . . . . . . . . . . . 5,441 2.? 100.0 22.6 40.9 21.4 15.1 65 years And over . . . . . . . . . . . . . . 4,932 4.1 100.0 16.2 37.5 26.9 19.3
Race: Black . . . . . . . . . . . . . . . . . . . . . . 2,880 3.1 100.0 22.3 34.2 22.5 21.1 White and other . . . . . . . . . . . . . 25,698 2,6 100.0 33.4 39.5 17.7 9.5
30

Table2 – continued
Functional limitation score and percent distribution of all persons and for persons with selected musculoskeletal conditions by perceived health status,
according to sex, age, race, and condition: United States, 1980
Number of Functional Perceived health status Sex, age, race, persons in limitat” on and condition thousands score i Total Excellent Good Fair Poor
Back only Percent distribution
Total . . . . . . . . . . . . . . . . . . . 10,502 2.0 100.0 37.1 43.4 13.7 5.8
Male, all ages . . . . . . . . . . . . . .4,959 100.0 37.4 43.0 12.9 6.8 Under 19 years . . . . . . . . . . . . . . . . t 394 w t100.0 t42.2 +47.5 t10.3 +-19-44 years . . . . . . . . . . . . . . . . . . . 2,424 1.6 100.0 43.9 44.7 7.6 3.8 45-64 years . . . . . . . . . . . . . . . . . . . 1,696 100.0 28.1 42.6 18.0 11.2 65yes.rs And over . . . . . . . . . . . . . . ?445 ?~8 t100.0 ?32.6 t30.8 +24.3 t12.2
Female, alleges . . . . . . . . . . . 5,543 2.1 100.0 36.8 43.7 14.5 4.9 Under 19 years . . . . . . . . . . . . . . . . 767 1.3 100.0 55.3 37.7 7.0 19-44 years . . . . . . . . . . . . . . . . . . . 2,862 1.8 100.0 36.0 47.3 10.9 5.8 45-64 years . . . . . . . . . . . . . . . . . . . 1,309 2.3 100.0 28.7 47.5 19.2 65 years and over . . . . . . . . . . . . . . t605 +3.0 t100.0 +35.0 t26.2 +30.8 t::;
Race: Black . . . . . . . . . . . . . . . . . . . . . . 996 2.4 100.0 22.0 58.4 11.7 7.9 IVhite and other . . . . . . . . . . . . . 9,507 2.0 100.0 38.7 41.8 18.9 5.6
Joints and back
Total . . . . . . . . . . . . . . . . . . . 5,031 3.0 100.0 19.3 38.3 25.6 16.9
Male, all ages . . . . . . . . . . . . . 2,177 2.7 100.0 22.5 37.5 24.9 15.1 Under 19 years . . . . . . . . . . . . . . . . $84 $4.0 $100.0 $64.6 $16.9 $18.6 $-19-44 years . . . . . . . . . . . . . . . . . . . 891 2.2 100.0 30.7 40.4 19.4 9.5 45-64 years . . . . . . . . . . . . . . . . . . . 955 100.0 11.7 37.7 28.6 21.9 65 years And over . . . . . . . . . . . . . . *248 & $100.0 $19.8 $33.3 $32.5 t14.4
Female, alleges . . . . . . . . . . . 2,854 100.0 16.8 38.9 26.1 18.3 Under 19 years . . . . . . . . . . . . . . . . $126 $;:: *100.0 *41.O $50.2 t- t8.8 19-44 years . . . . . . . . . . . . . . . . . . . 896 2.3 100.0 22.3 36.9 19.9 20.9 45-64 years . . . . . . . . . . . . . . . . . . . 976 3.1 100.0 13.5 37.3 36.3 12.9 65 years and over . . . . . . . . . . . . . . 856 4.2 100.0 11.2 41.1 24.7 23.0
Race: Black . . . . . . . . . . . . . . . . . . . . . . I-341 t3.o t100.0 ?6.2 t28.8 I’35.4 i’29.6 White and other . . . . . . . . . . . . . 4,691 3.0 100.0 20.2 39.0 24.8 16.0
lFunctional limitation iscomputed only for persons 17years ofage and over.
NOTE: Figures may not add to totals because of rounding.
31

.
.
..
.
.
.
Table 3
Mean condition-related disability days and percent of total disabili~ days reported by persons with selected musculoskeletal conditions, by sex, age, race, and condition: United States, 1980
Restricted- Bed-disability activity days days Work-loss days
Percent of Percent of Percent of Sex, age, race, and condition Mean total days Mean total days Mean total days
All musculoskeletal conditions
Total . . . . . . . . . . . . . . . . . . . . . . . . . . . . . . . . 8.8 30.4 2.3 25.0 2.7 29.3
Male, all ages . . . . . . . . . . . . . . . . . . . . . . . . . . 8.1 30.8 2.0 27.8 2.8 30.1 Under 19 years . . . . . . . . . . . . . . . . . . . . . . . . . . . . . 3.2 28.1 0.5 10.4 .. ... 19-44 years . . . . . . . . . . . . . . . . . . . . . . . . . . . . . . . . 5.4 26.1 1.4 24.1 3.2 32.0 45-64 years . . . . . . . . . . . . . . . . . . . . . . . . . . . . . . . . 11.2 35.9 3.0 37.5 2.6 30.0 65years ancl over . . . . . . . . . . . . . . . . . . . . . . . . . . . 11.9 28.7 2.2 23.2 1.3 14.3
Female, all ages . . . . . . . . . . . . . . . . . . . . . . . . 9.3 30.1 2.5 23.1 2.5 27.8 Under 19 years . . . . . . . . . . . . . . . . . . . . . . . . . . . . . 7.2 40.9 1.0 15.6 .. ... 19-44 years . . . . . . . . . . . . . . . . . . . . . . . . . . . . . . . . 7.5 28.7 2.2 23.2 2.5 29.8 45-64 years . . . . . . . . . . . . . . . . . . . . . . . . . . . . . . . . 10.0 32.1 2.4 24.2 3.1 26.7 65 years And over . . . . . . . . . . . . . . . . . . . . . . . . . . . 11.7 27.8 3.8 24.7 0.2 10.0
Race: Black. . . . . . . . . . . . . . . . . . . . . . . . . . . . . . . . . . . 14.4 35.7 5.6 38.1 9.2 55.8 White and other . . . . . . . . . . . . . . . . . . . . . . . . . . 8.2 29.7 1.9 22.1 2.0 23.5
Joints only
Total . . . . . . . . . . . . . . . . . . . . . . . . . . . . . . . . 8.3 29.0 2.0 22.0 2.4 25.8
Male, all ages . . . . . . . . . . . . . . . . . . . . . . . . . . 7.9 30.4 1.5 21.1 3.1 30.7 Under 19 years . . . . . . . . . . . . . . . . . . . . . . . . . . . . . 2.5 22.9 0.5 10.2 . ... 19-44 years . . . . . . . . . . . . . . . . . . . . . . . . . . . . . . . . 6.1 31.1 1.0 19.2 3.9 35.1 45-64 years . . . . . . . . . . . . . . . . . . . . . . . . . . . . . . . . 8.9 30.4 1.9 26.8 2.4 26.7 65 years Andover . . . . . . . . . . . . . . . . . . . . . . . . . . . 13.3 30.6 2.5 20.5 1.5 13.4
Female, all eges . . . . . . . . . . . . . . . . . . . . . . . . 8.7 28.5 2.3 21.7 1.7 20.5 Unde;19 years . . . . . . . . . . . . . . . . . . . . . . . . . . . . . 8.2 43.8 1.3 20.6 .. ... 19–44 years . . . . . . . . . . . . . . . . . . . . . . . . . . . . . . . . 5.4 24.3 1.6 20.6 2.0 26.3 45–64 years . . . . . . . . . . . . . . . . . . . . . . . . . . . . . . . . 9.7’ 30.5 1.9 18.8 1.8 16.5 65 years and over . . . . . . . . . . . . . . . . . . . . . . . . . . . 10.5 25.9 3.6 23.8 0.1 4.4
Race: Black . . . . . . . . . . . . . . . . . . . . . . . . . . . . . . . . . . . 13.2 33.8 5.4 35.1 7.5 59.6 White and other . . . . . . . . . . . . . . . . . . . . . . . . . . 7.8 28.5 1.6 19.0 1.9 21.1
Back only
Total . . . . . . . . . . . . . . . . . . . . . . . . . . . . . . . . 6.4 27.2 1.9 26.0 2.7 31.0
Male, all ages . . . . . . . . . . . . . . . . . . . . . . . . . . 5.1 24.3 34.0 1.5 20.8 Under 19 yea.rs . . . . . . . . . . . . . . . . . . . . . . . . . . . . . t7.1 +48.3 & t2.8 .. ... 19–44 years . . . . . . . . . . . . . . . . . . . . . . . . . . . . . . . . 2.0 12.0 1.5 31.3 1.1 15.5 45-64 years . . . . . . . . . . . . . . . . . . . . . . . . . . . . . . . . 65 .vears and over . . . . . . . . . . . . . . . . . . . . . . . . . . .
8.7 i’6.l
35.1 t17.o ~;::
45.5 +11.3
2.3 t1.5
28.4 1-34.9
Female, all eges . . . . . . . . . . . . . . . . . . . . . . . . 7.7 30.0 2.1 22.3 4.1 39.0 Under 19 years . . . . . . . . . . . . . . . . . . . . . . . . . . . . . 4.8 37.2 0.2 4.2 .. ... 19-44 years . . . . . . . . . . . . . . . . . . . . . . . . . . . . . . . . 7.1 27.5 1.$ 20.0 3.0 32.6 45-64 years . . . . . . . . . . . . . . . . . . . . . . . . . . . . . . . . 11.0 38.2 4.() 42.1 55.8 65 years And over . . . . . . . . . . . . . . . . . . . . . . . . . . . I’6.6 1’19.2 t1.3 18.7 “1::: t90.o
Race: Black . . . . . . . . . . . . . . . . . . . . . . . . . . . . . . . . . . . 17.7 42.1 5.8 44.6 1:.7 46.4 White and other . . . . . . . . . . . . . . . . . . . . . . . . . . 5.3 24.7 1.5 22.4 1.8 25.4
32

Table3 - continued
Mean condition-related disability days and percent of total disability days reported by persons with selected musculoskeletal conditions, by sex, age, race, and condition: United States, 1980
Restricted- Bed-disability activity days days Work-loss days
Percent of Percent. of Percent of Sex, age, race, and condition Mean total days Mean total days Mean total days
Joints and back
Total . . . . . . . . . . . . . . . . . . . . . . . . . . . . . . . . 16.4 39.4 5.0 36.5 3.6 37.5
Maie, all ages . . . . . . . . . . . . . . . . . . . . . . . . . . 16.4 41.0 5.1 39.5 4.9 46.2 Under 19 years . . . . . . . . . . . . . . . . . . . . . . . . . . . . . $- $- t- *- ... ... 19-44 years . . . . . . . . . . . . . . . . . . . . . . . . . . . . . . . . 11.7 32.1 3.2 28.6 6.1 47.7 45-64 years . . . . . . . . . . . . . . . . . . . . . . . . . . . . . . . . 24.5 49.0 50.9 4.1 47.6 65 years anciover . . . . . . . . . . . . . . . . . . . . . . . . . . . $7.9 $32.1 $H $18.1 $- $-
Female, all ages . . . . . . . . . . . . . . . . . . . . . . . . 16.3 38.1 4.9 34.3 2.1 24.7 Under 19years . . . . . . . . . . . . . . . . . . . . . . . . . . . . . $6.2 +21.1 *.9 $5.0 ... ... 19-44 years . . . . . . . . . . . . . . . . . . . . . . . . . . . . . . . . 18.5 42.0 6.0 37.0 2.8 29.4 45-64 years . . . . . . . . . . . . . . . . . . . . . . . . . . . . . . . . 10.5 33.4 3.1 32.6 18.7 65 years Andover . . . . . . . . . . . . . . . . . . . . . . . . . . . 22.2 39.4 6.2 35.6 ::: 22.2
Race: Black . . . . . . . . . . . . . . . . . . . . . . . . . . . . . . . . . . . t 15.6 ?33.3 t5.9 t41.s tll.3 +94.2 White and other . . . . . . . . . . . . . . . . . . . . . . . . . . 16.4 39.8 4.9 35.8 3.0 31.7
33

Table 4
Ambulatory care and hospital utilization for all persons and for persons with selected musculoskeletal conditions, by sex, age, race, and condition: United States, 1980
Ambulatory visits Hospital admissions Hospital days
Condition- Condition- Condition-Sex, age, race, and condition related Total related Total related Total
All persons Number per person Number per l, 000 population
Total . . . . . . . . . . . . . . . . . . . . . . . . . . . . . . . . . . . . . ... 5.2 ... 175 ... 1,218
Male, all ages . . . . . . . . . . . . . . . . . . . . . . . . . . . . . . . ... 4.4 ... 157 ... 1,161 Under 19 years . . . . . . . . . . . . . . . . . . . . . . . . . . . . . . . . . . ... 3.9 ... 133 ... 506 19–44 years . . . . . . . . . . . . . . . . . . . . . . . . . . . . . . . . . . . . ... 3.6 ... 98 ... 635 45-64 years . . . . . . . . . . . . . . . . . . . . . . . . . . . . . . . . . . . . ... 5.2 ... 188 ... 1,725 65 years And over . . . . . . . . . . . . . . . . . . . . . . . . . . . . . . . . ... 7.5 ... 435 ... 4,688
Female, all eges . . . . . . . . . . . . . . . . . . . . . . . . . . . . . ... 5.9 ... 192 ... 1,271 Under 19 years . . . . . . . . . . . . . . . . . . . . . . . . . . . . . . . . . . ... 3.8 ... 122 ... 429 19-44years . . . . . . . . . . . . . . . . . . . . . . . . . . . . . . . . . . . . ... 5.9 ... 200 ... 1,036 45-64.years . . . . . . . . . . . . . . . . . . . . . . . . . . . . . . . . . . . . ... 6.9 ... 184 ... 1,516 65 years And over . . . . . . . . . . . . . . . . . . . . . . . . . . . . . . . . ... 9.3 ... 352 ... 3,683
Race: Black . . . . . . . . . . . . . . . . . . . . . . . . . . . . . . . . . . . . . . . ... 4.3 ... 174 ... 1,408 White and other . . . . . . . . . . . . . . . . . . . . . . . . . . . . . . ... 5.3 ... 175 ... 1,193
All musculoskeletal conditions
Total . . . . . . . . . . . . . . . . . . . . . . . . . . . . . . . . . . . . . 3.4 9.5 51 280 537 2,430
Male, all ages . . . . . . . . . . . . . . . . . . . . . . . . . . . . . . . 3.1 8.1 58 252 665 2,366 Under 19 years . . . . . . . . . . . . . . . . . . . . . . . . . . . . . . . . . . 1.8 5.9 20 167 180 737 19-44years . . . . . . . . . . . . . . . . . . . . . . . . . . . . . . . . . . . . 3.1 7.4 58 144 352 868 45-64years . . . . . . . . . . . . . . . . . . . . . . . . . . . . . . . . . . . . 3.3 8.5 67 271 924 2,880 65 years And over . . . . . . . . . . . . . . . . . . . . . . . . . . . . . . . . 3.4 10.7 68 529 1,240 6,060
Female, all eges . . . . . . . . . . . . . . . . . . . . . . . . . . . . . 3.7 10.7 45 302 436 2,481 Under 19 years . . . . . . . . . . . . . . . . . . . . . . . . . . . . . . . . . . 3.0 8.0 34 154 447 813 19-44years . . . . . . . . . . . . . . . . . . . . . . . . . . . . . . . . . . . . 3.6 10.3 43 256 261 1,639 45-64years . . . . . . . . . . . . . . . . . . . . . . . . . . . . . . . . . . . . 3.8 10.8 45 261 335 1,973 65 years And over . . . . . . . . . . . . . . . . . . . . . . . . . . . . . . . . 3.9 12.1 53 472 764 4,851
Race: Black . . . . . . . . . . . . . . . . . . . . . . . . . . . . . . . . . . . . . . . 3.8 10.9 84 336 796 3,036 White and other . . . . . . . . . . . . . . . . . . . . . . . . . . . . . . . 3.4 9.4 47 274 509 2,366
Joints only
Total . . . . . . . . . . . . . . . . . . . . . . . . . . . . . . . . . . . . . 2.6 9.2 48 546 2,694
Male, all eges . . . . . . . . . . . . . . . . . . . . . . . . . . . . . . . 2.5 8.1 59 283 776 2,800 Under 19years . . . . . . . . . . . . . . . . . . . . . . . . . . . . . . . . . . 1.5 5.8 25 194 223 837 19-44years . . . . . . . . . . . . . . . . . . . . . . . . . . . . . . . . . . . . 2.6 7.4 54 159 264 1,040 45-64years . . . . . . . . . . . . . . . . . . . . . . . . . . . . . . . . . . . . 2.4 8.4 69 284 1,124 3,119 65 years And over . . . . . . . . . . . . . . . . . . . . . . . . . . . . . . . . 3.1 10.4 77 553 1,518 6,750
Female, all eges . . . . . . . . . . . . . . . . . . . . . . . . . . . . . 2.7 10.0 40 324 373 2,614 Under 19years . . . . . . . . . . . . . . . . . . . . . . . . . . . . . . . . . . 2.1 7.3 38 167 635 994 19-44 years . . . . . . . . . . . . . . . . . . . . . . . . . . . . . . . . . . . . z-~ 9.1 36 244 125 1,371 45–64years . . . . . . . . . . . . . . . . . . . . . . . . . . . . . . . . . . . . 2.9 10.4 282 193 1,975 65 years And over . . . . . . . . . . . . . . . . . . . . . . . . . . . . . . . . 3.1 11.3 % 494 672 4.962
Race: Black . . . . . . . . . . . . . . . . . . . . . . . . . . . . . . . . . . . . . . . 3.5 11.3 87 3’71 77!3 3,562 White and other . . . . . . . . . . . . . . . . . . . . . . . . . . . . . . . 2.5 8.9 44 299 520 2,597
34

Table4 - continued
Ambulatory care and hospital utilization for ali persons and for persons with selected musculoskeletal conditions, by sex, age, race, and condition: United S’tites, 1980
Ambulatory visits Hospital admissions Hospital days
Condition- Condition- Condition-Sex, age, race, and condition related Total related Total related Total
Back only Number per person Number per 1,000 population
Total . . . . . . . . . . . . . . . . . . . . . . . . . . . . . . . . . . . . . 3.8 8.5 31 174 357 1,334
Male, all ages . . . . . . . . . . . . . . . . . . . . . . . . . . . . . . . 6.8 33 156 258 1,161 Under 19 years . . . . . . . . . . . . . . . . . . . . . . . . . . . . . . . . . . i::: $6.3 t- ?67 ~– +397 19-44 years . . . . . . . . . . . . . . . . . . . . . . . . . . . . . . . . . . . . 2.5 5.7 41 82 276 426 45-64 years . . . . . . . . . . . . . . . . . . . . . . . . . . . . . . . . . . . . 4.0 194 360 1,958 65 years And over . . . . . . . . . . . . . . . . . . . . . . . . . . . . . . . . ~4.2 t3: +493 _i- i’2,797
Female, all eges . . . . . . . . . . . . . . . . . . . . . . . . . . . . . 4.4 10.1 29 190 446 1,490 Under 19years . . . . . . . . . . . . . . . . . . . . . . . . . . . . . . . . . . 5.1 8.8 100 443 1944years . . . . . . . . . . . . . . . . . . . . . . . . . . . . . . . . . . . . 4.3 10.5 28 211 339 1,355 45-64years . . . . . . . . . . . . . . . . . . . . . . . . . . . . . . . . . . . . 147 502 1,183 65 years Andover . . . . . . . . . . . . . . . . . . . . . . . . . . . . . . . . J:: T1?:: ‘t:: ?301 t1,400 t4,124
Race: Black . . . . . . . . . . . . . . . . . . . . . . . . . . . . . . . . . . . . . . . 3.4 8.0 42 240 658 1,939 White and other . . . . . . . . . . . . . . . . . . . . . . . . . . . . . . . 3.8 8.6 30 167 326 1,271
Joints and back
Total . . . . . . . . . . . . . . . . . . . . . . . . . . . . . . . . . . . . . 7.1 13.8 106 351 857 3,219
Male, all ages . . . . . . . . . . . . . . . . . . . . . . . . . . . . . . . Under 19 years . . . . . . . . . . . . . . . . . . . . . . . . . . . . . . . . . . *:::
11.1 $7.6
112 *-
294 $-
968 *-
2,666 *-
19-44years . . . . . . . . . . . . . . . . . . . . . . . . . . . . . . . . . . . . 6.7 11.8 123 241 963 1,290 45-64years . . . . . . . . . . . . . . . . . . . . . . . . . . . . . . . . . . . . 11.1 115 356 1,128 3,570 65 years And over . . . . . . . . . . . . . . . . . . . . . . . . . . . . . . . . t::; *10.3 %98 +347 $699 $5,032
Female, all eges . . . . . . . . . . . . . . . . . . . . . . . . . . . . . 15.7 101 394 772 3,641 Under 19 years . . . . . . . . . . . . . . . . . . . . . . . . . . . . . . . . . . ii:: $12.7 $187 $275 ‘$317 $317 19-44 years . . . . . . . . . . . . . . . . . . . . . . . . . . . . . . . . . . . . 7.4 15.4 120 452 620 3,746 45-64years . . . . . . . . . . . . . . . . . . . . . . . . . . . . . . . . . . . . 8.6 15.6 106 293 901 3,020 65 years and over . . . . . . . . . . . . . . . . . . . . . . . . . . . . . . . . 7.8 16.6 64 466 851 4,726
Race: Black . . . . . . . . . . . . . . . . . . . . . . . . . . . . . . . . . . . . . . . f7.4 t16.1 t184 T320 t1,345 t1,795 White andother . . . . . . . . . . . . . . . . . . . . . . . . . . . . . . . 7.0 13.6 100 353 821 3,322
35

Table 5
Percent of Dersons with selected musculoskeletal conditions who made 1 or more condition-related ambulatory visits, by provider, sex, age, race, and condition: United States, 1980
Other Any nonphysic” an
Sex, age, race, and condition providerl Physician Chiropractor Podiatrist provider ?2
All musculoskeletal conditions Percent
Total . . . . . . . . . . . . . . . . . . . . . . . . . . . . . . . . . 67.2 55.1 13.1 2.5 10.8
Male, all ages . . . . . . . . . . . . . . . . . . . . . . . . . . . . 64.2 52.5 13.1 2.0 10.1 Under 19 years . . . . . . . . . . . . . . . . . . . . . . . . . . . . . . 80.8 70.7 5.2 2.7 10.3 19-44 years . . . . . . . . . . . . . . . . . . . . . . . . . . . . . . . . . 64.4 51.3 15.3 2.7 10.2 45-64 years . . . . . . . . . . . . . . . . . . . . . . . . . . . . . . . . . 60.7 48.2 15.1 0.9 10.9 65 years and over . . . . . . . . . . . . . . . . . . . . . . . . . . . . 58.4 50.2 10.2 1.7 8.0
Female, allages . . . . . . . . . . . . . . . . . . . . . . . . . 69.6 57.2 13.1 2.9 11.4 Under 19 years . . . . . . . . . . . . . . . . . . . . . . . . . . . . . . 79.6 68.5 8.8 2.0 12.9 19-44 years . . . . . . . . . . . . . . . . . . . . . . . . . . . . . . . . . 72.9 53.7 19.5 2.3 11.3 45-64 years . . . . . . . . . . . . . . . . . . . . . . . . . . . . . . . . . 67.7 58.9 11.4 3.2 11.6 65 yearsand over . . . . . . . . . . . . . . . . . . . . . . . . . . . . 63.4 54.3 9.5 3.8 10.5
Race: Black . . . . . . . . . . . . . . . . . . . . . . . . . . . . . . . . . . . . 68.0 62.4 4.0 1.2 10.0 Whiteandother . . . . . . . . . . . . . . . . . . . . . . . . . . . 67.1 54.4 14.1 2.6 10.9
Joints only
Total . . . . . . . . . . . . . . . . . . . . . . . . . . . . . . . . . 65.3 58.8 4.3 3.3 10.7
Male, all ages . . . . . . . . . . . . . . . . . . . . . . . . . . . 62.8 57.4 3.6 2.7 11.0 Under 19 years . . . . . . . . . . . . . . . . . . . . . . . . . . . . . . 80.0 73.9 0.5 3.4 6.8 19-44 years . . . . . . . . . . . . . . . . . . . . . . . . . . . . . . . . . 61,7 55.8 3.8 4.1 13.2 45-64 years . . . . . . . . . . . . . . . . . . . . . . . . . . . . . . . . . 58.’7 5s.0 5.7 1.3 12.7 65years andover . . . . . . . . . . . . . . . . . . . . . . . . . . . . 57.6 54.1 2.7 2.2 8.2
Female, allages . . . . . . . . . . . . . . . . . . . . . . . . . 67.2 59.8 4.8 3.7 10.5 Under 19 years . . . . . . . . . . . . . . . . . . . . . . . . . . . . . . 79.5 72.9 1.2 2.9 13.4 19-44 years . . . . . . . . . . . . . . . . . . . . . . . . . . . . . . . . . 70.2 58.9 7.9 3.9 8.7 45-64 years . . . . . . . . . . . . . . . . . . . . . . . . . . . . . . . . . 66.9 60.4 4.7 3.8 12.3 65years andover . . . . . . . . . . . . . . . . . . . . . . . . . . . . 60.4 54.8 3.7 3.8 8.8
Race: Black. . . . . . . . . . . . . . . . . . . . . . . . . . . . . . . . . . . . 68.8 64.2 1.0 9.6 White and other . . . . . . . . . . . . . . . . . . . . . . . . . . . 64.9 58.2 4.8 3.5 10.9
Back only
Total . . . . . . . . . . . . . . . . . . . . . . . . . . . . . . . . . 66.4 40.5 29.9 8.2
Male, all ages . . . . . . . . . . . . . . . . . . . . . . . . . . . 63.2 36.4 30.3 5.9 Under 19 years . . . . . . . . . . . . . . . . . . . . . . . . . . . . . . I’84.1 t52.6 t25.9 $- ‘i22.6 19-44 years . . . . . . . . . . . . . . . . . . . . . . . . . . . . . . . . . 64.9 39.0 29.3 4.9 45–64 years . . . . . . . . . . . . . . . . . . . . . . . . . . . . . . . . . 57.2 31.3 30.4 3.9 65yearsandwer . . . . . . . . . . . . . . . . . . . . . . . . . . . . t58.3 t 27.2 t39.4 t– t3.9
Female, allages . . . . . . . . . . . . . . . . . . . . . . . . . 69.3 44.2 29.5 10.2 Under 19 years . . . . . . . . . . . . . . . . . . . . . . . . . . . . . . 80.0 57.4 25.8 11.7 19-44 years . . . . . . . . . . . . . . . . . . . . . . . . . . . . . . . . . 71.2 41.6 30.5 12.4 45-64 years . . . . . . . . . . . . . . . . . . . . . . . . . . . . . . . . . 65 years And over . . . . . . . . . . . . . . . . . . . . . . . . . . . .
62.6 t60.9
44.7 t’38.5
28.9 “P31.1 ~:
7.3 ‘1’4.4
Race: Black . . . . . . . . . . . . . . . . . . . . . . . . . . . . . . . . . . . . 61.1 53.9 9.6 9.6 White zmd other . . . . . . . . . . . . . . . . . . . . . . . . . . . 67.0 39.1 32.0 8.0
36

TabIe5 - continued
Percent of persons with selected musculoskeletal conditions who made 1 or more condition-related ambulatory visits, by provider, sex, age, race, and condition: United States, 1980
Other Any nonphysic”an
Sex, age, race, and condition provider 1 Physician Chiropractor Podiatrist provider ?2
Joints and back Percent
Total . . . . . . . . . . . . . . . . . . . . . . . . . . . . . . . . . 79.7 64.9 28.5 3.4 16.7
Male, all ages . . . . . . . . . . . . . . . . . . . . . . . . . . . 74.6 61.6 27.8 2.2 14.3 Under 19 years . . . . . . . . . . . . . . . . . . . . . . . . . . . . . . +S2.6 $82.6 $16.9 t- $33.8 19-44 years . . . . . . . . . . . . . . . . . . . . . . . . . . . . . . . . . 75.9 64.4 29.7 3.9 10.7 45-64 .years . . . . . . . . . . . . . . . . . . . . . . . . . . . . . . . . . 74.8 59.5 25.6 1.3 15.9 65 years and over . . . . . . . . . . . . . . . . . . . . . . . . . . . . +66.8 $52.S $32.9 *- $14.0
Female, all ages . . . . . . . . . . . . . . . . . . . . . . . . . 83.6 67.5 29.1 4.3 18.5 Under 19 years . . . . . . . . . . . . . . . . . . . . . . . . . . . . . . $80.0 $68.8 $’19.3 *- $11.6 19-44years . . . . . . . . . . . . . . . . . . . . . . . . . . . . . . . . . 90.0 69.5 36.2 3.0 19.3 45-64 years . . . . . . . . . . . . . . . . . . . . . . . . . . . . . . . . . 79.0 65years andover . . . . . . . . . . . . . . . . . . . . . . . . . . . . 82.7
69.6 62.7
25.3 27.5
4.1 6.4
13.4 24.7
Race: Black . . . . . . . . . . . . . . . . . . . . . . . . . . . . . . . . . . . . tS1.8 t71.6 t21.5 I’6.2 t14.1 White and other . . . . . . . . . . . . . . . . . . . . . . . . . . . 79.6 64.5 29.0 3.1 16.9
1Categories do not add to total because of multiple responses. 21ncludes optometrists, psychologists, social workers, nurses, physical therapists, and others.
37

Table 6
Charges related to musculoskeletal conditions and percent distribution by type of health service, according to condition: United States, 1980
Ambulatory care
Inpatient Other Total condition hospita
!2 Physicia
? p:ofessio~al Prescribed
Condition related charges services services services medications
All musculoskeletal conditions . . . $12,234 $7,232
Joints only . . . . . . . . . . . . . . . . . . . . . . . 8,026 5,248 Back only . . . . . . . . . . . . . . . . . . . . . . . . 1,962 822 Joints and back . . . . . . . . . . . . . . . . . . . 2,247 1,162
All musculoskeletal conditions . . . 100.0 59.1
Joints only . . . . . . . . . . . . . . . . . . . . . . . 100.0 65.4 Back only . . . . . . . . . . . . . . . . . . . . . . . . 100.0 41.9 Joints and back . . . . . . . . . . . . . . . . . . . 100.0 51.5
Amount in millions
$2,598 $1,624 $780
1,591 624 564 498 566 76 510 435 140
Percent distribution
21.2 13.3 6.4
19.8 7.8 7.0 25.4 28.8 3.9 22.7 19.6 6.2
lDoes not include $246 million for dental services and other medical service charges incurred in the treatment of musculoskeletal ~onditions.
Includes inpatient physician services. 31ncludes physician office visits and outpatient physician services. 41ncludes chiropractors, podiatrists, social workers, nurses, physical therapists, and others, as well as emergency room services.
NOTE: Figures may not add to totals because of rounding.

Table 7
Condition-related per capita charges and percent of charges paid out of pocket for persons with selected
musculoskeletal conditions, l)y type of ]lealtll service, age, SCX, race, and condition: United States, 1!)80
All health Hospital Prescribed Ambulatory Dental and other services .ac1missions medications visits medicnl services
Number of Per Percent Per Percent Per Percent Per Percent. Per Percent persons ir~ capita out of crrpita out of capita out of capita out of capita out of
Age, sex, rrrce, and condition thousands charge pocket chrrrge pocket chrrrge pocket chrrrge pocket charge pocket
All rnusculoskeleta I conditions
Total . . . . . . . . . . . . . . . . . . . . . . . . . . . . 44,111 $283 22.7 $164 11.9 $18 58.5 $96 32.G $G 56.7
Age: l_Inde)19yPars . . . . . . . . . . . . . . . . . . . . . . . 5,22(5 178 18.1 91 3.4 2 77.4 69 30.3 17 43.5 19-44 years . .,, , .,, . . . . . . . . . . . . . . . . . . 15,154 232 27.G 122 21.4 9 54.8 98 31.5 3 69.0 45-64 years . . . . . . . . . . . . . . . . . . . . . . . . . . 14,175 312 19.1 180 5.G 25 54.4 103 32.1 4 74.1 65yenrsnnd over . . . . . . . . . . . . . . . . . . . . . 9,556 378 23.4 246 12.9 30 64.7 96 36.0 G 50.7
,9 ex: Male, . . . . . . . . . . . . . . . . . . . . . . . . . . . . . . . Female . . . . . . . . . . . . . . . . . . . . . . . . . . . . . .
1!),40!!3 24,704
316 257
22.G 22.8
207 130
14.9 8.1
15 20
GO.9 57.0
89 101
31.7 33.2
5 ti
64.5 51.3
Rats: IUnck . . . . . . . . . . . . . . . . . . . . . . . . . . . . . . . 4,216 318 18.3 lG1 lG.4 17 46.2 135 lG.G 5 27.6 White anrl other . . . . . . . . . . . . . . . . . . . . . . . 39,895 279 23.2 1(34 11.4 18 59.7 92 35.0 6 59.8
.Joints cmlty
‘fOhll . . . . . . . . . . . . . . . . . . . . . . . . . . . . 28,577 286 21.7 184 12.2 20 59.5 77 31.6 5 66.9
Age: [Jnder19years . . . . . . . . . . . . . . . . . . . . . . . 3,856 184 1(3.1 119 3.5 2 83.1 5G 33.9 7 72.0 19-4,! years . . . . . . . . . . . . . . . . . . . . . . . . . . 8,082 216 30.4 129 2G.6 9 59.0 74 31.0 4 78.6 45-G4~erms . . . . . . . . . . . . . . . . . . . . . . . . . . 9,237 2!I!J 17.!J 188 4.2 27 54,8 81 34.1 4 88.2 (Niyrmrsandovcr . . . . . . . . . . . . . . . . . . . . . 7,402 3!)8 21.4 272 13,6 33 63.8 87 28.5 6 39.1
Sex: Male . . . . . . . . . . . . . . . . . . . . . . . . . . . . . . . . 12,271 22,1 2G3 lG.1 16 61.9 30.2 6 74.3 Femnlc . . . . . . . . . . . . . . . . . . . . . . . . . . . . . . 16,307 226 21.1 124 6,1 23 58,3 ;; 32.7 4 57,7
Race: Black . . . . . . . . . . . . . . . . . . . . . . . . . . . . . . . White rtnd othe r . . . . . . . . . . . . . . . . . . . . . .
2,880 25,698
298 284
13.6 22.(3
158 186
9.8 12A
20 20
38.4 61.9
11(J 73
13.4 34.8
4 rj
45.9 68.7

--Tab1c7 continued
Condition-related per capita charges and percent of charges paid out of pocket for persons with selected muwxdoskeletal conditions, by type of health set-vice, age, sex, race, and condition: United States, 1980
All health Hospital Prescribed Ambulatory Dental and other services admissions medications visits medical services
Number of Per Percent Per Percent Per Percent Per Percent Per Percent persons inl capita out of capita out of capita out of capita out of capita out of
Age, sex, race, and condition thousands charge pocket charge pocket charge pocket charge pocket charge pocket
Back only
‘fOt,al . . . . . . . . . . . . . . . . . . . . . . . . . . . . 10,502 $195 24.7 $78 8.9 45.2 $101 34.7 34.3
Age: tJnder19vears . . . . . . . . . . . . . . . . . . . . . . . 1,161 15!9 25.3 1 41.4 106 22.8 52 30.1 19–44 yea& . . . . . . . . . . . . . . . . . . . . . . . . . . 5,286 186 21.4 75 6.0 7 40.7 103 30.6 2 64.1 45–64yerws . . . . . . . . . . . . . . . . . . . . . . . . . . 3,006 210 30.1 93 17.3 9 47.3 103 40.2 4 26.4 65 years and over . . . . . . . . . . . . . . . . . . . . . 1,049 236 23.8 141 0.8 8 58.9 84 57.1 3 74.9
Sex: Male . . . . . . . . . . . . . . . . . . . . . . . . . . . . . . . . 4,959 165 26.7 74 12.1. 9 40.8 79 38.7 3 27.8 Female . . . . . . . . . . . . . . . . . . . . . . . . . . . . . . 5,543 222 23.4 82 6.3 G 5~.7 122 32.4 12 35.9
Race: Black . . . . . . . . . . . . . . . . . . . . . . . . . . . . . . . 996 322 21.4 125 29.9 8 56.9 177 14,6 12 8.3 White and other . . . . . . . . . . . . . . . . . . . . . . . 9,507 181 25.4 73 5.2 7 43.8 93 38.7 8 38.6
Joints and back
Total . . . . . . . . . . . . . . . . . . . . . . . . . . . . 5,031 451 24.5 231 12.5 28 61.5 188 32.4 5 76.9
Age: Under lOyears . . . . . . . . . . . . . . . . . . . . . . . *21O t 196 i21.3 *9O $– $1 t42.1 f 102 *37.3 +3 t 100.0 lfl-44 years . . . . . . . . . . . . . . . . . . . . . . . . . . 1,786 442 29.0 234 22.9 12 66.4 192 33.9 5 37.3 45–64 years . . . . . . . . . . . . . . . . . . . . . . . . . . 1,932 531 15.8 277 4.2 43 55.5 209 22.0 3 100.0 65years andover . . . . . . . . . . . . . . . . . . . . . 1,104 374 37.8 173 14.4 32 72.5 161 52.8 8 100.0
Sex: Male . . . . . . . . . . . . . . . . . . . . . . . . . . . . . . . . 2,177 389 21.1 200 8.2 26 73.5 160 28.1 4 43.7 Female . . . . . . . . . . . . . . . . . . . . . . . . . . . . . . 2,854 498 26.5 255 15.1 29 53.4 209 35.0 5 94.0
Race: Black . . . . . . . . . . . . . . . . . . . . . . . . . . . . . . . t341 t478 t37.2 +287 t 30.0 t24 t88.9 t 166 t41.8 tl t 100.0 White and other . . . . . . . . . . . . . . . . . . . . . . . 4,691 449 23.5 227 10.9 28 59.8 189 31.8 5 76.6
*Figures may not add to totals because of rounding.

Appendixes
uontents
1. Sample Design, Data Collection, and Processing . . . . . . . . . . . . . . . . . . . . . . . . . . . . . . . . . . . . . . . . . . . . . . . . . . . . . . 42 Introduction . . . . . . . . . . . . . . . . . . . . . . . . . . . . . . . . . . . . . . . . . . . . . . . . . . . . . . . . . . . . . . . . . . . . . . . . . . . . . . . . . . . . . 42 Survey Background . . . . . . . . . . . . . . . . . . . . . . . . . . . . . . . . . . . . . . . . . . . . . . . . . . . . . . . . . . . . . . . . . . . . . . . . . . . . . . 42 Sample Design . . . . . . . . . . . . . . . . . . . . . . . . . . . . . . . . . . . . . . . . . . . . . . . . . . . . . . . . . . . . . . . . . . . . . . . . . . . . . . . . . 42 Research Triangle institute Sample Design . . . . . . . . . . . . . . . . . . . . . . . . . . . . . . . . . . . . . . . . . . . . . . . . . . . . . . . . . 43 National Opinion Research Center Sample Design . . . . . . . . . . . . . . . . . . . . . . . . . . . . . . . . . . . . . . . . . . . . . . . . . . 43 Data Collection . . . . . . . . . . . . . . . . . . . . . . . . . . . . . . . . . . . . . . . . . . . . . . . . . . . . . . . . . . . . . . . . . . . . . . . . . . . . . . . . . 44 Weighting . . . . . . . . . . . . . . . . . . . . . . . . . . . . . . . . . . . . . . . . . . . . . . . . . . . . . . . . . . . . . . . . . . . . . . . . . . . . . . . . . . . . . . 44 Survey Nonresponse . . . . . . . . . . . . . . . . . . . . . . . . . . . . . . . . . . . . . . . . . . . . . . . . . . . . . . . . . . . . . . . . . . . . . . . . . . . . . 45 Attrition Imputation . . . . . . . . . . . . . . . . . . . . . . . . . . . . . . . . . . . . . . . . . . . . . . . . . . . . . . . . . . . . . . . . . . . . . . . . . . . . . . 45 item Nonresponse andlmputation . . . . . . . . . . . . . . . . . . . . . . . . . . . . . . . . . . . . . . . . . . . . . . . . . . . . . . . . . . . . . . . . . 46
Il. Data Modifications to Public Use Files . . . . . . . . . . . . . . . . . . . . . . . . . . . . . . . . . . . . . . . . . . . . . . . . . . . . . . . . . . . . . . 48 Ill. Analytical Strategies . . . . . . . . . . . . . . . . . . . . . . . . . . . . . . . . . . . . . . . . . . . . . . . . . . . . . . . . . . . . . . . . . . . . . . . . . . . . . . . 50
Notion of an Average Population . . . . . . . . . . . . . . . . . . . . . . . . . . . . . . . . . . . . . . . . . . . . . . . . . . . . . . . . . . . . . . . . . . 50 Role of Weights andlmputation . . . . . . . . . . . . . . . . . . . . . . . . . . . . . . . . . . . . . . . . . . . . . . . . . . . . . . . . . . . . . . . . . . 51 Estimation Procedures . . . . . . . . . . . . . . . . . . . . . . . . . . . . . . . . . . . . . . . . . . . . . . . . . . . . . . . . . . . . . . . . . . . . . . . . . . . 54
Iv. Sampling Errors . . . . . . . . . . . . . . . . . . . . . . . . . . . . . . . . . . . . . . . . . . . . . . . . . . . . . . . . . . . . . . . . . . . . . . . . . . . . . . . . . . . 56 Totals . . . . . . . . . . . . . . . . . . . . . . . . . . . . . . . . . . . . . . . . . . . . . . . . . . . . . . . . . . . . . . . . . . . . . . . . . . . . . . . . . . . . . . . . . 57 Means . . . . . . . . . . . . . . . . . . . . . . . . . . . . . . . . . . . . . . . . . . . . . . . . . . . . . . . . . . . . . . . . . . . . . . . . . . . . . . . . . . . . . . . . . 57 Proportions, Percents, and Prevalence Rates . . . . . . . . . . . . . . . . . . . . . . . . . . . . . . . . . . . . . . . . . . . . . . . . . . . . . . . . 59 Mutually Exclusive Subgroup Differences . . . . . . . . . . . . . . . . . . . . . . . . . . . . . . . . . . . . . . . . . . . . . . . . . . . . . . . . . . . 60 Subgroup to Total Group Differences . . . . . . . . . . . . . . . . . . . . . . . . . . . . . . . . . . . . . . . . . . . . . . . . . . . . . . . . . . . . . . 61
v. Definition of Terms . . . . . . . . . . . . . . . . . . . . . . . . . . . . . . . . . . . . . . . . . . . . . . . . . . . . . . . . . . . . . . . . . . . . . . . . . . . . . . . . 62
ListofAppendix Figures
1. Dynamic population for12 time period panel survey . . . . . . . . . . . . . . . . . . . . . . . . . . . . . . . . . . . . . . . . . . . . . . . . . . 50 Il. Estimated mean charges per hospital outpatient department visit, by 4 family income classes for all and real data:
United States, 1980 . . . . . . . . . . . . . . . . . . . . . . . . . . . . . . . . . . . . . . . . . . . . . . . . . . . . . . . . . . . . . . . . . . . . . . . . . . . . . . . 53 Ill. Estimated mean charges per hospital outpatient department visit, by 16 imputation classes for all persons and
for persons in families with income less than $5,000: United States, 1980 . . . . . . . . . . . . . . . . . . . . . . . . . . . . . . .
ListofAppenctixTables
1. Percent of data imputed for selected survey itemsin 4ofthe NMCUES public use data files:United States, 1980... 46 Il. Effect of person-year adjustment on counts and sampling weights, by 4 population groups: United States, 1980 . . . 51 Ill. Sample size, means, and standard errors for 5 disability measures, by all and real data subgroups: United
States, 1980 . . . . . . . . . . . . . . . . . . . . . . . . . . . . . . . . . . . . . . . . . . . . . . . . . . . . . . . . . . . . . . . . . . . . . . . . . . . . . . . . . . . . . . 52 [v. Sample size, means, standard errors, and element variance for total charge for a hospital outpatient department visit,
by data type: United States, 1980 . . . . . . . . . . . . . . . . . . . . . . . . . . . . . . . . . . . . . . . . . . . . . . . . . . . . . . . . . . . . . . . . . . . 52 v. Coefficients for standard error formula for estimated aggregates or totals, by estimator . . . . . . . . . . . . . . . . . . . . . . 57 V1. Values for mh and.# for standard error formula for estimated means, by estimator . . . . . . . . . . . . . . . . . . . . . . . . . 58 V1l.Values of roh for standard error formula for estimated proportions, by estimator . . . . . . . . . . . . . . . . . . . . . . . . . . . . 59
41

Appendix 1.Sample Design, DataCollection, and Processing
Introduction
The National Medical Care Utilization and Expenditure Survey (NMCUES) was designed to collect data about the U.S. civilian noninstitutional ized population during 1980. Because of the complexity of the survey, the analyst must be familiar with a range of design features, both to determine appropriate analytic methods and to investigate the impact that the design may have on a particular analysis. Several topics are addressed in this appendix: The overall design of NMCUES, the survey background, sampling methods, data collection methods, weighting, and compensation procedures for missing data. In these descriptions, the NMCUES data are presented essentially as they are available to the user of the public use data tape. This appendix draws heavily from a paper in the Proceedings of the 19th National Meeting of the Public Health Conference on Records and Statistics (Casady, 1983).
Survey Background
During the course of NMCUES, information was obtained on health, access to and use of medical services, associated charges and sources of payment, and health care coverage. The survey was cosponsored by the National Center for Health Statistics (NCHS) and the Health Care Financing Administration (HCFA). Data collection was provided under contract by the Research Triangle Institute (RTI) and its subcontractors, National Opinion Research Center (NORC) and SysteMetrics, Inc.
The basic survey plan for NMCUES drew heavily on two previous national surveys: The National Health Interview Survey (NHIS), which is conducted by NCHS, and the National Medical Care Expenditure Survey (NMCES), which was cosponsored by the National Center for Health Services Research and NCHS.
NHIS is a continuing multipurpose health survey first conducted in 1957. The primary purpose of NHIS is to collect information on illness, disability, and the use of medical care. Although some information on medical charges and insurance payments has been collected in NHIS, the cross-sectional nature of the NHIS survey design is not well suited for providing annual data on charges and payments.
NMCES was a panel survey in which sample house-holds were interviewed six times over an 18-month period ~ in 1977 and 1978. NMCES was designed specifically to provide comprehensive data on how health services were used and paid for in the United States in 1977.
NMCUES is similar to NMCES in survey design and question wording, so that analysis of change during the years between 1977 and 1980 is possible. Both NMCUES and NMCES are similar to NHIS in terms of question wording in areas common to the three surveys. Together they provide extensive information on illness, disability, use of medical care, costs of medical care, sources of payment for medical care, and health care coverage at two points in time.
Sample Design
General pLzn—The NMCUES sample of housing units and group quarters, hereafter jointly referred to as dwelling units, is a concatenation of two independently selected national samples, one provided by RTI and the other by NORC. The sample designs used by RTI and NORC are quite similar with respect to principal design features: Both can be characterized as stratified, multistage area probability designs. The principal differences between the two designs are the type of stratification variables and the specific definitions of sampling units at each stage.
Target popukzthmz—All persons living in a sample dwelling unit at the time of the first interview became part of the national sample. Unmarried students 17–22 years of age who lived away from home were included in the sample if their parent or guardian was included in the sample. In addition, persons who died or were institutionalized between January 1 and the date of first interview were included in the sample if they were related to persons living in the sampled dwelling units and were living in the sample dwelling before their death or institutionalization. All of these persons were considered “key” persons, and data were collected for them for the full 12 months of 1980 or for the portion of time that they were part of the U.S. civilian noninstitutionalized population. In addition, children born to key persons during 1980 were considered key persons, and data were collected for them from the time of birth.
42

Relatives from outside the original population (i.e., institutionalized, in the Armed Forces, or outside the United States from January 1 up to the first interview) who moved in with key persons after the first interview were also considered key persons, and data were collected for them from the time they joined the key person. Relatives who moved in with key persons after the first interview but were part of the civilian noninstitutional ized population on January 1, 1980, were classified as “non-key” persons. Data were collected for nonkey persons for the time that they lived with a key person; but because they had a chance of selection in the initial sample, their data are not used for general analysis of persons. However, data for nonkey persons are used in an analysis of families because they contribute to the family’s utilization of and charges for health care during the time they are part of the family. Family analysis is not part of this investigation, though, and will not be discussed further.
Persons included in the sample were grouped into “reporting units” for data collection purposes. Reporting units were defined as all persons related to each other by blood, marriage, adoption, or foster care status who lived in the same dwelling unit. The combined NMCUES sample consisted of approximately 7,200 reporting units, of which nearly 6,600 agreed to participate in the survey. In total, complete data were obtained on 17,123 key persons. The RTI sample yieIded approximately 8,300 respondents and the NORC sample 8,800.
Research Triangle Institute Sample Design
Primary sampling units (PSU’S)--A PSU was de-fined as a county, a group of contiguous counties, or parts of counties with a combined minimum 1970 population size of 20,000. A total of 1,686 nonoverlapping RTI PSU’S cover the entire land area of the 50 States and Washington, D.C. The PSU’S were classified as one of two types. The 16 largest standard metropolitan statistical areas (SMSA’S) were designated as self-representing PSU’S, and the remaining 1,670 PSU’S in the primary sampling frame were designated as non-self-representing PSU’S.
Strati$cation of PSU’S-PSU’S were grouped into strata whose members tend to be relatively alike within strata and relatively unlike between strata. PSU’S derived from the 16 largest SMSA’S were of sufficient 1970 population size to be treated as primary strata. The 1,659 non-self-representing PSU’S from the continental United States were stratified into 42 approximately equal-sized primary strata. Each primary stratum had a 1970 population size of about 3.3 million. One supplementary primary stratum of 11 PSU’S, with a 1970 population size of about 1 million, was added to the RTI primary frame to include Alaska and Hawaii.
First-stage selection of PSU’s—The total RTI primary sample consisted of 59 PSU’S, of which 16 were
self-representing. The non-self-representing PSU’S were obtained by selecting 1 PSU from each of the 43 non-self-representing primary strata. These PSU’S were se~ected with probability proportional to 1970 population size.
Secondary stratification-In each of 59 sample PSU’S, the entire PSU was divided into nonoverlapping smaller area units called secondary sampling units (SSU’S). Each SSU consisted of one or more 1970 census-defined enumeration districts (ED’s) or block groups (BG’s). Within each PSU the SSU’S were ordered and then partitioned to form approximately equal-sized secondary strata. Two seconda~ strata were formed in the non-seIf-representing PSU drawn from Alaska and Hawaii, and four secondary strata were formed in each of the remaining 42 non-self-representing PSU’S. Thus, the non-self-representing PSU’S were partitioned into a total of 170 secondary strata. In a similar manner the 16 self-representing PSU’S were partitioned into 144 secondary strata.
Second-stage selection of SSU’s-One SSU was selected from each of the 144 seconday strata covering the self-representing PSU’S, and two SSU’S were selected from each of the remaining secondary strata. All second-stage sampling was with replacement and with probability proportional to the SSU’S total noninstitutionalized population in 1970. The total number of sample SSU’S was 2 X 170 + 144 = 484.
Third-stage selection of areas and segments—Each SSU was divided into smaller nonoverlapping geographic areas, and one area within the SSU was selected with probability proportional to the 1970 total number of housing units. Next, one or more nonoverlapping segments of at least 60 housing units (HU’S) were formed in the selected area. One segment was selected from each SSU with probability proportional to the segment HU count. In response to the sponsoring agencies’ re-quest that the expected household sample size be reduced, a systematic sample of one-sixth of the segments was deleted from the household sample. Thus, the total third-stage sample was reduced to 404 segments.
Fourth-stage selection of housing units—Ail dwelling units within the segment were listed, and a systematic sample of dwelling units was selected. The procedures used to determine the sampling rate for segments guaranteed that all dwelling units had an approximately equal probability of selection. All reporting units within the selected dwelling units were included in the sample.
National Opinion Research Center Sample Design
Primary sampling units (PSU’s)—The land area of the 50 States and Washington, D.C., was divided into nonoverlapping PSU’S. A PSU consisted of SMSA’S, parts of SMSA’S, counties, parts of counties, or independent cities. Grouping of counties into a single PSU occurred when individual counties had a 1970 population of less than 10,000.
43

Zoning of PSU’ s—The PSU’S were classified into two groups according to metropolitan status (SMSA or not Sh4SA). These two groups were individual] y ordered and then partitioned into zones with a 1970 census population size of I million persons.
First-stage zone selection of PSU’S—A single PSU was selected within each zone with a probability proportional to its 1970 population. It should be noted that this procedure allows a PSU to be selected more than one time. For instance, an SMSA PSU with a population of 3 million may be selected at least twice and possibly as many as four times. The full general-purpose sample contained 204 PSU’S, which were systematically allocated to 4 subsamples of 51 PSU’S. The final set of 76 sample PSU’S was chosen by randomly selecting 2 complete subsamples of 51 PSU’S; 1 subsample was included in its entirety, and 25 PSU’s in the other subsample were selected systematically for inclusion in NMCUES.
Second-stage zone selection of SSU’s—Each PSU selected in the first stage was partitioned into a nonover-Iapping set of SSU’S defined by BG’s, ED’s, or a combination of the two types of census units. SSU’s were selected from the ordered list of these SSU’s. The cumulative number of households in the second-stage frame for each PSU was divided into 18 zones of equal width. An SSU could be selected more than once, as was the case in the PSU selection. If a PSU had been hit more than once in the first stage, then the second-stage selection process was repeated as many times as there were first-stage hits. Some 405 SSU’s were identified by selecting 5 SSU’S from each of the 51 PSU’S in the subsample that was included in its entirety and 6 SSU’S from each of the 25 PSU’S in the subsample for which one-half of the PSU’S were included.
Third-stage selection of segments—The selected SSU’S were subdivided into area segments with a mini-mum size of 100 housing units. One segment was then selected with probability proportional to the estimated number of housing units.
Fourth-stage selection of housing units—Sample selection at this level was essentially the same as for the RTI design.
Data Collection
Field operations for NMCUES were performed by RTI and NORC under specifications established by the cosponsoring agencies, Persons in the sample dwelling units were interviewed at approximately 3-month intervals beginning in February 1980 and ending in March 1981. The core questionnaire was administered during each of the five interview rounds to collect data on health, health care, health care charges, sources of payment, and health care coverage. A summary of responses was used to update information reported in previous rounds. Supplements to the core questionnaire were used
during the first, third, and fifth interview rounds to collect data that did not change during the year or that were needed only once. Approximately 80 percent of the third- and fourth-round interviews were conducted by telephone; all remaining interviews were conducted in person. The respondent for the interview was required to be a household member 17 years of age and over. A nonhousehold proxy respondent was permitted only if all eligible household members were unable to respond because of health, language, or mental condition.
Weighting
For the analysis of NMCUES data, sample weights are required to compensate for unequal probabilities of selection, to adjust for the potential y biasing effects of failure to obtain data from some persons or reporting units (RU’S) (i.e., nonresponse), and failure to cover some portions of the population because the sampling frame did not include them (i.e., undercoverage).
Basic sample design weights—Development of weights reflecting the sample design of NMCUES was the first step in the development of weights for each person in the survey. The basic sample design weight for a dwelling unit is the product of four components that correspond to the four stages of sample selection. Each of the four weight components is the inverse of the probability of selection at that stage when sampling was without replacement, or the inverse of the expected number of selections when sampling was with replacement, and multiple selection of the sample unit was possible.
Two-sample adjustment factor—As previously dis- : cussed, the NMCUES sample is composed of two independently selected samples. Each sample, together with its basic- sample design weights, yields independent unbiased estimates of population parameters. Because the two NMCUES samples were of approximately equal size, a simple average of the two independent estimators was used for the combined sample estimator. This is equivalent to computing an adjusted basic sample design weight by dividing each basic sample design weight by 2. In the subsequent discussion, only the combined sample design weights are considered.
Total nonresponse and undercoverage adjustment— A weight adjustment factor was computed at the RU level to compensate for RU-level nonresponse and under-coverage. Because every RU within a dwelling unit is included in the sample, the adjusted basic sample design weight assigned to an RU is simply the adjusted basic sample design weight for the dwelling unit in which the RU is located. An RU was classified as responding if members of the RU initially agreed to participate in NMCUES and as nonresponding otherwise.
Initially, 96 RU weight-adjustment cells were formed by cross-classifying the following variables: Race of RU head (white or all other), type of RU head (female,
44
male, or husband-wife), age of RU head (four levels), and size of RU (four levels). These cells were then collapsed to 63 cells so that each cell contained at least 20 responding RU’S. Within each cell an adjustment factor was computed so that the sum of adjusted basic sample design weights would equal the March 1980 Current Population Survey estimate for the same population. The weight for nonresponse and undercoverage was computed for each RU as the product of the adjusted basic sample design weight and the nonresponse-undercoverage adjustment factor for the ceH containing the RU.
Poststratij?cation adjustment-Once the nonresponse–undercoverage adjusted RU weights were computed, a poststratification adjusted weight was computed at the person level. Because each person within an RU is included in the sample, the nonresponse and under-coverage adjusted weight for a sample person is the nonresponse–undercoverage adjusted weight for the RU in which the person resides. Each person was classified as responding or nonresponding, as discussed subsequently in the section on attrition imputation.
Sixty poststrata were formed by cross-classifying age (15 levels), race (2 levels), and sex (2 levels). One poststratum (black males 75 years of age and over) had fewer than 20 respondents, so it was combined with an adjacent poststratum (black males 65–74 years of age), resulting in 59 poststrata.
Estimates based on population projections from the 1980 census were obtained from the Bureau of the Census for the U.S. civilian noninstitutionalized population by age, race, and sex poststrata for February 1, May 1, August 1, and November 1, 1980. The mean of these midquarter population estimates for each of the poststrata was computed and used as the 1980 average target population for calculating the poststrata adjustment factors.
Survey-based estimates of the average poststrata population were developed using the nonresponse and undercoverage adjusted weights. Fkst, a survey-based estimate of the target population of each poststratum for each quarter was computed by summing the nonresponse and undercoverage adjusted weights for respondents eligible for the survey on the midquarter date. Then the survey-based estimate of the 1980 average population was computed as the mean of the four midquarter estimates. Finaliy, the poststratification adjustment factor in each poststratum was computed as the ratio of the 1980 average target population (obtained from Bureau of the Census data) to the NMCUES 1980 average population. The poststratified weight for each respondent was then computed as the product of the nonresponse and undercoverage adjusted weight and the poststratification adjustment factor for the poststratum containing the respondent.
Thus, the weighting procedure is composed of three steps: Development of base sampIe design weights for each RU, adjustment for RU-leveI nonresponse and undercoverage, and adjustment for person-level nonre
sponse and undercoverage. A further adjustment for the number of days a person was an eligible member of the U.S. civiIian noninstitutionalized population was made, but this adjustment affects only certain types of estimates from NMCUES and is discussed in Appendix 111.
Survey Nonresponse
Nonresponse in panel surveys such as NMCUES occurs when sample individuals refuse to participate in the survey (total nonresponse), when initially participating individuals drop out of the survey (attrition nonresponse), or when data for specific items on the questionnaire are not collected (item nonresponse). Response rates for RU’S and persons in NMCUES were high, with approximate y 90 percent of the sample RU’S agreeing to participate in the survey and approximately 94 percent of the individuals in the participating RU’S sup-plying complete information. Even though the overall response rates are high, survey-based estimates of means and proportions may be biased if nonrespondents tend to have different health care experiences than respondents or if there is a substantial response rate differential across subgroups of the target population. Furthermore, annual totals tend to be underestimated unless allowance is made for the 10SSof data attributable to nonresponse.
Two methods commonly used to compensate for survey nonresponse are data imputation and adjustment of sampling weights. For NMCUES, data imputation was used to compensate for attrition and item nonresponse, and weight adjustment was used to compensate for total nonresponse. The calculation of the weight adjustment factors was discussed in the previous section.
Attrition Imputation
A special form of the sequential hot-deck imputation method (Cox, 1980) was used for attrition imputation. First, each sampIe person with incomplete annual data (referred to as a “recipient”) was Iinked to a sample person with similar demographic and socioeconomic characteristics who had complete annual data (referred to as a “donor”). Second, the time periods for which the recipient had missing data were divided into two categories: Imputed eligible days and imputed ineligible days. Imputed eligible days were those days for which the donor was eligible (i.e., in scope), and imputed ineligible days were those days for which the donor was ineligible (i.e., out of scope). The donor’s medical care experiences, such as medical provider visits, dental visits, and hospital stays, during the imputed eligible days were imputed into the recipient’s record for eligible days. Finally, the results of the attrition imputation were used to make the final determination of a person’s respondent status. If more than two-thirds of the person’s total
45

eligible days (both reported and imputed) were imputed eligible days, then the person was considered a total nonrespondent, and the data for the person were removed from the data file.
Item Nonresponse and Imputation
Persons classified as respondents may fail to provide information for some or many items in the questionnaire. In NMCUES, item nonresponse was particularly a problem for health care charges, income, and other sensitive topics. The extent of missing data varied by question, and imputation for all items in the data file would have been expensive. Imputations were made for missing data on key demographic, economic, and charge items across five of the six data files in the public use data tape (all except the condition file). Table I illustrates the extent of the item nonresponse problem for selected survey measures that received imputations in four data files used in this report.
Demographic items tend to require the least amount of imputation. Some, such as age, sex, and education, had insignificant levels of imputation. Income items had
Table I
Percent of data imputed for selected survey items in 4 of the NMCUES public use data tiles United States, 1980
Tape Percent location Description imputed
Person file (n = 17,123)
P54 Age 0.1 P57 Race ‘20.0 P59 Sex 0.1 P62 Highest grade attended 0.1 P67 Perceived health status 0.8 P592 Functional limitation score 3.2 PI 25 Number of bed-disability days 7.9 P128 Number of work-loss days 8.9 P135 Number of cut-down days 8.2 P399 Wages, salary, business income 9.7 P434 Pension income 3.5 P445 Interest income 21.6 P462 Total personal income *30.4
Medical visit file (n = 86,594)
M117 Total charge 25.9 M123 First source of payment 1.8 M125 First source of payment amount 11.6
Hospital stay file (n = 2,946)
H252 Nights hospitalized 3.1 H124 Total charge 36.3 H130 First source of payment 2.2 H132 First source of payment amount 17.6
Medical expenses file (n = 58,544)
E117 Total charge 19.4 El 23 First source of payment 2.8 El 25 First source of payment amount 10.0
1Race for children under 17 years of age imputed from race of head of reporting unit. ‘Cumulative across 12 types of income.
46
higher levels of nonresponse. Nearly one-third of the persons required imputation for at least one component of total personal income, which is a cumulation of earned income and 11 sources of unearned income. The bed-disability days, work-loss days, and cut-down days have levels of imputation between those for the demographic and income items.
The highest levels of imputation occurred for the important charge items on the various visit, hospital stay, and medical expenses files. Total charges for medical visits, hospital stays, and prescribed medicines and other medical expenses were imputed for 25.9 percent, 36.3 percent, and 19.4 percent of the events, respectively. Among the source-of-payment data, the imputation rates for the source of payment were small, but the rates for the amount paid by the first source of payment were generally subject to high rates of imputation. The number of nights hospitalized on the hospital stay file was imputed at a rate comparable to that for first source of payment.
The methods used to impute for missing items were diverse and tailored to the measure requiring imputation. Three types of imputation predominate: Edit or logical imputations, a sequential hot deck, and a weighted sequential hot deck. The edit or logical imputations were used to eliminate missing data that could reasonably be determined from other data items that provided over-lapping information for the given item. The sequential hot deck was used primarily for small numbers of imputations for the demographic items; the weighted sequential hot deck was used more extensively and for virtually ‘ all other items for which imputations were made.
The edit or logical imputation is a process in which the value of a missing item is deduced from other avail-able information in the data file. For example, race was not recorded for children under 17 years of age during the survey. Instead, a logical imputation was made during data processing that assigned the race of the head of the reporting unit to the child. Similarly, extensive editing was performed for the charge data before any imputations were made. If first source of payment was available, only one source of payment was given; and if total charge was missing, the value of the first source of payment amount was assigned to the total charge item.
In the sequential hot-deck procedure, the data are grouped within imputation classes formed by variables thought to be correlated with the item to be imputed. An additional sorting within imputation classes by variables also thought to be correlated with the imputed item is typically used. An initial value, such as the mean of the nonmissing cases for the item, is assigned as a “cold-deck” value. The first record in the file is then examined. If it is missing, the “cold-deck” value replaces the missing data code; if it is real (not missing), the real value replaces the “cold-deck” value and becomes a “hot-deck” value. Then the next record is examined. Again, the “hot-deck” value is used to replace missing

data: if the value is real, it becomes the “hot-deck” value. The process continues sequentially through the sorted file. The weighted hot deck, a modification of the sequential hot deck, uses weights to determine which real values are used to impute for a particular record needing imputation.
The imputation process will be described for two items to illustrate the nature of imputation for NMCUES. For Hispanic origin, two different imputation procedures were used: Logical and sequential hot deck. Because Hispanic origin was not recorded during the interview for children under 17 years of age, a logical imputation was made by assigning to the child the Hispanic origin of the wife of the head of the reporting unit, if present, and the origin of the head of the reporting unit otherwise. For the remaining cases that were not assigned a value by this procedure, the data were grouped into classes by observed race of the head of the reporting unit; within classes, the data were sorted by reporting unit identification number, primary sampling unit, and segment. An unweighed sequential hot deck was used to impute values of Hispanic origin for the remaining cases with missing values.
The imputations for medical visit total charge were made after extensive editing had been done to eliminate as many inconsistencies as possible between sources of payment and total charges. The medical visit records were then separated into three types: Emergency room, hospital outpatient department, and doctor visits. Within each type, the records were classed and sorted by several measures, which differed across visit types, prior to
a weighted hot-deck imputation. For example, the records for doctor visits were classified by reason for visit, type of doctor see~, whether work was done by a physician, and age of the individual. Within the groups formed by these classification variables, the records were then sorted by type of health care coverage and month of visit. Finally, the weighted hot-deck procedure was used to impute for missing total charge, sources of payment, and source-of-payment amounts for the classified and sorted data file.
Because imputations were made for missing items for a large number of the important items in NMCUES, they can be expected to influence the results of the survey in several ways. In general, the weighted hot deck is expected to preserve the means of the nonmissing observations when those means are for the total sample or classes within which imputations were made. How-ever, means for other subgroups, particularly small sub-groups, may be changed substantially by imputation. In addition, sampling variances can be substantially underestimated when imputed values are used in the estimation process. For a variable with one-quarter of its values imputed, for instance, sampling variances based on all cases will be based on one-third more values than were actually collected in the survey for the given item. That is, the variance would be too small by a factor of at least one-third. FinaIly, the strength of relationships between measures that received imputations can be substantially attenuated by the imputation. A more complete discussion of these issues can be found in Lepkowski, Stehouwer, and Landis ( 1984).
47
Appendix ILData Modifications to PublicUse Files
During the preparation of this report, a number of problems were discovered in the NMCUES public use files that required modification of the data. Eight sets of problems were identified:
(1) Sampling weights for 68 newborns (i.e., persons born in 1980) were in error.
(2) Six respondents had extremely high hospital stay charges.
(3) Forty-seven respondents had health care coverage categories inconsistent with source of payment for some medical events.
(4) For 173 respondents, fewer bed-disability days than hospital nights were reported. (Length-of-stay data were recorded in terms of the number of nights—as opposed to days—spent in the hospital. )
(5) Four respondents had extremely long lengths of stay in the hospital as a result of incorrect hospital admission dates.
(6) Four respondents had poverty status categories that were inconsistent with their poverty status level.
(7) Nine respondents were coded as deliveries in the hospital file but had inconsistent values for other hospital stay data.
(8) One respondent had duplicate hospital stay records.
Details of the changes made to correct these problems may be obtained from NCHS. Detailed descriptions of the specific changes are provided in the NMCUES series report by Lepkowski et al. (to be published). General information on the problems and changes is outlined below.
(1) Records for 68 newborns were incorrectly coded as eligible for the entire survey period (all 366 days) although born after January 1, 1980. These errors were corrected by changing the eligible time-adjustment factor and the person time-adjusted weight for each of the 68 records.
(2) After careful examination, the University of Michigan and NCHS determined that six hospital stay records, each with charges of at least $90,000, were incorrect and should be changed. These six records and related information in the person file (e. g., hospital stay charges, total charges) were changed to conform with
48
records in the Medicare best estimate file or with other information about each of the six respondents’ hospitalizations contained in the hospital stay file.
(3) Discrepancies between source of payment and health care coverage were noted in the course of analysis. All of the discrepancies involved Medicare coverage. Forty-seven respondents reporting Medicare as a source of payment in the medical visit, hospital stay, or pre-scribed medicine file were not properly coded as covered by Medicare. Health care coverage for these respondents was reclassified strictly according to source-of-payment data. Respondents originally coded as covered by private insurance but whose records did not show private insurance as a source of payment for any services were coded as having Medicare and private insurance coverage. When reassignment based on imputed data for source of payment would conflict with real data for health care coverage, the real data were used in preference to the imputed data.
(4) For 173 cases, the value for hospital nights was greater than the value for bed-disability days. According to interviewer instructions for the NMCUES questionnaire, hospital nights should be included in bed-disability days, except for newborns. Therefore, the value of bed-disability days was adjusted to equal hospital nights for these 173 cases, a procedure used in Health Interview Survey processing. However, this adjustment does not fully compensate for the errors in recording or computing bed-disability days. It is likely that bed-disability days are still underestimated for these 173 cases after the edit. The edit was performed without regard to the imputation status of either bed-disability days or hospital nights.
(5) Four cases with discrepancies between bed-disability days and hospital nights also had improperly coded hospital admission dates, which led to the recording of excessively long lengths of stay. In these cases, the admission dates and hospital nights were corrected, and the bed-disability days edit was not necessary.
(6) Comparison of the continuous and the categorical poverty status variables on the public use file identified four respondents whose categorical poverty status was inconsistent with their continuous poverty status value. The categorical variable was changed to correspond to their poverty status on the continuous variable.

(7) A variety O( problems were discovered on nine recorlis coded as deliveries in the hospital stay file.
(a) Two deliveries were attributed to male respondents. Examination of the data files suggested that the sex variable was incm-rectly coded in these two cases; the sex was therefore recoded to femaIe. A third deIivery attributed to a male was actually that of the respondent “s spouse. In this case, the hospital record was reassigned and appropriate changes made in the person file for both respondents.
(b) Four hospitalizations for newborns were in-correct y coded as deliveries. These were re-coded in the hospital stay file. A fifth new-born’s hospital record was attributed to its mother. In this case, the hospital record was
transferred to the newborn, and appropriate changes were made in the person file for both respondents.
(c) One delivery was attributed to a 74-year-old woman. Following an NCHS recommendation, the response was recoded to reflect signs, symptoms, and ill-defined conditions as the admitting condition.
(8) Two sets of duplicate records (four records in total) in the hospital stay file were discovered for one respondent. The two duplicates were deleted in the hospital stay fde, and necessary changes were made in the person file. Three of the four records had been imputed to another respondent for reasons of attrition. No changes were made in the records for the respondent receiving the attrition-imputed records.
49

Appendix Ill. Analytical Strategies
Notion of an Average Population
NMCUES was a panel survey in which members of the population were followed during the panel period (calendar year 1980). The nature of a dynamic population over time influences the rules used to determine who should be followed and for how long. It also has significant implications for the form of estimators for characteristics of the population during the panel period. Before discussing estimation strategies for NMCUES data, it is useful to review the nature of a dynamic population over time.
The nature of a longitudinal population as members move in and out of eligibility is illustrated in Figure I. Stable members of the population appear at
Figure I
Dynamic population for 12 time period panel survey
Stable
F
Leaver
E
b
Entrant
b
E
Mixed
b b
b
~~
b 01234 56789101112
Time
the beginning and at every time point during the life of the longitudinal time period. Even though these per-sons are termed “stable,” they may, of course, change residence during the panel period and may be quite difficult to trace. Leavers are persons who are eligible at the beginning of a time period but become ineligible at some later time. Leaving may occur through events such as death, institutionalization, or moving outside the geographic boundary of the population. At the same time, new members (entrants) may enter the population through births or through returns from institutions or from outside the geographic boundary of the population. Finally, there also will be mixed population elements that are both entrants and leavers from the population during different time periods. The majority of the population typically will be stable in nature, but it is the entrants and leavers, persons who may be experiencing major changes in their lives, who are often of particular interest to analysts of panel survey data. In order to assure adequate coverage of all elements in the dynamic population considered over the entire time period, NMCUES followup rules were carefully specified to include entrants, leavers, and mixed population elements properly.
As an illustration, consider a person who was in the Armed Forces on January 1, 1980, and was discharged on June 1, 1980, thus becoming a key person (i.e., one to be followed for the rest of the year while eligible) in the NMCUES panel. Because NMCUES was designed to provide information about the civilian population, medical care use and charges during the first 5 months of 1980 for this person are outside the scope of the survey. Data about health care use and charges were not collected unless they occurred after June 1. At the same time, this person was eligible for only 7 months of the year, and he was also “at risk” of incurring health care use or charges for only 7 of the 12 months. This person thus contributes only 742 or 0.58 of a year of eligibility (person year) to the study. This quantity is referred to as the “time-adjustment factor” in the documentation and throughout these appendixes.
For readers not familiar with the concept of “person years of risk,” it may be useful to consider briefly the rules that were used to determine eligibility for a given person at a given moment during 1980. There were essentially two ways of becoming eligible for or entering
50

the NMCUES eligible population. One way was to be a member of the U.S. civilian noninstitutional ized population on January 1, 1980, and hence a member of the original or base cohort about which inferences were to be made. The second way was to enter after January 1 through birth or through rejoining the civilian noninstitutionalized population during the year by returning from an institution, from the Armed Forces, or from outside the LTnitedStates. There were also several ways by which persons who were eligible members of the population could become ineligible. Death obviously re-moves a person from further followup, as does institutionalization, joining the Armed Forces, or moving to a residence outside the United States. Information was coI1ected to monitor the exact number of days that each person selected for NMCUES was eligible during the year. These eligibility periods are summarized by the time-adjustment factor on each record.
The use of “person years” to form sample estimates requires careful assessment of the characteristic to be estimated. Estimates that use onIy data collected from persons during periods of eligibility (e.g., totaI number of doctor visits, total charges for health care) do not need to account for time adjustments. Estimates for per-son characteristics (e.g., total population, proportion of the population in a given subgroup) must be based on person years to obtain estimates that correspond to those for health care estimates. Some estimates require the use of the time-adjustment factor in the denominator but not in the numerator. For example, an estimate of the mean total charge for health care during 1980 must use the total charges for health care as a numerator without time adjustment, but the denominator must be the number of person years that the U.S. population was exposed to the risk of such charges during 1980, a time-adjusted measure. The mean in this case is actually a rate of health care charges per person year of exposure for the eligibIe population in 1980.
When making estimates in which person years are important, the effect of the time-adjustment factor wiI1 vary depending on the subpopulation of interest (TabIe II). A cross-sectional cohort of N persons selected from the U.S. population on January 1, 1980, and followed for the entire year will contribute a total number of person years for 1980 that is smaller than N because of removals (i.e., deaths, institutionalization, and so on).
[f entrants are added to the initial cohort during the year, the person years contributed by the initial cohort and the entran~s may well exceed N, but it wili still be less than the number of original cohort members plus the number of entrants.
The difference between persons and person years will vary by subgroups as well. Females 25–29 years of age on January 1 constitute a cohort for which few additions are expected because of entrants from institutions, the Armed Forces, or living abroad. Few removals are expected because of death, institutionalization, joining the Armed Forces, or moving abroad. On the other hand, maIes 80 years of age and over on January 1 will contribute a much smaller number of person years to the population than the total number of persons in the cohort at the beginning of the year, because a large number of the cohort will die during the year.
Role of Weights and Imputation
Estimated means and sampling errors from NMCUES for bed-disability days, work-loss days, work-loss days in bed, cut-down days, and restricted-activity days are presented in Table 111.For each survey measure, separate estimates were computed using all data (i.e., both real and imputed) and using only the real data. The unweighed and weighted mean, unweighed and weighted simple random sampling standard error of the mean, and the weighted complex standard error, which accounts for the stratified, multistage nature of the design, are presented.
For each measure, the weighted means computed using all the data and using only the real data are quite similar. This similarity is not unexpected given that the weighted hot deck imputation procedure is designed to preserve the weighted mean for overall sample estimates. The simpIe random sampling standard errors, however, are smaller when all data are used simply because the simple random sampling variance is inversely related to the sample size. For the complex standard error, three of the five measures have smaller standard errors when alI data are used, and the other two measures show the opposite relationship. Weighting and imputation for the disability measures have little or no effect on estimated means or their standard errors for the total
Table II
Effect of person-year adjustment on counts and sampling weights, by 4 population groups United States, 1980
Sum of sampling weights
Basic weight Adjusted weight
Population group Sample size Person years in thousands in thousands
Total population . . . . . . . . . . . . . . . 17,123 16,862.84 226,368 222,824
Females, 25-29 years of age . . . . . . . . . . 702 699.39 9,529 9,494 Males, 80 years of age and over . . . . . . . . 113 104.05 1,384 1,274 All persons born during 1980 . . . . . . . . . . 251 121.02 3,560 1,713
51

Table Ill
Sample size, means, and standard errors for 5 disabilii measures, by all and real data subgroups: United States, 1980
Unweighed estimates Weighted estimates Estimates in this table are presented for illustrativepurposes. Calculations were made prior to data Simple Simplemodifications described in Appendix H. random random
sampling sampling Complex
Disability measure Sample standard standard standard
and data type size Mean error Mean error error
Bed-disability days
Alldata . . . . . . . . . . . . . . . . . . . . . . . . . 17,123 5.303 0.1279 5.268 0.1269 0.1540 Realdata . . . . . . . . . . . . . . . . . . . . . . . . . . 15,777 5.253 0.1326 5.228 0.1319 0.1599
Work-loss days
Alldata . . . . . . . . . . . . . . . . . . . . . . . . . . 13,069 3.614 0.1221 3.696 0.1220 0.1629
Realdata . . . . . . . . . . . . . . . . . . . . . . . . . . 11,537 3.510 0.1284 3.574 0.1277 0.1716
Work-loss days in bed
Alldata . . . . . . . . . . . . . . . . . . . . . . . . . . . 13,069 1.516 0.0508 1.568 0.0518 0.0592
Realdata . . . . . . . . . . . . . . . . . . . . . . . . . . . 10,970 1.530 0.0556 1.578 0.0568 0.0652
Cut-down days Alldata . . . . . . . . . . . . . . . . . . . . . . . . . . . . . . 17,123 6.831 0.1681 6.881 , 0.1697 0.3343
Realdata . . . . . . . . . . . . . . . . . . . . . . . . 15.724 6.609 0.1721 6.639 0.1735 0.3322
Restricted-activity days
Alldata . . . . . . . . . . . . . . . . . . . . . . . . . . . . . . 17,123 13.746 0.2559 13.805 0.2573 0.4716
Realdata . . . . . . . . . . . . . . . . . . . . . . . 14,049 13.036 0.2732 13.064 0.2742 0.4658
Table IV
Sample size, means, standard errors, and element variance for total charge for a hospital outpatient department visit, by data type: United States, 1980
Unweighed estimates Weighted estimates Estimates in this table are presented for illustrative purposes. Calculations were made prior to data Simple Simple modifications described in Appendix Il.
Data type
Alldata . . . . . . . . . . . . . . Real dataonly . . . . . . . . .
Imputed data . . . . . . . . . .
Real data Notdonor . . . . . . . . . . . . . . . . . . Donor once . . . . . . . . . . . . . . . . .
Donor twice . . . . . . . . . . . . . . . . .
Donor 3-5times . . . . . . . . . . . . .
population because the amount
random random
sampling sampling Complex Samole standard standard standard
size Mean
9,529 51.86 4,688 52.28 4,841 51.45
929 47.83 2,789 55.85
841 48.61 120 29.45
of missing data for these
error Mean error error
1..030 51.61 1.018 1.914
1.436 52.27 1.430 2.936
1.476 50.98 1.447 1.600
2.108 48.53 2.117 3.935 2.016 55.76 1.982 3.386
3.525 49.37 3.579 4.879
7.340 28.97 7.987 11.64
are quite similar; weighting does not.affect
Element
variance
(xlO-s)
9.87 9.59
10.14
4.17 11.00
10.78
7.66
the estimated measures is small (approximately 7 or 8 percent).
For other measures that have larger amounts of missing data, imputation has larger effects. Consider the means and standard errors for total charge for a hospital outpatient department visit shown in Table IV. Of 9,529 hospital outpatient department visits (real visit records plus those generated from the attrition imputation process), 4,841 have a total charge that was imputed from one of the other hospital outpatient department visit records. Thus, more than one-half of the total charges were missing for this particular medical event. Despite the large amount of missing data, the weighted means using all the data and using only real values
means. However, sampling errors are changed substantially when imputed values are added to real values to form an estimate. The weighted and unweighed simple random sampling standard errors are markedly smaller for all data than for the real data.
To investigate whether this decrease in sampling error is caused by changes in sample size, changes in the element variance, or both, the element or total variances were estimated by multiplying the weighted simple random sampling variances by the sample sizes. Inspection of Table IV suggests that the element variances are quite similar using all data and real data; the differences in standard error when all data and only real
52

data are used can be attributed mostly to the loss in sample size when going from all data to real data.
Not all of the real data were used as donors for imputation, and some of the real data were used as donors several times. Table IV also suggests that those real values not used as donors have a lower mean total charge than those used as donors, but values used as donors more than twice tend to have even smaller mean total charges. The means for donors used once, twice, or more frequently are a function of the use of imputation classes, within which the mean total charge and the amount of missing data varied.
The difference in complex standard errors between all data and the real data in Table IV illustrates the large effects of imputation. However, neither the complex standard error computed using all the data nor that computed using only the real data is the correct standard error for the weighted mean estimated using all the data. The mean computed using all data includes 4,841 values that were actually subsampled with replacement from the 4,688 real values. In addition, imputations were made across the primary sampling units and strata used in both the sample selection process and the variance estimation procedure. It is assumed in the variance estimation procedure that the observations were selected independently from primary sampling units and strata. That assumption is incorrect in this case. Hence, the complex standard error for all data shown in Table IV fails to account for two sources of variability: The double sampling used to select values for imputation and the correlation between primary sampling units and strata induced by imputation. At the same time, the complex standard error for the weighted mean computed using only the real data is an incorrect estimate of the standard error of the mean based on all the data. The actual sampling
Figure II
Estimated mean charges per hospital outpatient department visit, by 4 fam”~ income classes for all and real &tz
United States, 1980
65 r Data type I All
60 t Real
/’
/’
d“
35~ Less than $5,000- $12,000- $35,000 $5,000 $11,999 $34,999 or more
Family Income
Figure Ill
Estimated mean charaes Der hosDitaloutpatient department visit by 16 imputation%la&es forkll persk and fo; persons ‘
in families with income less than $5,000: United States, 1980
120Data type
� All
100 O Family income PFless than $5,000 I
20
u
o I I I I I I I I I I I I I I I 1 2345 678 910111213141516
Imputation class
error of the weighted mean for all the data is probably larger than that shown for the mean estimated using all the data; it may even be larger than the sampling error computed using only the real data.
As a final illustration of the effects that imputation can have on survey results, Figure II presents estimated mean charges per hospital outpatient department visit for four family income groups computed using all the data and using only the real data. For the real data, the mean charge per visit increases in a linear fashion as the family income increases. However, when all the data are used to estimate the mean charge per visit, the mean charge does not increase as rapidly with increasing family income. The strong relationship between family income and mean charge per hospital outpatient department visit in the real data has been attenuated by the imputed values.
The reason for this attenuation is shown in Figure III. Sixteen imputation classes were formed for the imputation of totaI charges for hospital outpatient department visits. Figure III shows mean charge by imputation class for real data for the total sample and for the subgroup with family incomes less than $5,000 in 1980. The low income group has lower mean charges than the total sample. Because family income was not one of the variables used to form imputation classes, low family income persons within an imputation class with missing hospital outpatient department visit total charges were imputed a charge that was, on average, higher than the mean charge for low income persons with real data. This occurs in almost every imputation class. When the real and imputed data are ~ombined for persons with family incomes less than $5,000, the effect of imputation is to increase the mean charge for this
53

�
subgroup. Conversely, for persons with family incomes of $35,000 or more, total hospital outpatient department visit charges for persons with real data tend to be larger than values imputed to persons with missing charges. The overall impact of the imputation process on the relationship between charges for hospital outpatient department visits and family income is a regression toward the mean charge for real data for low- and high-income subgroups.
The results in Tables III and IV and Figure II demonstrate the effect that imputation can have on estimated means, on estimated sampling errors, and on relation-ships between variables. Several strategies for handling imputation in estimation are suggested by these findings. It is beyond the scope of this discussion to evaluate various strategies and indicate the reasons why one was chosen for this report. The strategy used in preparing estimates for this report was to use all the data in all estimates despite the sizable effects caused by imputation. This strategy means that estimated means and totals presented in the report have been adjusted for item nonresponse, but sampling errors and relationships among some variables may be adversely affected by the imputation process. The reader should keep in mind that sampling errors for estimates that are subject to large amounts of item nonresponse may be underestimated, and the strength of relationships between a variable receiving imputed values and a variable that was not used to form imputation classes may be attenuated by the imputation process.
Estimation Procedures
Sample estimators from the NMCUES data, regard-less of whether they are totals, means, medians, proportions, or standard errors, must account for the complexity of the sample survey design. Totals, means, and other estimates must include sampling weights to compensate for unequal probabilities of selection, nonresponse, and undercoverage. Stratification, clustering, and weighting must also be accounted for in the estimation of sampling errors. In addition, consideration must be given to time-adjustment factors to account for persons not eligible for the entire year and to imputations that were made to compensate for missing items.
A variety of estimators were used for the descriptive analyses. To illustrate the role of time adjustments, consider the following six specific estimates that were used in the analysis:
� Estimated total charges for a selected subgroup (e.g., persons with musculoskeletal conditions).
“ Estimated total population.
� Mean charge per visit.
� Mean charge per person.
Proportion of charges that fall in a certain range of charges.
� Proportion of persons whose charges are less than or equal to a fixed level.
To define these estimators, the following notation for these quantities for the ith person is used:
yi = total charges for health care in 1980;
%= total number of medical visits for 1980;
Wi= nonresponse and undercoverage adjusted person weight;
ti = time-adjustment factor (i.e., the proportion of days in 1980 that the person was an eligible member of the population);
1, if total charges are less than or equal to a fixed value,
di= O, otherwise;
I1, if the total charge is between two fixed
ei= values, O,otherwise; and
I1, if the ith person is a member of a desig
nated subgroup of the population, 6i=
O,otherwise.
Estimating total charges, or any quantity from NMCUES that was recorded only during periods when the person was a noninstitutionalized civilian in the United States, is a relativel y straightforward task requiring only a weighted sum of charge values. In particular,
is the estimated total charge for a particular service for a selected subgroup. On the other hand, for estimates of total population, a time-adjusted estimator is required such as
j’ ‘~Witj8i.
Thus, j’ denotes an estimate of the 1980 average sub-group population, and j denotes the 1980 charges for a subgroup of the noninstitutionalized civilian population.
Estimated means may or may not need to include a time-adjustment factor in the denominator. For example, to estimate the mean charge per visit during 1980, no time adjustment is needed. Hence,
can be used to estimate mean charge per visit. However, to estimate mean charge per person, a time adjustment
54

is required in the denominator because the denominator is actually an estimate of the total average population in 1980. In particular, the estimator has the form
Estimates of mean charges for subgroups have a similar form, with the indicator variable d~ incIuded in the numerator and denominator for the appropriate subgroup of interest.
Estimated proportions are means that have an indicator variable in the numerator and a count variable in the denominator. Proportions may have time adjustments not only in the denominator but also in the numerator. For example, to estimate the proportion of persons who had charges less than or equal to a fixed value, an estimate of the form
p’= ~widitif~witi
was used. Appropriate indicator variables were added to the numerator and denominator to make estimates for selected subgroups.
On the other hand, the estimated proportion of total charges between two fixed Ievels of charges does not require time adjustments in the numerator or the de-nominator. In particular,
p= ~Wiyieil~Wiyi
is the estimated proportion of all charges for persons that occurred between two levels of charges.
55

Sampling Errors
The NMCUES sample was one of a large number of samples that could have been selected from the U.S. civilian noninstitutionalized population using the same sampling procedures. Each possible sample could pro-vide an estimate that might differ from the same estimate from another sample. The variability among the estimates from all possible samples that could have been selected is defined as the standard error of the estimate, or the sampling error. The standard error can be used to assess the precision of the estimate itself by creating a confidence interval. For each interval, there is a specified probability that the average estimate over all possible samples selected from the population using the same sampling procedures will be in the interval.
Preparation of sampling errors for every estimate in this report would be a sizable task, as would be presentation of sampling error estimates for every estimate. Rather than compute and display standard errors for every estimate in this report, standard errors were computed for a subset of estimates. A set of functions was fit to these estimated standard errors to identify a model that would allow computation of a standard error that would be reasonably close to the estimated standard error.
This appendix provides summary formulas derived from the estimated standard errors that can be used to approximate the standard error for any given estimate in the report. The formulas have been designed to allow computation of an estimated standard error using an electronic calculator with basic arithmetic operators and a square root function. The computed estimate will be an average or smoothed estimate of the actual standard error of the estimate.
The formulas for standard error estimates are presented for three types of estimates found in the repofi � Totals or aggregates (e.g., total charges for all health
services used in 1980; total person years for males). � Means (e.g., per capita condition-related charges
for ambulatory visits; mean number of ambulatory visits).
� Proportions, percents, and prevalence rates (e.g., proportion of ambulato~ visit charges paid out of pocket; percent of persons with hospital charges less than $1,000; prevalence rate of musculoskeletal conditions for males 45-64 years of age).
56
Comparisons can also be made between point estimates from two different subgroups of the population. Formulas are given for computing standard errors for two types of comparisons:
� Comparisons of two mutually exclusive subgroups (e.g., comparing mean number of ambulatory visits for males and females, male and female subgroups having no members in common).
� Comparisons between a subgroup and a larger group in which the subgroup is contained (e.g., comparing proportion of hospital stay charges paid out of pocket for the joints only condition group with those for all persons with musculoskeletal conditions).
The standard error of a difference is based on the standard error of the totals, means, proportions, percents, or prevalence rates of interest. Certain covariances between estimates, which typically are small relative to the standard errors of the estimates themselves, are ignored.
The standard errors calculated from the formulas in this appendix can be used to form intervals about which confidence statements can be made for estimates from all possible samples drawn in exactly the same way as NMCUES was. The confidence level is deter-mined by multiplying the estimated standard error by a constant derived from the standardized normal pr~bability distribution. In particular, for the estimate O with estimated standard error S~, the upper limit for a (1 – a) x 100 percent confidence interval can be formed by adding Z.,2times S8 to 6. The l~wer limit is formed by subtracting Zalztimes SP from t?. The value of Za,z is obtained from the standard normal probability distribution. For example, a 95-percent confidence interval corresponding to CY == 0.05 can be formed with ZOOZ51.96; a 99-percent confidence interval (a= 0.01 ) uses ZOW5= 2.346. Illustrations of these calculations are provided in the discussion section for each formula.
Confidence intervals for comparisons of estimates between two subgroups allow inferences to be made about whether the difference is statistically significant. If a (1 – a) X 100-percent confidence interval does not include the value zero, the difference is significantly different from zero.
Totals
Let j denote the estimated total or aggregate for which a standard error is desired. The standard error for the estimate can be calculated by the expression
$?= [a-t+ 1#] ‘“,
where a and b are constants chosen from Table V for the particular estimate of interest. This formula was derived from a study of the relationship between the estimated total j and its standard error S; in which a parabolic or quadratic relationship was observed.
As an illustration of the use of this formula, suppose that the standard error of the estimated number of persons with joint problems is needed. From Table A, $=$28 ,577,000, the estimated total number of person years accumulated in 1980 by persons with joint-disorders. Table V contains the coel%cients for person years, a=3.0476 x 10Qand b=4.7081 X 10⁻⁴. The estimated standard error is then computed as
Sj= [(3.0476 X 10⁴)(2.8577 X 10⁷)+
(4.7081 X 10⁻⁴)(2.8577 X 10⁷)2]1’2
=[(8.7091 X 101’) + (3.8448X 10¹¹)] 1/2
= 1,120,445,000.
This estimated standard error for the total j can be used to create confidence intervals for the number of persons with joint problems. For example, a 68-percent confidence interval is obtained by adding and subtracting the standard error from the estimate. In this case, in 68 out of 100 samples drawn exactly in the same way as in NMCUES, the estimated number of persons with joint problems will range from 27,456,555 to 29,697,445. Similarly, a 95-percent confidence interval can be obtained by adding and subtracting from the estimate 1.96 times the standard error. Thus, for 95 of 100 samples drawn in the same way as in NMCUES, the estimated number of persons with joint disorders would be from 26,380,928 to 30,773,072.
TableV
Coefficients for standard error formula for estimated aggregates or totals, by estimator
Coefficient
Estimator a b
Person years . . . . . . . . . . . . . . . 3.0476 X 10⁴ 4.7081 x 10 4
Charges . . . . . . . . . . . . . . . . . . . 1.0986 X 10⁶ 4.5524 X 10 4
Lost productivity and value of lost productivity . . . . . . 1.1593 X1O’ 9.1757X1O 4
Vkits, prescription acquisitions,
ordisabilitydays . . . . . . . . . . . . 4.6408 X 10² 5.7634 X 10- ‘
Means
A large number of means for different types of measures are presented in this report. Despite the variety of measures presented, a single formula is recommended for calculating an estimated standard error for a mean. The formula given here is based on the assumption that the standard error of the mean is determined by two quantities, the population variance and the effect of the sample design on the variances. The population variance for weighted survey data with weights Wi is estimated as
where yi denotes the value of the characteristic Y for the ith sample person, and ~ is the weighted sample mean. The effect of the sample design on the variance of a sample mean is called the design effect, or “deff” (Kkh, 1965), and is often expressed as
deff = [1 + [(n/a) – 1] rob],
where a is the number of clusters in the sample design and roh is a measure of within-cluster similarity among observations from the same cluster.
The estimated standard error for a mean Y can be calculated as
12
S: = deff � -%[1n
“ - += [1+[ 1,79~,637
1] rdz] � “2 [ 1
where rl is the estimated population total for the subgroup under consideration and 1,795,637 represents the number of clusters (a= 138) times the average basic person weight. Consequently, fi/1,795,637 is an estimator for n/a in the expression for deff. The values of rdz and S2 for a variety of means appearing in this report can be obtained from Table VI. The table provides, for example, values of roh and ? for mean charges and mean utilization measures of various types.
As an illustration, consider the standard error of the per capita charges generated in the treatment of all musculoskeletal conditions for males during 1980. From Table 7, for all musculoskeletal conditions; male Y= $316, ad from Table VI, under the entry “Mean charges per person, All charges, Total ,“ the values r-oh= 0.029644 and $2=7.2407 x 10¹⁰ are obtained. There were an estimated h = 19,408,000 males with mus-
57

�
Table VI
Values for roh and& for standard error formula for estimated means, by estimator
Estimator roh # Estimator roh #
Mean charges per person Mean charges per visit
All charges: All charges:
Ambulatory visits . . . . . . . . . . . . 0.029644 2.4952x10⁹ Ambulatory visits . . . . . . . . . . . . . . 0.018777 3.7690 X 10⁷
Hospitalstays . . . . . . . . . . . . . . . . 0.029644 6.1652x10’0 Hospital stays . . . . . . . . . . . . . . . . 0.018777 8.4926 X 10”
Physician visits . . . . . . . . . . . . . . . 0.029644 6.1914x10a Physician visits . . . . . . . . . . . . . . . 0.018777 2.4686 X 10⁷
Total . . . . . . . . . . . . . . . . . . . . . . . 0.029644 7.2407x 10’0 Emergency room visits . . . . . . . . . 0.018777 9.7896 X 10⁶
Emergency room visits . . . . . . . . . 0.029644 9.9816x10⁷ Prescribed medications . . . . . . . . . 0.018777 6.7348 X 10⁵
Prescribed medications . . . . . . . . . 0.029644 9.6458x10⁷ Charges paid out of pockeL
Hospital outpatient visits . . . . . . . . 0.031367 7.6646x10⁶ Ambulatory visits . . . . . . . . . . . . . . 0.018777 8.8152 X 10⁶
Independent provider visits . . . . 0.031367 2.6559x10⁷ Hospital stays . . . . . . . . . . . . . . . . 0.018777 9.4998 X 10’0
Hospital outpatient visits Physician visits . . . . . . . . . . . . . . . 0.018777 9.2576 X 10⁶
(nonphysician provider) . . . . . . . 0.031367 4.2419 X 10⁸ Emergency room visits . . . . . . . . . 0.018777 1.1109 XIO8
Physician visits Prescribed medications . . . . . . . . . 0.018777 7.8309 X 10⁵
(nonphysician provider) . . . . . . . .
Dental and 0.031367 5.3375 x 10’
Mean visits per user
other medical expenses . . . . . . 0.031367 8.8305 X 10⁷ Ambulatory visits . . . . . . . . . . . . . . . 0.048246 1.4117 XI06
Charges paid out of pocket: Hospital stays . . . . . . . . . . . . . . . . . . 0.048246 4.3009 x 10³
Ambulatory visits . . . . . . . . . . . . . . 0.029644 2.4323 X 10⁸ Physician visits . . . . . . . . . . . . . . . . . 0.048246 4.4788 X 10⁵
Hospital stays.............,.. 0.029644 2.4068 X 10⁹ Emergency room visits . . . . . . . . . . . 0.046246 7.9937 x 10³
Physician visits . . . . . . . . . . . . . . 0.029644 1.0745x 10⁸ Prescribed medications . . . . . . . . . . 0.048246 1.3402 X 10⁶
Total . . . . . . . . . . . . . . . . . . . . . . . 0.029644 3.5873 X 10⁹ Emergency room visits . . . . . . . . . 0.029644 1.0038 X 10⁷
Mean visits per parson
Prescribed medications . . . . . . . . . 0.029644 4.5416 X 10⁷ Ambulatory visits . . . . . . . . . . . . . . . 0.048246 1.6398 X 10⁶ Hospital outpatient visits . . . . . . . . 0.031367 8.6571 X 10⁶ Hospital stays . . . . . . . . . . . . . . . . . . 0.048246 1.0029 X 10⁴ Independent provider visits . . . . . . 0.031367 2.4996 X 10* Physician visits . . . . . . . . . . . . . . . . . 0.048246 5.5650 X 10⁵ Hospital outpatient visits Emergency room visits . . . . . . . . . . . 0.048246 1.6024 X 10⁴
(nonphysician provider) . . . . . . . . 0.031367 2.5341 X 10⁷ Prescribed medications . . . . . . . . . . 0.048246 1.6651 X 10⁶ Physician visits
(nonphysician provider) . . . . . . . . 0.031367 6.7847 X 10⁸ Mean percent paid out of pocket
Dental and Ambulatory visits . . . . . . . . . . . . . . . 0.051674 2.3071 X 10³ other medical expenses . . . . . . . 0.031367 3.8943 X 10⁸ Hospital stays . . . . . .. . . . . . . . . . . . . 0.011724 1 .7959x 10*
Prescribed medications . . . . . . . . . . 0.056569 2.7935 X 10³ Mean charges per user Dental and other
All charges: medical expenses . . . . . . . . . . . . . . 0.053301 2.61 50X 103
Ambulatory visits . . . . . . . . . . . . . . 0.043633 3.0423 X 10⁹ Hospital stays . . . . . . . . . . . . . . . . 0.043633 3.0044X 10” Mean length of hospital stay . . . . . . . 0.013098 8.5018 X 10⁵
Physician visits . . . . . . . . . . . . . . . 0.043633 1.1955X10⁹ Mean bed-disability days . . . . . . . . . 0.023772 7.6885 X 10⁶
Total . . . . . . . . . . . . . . . . . . . . . . . 0.043633 8.7587 X 10’0 Mean work-loss days . . . . . . . . . . . . 0.026868 5.2013 X 10⁶
Emergency room visits . . . . . . . . . 0.043633 3.3067 X 10⁸ Mean restricted-activity days . . . . . . 0.058349 3.4354 x 10’
Prescribed medications . . . . . . . . . 0.043633 1.2535 X 10a Mean functional limitation score . . . . 0.050066 4.9489 X 10⁴
Charges paid out of pocket: Mean number of
Ambulatory visits . . . . . . . . . . . . . . 0.043633 2.9046 X 10⁸ surgical procedures . . . . . . . . . . . . 0.0 1.4628 X 10⁸
Hospital stays . . . . . . . . . . . . . . . . 0.043633 1.6296 X 10’0 Physician visits . . . . . . . . . . . . . . . 0.043633 1.5871 X 10⁸ Total . . . . . . . . . . . . . . . . . . . . . . . 0.043633 5.3877 X 10⁹ Emergency room visits . . . . . . . . . 0.043633 7.5825 X 10⁷ Prescribed medications . . . . . . . . . 0.043633 6.2806 X 10⁷
culoskeletal problems. Substituting these values into the I/2
expression for Sy, = [1 + (10.8084 - 1)(0.029644)] (3,730.78)1 1
SF= 19’408’000 - 1)(0.029644)1 = [(1.2908)(3,730 .78)]]’2 [[
1 + ( 1,795,637
= 69.39.
7.2407 X 10¹⁰ l/2 The standard error of per capita total charges generated
19,408,000 I in the treatment of musculoskeletal conditions among
-! men is $69.39.
58

�
Approximate confidence intervals may be constructed for the population mean by adding to and subtracting from the estimated mean a constant times the estimated standard error. For example, to form a 95-per-cent confidence interval for the estimated per capita charges for men with musculoskeletal problems, 1.96 times the estimated standard error ($136) is added to and subtracted from the estimated mean Y= $316. In this case, the 95-percent interval ranges from $180 to $452.
When the estimated sample size is about the same size as or smaller than the constant 1,795,637 in the standard error formula, the design effect effectively be-comes equal to 1. Thus, when ii< 1,795,000, the design effect portion of the standard error formula is not necessary, and the estimated standard error can be calculated simply as
Sy=[m]“~,
where fz is again chosen from Table VI. For example, there are an estimated h= 996,000
black persons with back problems. To estimate the standard error of the per capita charges for all health care for these persons in 1980 @=$322 from Table 7), the value s?= 7.2407 X 10¹⁰is obtained from Table VI as before and
7.2407 X 10¹⁰ “z“Sy= [ 996,000 1
= 269.63.
To form an approximate 95-percent confidence interval for the per capita charges, 1.96 times the standard error ($528) is added to and subtracted from the estimated mean, -j=$322. The 95-percent interval thus ranges from – $206 to $850.
Proportions, Percents, and Prevalence Rates
The standard error of a proportion is computed using a formula similar to that recommended for the standard error of a mean. Let @denote the estimated proportion for which a standard error is needed. The standard error forp is calculated as
. 13,012~(1 -~) “z Sp = [1 + I I ,79;,637 -l]roh]
ii 1[
where ii is the estimated sample size on which the pro-portion is based, r-ohis a value selected from Table VII, and the constant 13,012 is the average time-adjusted weight for all persons in the sample. For proportions, the population variance can be estimated simply as
and hence can be estimated directly from the sample proportions themselves (i.e., no value of ~2is needed in Table VII). The design effect, the ratio of the actual sampling variance for the estimated proportion to the variance that would be achieved for a simple random sample of the same size, is calculated for proportions in the same way as it was calculated for means.
As an iHustration of the use of the formula for SF, consider obtaining the standard error for the proportion of persons @ = O.107) who have joint problems and rate their health as poor (Table B). To calculate the standard error for percents, the same formula can be used as for proportions after the percent has been divided by 100. There are an estimated fi= 3,057,739 persons in the group (O.107 x 28,577,000), and roh = 0.069992 is obtained from Table VII. Substituting these values into the formula for Se,
Sp= 1[ 3’057’739 – 1)(0.069992)1121 + ( 1,795,637
13,012(0.107)(1 - 0.107) 3,057,739 1
. 1 + (0.7028)(0.069992) 31;:;;9 >3[[ 1]
12
= [(1.4920)(4.0661 X 10⁻⁴)] I ~
= 0.024630.
Because Sp= 0.024630 is the estimated standard error for the proportion ~= 0.107, simply multiply 5Pby 100 for a standard error of 2.4630 for the percent 10.7.
Table VU
Values of rohfor standard error formula for estimated proportions, by estimator
Estimator roh
Person years . . . . . . . . . . . . . . . . . . . . . . . . . . . . . . . . 0.069992 Charges . . . . . . . . . . . . . . . . . . . . . . . . . . . . . . . . . . . . 0.041917 Charges paidoutofpocket . . . . . . . . . . . . . . . . . . . . . . 0.019816 Visits . . . . . . . . . . . . . . . . . . . . . . . . . . . . . . . . . . . . . . . 0.084014
An approximate 95-percent confidence interval for the percent can now be calculated by adding to and subtracting from the estimated percent 1.96 times the estimated standard error. In this case, the 95-percent interval ranges from 5.9 to 15.5 percent of those persons with joint problems rating their health as poor.
When the estimated sample size is less than or equal to 1,795,637, the design effect is close to 1 and the formula can be simplified to
59
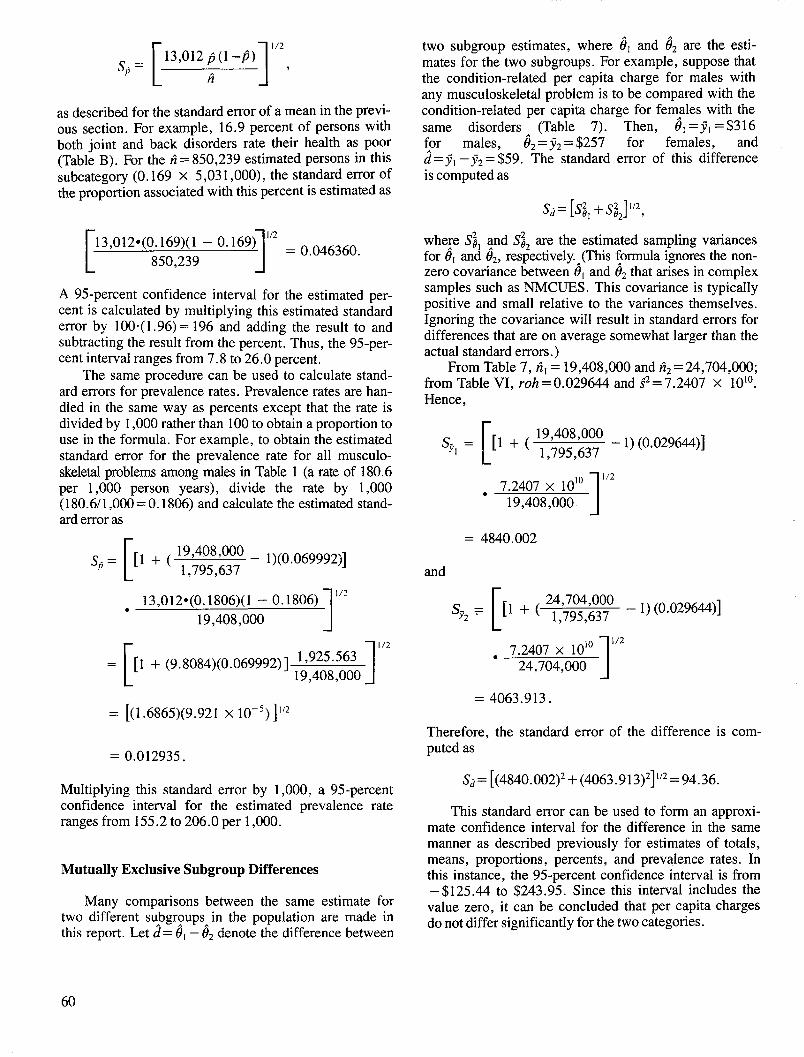
two subgroup estimates, where dl and & are the estimates for the two subgroups. For example, suppose that the condition-related per capita charge for males‘=[’3’012:(’-$)1”27with any musculoskeletal problem is to be compared with the
as described for the standard error of a mean in the previous section. For example, 16.9 percent of persons with both joint and back disorders rate their health as poor (Table B). For the fi = 850,239 estimated persons in this subcategory (O. 169 x 5,031,000), the standard error of the proportion associated with this percent is estimated as
13,012*(0.169)(1 – 0.169) “2 = 0046360
[ 850,239 1A 95-percent confidence interval for the estimated per-cent is calculated by multiplying this estimated standard error by 100”( 1.96) = 196 and adding the result to and subtracting the result from the percent. Thus, the 95-per-cent interval ranges from 7.8 to 26.0 percent.
The same procedure can be used to calculate standard errors for prevalence rates. Prevalence rates are handled in the same way as percents except that the rate is divided by 1,000 rather than 100 to obtain a proportion to use in the formula. For example, to obtain the estimated standard error for the prevalence rate for all musculoskeletal problems among males in Table 1 (a rate of 180.6 per 1,000 person years), divide the rate by 1,000 (180.6/1 ,000 = O.1806) and calculate the estimated standard error as
Sb = [1 + ( l:&::!?~ – 1)(0.069992)] [ 9? .13,012*(0.1806)(1 – 0,1806) 1’21
condition-related per capita charge for females with the same disorders (Table 7). Then, dl =j, = $316 [or males, 8Z=jj = $257 for females, and d= j] – Yz= $59. The standard error of this difference is computed as
SJ=[Sj,+s;2]1”,
whe~e Sjl ~nd S~2 are the estimated sampling variances for 61 and (32,respectively. A(This ~ormula ignores the non-zero covariance between 61 and f32that arises in complex samples such as NMCUES. This covariance is typically positive and small relative to the variances themselves. Ignoring the covariance will result in standard errors for differences that are on average somewhat larger than the actual standard errors. )
From Table 7, Al = 19,408,000 and fiz= 24,704,000; from Table VI, roh = 0.029644 and 82= 7.2407 X 101O. Hence,
SY, = [1 + ( 1::~:::~ – 1) (0.029644)] [ 99 .7.2407 X 1010 “2
19,408,000 1= 4840.002
and
24,704,000
19,408,000 SY2= [1 + ( 1,795,637 – 1) (0.029644)]
1I/2 [ .7.2407 X 1010 1’2
= [1 + (9.8084)(0.069992)] 1‘925”563 24,704,000 1[ 19,408,000
= [(1.6865)(9.921 X 10⁻⁵)]’”
= 0.012935.
Multiplying this standard error by 1,000, a 95-percent confidence interval for the estimated prevalence rate ranges from 155.2 to 206.0 per 1,000.
Mutually Exclusive Subgroup Differences
Many comparisons between the same estimate for two different su~gr~upsA in the population are made in this report. Let d= 6, – t92denote the difference between
= 4063.913.
Therefore, the standard error of the difference is computed as
S~= [(4840.002)2+ (4063 .913)2]1’2= 94.36.
This standard error can be used to form an approximate confidence interval for the difference in the same manner as described previously for estimates of totals, means, proportions, percents, and prevalence rates. In this instance, the 95-percent confidence interval is from – $125.44 to $243.95. Since this interval includes the value zero, it can be concluded that per capita charges do not differ significantly for the two categories.
60

Subgroup to Total Group Differences
Another type of comparison made in this report is be-tween an estimate for a subgroup and the sam: estimate for a group that contains the subgroup. Let d= @l – & denote the difference between a subgroup estimate and the estimate f:r a group in which the subgr~up is contained, where 61is the subgroup estimate and (+ is the estimate for the larger group. The standard error of this difference is computed as
SJ=S6*[1 – (l?,%)]’”,
where S~l denotes the standard error of the estimator PI and iil and fi~ denote the estimated sample sizes for the subgroup and for the larger group, respectively. (This formula is based on an assumption that the covariance tween 191and 19~is the same as the variance of 01, i.e., S~l. This assumption results in an estimated standard error for the difference that is on average somewhat larger than the actual standard error.)
For example, suppose that the standard error of the difference between per capita charges for black persons with any musculoskeletal problem and per capita charges for all persons with any musculoskelet:l problem is needed. From Table 7, (31=Yl=$318, d~=j~= $283, fil = 4,216,000, and fi~=44, 111,000. Using the formula
for estimating the standard error of the mean and values from Table VI (i.e., S’=7.2407 x 10’0 and t-oh= 0.029644),
r4,216,000
+, = 111 + ( 1,795,637 –1) (0.029644)]
7.2407 X 10’() “z 4,216,000 1
= 133.64.
Hence, the standard error of the difference, d=$318 – $283=$35, is computed as
SJ= 133.64 [1 –(4,216,@XY44,111 ,000)]”2= 127.09.
A 95-percent confidence interval can be constructed for the difference by adding to and subtracting from the estimated difference 1.96 times the estimated standard error of the difference. In this instance, the 95-percent confidence interval is from – $214.10 to $284.10. Thus, per capita charges do not differ significantly between black persons with musculoskeletal problems and all persons with these disorders because this confidence interval includes zero.
61

Appendix V. Definition of Terms
Age—This is the age of the person as of January 1, 1980. Babies born during the survey period were included in the youngest age category.
Ambulatory care visit—A direct personal exchange between an ambulatory patient and a health care provider is an ambulatory care visit. The visit may take place in the provider’s office, hospital outpatient department, emergency room, clinic, health center, or the patient’s home. Services may be rendered by a physician, chiropractor, podiatrist, optometrist, psychologist, social worker, nurse, or other ancillary personnel.
Bed-disability day—A bed-disability day is one on which a person stays in bed more than half of the daylight hours because of a specific illness or injury. All hospital days for inpatients are considered to be bed-disability days even if the patient was not actually in bed at the hospital.
Condition—Any entry on the questionnaire that de-scribes a departure from a state of physical or mental well-being is included. A condition is any illness, injury, complaint, impairment, or problem perceived by the respondent as inhibiting usual activities or requiring medical treatment. Pregnant y, vasectomy, and tubal ligation were not considered to be conditions; however, related medical care was recorded as if they were conditions. Neoplasms were classified without regard to site. Conditions, except impairments, were classified by type according to the Ninth Revision of the International Classification of Diseases (World Health Organization, 1977) as modified by the National Health Interview Survey Medical Coding Manual; these modifications make the code more suitable for a household interview survey. Impairments are chronic or permanent defects, usually static in nature, that result from disease, injury, or con-genital malformation. They represent decrease or loss of ability to perform various functions, particularly those of the musculoskeletal system and the sense organs. Impairments are classified by using a supplementary code specified in the coding manual. In the supplementary code, impairments are grouped according to type of functional impairment and etiology.
Condition-related disabili~ day—A condition-related disability day includes work-loss days, restricted-activity days, and bed-disability days for which the respondent listed the indexed condition as an underlying cause for staying home from work, cutting down on usual activities, or staying in bed.
Condition-related visit or hospital admission—An ambulatory visit or hospital admission for which the respondent listed the indexed condition as an underlying reason for seeking medical services.
Disabili@—Disability is the general term used to describe any temporary or long-term reduction of a per-son’s activity as a result of an acute or chronic condition.
Disabili@ day-Short-term disability days are classified according to whether they are days of restricted activity, bed-disability days, hospital days, or work-loss days. All hospital days are by definition days of bed disability; all days of bed disability are by definition days of restricted activity. The converse form of these statements is, of course, not true. Days lost from work apply only to the working population. Work-loss days are also days of restricted activity. Hence, the restricted-activity day is the most inclusive term used to describe disability days.
Employed—An individual is classified as employed if he or she worked at any time in 1980.
Family—A group of people living together and related to each other by blood, marriage, adoption, or foster care status is considered a family. An unmarried student 17–22 years of age living away from home was also considered part of the family even though his or her residence was in a different location during the school year.
Health care coverage—Twelve mutually exclusive categories of health care coverage were developed. Be-cause of the importance and extent of Medicare coverage for persons 65 years of age and over, the population was first divided into those under 65 years of age and those 65 years of age and over. For persons under 65 years, coverage is divided into four mutually exclusive categories: Coverage all year from a single source, cover-age all year from a mixture of sources, coverage only part of the year, and no health care coverage. For those under 65 years and covered all year from a single source, three subcategories of coverage were designated: Private insurance only, such as a commercial carrier or Blue Cross, Medicaid only, and other government programs including Medicare, CHAMPUSICHAMPVA, Indian Health Service, and other programs covering the cost of health care. Persons in the part-year-coverage category had health care coverage under either a private insurance
62

policy or a public program, but the coverage did not extend throughout the year.
People 65 years of age and over are partitioned into two major coverage categories: Covered by Medicare and not covered by Medicare. The former group is sub-divided into persons having only Medicare coverage, those who have supplemented their Medicare with private policies, and those who are covered not only by Medicare but also by Medicaid, the Indian Health Service, or other government program. The second subgroup, those not having Medicare, is divided into persons who have some other type of health care coverage, whether private or public, and those who have no coverage at all.
Homemaker—An individual is classified as a home-maker if he or she did not work at all in 1980 (unemployed or not in the labor force) and claimed housekeeping as his or her main activity in 1979. Disabled homemakers are not included.
Hospital admission—This is the formal acceptance by a hospital of a patient who is provided room, board, and regular nursing care in a unit of the hospital. A patient admitted to the hospital and discharged on the same day is considered to have had a hospital admission. Also included is a hospital stay resulting from an emergency department visit.
Hospital days—The total number of inpatient days accumulated at time of discharge by patients discharged from short-stay hospitals during a year constitute hospital days. A stay of less than 1 day (patient admission and discharge on the same day) is counted as zero days in the summation of hospital days. For patients admitted and discharged on different days, the number of days of care is computed by counting all days from (and including) the date of admission to (but not including) the date of discharge.
Household—Occupants of group quarters or of a housing unit that was included in the sample constitute a household. A household can comprise one person, a family of related people, a number of unrelated people, or a combination of related and unrelated people.
Housing unit—A group of rooms or a single room occupied or intended for occupancy as separate living quarters is a housing unit if the occupants do not live and eat with any other persons in the structure and if there was either direct access from the outside or through a common hall or there were complete kitchen facilities for the use of the occupants only.
Key person—A key person was (1) an occupant of a national household sample housing unit or group quarters at the time of the first interview; (2) a person related to and living with a State Medicaid household case member at the time of the first interview; (3) an unmarried student 17–22 years of age living away from home and related to a person in one of the first two groups; (4) a related person who had lived with a person in the first two groups between January 1, 1980, and the round 1 interview, but was deceased or had been institutionalized; (5) a baby born to a key person during 1980; or (6) a person who was living outside the United
States, was in the Armed Forces, or was in an institution at the time of the round 1 interview but who had joined a related key person.
,hzitation of activiv—A functional limitation score was developed for classifying limitation of activity. It ranges from O, indicating no limitation of activity, to 8, meaning severe activity Imitation, and to 9, indicating death during the survey period. The functional limitation score was developed from responses to a battery of questions designed to assess ability to perform various common functions such as walking, driving a car, and climbing stairs. For NMCUES, these questions were asked of persons 17 years of age and over.
Median charge per person—The amount at which half the reference population had lower charges and half had higher charges.
iVonkey person—A person related to a key person who joined him or her after the round 1 interview but was part of the civilian noninstitutionalized population of the United States at the date of the first interview is considered nonkey.
Patient—A person who is formally admitted to the inpatient service of a short-stay hospital for observation, care, diagnosis, or treatment is considered a patient. In this report, the number of patients refers to the number of discharges during the year, including any multiple discharges of the same individual t?om one or more short-stay hospitals. The terms “patient” and “inpatient” are used synonymously.
Per capita charges—These charges were calculated by dividing the total charges by the number of people in the reference population.
Perceived health stafus—The family respondent’s judgment of the health of the person compared to others the same age, as reported at the time of the first interview. The categories were excellent, good, fair, or poor.
Prevalence of conditions—In general, prevalence of conditions is the estimated number of conditions of a specified type existing at a specified time or the average number existing during a specified interval of time (1980 in this survey).
Race—The race of people 17 years of age and over was reported by the family respondent; the race of those under 17 was derived from the race of other family members. If the head of the family was male and had a wife who was living in the household, her race was assigned to any children under 17 years of age. In all other cases, the race of the head of the family (male or female) was assigned to any children under 17 years of age. Race is classified as “white,” “black,” or “other.” The “other” race category includes American Indian, Alaskan Native, Asian, and Pacific Islander. The category “white and other” includes the categories “white” and “other.”
Region—NORTHEAST: Maine, New Hampshire, Vermont, Massachusetts, Rhode Island, Connecticut, New York, New Jersey, Pennsylvania; NORTH CENTRAL: Michigan, Wisconsin, Ohio, Indiana, Illinois, Minnesota, Iowa, Missouri, North Dakota, South
63

Dakota, Nebraska, Kansas; SOUTH: Delaware, Mary-land, District of Columbia, Virginia, West Virginia, North Carolina, South Carolina, Georgia, Florida, Kentucky, Tennessee, Alabama, Mississippi, Arkansas, Louisiana, Oklahoma, Texas; WEST: Montana, Idaho, Wyoming, Colorado, New Mexico, Arizona, Utah, Nevada, Washington, Oregon, California, Alaska, Hawaii.
Reporting unit—This is the basic unit for reporting data in the household component of NMCUES. A reporting unit consists of all related people residing in the same housing unit or group quarters. One person could give information for all members of the reporting unit.
Restricted-activity day—A restricted-activity day is one on which a person cuts down on his or her usual activities for the whole of that day because of an illness
or an injury. The term “usual activities” for any day means the things that the person would ordinarily do on that day. A day spent in bed or a day home from work because of illness or injury is, of course, a restricted-activity day.
Round—A round was the administrative term used to designate all interviews that occurred within a given period of time and that used the same instruments and procedures.
Work-loss day—A work-loss day is a day on which a person did not work at his or her job or business because of a specific illness or injury. The number of days lost from work is determined only for persons 17 years of age and over who reported that at any time during the survey period they either worked at or had a job or business.
64

Department of Health and Human Services
Otis R. Bowen, M. D., Secretary
Health Care Financing Administration
William L. Roper, M. D., Administrator
OffIce of Research and Demonstrations
Judith B. Willis, Director
OffIce of Research
Allen Dobson, Ph. D., Director
Division of Program Studies
Carl Josephson, Director
Surveys Studies Branch
Herbert A. Silverman, Ph. D., Chief
Public Health Service
DonaId Ian Macdonzdd, M. D., Acting Assistant Secretary for Health
National Center for Health Statistics
Manning Feinleib, M. D., Dr. P. H., Dkector
Oftice of Interview and Examination Statistics Program
Peter L. Hurley, Acting Associate Director
Division of Health Interview Statistics
Owen T. Thombeq, Jr., Ph. D., Director
Utilization and Expenditure Statistics Branch
Robert A. Wright, Chief