dis 86 (december 2003) research notes 83 acknowledgments
TRANSCRIPT

DIS 86 (December 2003) Research Notes 83
Acknowledgments: The authors thank the Bloomington Drosophila Stock Center for fly
stocks and the Plant-Microbe Genomics Facility at Ohio State University for DNA sequencing. The
authors also thank Mary E. Van Doren for editorial work on the manuscript. This work was
supported by a grant from the National Institutes of Health to S.T.
References: Apionishev, S., D. Malhotra, S. Raghavachari, S. Tanda, and R. S. Rasooly 2001,
Genes Cells 6: 215-224; Ashburner, M., 1989, Drosophila. A Laboratory Manual. Cold Spring
Harbor Laboratory Press, Cold Spring Harbor; Engels, W.R., D.M. Johnson-Schlitz, W.B. Eggleston,
and J. Sved 1990, Cell 62: 515-525; Epps, J.L., and S. Tanda 1998, Curr. Biol. 8: 1277-1280; Gloor,
G.B., N.A. Nassif, D.M. Johnson-Schlitz, C.R. Preston, and W.R. Engels 1991, Science 253: 1110-
1117; Melchior, F., 2000, Annu. Rev. Cell Dev. Biol. 16: 591-626; Muller, S., C. Hoege, G.
Pyrowolakis, and S. Jentsch 2001, Nat. Rev. Mol. Cell Biol. 2: 202-210; Preston, C.R., J.A. Sved,
and W.R. Engels 1996, Genetics 144: 1623-1638; Robertson, H.M., C.R. Preston, R.W. Phillis, D.M.
Johnson-Schlitz, W.K. Benz et al., 1988, Genetics 118: 461-470; Yeh, E.T., L. Gong, and T.
Kamitani 2000, Gene 248: 1-14.
Failure to suppress polo sterility but an hypothesis for why males are so very sterile
(plus somatic reversion of st1).
Carpenter, Adelaide T.C. Department of Genetics, University of Cambridge,
Cambridge CB2 3EH, U.K.
All extant alleles of polo are female sterile (no surprise, the female-sterile phene was used to
identify most of them), as homozygotes if viable, as transheteroallelic combinations of weaker
allele/stronger if the stronger allele is lethal; however, weaker combinations can be male fertile
although stronger combinations are completely male sterile. I therefore reasoned that it might be
possible to identify dominant suppressors of polo male sterility in a genotype that is just sterile as the
rare male who is fertile. Moreover, since in a polo background only the sons who inherit such a
suppressor will be fertile, the suppressor can be anywhere in the genome, being kept in stock by
virtue of conferring fertility; it can be located and properly balanced at leisure.
The test cross is: mutagenized polox/st polo1 ca (extraneous lethal) males crossed back to st
polo1 ca (extraneous lethal)/Balancer females; should any of the polox/polo1 males be fertile, cross
their polox/polo1 sons again back to polo1 stock females. Since polo1 is homozygous male fertile,
the extraneous lethal its chromosome carries guarantees that all of the non-Balancer sons are
polox/polo1 and sterile unless they have also inherited the suppressor. polo1 was chosen as the tester
allele because it is homozygous male fertile; its lesion in polo (Tavares, Glover, and Sunkel, 1996)
reduces Polo activity (since polo1/strong polo males are sterile) but does not abolish it.
Consequently, fertility could be restored to polox/polo1 sons by mutations that a) increase levels of
Polo protein per se (since two doses of polo1 confers fertility), or b) reduce the requirement for Polo
protein during spermatogenesis, or c) anything I haven't thought of.
Two different polox alleles were chosen: "polo6”, which is viable but male sterile/deficiency
for polo, and polo8, which is lethal both homozygous and over the deficiency. However,
"polo6"/polo1 males are already fertile and indeed this chromosome behaves as though it carries
polo1 -- there seems to have been historical stock confusion. Consequently, only mutagenized
Research Notes DIS 86 (December 2003) 84
polo8/polo1 males were tested for fertility; however, females of both genotypes were also tested --
since I had them after all and suppressing female sterility would also be interesting.
th st "polo6" ca/TM6B and ru h th st polo8 red sr e/TM6C, Sb males were given 5000 rads of
X rays (Torrex 150 X-ray machine) and mated to st polo1 ca/TM6B females; F1 "polo6"/polo1
females, polo8/polo1 females, and polo8/polo1 males were mated back to polo1 stock flies of the
opposite sex in batches of 5. It should be noted that both these combinations of polo alleles have
good viability, as indeed does polo1/deficiency; the reduction in viability originally noted for polo1
homozygotes (Herrmann, Amorim and Sunkel, 1998) must therefore reflect extraneous sub-vital
mutations present on the original chromosome.
For polo8/polo1, 3805 females and 3393 males were sterile; the mutagenesis was effective
because in addition one presumptive new allele of Dichaete was recovered on a polo8 chromosome(=
D12) and one of Auricular (= Au2) on TM6C, Sb; and one scarlet on TM6C, Sb (Minute and too
female-sterile to be kept), two clarets on TM6C, Sb kept, one not tested, two sterile plus lots of other
dull phenotypes not tested. For "polo6"/polo1, 2618 females were sterile and one new allele of
scarlet was recovered on TM6B. There do not seem to be many genes capable of mutating to
dominant suppressors of polo sterility -- anywhere in the genome, since the flies tested were F1s and
therefore carried a mutagenized full haploid complement.
One polo8/polo1 male test was fertile but it does not seem to have been a suppression event;
first lots of ca Tb Hu (= polo1/TM6B) progeny eclosed, I thought "non-virgin" of course, but
eventually one sole e Tb Hu female (= polo8/TM6B) appeared. Attempts to rescue any suppressor
from either genotype failed but the putative polo8 progeny did carry a strong polo allele with the
expected markers for polo8. Since polo1 is male-fertile homozygous, I think this fertile test was the
result of a germ-line event that generated a polo1 homozygous clone (either a somatic crossover or
somatic nondisjunction). That such a large clone would succeed in producing polo1-bearing
functional sperm is not surprising but the inclusion of the sole polo8-bearing functional sperm is, and
provides an hypothesis for why polo8/polo1 males are completely sterile in the first place despite
producing moderate numbers of apparently normal onion-stage spermatids. Although the processes
of individualization and coiling can sort the normal spermatids in a half normal/half abnormal bundle
(SD/+ males are fertile even though no SD+ sperm are produced; Peacock, Tokuyasu and Hardy,
1972), there may well be an upper limit on this, both within each individual bundle and throughout
the testis; one normal spermatid in the midst of lots of abnormal ones may not make it to being a
mature sperm either (and polo8/polo1 testes contain no motile mature sperm although lots of
elongated immature bundles, and even apparently individualized, coiled bundles, are present).
Alternatively, females may reject an ejaculate containing only (say) six sperm. This may well
provide an experimental bypass for separating specific gene effects from testis-environmental effects:
can your mutant of interest make a functional sperm in a testis with a sperm-producing clone even
though it can't on its own?
Early on I noticed that the occasional st1/st1 fly had st+//st mosaic eyes, so I scored for this;
28 of the polo8/polo1 females were such mosaics, 12 of the polo8/polo1 males, and 11 of the
"polo6"/polo1 females, for an overall frequency of 51/7299 = 0.7%. I have subsequently spotted
such mosaics in a variety of other genotypes so they are unlikely to be caused either by polo or by X-
ray mutagenesis. The st1 mutation is known to result from insertion of a 412 transposable element

DIS 86 (December 2003) Research Notes 85
(ten Have, Green and Howells, 1995); it seems to be slightly unstable somatically.
Acknowledgments: This research was supported by MRC grant G9901264 to David Glover.
References: Herrmann, S., I. Amorim, and C.E. Sunkel 1998, Chromosoma 107: 440-451;
Peacock, W.J., K.T. Tokuyasu, and R.W. Hardy 1972, In: Proc. Int. Symp. The Genetics of the
Spermatozoon, (Beatty, R.A., and S. Glucksohn-Waelch, eds.). pp. 247-268. Edinburgh/New York;
Tavares, A.A.M., D.M. Glover, and C.E. Sunkel 1996, EMBO J. 15: 4873-4883; ten Have, J.F.,
M.M. Green, and A.J. Howells 1995, Molec. gen. Genet. 249: 673-681.
Effect of intra- and interspecific competition on pupation height in Drosophila.
Chethan, B.K., and S.N. Hegde. Department of Studies in Zoology, Manasagangotri,
Mysore-570006, India.
D. nasuta belongs to nasuta subgroup of immigrans species group and D. rajasekari belongs
to suzukii subgroup of melanogaster species group. These two species are sympatric in distribution
(Krishna and Hegde, 2003). The isofemale lines of these two species were established from females
collected in semi domestic localities of Mysore city (Karnataka, India). After 10 generation of
inbreeding the flies were isolated and aged for 5 days. 50 males and 50 females of the same species
were introduced together into a culture bottle. This formed the pure culture exhibiting only
interspecific competition. In addition to pure culture, a mixed culture was also prepared by mixing
25 pairs of male and females of D. nasuta and 25 pairs of D. rajasekari were allowed to develop.
Five replicates of such culture were maintained. When pupae formed, the parental flies were
transferred to fresh bottles and pupal heights were measured. The pupae of two species in mixed
culture could be differentiated with their size and nature of spiracles. When adults emerged they
were added to bottles containing parents. This procedure was followed until the elimination of one of
the two species in the mixed culture. The pupal height was measured in all generations of pure and
mixed cultures. The pupal height at the interval of four generations was used for computation.
D. nasuta with their higher productivity eliminate D. rajasekari in a span of 14 generations.
The overall pupation height has been assessed during intra- and interspecific competitive condition.
The mean pupation height in the pure culture of D. rajasekari (6.10 ±±±± 0.49 to 6.47 ±±±± 0.49cm) was
higher than D. nasuta (5.01 ±±±± 0.42 to 6.21 ±±±± 0.47). The larvae of D. rajasekari can crawl to a greater
height than D. nasuta. In pure culture the pupal height of D. nasuta gradually increased over
generations. The intraspecific competition, therefore, has led to the increase in pupal height in this
species. In the interspecific competition, the pupal height of D. rajasekari decreased significantly,
indicating that the
interspecific com-
petition has a
serious impact on
the pupation height.
D. nasuta slowly
replaces D. rajase-
kari in interspeci-
fic competition.
Though in pure
culture the species
Table 1. Showing pupation height during intra and inter specific competition.
D. rajashekari D. nasuta Generation Pure culture Mixed culture Pure culture Mixed culture
1 6.47±0.49 5.71±0.49 5.01±0.42 6.18±0.45 4 6.10±0.48 6.15±0.49 5.86±0.45 5.81±0.48 8 6.37±0.48 5.57±0.45 6.12±0.45 5.40±0.48
12 6.14±3.46 3.20±0.52 6.21±0.47 5.26±0.45
Values are Means ± SE (cms).

Research Notes DIS 86 (December 2003) 86
showed increase in pupation height, in mixed culture the height decreased. Thus D. nasuta is a better
competitor than D. rajasekari.
Acknowledgment: The authors are grateful to Chairman, Department of Studies in Zoology,
University of Mysore, for providing Facilities.
References: Krishna, M.S., and S.N. Hegde 2003, Ital. J. Zool. 70: 47-52.
A revised cytological location of stambh A and of the breakpoints of Df(2R)44CE of
Drosophila melanogaster.
Jain, Charu, and Shanti Chandrashekaran.* Division of Genetics, Indian
Agricultural Research Institute, New Delhi, 110012, India. * Email: [email protected]
The mutation stambh A (stmA) (2-56.8cM) in Drosophila melanogaster was discovered
through its phenotype of reversible temperature sensitive (ts) paralysis (Shyngle and Sharma, 1985).
Adults and larvae homozygous for stmA1 and stmA
2 paralyse within 2-4 minutes at 38ºC temperature
and recover to normal behaviour when brought back to 23-24ºC . Mutations isolated later included
several unconditional embryonic lethal alleles stmA7, stmA
12, stmA
18-2 and several multiphasic lethals
(Chandrashekaran and Sarla, 1993; Kumar et al., 2001). stmA was mapped to the 42A16-42B2
interval (Chandrashekaran and Sarla, 1993) based upon the following observations:
1. Flies of the genotype stmA1 / stmA
1; Tp2;3 P32, containing two copies of stmA
1 and a wild type
copy of the 2nd chromosome region 41A to 44D4-8 (Figure 1, Table 1), transposed on
chromosome 3 showed wild type behaviour. On this basis stmA was roughly mapped to the 41A-
44D4-8 interval.
2. Deletions spanning 41A through 41C and 42A16 through 43 F8.9 (Figure 1, Table 1) were wild
type over stmA. The stmA12
bearing chromosome was associated with a visible cytological
deficiency 42A8-42B2, which could not be separated by recombination from the stmA embryonic
lethal phenotype at the time of the study.
On the basis of (1) and (2) stmA was placed between 42A8-42A16 (Figure 1). Deletions spanning 43
F8.9 and 44 D were not tested because of the deficiency associated with stmA12
.
Recently we were able to
separate, by meiotic recombi-
nation, the stmA12
allele from the
deficiency 42A8-42B2, without
altering the ts paralytic
phenotype of stmA12
/ stmA1 flies
or the recessive lethality of
stmA12
/ stmA12
homozygotes. It
became obvious that the 42A8-
42B2 map position of stambh A
was incorrect and it became
essential to re-determine, the cytological position of stmA.
We have tested five deficiencies (Figure 1, Table 2) all with at least one breakpoint distal to
43F8.9 to map stmA.
Df(2R)H3C1 and Df(2R) H3E1 both uncover the ts paralytic phenotype and lethality of the
Table1. Aberrations spanning 41A–42B2 used in mapping stmA (From Chandrashekaran and Sarla, 1993).
Rearrangement Breakpoints Whether stm A+ Tp 2;3 P 32 41A-44D4-8 Yes Df (2R) rl
10 41A Yes
Df (2R) V30 41B-41C Yes Df (2R) D5
L TE 146-SZ 4 42A16.19-43A1 Yes
Df (2R) pk 78s 42C1.7-43F8.9 Yes Df (2R) stm A
12 42A8-42B2 No

DIS 86 (December 2003) Research Notes 87
various stmA alleles (Table 3). stmA therefore maps to the 44D1-4 to 44D3-8 interval defined by the
proximal breakpoint 44D1-4 of Df(2R) H3E1 and the distal breakpoint 44D3-8 of Df(2R) H3C1. The
deficiency, Df(2R) 44C-E whose proximal breakpoint is 44C1-2 and distal breakpoint is 44E1-4,
according to Flybase (www.flybase.bio.indiana.edu) ought to be deficient for the relevant 44D1-4 to
44D3-8 region. Df(2R)44CE was therefore expected to uncover the mutant phenotype of stmA.
Contrary to expectations, Df(2R)44CE complemented stmA (Table 3). This unexpected observation
suggested that Df (2R)H3E1 was not deficient for all or some part of the 44D1 to 8 region.
Figure 1. Chromosomal aberrations used to map stambh A. Dotted bars: deficiencies used in 1993 .
Solid Black bars: deficiencies used in the present study. Stippled bar: Transposition (1993). Solid
triangle: PlacW element at 44D4.5.
Table 2. List of deficiencies with breakpoints distal to 43F8.9 used to map stambh A. * as published by Flybase.
Breakpoints S. No
Deficiency (2R)
Bloomington Stock Numbers Proximal Distal
Whether stmA
+
1 cn 87e 224 42B4.C1 43F.44A1 Yes 2 cn 9 3368 42E 44C Yes 3 H3 C1 198 43F 44D3.8 No
4 44CE 3643 44C1.2* 44E2.4* Yes 5 H3E1 201 44D1.4 44F12 No
The breakpoints of Deficiency (2R) 44CE: We examined polytene chromosomes of Df (2R)
44C-E /+ larvae and found that it is not entirely deficient for the 44C1-2 to 44E2-4 region. The
following observations were made about the cytology of Df(2R)44CE: (1) It consists of a proximal
deficiency (P) of a deeply staining doublet; (2) a large distal (D) deficiency; and (3) that P and D are

Research Notes DIS 86 (December 2003) 88
separated by a single band (S) (Figure 2).
Figure 2. A lacto aceto-orcein stained polytene chromosome preparation of Df (2R)44CE/+ P:
Proximal deficiency 44 C1.2; S: 44D1.2 ; D: 44 D3-44E2.4.
The presence of band ‘S' supports the genetic complementation of Df(2R) 44C-E over stmA.
Complementation data also suggest that `S' should comprise of bands in the 44D1 to 8 interval. It is
difficult to resolve the identity of `S' unequivocally at the current level of microscopy. For the
present, `S' has been defined as 44D1-2 based upon the argument that the doublet band 44D1-2 is the
only band common to Df (2R) H3C1 and Df (2R)H3E1. The proximal deficiency `P' is defined as a
deficiency for the doublet 44C1-2. The breakpoints of the distal deficiency (D) were defined as 44D3
(proximal) and 44E1.4 (distal). On the basis of this interpretation, we have mapped stambh A to the
doublet 44D1.2, based on the observation that 44D1.2 is the only band common to the overlapping Df
(2R) H3C1 and Df (2R)H3E1 and is present in Df(2R)44CE. Df(2R)44CE is also reported to
complement l(2)k05118 a multiple PlacW insert line that has one insertion at 44D1-2
(www.fruitfly.org, visited on 21.6.2001).
We have come across published reports that the proximal breakpoint in Df(2R) 44C-E might
be 44C4-5, and not 44C1-2 Df(2R)44CE (Table 4). Among seven papers surveyed, five list the
proximal breakpoint of Df(2R)44CE as 44 C4.5 and not 44 C1.2 as listed in Flybase. We interpret the
conflicting reports to the twin deficiencies associated with Df(2R)44CE.
The unexpected complementation pattern of Df(2R)44CE over stmA and its cytology point to
Table 3. Viability and temperature sensitive paralytic response of stmA alleles over deficiencies H3C1,H3E1 and 44CE. TsP: TS paralytic homozygous viable allele; L:Recessive Lethal allele; P: Paralytic; NP:Non-Paralytic.
H3 C1 43F to 44D3-8
H3E1 44D1-4 to 44F12
44CE 44C1.2-44E2.4 stmA
Allele
Viable ts Paralytic / Lethal
% viability
Paralytic response
% viability
Paralytic response
% viability
Paralytic response
stmA1 Ts P 112 P 104 P 81 NP
stmA2 Ts P 66 P 101 P 52 NP
stmA7 L 29 P 27 P 222 NP
stmA12
L 0 - 34 P 80 NP stmA
PEL1 L 0 - 0 - 0 NP
stmA PEL7
L 0 - 0 - 29 NP stmA
PEL8 L 0 - 0 - 18 NP
stmA PEL11
L 0 - 0 - ND ND stmA
PEL4 L 0 - 0 - 42 NP
stmA PEL3
L 0 - 0 - 29 NP
P
S
D

DIS 86 (December 2003) Research Notes 89
the need for its breakpoints be determined accurately, for it to be of greater utility to the Drosophila
research community.
References: Bilder, D., and M.P. Scott 1995, Genetics 150: 1091-1103; Chandrashekaran. S.,
and N. Sarla 1993, Genetica 90: 61-72; Coyne, J.A., S. Simeonidis, and P. Rooney 1995, Genetics
150: 1091-1103; Firth, L., J. Manchester, J.A. Lorenzen, M. Baron, and L.A. Perkins 2000, Genetics
156: 733-748; Kania, A., A. Salzberg, M. Bhat, D. D'evelyn, Y. He, I. Kiss, and H.J. Bellen 1995,
Genetics 139: 1663-1678; Kumar, M., M. Joseph, and S. Chandrashekaran 2001, J. Genet. 80: 83-
95; Li, W., E. Noll, and N. Perrimon 2000, Genetics 156: 763-744; Pasyukova, E.G., C. Vieira, and
T.F.C. Mackay 2000, Genetics 156: 1129-1146; Shyngle, J., and R.P. Sharma 1985, Indian J. Exptl.
Biol. 23: 235-240; Zhang, N., J. Zhang, Y. Cheng, and K. Howard 1996, Genetics 143: 1231-1241.
The extension of the geographic range of Drosophila malerkotliana on the American
continent.
Medeiros, Hermes F.,1 Marlúcia B. Martins
2, and Jean R. David.
3
1Departamento
de Genética, IB, UNICAMP, Campinas, SP, Brazil ;
2Coordenação de Zoologia,
Museu P. E. Goeldi, Pará, Brasil; 3CNRS, Laboratoire Populations, Genétique et
Evolution, 91198-Gif sur Yvette Cedex, France. For correspondence, email: [email protected]
gif.fr
Numerous species, either plants or animals, may become successful invaders, and biological
invasions are a major and recurrent problem for the protection and conservation of biodiversity in
ecological communities (Vermeij, 1996; Kolar and Lodge, 2001). Besides this practical purpose, the
study of such phenomena provides an opportunity to access many general questions in evolutionary
biology, including demographic bottle necks and climatic adaptations.
Among more than 3000 described species the Drosophilidae family harbors a small number of
widespread species which have reached a cosmopolitan status thanks to artificial modern-man
transportation. Since an earlier publication (David and Tsacas, 1981) which listed about 20 such
species, other cases of recent invasions have been documented, such as the European D. subobscura
in South and North America (Brncic et al., 1981; Huey et al., 2000) and the very recent case of
Zaprionus indianus in Brazil (Vilela, 1999; Tidon et al., 2003).
Here we focus on the case of D. malerkotliana, which has appeared on South American
continent several decades ago, and which now seems to extend its range in North America. Due to a
continuity of favorable habitats from South to North America, we expect that the extension of D.
malerkotliana will be limited only by climatic factors.
D. malerkotliana belongs to a cluster of 4 related species, within the D. ananassae subgroup
of the D. melanogaster group in the Sophophora subgenus. This cluster, the D. bipectinata complex,
comprises, besides D. bipectinata, D. parabipectinata, D. malerkotliana and D. pseudoananassae
(Bock, 1971a). These species are closely related and, in most combinations, make hybrids, that is
fertile F1 females but sterile males (Bock, 1971b). D. malerkotliana has the broadest distribution, and
indeed is subdivided into two subspecies. The type subspecies is found in India (Malerkotla is the
name of an Indian city), Thailand, and Malaysia; it is easily recognized by the fact that the male’s last
abdomen segments (5 and 6) are black. The pallens subspecies is defined by the fact that males have
an abdomen entirely yellow (as in the other species of the complex as well as in all females). It has a
more oriental distribution, being found in Borneo and Philippines (Bock, 1971a). Differences in the

Research Notes DIS 86 (December 2003) 90
shape of the Y chromosome have also been described between the subspecies (Kaneshiro and
Wheeler, 1970).
The species in the D. bipectinata complex are generalists, breeding in a diversity of sweet
decaying resources, and often have a domestic status like D. melanogaster. This is a favorable
situation for becoming an invader, and indeed the type subspecies of D. malerkotliana is known to be
cosmopolitan (David and Tsacas, 1981). Ancestral populations are presumably found in India, where
the species is abundant everywhere, from North to South. From there, the species has been introduced
in the Afrotropical region, and it is generally abundant at low elevations on the mainland (Tsacas et
al., 1981). It has been introduced to the Seychelles during the 20th
century, where it is very abundant
(Louis and David, 1986). Worth mentioning is the fact that D. malerkotliana is absent from Réunion
island and Mauritius (in the Indian Ocean) where another species of the complex (D.
parabipectinata) has been introduced (David and Tsacas, 1975; David et al., 1989a).
D. malerkotliana is now very abundant in South America, and especially in Brazil. It is a
dominant species in domestic Drosophilid communities (Val and Sene, 1980; Sene et al., 1980) and
has a strong invading capacity. In the Amazon region, its abundance may reach 70% in disturbed
forest habitats (Martins, 1989, 2001). It is also found, but with a much lesser frequency, in the
undisturbed, native forest. D. malerkotliana thus appears as a good biological indicator of habitat
disturbance in the Amazon forest (Martins, 2001).
The date of appearance of D. malerkotliana in Brazil is quite well documented (Val and Sene,
1980). Apparently it was absent in the 1950s and 1960s while it became quite abundant in the 1970s.
The origin of the propagule which invaded Brazil so quickly is not known. It seems likely to be
Africa, since D. malerkotliana is frequent there. An introduction from south East Asia is unlikely,
since this part of the world harbors the pallens subspecies. D. malerkotliana has extended its range to
most South American countries, provided the climate is sufficiently warm. For example it is abundant
in coastal places of Equator (Rafael et al., 2000) and Panamá (Sevenster, 1992; Sevenster and Van
Alphen, 1996; Shorrocks and Sevenster, 1995). Going South, it has been collected on Santa Catarina
island (SC, Brazil 27°42S) (Toni and Hofmann, 1995) but never in Porto Alegre (RS, Brazil, 30°03S)
(V.L.S. Valente, personal communication), nor in Uruguay (Goni et al., 1998). Going North of
Equator there is a continuity of favorable habitats and warm climatic conditions, up to the South of
USA. Indeed, the presence of D. malerkotliana in Mexico and Cuba was mentioned in the late ‘80s
(Chassagnard et al., 1989). The sudden appearance of the species in French Caribbeans (Martinique
and Guadeloupe) is also documented. In 1980 we investigated these communities (David and Capy,
1983) and no D. malerkotliana was found (only D. melanogaster and D. ananassae were
representatives of Sophophora). Ten years later, D. malerkotliana was very abundant in both islands,
especially at sea level (J. David, unpublished observation). The origin of the Caribbean D.
malerkotliana is not known, but might be Mexico or Cuba. Worth mentioning is the fact that
cosmopolitan, domestic species are certainly transported by man, but such introductions are not so
common, nor efficient. For example, D simulans is very abundant in North American mainland and
in Cuba. It is however completely absent (last observation in 1998) from Martinique and Guadeloupe,
while it is very common in St. Martin island, about 150 km north of Guadeloupe (see Morin et al.,
1999).
When a new species is introduced into different islands, the sizes of the propagules are not
known, but could be inferred by investigating the diversity of genetic markers. We may mention a
likely case for D. melanogaster. All populations in the world so far investigated are polymorphic for
the two widespread alleles at the Adh locus, although the frequencies are extremely variable across
latitudinal clines (David et al., 1989b). We know only one place in the world, Martinique Island,
where the Adh locus seems monomorphic. In the Caribbean region, the Fast allele is rare, at a
frequency less than 5%. Any fly sample of more than 50 individuals always reveals some

DIS 86 (December 2003) Research Notes 91
heterozygotes, but not in Martinique. From that island, we have analyzed more than 500 wild
collected flies, and never found a Fast allele. This observation suggests that the extant population was
founded by a very small propagule.
From an ecophysiological point of view, D malerkotliana is typically a tropical species,
whose distribution is limited by cold temperature in winter time. The cold sensitivity of D. ananassae
is well documented, since it cannot grow below 16oC (Morin et al., 1997). D. malerkotliana is not so
well known, but some unpublished data suggest the lower developmental limit to be 15oC (J.R.
David), and that fertility is reduced below 20oC (M.B. Martins). So in North Mexico, we expect that
proliferation of D. malerkotliana will favor the colonization of northern places, while winter low
temperature will destroy the summer populations. We do not know where the limit is, but recent
observations suggest that D. malerkotliana is now established in Southern USA. The species has been
regularly collected in the Tallahassee (FL) area at a latitude of 30°25N (Birdsley, 2003). In
September 2002, D. malerkotliana was collected (J.R. David) farther north, in the suburbs of Athens,
GA, at a latitude of 33°57N. In this community, two species were dominant, D. simulans and D.
affinis. D. malerkotliana should be searched for in all USA Southern states were its extension will be
limited only by low winter temperatures. From an ecological point of view, the species might be a
convenient indicator of climatic warming in the next decades. From an evolutionary point of view,
we know that D. malerkotliana is proliferating under a diversity of climates from the stable warm
environment of the Equator to subtropical places and even warm temperate climates. Several
Drosophila species are known to exhibit latitudinal clines in response to such climatic variation, and
indeed such clines may become established in less than 20 years, as such has been the case for D.
subobscura (Huey et al., 2000). Natural populations of D. malerkotliana might thus become a good
model for analyzing thermal adaptations, for comparing ancestral and derived populations and for
investigating the possible effects of recurrent demographic bottle necks.
Another cosmopolitan species, Zaprionus indianus, is likely to reach a similar distribution in
the forthcoming years. This African species was intoduced to Brazil in 1998 and spread very rapidly
(Tidon et al., 2003). It is now abundant in most places up to the Equator and was collected in Igarapé
Açu (Pará, Brazil) in December 2000 and in Belem in December 2002 (J.R. David and M. Martins,
unpublished). Since this species has apparently a very strong dispersal and colonizing ability, we
expect it will invade Mexico and Southern USA in a few years, and it should be searched there in the
same way as D. malerkotliana.
Acknowledgments: This is paper #3 of Franco-Brazilian Cooperation Project "Studies on a
recent biological invasion: Zaprionus Indianus in Brazil". H.F.M. was supported by a fellowship
from Fundação de Amparo à Pesquisa do Estado de São Paulo (FAPESP).
References: Birdsley, J.S., 2003, Dros. Inf. Serv., this issue; Bock, I.R., 1971a, Univ. Tex.
Publ. 7103: 273-280; Bock, I.R., 1971b, Chromosoma 34: 206-229; Brncic, D.J., A. Prevosti, M.
Budnick, M. Monclus, and J. Ocana 1981, Genetica 56: 3-9; Chassagnard, M.T., M. Solignac, and L.
Tsacas 1989, Annls Soc. ent. Fr. NS 25: 247-248; David, J.R., A. Alonso-Moraga, F. Borai, P. Capy,
H. Mercot, S.F. McEvey, A. Munoz Serrano, and S.C. Tsakas 1989b, Heredity 62: 11-16; David,
J.R., and P. Capy 1983, Acta Oecol., Oecol. gen. 4: 265-270; David, J.R., S.F. McEvey, M.
Solignac, and L. Tsacas 1989a, Revue Zool. afr. 103: 107-116; David, J.R., and L. Tsacas 1975,
Beitr. Ent. 25: 245-254; David, J.R., and L. Tsacas 1981, C. R. Seanc. Soc. biogeog. 57: 11-26;
Goni, B., M.E. Martinez, V.L.S. Valente, and C.R. Vilela 1998, Revta bras. Ent. 42: 131-140; Huey,
R.B., G.W. Gilchrist, M.L. Carlson, D. Berrigan, and L. Serra 2000, Science 287: 308-309;
Kaneshiro, K.Y., and M.R. Wheeler 1970, Dros. Inf. Serv. 45: 143; Kolar, C.S., and D.M. Lodge
2001, Trends Ecol. Evol. 16: 199-204; Louis, J., and J.R. David 1986, Acta Oecol., Oecol. gen. 7:
215-229; Martins, M.B., 1989, Acta Amazonica 19: 265-271; Martins, M.B., 2001, In: Lessons from
Amazonia: The Ecology and Conservation of a Fragmented Forest. (Bierregaard, R.O., Jr., C.

Research Notes DIS 86 (December 2003) 92
Gascon, T.E. Lovejoy, and R. Mesquita, eds.). Yale University Press, New Haven, 478 pp.; Morin,
J.P., B. Moreteau, G. Petavy, R. Parkash, and J.R. David 1997, Evolution 51: 1140-1148; Morin,
J.P., B. Moreteau, G. Petavy, and J.R. David 1999, J. Evol. Biol. 12: 329-339; Rafael, V., and D.
Vela 2000, Dros. Inf. Serv. 83: 85-88; Sene, F. de M., F.C. Val, C.R. Vilela, and M.A.Q. Rodrigues-
Pereira 1980, Pap. Avul. Dep. Zool. Sec. Agric. 33: 315-326; Sevenster, J.G., 1992, Ph.D. thesis,
Leiden. 167 pp.; Sevenster, J.G., and J.J.M. Van ALpen 1996, J. Animal Ecology 65: 308-324;
Shorrocks, B., and J.G. Sevenster 1995, Proc. Roy. Soc. Lond. B Bio. 260: 305-309; Tidon, R., D.F.
Leite, and B.F.D. Leao 2003, Biol. Conservation 112: 299-305; De Toni, D.C., and P.R.P. Hofmann
1995, Revta bras. Biol. 55: 347-350; Tsacas, L., D. Lachaise, and J.R. David 1981, In: Genetics and
Biology of Drosophila, vol 3a, (Ashburner, M., H.L. Carson and J.N. Thompson, jr., eds.), pp. 197-
259, Academic Press, New York; Val, F.C., and F. de M. Sene 1980, Pap. Avul. Dep. Zool. Sec.
Agric. 33: 293-298; Vermeij, G.J., 1996, Biol. Conservation 78: 3-9; Vilela, C.R., 1999, Dros. Inf.
Serv. 82: 37-39.
Colonization of Northeast Region of Brazil by the drosophilid flies Drosophila
malerkotliana and Zaprionus indianus, a new potential insect pest for Brazilian
fruitculture.
Santos, J.F.*; T.T. Rieger, S.R.C. Campos, A.C.C. Nascimento, P.T. Félix, S.V.O. Silva, and F.M.R. Freitas. Departamento de Genética, CCB, Universidade Federal
de Pernambuco. Av. Morais Rego, S/N. Cidade Universitária, 50732-970, Recife, PE, Brazil.
Phone/Fax: 8132718522. *Corresponding author, e-mail: [email protected]
The drosophilid fauna from Northeast region of Brazil is poorly studied. According to Val et
al. (1981) and Ehrman and Powell (1982), the main species in the region were Drosophila nebulosa,
D. willistoni, D. paulistorum, and D. tropicalis (willistoni group) and D. simulans, D. melanogaster
and D. kikkawai (melanogaster group). This list was enlarged to include the colonizing species D.
malerkotliana (Sene et al., 1980; Val and Sene, 1980). Since 1996 we have made several sampling
collections of drosophilids at different localities in the States of Pernambuco (PE), Bahia (BA), and
Paraíba (PB), in the Northeast region of Brazil. These localities encompass different degrees of
urbanization, which is high at UFPE Campus (08o 03’ 01” S, 34
o 56’ 54” W) in Recife City (PE), and
Olinda (08o 03’ 45” S, 34
o 48’ 45” W, PE), medium at Bezerros (PE, 08
o 11’ 15” S, 35
o 48’ 45” W),
Moreno (PE, 08o 06’ 24” S, 35
o 10’ 32” W), and in Santa Rita (PB, 07
o 03’ 45” S, 34
o 56’ 15” W),
and is low at Sobradinho (BA, 09o 29’ 13” S, 40
o 49’ 49” W), Vila Velha (07
o 41’ 15” S, 34
o 48’ 45”
W, Itamaracá, PE), Estação Ecológica de Tapacurá (08o 03’ 45” S, 35
o 03’ 45” W, São Lourenço da
Mata, PE), Estação Itapirema (07o 33’ 45” S, 35
o 03’ 45” W, Goiana, PE), Parque Dois Irmãos (08
o
00’ 05” S, 34o 57’ 23” W), a preserved secondary forest inside the Recife City and in the Refúgio
Ecológico Charles Darwin (07o 48’ 57” S, 34
o 41’ 52” W), which is also a secondary forest, very well
protected and not urbanized at all, which is part of the Atlantic Forest, near Igarassu (PE). While
Sobradinho is in the Sertão (semiarid interior), all the other locations are at the litoranean stripe of
Brazilian Northeast.
The diversity of species was higher at low and medium urbanization localities, as can be
drawn from Table 1. The willistoni group of species was represented only by few individuals of D.
nebulosa, which means that this group is now extremely reduced in the Northeast of Brazil both in
number of species and individuals, unravelling an extensive modification in the drosophilid fauna of
the region. For the melanogaster group the situation is also completely different from that reported in

DIS 86 (December 2003) Research Notes 93

Research Notes DIS 86 (December 2003) 94
1980 (Sene et al., 1980; Val and Sene, 1980; Val et al., 1981), represented by D. melanogaster and
D. simulans, since there is now a remarkable dominance of the colonizing species D. malerkotliana,
which could have displaced the other species from their niches, including that of the willistoni group.
The replacement of D. willistoni by D. malerkotliana was reported earlier by Morais et al. (1995) in
the Amazonian region (North Brazil). The invasion of Northeast region by D. malerkotliana is, thus,
probably the cause of the annotated drop in frequency of individuals of both the willistoni and
melanogaster group of species. Also from the melanogaster group we have registered the presence of
few individuals of D. kikkawai, exclusively in the Refúgio Ecológico Charles Darwin, a preserved
park not urbanized. An unexpected finding, however, was the significant number of individuals of D.
maculifrons (guarani group) in Parque Dois Irmãos and Refúgio Ecológico Charles Darwin, both
with low urbanization. The guarani group is generally believed to occur mainly in cold regions (Sene
et al., 1980), being never registered before in Northeast region of Brazil, characterized by elevated
temperatures during all the year and a low and irregular pluviometry.
Moreover, these were not the only changes in the drosophilid fauna of this region. Our
register of collections shown in Table 1 also documents the invasion of Northeast of Brazil by
another drosophilid, Zaprionus indianus. This fly was first reported in Brazil by Vilela (1999), who
found it colonizing fermenting fruits of persimmon trees (Diospyros kaki) in São Paulo State.
Unexpectedly, this fly adopted a pest behaviour in Brazil, whose larvae colonized orange, peach and
the Ficus carica fruits, causing a severe lost of exportation profits (Vilela et al., 1999; Vilela et al.,
2001). This fly was also found in the Amazonian region (Tidon et al., 2003), where it has dispersed
rapidly, resulting in a marked alteration in drosophilid fauna. Although not found in our collecting
from 1996 to 1999, Z. indianus is now widespread in the Northeast region, suggesting a very new
colonization. In fact, in March 2000 this species was firstly found in the Basin of São Francisco River
(Sobradinho, BA), colonizing fruits of Spondias tuberosa (umbuzeiro), a native non-cultivated tree.
In following collections in this same year we have found it in the litoranean stripe of Pernambuco,
colonizing fruits of Jambosa vulgaris (jambo) in the city of Recife (PE), Spondias purpurea
(siriguela) in Bezerros (PE), and Genipa americana (genipapo) in Moreno (PE) and Santa Rita (PB).
The populations grew rapidly, and by the end of 2000, Z. indianus already represented 12.4% of
individuals frequency, being the third main drosophilid species (Table 1). It was suggested by Vilela
(1999) and Vilela et al. (2001) that Z. indianus could have reached the São Paulo State through
infested fruits imported from Europe, or, alternatively, this species can have escaped from laboratory
cultures in USA and widespread to Central America and then throughout Amazonia to Brazil in
South America. Whatever the source, from Amazonia or São Paulo, it is clear from our data that Z.
indianus has first colonized the interior of Bahia State and then has reached the litoranean stripe of
Northeast of Brazil. As in the case of D. malerkotliana, Z. indianus also seems to be a powerful
species which can displace other drosophilid species. The main concern about this fly is its behaviour
as a potential fruitculture pest in Brazil, undocumented earlier in other countries. Vilela (1999) and
Vilela et al. (2001) reasoned that the species seems to be restricted to cultivated fruits, which could
facilitate the biological control. However, as we demonstrate here, Z. indianus is now, at least in
Northeast region of Brazil, very well adapted to several native resources, which can make the species
more difficult to control and can become a pest for the fruitculture developed at the Basin of São
Francisco River.
Acknowledgments: The authors thanks the administration of the Parque Dois Irmãos and the
Refúgio Ecológico Charles Darwin for special permission to enter their restricted areas to collect
research material.
References: Ehrman, L., and J.R. Powell 1982, In: The Genetics and Biology of Drosophila,
vol. 3b. (Ashburner, M., H.L. Carson, and J.N. Thompson, jr., eds.). pp. 345–384. Academic Press,
New York; Morais, P.B., M.B. Martins, L.B. Klaczko, L.C. Mendonça-Hagler, and A.N. Hagler

DIS 86 (December 2003) Research Notes 95
1995, App. Envir. Microb. 61: 4251-4252; Sene F.M., F.C. Val, C.R. Vilela, and M.A.Q.R. Pereira
1980, Papéis Avulsos de Zoologia 33: 315–326; Tidon, R., D.F. Leite, and B.D.F. Leão 2003,
Impact of the colonisation of Zaprionus (Diptera, Drosophilidae) in different ecosystems of the
Neotropical Region: 2 years after the invasion, Biol. Conserv., in press; Val, F.C., and F.M. Sene
1980, Papéis Avulsos de Zoologia 33: 293-298; Val, F.C., C.R. Vilela, and M.D. Marques 1981, In:
The Genetics and Biology of Drosophila, vol. 3a. (Ashburner, M., H.L. Carson, and J.N. Thompson,
jr., eds.). pp. 123-168. Academic Press, New York; Vilela, C.R., 1999, Dros. Inf. Serv. 82: 37-39;
Vilela, C.R., E.P. Teixeira, and C.P. Stein 1999, Inform. Soc. Entomol. Bras. 24(2): 2; Vilela, C.R.,
R.A. Zucchi, and F. Cantor 2001, In: Histórico e impacto das pragas introduzidas no Brasil, Holos
Ed., Ribeirão Preto, 48-51.
Morphometric changes of the Drosophila saltans salivary glands prior to and during
apoptosis.
Dias, Márcio Vinicius Bertacine, Cássia Cardoso de Oliveira, and Hermione E.M.C. Bicudo. Universidade Estadual Paulista-UNESP, Instituto de Biociências,
Letras e Ciências Exatas-IBILCE de São José do Rio Preto, SP, Brazil
Drosophila salivary glands develop from two ventral ectodermal plates with about 100 cells
each, in the region of the presumptive posterior head. They differentiate without further cell division
and increase in size by increasing the volume of individual cells (Andrew et al., 2000). Drosophila
salivary glands are eliminated in development, in general during the pupal phase. This elimination,
which is named apoptosis or programmed cell death, is preceded by morphological and physiological
modifications resulting from the activation of an intrinsic, genetically controlled “suicide” program
Figure 1. A, B. Boxplots for area (A) and perimeter (B) values of Drosophila saltans salivary glands
during development. 1= early third instar larvae; 2 = late third instar larvae; 3 = puparium; 4 =
prepupae; 5 = pupae.

Research Notes DIS 86 (December 2003) 96
(Steller, 1995). There is already fairly good knowledge about the regulatory pathways controlling
salivary gland formation (Andrew et al., 2000). Also several steps involving specific gene activation
for apoptosis are already known (White et al., 1994; Kumar and Doumanis, 2000; Farkas and
Mechler, 2000).
In the present study, variations in the area and perimeter of salivary glands were analyzed in
Drosophila saltans development, from early third instar larvae to the pupal phase preceding
disintegration of the glands due to apoptosis. This study was carried out in parallel with the study of
modifications involving chromosomes and nucleoli in the salivary gland cells (data being published
elsewhere). Area and perimeter measurements were taken in early and late third instar larvae,
puparium (everted spiracles), prepupae (white pupae) and pupae (yellow pupae, before the eyes turn
red). They were aged about 248, 250, 251, 278 and 305 hours from the egg, respectively. The strain
used was the 180.40, from San Jose, Costa Rica, maintained in the stocks of the Biology Department,
IBILCE-UNESP. The salivary glands were dissected in Demerec solution (Demerec and Kaufman,
1945), carefully cleaned of the fat tissue present around them, and stained with lacto-acetic orcein.
The slides were made permanent with crystal varnish. Measurements of area and perimeter were
taken using the computer program Global Lab Image SP0550 (Data Translation, 1995; Marlboro,
MA, U.S.A.). From thirty to
thirty-three complete salivary
glands from each stage were
measured.
Data for area and
perimeter are shown in Table 1
and Figure 1. The Student’s t test
results for comparison of area and
perimeter values of salivary
glands from different stages are
set out in Table 2. The area and
perimeter of salivary glands from
the late third instar larvae were
significantly greater than those in
the early third instar and
significantly greater than the
subsequent developmental stages
(puparium, prepupae, and pupae).
The area and perimeter of the
salivary glands from the puparium
stage were also significantly
greater than those from pupae.
The perimeter in pupae was also
significantly smaller than in
prepupae. Although not significant statistically, pupae also showed a smaller mean area than
prepupae. In pupae older than those examined in the present study, the salivary glands are smaller
and take the appearance of a rounded body. At this time they are very soft and disintegrate when
touched with the dissection needles.
The fact that the salivary glands attain their greatest size in the late third instar lavae is due to
a feature that has been understood for a long time. In that stage, the giant chromosomes from the
salivary glands cells exhibit the highest degree of polyteny (Berendes, 1965). This means that there
are multiple rounds of DNA replication without cell division. In Drosophila, at this developmental
Table 1. Statistics for area and perimeter values of D. saltans salivary glands, in five developmental stages. N= number of salivary glands examined; eL3 = early third instar larvae, lL3 = late third instar larvae, pup = puparium, pp = prepupae, p = pupae.
Area in µ2 Perimeter in µ
stage Nº Mean St.Dev. Mean St.Dev. eL3 30 6034 1645.20 602 119 lL3 32 10348 5171.79 728 155.59 pup 31 7462 2693.48 565 97.59 pp 33 7003 3023.88 506 100.62 p 30 5815 2138.74 474 102.09
Table 2. Student’s t test for comparison of the area values (above the diagonal) and perimeter values (below the diagonal) of D. saltans salivary glands, in different developmental stages. eL3 = early third instar larvae, lL3 = late third instar larvae, pup = puparium, pp = prepupae, p = pupae. Asteriscs indicate significant differences: * = p < 0.05; ** = < 0.001.
eL3 lL3 pup pp p eL3 xxxxxxxxx ** l L3 xxxxxxxxx * * ** pup ** xxxxxxxxx * pp ** * xxxxxxxxx p ** ** xxxxxxxx

DIS 86 (December 2003) Research Notes 97
time, about 1024 strands are present in the salivary gland polytene chromosomes. In consequence
nucleus and cell size increase. The high degree of polyteny is related to the high degree of synthesis
that characterizes the salivary gland cells in this stage. In addition, the nucleolar size and the number
and size of puffs (chromosome regions enlarged due to the unraveling of the chromosome threads for
RNA synthesis) are the greatest and the cytoplasm shows a high amount of synthesized material.
After this stage, the involvement of the salivary glands in the fly development apparently ceases. The
significant decrease of size, here described, occurs along with changes that denote a decrease in
nuclear activity. From the late third instar larve to the time of the gland disappearance, occurring later
in the pupal stage, the polytene chromosomes and the nucleolus exhibit morphological changes that
culminate with the disintegration of both (Oliveira and Bicudo, unpublished data). Since the size
increase of the salivary glands is due to an increase in the volume of individual cells, the decrease is
also due to a reduction in the volume of the same cells, in consequence of the mentioned changes.
Besides, in the process of apoptosis, cytoplasmic components are released into the lumen of the
glands, also contributing to the size decrease. The reduction of salivary gland size progresses till the
occurrence of histolysis. As shown by the present data, in the last phase in which the salivary glands
could be manipulated for measurement, their mean area was about half of that found in the late third
instar larvae.
References: Andrew, D.J., K.D Henderson, and P. Seshaiah 2000, Mech. Dev. 92: 5-17;
Berendes, H.D., 1965, Chromosoma 17: 35-77; Demerec, M., and B.P. Kaufmann 1945, Drosophila
Guide, The Lord Baltimore Press, Baltimore, Maryland; Farkas, R., and B.M. Mecheler 2000, Cell
Death Differ.; Kumar, S., and J. Doumanis 2000, Cell Death Differ. 7: 1039-1044; Steller, H., 1995,
Science 267: 1445-1449; White, K., M.E. Grether, J.M. Abrams, L.Young, K. Farrell, and H. Steller
1994, Science 264: 677-683.
Novel isoforms of Drosophila annexins produced by alternative splicing.1
Stoltzfus, Jon R., and Michael S. Grotewiel.* Department of Zoology, the
Neuroscience Program and the Genetics Graduate Program, Michigan State
University, East Lansing, MI; *Address for Correspondence: Michael S. Grotewiel,
Michigan State University. S-306 Plant Biology Building, 178 Wilson Rd., East Lansing, MI 48824-
1312; Phone, (517) 353-5554; Fax, (517) 432-7120; email, [email protected]
1Nucleotide sequence data presented in this paper have been deposited in GenBank under accession
numbers AY007377 (AnxB9a) and AF261718 (AnxB9b) or can be found under GadFly gene number
CG9968 (AnxB11).
Keywords: annexin B9, annexin B11, RT-PCR, cDNA, Drosophila melanogaster
Abstract: We report the complete sequence analysis of the AnxB9 gene and a novel, related
gene, annexin B11 (AnxB11), from Drosophila. Analysis of AnxB9 cDNAs revealed two closely
related isoforms expressed from this gene that arise from alternative splicing. We identified the
complete open reading frame for the previously reported transcript, AnxB9a, in addition to a novel
isoform, AnxB9b. The novel AnxB11 gene also encodes two annexin isoforms, AnxB11-short and
AnxB11-long, that arise from alternative exon usage. All four annexin isoforms described are
expressed at all Drosophila life stages, suggesting broad cellular roles. Our analyses also suggest a

Research Notes DIS 86 (December 2003) 98
dissociation between conservation in the functional organization of Drosophila annexin genes and
conservation of the amino acid sequence of their proteins.
The annexins are a large family of proteins found in diverse eukaryotes including fungi,
plants, Caenorhabditis elegans, Drosophila, fish, birds, and mammals, but not yeast or prokaryotes
(Benz and Hofmann, 1997). These proteins typically contain four repeated domains (Sudhof et al.,
1988) and bind phospholipids in a calcium-dependent manner (Sudhof et al., 1984). Many aspects of
annexin structure and function have been intensively studied including their interactions with lipids
and membranes, binding to other proteins, and ion channel activity (Benz and Hofmann, 1997).
Possible cellular roles as regulators of membrane fusion or cell surface receptors have been
suggested. However, no clear biological function has been shown for any member of the annexin
family (Benz and Hofmann, 1997).
Two annexins from Drosophila were previously identified using antibodies directed against a
consensus annexin repeat found in mammalian annexins (Gerke, 1989). These antibodies recognized
30 and 34 kD Drosophila proteins that interacted with phospholipids in a calcium-dependent manner,
suggesting that these proteins were annexins. cDNAs for two annexins from Drosophila were cloned
using a probe derived from conserved regions of vertebrate annexins (Johnston et al., 1990). These
annexins were designated annexin IX and annexin X (hereafter called AnxB9 and AnxB10,
respectively, in accord with the revised nomenclature for the annexin family (Morgan et al., 1999)).
Sequence analyses and in situ hybridizations to chromosomes showed that these two annexins are
encoded by two distinct genes. The reported AnxB10 cDNA contained the complete open reading
frame (ORF). However, the published AnxB9 cDNA appeared to be truncated, resulting in the
predicted ANXB9 protein having only three of the four annexin repeat domains found in other
annexins (Johnston et al., 1990).
We identified a cDNA clone (V1.39) encoding a novel isoform of AnxB9 as a false positive in
a yeast two-hybrid screen. Pair-wise alignments (Smith et al., 1996) of the nucleotide sequence of
clone V1.39 with GenBank accession number M34068.1, the previously reported cDNA for AnxB9
(Johnston et al., 1990), revealed that the first 840 residues of V1.39 have 99.8% identity with
M34068.1. These two sequences diverge at the 3' end, suggesting that there might be multiple AnxB9
isoforms.
A Blast search (Altschul et al., 1997) of the expressed sequence tag (EST) database from the
Berkeley Drosophila Genome Project (BDGP, http://www.fruitfly.org/) revealed that V1.39 has
greater than 97% nucleotide identity with the 21 ESTs in Clot number 2657:3 (BDGP, unpublished).
Twenty of these are 5' ESTs and only one, GH08594.3, is a 3' EST. Clone LD09947, the EST that
extended the furthest in the 5' direction, was obtained from BDGP via Research Genetics (Huntsville,
AL) and sequenced from the 5' and 3' ends. The 5' end of LD09947 is 97% identical to M34068.1 in
regions of overlap but contains additional 5' bases encompassing the 5' end of the ORF, confirming
that the original AnxB9 cDNA sequence was truncated (Johnston et al., 1990). The 3' end of
LD09947 was 98% identical to V1.39 and GH08594.3. However, all three of these clones diverge
from the previously published AnxB9 cDNA (M34068.1; (Johnston et al., 1990)) at the same
nucleotide, indicating that they represent a novel isoform of AnxB9.
Together, these analyses show that two distinct transcripts are produced from the AnxB9
locus. We designate one isoform as AnxB9a (GenBank accession number AY007377; represented by
the previously published truncated sequence, M34068.1 (Johnston et al., 1990), and several BDGP
ESTs that complete the ORF) (Figure 1A) and the novel isoform as AnxB9b (GenBank accession
number AF261718; represented by clones LD09947, GH08594.3, and V1.39) (Figure 1B). Based on
these analyses we predicted that the AnxB9a and AnxB9b transcripts are identical except for
alternatively spliced fifth exons.

DIS 86 (December 2003) Research Notes 99
Figure 1. AnxB9 cDNAs and proteins. (A) Nucleotide sequence of AnxB9a with translation
(GenBank accession number AY007377). Arrowheads indicate exon junctions. (B) Nucleotide
sequence of the fifth exon from AnxB9b with translation (GenBank accession number AF261718).
The first four exons of AnxB9a are identical to those from AnxB9b. The nucleotide sequence
numbering begins with base 1003 (from AnxB9a) where AnxB9b diverges. The annexin repeats,
identified using Pfam (Bateman et al., 1999) via the Institute for Chemical Research, Kyoto
University, Japan (http://www.genome.ad.jp/), are shown in bold.

Research Notes DIS 86 (December 2003) 100
Figure 2. AnxB11 cDNAs and
proteins. Nucleotide sequence of
AnxB11-long with translation
(GadFly gene CG9968, GenBank
accession AJ276963). Arrow-
heads indicate exon junctions.
ANXB11-short and ANXB11-long
are identical except for the
underlined sequence which is
specific to the long isoform. The
annexin repeats, identified using
Pfam (Bateman et al., 1999) via the
Institute for Chemical Research,
Kyoto University, Japan
(http://www.genome.ad.jp/), are
shown in bold.

DIS 86 (December 2003) Research Notes 101
The structure of the AnxB9 locus was investigated by sequence analysis. Genomic sequence
(GenBank accession number AC019736; Adams and Venter, unpublished) for the AnxB9 locus was
obtained by searching the BDGP database with the AnxB9b and AnxB9a sequences. In each case the
analysis revealed five blocks of identity representing five exons from which each transcript is
derived. The first four exons are common to both transcripts, whereas the fifth exon is alternatively
spliced (Figure 3A). Each intron begins with GT and ends with AG, following the GT-AG rule
(Breathnach et al., 1978; Stephens and Schneider, 1992).
Analyses of all ESTs from AnxB9 cDNA clones (BDGP EST clot #2657:3) support this
splicing pattern. Nineteen ESTs are consistent with splice sites one and two, three ESTs are
consistent with splice three, and two ESTs are consistent with splice site 4b. Two ESTs, LD03123
and GH13750, are derived from alternative splicing within the 5' untranslated region such that the 3'
end of the first exon is extended by 25 bases (5'-GTACGTTGAAAATCGAATATCATTG-3')
relative to the sequence shown in figure 1A. The nucleotides in this extended exon are identical to
those in the genomic sequence and are followed by GT residues, conforming to the GT-AG rule
(Breathnach et al., 1978; Stephens and Schneider, 1992). Thus, all available sequence information is
fully consistent with the splicing patterns shown in Figure 3A.
While all available 5' AnxB9 ESTs share the same 5' residues, these data do not exclude the
possibility that AnxB9a and AnxB9b are derived from different first exons. We used reverse
transcription polymerase chain reaction (RT-PCR) analysis to verify the presence of AnxB9a and
AnxB9b transcripts containing the common first exon and the alternatively spliced fifth exons. First-
strand cDNAs were generated via reverse-transcription using total RNA isolated with Trizol (Life
Technologies, Inc., Rockville, MD) as template. cDNAs were amplified by PCR using primer B9.1F
(5'-CGCTTGCAGTTCGCATCG-3') which anneals to the first exon in combination with primers
B9a.R (5'-TGAACAGTGGGGTATTGC-3') and B9b.R (B9b.R, 5'-ACCGCGATTTTACAGTGC-3'),
which are specific for exon 5a or 5b, respectively. Primer pairs B9.1F/B9a.R and B9.1F/B9b.R
amplified the predicted 1076 and 1161 base pair products corresponding to portions of AnxB9a and
AnxB9b, respectively (data not shown). Additionally, alternative splicing of the first exon was
confirmed by RT-PCR studies using a forward primer specific for the extended region of exon one
and reverse primers specific for either the AnxB9a or AnxB9b isoform (data not shown). These data,
in conjunction with the available 5' EST sequence data presented above, show that the AnxB9a and
AnxB9b transcripts are derived from the same first exon and confirm the pattern of exon utilization
depicted in Figure 3A.
Blast searches of the BDGP sequence database identified a novel annexin gene in Drosophila,
AnxB11 (Genome annotation database of Drosophila (GadFly) gene CG9968 (Adams et al., 2000)).
This gene is predicted by GadFly to have two transcripts resulting from alternative splicing. One
transcript is derived from six exons, whereas the other is derived from the same six plus an additional
exon in the second position. We designate these two transcripts AnxB11-short and AnxB11-long,
respectively. The additional exon within AnxB11-long is composed of 567 nucleotides and encodes
189 amino acids (Figure 2). Alignment of the nucleotide sequences of the two AnxB11 cDNAs to the
AnxB11 genomic region (BACR48A09, GenBank accession AC016020) revealed six blocks of
homology for AnxB11-short and seven blocks for AnxB11-long (Figure 3B), consistent with the
prediction of exon usage from GadFly (Adams et al., 2000). Additionally, all of the introns follow
the GT-AG rule (Breathnach et al., 1978; Stephens and Schneider, 1992).
Eight ESTs from the BDGP database were found that corresponded to the AnxB11 locus. One
EST was consistent with splice site one in AnxB11-long and three were consistent with splice site one
in AnxB11-short. Additionally, four were consistent with splice site three, two with sites four and
five, and three with site six in both isoforms (numbering relative to splice sites in AnxB11-long)
(Figure 3B). RT-PCR analyses determined that both AnxB11 isoforms are expressed (Figure 4, see

Research Notes DIS 86 (December 2003) 102
below). Together, these data confirm that the AnxB11 gene produces two alternatively spliced
transcripts.
Expression of AnxB9a and AnxB9b was analyzed using RT-PCR. First-strand cDNAs were
generated via reverse-transcription using as template total RNA isolated from embryos, each larval
instar, and adult body parts. A primer that anneals to the common third exon (B9.2F, 5'-
ACCAGTGGCCACTTCAAG-3') was used with primers B9a.R or B9b.R to specifically amplify
AnxB9a and AnxB9b cDNAs, respectively (Figure 3A). The identities of amplified fragments were
verified by direct sequencing using a nested primer (B9.3F, 5'-TCAGCCGGTCGGAGATCG-3') that
anneals to the common fourth exon (Figure 3A). Expression of both AnxB9a and AnxB9b was found
in embryos, all larval instars, and both heads and bodies of adult flies (Figure 4A and 4B). These
data directly show that the two distinct transcripts of AnxB9, encoding different isoforms of the
ANXB9 protein, are present at all life stages in Drosophila, consistent with previous results showing
two transcripts on northern blots that hybridize with an AnxB9 probe (Johnston et al., 1990).
Figure 3. Genomic structures of AnxB9 and AnxB11. Exons are shown as boxes with the protein
coding regions shaded. The positions of annexin repeat domains (ARD) 1-4 relative to exons are
indicated by upward arrows. (A) Structure of AnxB9. Nucleotide sequences from AnxB9 cDNAs and
sequences from the BDGP database were used to determine the genomic structure of the AnxB9
locus. The locations of primers (B9.1F, B9.2F, B9a.R, B9b.R, B9.3F) used in RT-PCR and
sequencing are indicated. (B) Structure of AnxB11. Nucleotide sequences from AnxB11 cDNAs
(GadFly gene CG9968, GenBank accession AJ276963) and genomic sequences (BDGP
BACR48A09, GenBank accession AC016020) were used to determine the genomic structure of the
AnxB11 locus. The locations of primers (B11.1F, B11.2F, B11.2R) used in RT-PCR are indicated.

DIS 86 (December 2003) Research Notes 103
Expression of AnxB11-short and AnxB11-long was also analyzed by RT-PCR. Amplification
with a common reverse primer (B11.2R, 5- ATCTCCATGTTGGACAGC -3') in combination with a
common forward primer (B11.1F, 5'-CCCTCAAAATGTATCCCTTCGG-3') generated a strong band
corresponding to AnxB11-short (Figure 4C) and a much weaker band that was consistent with
AnxB11-long expression (data not shown). Expression of AnxB11-long was confirmed by RT-PCR
using an AnxB11-long specific forward primer (B11.2F, 5'-AAACTCGCCATACCCACC-3') in
combination with the same common reverse primer (B11.2R) (Figure 4D). These studies revealed
that AnxB11-short and AnxB11-long are both expressed in all life stages analyzed in addition to heads
and bodies of adults. Together, our results on expression of the AnxB9 and AnxB11 genes suggest
that these two genes might have basic cellular roles at all life stages.
Our studies, in combination with previous experiments (Johnston et al., 1990;
Benevolenskaya et al., 1995), identify three annexin genes in Drosophila: AnxB9, AnxB10, and
AnxB11. Collectively, these three genes encode five protein isoforms (Johnston et al., 1990;
Benevolenskaya et al., 1995) (Figures 1 and 2). All five isoforms contain the characteristic four
annexin repeat domains (Figures 1 and 2) (Sudhof et al., 1988) and are 25-50 percent identical to
other known annexins (data not shown).
The predicted ANXB9a and ANXB9b proteins are both 324 amino acids in length and differ
only in the carboxy-terminal 17 amino acids which are encoded by alternatively spliced fifth exons.
These 17 carboxy-terminal residue are identical at six positions and are similar at 11 positions (Figure
1). ANXB11-short and ANXB11-long are 322 and 511 amino acids in length, respectively. They are
identical except that ANXB11-long has an additional 189 amino acid residues derived from AnxB11-
long specific exon two that are inserted after the fourth amino acid residue (Figure 2). This
alternative splicing makes ANXB11-long similar in overall structure to vertebrate annexins VII and
XI which have long amino termini followed by the four annexin repeats (Smith and Moss, 1994). In
contrast, ANXB11-short (Figure 2) along with ANXB9a, ANXB9b (Figure 1) and ANXB10
(Benevolenskaya et al., 1995) are similar to all other annexins containing short amino termini
preceding the four repeat domains (Smith and Moss, 1994). Blast searches of protein and nucleotide
databases via NCBI and BDGP revealed that this additional region of ANXB11-long does not have
significant homology to any other known protein, leaving its functional significance obscure.
However, its presence suggests that ANXB11-long might have a unique function among annexins.
Comparisons of the full length amino acid sequences revealed that the ANXB9 proteins and
ANXB11-short are somewhat more related to each other than they are to ANXB10 (54-55% amino
acid identity versus 44-47%). Interestingly, AnxB10 is expressed in embryos and in adults, but not at
other stages (Johnston et al., 1990), whereas AnxB9 and AnxB11 are expressed at all life stages in
Drosophila (Figure 4). The conservation in primary amino acid sequence between the ANXB9
isoforms and ANXB11-short, in combination with parallels in their temporal patterns of expression
(Figure 4), is consistent with a conserved function for this group of proteins.
Interestingly, though, the functional organizations of the AnxB9 and AnxB10 genes are
strikingly similar to each other and markedly different from that of AnxB11. The two most prominent
similarities between AnxB9 and AnxB10 is that the first three annexin repeat domains in both genes
are encoded by the second protein-coding exon and the fourth annexin repeat is encoded by the third
and fourth protein-coding exons (Benevolenskaya et al., 1995) (Figures 1 and 3A). In contrast, the
first annexin repeat in AnxB11-short is encoded by the second exon, the second repeat by exons two
and three, the third repeat by exons three and four, and the fourth repeat by exons four, five and six
(Figures 2 and 3B). Thus, the conservation in primary amino acid structure between the ANXB9
isoforms and ANXB11-short does not correlate with conservation of functional organization of their
genomic loci.

Research Notes DIS 86 (December 2003) 104
Figure 4. Expression of AnxB9 and AnxB11 isoforms. Gels showing RT-PCR products amplified
with 30-35 cycles from RNA isolated from embryos (E), first instar larvae (L1), second instar larvae
(L2), third instar larvae (L3), adult heads (H), adult bodies (B) and whole adults (W). (A)
Amplification using primers B9.2F and B9a.R, specific for AnxB9a. (B) Amplification using primers
B9.2F and B9b.R, specific for AnxB9b. (C) Amplification using primers B11.1F and B11.2R which
amplify both AnxB11-short and AnxB11-long (long not shown). (D) Amplification using primers
B11.2F and B11.2R which specifically amplifies AnxB11-long. (E) RT-PCR analysis of expression
from the ribosomal protein gene rp49 (O'Connell and Rosbash, 1984) was the internal control. No
DNA fragments were amplified in reactions with RNase added prior to reverse transcription (data not
shown). Amplification products were separated by agarose gel electrophoresis, stained with ethidium
bromide, and visualized with ultraviolet light. Molecular weight markers (in base pairs) are
indicated.
In accord with a model of annexin gene evolution involving intron loss (Smith and Moss,
1994; Benevolenskaya et al., 1995; Morgan and Fernandez, 1997), we propose that a single ancestral
gene similar in organization to the AnxB11-short transcription unit gave rise to a common precursor
of AnxB9 and AnxB10 via gene duplication and subsequent elimination of the second, third and fourth
introns. This common precursor in turn would have undergone gene duplication to produce AnxB9
and AnxB10, whereas the presumptive ancestral gene would have evolved into AnxB11. Thus, our
analyses suggest that the conservation in functional organization of annexin genes and the
conservation of the amino acid sequences of their gene products are influenced by distinct
evolutionary forces.
Acknowledgments: This work was supported in part by grants from Michigan State
University and the Whitehall Foundation. We thank Kim Trouten for technical assistance and Sarah
Elsea for helpful suggestions and careful reading of the manuscript.

DIS 86 (December 2003) Research Notes 105
References: Adams, M.D., S.E. Celniker, R.A. Holt, C.A. Evans, J.D. Gocayne, P.G.
Amanatides, S.E. Scherer, P.W. Li, R.A. Hoskins, R.F. Galle, et al. 2000, Science. 287: 2185-2195;
Altschul, S.F., T.L. Madden, A.A. Schaffer, J. Zhang, Z. Zhang, W. Miller, and D.J. Lipman 1997,
Nucleic Acids Res. 25: 3389-3402; Bateman, A., E. Birney, R. Durbin, S.R. Eddy, R.D. Finn, and
E.L. Sonnhammer 1999, Nucleic Acids Res. 27: 260-262; Benevolenskaya, E.V., D.I. Nurminsky,
and V.A. Gvozdev 1995, DNA Cell Biol. 14: 349-357; Benz, J., and A. Hofmann 1997, Biol.
Chem. 378: 177-183; Breathnach, R., C. Benoist, K. O'Hare, F. Gannon, and P. Chambon 1978,
Proc. Natl. Acad. Sci. U S A. 75: 4853-4857; Gerke, V., 1989, FEBS Lett. 258: 259-262; Johnston,
P.A., M.S. Perin, G.A. Reynolds, S.A. Wasserman, and T.C. Sudhof 1990, J. Biol. Chem. 265:
11382-11388; Morgan, R.O., and M.P. Fernandez, 1997, Cell Mol. Life Sci. 53: 508-515; Morgan,
R.O., N.A. Jenkins, D.J. Gilbert, N.G. Copeland, B.R. Balsara, J.R. Testa, and M.P. Fernandez 1999,
Genomics 60: 40-49; O'Connell, P.O., and M. Rosbash 1984, Nucleic Acids Res. 12: 5495-4513;
Smith, P.D., and S.E. Moss 1994, Trends Genet. 10: 241-246; Smith, R.F., B.A. Wiese, M.K.
Wojzynski, D.B. Davison, and K.C. Worley 1996, Genome Res. 6: 454-462; Stephens, R.M., and
T.D. Schneider 1992, J. Mol. Biol. 228: 1124-1136; Sudhof, T.C., M. Ebbecke, J.H. Walker, U.
Fritsche, and C. Boustead 1984, Biochemistry 23: 1103-1109; Sudhof, T.C., C.A. Slaughter, L.
Leznicki, P. Barjon, and G.A. Reynolds 1988, Proc. Natl. Acad. Sci. U S A. 85: 664-668.
The influence of the p53 mutation on the tumor frequency in wts/+ heterozygotes.
Sidorov, R.A.1, K.I. Kirsanov
2, I.D. Alexandrov
3, M.V. Alexandrova
3, E.M.
Khovanova4.
1 Blokhin Cancer Research Center, Russian Academy of Medical
Sciences, Moscow, Russia; 2 Lomonosov Moscow State University, Moscow,
Russia; 3 Joint Institute for Nuclear Research, Dubna, Moscow Region, Russia;
4 Koltzov Institute of Developmental Biology, Russian Academy of Sciences, Moscow, Russia.
Recently a homologue of mammalian p53, the key gene in the tumor suppression and
apoptosis control, was identified in Drosophila (Brodsky et al., 2000; Ollmann, M. et al., 2000). The
influence of Drosophila p53 mutations on the radiation-induced apoptosis had been thoroughly
characterized (Brodsky et al., 2000; Lee et al., 2003). In the present article we describe the p53
dominant negative mutation effects on the frequency, both spontaneous and mutagen-induced, of
somatic recombinant tumor clone formation in heterozygotes for the tumor suppressor gene warts
(wts).
Three crossings were performed:
(I): ♀ y w; wtsX1
/TM6B, Hu Tb × ♂ w sn3 to obtain control wts/+ heterozygotes without the p53
mutation; (II): ♀ y w; P{w+ GMR-p53
259H.GUS} wts
X1/TM6B, Hu Tb × ♂ w sn
3 to obtain
GMR-p53259H.GUS
wtsX1
/ + + heterozygotes carrying a dominant negative p53 mutation in a
transgenic construct; (III): ♀ y w; P{w+ GMR-p53
259H.GUS} wts
X1/TM6B, Hu Tb ×
♂ w; act-GAL4/TM6B, Hu Tb to produce + GMR-p53259H.GUS
wtsX1
/act-GAL4 + + heterozygotes
with the p53 mutation under Glass Multiple Reporter (GMR) promoter activated by GAL4. For the
characteristics of the strains see (Brodsky et al., 2000; Xu et al., 1995)
The 1st instar F1 larvae from the crosses were treated either with distilled water (control
group) or with a mutagenic substance, oxoplatin (2 mg/ml aqueous solution). In the F1, wtsX1
/+
(crossing I), P{w+ p53
259H.GUS } wts
X1/ + + (crossing II) and + P{w
+ p53
259H.GUS } wts
X1/ act-GAL4 + +
(crossing III) flies selected by the absence of Hu and Tb markers were examined for wts tumorous

Research Notes DIS 86 (December 2003) 106
clones. Clone frequency (p) was calculated as (Number_of_clones / Number_of_flies) × 100%. The
significance of differences between the series was calculated in Student’s t-test with Fisher’s
correction parcsin2=ϕ .
Table 1. The influence of GMR-p53
259H.GUS on the tumor clone frequency in wts/+ heterozygotes.
Flies genotype Substance, concentration
flies wts clones Pwts, %
Oxoplatin, 2 mg/ml 581 144 24.78! wts
X1/+
Distillated water 1383 11 0.80 Oxoplatin, 2 mg/ml 1064 826 77.63! **
GMR-p53259H.GUS
wtsX1
/ + + Distillated water 686 16 2.33*
Oxoplatin, 2 mg/ml 228 220 96.49! ** + GMR-p53259H.GUS
wtsX1
/act-GAL4 + + Distillated water 765 66 8.63** ! – the wts tumor frequency is significantly higher than the control one, P < 0.001; ** – the wts tumor frequency is significantly higher than the frequency in the corresponding variant with less active or absent p53 mutation; P < 0.001; * - the same, P<0.01.
The results are summarized in the Table 1. We have made the following conclusions.
1). The p53259H.GUS
dominant mutation increases both spontaneous and induced tumor
frequency in wts/+ heterozygotes (3.13 times for the induced mosaicism and 2.91 times for the
spontaneous mosaicism). Probably, the p53 dominant mutation leads to the increase in the number of
surviving cells with DNA breaks that are the substrate for the somatic recombination producing
tumorous clones homozygous for wts in wts/+ individuals.
2). The P{w+ GMR-p53
259H.GUS} construct is sufficient to increase the frequency of tumor
clones even without GAL4. It is possible that the GMR promoter provides some minimum rate of the
mutant p53 transcription in absence of GAL4.
3). The activation of p53259H.GUS
transcription in GAL4 presence results in the increase in the
frequency of wts clones. This may suggest that in absence of GAL4 in GMR-p53259H.GUS
wtsX1
/ + +
flies the production of the mutant form of the p53 protein is insufficient to eliminate the wild type
product completely.
4). The relative tumor frequency increase observed upon GMR-p53259H.GUS
transcription
activation by GAL4 is higher in case of the spontaneous mosaicism (3.70 times) than in case of the
induced mosaicism (1.24 times).
Acknowledgments: We are grateful to Dr. M. Brodsky and Dr. T. Xu for the wtsX1
and
p53259H.GUS
Drosophila mutants. This work was sponsored in part by the International Science and
Technology Center grant # 832 and Russian Foundation for Basic Research grant # 01-04-49285.
References: Brodsky, M.H., W. Nordstrom, G. Tsang, E. Kwan, G.M. Rubin, J.M. Abrams
2000, Cell. 101(1): 103-113; Xu, T., W. Wang, S. Zhang, R.A. Stewart, and W. Yu 1995,
Development 121: 1053-1063; Ollmann, M., L.M. Young, C.J. Di Como, F. Karim, M. Belvin, S.
Robertson, K. Whittaker, M. Demsky, W.W. Fisher, A. Buchman, G. Duyk, L. Friedman, C. Prives,
and C. Kopczynski 2000, Cell. 101: 91-101; Lee, J.H., E. Lee, J. Park, E. Kim, J. Kim, and J. Chung
2003, FEBS Letters 550(1-3): 5-10.
Visit the Drosophila Information Service Web site
www.ou.edu/journals/dis

DIS 86 (December 2003) Research Notes 107
Overexpression of phosphatidylinositol 3-OH kinase (PI3K) in dopaminergic neurons
dramatically reduces life span and climbing ability in Drosophila melanogaster.
Saunders, Lisa D., Annika F.M. Haywood, and Brian E. Staveley. Department of
Biology, Memorial University of Newfoundland, St. John's, Newfoundland &
Labrador, Canada, A1B 3X9; telephone (709) 737-4317; telefax (709) 737-3018; [email protected];
Corresponding Author: Dr. Brian E. Staveley, Department of Biology, Science Building, Rm. SN-
3017, Memorial University of Newfoundland, St. John's, Newfoundland & Labrador, Canada, A1B
3X9; telephone, (709) 737-4317; telefax number, (709) 737-3018.
Abstract
Parkinson's disease (PD) is a prevalent neurodegenerative disease marked by the selective loss
of dopaminergic neurons that is accompanied by resting tremors and other symptoms. The study of
organismal models of PD, including the well-studied α-synucleinopathic model, in Drosophila
melanogaster has led to a greater understanding of the biological basis of the disease. In an attempt
to establish additional Drosophila models of PD via the manipulation of cell survival signaling, the
UAS/GAL4 system was used to overexpress two forms of phosphatidylinositol 3-OH kinase (PI3K)
in the dopaminergic neurons of flies. The directed expression of PI3K in this manner dramatically
reduces life span and climbing ability while an inhibitory form, a dominant negative version of PI3K,
reduces life span in a far less dramatic way. These novel models should provide the basis for a series
of investigations into the role of cell survival signaling in Parkinson's disease.
Introduction
Parkinson’s disease (PD) is a common, age-related neurodegenerative disease characterized
by muscle rigidity, resting tremors, and postural instability (Spacey and Wood, 1999; Lansbury and
Brice, 2002). Post-mortem analysis of patients reveal that PD appears to be due to the selective loss
of dopaminergic neurons in the substantia nigra region of the brain. The underlying cause of this
distinctive loss of neurons may be classified as either sporadic or familial in origin. Although the
underlying mechanism is not well understood, defects in several genes as well as a number of
environmental toxins have been linked to the cause of this neuronal loss. As it is difficult to research
the pathogenesis of PD in living patients, a number of animal models (Dawson, 2000; Hashimoto et
al., 2003), including a well established Drosophila model (Feany and Bender, 2000), have been
developed to investigate aspects of PD.
A promising series of investigations into the biological basis of PD have been initiated
through the generation of a PD model by the conditional expression of human α-synuclein in
transgenic Drosophila (Feany and Bender, 2000). The expression of α-synuclein, in both a
pan-neural and dopaminergic neuron-specific manner, produce an age-dependent loss of
dopaminergic neurons. The neuronal loss is accompanied with the premature loss of climbing ability
and the formation of cytoplasmic inclusions in the dopaminergic neurons. In addition, expression of
α-synuclein in the developing eye results in an age-dependent degeneration of the retina. In further
experiments, the dopamine precursor levodopa, dopamine receptor agonists, and the anticholinergic
agent atropine act to counter the age-dependent loss of climbing ability (Pendleton et al., 2002).
Expression of the molecular chaperone gene hsp70 with α-synuclein prevents dopaminergic neuronal

Research Notes DIS 86 (December 2003) 108
degeneration (Auluck et al., 2002). The expression of parkin can suppress the loss of dopaminergic
neurons (Yang et al., 2003), the premature loss of climbing ability and the age-dependent
degeneration of the retina (Haywood and Staveley, in preparation) induced by α-synuclein in
Drosophila. In addition, another model has recently been established with the description of mutants
in the parkin gene (Greene et al., 2003). The Drosophila models of PD are proving to be very
effective tools in the investigation of the biological basis of this disease.
Dopaminergic neurons may die as a result of apoptosis in PD (for review see Lev et al.,
2003). This process may be caused by the accumulation of endogenous toxic proteins or
environmental toxins. Exploration of the role of cell survival signaling in the selective loss of
dopaminergic neurons in Drosophila may provide further insight into the basis of PD. The insulin
receptor/ PI3 kinase/ akt anti-apoptotic signaling pathway is highly conserved between mammals and
Drosophila (Fernandez et al., 1995, Leevers et al., 1996; Staveley et al., 1998; Datta et al., 1999;
Oldham et al., 2000). To initiate this signal, insulin or insulin-like growth factors bind to receptor
tyrosine kinases at the cell membrane and activate the protein phosphatidylinositol 3-OH kinase
(PI3K) via phosphorylation (Vanhaesebroeck et al., 2000). In turn, PI3K phosphorylates inositol
lipids on the inner membrane of the cell, which leads to the co-localization of akt and
phosphoinosotide-dependent kinase 1 (PDK-1) and, as a result, the activation of akt. An anti-
apoptotic or cell survival signal results from activated akt. Consequently, manipulation of the
InR/PI3K/akt pathway in the dopaminergic neurons of Drosophila melanogaster may produce
selective apoptotic death of those cells and produce flies with symptoms similar to other models of
PD. As PI3K is an essential component of this pathway, it is a good candidate for manipulating cell
survival signaling.
The UAS/GAL4 ectopic expression system (Brand and Perrimon, 1993) was used to
overexpress wild type and mutant forms of PI3K in the dopaminergic neurons. Climbing and
longevity assays were performed and the results demonstrate that overexpression of PI3K
dramatically reduces climbing ability and viability of the flies from the time of eclosion.
Overexpression of an inhibitory PI3K also reduces the length of life span when compared to controls
but does not prematurely reduce the climbing ability of the flies.
Materials and Methods
Fly stocks and culture: The Ddc-GAL4
4.3D and Ddc-GAL4
4.36 transgenic lines (Li et al., 2000)
were obtained from Dr. Jay Hirsh at the Department of Biology, University of Virginia. The UAS-
PI3K-dp110 and UAS-PI3K-dp110D954A
flies were obtained from Dr. Sally Leevers at the Ludwig
Institute for Cancer Research and the Department of Biochemistry and Molecular Biology, University
College, London. The w1118
strain was provided by Dr. Howard D. Lipshitz of the Hospital for Sick
Children and the University of Toronto. All flies were cultured on standard cornmeal/yeast/agar
medium at 25oC.
Transgene Expression: The UAS/GAL4 ectopic expression system (Brand and Perrimon,
1993) was used to express wild type and mutant forms of phosphatidylinositol 3-OH kinase (PI3K;
Leevers et al., 1996) in the dopaminergic neurons using Ddc-GAL4 transgenes (Li et al., 2000). The
progeny of crosses of the Ddc-GAL4 lines to transgenic UAS-PI3K-dp110 flies will express the
catalytic subunit of PI3K (dp110) in the dopaminergic neurons. The same Ddc-GAL4 driver lines
were crossed to UAS-PI3K-dp110D954A
to induce the expression of an inhibitory form of this subunit
of PI3K. The controls were produced by crossing w1118
to the Ddc-GAL4 transgenics.
Aging assay: Adult male flies were collected within 24 hours of eclosion and scored for
viability every two to three days to determine the adult life span characteristics as previously

DIS 86 (December 2003) Research Notes 109
described (Staveley et al., 1990). Flies were maintained under non-crowded conditions of
approximately 5 to 15 individuals upon standard cornmeal/yeast/agar medium at 25°C.
Climbing assay: The climbing ability of male flies of the same age were assayed every four
days to determine their locomotor abilities throughout their life span as previously described (Feany
and Bender, 2000). To be precise, the proportion of a cohort of ten (or fewer) flies to climb a
distance of 8 centimetres within a period of 18 seconds was determined. In total, twenty trials were
carried out at each time point. From this data, the average number of flies that successfully completed
the climb at each time point was calculated.
Data Analysis: Data from the aging and climbing assays were compiled and graphed using
Microsoft Excel.
Figure 1. Survival of flies expressing wild type (PI3K) and dominant negative PI3K (PI3K
DN) in the
dopaminergic neurons. Adult males that express the wild type version of PI3K in the dopaminergic
neurons Ddc-GAL44.36
/UAS-PI3K-dp110 (large solid triangles) and Ddc-GAL44.3D
/UAS-PI3K-dp110
(large solid squares) have a greatly reduced life span when compared to controls. Expression of the
dominant negative PI3K transgene under the same circumstances, Ddc-GAL44.36
/UAS-PI3K-
dp110D954A
(small solid triangles) and Ddc-GAL44.3D
/UAS-PI3K-dp110D954A
(small solid squares),
leads to a slightly reduced life span, when compared to the GAL4-expressing controls, Ddc-
GAL44.36
/+: (small open triangles) and Ddc-GAL44.3D
/+: (small open squares). The number of
individuals aged was as follows: Ddc-GAL44.36
/UAS-PI3K-dp110, n = 122; Ddc-GAL44.3D
/UAS-PI3K-
dp110, n = 129; Ddc-GAL44.36
/UAS-PI3K-dp110D954A
, n = 107; Ddc-GAL44.3D
/UAS-PI3K-dp110D954A
,
n = 195; Ddc-GAL44.36
/+, n = 119; Ddc-GAL44.3D
/+, n = 280.

Research Notes DIS 86 (December 2003) 110
Results and Discussion
Transgenic flies expressing one of the two forms of PI3K in the dopaminergic neurons were
tested for viability with an aging assay (Figure 1). Overexpression of PI3K-dp110 with both of the Ddc-
GAL4 transgenes greatly decreased the life span of the flies. The median age of survival (50%) for flies
expressing PI3K-dp110 was between 18 and 20 days when expressed by Ddc-GAL44.3D
and between 12
and 14 days when expressed by Ddc-GAL44.36
. Expression of the dominant negative form of PI3K
(PI3K-dp110D954A
) produced a small decrease in survival. The median age of survival (50%) was
between 58 and 60 days under the control of the Ddc-GAL44.36
driver and between 68 and 70 days with
the Ddc-GAL44.3D
transgene. The GAL4 heterozygotes, Ddc-GAL44.3D
and Ddc-GAL44.36
, were tested
and the results show a median age of survival between 70 and 72 days for the former and between 82
and 84 for the latter. The expression of PI3K-dp110D954A
resulted in a decrease in median survival of
approximately 14 days when compared to the Ddc-GAL4 heterozygote controls while the expression of
PI3K-dp110 resulted in a major decrease in life span by between 50 and 70 days.
Figure 2. The measurement of climbing ability of flies expressing wild type (PI3K) and dominant
negative PI3K (PI3KDN
) in the dopaminergic neurons. Adult males that express the wild type version
of PI3K in the dopaminergic neurons Ddc-GAL44.36
/UAS-PI3K-dp110 (large solid triangles) and Ddc-
GAL44.3D
/UAS-PI3K-dp110 (large solid squares) have a poor ability to climb when compared to
controls. Expression of the dominant negative PI3K transgene under the same circumstances, Ddc-
GAL44.36
/UAS-PI3K-dp110D954A
(small solid triangles) and Ddc-GAL44.3D
/UAS-PI3K-dp110D954A
(small solid squares), maintain the ability to climb in a manner similar to the controls, Ddc-GAL44.36
/+
(small open triangles) and Ddc-GAL44.3D
/+ (small open squares). The climbing experiments were
discontinued when death reduced the number significantly.
DIS 86 (December 2003) Research Notes 111
To monitor the effects upon locomotion, the climbing ability of these transgenic flies were
tested (Figure 2). Flies that express the wild type version PI3K-dp110 under the control of Ddc-
GAL4 climb poorly while those expressing PI3K-dp110D954A
appear to climb as well as the controls
throughout the duration of the experiment.
In addition to the defects in climbing ability and the greatly reduced life span, flies
overexpressing PI3K-dp110 exhibit a blistered wing phenotype shortly after emerging from the pupae
cases (data not shown). Within a day or so, most adult Ddc-GAL4/UAS-PI3K-dp110 flies have
shriveled wings. This defect may be indirectly caused by neuronal loss.
Overexpression of PI3K in the dopaminergic neuron during development may lead to
selective apoptotic death of these neurons. Contrary to the common role of PI3K in supporting cell
survival, overexpression of PI3K has been shown to cause apoptosis. In cultured rat embryo
fibroblasts, prolonged activation of PI3K in the absence of other stimuli (serum) results in apoptosis
(Klippel et al., 1998). Prolonged overexpression of PI3K increases in the proportion of cells in G2/M
and induces apoptosis in Drosophila (Vanhaesebroeck et al., 2000). This may be due to deregulation
of the cell cycle or the induction of an apoptotic feedback program by the hyperactivation of many
signaling pathways. The selective loss of the dopaminergic neurons via a cell death mechanism
could be responsible for the observed poor climbing ability and reduced life span of adult Ddc-
GAL4/UAS-PI3K-dp110 flies.
Although active PI3K acts to prevent apoptosis of cells, larvae survive for twenty days
without PI3K (Weinkove et al., 1999). In contrast, the inhibitory form of PI3K has been shown to
cause cell death when expressed in embryos (Scanga et al., 2000). In our experiments, the expression
level of PI3K-dp110D954A
may have been sufficient to induce neuronal loss only in late life. The
small decrease in life span may have resulted from this late loss in neurons in the Ddc-GAL4/UAS-
PI3K- dp110D954A
flies.
In conclusion, this experiment analyzed the viability and climbing ability of flies expressing
two forms of PI3K in an attempt to model characteristics of Parkinson's disease. Unexpectedly, the
ectopic expression of PI3K showed dramatically reduced life span coupled with poor climbing
ability. Unlike Parkinson disease patients, the locomotor dysfunction begins early, rather than arising
in a gradual manner, which may be due to the larval expression of PI3K, and subsequent loss of
dopaminergic neurons at that stage. The dominant negative version of PI3K reduced life span by a
modest amount but did not seem to influence the ability of these flies to climb. In summary, our
experiments show that the overexpression of PI3K in dopaminergic neurons can produce defects that
may recapitulate some aspects of Parkinson's disease in Drosophila melanogaster.
Acknowledgments: This work was funded by the Natural Sciences and Engineering Research
Council of Canada and the Dean of Science of Memorial University of Newfoundland (start up funds
to BES). LDS was funded by an Undergraduate Student Research Award from the Natural Sciences
and Engineering Research Council of Canada. Many thanks to Dr. Jay Hirsh, Dr. Sally J. Leevers
and Dr. Howard D. Lipshitz for providing fly stocks. We thank Lloyd Smith for design and
production of the climbing assay device. We thank Justin Moores and Jamie Kramer for a critical
reading of the manuscript.
References: Auluck, P.K., H.Y. Chan, J.Q. Trojanowski, V.M. Lee, and N.M. Bonini 2002,
Science 295: 865-868; Brand, A.H., and N. Perrimon 1993, Development 118: 401-415; Datta,
S.R., A. Brunet, and M.E. Greenburg 1999, Genes Dev. 13: 2905-2927; Dawson, T.M., 2000, Cell
101: 115-118; Feany, M.B., and W.W. Bender 2000, Nature 404: 394-398; Fernandez, R., D.
Tabarini, N. Azpiazu, M. Frasch, and J. Schlessinger 1995, EMBO J. 14: 3373-3384; Greene, J.C.,
A.J. Whitworth, I. Kuo, L.A. Andrews, M.B. Feany, and L.J. Pallanck 2003, Proc. Natl. Acad. Sci.
USA 100: 4078–4083; Hashimoto, M., E. Rockenstein, and E. Masliah 2003, Ann. N.Y. Acad. Sci.
991: 171-188; Klippel, A., M.-A. Escobedo, M.S. Wachowicz, G. Apell, T.W. Brown, M.A. Giedlin,

Research Notes DIS 86 (December 2003) 112
W.M. Kavanaugh, and L.T. Williams 1998, Mol. Cell. Biol. 18: 5699–5711; Lansbury, P.T., and A.
Brice 2002, Curr. Opin. Cell. Biol. 14: 653-660; Leevers S.J., D. Weinkove, L.K. MacDougall, E.
Hafen, and M.D. Waterfield 1996, EMBO J. 23: 6584-6594; Lev, N., E. Melamed, and D. Offen
2003, Prog. Neuropsychopharmacol. Biol. Psychiatry 27: 245-250; Li, H., S. Chaney, I.J. Roberts,
M. Forte, and J. Hirsh 2000, Curr. Biol. 10: 211-214; Oldham, S., R. Bohni, H. Stocker, W.
Brogiolo, and E. Hafen 2000, Philos. Trans. R. Soc. Lond. B. Biol. Sci. 355: 945-952; Pendleton,
R.G., A. Rasheed, T. Sardina, T. Tully, and R. Hillman 2002, Behav. Genetics 2: 89-94; Scanga,
S.E., L. Ruel, R.C. Binari, B. Snow, V. Stambolic, D. Bouchard, M. Peters, B. Calvieri, T.W. Mak,
J.R. Woodgett, and A.S. Manoukian 2000, Oncogene 19: 3971-3977; Spacey, S.D., and N.W. Wood
1999, Curr. Opin. Neurol. 12: 427-432; Staveley, B.E., L. Ruel, J. Jin, V. Stambolic, F.G.
Mastronardi, P. Heitzler, J.R. Woodgett, and. A.S. Manoukian 1998, Curr. Biol. 8: 599-602;
Staveley, B.E., J.P. Phillips, and A.J. Hilliker 1990, Genome 33: 867-872; Vanhaesebroeck, B., S.J.
Leevers, K. Ahmadi, J. Timms, R. Katso, P.C. Driscoll, R. Woscholski, P.J. Parker, and M.D.
Waterfield 2001, Annu. Rev. Biochem. 70: 535–602; Weinkove, D., T. Twardzik, M.D. Waterfield,
and S.J. Leevers 1999, Curr. Biol. 9: 1019-1029; Yang, Y., I. Nishimura, Y. Imai, R. Takahashi, and
B. Lu 2003, Neuron 37: 911-924.
Drosophila malerkotliana and D. ananassae in Florida.
Birdsley, Jeffrey S. Department of Biological Science, Florida State University,
Tallahassee, Florida, 32306. For correspondence, email: [email protected].
Drosophila malerkotliana is probably native to Asia. It has spread through Africa and the
New World tropics where it was first collected in the latter part of the twentieth century (Chassagnard
et al., 1989, and references therein). Here I report the first collections of this species in North
America. I compare its distribution to that of its relative D. ananassae, long considered to be the
only representative of the ananassae subgroup in North America (e.g., Patterson and Wagner, 1943).
I identified the specimens as D. malerkotliana by genital and sex comb characters. As
members of the bipectinata complex in the ananassae subgroup (Bock, 1971), malerkotliana males
have a bifid aedeagus. Males in the related ananassae complex have a single, fused aedeagus. Sex
combs in malerkotliana consist of short, transverse rows of bristles (Bock and Wheeler, 1972). There
are one or two rows on the metatarsus, the proximal row having 0-2 teeth, the distal row having about
3. There are two rows on the second tarsal segment, the proximal row having about 1 tooth, the distal
row having about 2. This formula distinguishes malerkotliana from the very similar D.
pseudoananassae (Bock, 1971). In September 2003 I performed crosses between recent Florida
stocks and a D. malerkotliana stock collected May 2002 in Chiapas, Mexico, and distributed by the
Tucson Stock Center. All crosses produced F1 and F2 flies.
I collected the first specimens of malerkotliana at Tallahassee, Florida, 22 Sep 2001. My
weekly year-around collections on fruit compost in central Tallahassee show it to be present only
between August and December, some years becoming very abundant in October (see
http://bio.fsu.edu/~birdsley). It may be re-colonizing north Florida from the south each summer. In
fall 2000 I made less regular collections at this same Tallahassee site but did not identify any
malerkotliana. I think it is likely that malerkotliana was not present in 2000, though inexperience
may have caused me to confuse them with D. simulans or D. willistoni.

DIS 86 (December 2003) Research Notes 113
Figure 1. Distribution of D. malerkotliana ( ), D. ananassae ( ), or neither species ( ) in
collections made (a) in Aug-Oct 2002 and Sep 2003 and (b) in Feb-Mar 2002 and Mar 2003.
I have collected malerkotliana throughout peninsular Florida. In far south Florida, I have also
collected small numbers of what appears to be a sexually monomorphic form of ananassae. The
abdomen of males of this species is not black-tipped, but has thin, dark bands like that of the female.
The aedeagus is single. Sex combs consist of four or five metatarsal rows, three or four rows on the
second tarsal segment, and 1 tooth on the distal end of the third tarsal segment. Figures 1a and 1b
show the distributions of both species in Florida and neighboring states in fall and spring,
respectively. I generally collected samples of hundreds of flies on rotting fruits. Note the apparent
winter refuge in far south Florida and the spread north by fall. The Georgia collections were made 6
Sep 2003 when I collected a single male ananassae at a large produce distributor in Thomasville,
Georgia. I had collected a single female ananassae at the same site on 28 Jun 2003, suggesting
frequent immigration from the south via produce shipments. The malerkotliana population may
spread north into Georgia after 6 Sep, but it is less likely that it spreads into Alabama. I made the
collection shown in Conecuh County, Alabama, on 19-20 Oct 2002, long after malerkotliana had
become abundant in Tallahassee.
Acknowledgments: This work was supported by NSF grant DEB-0129219 to David Houle
who collected some of these fly samples. Becky Fuller assisted in most collections.
References: Bock, I.R., 1971, Univ. Tex. Publ. 7103: 273-280; Bock, I.R., and M.R.
Wheeler 1972, Univ. Tex. Publ. 7213: 1-102; Chassagnard, M.T., M. Solignac, and L. Tsacas 1989,
Annls. Soc. ent. Fr. 25: 247-248; Patterson, J.T., and R.P. Wagner 1943, Univ. Tex. Publ. 4313: 217-
281.
a b

Research Notes DIS 86 (December 2003) 114
A summary of the polytene chromosome bands not seen by EM.
Saura, Anja O. Department of Biosciences, Division of Genetics, P.O. Box 56
(Viikinkaari 5), FIN-00014 University of Helsinki, Finland. E-mail:
In the literature, the number of bands among dipteran polytene chromosomes ranges from
1500 to 5000 (Zhimulev, 1996). According to Zhimulev, this variation is probably due to subjective
or objective factors such as the way preparations are made. The most extensively studied dipteran,
Drosophila melanogaster, has been attributed the highest number of bands. The Bridges’ drawn maps
for D. melanogaster polytene chromosomes (C.B. Bridges, 1938; P.N. Bridges, 1941a,b, 1942;
Bridges and Bridges, 1939) reprinted in Lindsley and Zimm (1992) and in Sorsa (1988) show more
than 5000 bands when the so called double bands are counted as two bands each (Bridges, 1942), but
less than 3800 bands when the doublets are counted as one band each (Zhimulev, 1996). The latter
number may be a good approximation of reality.
The size of the single bands on the Bridges’ maps ranges from very small and faint to large and
dark. The smallest bands are difficult to see on a chromosome preparation even using an electron
microscope (EM). Our electron micrograph maps based on thin sections of the long salivary gland
chromosomes of D. melanogaster were published piecemeal in 1979-1996 and finally completed with
the micrographs on the fourth or the dot chromosome (Saura et al., 2002). Our original goal was to
identify as many of Bridges’ bands as possible. Of course, the interpretation of the banding given on
our micrograph maps is subjective and the amount of evidence needed to demonstrate the existence
of many of the faint bands is open to debate (Semeshin et al., 1985).
Table 1 lists the Bridges’ bands that were regarded as missing in our electron micrographs. One
reason many of the faintest bands have not been detected through EM is that a micrograph shows
only a very thin section, 80-100 nm, of a chromosome. One might assume that successive
longitudinal thin sections through the same chromosome would show some of the now missing
Bridges’ bands, even though Lefevre (1976) suggested that Bridges drew certain bands only to even
up otherwise excessively long interbands.
Because our EM mapping was done during a long period of time, our ways to interpret
banding pattern may have changed at least slightly, if we compare the first papers (Saura and Sorsa,
1979a-d) and the later ones (e.g., Saura et al., 1993, 1994, 1996). In papers published later we have
applied a more stringent interpretation in comparison with the first papers but not as stringent as the
rules of Semeshin et al. (1985). They propose that the banding pattern of a region should be
reproducible on serial sections of at least two or three chromosomes. In addition, single electron
dense structures less than 1/20 of the chromosome diameter should not be regarded as bands. The list
of bands in Table 1 contains now some 320 (-350) bands. The list might be much longer, if the
banding on the micrographs (e.g., Saura et al., 1997) were interpreted by some other person or strictly
by the above rule of Semeshin et al. (1985), since the amount of evidence needed to demonstrate the
existence of many other of the Bridges’ faint bands might be considered to be too meager.
Acknowledgments: Veikko Sorsa and Tapio. I. Heino have commented upon the MS. This
work has been supported by a grant from the Jenny and Antti Wihuri Foundation.
References: Bridges, C.B., 1938, J. Hered. 29: 11-13; Bridges, P.N., 1941a, J. Hered. 32: 64-
65; Bridges, P.N., 1941b, J. Hered. 32: 299-300; Bridges, P.N., 1942, J. Hered. 33: 403-408;
Bridges, C.B., and P.N. Bridges 1939, J. Hered. 30: 475-476; Lefevre, G., Jr., 1976, In: The Genetics
andBbiology of Drosophila, (Ashburner, M., and E. Novitski, eds.), Academic Press, London, 1a: 31-

DIS 86 (December 2003) Research Notes 115
Table 1. The bands of the Bridges' maps not been seen on the electron micrographs. The bands in parentheses (in particular in 2R) may exist but they are weakly visible in the micrographs in comparison with other bands. Chromocentral parts (20B-F, 40B-F, 41A-E, 80B-F) were mostly omitted from detailed mapping.
Chromosome arm and region
Bridges’ bands not seen in micrographs. Numbers denoting a chromosome division are in bold
Reference (see also Saura et al., 1997)
X1-2 - Sorsa and Saura (1980a) X3-5 4A6, E3; 5A10 (or A11), B5, C4 Sorsa and Saura (1980b) X6-10 10(B12, B17) Sorsa et al. (1983) X11-20A 11B12, D7, D11, E5, E7; 12A3, C3; 13A4, (C8); 14C3; 15A6, A9,
A12, B3, C3, C6, D3, F6; 16A3, A7, B3, C9; 18A7, B8 Saura et al. (1993)
2L21-22 - Saura and Sorsa (1979a) 2L23-26 24B3, C4, C6, F5, F8; 26A7 Saura (1980) 2L27-29 27E8, F6; 28A3, B4, C6, C9, E6 (or E5) Saura and Sorsa (1979d) 2L30-31 30B7; 31A3 Saura and Sorsa (1979b) 2L32-36(-40) 32E3; 33A4, A8, B4, B7, C6, D2, D5, E? F?; 34A11, B3, B4, B8,
B12, C7, E3, E6; 35E3, E4, E5-6, F10; 36B3, C3, C8 Saura (1983)
2L37-40A 37(F3); 38C4; 39C3, C4 Saura and Sorsa (1979c) 2R41F-50 41F7; 42A13, A15, A17, B5, (C2), (C3), D3; 43E18; 44A8, D7, (E3);
45B5, B9, C9, D3, D6, (D7), D10, (E4), F3, F6; 46B9, B13, C3, C7, C10, C12, (D5), D6 (or D8), E5, E7, E9, F3 (or F4), (F8), (F11); 47A4 or A5, A6, A10, A15, (A16), (B6), B10, B14, C5, C6, (D3, D7, E3), E6, (F3), F5, F6, F10, F17; 48A6, (B4), C7, (D7), (E8, E9), F4, F9, F10; 49A6, (B4), (C4), D4, D5, F12; 50(A6), A11, (A15), B4, (C5), D3, (D6), (E9)
Saura (1986)
2R51-60 51B3, C4, C7, D3, E8, E9, F5; 52A5, A13-14, D6, E11, F4, F6, F8, F11; 53C5, C8, E3, E9, F7; 54C11, D6, E5; 55F13; 56D9, D10, D12, D15, E3, E6, F5; 57B8, C4; 58E5; 59B3; 60(A7, E7, E10, E12), F4
Saura et al. (1991)
3L61-63 - Sorsa et al. (1984) 3L64-70 64B3, E3, E4, E10; 65A13, F9; 66A4, A16, D13; 68C5; 69C3, C11;
70D6, E8 Saura et al. (1989)
3L71-73 - Sorsa et al. 1987) 3L74-80A 74C4; 75F8; 76A7; 77C5, D5, E5, F5; 78B4 Saura et al. (1988) 3R81-90 83C9, D3, F3; 84A6, F16; 85A4, A10, C6, D10, D13, D20, D23, D26,
F11, F14, 86A3, A8, C9, C14, D3, D10, E3, E9, F5; 87B3, B12, C4, D6, D8, D10, D13, E3, E7, F4, F6, F9, F11; 88A3, A11, B4, B9, C5, C11, E5, E10, E13; 89A10, A13, B5, B8; 90A4, A7, D6, E7, F5, F8
Saura et al. (1994)
3R91-100 91A7; 92A9, A12, B5, B10, C3, D3, D5, D6, D9, E5, E7, E15, F9, F12; 93A3, A6, C6, D5, D10, E3, E10, F3, F8; 94A5, A13, B7, B11, C6, D6, D9, E2, E5; 95A3, A9, B4, C3, C6, C9, C14, E4, E8, F13; 96A12, A16, A21, A25, B3, B12, B16, B18, D3, D6, E7, E9, E12, F7, F13; 97A10, C2, C5, D10, D13, D15, E4, E8, F4, F7, F9; 98A5, A8, A13, B4, D3, D6, F10; 99B3, B6, C3
Saura et al. (1996)
4:101-102 - Saura et al. (2002)
66; Lindsley, D.L., and G.G. Zimm 1992, The Genome of Drosophila melanogaster, Academic Press,
San Diego, California; Saura, A.O., 1980, Hereditas 93: 295-309; ,Saura, A.O., 1983, Hereditas 99:
89-114; ,Saura, A.O., 1986, Electron microscopic mapping of the second polytene chromosome of
Drosophila melanogaster, PhD Thesis, University of Helsinki: 1-58; Saura, A.O., and V. Sorsa
1979a, Hereditas 90: 39-49; Saura, A.O., and V. Sorsa 1979b, Hereditas 90: 257-267; Saura, A.O.,
and V. Sorsa 1979c, Hereditas 91: 5-18; Saura, A.O., and V. Sorsa 1979d, Hereditas 91: 219-230;
Saura, A.O., T.I. Heino, and V. Sorsa 1988, Hereditas 109: 1-13; Saura, A.O., T.I. Heino, and V.
Sorsa 1989, Hereditas 110: 235-252; Saura, A.O., T.I. Heino, and V. Sorsa 1991, Hereditas 114: 15-
34; Saura, A.O., T.I Heino, and V. Sorsa 1993, Hereditas 119: 123-141; Saura, A.O., T.I. Heino,
and V. Sorsa 1994, Hereditas 121: 1-20; Saura, A.O., T.I. Heino, and V. Sorsa 1996, Hereditas 124:

Research Notes DIS 86 (December 2003) 116
71-90; Saura, A.O., J.B. Cuenca, T.I. Heino, R. de Frutos, and V. Sorsa 2002, Chromosoma 111:
273-283; Saura, A.O., A.J. Saura, and V. Sorsa 1997, http://www.helsinki.fi/~saura/EM/index.html;
Semeshin, V.F., E.M. Baricheva, E.S. Belyaeva, and I.F. Zhimulev 1985, Chromosoma 91: 210-233;
Sorsa, V., 1988, Chromosome maps of Drosophila, CRC Press, Boca Raton, Florida; Sorsa, V., and
A.O. Saura 1980a, Hereditas 92: 73-83; Sorsa, V., and A.O. Saura 1980b, Hereditas 92: 341-351;
Sorsa, V., A.O. Saura, and T.I. Heino 1983, Hereditas 98: 181-200; Sorsa, V., A.O. Saura, and T.I.
Heino 1984, Chromosoma 90: 177-184; Sorsa, V., A.O. Saura, and T.I. Heino 1987, Biol. Zent.bl.
106: 303-314; Zhimulev, I.F., 1996, Adv. Genetics 34: 1-497.
A further study on the expansion of Drosophila simulans in Japan.
Itoh, Masanobu,1 Takahisa Uenoyama,
2 and Masayoshi Watada
3.
1Department of
Applied Biology, Kyoto Institute of Technology, Matsugasaki, Sakyo, Kyoto 606-
8585, Japan; Corresponding author, E-mail: [email protected]; 2Kobe Gakuin
Women’s College, Nagata, Kobe 653-0861, Japan; 3Department of Biology and Earth Science,
Faculty of Science, Ehime University, Matsuyama, Ehime 790-8577, Japan.
Drosophila simulans, a sibling species closely related to D. melanogaster, is distributed
throughout subtropical and temperate zones of the Northern and Southern Hemispheres in association
with human habitation and agriculture. This species was apparently absent from Japan prior to its
discovery in 1936 in the Bonin Islands, 1000 km south of Tokyo (Komai, l937; Okada, l956).
Watanabe and Kawanishi (l976) first reported D. simulans individuals in 1975 in many places in
Fukuoka (Kitakyushu), Ehime (Shikoku), Shizuoka (Pacific coast of Middle mainland). Watanabe
and Kawanishi (l978) reported the expansion of D. simulans in l976 in the Kyushu district and the
Kanto-Tokai district along the Pacific coast of Middle mainland, but not in the intervening areas.
However, no D. simulans was found in the southwestern islands aside from a few individuals,
probably temporarily introduced. In field surveys of domestic and semi-domestic species of
Drosophila from l977 to l985, Watada et al. (l986) confirmed the abundance of D. simulans in the
Kyushu and Kanto-Tokai districts. Newly established populations of D. simulans were also found in
the western mainland, in the Kinki and Chugoku districts. Some isolated populations were observed
in Sapporo and Akita, the northern parts of Japan, and some of the southwestern islands.
In an attempt to know how a newly immigrant species adapts to new environments and
colonizes, we examined temporal changes in the distribution of D. simulans. Wild Drosophila flies
were collected at 32 sites in Japan from 1993 to 2003. Here we report the D. simulans distribution in
Japan for this period.
Flies were collected, within seven days after trap setting, using banana-bait traps put near
human habitation. At vineyards, flies were collected by sweeping a net over pomace heaps. The
collection seasons were restricted to the most preferable for D. simulans and D. melanogaster in each
site: from summer to autumn in the mainland and from winter to spring in the southwestern islands.
Collected flies were classified under a dissection microscope. The presence of a dark longitudinal
stripe at the tip of egg-guide of D. simulans females is a reliable measure to distinguish them from
those of D. melanogaster (Okada, l956). Males were distinguished by their genitalia.
A total of 32 collection sites throughout Japan were chosen for the present study (Figure 1).
Collection data, combining males and females, are summarized in Table 1. D. simulans was found at
all sites except in Toyotomi (site 1), the most northern part of Japan, and some islands in the

DIS 86 (December 2003) Research Notes 117
southwestern islands (sites
29-32). The abundance of
D. simulans in Kanto-
Tokai (sites 7, 8, and 10),
Chugoku (sites 17-19),
Kinki (sites 12-16),
Shikoku (site 20 and 21),
and Kyushu (sites 22-25)
districts was confirmed.
Although isolated colonies
were found in sites 2 and
3, D. simulans was very
rare in the Tohoku district
(sites 4 and 5). In the
southwestern islands, new
colonies of D. simulans
were found in Nago (site
26), Kumejima (site 27)
and Miyakojima (site 28).
The distribution of D.
simulans is more
extensive than in the
1980s (Watada et al.,
l986), suggesting that the
expansion of D. simulans
has continued in Japan
during the last 20 years.
The speed of spreading,
however, might be
slowing down.
D. melanogaster
were significantly few in
some areas, for instance,
in the Kyushu district (site
22 and 25) where the
invasion of D. simulans
was first reported
(Watanabe and Kawanishi, l978). In such sites, D. simulans was almost predominant to D.
melanogaster. Therefore, it is likely that the reduction of D. melanogaster population size is caused
by the expansion of D. simulans. Similar cases of competitive exclusion of D. melanogaster were
reported in Colombia and Egypt (Hoenigsberg, l968; Tantawy et al., l970). D. melanogaster may be
at the doorstep of eradication in some areas.
It has generally been thought that D. simulans and D. melanogaster have overlapping niches
in nature, since they are very close sibling species and their distributions are largely overlapping in
association with human habitation or activity. Nonetheless, some physiological and behavioral
differences suggest that there may be microhabitat separation between the two species. D. simulans
is less adapted to both cold and hot temperature stresses, and both high and low humidity than D.
melanogaster (Parsons, l979, l983; but Kojima and Kimura, 2003). Some wild Drosophila, including
Table 1. Number of D. melanogaster and D. simulans collected.
Locality Date D. melanogaster D. simulans
Hokkaido 1. Toyotomi Aug. 2000 26 0
Northern mainland 2. Inakadate, Aug. 2000 243 45 3. Tsuruta Aug. 2000 78 33 4. Ohazama Sep. 2000 155 1 5. Higashine Sep. 2000 262 1
Middle mainland 6. Obuse Sep. 2000 22 399 7. Katsunuma Oct. 1997 1,055 430
Oct. 1999 484 126 8. Mishima Oct. 1999 177 283 9. Fukui Jul. 1999 60 4
10. Minogamo Sep. 2001 96 101 Western mailand
11. Aito Sep. 2001 105 7 12. Kyoto Oct. 2001 30 41 13. Kawachinagano Oct. 1993 12 162 14. Tozugawa Jul. 2000 71 68 15. Nishinomiya Sep. 2001 42 36 16. Kobe Aug. 1993 15 282 17. Tottori Oct. 2001 61 174 18. Akasaka Sep. 2001 93 409 19. Tokuyama Sep. 2001 44 192
Shikoku 20. Oe Sep. 2001 28 425 21. Nankoku Sep. 2001 85 138
Kyushu 22. Shonai Sep. 2001 6 399 23. Tanushimaru Sep. 2001 27 95 24. Seihi Sep. 2001 15 44 25. Kobayashi Sep. 2001 7 128
South-west Islands 26. Naga Nov.1996 71 73 27. Kumejima Apr. 2002 141 454 28. Miyakojima Dec. 1999 61 8 29. Ishigakijima Mar. 1998 20 0 30. Iriomotejima Nov. 2001 896 1
Apr. 2003 985 0 31. Harerumajima Nov. 1998 174 0 32. Yonagunijima Dec. 1998 199 0
Data from sites 26, 28, 29, 31, and 32 are from Watada and Itoh (1999).

Research Notes DIS 86 (December 2003) 118
D. melanogaster, come indoors, but D. simulans does not (Dobzhansky, l965; Okada, 1971) because
of its stronger light preference (Parsons, l975; Kawanishi and Watanabe, l978). What factors
determine the success of D. simulans colonization in an area is the question to be solved.
Figure 1. Geographical distribution of Drosophila simulans in Japan. White circles are D. simulans-
abundant sites (the number of D. simulans was more than 10% of the total number of D. simulans and
D. melanogaster) and black ones are D. simulans-deficient sites (the number of D. simulans was less
than 10%). The number of each site is the same as in Table 1.
Acknowledgments: We thank N. Inomata and T. Takano-Shimizu for assistance collecting
flies. The latter found the first recorded male of D. simulans from Iriomotejima. We also thank to Y.
Inoue and I.A. Boussy for helpful comments on the manuscript.
References: Dobzhansky, Th., l965, The Genetics of Colonizing Species. Academic Press,
N.Y.: 533-546; Hoenigsberg, H.F., l968, Am. Natur. 102: 389-390; Kojima, K., and M.T. Kimura
2003, Entomol. Sci. 6: 135-142; Komai, T., l937, Dros. Inf. Serv. 8: 7-8; Okada, T., l956,
Systematic study of Drosophilidae and allied families of Japan. Gihodo, Tokyo; Okada, T., l971,
Proc. Jpn. System. Zool. 7: 67-73; Parsons, P.A., l975, Behav. Ganet. 5: 17-25; Parsons, P.A., l979,
Evolution 33: 131-136; Parsons, P.A., l983, The Evolutionary Biology of Colonizing Species.

DIS 86 (December 2003) Research Notes 119
Cambridge Univ. Press; Tantawy, A.O., A.M. Mourad, and A.M. Masri 1970, Am. Natur. 104: 105-
109; Watada, M., Y. Inoue, and T.K. Watanabe l986, Zool. Sci. 3: 873-883; Watanabe, T.K., and M.
Kawanishi l976, Proc. Japan Acad. 52: 191-194; Watanabe, T.K., and M. Kawanishi l978, Zool.
Mag. 87: 109-116.
Sterile female of lozenge of Drosophila melanogaster has activated eggs in ovary.
Baba, Kanako, and Machiko Hatsumi. Department of Biological Science, Faculty
of Life and Environmental Science, Shimane University, 1060 Nishikawatsu cho,
Matsue city, Shimane, 690-8504, Japan; Phone:, 81-852-32-6434; Fax., 81-852-32-
6449; E-mail: Machiko Hatsumi, [email protected].
Many alleles of the lozenge (lz) of Drosophila melanogaster, on the X chromosome (1-27.7),
show a wide range of phenotype, namely, reduced eye size, abnormal parovaria, tarsal claws
reduction, female sterility and so on (Lindsley and Zimm, 1992). The extent of abnormality is
different by alleles. The lozenge gene controls eye development as a transcription factor (Daga et al.,
1996). But its roles of other organs were not known.
We observed ovaries of homozygous flies for several alleles of lz to know the effect of lz gene
on female fertility. The strains of lz were given from Bloomington Drosophila Stock Center, BL65
(lz34
), 66 (lz36
), 114 (lzy4
), 3613 (lz37
), 4069 (lzBS+46
), 4495 (lz48f
), and Tokyo Metropolitan University,
lz85
. Flies were fed and maintained in nutritious condition at room temperature. Five- or six-day-old
females of lz / lz or six- and eight-
day-old Canton-S females were
dissected in Drosophila ringer
solution (Ephrussi and Beadle,
1936). We found activated eggs in
ovaries of homozygous female for
lz. We immersed these eggs into ten
times ringer solution in order to
check permeability of the membrane
of eggs. Mature oocyte of D.
melanogaster (Hastumi, et al., 2001)
is more rehydrate than stage 14
oocyte described by King (1970)
and looked more similar to
activated. When they were
immersed into ten times ringer
solution, mature oocytes shrunk
because of nature of semipermeable membranes, while the vitelline membrane of activated eggs were
not permeable and shape of activated eggs did not change. By using ten times ringer solution we tried
to confirm that the egg in the ovary of the lz female was activated. Table 1 shows the results. Canton-
S females, control strain of wild type, and female homozygous for female fertile lz allele, lz77a7
/ lz77a7
and lz85
/ lz85
, had no activated eggs in their ovaries. Activated eggs were found in ovaries of females
homozygous for sterile lz alleles. We immersed ovaries of sterile lz females into 50% commercial
bleach which destroys unactivated oocytes. A few eggs were not destroyed after ovaries were soaked
Table 1. Number of females with activated eggs in ovary and mean number of activated eggs per female.
Genotype Fertility N* NAE
** Mean
***
lz34
/lz34
Sterile 20 1 1.00
lz36
/lz36 Sterile 20 2 2.00
lzy4
/lzy4
Sterile 20 1 1.00
lz37
/lz37
Sterile 20 2 1.00
lzBs+46
/lzBs+46
Sterile 20 4 1.75
lz48f
/lz48f
Sterile 20 5 1.80
lz77a7
/lz77a7
Fertile 20 0 0
lz85
/lz85
Fertile 20 0 0
CantonS 6-day-old Fertile 20 0 0
CantonS 8-day-old Fertile 20 0 0
N
*: Number of females dissected. NAE
**: Number of females with
activated eggs in ovary. Mean***
: Mean number of activated eggs per female.

Research Notes DIS 86 (December 2003) 120
in bleach. These results suggested that abnormal egg activation in ovary is related to sterility of lz / lz
females. It was reported that storage of stage 14 oocytes is characteristic in females homozygous for
lz34k
and King (1970) discussed that in this mutant the musculatures of the uteri and genital segments
are unable to generate the peristaltic contractions required for oviposition. We confirmed eggs laid on
medium by female homozygous for lz allele except one, lzBS+46
allele. Our results suggest sterile lz
female can lay eggs, but activated eggs in ovary disturb ovulation frequently. It was suggested that
the lz gene product controls the repression of egg activation in ovaries.
Mechanisms of egg activation at fertilization are not understood well. Our observation
suggests that there are not only the mechanisms of egg activation at fertilization but also the
mechanisms that disturb egg activation before fertilization when eggs are staying in the ovary and
that both mechanisms are important for egg fertility.
References: Daga, A., C.A. Karlovich, K. Dumsterei, and U. Banerjee 1996, Genes and Dev.
10: 1194-1205; Ephrussi, B., and G.W. Beadle 1936, Am. Nat. 70: 218-225; Hatsumi, M., Y.
Watanabe, and M. Sawa 2001, M. Biol. Cell. 93: 281-284; King, R.C., 1970, Ovarian Development
in Drosophila melanogaster. p.50, Academic Press; Lindsley, D.L., and G.G. Zimm 1992, The
Genome of Drosophila melanogaster. Academic Press, Inc.
Cooperation of net and EGFR signalling in the wing vein pattern development in
Drosophila.
Weisman, N.Ya. Institute of Cytology and Genetics of Siberian Branch of the
Russian Academy of Sciences, Novosibirsk, 630090, Russia; e-mail:
A great number of genes are involved in the development of wing veins pattern. Expression of
those genes in the embryonic imaginal disc is specific both for the cells competent to the
development into veins as well as for their neighbors developing into the wing cell regions. In
Drosophila melanogaster, net (net, 2-0.0) is one of the major players in the development of wing
veins pattern.
net mutations cause the development of vein nets and additional longitudinal segments in all
wing cells except for the first behind cells (Figure 1B). Mutations differing in their phenotypical
expression from the known net-alleles have been found in the natural populations of D.
melanogaster. The phenotype of netextra-analis
allele isolated from Belokurikha population in 2000
shows a single additional vein in the 3rd
back wing cell near the center of a longitudinal anal vein
(Figure 1C). Another non-typical netCh86
allele from Chernobyl-1986 population causes the
development of additional vein segments in the marginal, submarginal, 2nd
and 3rd
back wing cells. In
addition, up to 10% of flies in netCh86
stock have an additional vein segment in the 1st back wing cell,
which is not typical for the previously described net mutations (Figure 1D). netSТ91
mutation was
discovered in Tashkent-2001 population of D. simulans, the closest relative of D. melanogaster
species. Vein patterns in males and females of netSТ91
stock is disturbed leading to the formation of a
net and several additional vein segments in different wing sectors including the 1st back cell (Figure
1E). net-extra-analis is a recessive mutation while, netCh86
and netSТ91
are semi-dominant mutations
as compared to the normal wild-type allele.
netextra-analis
and netCh86
alleles are characterized by a less strong disturbance of vein pattern as
compared to the standard mutant allele net2-45
and are dominant to that allele. netCh86
allele is also
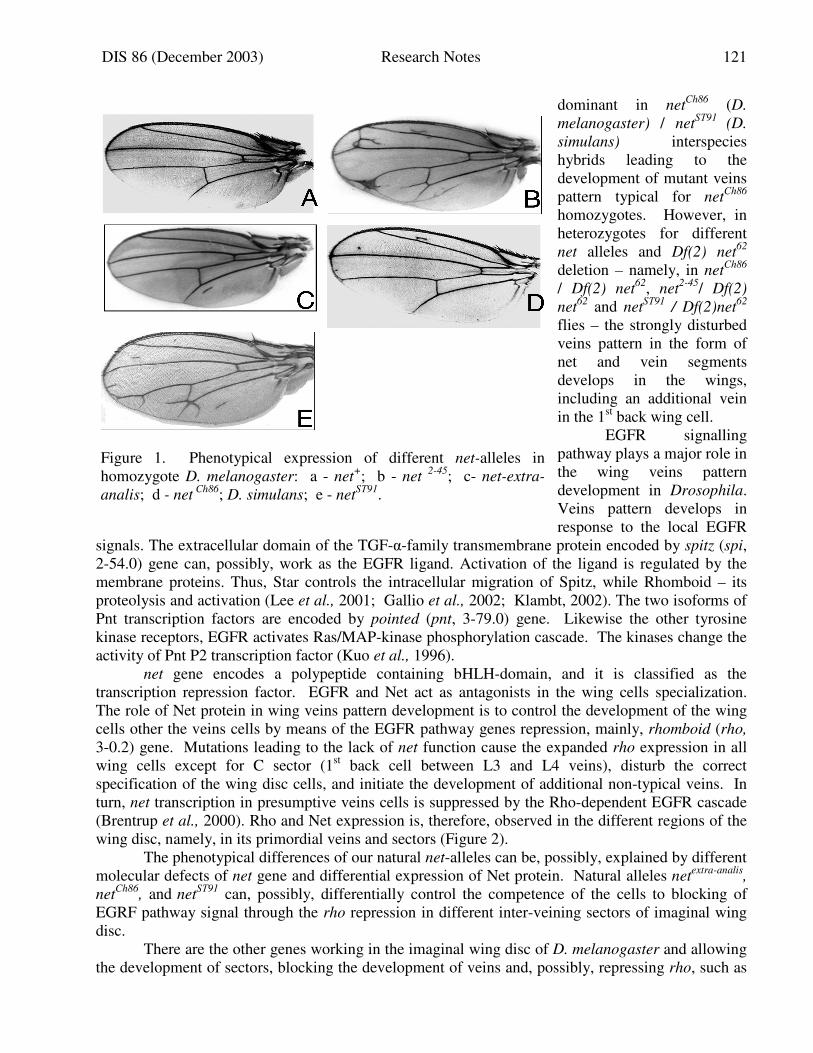
DIS 86 (December 2003) Research Notes 121
dominant in netCh86
(D.
melanogaster) / netSТ91
(D.
simulans)
interspecies
hybrids leading to the
development of mutant veins
pattern typical for netCh86
homozygotes. However, in
heterozygotes for different
net alleles and Df(2) net62
deletion – namely, in netCh86
/ Df(2) net62
, net2-45
/ Df(2)
net62
and netSТ91
/ Df(2)net62
flies – the strongly disturbed
veins pattern in the form of
net and vein segments
develops in the wings,
including an additional vein
in the 1st back wing cell.
EGFR signalling
pathway plays a major role in
the wing veins pattern
development in Drosophila.
Veins pattern develops in
response to the local EGFR
signals. The extracellular domain of the TGF-α-family transmembrane protein encoded by spitz (spi,
2-54.0) gene can, possibly, work as the EGFR ligand. Activation of the ligand is regulated by the
membrane proteins. Thus, Star controls the intracellular migration of Spitz, while Rhomboid – its
proteolysis and activation (Lee et al., 2001; Gallio et al., 2002; Klambt, 2002). The two isoforms of
Pnt transcription factors are encoded by pointed (pnt, 3-79.0) gene. Likewise the other tyrosine
kinase receptors, EGFR activates Ras/MAP-kinase phosphorylation cascade. The kinases change the
activity of Pnt P2 transcription factor (Kuo et al., 1996).
net gene encodes a polypeptide containing bHLH-domain, and it is classified as the
transcription repression factor. EGFR and Net act as antagonists in the wing cells specialization.
The role of Net protein in wing veins pattern development is to control the development of the wing
cells other the veins cells by means of the EGFR pathway genes repression, mainly, rhomboid (rho,
3-0.2) gene. Mutations leading to the lack of net function cause the expanded rho expression in all
wing cells except for C sector (1st back cell between L3 and L4 veins), disturb the correct
specification of the wing disc cells, and initiate the development of additional non-typical veins. In
turn, net transcription in presumptive veins cells is suppressed by the Rho-dependent EGFR cascade
(Brentrup et al., 2000). Rho and Net expression is, therefore, observed in the different regions of the
wing disc, namely, in its primordial veins and sectors (Figure 2).
The phenotypical differences of our natural net-alleles can be, possibly, explained by different
molecular defects of net gene and differential expression of Net protein. Natural alleles netextra-analis
,
netCh86
, and net
SТ91 can, possibly, differentially control the competence of the cells to blocking of
EGRF pathway signal through the rho repression in different inter-veining sectors of imaginal wing
disc.
There are the other genes working in the imaginal wing disc of D. melanogaster and allowing
the development of sectors, blocking the development of veins and, possibly, repressing rho, such as
Figure 1. Phenotypical expression of different net-alleles in
homozygote D. melanogaster: a - net+; b - net
2-45; c- net-extra-
analis; d - net Ch86
; D. simulans; e - netSТ91
.

Research Notes DIS 86 (December 2003) 122
blistered (bs, 2-107.3), daughterless (da, 2-39.3), knot (kn, 2-72.3), plexus (Fristrom et al., 1994;
Brentrup et al., 2000). Phenotypical expression of the different mutants can depend on the activity of
those genes in different wing sectors as well.
The role of EGFR pathway in ontogenesis considerably depends on its interactions with the
other signalling systems, for example, the Notch cascade. The coordinated interaction of signalling
systems lays the foundation for the coordinated regulation of genome functioning in live organisms.
Thus, the cooperation of net and EGFR in the wing veins pattern development in Drosophila is an
important link in a complicated chain of events.
Acknowledgments: The work is partially supported by the Russian Foundation for Basic
Research (No. 02-04-49251).
References: Brentrup, D., H. Lerch, H. Jackle, and M. Noll 2000, Development 127: 4729-
4741; Fristrom, D., P. Gotwals, S. Eaton, T.B. Kornberg, M. Sturtevant, E. Bier, and J.W. Fristrom
1994, Development 120: 2661-2671; Gallio, M., G. Sturgill, P. Rather, and P. Kylsten 2002, Proc.
Natl. Acad. Sci. 99: 12208-12213; Klambt, C., 2002, Curr. Biol. 12: R21-R23; Kuo, Y.M., N.
Jones, B. Zhou, S. Panzer, V. Larson, and S.K. Beckendorf 1996, Development 122: 1909-1917;
Lee, J.R., S. Urban, C.F. Garvey, and M. Freeman 2001, Cell 107: 161-171.
Movement patterns on two substrates of Chilean third instar larvae of D.
melanogaster, D. hydei and D. pavani collected in the same orchard.
Medina, M.C., and R. Godoy-Herrera. Depto. Biología, Universidad de
Playa Ancha de Ciencias de la Educación, and Programa de Genética Humana,
ICBM, Facultad de Medicina, Universidad de Chile, Casilla 70061. Santiago-7. Chile.
Animal patterns of movement are related with dispersal and distribution of these organisms
in space. They are also associated with genetic flow between animal populations. The patterns of
Figure 2. Antagonism between Net and EGFR pathway proteins.
Signalling cell Spitz Star
net Ras/MAP Target genes Pnt
vein cells
Spitz
EG
FR
Rh
o
Net bs
net rho
wing sector cells
EG
FR

DIS 86 (December 2003) Research Notes 123
movement also determine what parts of the habitat are accessible to animals (Irschick and Garland,
2001). More specifically, the patterns of movement are involved in, for example, habitat selection,
searching for conspecifics, feeding strategies, and avoidance of predators and/or parasites. Thus, the
way that an animal moves in its environment affects its fitness. In the case of Drosophila species that
breed naturally in the same fruits in the wild, it is of importance to relate larval patterns of movement
with dispersal and searching for food and pupation sites. This type of investigation could help us to
understand the role of larval behavior in the ecology of Drosophila, particularly with respect to those
species that coexist in the same breeding sites sharing resources as food and space. Here we studied
patterns of movement of third instar larvae of Drosophila melanogaster, Drosophila hydei and
Drosophila pavani while searching for pupation sites. The goal is to investigate the role of physical
features of substrates on that larval behavior to understand how do Drosophila larvae used their
patterns of movement when select pupation sites. The strains used were founded with parents
collected in an orchard in Chillán (410 km South from Santiago).
Two types of substrates were used to perform the experiments: i) agar (humid, smooth surface
substrate), and ii) sand (dry, rough surface substrate). A set of 120 petri dishes were each filled up to
a deep of 2 cm with 3% agar. Once cooled, a half agar of the petri dishes was removed along one side
leaving a dry surface. Then this part was filled with sand forming a 2 cm thick layer. Each larvae
tested was deposited on the center of the corresponding petri dish on the limit between the two
substrates. The trail made by each of the larvae on the substrates was drawn for a total period of 2
min or until they dug disappearing into the sand. A Wild M5 camera lucida was used to drawn the
trails. Each one of the larvae tested was observed in a “virgin” petri dish. Number of third instar
larvae tested per strain and species was 30.
Locomotion and turns are the principal behavioral elements which define a pattern of
movement in Drosophila larvae (Sokolowsky, 1980). The locomotion was estimated by measuring
the length of the trail made on the agar and sand (Sokolowski op.cit.). Turning behavior was recorded
by counting number of changes in direction in the trails. To have an additional estimation of turning
behavior, we also measured size of turns by tracing tangent lines where the trails showed changes in
direction. The angle size formed by two adjacent tangents cutting in a point was another estimation of
larval turning behavior.
Third instar larvae of the Drosophila species tested crawl and wander on the substrates
exploring environment searching for pupation sites. The larvae spent most of the observation time on
the agar: i) D. melanogaster, 58.33%, ii) D. hydei, 70.83%, and iii) D. pavani, 67.92%. These
differences are statistically important (the 2 × 2 G-test of independence produced values that
exceeded the critical value, χ2 = 3.84, df = 1). Larvae that crawl and wander on agar may touch the
sand in the limit between the two substrates. Some of them carry on crawling on agar, while other
may cross towards the sand. The mean number of these type of contacts was about one per larva in
the three species. The number of larvae of each species that crossed towards the sand was: i) D.
melanogaster 21 out of 30 (70.00%), ii) D. hydei, 10 out of 30 (33.33%), and iii) D. pavani, 12 out of
30 (40.00%). Once on the sand, the larvae move and start to dig into the substrate. One hundred
percent of the melanogaster larvae pupated underneath the sand, about 70 % of hydei larvae also dug
into the substrate, while no more of 10% of pavani larvae formed puparia underneath the sand. Thus,
substantial differences in digging and preferences for pupation substrate were found between the
three species collected in the same orchard.
Table 1 shows the locomotion and turning behavior of third instar larvae of D. melanogaster,
D. hydei and D. pavani (the Chillán populations). On agar, D. hydei larvae show higher locomotion,
while those of D. pavani the lowest. The differences in larval locomotion between the three species
are statistically important (t.test: i) D. melanogaster versus D.hydei, t = 5.15, df = 58, P < 0.05, ii) D.

Research Notes DIS 86 (December 2003) 124
melanogaster versus D. pavani, t = 5.05, df = 58, P < 0.05, iii) D. hydei versus D. melanogaster, t =
6.78, df = 58, P < 0.05). On the sand, third instar larvae of the three species substantially decrease
their locomotion (Table 1). In contrast with agar, on the sand, D. melanogaster larvae show higher
locomotion, while D hydei the lowest. On the other hand, D. pavani larvae exhibit a locomotion
intermediate respect to those of the other two species (Table 1). These interspecific differences in
larval locomotion are statistically important (t-test).
Table 1. Locomotion and turning behavior of third instar larvae of D. melanogaster, D. hydei and D. pavani. The behaviors were recorded while larvae crawling on agar and dry sand. The observation time was two minutes. Locomotion was estimated measuring length of the trail made on each of the substrates. Number and size of changes in direction were also recorded.
Locomotion (cm) Number of turns Size of turns (angles) Species
agar sand agar sand agar sand D. melanogaster 9.70 ± 1.25 0.73 ± 0.19 6.30 ± 4.07 0.73 ± 0.18 125.00 ± 2.04 92.98 ± 43.90 D. hydei 18.30 ± 1.94 0.22 ± 0.05 9.80 ± 0.93 0.17 ± 0.10 137.50 ± 2.31 117.10 ± 1.73 D. pavani 6.30 ± 1.30 0.44 ± 0.15 2.80 ± 0.36 0.20 ± 0.17 103.40 ± 4.70 157.17 ± 1.73
Table 1 also shows that, on agar, third instar larvae of the three species differ in turning
behavior. Thus, D. hydei larvae exhibit the higher number of turns which are also wider than those
turns made by larvae of D. melanogaster and D. pavani. The t values for number of turns on agar
were: i) D. melanogaster versus D. hydei, t = 8.98, df = 483, P < 0.05, ii) D. melanogaster versus D.
pavani, t = 14.76, df = 272, P < 0.05, iii) D. hydei versus D. pavani, t = 26.78, df = 478, P < 0.05).
Similar results were obtained for size of the turns made by the larvae of the three species.
Interestingly, by comparison with turning behavior exhibited on agar, on the sand, third instar larvae
of D. melanogaster and D. hydei decrease amplitude of the turns. By contrast, in that same substrate,
D. pavani larvae made turns wider than on the agar (Table 1). Interspecific differences in size of turns
made on the sand are also statistically important (t-test).
The present results suggest how third instar larvae of D. melanogaster, D. hydei and D.
pavani use their patterns of movement when they search for and select sites where form puparia. Our
findings should also help to understand the behavioral bases of aggregation patterns and density of
pupae found in microhabitats that surround overripe fruits fallen on the ground. These fruits are used
as breeding sites by several Chilean Drosophila species. Thus, in Chile, Drosophila females oviposit
on fruits as cherries (Prunus avium), plums (Prunus domestica) and mulberries (Morus alba) (Brncic,
1987). At the end of larval period, most of D. melanogaster, D. hydei and D. pavani third instar
larvae leave their breeding sites forming, each species, pupae aggregations away from those of the
other species (Medina and Godoy-Herrera, 2003). Some of these preadults also dig and pupate
underneath substrates that surrounding their natural breeding sites.
Agar and sand substrates differ in their structure varying in their resistance to larval
movement. As a consequence, larvae of the three species here studied travel at different rates and
over different distances depending on that type of substrate they are moving. For example, agar,
which shows a humid and smooth surface, seems to favor larval movements. By contrast, on a dry
substrate that has rough surface as occur with the sand, larval movement decrease. However, it is
interesting to note that, on the sand, D. pavani larvae increase the size of their changes in direction
suggesting that for this local Drosophila species this substrate could be ecologically less restrictive
for dispersal activities than for D. melanogaster and D. hydei third instar larvae. The larval patterns
of movement here studied could be a part of the process by which Drosophila larvae evaluate the

DIS 86 (December 2003) Research Notes 125
relative quality of the microhabitas surrounding their breeding sites in the wild, before selecting and
form puparia in one of them.
Acknowledgements: Supported by FONDECYT 1020130.
References: Brncic, D., 1987, Medio Ambiente 8(2): 3-9; Irschick, D.J., and T. Jr. Garland
2001, Ann. Rev. Ecol. Syst. 32: 367-396; Medina, M.C., and R. Godoy-Herrera 2003, Behav. Ecol.
(submitted); Sokolowski, M.B., 1980, Behav. Genet. 10: 291-302.
Guide to Authors
Drosophila Information Service prints short research, technique, and teaching articles, descriptions of new
mutations, stock lists, directory information, and other material of general interest to Drosophila researchers.
The current publication schedule for regular issues is annually, with the official publication date being
December. The annual issue will include material submitted during the calendar year. To help us meet this
target date, we request that submissions be sent by 15 December, but articles are accepted at any time. A
receipt deadline of 31 December is a firm deadline, due to printer submission schedules. Electronic
submissions are encouraged, and may be required for lengthy or complex articles.
Manuscripts, orders, and inquiries concerning the regular annual DIS issue should be sent to James Thompson,
Department of Zoology, University of Oklahoma, Norman, OK 73019. Telephone (405)-325-4821; email
[email protected]; FAX (405)-325-7560.
Submission: Articles should be submitted electronically, if possible. Alternatively, we ask that a diskette be
included with an article mailed to us. MS Word or Rich Text Formats are preferred. To help minimize
editorial costs, proofs will not be sent to authors unless there is some question that needs to be clarified or they
are specifically requested by the authors at the time of submission. The editor reserves the right to make minor
grammatical and stylistic changes if necessary to conform to DIS format. If the article contains tables, line
figures, or black and white half tones, we ask that a printed copy be mailed to us, even if the article is
submitted electronically.
Citation of References: Citation should be by name and date in the text of an article (Smith, 1989; Jin and
Brown, 1990; Waters et al., 1990). At the end of the article, references should be listed alphabetically by
senior author, listing all authors with initials, date, journal, volume and page numbers. Titles will not be
included except for books, unpublished theses, and articles in press. An example format is:
Waters, R.L., J.T. Smith, and R.R. Brown 1990, J. Genet. 47: 123-134.
Green, R.L., 1998, Heredity 121: 430-442.
Stock Lists, Specialized Bibliographies, and Long Technical Articles: Long or complex material can
generally not be accepted unless it is submitted electronically or on diskette, with a printed copy for editorial
guidance. There is no technical staff for this journal, so all set up is done in person by the editors. We
encourage submission of lists and other documentary material to complement presentations in other journals
that might have more restrictive space limits or costs. That is, some have published the equivalent of an
appendix in DIS, referencing the principal article in another journal. Special justification will, however, be
needed for material like bibliographic lists that are now often readily available by other means.
Figures and Tables: Both line drawings and black and white half-tone illustrations will be accepted, but half-
tones should be provided in high contrast black and white. We are currently unable to publish figures in color,
and color originals seldom make attractive black and white half-tones. Tonal figures can also be submitted
electronically, but resolution is often not as clear as when we are able to make professional half-tones from
high contrast black and white photographs. All tables are retyped by us to fit a uniform style, and it is critical
that all numbers and symbols be clearly arranged and legible.